the global outlook for the resources sector · 2006. 9. 27. · consensus economics, consensus...
TRANSCRIPT

economics@
Presentation to Presentation to
CPA Australia CPA Australia Western Resources ConventionWestern Resources Convention
The global outlook for the resources sector
The global outlook for The global outlook for the resources sectorthe resources sector
Saul EslakeSaul EslakeChief EconomistChief EconomistANZANZ
Duxton HotelDuxton HotelPerthPerth
2727thth September 2006September 2006
www.anz.com/go/economicswww.anz.com/go/economicswww.anz.com/go/economics

economics@2
Yet in fact the world economy is doing remarkably well, and likely to continue doing soYet in fact the world economy is doing remarkably Yet in fact the world economy is doing remarkably well, and likely to continue doing sowell, and likely to continue doing so
Global economic growth
0
1
2
3
4
5
6
7
8
70 74 78 82 86 90 94 98 02 06
Real % change from previous year
Long-term trend
Note: GDP is measured in US$ at purchasing power parities.Source: IMF; Economics@ANZ.

economics@3
Global growth is being increasingly driven by developing economies ….Global growth is being increasingly driven by Global growth is being increasingly driven by developing economies ….developing economies ….
0
1
2
3
4
5
6
7
70 74 78 82 86 90 94 98 02 06
Real % change from previous year
‘Advanced’ economies
‘Advanced’ economies comprise the US, Western Europe, Japan, Canada, Australia and New Zealand. Sources: IMF, World Economic Outlook September 2006 database; Economics@ANZ.
`
0
1
2
3
4
5
6
7
8
9
70 74 78 82 86 90 94 98 02 06
Real % change from previous year
‘Developing’ economies
Long-termtrend
Trend 1970-1991
Trend 1992-2006
Real GDP growth 1970-2008

economics@4
… which now account for just over 50% of world GDP … which now account for just over 50% of world … which now account for just over 50% of world GDP GDP
‘Advanced’ economies comprise the US, Western Europe, Japan, Canada, Australia and New Zealand Sources: IMF, World Economic Outlook; Angus Maddison, The World Economy: Historical Statistics; Economics@ANZ.
20
30
40
50
60
70
80
90
80 85 90 95 00 05 10
%
'Emerging' or'developing' economies
'Advanced'economies
Shares of world GDP growth
and over 60% of the growth in world GDPand over 60% of the and over 60% of the growthgrowth in world GDPin world GDP
35
40
45
50
55
60
65
50 60 70 80 90 00 10
%
'Emerging' or'developing' economies
'Advanced' economies
Shares of world GDP

economics@5
The world economy in ten years’ timeThe world economy in ten years’ time
13994Korea
17
1211=9=9
8=6=6
54321
Rank
630
1,0731,1051,5771,5761,6681,8301,8332,5223,6333,9119,412
12,278
US$bn
GDP in 2005
Canada
BrazilItalyFranceUnited Kingdom
Australia
Mexico
Russia
GermanyIndiaJapanChinaUnited States
Note: GDP figures are converted to US$ at purchasing power parities (PPPs), not market exchange rates. Forecasts are ‘consensus forecasts’ Sources: IMF, World Economic Outlook September 2006; Consensus Economics, Consensus Forecasts April 2006; ANZ.
14977Indonesia
=121,550
141,450
875
1,550
2,7002,2251,9502,2502,3002,9006,6004,600
20,65016,800
US$bn
GDP in 2015
=810=8
7
19
=12
6
53412
Rank
111,7504.6
3.3
3.72.75.53.61.52.12.31.56.51.68.03.1
GDP growth,
2006-2015 (f)
5.9

economics@6
China and India are reclaiming their historical position as the world’s largest economiesChina and India are reclaiming their historical China and India are reclaiming their historical position as the world’s largest economiesposition as the world’s largest economies
Shares of world GDP, 0 – 2015 AD
Source: Angus Maddison, The World Economy: A Millennial Perspective, OECD Development Centre, 2001; IMF, World Economic Outlook Database, September 2005; Consensus Economics, Consensus Forecasts, October 2005; Economics@ANZ.
0
5
10
15
20
25
30
35
40
0 1000 1500 1600 1700 1820 1870 1913 1950 1973 1998 2005 2015
%
China
Western Europe
US
India

economics@7
Oil prices have been at elevated levels for some time now, and seem likely to remain soOil prices have been at elevated levels for some Oil prices have been at elevated levels for some time now, and seem likely to remain sotime now, and seem likely to remain so
Nominal and real oil prices
0
10
20
30
40
50
60
70
80
90
100
70 75 80 85 90 95 00 05 10
US$ per barrel
Oil price incurrent dollars
Futurespricesas at
21 Sep2006
Oil price in2005 dollars
Note: Oil price is West Texas Intermediate. Shaded periods indicate ‘oil shocks’. Source: Thomson Financial Datastream; Bloomberg; US Bureau of Labor Statistics; Economics@ANZ.
economics@8
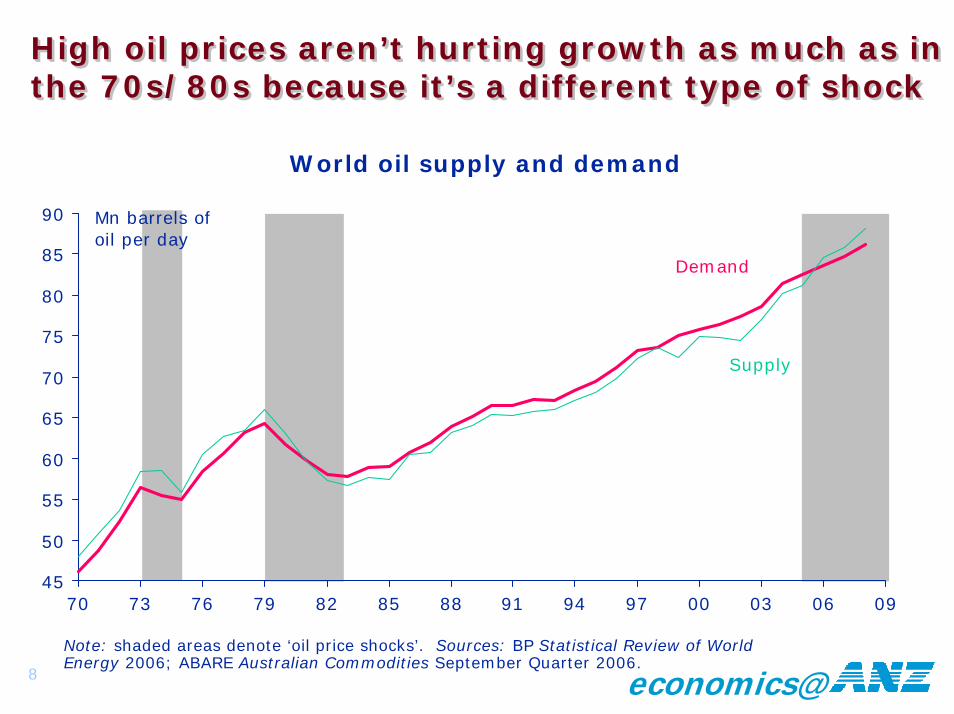
High oil prices aren’t hurting growth as much as in the 70s/80s because it’s a different type of shockHigh oil prices aren’t hurting growth as much as in High oil prices aren’t hurting growth as much as in the 70s/80s because it’s a different type of shockthe 70s/80s because it’s a different type of shock
World oil supply and demand
45
50
55
60
65
70
75
80
85
90
70 73 76 79 82 85 88 91 94 97 00 03 06 09
Mn barrels ofoil per day
Demand
Supply
Note: shaded areas denote ‘oil price shocks’. Sources: BP Statistical Review of World Energy 2006; ABARE Australian Commodities September Quarter 2006.

economics@9
Developing countries now account for over threeDeveloping countries now account for over three--quarters of world crude oil demand quarters of world crude oil demand
-0.5
0.0
0.5
1.0
1.5
2.0
2.5
3.0
90 93 96 99 02 05
Developing economies
Advanced economies
Millions of barrels per day
Growth in worldoil demand
Oil consumption
15
20
25
30
35
40
45
70 75 80 85 90 95 00 05
Millions of barrels per day
'Advanced'economies
Developing oremerging economies
Note: ‘advanced economies’ are the US, Western Europe, Japan, Canada, Australia and New Zealand. Sources: BP Statistical Review of World Energy 2006; Economics@ANZ.

economics@10
Developing country demand for oil is likely to grow rapidly as incomes riseDeveloping country demand for oil is likely to Developing country demand for oil is likely to grow rapidly as incomes risegrow rapidly as incomes rise
Oil consumption and GDP per capita, 2005
0
5
10
15
20
25
30
0 5 10 15 20 25 30 35 40 45
Barrels
GDP (at purchasing power parities) per capita
Oil
consu
mption p
er
capita
US$000
USCanada
Australia
Japan
Germany
Korea
UKFrance
Spain
Russia
Sth AfricaBrazil
Mexico
Argentina
Taiwan
ChinaIndia
Thailand Malaysia
Indonesia
Sources: The Economist ‘Survey of the World Economy’ 16 September 2006 p. 20; BP Statistical Review of World Energy 2005; IMF World Economic OutlookSeptember 2006; Economics@ANZ.

economics@11
Higher oil prices aren’t (thus far) leading to higher inflation and interest ratesHigher oil prices aren’t (thus far) leading to Higher oil prices aren’t (thus far) leading to higher inflation and interest rateshigher inflation and interest rates
Oil prices and inflation Oil prices and interest rates
0
10
20
30
40
50
60
70
80
90
100
70 74 78 82 86 90 94 98 02 060
2
4
6
8
10
12
14
16US$ per barrel(2005 prices)
Real oilprices
% per annum
G7 3-mth interest rates(right scale)
`
0
10
20
30
40
50
60
70
80
90
100
70 74 78 82 86 90 94 98 02 060
2
4
6
8
10
12
14
16US$ per barrel(2005 prices)
Real oil prices
% change fromyear earlier
G7 consumer prices (right scale)
Sources: Datastream; OECD; [email protected]: Shaded areas denote “oil price shocks”

economics@12
Metal prices are at record highs in nominal terms though below previous peaks in real termsMetal prices are at record highs in nominal terms Metal prices are at record highs in nominal terms though below previous peaks in real termsthough below previous peaks in real terms
Nominal and real metal prices
0
50
100
150
200
250
300
56 61 66 71 76 81 86 91 96 01 06
Index: 2000 = 100
Nominal terms
Deflated byUS CPI
Source: IMF International Financial Statistics;Economics@ANZ.

economics@13
China is now the major influence on global demand for base metals and steelChina is now the major influence on global China is now the major influence on global demand for base metals and steeldemand for base metals and steel
1993-2002 2002-2005
Contribution to growth (%) of
Contribution to growth (%) of
Other EMs* China
9
15
15
-11
11
16
10
48
51
110
87
54
86
113
World consum
-ption growth†
World consum
-ption growth† China
Other EMs*
Aluminium 3.8 38
43
42
12
38
34
42
7.6 9
Copper 3.5 3.8 41
Lead 3.0 4.3 -7
Nickel 4.4 3.6 -11
Steel 3.4 9.2 8
Tin 1.3 8.1 2
Zinc 3.4 3.8 7
† % pa * Emerging Markets (India, Russia, Brazil and Mexico)Source: IMF World Economic Outlook, September 2006 Table 5.3.

economics@14
Base metal consumption in developing countries is likely to grow strongly over timeBase metal consumption in developing Base metal consumption in developing countries is likely to grow strongly over timecountries is likely to grow strongly over time
Base metal consumption and GDP per capita, 2004
0
10
20
30
40
50
60
70
80
0 5 10 15 20 25 30 35 40
Tons
GDP (at purchasing power parities) per capita
Base
meta
l co
nsu
mption p
er
capita
US$000
US
Canada
Australia
Japan
Germany
Korea
UK
FranceSpain
Russia
Sth AfricaBrazil Mexico
Taiwan
China
India
Thai-land
Malaysia
Indo-nesia
Italy
Sources: ABARE Australian Commodities 2006; IMF World Economic OutlookSeptember 2006; Economics@ANZ.

economics@15
Per capita consumption of base metals and steel typically rises with income up to US$15-20,000 Per capita consumption of base metals and steel Per capita consumption of base metals and steel typically rises with income up to US$15typically rises with income up to US$15--20,000 20,000
China
Korea
EU
US
0
5
10
15
20
25
30
0 10 20 30 40
Kgs
Real GDP (at PPP) per capita
Alu
min
ium
con
sum
pti
on p
er c
apit
a
US$000Japan
Aluminium
China
Korea
EU
US
0
100
200
300
400
500
600
700
800
900
1000
0 10 20 30 40
Kgs
Real GDP (at PPP) per capita
Ste
el c
onsu
mpti
on p
er c
apit
a
US$000
Japan
Steel
Sources: IMF World Economic Outlook September 2006; (Figure 5.7); Economics@ANZ.

economics@16
Metal supply has responded more slowly to the acceleration in demand than in earlier cyclesMetal supply has responded more slowly to the Metal supply has responded more slowly to the acceleration in demand than in earlier cyclesacceleration in demand than in earlier cycles
Mining companies have to some extent been surprised at the strength of the upturn in demand
– industry views on the outlook for prices were generally pessimistic in the aftermath of the Asian economic crisis
The mining industry globally is more consolidated than in previous cycles
– companies are more conscious of the impact that an increase in their own production may have on prices
Mining companies now have alternative ways of spending windfall cash flows
– expanding exploration or production is no longer the first instinct
– takeovers, ‘special dividends’ and share buybacks are now much more common-place among mining companies

economics@17
Strong demand combined with muted supply increases have driven metal stocks to low levels Strong demand combined with muted supply Strong demand combined with muted supply increases have driven metal stocks to low levels increases have driven metal stocks to low levels
02468
10121416
65 75 85 95 05
Weeks' consumption
Aluminium
Copper
Nickel
Zinc
02468
101214
65 75 85 95 05
Weeks' consumption
0
5
10
15
20
85 95 05
Weeks' consumption
02468
101214
65 75 85 95 05
Weeks' consumption
Sources: ABARE; AME Mineral Economics; Economics@ANZ.

economics@18
Nickel and copper prices now very high relative to production costs – should prompt increased supplyNickel and copper prices now very high relative to Nickel and copper prices now very high relative to production costs production costs –– should prompt increased supplyshould prompt increased supply
Aluminium
0.0
0.2
0.4
0.6
0.8
1.0
1.2
1.4
1.6
1.8
2.0
1985trough
1988peak
2002trough
2005up-turn
2006cur-rent
Ratio
Nickel
0.0
0.5
1.0
1.5
2.0
2.5
3.0
1985trough
1988peak
2002trough
2005up-turn
2006cur-rent
Ratio
Copper
0.0
0.5
1.0
1.5
2.0
2.5
3.0
1985trough
1989peak
2002trough
2005up-turn
2006cur-rent
Ratio
Ratio of price to cash operating cost of least efficient 10% of producers – selected base metals
Sources: Brooke Hunt Metal Consultants; International Monetary FundWorld Economic Outlook September 2006 Table 5.5.

economics@19
Modest increases in global production of most major mineral commodities now in prospectModest increases in global production of most Modest increases in global production of most major mineral commodities now in prospectmajor mineral commodities now in prospect
% change from previous year
1999-2004*
2005 (e)
2006 (f)
2007 (f)
Coal 5.0 7.4 2.2 2.2
Iron ore 5.9 10.3 11.7 9.2
Alumina 5.0 6.1 11.7 4.4
Copper 1.7 5.7 3.6 4.6
7.0
11.8
5.8
6.3
0.0
Aluminium 4.7 5.0 4.8
Lead 1.7 6.6 3.7
Nickel 3.3 4.7 3.0
Zinc 4.0 6.9 0.9
Gold (mine) -0.6 0.0 4.0
* Average annual rate. Sources: ABARE, Australian CommoditiesSeptember quarter 2006; Economics@ ANZ.

economics@20
200
400
600
800
1000
1200
1400
01020304050607080910
US¢/pound
LME
50
75
100
125
150
0102 0304050607 080910
US¢/pound
LME
2025303540455055
01 02 030405 06 070809 10
US$/tonne
NY Mercfutures
Futures markets expect metal and energy prices Futures markets expect metal and energy prices to remain strong by historical standardsto remain strong by historical standards
Thermal coal Gold
Copper
Aluminium
Zinc
50100150200250300350400
0102 0304050607 080910
US¢/pound
LME
Nickel
200
300
400
500
600
700
0102 0304050607 080910
US$/oz
Comex
25
50
75
100
125
150
175
0102 0304050607 080910
US¢/pound
LME
Note: Futures contract prices as at 21 September 2006.Source: Datastream; Bloomberg; Economics@ANZ.

economics@21
Leading indicators are giving a preliminary warning that the global cycle may have peakedLeading indicators are giving a preliminary Leading indicators are giving a preliminary warning that the global cycle may have peakedwarning that the global cycle may have peaked
World IP and the OECD leading indicator
World IP and the globalpurchasing managers index
-6
-4
-2
0
2
4
6
8
00 01 02 03 04 05 06
% change from year earlier
World industrialproduction (3-mthmoving average)
OECD compositeleading indicator,4 months forward
-6
-4
-2
0
2
4
6
8
00 01 02 03 04 05 0640
42
44
46
48
50
52
54
56
58
60% change from year earlier
World industrialproduction (3-mthmoving average)
Global purchasingmanagers' index,
3 mths forward(right scale)
Note: Global PMI based on PMIs for the US, Japan, Euro area, UK, Australia,Hong Kong and Singapore. Sources: OECD; national statistical agencies and purchasing managers’ associations; Economics@ NZ.

economics@22
It is becoming increasingly clear that the US housing market has peakedIt is becoming increasingly clear that the US It is becoming increasingly clear that the US housing market has peakedhousing market has peaked
Mortgage purchase applications
90100110120130140150160170
01 02 03 04 05 06
IndexTrend
Actual
Sources: Office of Federal Housing Enterprises Oversight; National Association of Realtors. Bureau of Economic Analysis; Mortgage Bankers’ Association.
Housing affordability
100
110
120
130
140
01 02 03 04 05 06
Index Lowest sinceAugust 1986
30-year mortgage rate
5.0
5.5
6.0
6.5
7.0
7.5
8.0
01 02 03 04 05 06
% paStill below average
of last 15 years (7½%)
0
4
8
12
16
01 02 03 04 05 06
% change from year earlier
OFHEO series
Nat'l Assocn of Realtorsexisting home sales prices
House prices

economics@23
Housing activity is clearly turning down – but there’s more to comeHousing activity is clearly turning down Housing activity is clearly turning down –– but but there’s more to comethere’s more to come
Sources: National Association of Housing Brokers; CommerceDepartment; National Association of Realtors.
Unsold new housing stock
3.03.54.04.55.05.56.06.57.0
01 02 03 04 05 06
Index (2000 = 100)
Trend
Actual
1.51.61.71.81.92.02.12.2
01 02 03 04 05 06
Index (2000 = 100)Trend
Actual
Housing starts
202530354045505560
01 02 03 04 05 06
Index
Lowest sinceJanuary 1991
New house ‘’buyer traffic’ Residential construction spending
-5
0
5
10
15
20
25
01 02 03 04 05 06
% change from year earlier
Trend
Actual

economics@24
End of the housing boom (and higher oil prices) will lead to slower growth in consumer spendingEnd of the housing boom (and higher oil prices) End of the housing boom (and higher oil prices) will lead to slower growth in consumer spendingwill lead to slower growth in consumer spending
-4
-2
0
2
4
01 02 03 04 05 06
% of disposable income
TrendActual
Personal saving Consumer spending
0
1
2
3
4
5
01 02 03 04 05 06
% change from year earlier
TrendActual
Mortgage refi applications
0
500
1000
1500
2000
01 02 03 04 05 06
Index
Trend
Actual
4.0
4.5
5.0
5.5
6.0
6.5
01 02 03 04 05 06
% of disposable income
Trend
Actual
Personal energy spending
Sources: Mortgage Bankers’ Association; US Bureau of Economic Analysis.

economics@25
The UK experience of the past few years provides a template for what may happen in the USThe UK experience of the past few years provides The UK experience of the past few years provides a template for what may happen in the USa template for what may happen in the US
Bank of England refi rate
Sources: Office of the Deputy Prime Minister; Halifax BoS; UK Office of National Statistics; Bank of England.
Unemployment
Consumer spending
0
5
10
15
20
25
30
35
01 02 03 04 05 06
% change from year earlier
ODPM series
HBOS series
House prices
0.00.51.01.52.02.53.03.54.04.5
01 02 03 04 05 06
% change from year earlier
2.50
2.75
3.00
3.25
3.50
01 02 03 04 05 06
% (claimant count series)
3.0
3.5
4.0
4.5
5.0
5.5
6.0
6.5
01 02 03 04 05 06
% paRatecut

economics@26
The euro zone economy is also picking up solidly –although tax hikes may slow the recovery in 2007The euro zone economy is also picking up solidly The euro zone economy is also picking up solidly ––although tax hikes may slow the recovery in 2007although tax hikes may slow the recovery in 2007
Sources: Eurostat; national purchasing managers’ associations.
Real GDP growth Purchasing managers’ indices
0.0
0.5
1.0
1.5
2.0
2.5
3.0
3.5
01 02 03 04 05 06
% change from year earlier
40
45
50
55
60
65
01 02 03 04 05 06
Net balance (%)Services
Manufactiring
7.5
8.0
8.5
9.0
01 02 03 04 05 06
% of the labour force
UnemploymentIndustrial production
-6
-4
-2
0
2
4
6
8
01 02 03 04 05 06
% change from year earlier(3-mth moving average)

economics@27
Japan’s recovery looks firmly entrenched even though the first half of 2006 was a little softJapan’s recovery looks firmly entrenched even Japan’s recovery looks firmly entrenched even though the first half of 2006 was a little softthough the first half of 2006 was a little soft
Sources: Economic & Social Research Institute; Bank of Japan; Home Ministry.
4.04.24.44.64.85.05.25.45.6
01 02 03 04 05 06
% of the labour force
Seas. adj. Trend
Lowest since May '98
UnemploymentConsumer confidence
Business confidence
-50-40-30-20-10
0102030
01 02 03 04 05 06
Net balance reportingbetter conditions (%)
Large
Smallcompanies
Bank lending
-6
-4
-2
0
2
4
01 02 03 04 05 06
% change from year earlier
30
35
40
45
50
55
01 02 03 04 05 06
%Tokyo
All Japan

economics@28
Japan’s corporate sector has worked off the ‘four excesses’ created by the 1980s ‘bubble’ …Japan’s corporate sector has worked off the ‘four Japan’s corporate sector has worked off the ‘four excesses’ created by the 1980s ‘bubble’ …excesses’ created by the 1980s ‘bubble’ …
Excess capacity
-15-10-505
10152025
90 94 98 02 06
Net balance (%) reporting 'excessive'
Large
Small
Source: Bank of Japan Tankan survey
Excess labour
-50-40-30-20-10
010203040
90 94 98 02 06
Net balance (%) reporting 'excessive'
Large
Small
Excess inventories
05
10152025303540
90 94 98 02 06
Net balance (%) reporting 'excessive'
Large
Small
Excess debt
-30
-20
-10
0
10
20
30
90 94 98 02 06
Net balance (%) reporting financialposition as 'satisfactory'
Large
Small

economics@29
… and is now in its strongest financial position since the mid-1980s… and is now in its strongest financial position … and is now in its strongest financial position since the midsince the mid--1980s1980s
Corporate profit share of GDP
1.0
1.5
2.0
2.5
3.0
81 86 91 96 01 06
% (4-qtr moving average)
Rate of return on assets
2.0
3.0
4.0
5.0
6.0
81 86 91 96 01 06
% (4-qtr moving average)
Bankruptcies
0.0
0.5
1.0
1.5
2.0
81 86 91 96 01 06
'000s (annual moving average)
Debt-equity ratio
200
250
300
350
400
450
500
81 86 91 96 01 06
% (4-qtr moving average)
Sources: Bank of Japan; Tokyo Shoko Research Company.

economics@30
China’s growth has accelerated in the first half of China’s growth has accelerated in the first half of 2006 despite official plans to slow it down2006 despite official plans to slow it down
Real GDP
Industrial production
7
8
9
10
11
12
00 01 02 03 04 05 06
% ch. from year earlier
0
5
10
15
20
25
00 01 02 03 04 05 06
% ch. from year earlierActual
6-mth moving average
Fixed asset investment
0
10
20
30
40
50
60
00 01 02 03 04 05 06
Cumulative % ch.from year earlier
Retail sales
0
5
10
15
20
25
30
00 01 02 03 04 05 06
% ch. from year earlierActual
6-mth moving average
Source: China National Statistics Bureau

economics@31
Modest tightening measures by the People’s Bank of China haven’t succeeded in reining in lendingModest tightening measures by the People’s Bank Modest tightening measures by the People’s Bank of China haven’t succeeded in reining in lendingof China haven’t succeeded in reining in lending
Money supply growth
0
5
10
15
20
25
01 02 03 04 05 06
% change from year earlierM2
M1
PBoCtarget
Interest rates
5.00
5.25
5.50
5.75
6.00
6.25
01 02 03 04 05 06
% change from year earlier
1 yr baselending rate
Construction loans
-20-10
0102030405060
01 02 03 04 05 06
% change from year earlier
Other
Construction
Bank lending
0
5
10
15
20
25
30
01 02 03 04 05 06
% change from year earlier
Source: People’s Bank of China.

economics@32
China’s rapid growth and industrialization is a particularly & uniquely ‘Good Thing’ for AustraliaChina’s rapid growth and industrialization is a China’s rapid growth and industrialization is a particularly & uniquely ‘Good Thing’ for Australiaparticularly & uniquely ‘Good Thing’ for Australia
Long-term price changes for Australian exports and imports
-6
-4
-2
0
2
4
6
8
1960s 1970s 1980s 1990s 2000s
Export prices
Import prices
% per annum (real US$ terms)
Ratio of Australian exportprices to import prices
60
70
80
90
100
110
120
130
140
150
160
170
50 55 60 65 70 75 80 85 90 95 00 05
2004-05 = 100
Korean Warwool boom
Mid-1970scommoditiesboom
Keating's'BananaRepublic'
Chinaboom
Note: the ‘terms of trade’ is the ratio of export to import prices; it is a measure of the international ‘purchasing power’ of Australia’sexports. Sources: ABS; US BEA; Economics@ANZ.

economics@33
‘Terms of trade’ gains since 1999 have been worth $2,844 pa to each Australian, on average‘Terms of trade’ gains since 1999 have been ‘Terms of trade’ gains since 1999 have been worth $2,844 pa to each Australian, on averageworth $2,844 pa to each Australian, on average
Note: Gross domestic income (GDI) is GDP adjusted for changes in the terms of trade (ratio of export to import prices). Sources: ABS; Economics@ANZ.
0
1
2
3
4
5
6
7
00 01 02 03 04 05 06
% change from year earlier(trend) Real gross
domestic income (GDI)
Real grossdomestic
product(GDP)
Real gross domestic productand income
38
39
40
41
42
43
44
45
46
47
00 01 02 03 04 05 06
A$ 000 (at annual rates;trend; 2004-05 prices)
GDI per capita
GDP per capita
-$1,783
$1,062
Real gross domestic productand income per capita

economics@34
Higher commodity prices have prompted a surge in resources-related investmentHigher commodity prices have prompted a surge Higher commodity prices have prompted a surge in resourcesin resources--related investmentrelated investment
Export-oriented infrastructure investment
Capital expenditure bythe mining industry
0.0
1.0
2.0
3.0
4.0
5.0
6.0
00 01 02 03 04 05 06
A$ bn (current prices,annualized rate)
Railways
Harbours
Electricity
0
2
4
6
8
10
12
14
16
18
20
00 01 02 03 04 05 06
A$ bn (constant prices,annualized rate)
Sources: ABS; Economics@ANZ.

economics@35
The ‘resources boom’ has arrived at a time when the economy is bumping into capacity constraintsThe ‘resources boom’ has arrived at a time when The ‘resources boom’ has arrived at a time when the economy is bumping into capacity constraintsthe economy is bumping into capacity constraints
4.5
5.0
5.5
6.0
6.5
7.0
7.5
00 01 02 03 04 05 06
% of the labour force
Actual
Trend
Lowest in30 years
Unemployment rate
Labour shortages
0
5
10
15
20
25
00 01 02 03 04 05 06
%
Businesses reporting labour shortages as aconstraint on output
Highest in historyof survey (since 1989)
`
CBD office vacancy rates
456789
101112
00 01 02 03 04 05 06
%Sydney
Rest of Australia
78
79
80
81
82
83
84
00 01 02 03 04 05 06
%
Actual (seas. adj. by ANZ)
Trend
Capacity utilization
Sources: ABS; National Australia Bank; PropertyCouncil of Australia.

economics@36
Labour costs and other ‘upstream’ prices have been accelerating for some timeLabour costs and other ‘upstream’ prices have Labour costs and other ‘upstream’ prices have been accelerating for some timebeen accelerating for some time
Private sector wage costs
2.5
3.0
3.5
4.0
4.5
00 01 02 03 04 05 06
% change from year earlier
Materials costs
-15-10-50
5101520
00 01 02 03 04 05 06
% change from year earlier
Producer prices - goods
0
1
2
3
4
5
6
00 01 02 03 04 05 06
% change from year earlier
(domestically-produced goods)
Producer prices - services
-1
0
1
2
3
4
5
00 01 02 03 04 05 06
% change from year earlier
Property& businessservices
Freight & storage
Source: ABS.

economics@37
Monetary policy isn’t yet really ‘tight’ by the standards of the ‘low inflation’ (post-1992) eraMonetary policy isn’t yet really ‘tight’ by the Monetary policy isn’t yet really ‘tight’ by the standards of the ‘low inflation’ (poststandards of the ‘low inflation’ (post--1992) era1992) era
Interest rates Real cash rate
4
5
6
7
8
9
10
11
12
13
14
93 94 95 96 97 98 99 00 01 02 03 04 05 06
% pa
Weighted average rate paid by small business
Cash rate
SVMR*
0
1
2
3
4
5
6
93 94 95 96 97 98 99 00 01 02 03 04 05 06
% pa
Cash rate deflated by4-qtr trailing 'underlying'inflation rate (simple average of RBA measures)
* Standard variable mortgage rate. Dotted lines show averages since 1993.Sources: RBA Statistical Bulletin; Economics@ANZ.

economics@38
Fiscal and monetary policy are now working at ‘cross purposes’Fiscal and monetary policy are now working at Fiscal and monetary policy are now working at ‘cross purposes’‘cross purposes’
Households have (as of 31 March) almost $1 trn of debt and just under $400bn of bank deposits and other interest-earning assets
– each ¼ pc point rise in interest rates costs households around $1¾ bn in aggregate (allowing for the fact that some deposits don’t attract interest)
– the combined impact of the May and August rate increases is thus to reduce household spending power by $3½ bn
The average household buys about 35 litres of petrol (or diesel/LPG) a week (or 1,820 litres per annum)
– so the roughly 14¢ per litre increase in petrol prices so far this year will cost Australia’s 7mn households about $1¾bn per annum (down from nearly $3bn pa at average August prices)
Against this, the personal income tax cuts which took effect on 1 July (including those foreshadowed in last year’s Budget) willboost household disposable incomes by around $9bn pa
So for Australian households in aggregate (if not for each individual household), tax cuts more than outweigh the impact of higher interest rates and petrol prices

economics@39
0
5
10
15
20
25
30
35
40
45
50
2003-04 2004-05 2005-06 2006-07 2007-08 2008-09 2009-10
'Parameter variations' 'Policy decisions'
$bn
Financial years
Cumulative impact of:
Net ‘bottom line’ impact of ‘parameter variations’vs ‘policy decision’ (tax cuts or spending increases)Net ‘bottom line’ impact of ‘parameter variations’
vs ‘policy decision’ (tax cuts or spending increases)
The Government has had a $263bn windfall over the past 4 Budgets – and ‘spent’ $248bn of itThe Government has had a $263bn windfall over The Government has had a $263bn windfall over the past 4 Budgets the past 4 Budgets –– and ‘spent’ $248bn of itand ‘spent’ $248bn of it
Sources: Budget Papers 2002-03 through 2006-07 andEconomics@ANZ calculations.

economics@40
The government is saving almost none of the windfall gains produced by the resources boom The government is saving almost none of the The government is saving almost none of the windfall gains produced by the resources boom windfall gains produced by the resources boom
-20
-15
-10
-5
0
5
10
15
20
70 75 80 85 90 95 00 05 10-5
-4
-3
-2
-1
0
1
2
3
4$bn
As a % of GDP(right scale)
$ bn(left scale)
%
Commonwealth ‘underlying’ cash balance
Forecast surpluses smaller as a % of GDP than at previous cyclical
and commodity price peaks
Sources: 2006-07 Budget Paper No. 1, Statement 13, Table 1(and previous issues).

economics@41
It’s likely that there will be at least one more rate increase before the middle of next yearIt’s likely that there will be at least one more rate It’s likely that there will be at least one more rate increase before the middle of next yearincrease before the middle of next year
4.0
4.5
5.0
5.5
6.0
6.5
01 02 03 04 05 06 07
% pa
90-daybill yield
Cash rate
Shaded areas denote forecasts.Sources: ABS; RBA; Economics@ANZ.
Interest rates In last week’s Statement on Monetary Policy, the Reserve Bank raised its forecast for ‘underlying’ inflation to 3% -the top of its ‘target range’It also raised its forecast for economic growth to 3½% - at the top of the range of estimates of Australia’s ‘potential’ growth rate, at a time when idle resources are becoming increasingly scarceWith another pre-election Budget likely next May, the clash between monetary and fiscal policy will continue …… creating a situation where further increase(s) in interest rates are likely

economics@42
The resources boom is keeping the A$ stronger than it otherwise would have beenThe resources boom is keeping the A$ stronger The resources boom is keeping the A$ stronger than it otherwise would have beenthan it otherwise would have been
Economic influences on the value of the A$
0.45
0.50
0.55
0.60
0.65
0.70
0.75
0.80
01 02 03 04 05 06-100
0
100
200
300
400
500US¢
Australia-US 90-day
interestrate spread,
forward 1 year(right scale)
Basis pointsA$-US$
(leftscale)
Interest rate spreads
0.45
0.50
0.55
0.60
0.65
0.70
0.75
0.80
0.85
01 02 03 04 05 0680
100
120
140
160
180
200
220US¢
RBA commodityprice index (in US$)(right scale)
2002-03 = 100
A$-US$(left scale)
Commodity prices
Sources: Datastream; Reserve Bank of Australia.

economics@43
Commodity prices and interest rate differentials have been working in opposite directions on the A$Commodity prices and interest rate differentials Commodity prices and interest rate differentials have been working in opposite directions on the A$have been working in opposite directions on the A$
If commodity priceshadn’t risen since June 2001
Alternative hypothetical scenarios for the A$
0.45
0.50
0.55
0.60
0.65
0.70
0.75
0.80
0.85
0.90
01 02 03 04 05 06
US¢ A$ predicted by model ifAustralia-US interest rate
spread had remained atJuly 2004 level
Actual
A$ as predictedby ANZ model
If the interest rate spread on the A$ hadn’t narrowed since July 2004
0.45
0.50
0.55
0.60
0.65
0.70
0.75
0.80
0.85
0.90
01 02 03 04 05 06
US¢
A$ predicted bymodel if commmodity
prices had remained atJune 2001 level
Actual
A$ as predictedby ANZ model
Sources: Datastream; Reserve Bank of Australia.

economics@44
The Australian resources sector is booming on all fronts except – surprisingly - outputThe Australian resources sector is booming on all The Australian resources sector is booming on all fronts except fronts except –– surprisingly surprisingly -- outputoutput
Employment
-10-505
10152025
00 01 02 03 04 05 06
% change from year earlier(4-qtr moving average)
Mining
Rest of the economy
Source: ABS.
Gross value added
Capital expenditures
-60-40-20
020406080
100
00 01 02 03 04 05 06
Real % change fromyear earlier Mining
Rest of theeconomy
Pre-tax profits
-50
0
50
100
150
00 01 02 03 04 05 06
% change from year earlier (4-qtrmoving average)
MiningRest of theeconomy
-10
-5
0
5
10
15
00 01 02 03 04 05 06
Real % change fromyear earlier
Mining
Rest ofthe economy

economics@45
It’s inevitable that different States will grow at different speedsIt’s inevitable that different States will grow at It’s inevitable that different States will grow at different speedsdifferent speeds
Mining and manufacturing as a share of State economies
0
5
10
15
20
25
NSW Vic Qld SA WA Tas NT
Mining Manufacturing% of gross State product, 2004-05
Sources: ABS; Economics@ANZ.

economics@46
0
2
4
6
8
10
12
14
80818283848586878889909192939495969798990001020304050607080910
p.c. points
Difference betweenfastest and slowestState GSP growth rates
State Budgetestimates &forecasts
Current differences between growth rates of different States are less than in previous cycles Current differences between growth rates of Current differences between growth rates of different States are less than in previous cycles different States are less than in previous cycles
Dispersion between fastest and slowest State economic growth rates
Sources: ABS State Accounts; State Budget Papers 2006-07;Economics@ANZ.

economics@47
Different growth rates across the States aren’t unusual: what is unusual is NSW coming last Different growth rates across the States aren’t Different growth rates across the States aren’t unusual: what is unusual is NSW coming last unusual: what is unusual is NSW coming last
Sources: ABS State Accounts; Economics@ ANZ.
-4
-2
0
2
4
6
8
80 85 90 95 00 05
% ch
New South Wales
Victoria
-4
-2
0
2
4
6
8
80 85 90 95 00 05
% ch
-4-202468
10
80 85 90 95 00 05
% ch
Queensland
Western Australia
-4-202468
1012
80 85 90 95 00 05
% ch
-4-202468
1012
80 85 90 95 00 05
% ch
South Australia
Tasmania
-6-4-202468
10
80 85 90 95 00 05
% ch
State and national real growth rates

economics@48
Different growth rates across the States aren’t unusual: what is unusual is NSW coming last Different growth rates across the States aren’t Different growth rates across the States aren’t unusual: what is unusual is NSW coming last unusual: what is unusual is NSW coming last
Sources: ABS State Accounts; Economics@ ANZ.
0.0
0.5
1.0
1.5
2.0
81 86 91 96 01 06
% ch
New South Wales
Victoria
Queensland
Western Australia
South Australia
Tasmania
State and national population growth rates
0.0
0.5
1.0
1.5
2.0
81 86 91 96 01 06
% ch
0.0
1.0
2.0
3.0
4.0
81 86 91 96 01 06
% ch
0.00.51.01.52.02.53.03.5
81 86 91 96 01 06
% ch
0.0
0.5
1.0
1.5
2.0
81 86 91 96 01 06
% ch
-0.5
0.0
0.5
1.0
1.5
2.0
81 86 91 96 01 06
% ch

economics@49
SummarySummarySummary
Global growth is now being driven by developing economies especially but not only China
Although commodity demand from advanced economies has begun to ease (with a slowing in the US), developing countries’ energy and metals demand is likely to continue growing strongly
The surge in energy and metals prices reflects the muted response of commodity supply to the rapid growth in demand
– in turn partly as a result of changes in the structure of the global resources industry
Prices of most resource commodities will ease from current highs but remain high by the standards of the past decade
The current ‘resources boom’ is allowing Australia to maintain reasonably strong economic growth in contrast to other countries where growth has been largely dependent on consumer spending fuelled by a now-passed housing boom
The ‘two-speed’ pattern of growth in the Australian economy is not unusual
– what is unusual (and behind the focus on this issue) is that New South Wales is at the bottom of the pack