the global leader in lithium mica processing corporate
TRANSCRIPT

10-12 November 2021
THE GLOBAL LEADER IN LITHIUM MICA PROCESSING
Corporate Update: Noosa Mining Conference
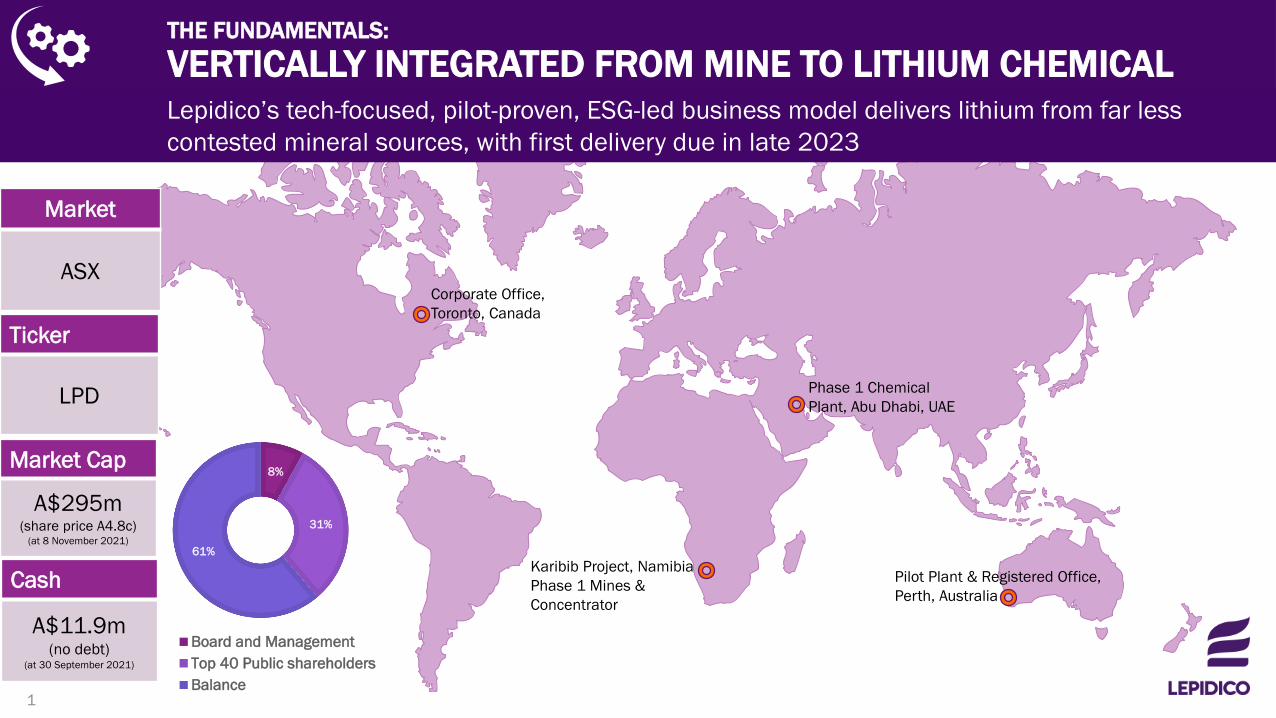
Karibib Project, NamibiaPhase 1 Mines & Concentrator
Phase 1 Chemical Plant, Abu Dhabi, UAE
Pilot Plant & Registered Office,Perth, Australia
Corporate Office,Toronto, Canada
8%
31%
61%
Board and ManagementTop 40 Public shareholdersBalance
Lepidico’s tech-focused, pilot-proven, ESG-led business model delivers lithium from far less contested mineral sources, with first delivery due in late 2023
1
Market
ASX
Ticker
LPD
Market Cap
A$295m(share price A4.8c)
(at 8 November 2021)
Cash
A$11.9m(no debt)
(at 30 September 2021)
1
THE FUNDAMENTALS:
VERTICALLY INTEGRATED FROM MINE TO LITHIUM CHEMICAL

2023 Chemical Plant
commissioning starts
Project fully operational
Phase 2 Feasibility Study starts
Corporate Timeline
2017 Pre-Feasibility
Study complete Phase 1
Feasibility Study starts
2016 ASX listing Company
name change to Lepidico Ltd
PFS starts
2018 L-Max® Pilot Plant
development Provisional patent
application forCs & Rb separation process
2019 LOH-Max® provisional
patent application Acquisition of TSX-V listed
Desert Lion Energy & Karibib assets
Pilot Plant confirms viability of L-Max® technology
First L-Max® patent protection received
2020 Inaugural Ore Reserve
estimates for Rubicon and Helicon announced
World’s only Ore Reserve estimate for “Critical Minerals” Cs & Rb
Phase 1 Project DFS completed
Namibia ESIA & ESMP completed to IFC Standards
2022 Phase 1 full funding package Karibib mining commences Karibib concentrator ore
commissioning starts
2021 EPCM contract awarded Front End Engineering &
Design to complete First product offtake
agreements
Cs Rb
2013-2015 2013 L-Max®
process concept 2014 Provisional
patent application First continuous
lab trials 2015
2
Legend Achieved Target
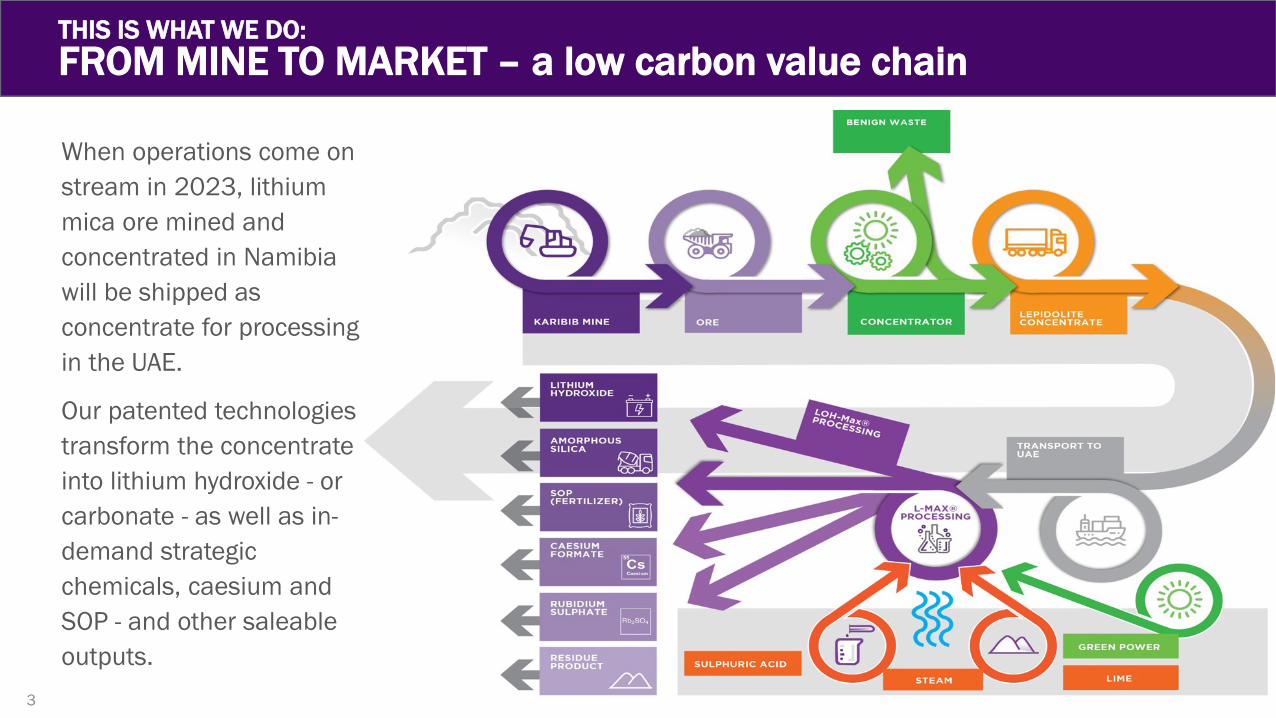
THIS IS WHAT WE DO: FROM MINE TO MARKET – a low carbon value chain
When operations come on stream in 2023, lithium mica ore mined and concentrated in Namibia will be shipped as concentrate for processing in the UAE.
Our patented technologies transform the concentrate into lithium hydroxide - or carbonate - as well as in-demand strategic chemicals, caesium and SOP - and other saleable outputs.
3
OUR TECHNOLOGIES & ESG
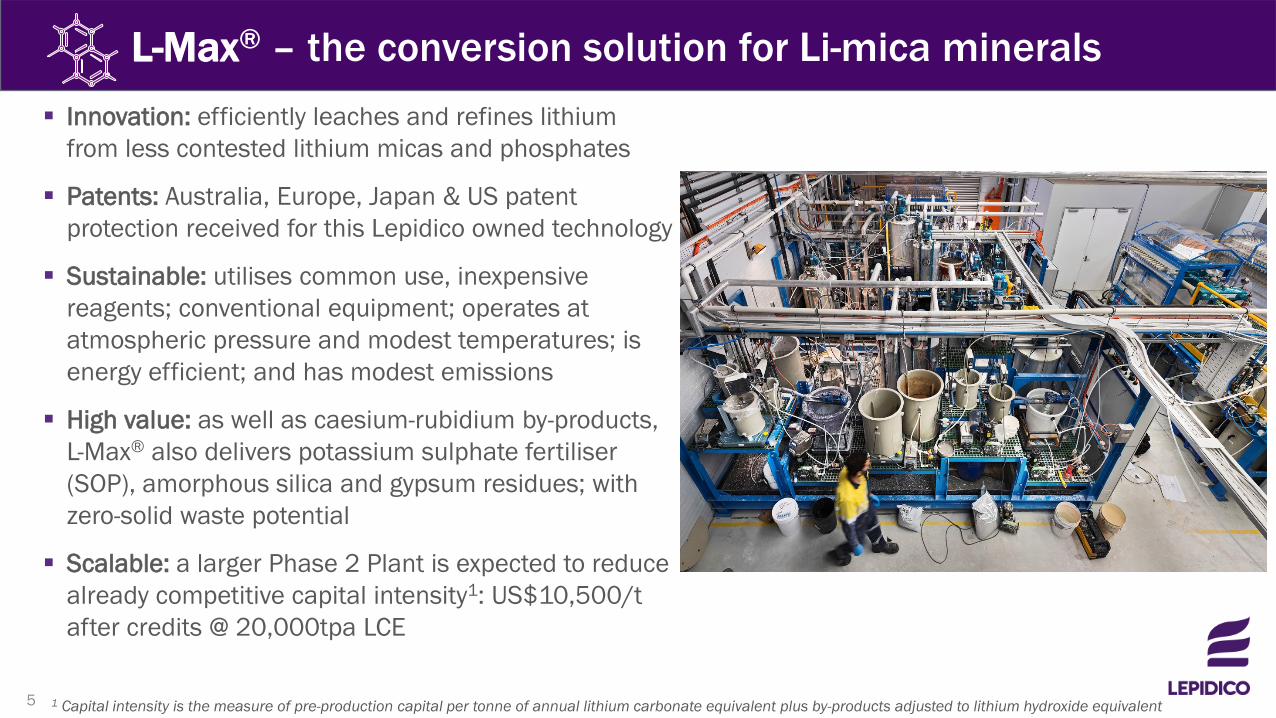
L-Max® – the conversion solution for Li-mica minerals Innovation: efficiently leaches and refines lithium
from less contested lithium micas and phosphates
Patents: Australia, Europe, Japan & US patent protection received for this Lepidico owned technology
Sustainable: utilises common use, inexpensive reagents; conventional equipment; operates at atmospheric pressure and modest temperatures; is energy efficient; and has modest emissions
High value: as well as caesium-rubidium by-products, L-Max® also delivers potassium sulphate fertiliser (SOP), amorphous silica and gypsum residues; with zero-solid waste potential
Scalable: a larger Phase 2 Plant is expected to reduce already competitive capital intensity1: US$10,500/t after credits @ 20,000tpa LCE
1 Capital intensity is the measure of pre-production capital per tonne of annual lithium carbonate equivalent plus by-products adjusted to lithium hydroxide equivalent5

LOH-Max® - a more sustainable Lithium Hydroxide solution1
Patent – provisional patent lodged early 2019; international patent phase started August 2020; national and regional phases started September 2021
Broad application – in lithium mineral conversion that employs sulfur-based chemistry; includes Spodumene
Recovery enhanced – +4% versus conventional Spodumene process; +1,000tpa LiOH at nominal 20,000tpa rate
1 ASX Announcement: LOH-Max® process technology acquisition & improvements, 29 October 2020
CapEx reduced – by US$52M (14%) on 20,000tpa LCE reference case Spodumene converter on simplified flowsheet
OpEx reduced – by US$8M pa versus reference Spodumene converter case on lower power and reagent consumption
CO2 reduced – lower Scope 1, 2 and 3 emissions versus conventional processing
Value enhanced – by +US$100M per 20,000tpa LiOH.H2O over 10-years
Waste – benign gypsum/alunite waste
Risk reduced – as sodium sulphate not produced; a potential fatal flaw for conventional plants if disposal required
Ownership – 100% owned by Lepidico; royalty sharing arrangement with original developers for third party licenses
6
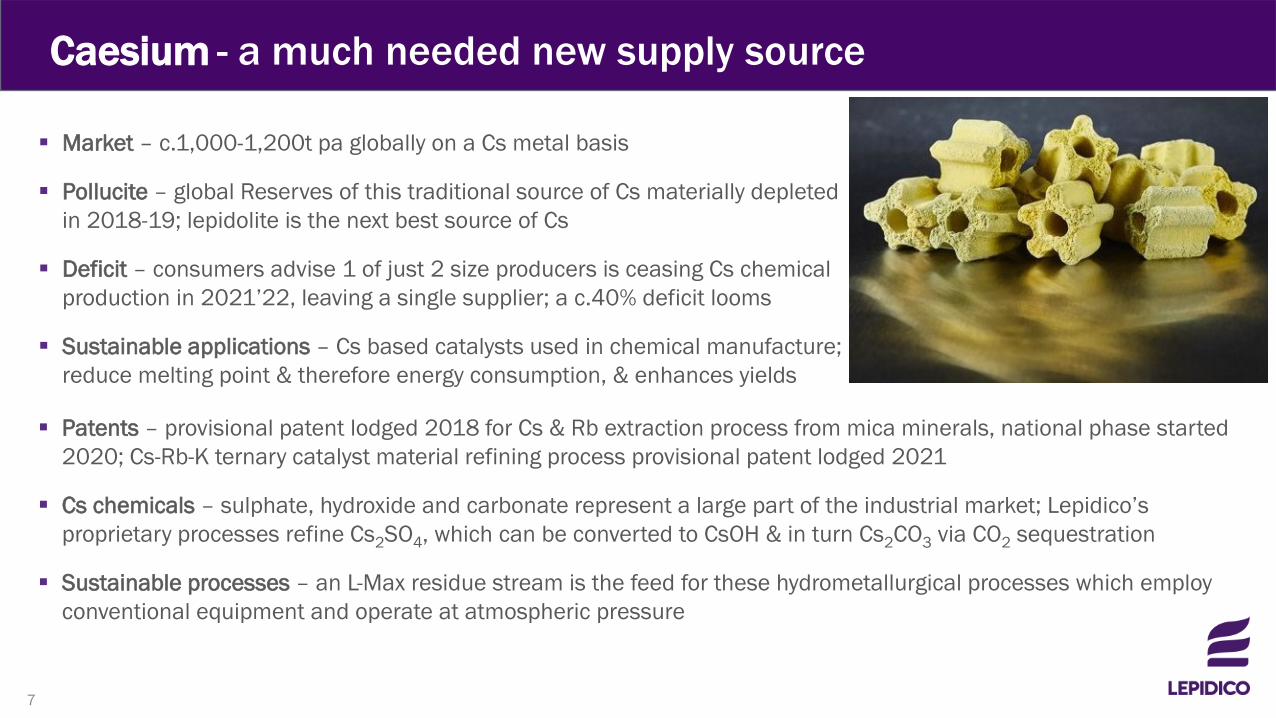
Caesium - a much needed new supply source
Market – c.1,000-1,200t pa globally on a Cs metal basis
Pollucite – global Reserves of this traditional source of Cs materially depleted in 2018-19; lepidolite is the next best source of Cs
Deficit – consumers advise 1 of just 2 size producers is ceasing Cs chemical production in 2021’22, leaving a single supplier; a c.40% deficit looms
Sustainable applications – Cs based catalysts used in chemical manufacture; reduce melting point & therefore energy consumption, & enhances yields
Patents – provisional patent lodged 2018 for Cs & Rb extraction process from mica minerals, national phase started 2020; Cs-Rb-K ternary catalyst material refining process provisional patent lodged 2021
Cs chemicals – sulphate, hydroxide and carbonate represent a large part of the industrial market; Lepidico’sproprietary processes refine Cs2SO4, which can be converted to CsOH & in turn Cs2CO3 via CO2 sequestration
Sustainable processes – an L-Max residue stream is the feed for these hydrometallurgical processes which employ conventional equipment and operate at atmospheric pressure
7

Environmental excellence through technology Competitive carbon intensity – GHD reported “low” chemical plant
emissions intensity vs other LiOH plants; 8.8tCO2-e/t LiOH.H2O (10.0tCO2-e/t LCE) for integrated project Scope 1 & 2 emissions –90% in chemical plant, 10% mine & concentrator; renewable power and green hydrogen can lower emissions to just 3.0tCO2-e/t LCE
Other emissions & pollutants – negligible
Water intensity – 33m3/t LCE, 44% allocation to LiOH; 20% Namibia/80% UAE for first 5 years, with 85% of concentrator water recycled
Land use intensity – 962Ha integrated project on predominantly industrial land; mine closure plan to return land to agricultural use; Category B designation
Biodiversity – ESIAs identifies no material impacts at Karibib & UAE operations are located within a designated industrial park
Industrial waste generation – no TSF required, benign mine and concentrator waste co-disposed; no sodium sulphate generated from converter; & opportunity for zero solid waste chemical plant
8

Social Responsibility & Governance
Health & Safety
• Lost Time Injury & Total Recordable Incidents Frequency Rates 0 > zero harm
• More than 118,000 hours worked with no Recordable Incidents since records began in 2016
Social
• Creation of 115 direct jobs and +800 indirect jobs in Namibia
• 119 new direct jobs in the UAE• No relocation requirement• Water supply to local farmers• Medical equipment donation
Governance
• Experienced Board of Directors with complementary skills
• Sustainability & best practice ESG integrated with strategic planning
• Diversity Committee established • Risk register including a residual risk
rating for all actions and controls
9
OUR PHASE 1 PROJECT

Karibib Project, Namibia
Brownfield re-development of Rubicon & Helikon mines
Fully permitted: Granted 68km2
Mining Licence
Water extraction licence given -85% of process water will be recycled
Construction of new small-scale 60,000tpa concentrator
Direct access to excellent existing regional infrastructure
New 25km line for grid power
+1,000km2 land position prospective for lithium, caesium, rubidium & gold
Karibib Lithium Project
Windhoek
Exploration: Mineral Resource expansion programs started mid-2021 to extend Phase 1 life & support the Phase 2 Project Scoping Study
11

RESERVES & RESOURCES: Unique source of Critical MineralsOre Reserve Estimate1 Rubicon & Helikon 1 deposits Karibib Project Global Mineral Resources 2
JORC Code (2012) compliant Ore Reserve estimate for lithium, rubidium, caesium & potassium
76% conversion of Measured & Indicated Resources to Reserves for a 14-year project life
Inferred Resource potential supports expansion potential or Phase 2 Project development
Ore exposed at surface and deposits pre-stripped by historical mining
Strip ratio just 0.5 to 1 for the first 2 years and 3.8 to 1 Life of Mine
Most mine development work complete including haul road to Helikon 1 & water supply
1 ASX Announcement: DFS Delivers Compelling Phase 1 Project Results, 28 May 20202 Resources are inclusive of Ore Reserves 3 ASX announcement dated 30 January 2020: Updated Mineral Resource Estimates for Helikon 1 and Rubicon4 ASX announcement dated 16 July 2019: Drilling starts at the Karibib Lithium Project5 ASX announcement dated 12 March 2021: Karibib Mineral Resources Expanded
Reserve Category
Tonnes(M)
Li2O(%)
Rb(%)
Cs(ppm)
Ta(ppm)
K(%)
Proved 1.93 0.59 0.28 410 50 2.10
Probable 4.79 0.41 0.21 290 40 1.99
Total Reserves 6.79 0.46 0.23 320 50 2.02
Deposit Resource Category
Tonnes Li2O Rb Cs Ta K Cut-off(M) (%) (%) (ppm) (ppm) (%) (% Li2O)
Rubicon & Helikon 13
Measured 2.2 0.56 0.27 389 51 2.14 0.15Indicated 6.66 0.38 0.20 274 42 2.07 0.15Inferred 0.17 0.7 0.29 1100 150 2.18 0.15
Helikon 2, 3, 4& 54 Inferred 2.2 0.41 0.20
Rubicon tailings5 Indicated 0.07 0.99 0.42 538 60 0.00
Rubicon & Helikonstockpiles5 Inferred 0.57 0.79 0.00
Global
Measured 2.2 0.57 0.27 389 51 2.14
Indicated 6.73 0.39 0.21 277 42
Inferred 2.94 0.5
Total 11.87 0.45
12

13
Karibib Concentrator – conventional flotation, small footprint
Lycopodium started EPCM works May 2021
FEED to complete December Quarter 2021
Site works start March quarter 2022
Mining December quarter 2022
Concentrator commissioning late 2022
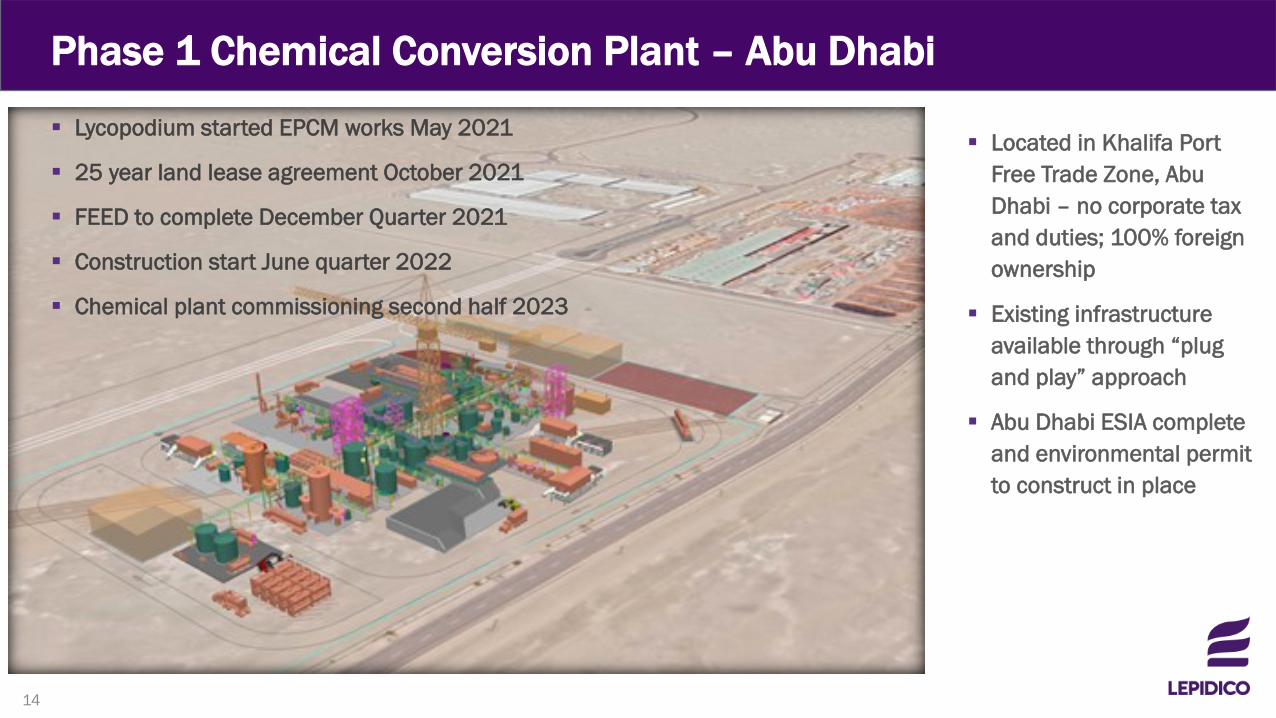
Phase 1 Chemical Conversion Plant – Abu Dhabi
Located in Khalifa Port Free Trade Zone, Abu Dhabi – no corporate tax and duties; 100% foreign ownership
Existing infrastructure available through “plug and play” approach
Abu Dhabi ESIA complete and environmental permit to construct in place
Lycopodium started EPCM works May 2021
25 year land lease agreement October 2021
FEED to complete December Quarter 2021
Construction start June quarter 2022
Chemical plant commissioning second half 2023
14
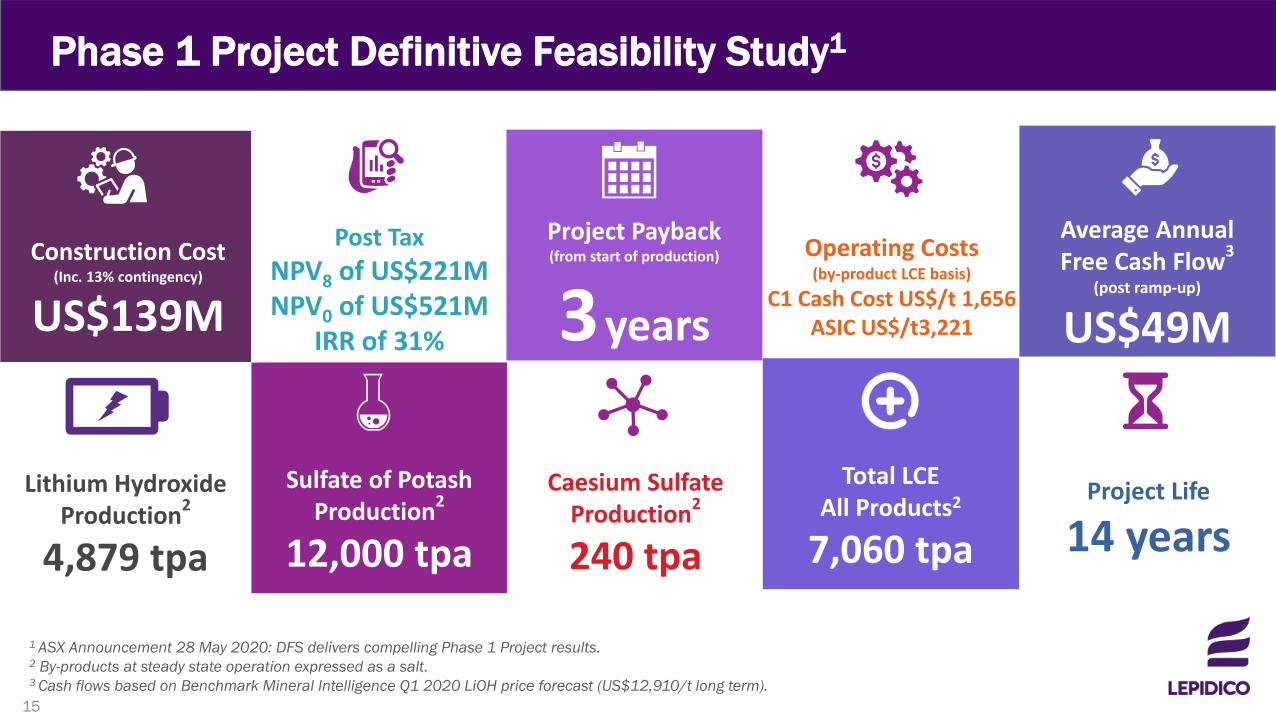
Operating Costs (by-product LCE basis)
C1 Cash Cost US$/t 1,656ASIC US$/t3,221
Lithium Hydroxide Production2
4,879 tpa
Sulfate of Potash Production2
12,000 tpa
Caesium Sulfate Production2
240 tpa
Total LCE All Products2
7,060 tpaProject Life
14 years
Construction Cost (Inc. 13% contingency)
US$139M
Post TaxNPV8 of US$221MNPV0 of US$521M
IRR of 31%
Project Payback (from start of production)
3years
Average Annual Free Cash Flow3
(post ramp-up)
US$49M
Phase 1 Project Definitive Feasibility Study1
1 ASX Announcement 28 May 2020: DFS delivers compelling Phase 1 Project results. 2 By-products at steady state operation expressed as a salt. 3 Cash flows based on Benchmark Mineral Intelligence Q1 2020 LiOH price forecast (US$12,910/t long term).
15

Low All in Sustaining Costs
Source: Benchmark Mineral Intelligence for industry data; Lepidico for Phase 1 Project data16

Finance & Offtakes Lithium Hydroxide – binding term sheets in advanced
negotiation with four customers; c.80% EV supply chain, 20% agency/spot sales
Caesium – binding term sheets being negotiated with multiple consumers for sulphate, hydroxide & carbonate
Bulk Products – Commercial Manager, UAE appointed for local product sales
Testing – samples of all products have been dispatched for customer assessment; pilot plant being run now to generate additional samples & for product development
Debt Finance – formal mandate signed with the U.S. International Development Finance Corporation for Karibib; commercial lenders engaged for UAE debt; due diligence advanced; commitments targeted for late 2021-early 2022
Strategic Partner – under evaluation
Prepayment/Streaming – under evaluation17
IN SUMMARY
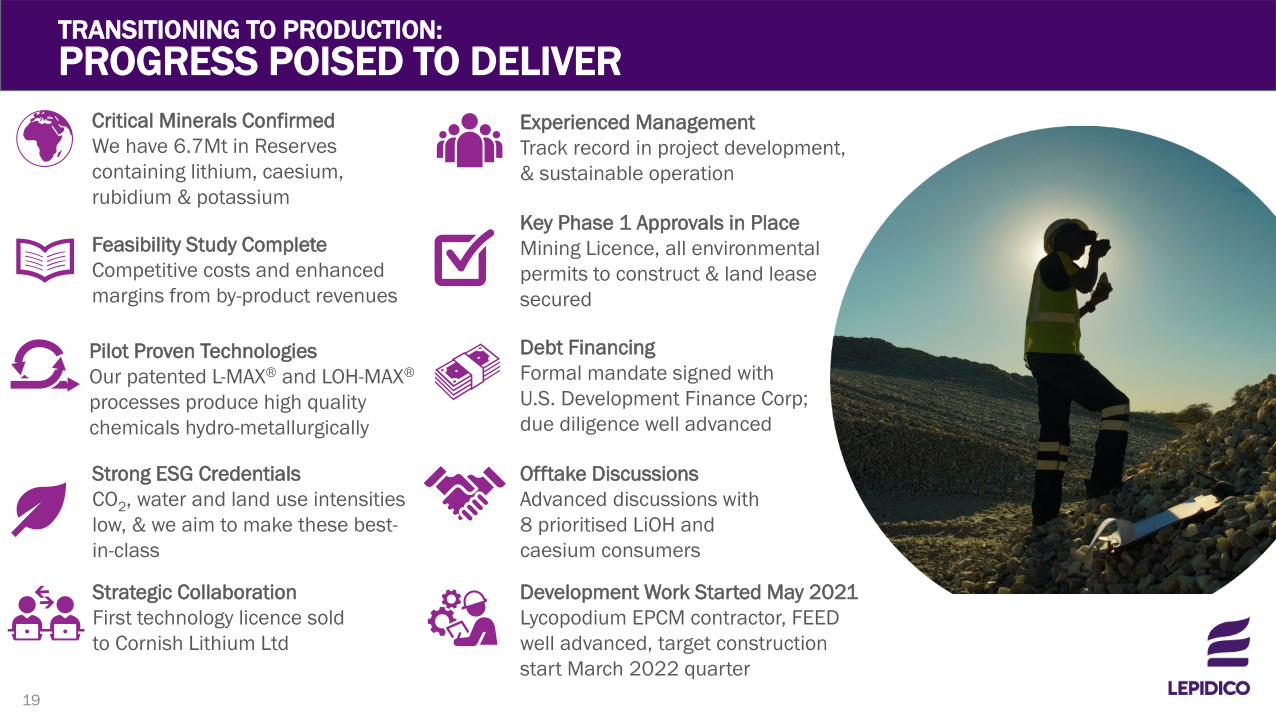
Critical Minerals ConfirmedWe have 6.7Mt in Reserves containing lithium, caesium, rubidium & potassium
Feasibility Study CompleteCompetitive costs and enhanced margins from by-product revenues
Pilot Proven TechnologiesOur patented L-MAX® and LOH-MAX®
processes produce high quality chemicals hydro-metallurgically
Key Phase 1 Approvals in PlaceMining Licence, all environmental permits to construct & land lease secured
Experienced ManagementTrack record in project development, & sustainable operation
Strategic CollaborationFirst technology licence sold to Cornish Lithium Ltd
Development Work Started May 2021 Lycopodium EPCM contractor, FEED well advanced, target construction start March 2022 quarter
Debt FinancingFormal mandate signed with U.S. Development Finance Corp; due diligence well advanced
Offtake DiscussionsAdvanced discussions with 8 prioritised LiOH and caesium consumers
Strong ESG CredentialsCO2, water and land use intensities low, & we aim to make these best-in-class
TRANSITIONING TO PRODUCTION: PROGRESS POISED TO DELIVER
19

LITHIUM MARKET
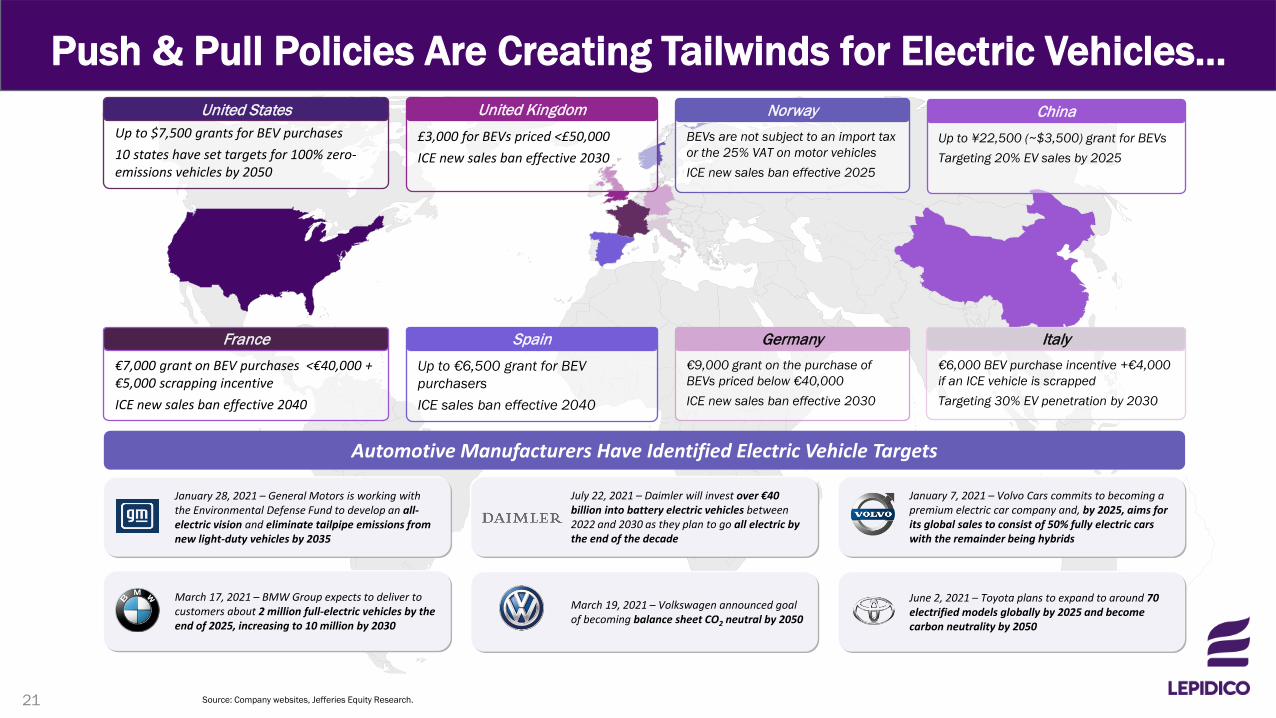
Push & Pull Policies Are Creating Tailwinds for Electric Vehicles…
Source: Company websites, Jefferies Equity Research.
Automotive Manufacturers Have Identified Electric Vehicle Targets
January 28, 2021 – General Motors is working with the Environmental Defense Fund to develop an all-electric vision and eliminate tailpipe emissions from new light-duty vehicles by 2035
March 17, 2021 – BMW Group expects to deliver to customers about 2 million full-electric vehicles by the end of 2025, increasing to 10 million by 2030
July 22, 2021 – Daimler will invest over €40 billion into battery electric vehicles between 2022 and 2030 as they plan to go all electric by the end of the decade
March 19, 2021 – Volkswagen announced goal of becoming balance sheet CO2 neutral by 2050
January 7, 2021 – Volvo Cars commits to becoming a premium electric car company and, by 2025, aims for its global sales to consist of 50% fully electric cars with the remainder being hybrids
June 2, 2021 – Toyota plans to expand to around 70 electrified models globally by 2025 and become carbon neutrality by 2050
BEVs are not subject to an import tax or the 25% VAT on motor vehiclesICE new sales ban effective 2025
Norway
€9,000 grant on the purchase of BEVs priced below €40,000ICE new sales ban effective 2030
Germany€7,000 grant on BEV purchases <€40,000 + €5,000 scrapping incentiveICE new sales ban effective 2040
France€6,000 BEV purchase incentive +€4,000 if an ICE vehicle is scrappedTargeting 30% EV penetration by 2030
ItalyUp to €6,500 grant for BEV purchasersICE sales ban effective 2040
Spain
Up to ¥22,500 (~$3,500) grant for BEVsTargeting 20% EV sales by 2025
China£3,000 for BEVs priced <£50,000ICE new sales ban effective 2030
United KingdomUp to $7,500 grants for BEV purchases10 states have set targets for 100% zero-emissions vehicles by 2050
United States
21

…Driving Significant Ramp-Up in Electric Vehicle Penetration Globally
Source: Jefferies Equity Research.
Secular Changes in EV Adoption Will Transform Demand for Battery Materials
2% 6%
22%
43%
2017 2020 2025 2030
2%11%
38%
81%
2017 2020 2025 2030
1% 2%14%
28%
2017 2020 2025 2030
North America Europe China
1.4
12.8
2020 2030
0.4
5.6
2020 2030
1.2
11.1
2020 2030
15.4x
9.4x9.3x
Elec
tric
Vehi
cle
Pene
tratio
nEl
ectri
c Ve
hicl
e Sa
les
(mill
ions
)
22

Lithium Is THE Critical Component Cathode Material Lithium Copper Nickel Manganese Cobalt Graphite
NCA
NCA+
NMC 333
NMC 532
NMC 622
NMC 811
LFP
LMO
Lithium Is the Constant Input Across All Types of
EV Batteries
LiOH expected to take dominant share (90%+)
in lithium battery cathode chemistries by
202529%
6%
22%
48%
37%
6%6%
36%21%
22%21%28%
12% 6%
2018 2021 2025
LFP, Others
NCA
NMC 811
NMC 721
NMC 622
NMC 111
94% Market Share
82% Market Share
43% Market Share
Source: IEA.23

Strong Fundamentals…
(1,200,000)
(1,000,000)
(800,000)
(600,000)
(400,000)
(200,000)
0
200,000
2019 2020 2021 2022 2023 2024 2025 2026 2027 2028 2029 2030
Total Lithium Supply / Demand Balance (tonnes LCE)(1)
The market for lithium chemicals is forecasted to be in a supply deficit from 2022 onwards
(1) Source: Benchmark Mineral Index. 24

…Underpinned by Project Uncertainty and Long Lead-times
0
200,000
400,000
600,000
800,000
1,000,000
1,200,000
1,400,000
1,600,000
1,800,000
'15 '16 '17 '18 '19 '20 '21 '22 '23 '24 '25 '26 '27 '28 '29 '30 '31 '32 '33 '34 '35 '36 '37 '38 '39 '40
Lithium Global Supply Forecast (tonnes LCE)(1)
Operational Supply Highly Probable Probable Possible
25

Lithium Industry Pricing Mechanisms
$0
$5,000
$10,000
$15,000
$20,000
$25,000
Jan-18 Jul-18 Jan-19 Jul-19 Jan-20 Jul-20 Jan-21 Jul-21
Lithium Carbonate (min 99.5% CIF China) Lithium Hydroxide (min 56.5% FOB China)
Spodumene Concentrate (Li2O 5% min CIF China)
(US$/t)
Source: Bloomberg, S&P, Roskill.Note: Market data as of September 3, 2021.
Since beginning of 2021, prices of both lithium hydroxide and lithium carbonate have continued to rise back to almost 2018 levels Primarily driven by the sharp
surge in domestic Chinese lithium carbonate market Similarly prices for most battery
raw materials were maintained at historically high levels compared to the past 2-year period Continued strong demand
growth into H2 2021 is expected to maintain elevated prices
26

Lithium Supply Chain
15% - 40%
Source: Benchmark Mineral Intelligence, Wall Street Broker Research.
EXTRACTION CHEMICAL PROCESSING CATHODE / ANODEPRODUCTION
CELLMANUFACTURING APPLICATION
+ -
10% - 15% 15% - 25% 10% - 20% 5% - 15%
Typical Project IRRLepidico’s value chain focus
27
DISCLAIMERIMPORTANT INFORMATIONThis presentation has been prepared by the management of Lepidico Ltd (the 'Company') for the benefit of brokers, analysts and investors and not as specific advice to any particular party or person.The information is based on publicly available information, internally developed data and other external sources. No independent verification of those sources has been undertaken and where any opinion is expressed in this document it is based on the assumptions and limitations mentioned herein and is an expression of present opinion only. No warranties or representations can be made as to the origin, validity, accuracy, completeness, currency or reliability of the information. The Company disclaims and excludes all liability (to the extent permitted by law), for losses, claims, damages, demands, costs and expenses of whatever nature arising in any way out of or in connection with the information, its accuracy, completeness or by reason of reliance by any person on any of it.Where the Company expresses or implies an expectation or belief as to the success of future exploration and the economic viability of future projects, such expectation or belief is based on management’s current predictions, assumptions and projections. However, such forecasts are subject to risks, uncertainties and other factors which could cause actual results to differ materially from future results expressed, projected or implied by such forecasts. Such risks include, but are not limited to, exploration success, commodity price volatility, future changes to mineral resource estimates, changes to assumptions for capital and operating costs as well as political and operational risks and governmental regulation outcomes. For more detail of risks and other factors, refer to the Company's other Australian Securities Exchange announcements and filings. The Company does not have any obligation to advise any person if it becomes aware of any inaccuracy in, or omission from, any forecast or to update such forecast.
Forward-looking StatementsAll statements other than statements of historical fact included in this release including, without limitation, statements regarding future plans and objectives of Lepidico, are forward-looking statements. Forward-looking statements can be identified by words such as "anticipate", "believe", "could", "estimate", "expect", "future", "intend", "may", "opportunity", "plan", "potential", "project", "seek", "will" and other similar words that involve risks and uncertainties. These statements are based on an assessment of present economic and operating conditions, and on a number of assumptions regarding future events and actions that are expected to take place. Such forward-looking statements are not guarantees of future performance and involve known and unknown risks, uncertainties, assumptions and other important factors, many of which are beyond the control of the Company, its directors and management of Lepidico that could cause Lepidico’s actual results to differ materially from the results expressed or anticipated in these statements.The Company cannot and does not give any assurance that the results, performance or achievements expressed or implied by the forward-looking statements contained in this release will actually occur and investors are cautioned not to place any reliance on these forward-looking statements. Lepidico does not undertake to update or revise forward-looking statements, or to publish prospective financial information in the future, regardless of whether new information, future events or any other factors affect the information contained in this release, except where required by applicable law and stock exchange listing requirements.
Competent Person StatementThe information in this report that relates to the Helikon 1 and Rubicon Ore Reserve estimates is extracted from an ASX Announcement dated 28 May 2020 (“Definitive Feasibility Study Delivers Compelling Phase 1 Project Results”) and was completed in accordance with the guidelines of the JORC Code (2012). The Company confirms that it is not aware of any new information or data that materially affects the information included in the original market announcement and that all material assumptions and technical parameters underpinning the Mineral Resource estimates in the relevant market announcement continue to apply and have not materially changed. The Company confirms that the form and context in which the Competent Person’s findings are represented have not been materially modified from the original market announcement.
The information in this report that relates to the Rubicon and Helikon 1 Mineral Resource estimates is extracted from ASX Announcements dated 30 January 2020 (“Updated Mineral Resource Estimates for Helikon 1 and Rubicon”) and 12 March 2021 (“Karibib Mineral Resource expanded”), which completed in accordance with the guidelines of the JORC Code (2012). The Company confirms that it is not aware of any new information or data that materially affects the information included in the original market announcement and that all material assumptions and technical parameters underpinning the Mineral Resource estimates in the relevant market announcement continue to apply and have not materially changed. The Company confirms that the form and context in which the Competent Person’s findings are represented have not been materially modified from the original market announcement.
The information in this report that relates to the Helikon 2 - Helikon 5 Mineral Resource estimates is extracted from an ASX Announcement dated 16 July 2019 (“Drilling Starts at the Karibib Lithium Project”) and was completed in accordance with the guidelines of the JORC Code (2012). The Company confirms that it is not aware of any new information or data that materially affects the information included in the original market announcement and that all material assumptions and technical parameters underpinning the Mineral Resource estimates in the relevant market announcement continue to apply and have not materially changed. The Company confirms that the form and context in which the Competent Person’s findings are represented have not been materially modified from the original market announcement.
28
