the global information technology report 2013 - computerworld
TRANSCRIPT

Insight Report
The Global Information Technology Report 2013Growth and Jobs in a Hyperconnected World
Beñat Bilbao-Osorio, Soumitra Dutta, and Bruno Lanvin, Editors


Insight Report
The Global Information Technology Report 2013
Growth and Jobs in a Hyperconnected World
Beñat Bilbao-Osorio, World Economic Forum
Soumitra Dutta, Cornell University
Bruno Lanvin, INSEAD
Editors
@ 2013 World Economic Forum

The Global Information Technology Report 2013 is a project within the framework of the World Economic Forum’s Global Competitiveness and Benchmarking Network and the Industry Partnership Programme for Information and Communication Technologies. It is the result of a collaboration between the World Economic Forum and INSEAD.
Professor Klaus Schwab
Executive Chairman
Børge Brende
Managing Director, Government Relations and Constituents Engagement
Robert Greenhill
Managing Director, Chief Business Officer
EDITORS
Beñat Bilbao-Osorio, Associate Director and Senior Economist, Global Competitiveness and Benchmarking Network, World Economic Forum
Soumitra Dutta, Dean, Samuel Curtis Johnson Graduate School of Management, Cornell University
Bruno Lanvin, Executive Director, eLab, INSEAD
GLOBAL COMPETITIVENESS AND BENCHMARKING NETWORK
Jennifer Blanke, Chief Economist, Head of the Global Competitiveness and Benchmarking Network
Ciara Browne, Associate DirectorGemma Corrigan, InternRoberto Crotti, Quantitative EconomistMargareta Drzeniek Hanouz, Director, Lead
Economist, Head of Competitiveness ResearchThierry Geiger, Associate Director, EconomistTania Gutknecht, Community ManagerCaroline Ko, Junior EconomistCecilia Serin, Team Coordinator
INFORMATION TECHNOLOGY AND TELECOMMUNICATIONS
INDUSTRIES TEAM
Alan Marcus, Senior Director, Head of Information and Communication Technologies Industries
William Hoffman, Associate Director, Head of Issue Community
Danil Kerimi, Associate Director, Head of Government Community
Elena Kvochko, Project Manager, Information Technology Industry
Derek O’Halloran, Head of Information Technology Industry
Alexandra Shaw, Team Coordinator, Information Technology Industry
Bruce Weinelt, Director, Head of Telecommunication Industry
World Economic ForumGeneva
Copyright © 2013by the World Economic Forum and INSEAD
All rights reserved. No part of this publication may be reproduced, stored in a retrieval system, or transmitted, in any form or by any means, electronic, mechanical, photocopying, or otherwise without the prior permission of the World Economic Forum.
ISBN-10: 92-95044-77-0ISBN-13: 978-92-95044-77-7
This report is printed on paper suitable for recycling and made from fully managed and sustained forest sources.Printed and bound in Switzerland by SRO-Kundig.
Visit The Global Information Technology Report page at www.weforum.org/gitr.
We thank Hope Steele for her excellent editing work and Neil Weinberg for his superb graphic design and layout.
The terms country and nation as used in this report do not in all cases refer to a territorial entity that is a state as understood by international law and practice. The terms cover well-defined, geographically self-contained economic areas that may not be states but for which statistical data are maintained on a separate and independent basis.
@ 2013 World Economic Forum

The Global Information Technology Report Report 2013 | iii
Contents
Preface v
Børge Brende and Robert Greenhill (World Economic Forum)
Foreword vii
Cesare Mainardi (Booz & Company)
Foreword ix
John Chambers (Cisco Systems)
Executive Summary xi
Beñat Bilbao-Osorio (World Economic Forum), Soumitra
Dutta (Cornell University), and Bruno Lanvin (INSEAD)
The Networked Readiness Index Rankings xxi
Part 1: The Current Networked Readiness for Growth and Jobs
1.1 The Networked Readiness Index 2013: 3 Benchmarking ICT Uptake and Support for Growth and Jobs in a Hyperconnected World
Beñat Bilbao-Osorio (World Economic Forum),
Soumitra Dutta (Cornell University), Thierry Geiger
(World Economic Forum), and Bruno Lanvin (INSEAD)
1.2 Digitization for Economic Growth and 35 Job Creation
Karim Sabbagh, Roman Friedrich, Bahjat El-Darwiche,
Milind Singh, and Alex Koster (Booz & Company)
1.3 Convergent Objectives, Divergent Strategies: 43 A Taxonomy of National Broadband and ICT Plans
Robert Pepper and John Garrity (Cisco Systems)
1.4 The Importance of National Policy Leadership 53 Phillippa Biggs and Anna Polomska (ITU/UNESCO
Broadband Commission for Digital Development)
1.5 Fiber Broadband: A Foundation for Social 67 and Economic Growth
Sean Williams (BT)
1.6 The Economic Impact of Next-Generation 77 Mobile Services: How 3G Connections and the Use of Mobile Data Impact GDP Growth
Chris Williams, Davide Strusani, David Vincent, and
David Kovo (Deloitte LLP)
1.7 Better Measurements for Realizing the 81 Full Potential of Health Information Technologies
Elettra Ronchi (OECD), Julia Adler-Milstein and Genna R.
Cohen (University of Michigan), and Laura P. Winn and
Ashish K. Jha (Harvard School of Public Health)
1.8 Re-Establishing the European Union’s 93 Competitiveness with the Next Wave of Investment in Telecommunications
Scott Beardsley, Luis Enriquez, Wim Torfs, Ferry
Grijpink, Stagg Newman, Sergio Sandoval, and Malin
Strandell-Jansson (McKinsey & Company)
1.9 The Big Opportunity for Inclusive Growth 101 Mikael Hagström and Ian Manocha (SAS Institute Inc.)
Part 2: Case Studies of Leveraging ICTs for Competitiveness and Well-Being
2.1 Colombia’s Digital Agenda: Successes 111 and the Challenges Ahead
Diego Molano Vega (Ministry of Information
and Communication Technologies of Colombia)
2.2 The Metamorphosis to a Knowledge-Based 119 Society: Rwanda
Alex Ntale (Rwanda ICT Chamber and Private Sector
Federation), Atsushi Yamanaka (Rwanda Development
Board-ICT/Japan International Cooperation Agency), and
Didier Nkurikiyimfura (Ministry of Youth and ICT of Rwanda)
2.3 E-Government in Latin America: A Review 127 of the Success in Colombia, Uruguay, and Panama
Miguel A. Porrúa (Organization of American States)
@ 2013 World Economic Forum

iv | The Global Information Technology Report Report 2013
Contents
Part 3: Country/Economy Profiles
How to Read the Country/Economy Profiles ................................139
Index of Countries/Economies ......................................................141
Country/Economy Profiles ............................................................142
Part 4: Data Tables
How to Read the Data Tables .......................................................289
Index of Data Tables .....................................................................291
Data Tables ..................................................................................293
Technical Notes and Sources 361
About the Authors 367
List of Partner Institutes 375
Acknowledgments 383
@ 2013 World Economic Forum

The Global Information Technology Report Report 2013 | v
The 12th edition of The Global Information Technology Report (GITR) is being released at a time of cautious optimism after a long period of economic uncertainty that has transformed the global economic outlook. While uncertainty in the euro zone and the risk of political deadlock in the United States still persist and could derail the tentative economic recovery in developed economies, the risk of a financial and economic meltdown with unprecedented consequences seems more remote than it did a year ago. Overall, developed economies are striving to return to higher levels of competitiveness while fighting the stubbornly high levels of unemployment, especially among youth; at the same time, developing and emerging economies are focusing on innovation as a prerequisite to sustain the high economic growth rates they have experienced in the past decade and leapfrog toward higher levels of economic and social prosperity.
Against this backdrop, the role that information and communication technologies (ICTs) can play to support economic growth and the creation of high-quality jobs has never drawn so much attention and research. There had been some initial concerns about the risk, in some developed economies, that ICTs could accelerate the delocalization of certain economic activities toward developing countries. But the benefits of ICTs are now widely recognized everywhere as an important source of efficiency gains for companies that will allow them to optimize their production function and liberalize resources toward other productive investments. Moreover, ICTs are also increasingly recognized as a key source of innovation that can generate increased economic growth and new sources of high-value-added jobs. This ability to innovate is essential in the current information revolution that is transforming economic and social transactions in our societies.
The GITR series has been published by the World Economic Forum in partnership with INSEAD since 2002. The Report has accompanied and monitored ICT advances over the last decade as well as raising awareness of the importance of ICT diffusion and usage for long-term competitiveness and societal well-being. Through the lens of the Networked Readiness Index (NRI), the driving factors and impacts of networked readiness and ICT leveraging have been identified, highlighting the joint responsibility of all social
actors—individuals, businesses, and governments.Over time, the series has become one of the most-
respected studies of its kind. It is extensively used by policymakers and relevant stakeholders as a unique tool to identify strengths on which to build and weaknesses that need to be addressed by national strategies for enhanced networked readiness.
The Global Information Technology Report 2013 features the latest results of the NRI, offering an overview of the current state of ICT readiness in the world. This year’s coverage includes a record number of 144 economies, accounting for over 98 percent of global GDP. A number of essays on the role of ICTs to promote growth and jobs in an increasingly hyperconnected world, as well as policy case studies on developing ICTs, are featured in the Report, together with a comprehensive data section—including detailed profiles for each economy covered and data tables with global rankings for the NRI’s 54 indicators.
We would like to convey our sincere gratitude to the industry and international organizations’ experts who contributed outstanding chapters exploring the links between ICTs and economic growth and job creation, as well as to policy analysts for providing their valuable insights in the policy case studies.
We especially wish to thank the editors of the Report, Soumitra Dutta at the Samuel Curtis Johnson Graduate School of Management at Cornell University, Bruno Lanvin at INSEAD, and Beñat Bilbao-Osorio at the World Economic Forum, for their leadership in this project, together with the other members of the GITR team: Thierry Geiger, Danil Kerimi, and Elena Kvochko. Appreciation also goes to Alan Marcus, Senior Director and Head of the Information Technology and Communication Industries team, and Jennifer Blanke, Chief Economist and Head of the Global Competitiveness and Benchmarking Network, as well as her team: Ciara Browne, Gemma Corrigan, Roberto Crotti, Margareta Drzeniek Hanouz, Tania Gutknecht, Caroline Ko, and Cecilia Serin. Last but not least, we would like to express our gratitude to our network of 167 Partner Institutes around the world and to all the business executives who participated in our Executive Opinion Survey. Without their valuable input, the production of this Report would not have been possible.
PrefaceBØRGE BRENDE AND ROBERT GREENHILL
World Economic Forum
@ 2013 World Economic Forum

@ 2013 World Economic Forum

The Global Information Technology Report Report 2013 | vii
ForewordCESARE MAINARDI
Chief Executive Officer, Booz & Company
Ever since Adam Smith first proposed the theory of absolute advantage enjoyed by a country in producing a good or service, policymakers have sought to build and maintain such an advantage in key sectors of their economies. What has become increasingly clear over the past 12 years that the World Economic Forum and INSEAD have been publishing this Global Information Technology Report is the role that information communication technologies (ICTs), and specifically digitization, plays in the potential development and maintenance of absolute advantage.
Digitization—the mass adoption of connected digital services by consumers, enterprises, and governments—is far more than a disruptive wave washing over isolated industries. We have long since recognized that reality. Digitization is a fundamental driver of economic growth and job creation the world over—in both developed and emerging markets. And that is not hollow rhetoric—it is confirmed by econometric analysis that Booz & Company has conducted to quantify the actual impact of digitization on a country’s economic output (GDP) and employment. In fact, we have created a Digitization Index that scores a country’s digitization level on a scale of 0 to 100. This level-setter allows us to go beyond the anecdotal evidence of the transformational impact of ICTs and actually measure that impact on economic and social factors on a comparative basis.
The headline is powerful: despite the continued sluggishness of economies across the globe, digitization boosted world economic output by nearly US$200 billion and created 6 million jobs in 2011. Specifically, our analysis reveals that an increase of 10 percent in a country’s digitization score drives a 0.75 percent growth in its GDP per capita. That same 10 percent boost in digitization leads to a 1.02 percent drop in a state’s unemployment rate. These benefits grow as a country moves along the digitization continuum—in other words, increased digitization yields improving returns.
Although the net effect of digitization is positive, as you begin analyzing the data by country and sector, certain tradeoffs become apparent. For example, advanced-stage economies in North America and Western Europe, for a number of reasons, realize fewer employment benefits than developing economies as their digitization level increases. Their productivity
improves; some jobs get replaced by technologies; and lower-value-added, labor-intensive jobs go overseas to emerging markets where labor is cheaper. On a sector-by-sector basis, you see the same effect in highly digitized industries such as financial services and manufacturing.
Thus no universal prescriptions are available for realizing the full socioeconomic benefits of digitization—the right formula will vary by country and industry. But there is no question that the benefits are there to be realized, and they are substantial for the foresighted and sure-footed.
The lesson for policymakers and national leaders is clear: having laid the necessary groundwork by building out broadband infrastructure and ensuring access, it is now time to differentiate around distinctive opportunities and capabilities. Governments have a role to play as digital market makers. That means making deliberate choices about what sectors furnish the best opportunity for that absolute advantage Adam Smith described and focusing on them. It means understanding the tradeoffs between job creation and productivity that increasing digitization brings, and creating mechanisms to offset potential job losses. Finally, it means understanding what capabilities you must bring as a policymaker to advancing your country’s digitization agenda. Do you need to play the role of direct developer, financier, or facilitator? There are successful models of all three capability sets in practice today around the world. You have only to open your eyes and apply the right capabilities lens to chart the right path forward. This year’s Global Information Technology Report will illuminate the way.
@ 2013 World Economic Forum

@ 2013 World Economic Forum

The Global Information Technology Report Report 2013 | ix
ForewordJOHN CHAMBERS
Chairman and Chief Executive Officer, Cisco Systems
It has been almost 30 years since the connections that sparked one of the greatest technological transformations in history were made, creating an enormous global market for information and communication technologies (ICTs) while laying the foundation for networked readiness. Today the Internet and the applications and the services it supports touch our lives every day. Just as Cisco was at the forefront of network development in the past, today we envision a future where everything is connected and amazing things are possible.
More than 99 percent of things in the physical world are not linked to the Internet. Yet. But as the world transitions into what we call the Internet of Everything (IoE)—the intelligent connection of people, processes, data, and things—only the networked readiness of countries will dictate where the IoE will take hold and who will reap its benefits. Given the economic and social potential of this market transition, we are very pleased to again collaborate with the World Economic Forum and INSEAD in the production of this year’s Global Information Technology Report and its Networked Readiness Index.
The IoE and intelligent networking will impact all sectors, creating opportunities for people, businesses, and countries. An intelligent network will be the driver of the next round of innovation, productivity enhancement, and employment.
Developing the IoE will require close collaboration among stakeholders in industry, customers, academia, and government. Products and services will be developed commercially, customers will dictate what succeeds in the market place, academia can aid in research and design, and governments can play a role in maintaining a vibrant and competitive business environment where innovation will flourish.
This year’s Global Information Technology Report, focusing on ICTs for growth and jobs, places a spotlight on the role that technology can have in economic growth and employment. As highlighted in the research that follows, high-speed broadband networks have demonstrated a positive impact on short- and long-term employment, and we believe the next wave of Internet development will further advance the growth effects of the network.
@ 2013 World Economic Forum

@ 2013 World Economic Forum

Executive SummaryBEÑAT BILBAO-OSORIO, World Economic Forum
SOUMITRA DUTTA, Cornell University
BRUNO LANVIN, INSEAD
When The Global Information Technology Report (GITR) and the Networked Readiness Index (NRI) were created some 12 years ago, the attention of decision makers and investors was on adopting business and financial strategies that would allow them to develop in the context of a fast-moving but nascent Internet economy. Over more than a decade, the NRI has provided decision leaders with a useful conceptual framework to evaluate the impact of information and communications technologies (ICTs) at a global level, and to benchmark the ICT readiness and the usage of their economies.
Today, the world has undergone massive changes: the Internet bubble has come and gone, and emerging countries such as China and India have become prominent global users and providers of ICT equipment and services. Struggling to emerge from the financial crisis, developed economies are striving to return to higher levels of growth and competitiveness while fighting stubbornly high unemployment rates, especially among their youth. Both emerging and developed economies are focusing on innovation, competing globally for talent, resources, and market shares. Information flows and networks have spread across borders in ways that could not be imagined before the onset of the Internet, the global adoption of mobile telephony and social networks, and the rapid growth of broadband. Business models have been redefined, the workplace has been redesigned, small startups have evolved into large companies, and entire functions of society (education, health, security, privacy) are being rethought.
ICTs, COMPETITIVENESS, GROWTH, AND JOBS: A COMPLEX RELATIONSHIPThe links between ICTs (their tools, services, and models) on the one hand and the unwavering importance of competitiveness, growth, and jobs on the other have never before been the subject of so much attention and concern. This is hardly surprising when one considers the “pull” of technology: developed economies need to reinvent themselves to maintain or restore their competitiveness, retain or regain market shares, and create jobs; emerging and developing economies are seeking ways to improve productivity and find new sources of growth through new technologies. Finally,
the world needs to collectively address environmental and social challenges to ensure a more sustainable development path and a better quality of life for its people.
On the “push” side, technological progress continues at a relentless speed. The growing availability of technology has empowered citizens of both developed and emerging economies with fairly good access to the digital world. The rise of cloud computing has reduced the competitive differentials in technology availability across larger and smaller firms. Low entry barriers in the digital space have sparked creativity and given rise to a class of young entrepreneurs around the world. It is clear that ICTs offer higher benefit-to-cost ratios in all sectors of production, while simultaneously offering new ways to create value by better and more efficiently organizing the use of natural, financial, and human resources.
Numerous studies have been presented in the literature on the connections between ICTs on the one hand, and development and growth on the other. Although the first analyses of the economic impact of fixed telephone density on economic growth were conducted more than three decades ago,1 such studies have proliferated in recent years. Despite the ubiquity of ICTs in society and business, such research has not been easy. For one thing, the pace of adoption of many technologies (broadband, mobile, etc.) has been fast and recent—thus limiting the validity of longitudinal studies and making it difficult for data collection agencies to keep pace with the definition and collection of appropriate metrics. Also, it remains challenging to isolate the impact of ICTs as their economic impacts have often occurred when combined with other broad social and business changes.
For more than a decade, the NRI has included aspects of how ICTs are transforming the economy and society. Among the expressions of transformation is the development of new skills that are important in knowledge-based, information-rich societies and that are crucial for employment. Despite the fact that ICTs are becoming increasingly universal, the question of access and usage remains important—especially for developing countries, given their need to narrow the digital divide. The NRI includes features related to access and usage that cover not only affordable ICT infrastructure but
The Global Information Technology Report Report 2013 | xi @ 2013 World Economic Forum

also digital resources, including software and skills. In addition, the NRI includes proxies to assessing some of the economic and social impacts accruing from ICTs. Thus, the Index facilitates the identification of areas where policy intervention—through investment, smart regulation, and/or incentives—could boost the impact of ICTs on development and growth.
PART 1: THE CURRENT NETWORKED READINESS LANDSCAPEPart 1 presents the latest findings of the NRI, offering a comprehensive assessment of the present state of networked readiness in the world. Furthermore, a number of expert contributions inquiring into the relation between ICTs and growth and jobs in the current economic and digital context are also included. These relate to (1) the role of digitization for economic growth and job creation; (2) the description of a taxonomy of national broadband and ICT plans; (3) the importance of national policy leadership; (4) the role of fiber broadband for economic and social growth; (5) the economic impact of next-generation mobile technologies; (6) the need for better measurement to realize the potential of health information technologies; (7) the role of ICTs for Europe to regain its competitiveness, and (8) the potential of ICTs to support social inclusion.
Insight from the NRI 2013 on the world’s networked readinessGiven the potential high returns that ICTs can provide in transforming a nation’s economy and its citizens’ well-being, assessing ICT developments has been the object of much academic and policy attention in the past decade. Several organizations have made significant efforts to measure and benchmark ICT deployment and uptake, but few have aimed at equally assessing the returns that ICTs can actually provide to both the economy and society. Although data availability is still scarce in terms of ICT impacts, policy interest in measuring ICTs has shifted from measuring ICT access to measuring ICT impacts.
Last year, after two years of research and consultations with ICT practitioners, policy and industry experts, and academia, a new subindex on ICT impacts that aimed at holistically assessing the way that countries go about leveraging ICTs and benefiting from them in terms of enhanced competitiveness and well-being has been introduced in the NRI. This evolution ensures that the NRI framework remains at the forefront of ICT measurement. As one of the most authoritative assessments of its kind, it has been adopted by several governments as a valuable tool for informing their competitiveness and policy agendas.
As a result, the framework gauges:
• the friendliness of a country’s market and regulatory framework in supporting high levels of ICT uptake;
• the degree of a society’s preparation to make good use of an affordable ICT infrastructure;
• the efforts of the main social agents—that is, individuals, business, and government—to increase their capacity to use ICTs as well as their actual use of ICTs in day-to-day activities; and
• the broad economic and social impacts accruing from ICTs and the transformation of a country toward an ICT- and technology-savvy economy and society.
As in previous editions, the NRI is composed of a mixture of quantitative data collected by international organizations—such as International Telecommunication Union (ITU), other UN agencies, the Organisation for Economic Co-operation and Development (OECD), and the World Bank—and survey data from the Executive Opinion Survey (the Survey), conducted annually by the Forum in each of the economies covered by the Report. The NRI 2013 covers a record number of 144 economies, accounting for over 98 percent of world GDP.
In terms of the results (see the Networked Readiness Index Rankings provided on page xix), two groups of economies dominate the NRI: Northern European economies and the so-called Asian Tigers. Among the Northern European countries, four out of the five Nordic economies featured in the NRI—Finland, Sweden, Norway, and Denmark (in rank order)—continue to feature in the top 10. Iceland, the last of the Nordics, is not too far behind, at 17th place. The performance of this group in terms of readiness is particularly outstanding. All five Nordics feature in the top 10 of this subindex. Within this subindex, on the infrastructure and digital content pillar, four countries occupy the top positions. As highlighted in the previous edition and in this Report, the gap between those countries and the ones in the Southern and Eastern parts of Europe is profound. A second group of economies that posts a remarkable performance are the Asian Tigers: Singapore, Taiwan (China), the Republic of Korea, and Hong Kong SAR. All boast outstanding business and innovation environments that are consistently ranked among the most conducive in the world. The Tigers also stand out for their governments’ leadership in promoting the digital agenda, and the impact of ICTs on society tends to be larger in these economies.
Finland (1st) reaches the top of the NRI rankings for the first time, thanks to improvements across the board. The country shows progress on two-thirds of the 54 indicators of the NRI and posts a very consistent performance across all categories of the NRI. Singapore
xii | The Global Information Technology Report Report 2013
Executive Summary
@ 2013 World Economic Forum

remains 2nd overall, while slightly improving its score. The extreme efficiency and business friendliness of its institutional framework, strong intellectual property protection, intense competition, and high university enrollment rate lead to these outstanding outcomes. Sweden (3rd) maintains its score, but declines two positions and abandons the top spot to Finland. Despite this slight decline in rankings, the country undeniably remains one of the few truly knowledge-based economies of this world.
Up three notches, the United Kingdom (7th) posts the biggest rank improvement among the top 10 economies. The country offers one of the most conducive environments for ICT development. In particular, it offers a sound and conducive political and regulatory environment (7th). The country also boasts high levels of ICT adoption. ICTs are pervasive among the population, businesses, and the government. Down one, the United States slips to 9th place despite a performance essentially unchanged from the previous year. This constitutes the country’s worst showing since the first edition of the GITR in 2001, in which it ranked 1st, although changes to the methodology and in the composition of the NRI over time cause the results not to be strictly comparable. The country still possesses many strengths, however, which have contributed to making it the world’s innovation powerhouse for decades.
Several European countries continue to lead the rankings, showcasing their strong efforts and commitment to fully develop and leverage ICTs to boost their competitiveness and the well-being of their citizens. Within the European Union (EU), while stark intra-regional disparities persist, it is worth noting that the divergence across Member States in the NRI is significantly narrower than it is in the Global Competitiveness Index,2 the most comprehensive analysis for measuring the set of policies, institutions, and factors that drive the productivity of an economy. This reflects the longstanding efforts of the European Union to narrow the digital divide in Europe and build an internal digital market, as corroborated by the launch of a new Digital Agenda for Europe,3 one of the seven flagship initiatives of the European Commission’s Europe 2020 Strategy for growth and jobs for the present decade.
Within the Commonwealth of Independent States, several countries have fully recognized the potential of ICTs to leapfrog and diversify their economies, and important progress has been recorded since last year.
Asia is home to some of the world’s wealthiest, most successful economies in the world and also to some of its poorest. Unsurprisingly, a similarly profound diversity characterizes Asia’s digital landscape, thus making it impossible to draw a uniform picture of the region. The most digitized and innovative nations—the
Asian Tigers—on the planet are next to some of the least-connected ones. Nowhere else does the regional digital divide run as deeply as it does in Asia. Regardless of their position on the development ladder, all Asian economies have much to gain from increased networked readiness. It will allow populations of the least-advanced countries to gain access to much-needed basic services, improved government transparency and efficiency, and—for the most advanced, many of which suffer from anemic economic growth—it will contribute to boosting their innovation capacity. The NRI reveals that in the case of Asia’s best-performing economies, governments typically lead the digital effort, unlike in Europe. At the heart of Asia, and representative of its immense diversity, the Association of Southeast Asian Nations (ASEAN) is fairly dynamic. Led by Singapore, all eight ASEAN members covered by the NRI improve their overall score and a majority progress in the rankings, albeit in some cases—such as Cambodia and the Philippines—from a low base.
Digitally connecting the hemisphere remains one of the key challenges for Latin America and the Caribbean, as recognized during the Sixth Summit of the Americas, which took place in Colombia in April 2012.4 While several countries have made remarkable improvements that are clearly reflected in important gains in the scores and rankings of the NRI—including Panama, Mexico, Colombia, and El Salvador—overall, Latin American and the Caribbean still suffers from a serious lag that prevents it from fully leveraging the potential of ICT to boost the regional productivity. The social and, most remarkably, economic impacts accruing from ICTs remain low in comparison with other regions despite government-led efforts to develop and upgrade ICT infrastructure and also despite governments’ increasing use of the Internet to communicate and interact with individuals and the business community. Weaknesses in the political and regulatory environment, the existence of large segments of the population with a low skill base, and poor development of the innovation system are all factors hindering the potential that ICT developments could have on the regional economy.
Sub-Saharan Africa has continued to make significant efforts to build its ICT infrastructure, as reflected by important improvements in developing its broadband infrastructure and the expansion of its mobile network coverage. As a result, ICT usage, while still very low, has picked up slightly, as seen especially by an increase in the number of Internet users and also by the continued commitment of some governments in the region to expand the number of available online services. Despite this positive trend, the stubbornly high sharp digital divide from more advanced economies, notably in terms of ICT-driven economic and social impacts, persists. A still-costly access to ICT infrastructure,
The Global Information Technology Report Report 2013 | xiii
Executive Summary
@ 2013 World Economic Forum

relatively low levels of skills with low educational attainments, and unfavorable business conditions for entrepreneurship and innovation are hindering the region’s capacity to fully leverage the potential of the increasingly available ICT infrastructure. As a result, only two countries—Mauritius (55th) and South Africa (70th)—are positioned in the top half of the rankings, while nine out of the bottom ten belong to the region.
The Middle East and North Africa region boasts one of the most diverse performances in the world. On the one hand, Israel and several Gulf Cooperation Council states have sharply improved their overall performances and have continued their investments to make ICTs one of the key national industries that attempt to diversify and transform their economies. On the other hand, several North African and Levant nations have either fallen—or stagnated, in the best cases—in their efforts to leverage ICTs as part of their economic and social transformation process toward more knowledge-intensive activities and open societies.
Digitization for Economic Growth and Job Creation: Regional and Industry PerspectivesChapter 1.2, contributed by Karim Sabbagh, Roman Friedrich, Bahjat El-Darwiche, Milind Singh, and Alex Koster at Booz & Company, analyses the rise of digitization—the mass adoption of connected digital services by consumers, enterprises, and governments—as a key economic driver that accelerates growth and facilitates job creation. In the current context of a sluggish global economy, digitization can play an important role in assisting policymakers to spur economic growth and employment. Booz & Company’s econometric analysis estimates that, despite the unfavorable global economic climate, digitization provided a US$193 billion boost to world economic output and created 6 million jobs globally in 2011.5
However, the impact of digitization by country and by sector is uneven. Developed economies enjoy higher economic growth benefits by a factor of almost 25 percent, although they tend to lag behind emerging economies in job creation by a similar margin. The main reason for the differing effects of digitization lies in the economic structures of developed and emerging economies. Developed countries rely chiefly on domestic consumption, which makes nontradable sectors important. Across developed economies, digitization improves productivity and has a measurable effect on growth. However, the result can be job losses because lower-skilled, lower-value-added work is sent abroad to emerging markets where labor is cheaper. By contrast, emerging markets are more export-oriented and driven by tradable sectors. They tend to gain more from digitization’s effect on employment than from its influence on growth.
Policymakers can harness these varying effects of digitization through three main measures that go beyond their current roles of setting policy and regulations. First, they should create digitization plans for targeted sectors in which they wish to maximize the impact of digitization. Second, they should encourage the development of the necessary capabilities and enablers to achieve these digitization plans. Finally, policymakers should work in concert with industry, consumers, and government agencies to establish an inclusive ICT ecosystem that encourages greater uptake and usage of digital services.
Convergent Objectives, Divergent Strategies: A Taxonomy of National Broadband and ICT PlansIn Chapter 1.3, Robert Pepper and John Garrity from Cisco Systems analyze the wide range of formal broadband policies around the world. A critical question now is whether the divergence in policy packages will result in significant differences in the efficacy of plans. To begin this research and establish a foundation for understanding the global landscape of national broadband and ICT plans, this chapter reviews plans around the world and presents a taxonomy for classification. The authors first detail the existing relationship among broadband, economic growth, and employment. Next they analyze a cross-section of national plans, their objectives, and their policy components. Subsequently they propose a taxonomy examining the degree of broadband supply- and demand-side emphasis. This taxonomy establishes a common language that can guide governments through the development of national broadband plans and serves as a baseline for evaluating the factors of success for implemented plans.
They find that as countries around the world have developed national plans to accelerate broadband adoption, the plans vary by both goals and policy recommendations. Their taxonomy of broad-based, supply-driven, demand-driven, and emergent plans provides a clear method for categorizing national broadband and ICT plans on the breadth of their policy options; the classification also provides a starting point for the review and comparison of national plans. Further, it can aid policymakers in countries with strategic plans underway as they work to increase broadband adoption.
The Importance of National Policy LeadershipChapter 1.4, contributed by Phillippa Biggs and Anna Polomska at the ITU/UNESCO Broadband Commission for Digital Development, evaluates recent growth in national broadband plans and the importance of national policy leadership for driving the rollout of broadband networks, services, and applications. In light of recent evidence for strong positive externalities to investments in broadband networks, rapid technological evolution, and a changing institutional environment, the chapter
xiv | The Global Information Technology Report Report 2013
Executive Summary
@ 2013 World Economic Forum

explores the changing role of policymakers in helping to facilitate and set national policy.
A growing number of countries now recognize the importance of policy leadership and a clear cross-sectoral vision to maximize the economic and social returns to ICTs, as shown by strong growth in the number of national broadband plans. This chapter provides a brief overview of the growth in these plans and the key characteristics of good ones, with reference to several examples: the US, UK, and Polish national broadband plans.
Fiber Broadband: A Foundation for Social and Economic GrowthIn Chapter 1.5, Sean Williams from BT highlights the fact that, as the foundation for knowledge- and ICT-based jobs, fiber broadband has the potential to drive social and economic growth and help create jobs. As Europe, and the wider developed world, look to emerge from the recent financial crisis and downturn, such growth will be vital. The issue is not whether fiber broadband can help drive social and economic growth, but how the vision of coverage as close as possible to 100 percent can be achieved.
This chapter aims to advance the debate in two ways: first, by reviewing recent independent research from Regeneris, an economic development consulting firm, detailing the economic impact of high-speed broadband infrastructure on environments as diverse as capital cities and economically deprived rural regions. And second, by articulating technical and market solutions that are fit for purpose in the current economic climate.
The chapter recommends policy responses that national governments and regional authorities should implement to put these solutions into action.
The Economic Impact of Next-Generation Mobile Services: How 3G Connections and the Use of Mobile Data Impact GDP GrowthIn Chapter 1.6, Chris Williams, Davide Strusani, David Vincent, and David Kovo from Deloitte LLP argue that the mobile telecommunication sector continues to offer unprecedented opportunities for economic growth in both developing and developed markets, and that mobile communication services have become an essential part of how economies work and function.
As technology develops, mobile telephony has the potential to impact economic development further through the provision of high-value 3G and 4G data services accessed via smartphones, tablets, and dongles that deliver mobile data services to businesses and consumers. For the first time, applying econometric analysis, the authors studiy the impact, on GDP per capita growth, of consumers substituting a 2G connection with a 3G connection and, based on data
from Cisco Systems, the impact of increasing usage of mobile data per 3G connection. This study finds that:
• For a given level of mobile penetration, a 10 percent increase in 3G penetration increases GDP per capita growth by 0.15 percentage points.
• A doubling of mobile data use is associated with an increase in the GDP per capita growth rate of 0.5 percentage points.
These results suggest that policy activity should focus on increasing 3G penetration and mobile data consumption. This focus should include making spectrum available for mobile broadband and encouraging the substitution of basic mobile services with more-advanced 3G connections.
Better Measurements for Realizing the Full Potential of Health Information TechnologiesHealthcare has become an increasingly dominant topic of discussion in recent years because of rising costs and the need to improve the efficiency and quality of healthcare delivery. Although ICTs cannot, alone, provide the solution for overcoming these issues, they are seen by many governments as potentially playing a significant role as enablers of the changes required in health systems.
In light of this, a critical question now facing policymakers is how to realize the full potential of these technologies, particularly since the challenges to achieving widespread ICT adoption and use are proving daunting.
In Chapter 1.7, Elettra Ronchi from the Organisation for Economic Co-operation and Development (OECD), Julia Adler-Milstein and Genna R. Cohen from the University of Michigan, and Laura P. Winn and Ashish K. Jha from the Harvard School of Public Health argue that countries have much to gain by combining their efforts and sharing the burden of developing comparable measures for evidence-based policy in this sector. Risk, delay, and cost can be minimized by learning from good international practices.
The chapter reviews what is currently known about the state of implementation of ICTs in the health sector across OECD countries and the benefits that can be realized from these technologies, including the opportunities for economic growth. It then discusses the efforts, led by the OECD, to develop a common set of indicators, describing the policy motivation for this work, the process followed, the current status of these measures, and the key remaining challenges.
The Global Information Technology Report Report 2013 | xv
Executive Summary
@ 2013 World Economic Forum

Re-Establishing the European Union’s Competitiveness with the Next Wave of Investment in TelecommunicationsIn Chapter 1.8, Scott Beardsley, Luis Enriquez, Wim Torfs, Ferry Grijpink, Stagg Newman, Sergio Sandoval, and Malin Strandell-Jansson from McKinsey & Company argue that Europe’s fixed and mobile telecommunication networks need a massive upgrade to satisfy burgeoning consumer demand for new Internet services. McKinsey & Company estimates that modernizing the EU-15’s fixed telecommunication infrastructure to give all households access to high-speed broadband will take €200 to €250 billion, while revamping Europe’s mobile infrastructure to offer 4G services to 95 percent of the region’s population would cost another €50 to €70 billion.
Unless they make investments on this scale, Europe’s economies risk losing technology leadership across the telecommunication value chain to Asia and the United States. High-speed network investment is far ahead in both regions. For instance, around 64 percent of 4G mobile subscriptions worldwide are in North America, 33 percent in Asia Pacific, but only 3 percent in Europe. Value-added by the US telecommunication industry grew in real terms by 18 percent from 2007 to 2010, but only 7 percent in Europe.
Downward pressure on both wholesale and retail prices is choking growth and profitability among Europe’s telecommunication players, hindering them from meeting their investment challenge. This chapter offers four ideas for shaping a region-wide policy framework that could lift those constraints:
• Allow a reduction in the number of fixed and mobile operators. Europe’s consumers could be better served by an industry with fewer players that are strong enough to make large investments but sufficiently plentiful to ensure vibrant competition.
• Allow more pricing flexibility, so operators get a proportionate return from customers who generate the most data traffic and take up the most bandwidth.
• Restrict wholesale access regulation to a few basic services, and allow “regulatory” holidays. This would give operators a better chance of recouping their investments.
• Release more spectrum to operators, giving them more options for extending network capacity.
The Big Opportunity for Inclusive GrowthThe social and economic environment is changing, and the way that business and government look at the economy must change with it. If not, we run the risk of social exclusion and further economic slowdown.
Big data is a new asset class that has great potential to help resurrect the global economy. Unlike
other essential assets—oil and water, for instance—it exists in abundance and can help reduce conflict and tension instead of proliferating discord.
In Chapter 1.9, Mikael Hagström and Ian Manocha from SAS Institute Inc. identify how big data and analytics can help energize the economy through efficiency, innovation and creative gains, by:
• using big data to stimulate new ways of doing business;
• using linguistic-based analytics to formulate policies and target action plans to tackle unemployment before problems manifest themselves;
• using big data and analytics to match people to jobs and jobs to people more proactively—the chapter draws on experiences at the national and state government level, and from working with financial institutions; and
• putting the tools and methods of analytics into the hands of an existing workforce to industrialize the service economy (the sleeping giant), much as Henry Ford’s innovation industrialized factory production.
The chapter analyzes advances in ICTs and current applications—such as how a major retail organization comes to understand what customers want (what products, where, and when) and the flow of this information back down their supply chain to manufacturers, based on demand. Such approaches can help ensure we have qualified labor in the right location at the right time.
PART 2: CASE STUDIES OF LEVERAGING ICTS FOR COMPETITIVENESS AND WELL-BEINGPart 2 presents deep-dive studies of selected national experiences of leveraging ICTs or developing the sector, showcasing the main challenges faced and the articulation of strategies to overcome them. In this edition, the cases of Colombia and Rwanda, as well as a comparative case study of e-government in three Latin American countries, are presented.
Colombia’s Digital Agenda: Successes and Challenges AheadIn recent years, the ICT sector has gained importance in Colombian public policy because the government has given priority to the development of Plan Vive Digital, which seeks to give the country a technological leap forward that affects the economy and development in a positive way, reducing poverty and increasing competitiveness and productivity.
In Chapter 2.1, Diego Molano Vega, Minister of Information and Communication Technologies of Colombia, identifies the four obstacles to achieving the
xvi | The Global Information Technology Report Report 2013
Executive Summary
@ 2013 World Economic Forum

widespread use of the Internet in his country: (1) people and businesses do not perceive the Internet as useful; (2) the costs of installing the necessary infrastructure are high; (3) the state has limited resources to invest in infrastructure; and (4) Colombians’ purchasing power is limited.
To achieve widespread Internet use, Plan Vive Digital has defined some concrete goals for the year 2014:
1. Triple the number of municipalities connected to the information highway. The aim is to extend the infrastructure to connect 1,053 of the country’s municipalities to the national fiber-optic network.
2. Connect 50 percent of micro-enterprises and small- and medium-sized enterprises, and 50 percent of homes to the Internet.
3. Increase the number of Internet connections fourfold. By 2014, we want to reach 8.8 million Internet connections.
Vive Digital aims to develop the country’s digital environment through its four principal components by:
1. expanding the infrastructure,2. creating new services at lower prices,3. developing digital applications and contents, and4. fostering ICT adoption and use.
The main goal is to establish a virtuous circle that can act as a method of feedback, in which a better infrastructure will allow more and better services at lower prices and also stimulate the development of content, applications, and demand.
The Metamorphosis to a Knowledge-Based Society: RwandaChapter 2.2, by Alex Ntale from the Rwanda ICT Chamber and Private Sector Federation, Atsushi Yamanaka from the Rwanda Development Board-ICT/Japan International Cooperation Agency, and Didier Nkurikiyimfura from Rwanda’s Ministry of Youth and ICT, present Rwanda’s remarkable journey from an agrarian economy to a knowledge-based one that has put the country at the forefront of the region in terms of ICTs.
Rwanda’s economy has continued to grow at comparably good rates, averaging 8 percent per annum, despite a global recessionary environment starting in 2008 and containing high inflationary pressures. This growth in such adverse circumstances can be attributed to good governance, sound fiscal discipline, and the commitment from both the public and private sector to build a more equitable country.
In the World Bank’s Doing Business 2012 report, Rwanda is ranked number one in East Africa with respect to starting up a business, registering property, protecting investors’ interests, enforcing contracts, and
obtaining access to credit. The Global Competitiveness Report 2012–2013 published by the World Economic Forum ranked Rwanda the most competitive economy in the East Africa Community (EAC) countries and third in sub-Saharan Africa. Rwanda also received top ranking in East Africa, and 7th in Africa among countries with active mobile-broadband subscriptions per 100 inhabitants in 2011 in the United Nations Broadband Commission report.
In many respects, this progress has come as a result of visionary leadership and good governance practices that have been embraced by Rwanda’s leaders. Rwanda has systematically fought corruption, which is one of the biggest impediments to development in Africa and everywhere in the world.
In its Vision 2020, developed in 2000, Rwanda set out on a journey to becoming a knowledge-based economy. To this end, the government integrated ICTs into its Vision 2020 to enable the country to leapfrog the key stages of industrialization and transform its agro-based economy into a service-oriented, information-rich and knowledge-based one that is globally competitive. This integration came in the form of its national ICT strategy and plan, commonly known as the National Information Communication Infrastructure Plan (NICI Plan), which Rwanda adopted in 2000 as an approach to use ICTs holistically for development. Each five-year phase (the NICI Plan includes four five-year phases spanning 20 years) characterizes this strategy and is aligned with the country’s overall development goals and vision.
The plan, now in its third phase, has delivered a number of successes. These include a nationwide fiber-optic backbone network, a state-of-the art tier 3 data center, 96 percent cell phone/data coverage, and multipurpose community tele-centers, to mention but a few of the plan’s successes.
E-Government in Latin America: A Review of the Success in Colombia, Uruguay, and PanamaAlthough Latin America entered in the 21st century with abundant initiatives aimed at introducing ICTs in the public sector, as evidenced by the numerous e-government solutions documented by the excelGov Awards, very few countries have been able to maintain a rhythm of progress comparable to the most advanced nations in the world. Colombia, Uruguay, Panama, Chile, and occasionally Mexico and Brazil, have occupied a place among the top 50 e-government countries in the most recognized worldwide rankings.
Chapter 2.3, by Miguel A. Porrúa from the Organization of American States, looks at three Latin American countries—Colombia, Uruguay, and Panama—and charts their respective paths to achieving success in establishing ICTs in public administration, and identifies some of their common elements.
The Global Information Technology Report Report 2013 | xvii
Executive Summary
@ 2013 World Economic Forum

For the past five years, Colombia, Uruguay, and Panama have seen progress that not only becomes empirical proof of the validity of most of the recommendations made by e-government authors and practitioners but also positions these three countries as a valuable reference for others around the world.
The three have built their success upon solid political support that comes from the highest office, the presidential, and goes to the next level, the ministerial. In all three countries, presidents have shown their commitment not just with words but with actions. Presidential decrees have sent an unmistakable message to citizens and government officers alike about their unwavering commitment to bringing ICTs to the public administration.
Usually, an immediate consequence of that political support is the availability of financial resources to undertake the main initiatives. Unfortunately, Latin America offers numerous examples of fruitless, well-designed e-government plans that, years after launching, are still waiting to see some financial investment that would allow the projects to be implemented. Although Colombia, Uruguay, and Panama could have done more in providing funding to e-government initiatives, they clearly understood that nice documents with no backing money produce no results. Smartly using international cooperation and public-private partnerships, they managed to allocate financial resources to their e-government plans every year.
The virtuous triangle of success in these three countries adds another vertex in the careful attention paid to human resources. The systematic investment in the qualification of government officers as well as a carefully designed institutional framework allowed Colombia, Uruguay, and Panama to advance more quickly than other countries in the region.
Other ingredients, such as the operational autonomy of AGESIC in Uruguay and AIG in Panama; the appropriation office in Colombia; the strong IT sector in Uruguay; the international cooperation in Panama; the implication of the private sector in Colombia; and the commitment of three, well-qualified champions in the three countries added the necessary spice to a recipe made of the best ingredients: political support, financial backing, and qualified human resources.
PARTS 3 AND 4: COUNTRY/ECONOMY PROFILES AND DATA PRESENTATIONParts 3 and 4 feature comprehensive profiles for each of the 144 economies covered in this year’s Report and data tables for each of the 54 variables composing the NRI, with global rankings. Each part begins with a description of how to interpret the data provided.
Technical notes and sources, included at the end of Part 4, provide additional insight and information on the definitions and sources of specific quantitative
non-Survey data variables included in the NRI computation this year.
NOTES 1 Jipp 1963.
2 See World Economic Forum 2012.
3 See the European Commission’s Digital Agenda, available at http://ec.europa.eu/digital-agenda/.
4 See http://www.summit-americas.org/default_en.htm.
5 The authors have estimated the GDP and employment impact caused by the increased digitization in most countries and aggregated to get the global impact.
REFERENCESITU (International Telecommunication Union). 2012. World
Telecomunication/ICT Indicators Database (December 2012 edition.) Available at http://www.itu.int/ITU-D/ict/publications/world/world.html.
Jipp, A. 1963. “Wealth of Nations and Telephone Density.” Telecommunications Journal (July): 199–201.
Katz, R. 2012. The Impact of Broadband on the Economy: Research to Date and Policy Issues. ITU Broadband Series, April. Geneva: ITU. Available at http://www.itu.int/ITU-D/treg/broadband/ITU-BB-Reports_Impact-of-Broadband-on-the-Economy.pdf.
World Economic Forum. 2012. The Global Competitiveness Report 2012–2013. Geneva: World Economic Forum. Available at www.weforum.org/gcr.
xviii | The Global Information Technology Report Report 2013
Executive Summary
@ 2013 World Economic Forum
The Networked Readiness Index Rankings
@ 2013 World Economic Forum

@ 2013 World Economic Forum

The Global Information Technology Report Report 2013 | xxi
The Networked Readiness Index 2013
2012 rank Rank Country/Economy Score (out of 142)
1 Finland 5.98 3 2 Singapore 5.96 2 3 Sweden 5.91 1 4 Netherlands 5.81 6 5 Norway 5.66 7 6 Switzerland 5.66 5 7 United Kingdom 5.64 10 8 Denmark 5.58 4 9 United States 5.57 8 10 Taiwan, China 5.47 11 11 Korea, Rep. 5.46 12 12 Canada 5.44 9 13 Germany 5.43 16 14 Hong Kong SAR 5.40 13 15 Israel 5.39 20 16 Luxembourg 5.37 21 17 Iceland 5.31 15 18 Australia 5.26 17 19 Austria 5.25 19 20 New Zealand 5.25 14 21 Japan 5.24 18 22 Estonia 5.12 24 23 Qatar 5.10 28 24 Belgium 5.10 22 25 United Arab Emirates 5.07 30 26 France 5.06 23 27 Ireland 5.05 25 28 Malta 4.90 26 29 Bahrain 4.83 27 30 Malaysia 4.82 29 31 Saudi Arabia 4.82 34 32 Lithuania 4.72 31 33 Portugal 4.67 33 34 Chile 4.59 39 35 Cyprus 4.59 32 36 Puerto Rico 4.55 36 37 Slovenia 4.53 37 38 Spain 4.51 38 39 Barbados 4.49 35 40 Oman 4.48 40 41 Latvia 4.43 41 42 Czech Republic 4.38 42 43 Kazakhstan 4.32 55 44 Hungary 4.29 43 45 Turkey 4.22 52 46 Panama 4.22 57 47 Jordan 4.20 47 48 Montenegro 4.20 46 49 Poland 4.19 49 50 Italy 4.18 48 51 Croatia 4.17 45 52 Uruguay 4.16 44 53 Costa Rica 4.15 58 54 Russian Federation 4.13 56 55 Mauritius 4.12 53 56 Azerbaijan 4.11 61 57 Brunei Darussalam 4.11 54 58 China 4.03 51 59 Mongolia 4.01 63 60 Brazil 3.97 65 61 Slovak Republic 3.95 64 62 Kuwait 3.94 62 63 Mexico 3.93 76 64 Greece 3.93 59 65 Georgia 3.93 88 66 Colombia 3.91 73 67 Macedonia, FYR 3.89 66 68 India 3.88 69 69 Sri Lanka 3.88 71 70 South Africa 3.87 72 71 Bulgaria 3.87 70 72 Trinidad and Tobago 3.87 60
2012 rank Rank Country/Economy Score (out of 142)
73 Ukraine 3.87 75 74 Thailand 3.86 77 75 Romania 3.86 67 76 Indonesia 3.84 80 77 Moldova 3.84 78 78 Bosnia and Herzegovina 3.80 84 79 Seychelles 3.80 n/a 80 Egypt 3.78 79 81 Cape Verde 3.78 81 82 Armenia 3.76 94 83 Albania 3.75 68 84 Vietnam 3.74 83 85 Jamaica 3.74 74 86 Philippines 3.73 86 87 Serbia 3.70 85 88 Rwanda 3.68 82 89 Morocco 3.64 91 90 Dominican Republic 3.62 87 91 Ecuador 3.58 96 92 Kenya 3.54 93 93 El Salvador 3.53 103 94 Lebanon 3.53 95 95 Ghana 3.51 97 96 Botswana 3.50 89 97 Liberia 3.48 n/a 98 Gambia, The 3.47 101 99 Argentina 3.47 92 100 Guyana 3.45 90 101 Iran, Islamic Rep. 3.43 104 102 Guatemala 3.42 98 103 Peru 3.39 106 104 Paraguay 3.37 111 105 Pakistan 3.35 102 106 Cambodia 3.34 108 107 Senegal 3.33 100 108 Venezuela 3.33 107 109 Honduras 3.32 99 110 Uganda 3.30 110 111 Namibia 3.29 105 112 Tajikistan 3.29 114 113 Nigeria 3.27 112 114 Bangladesh 3.22 113 115 Zambia 3.19 109 116 Zimbabwe 3.17 124 117 Suriname 3.13 121 118 Kyrgyz Republic 3.09 115 119 Bolivia 3.01 127 120 Côte d’Ivoire 3.00 122 121 Gabon 2.97 n/a 122 Mali 2.97 126 123 Benin 2.97 117 124 Cameroon 2.95 125 125 Nicaragua 2.93 131 126 Nepal 2.93 128 127 Tanzania 2.92 123 128 Ethiopia 2.85 130 129 Malawi 2.83 116 130 Burkina Faso 2.80 135 131 Algeria 2.78 118 132 Libya 2.77 n/a 133 Mozambique 2.76 120 134 Timor-Leste 2.72 132 135 Mauritania 2.71 139 136 Swaziland 2.69 136 137 Madagascar 2.69 134 138 Lesotho 2.68 133 139 Yemen 2.63 141 140 Guinea 2.61 n/a 141 Haiti 2.58 142 142 Chad 2.53 138 143 Sierra Leone 2.53 n/a 144 Burundi 2.30 137
@ 2013 World Economic Forum

@ 2013 World Economic Forum

Part 1The Current Networked Readiness for Growth and Jobs
@ 2013 World Economic Forum

@ 2013 World Economic Forum

The Global Information Technology Report 2013 | 3
CHAPTER 1.1
The Networked Readiness Index 2013: Benchmarking ICT Uptake and Support for Growth and Jobs in a Hyperconnected World
BEÑAT BILBAO-OSORIO, World Economic Forum
SOUMITRA DUTTA, Cornell University
THIERRY GEIGER, World Economic Forum
BRUNO LANVIN, INSEAD
When The Global Information Technology Report (GITR) and the Networked Readiness Index (NRI) were created some 12 years ago, the attention of decision makers and investors was on adopting business and financial strategies that would allow them to develop in the context of a fast-moving but nascent Internet economy. Over more than a decade, the NRI has provided decision makers with a useful conceptual framework to evaluate the impact of information and communication technologies (ICTs) at a global level, and to benchmark the ICT readiness and the usage of their economies.
Today, the world has undergone massive changes: the Internet bubble has come and gone, and emerging countries such as China and India have become prominent global providers and users of ICT equipment and services. Struggling to emerge from the financial crisis, developed economies are striving to return to higher levels of growth and competitiveness while fighting stubbornly high unemployment rates, especially among their youth. Both emerging and developed economies are focusing on innovation, competing globally for talent, resources, and market shares. Information flows and networks have spread across borders in ways that could not be imagined before the onset of the Internet, the global adoption of mobile telephony and social networks, and the rapid growth of broadband. Business models have been redefined, the workplace has been redesigned, small startups have evolved into large companies, and entire functions of society (education, health, security, privacy) are being rethought.
ICTs, COMPETITIVENESS, GROWTH, AND JOBS: A COMPLEX RELATIONSHIPThe links between ICTs (their tools, services, and models) on the one hand and the unwavering importance of competitiveness, growth, and jobs on the other have never before been the subject of so much attention and concern. This is hardly surprising when one considers the “pull” of technology: developed economies need to reinvent themselves to maintain or restore their competitiveness, retain or regain market shares, and create jobs; emerging and developing economies are seeking ways to improve productivity and find new sources of growth through new technologies. Finally, the world needs to collectively address environmental and social challenges to ensure a more sustainable development path and a better quality of life for its people.
On the “push” side, technological progress continues at a relentless speed. The growing availability of technology has empowered citizens of both developed and emerging economies with fairly good access to the digital world. The rise of cloud computing has reduced the competitive differentials in technology availability across larger and smaller firms. Low entry barriers in the
@ 2013 World Economic Forum

Chapter 1.1: The Networked Readiness Index 2013
4 | The Global Information Technology Report 2013
digital space have sparked creativity and given rise to a class of young entrepreneurs around the world. It is clear that ICTs offer higher benefit-to-cost ratios in all sectors of production, while simultaneously offering new ways to create value by better and more efficiently organizing the use of natural, financial, and human resources.
Numerous studies have been presented in the literature on the connections between ICTs on the one hand, and development and growth on the other. Although the first analyses of the economic impact of fixed telephone density on economic growth were conducted more than three decades ago,1 such studies have proliferated in recent years. Despite the ubiquity of ICTs in society and business, such research has not been easy. For one thing, the pace of adoption of many technologies (broadband, mobile, etc.) has been fast and recent—thus limiting the validity of longitudinal studies and making it difficult for data collection agencies to keep pace with the definition and collection of appropriate metrics. Also, it remains challenging to isolate the impact of ICT as its economic impacts have often occurred when combined with other broad social and business changes.
A recent ITU report summarizes the overall findings from current research on the economic impact of broadband:
First, broadband exhibits a higher contribution to
economic growth in countries that have a higher
adoption of the technology (this could be labelled the
“critical mass” or “return to scale” theory). Second,
broadband has a stronger productivity impact in
sectors with high transaction costs, such as financial
services, or high labor intensity, such as tourism and
lodging. Third, in less-developed regions, as postulated
in economic theory, broadband enables the adoption
of more efficient business processes and leads to
capital-labour substitution and, therefore, loss of jobs
(this could be labelled the “productivity shock theory”).
Fourth, the impact of broadband on small and medium
enterprises takes longer to materialize due to the need to
restructure the firms’ processes and labor organization
in order to gain from adopting the technology (this is
called “accumulation of intangible capital”). Finally, the
economic impact of broadband is higher when promotion
of the technology is combined with stimulus of innovative
businesses that are tied to new applications. In other
words, the impact of broadband is neither automatic nor
homogeneous across the economic system.2
The concluding sentence above is important and generally valid for most other analyses of the economic impact of ICTs on development and growth. This in no way negates either the economic impact of ICTs or
the studies thereof. Rather, it highlights the valuable contribution of comprehensive models of ICT usage and impact such as the Networked Readiness Index (NRI). The ITU report concludes that “this emphasizes the importance of implementing public policies not only in the areas of telecommunications regulation, but also in education, economic development and planning, science and technology and others.”3
For more than a decade, the NRI has included aspects of the ways ICTs are transforming the economy and society. Among the expressions of transformation is the development of new skills that are important in knowledge-based, information-rich societies and that are crucial for employment. Despite the fact that ICTs are becoming increasingly universal, the question of access and usage remains important—especially for developing countries, given their need to narrow the digital divide. The NRI includes features related to access and usage that cover not only affordable ICT infrastructure but also digital resources, including software and skills. In addition, the NRI includes proxies for assessing some of the economic and social impacts accruing from ICTs. Thus, the Index facilitates the identification of areas where policy intervention—through investment, smart regulation, and/or incentives—could boost the impact of ICTs on development and growth.
THE NETWORKED READINESS FRAMEWORK: A HOLISTIC APPROACH TO MEASURE ICT ACCESS AND IMPACTSGiven the potential high returns that ICTs can provide in transforming a nation’s economy and its citizens’ well-being, assessing ICT developments has been the object of much academic and policy attention in the past decade. Several organizations have made significant efforts to measure and benchmark ICT deployment and uptake, but few have aimed at equally assessing the returns that ICTs can actually provide to both the economy and society. Although data availability is still scarce in terms of ICT impacts, policy interest in measuring ICTs has shifted from measuring ICT access to measuring ICT impacts.
Last year, after two years of research and consultations with ICT practitioners, policy and industry experts, and academia, the NRI introduced a new subindex on ICT impacts that aimed at holistically assessing the way that countries go about leveraging ICTs and benefiting from them in terms of enhanced competitiveness and well-being. This evolution ensures that the NRI framework remains at the forefront of ICT measurement. As one of the most authoritative assessments of its kind, it has been adopted by several governments as a valuable tool for informing their competitiveness and policy agendas.
The design of the framework for the calculation of the NRI (Figure 1) has been guided by five principles:
@ 2013 World Economic Forum

The Global Information Technology Report 2013 | 5
Chapter 1.1: The Networked Readiness Index 2013
1. Measuring the economic and social impacts of ICTs is crucial. The NRI must include aspects of the way ICTs are transforming both the economy and society. In the economy of several countries, the ICT industry has become increasingly important and now accounts for a significant share of value-added and employment. In addition, ICTs interact closely with many other sectors, thus enabling innovations to accrue and affecting productivity. Moreover, the impacts of ICTs are also evident in the development of new skills that are important in knowledge-based, information-rich societies and that are crucial for employment. In society, ICTs allow citizens to participate more actively and steadily in social and political debates and make the government more accountable. They improve access to better and faster services, which, in turn, yield important benefits.
2. An enabling environment determines the capacity of an economy and society to benefit from the use of ICTs. The success of a country in leveraging ICTs and achieving the desired economic and social benefits will depend on its overall environment—including market conditions, the regulatory framework, and innovation-prone conditions—to boost innovation and entrepreneurship.
3. ICT readiness and usage remain key drivers and preconditions for obtaining any impacts. Despite the increasing availability of ICTs, the question of access and usage remains important especially for developing countries,
given their need to narrow the digital divide. Even within developed nations, the need to provide high-speed broadband to all segments of the population has acquired importance in recent years. Some features of the NRI are related to access and usage; these cover not only affordable ICT infrastructure but also digital resources, including software and skills. Moreover, ICT impacts can arise only if ICTs are widely used by all key actors—individuals, businesses, and governments. It is a society-wide effort. Those actors demonstrating better preparedness and greater interest are likely to use ICT more and more effectively, contributing to a greater impact on competitiveness and development.
4. All factors interact and co-evolve within an ICT ecosystem. Those societies that can count on better-prepared actors and an enabling environment are more likely to benefit from higher rates of ICT use and impacts. At the same time, those societies that benefit from higher rates of ICT use and positive impacts will, in turn, be more likely to benefit from a push on the part of the different stakeholders to be better prepared and keep improving the framework conditions that will allow for more and stronger benefits to accrue. As a result, a virtuous circle starts, where improvements in one area affect and drive improvements in other areas. Conversely, lags in one particular factor also affect the evolution of the other factors.
Infrastructure
Affordability Skills
Individual
Environment
DRIVERS
Business Government
IMPACTS
Economic
Social
Readiness Usage
Figure 1: The Networked Readiness Index framework
@ 2013 World Economic Forum

Chapter 1.1: The Networked Readiness Index 2013
6 | The Global Information Technology Report 2013
5. The framework should provide clear policy orientations and identify opportunities for public-private collaboration. The NRI facilitates the identification of areas where policy intervention—through investment including public-private partnerships, smart regulation, or the provision of incentives—could boost the impacts of ICTs. This is important because the development and general uptake of ICTs depend on the capacity of a country to provide an institutional framework with reliable and efficient rules and regulations; favorable business conditions for the founding and growth of new (social and commercial) enterprises; an innovation-prone environment, capable of developing and absorbing new knowledge; and an ICT-friendly government policy.
ELEMENTS OF THE NETWORKED READINESS INDEXThe networked readiness framework translates into the NRI, comprising four subindexes that measure the environment for ICTs; the readiness of a society to use ICTs; the actual usage of all main stakeholders; and, finally, the impacts that ICTs generate in the economy and in society. The three first subindexes can be regarded as the drivers that establish the conditions for
the results of the fourth subindex, ICT impacts. These four subindexes are divided into 10 pillars composed of 54 individual indicators in total, according to the following structure (see also Figure 2):
A. Environment subindex 1. Political and regulatory environment 2. Business and innovation environment
B. Readiness subindex 3. Infrastructure and digital content 4. Affordability 5. Skills
C. Usage subindex 6. Individual usage 7. Business usage 8. Government usage
D. Impact subindex 9. Economic impacts 10. Social impacts
The final NRI score is a simple average of the four composing subindex scores, while each subindex’s score is a simple average of those of the composing pillars. In doing this, we assume that all NRI subindexes
The NetworkedReadiness Index
Readiness Affordability
Infrastructure and digital content
Skills
Business usage
Individual usage
Government usage
Usage
Business and innovation environment
Political and regulatory environmentEnvironment
Subindexes Pillars
Social impacts
Economic impactsImpact
Figure 2: The Networked Readiness Index structure
@ 2013 World Economic Forum

The Global Information Technology Report 2013 | 7
Chapter 1.1: The Networked Readiness Index 2013
make a similar contribution to networked readiness. Appendix A includes detailed information on the composition and computation of the NRI 2013, while we briefly describe the different subindexes below.
Environment subindexThe environment subindex gauges the friendliness of a country’s market and regulatory framework in supporting high levels of ICT uptake and the emergence of entrepreneurship and innovation-prone conditions. A supportive environment is necessary to maximize the potential impacts of ICTs in boosting competitiveness and well-being. It includes a total of 18 variables distributed into two pillars.
The political and regulatory environment pillar (composed of nine variables) assesses the extent to which the national legal framework facilitates ICT penetration and the safe development of business activities, taking into account general features of the regulatory environment (including the protection afforded to property rights, the independence of the judiciary, and the efficiency of the law-making process) as well as more ICT-specific dimensions (the passing of laws related to ICTs and software piracy rates).
The business and innovation environment pillar (nine variables) gauges the quality of the business framework conditions to boost entrepreneurship, taking into account dimensions related to the ease of doing business (including the presence of red tape and excessive fiscal charges). This pillar also measures the presence of conditions that allow innovation to flourish by including variables on the overall availability of technology, the demand conditions for innovative products (as proxied by the development of government procurement of advanced technology products), the availability of venture capital for financing innovation-related projects, and the presence of a skilled labor force.
Readiness subindexThe readiness subindex, with a total of 12 variables, measures the degree to which a society is prepared to make good use of an affordable ICT infrastructure and digital content.
The infrastructure and digital content pillar (five variables) captures the development of ICT infrastructure (including mobile network coverage, international Internet bandwidth, secure Internet servers, and electricity production) as well as the accessibility of digital content.
The affordability pillar (three variables) assesses the cost of accessing ICTs, either via mobile telephony or fixed broadband Internet, as well as the level of competition in the Internet and telephony sectors that determine this cost.
The skills pillar (four variables) gauges the ability of a society to make effective use of ICTs thanks to the existence of basic educational skills captured by
the quality of the educational system, the level of adult literacy, and the rate of secondary education enrollment.
Usage subindexThe usage subindex assesses the individual efforts of the main social agents—that is, individuals, business, and government—to increase their capacity to use ICTs as well as their actual use in their day-to-day activities with other agents. It includes 16 variables.
The individual usage pillar (seven variables) measures ICT penetration and diffusion at the individual level, using indicators such as the number of mobile phone subscriptions, individuals using the Internet, households with a personal computer (PC), households with Internet access, both fixed and mobile broadband subscriptions, and the use of social networks.
The business usage pillar (six variables) captures the extent of business Internet use as well as the efforts of the firms in an economy to integrate ICTs into an internal, technology-savvy, innovation-conducive environment that generates productivity gains. Consequently, this pillar measures the firm’s technology absorption capacity as well as its overall capacity to innovate and the production of technology novelties measured by the number of Patent Cooperation Treaty (PCT) patent applications. It also measures the extent of staff training available, which indicates the extent to which management and employees are more capable of identifying and developing business innovations. New this year, we have split the e-commerce variable from previous editions to distinguish the business-to-business dimension from the business-to-consumer one, as some noticeable differences between the two dimensions exist in several countries.
The government usage pillar (three variables) provides insights into the importance that governments place on carrying out ICT policies for competitiveness and to enhance the well-being of their citizens, the efforts they make to implement their visions for ICT development, and the number of government services they provide online.
Impact subindexThe impact subindex gauges the broad economic and social impacts accruing from ICTs to boost competitiveness and well-being and that reflect the transformations toward an ICT- and technology-savvy economy and society. It includes a total of eight variables.
The economic impacts pillar (four variables) measures the effect of ICTs on competitiveness thanks to the generation of technological and non-technological innovations in the shape of patents, new products or processes, and organizational practices. In addition, it also measures the overall shift of an economy toward more knowledge-intensive activities.
@ 2013 World Economic Forum

Chapter 1.1: The Networked Readiness Index 2013
8 | The Global Information Technology Report 2013
The social impacts pillar (four variables) aims at assessing the ICT-driven improvements in well-being thanks to their impacts on the environment, education, energy consumption, health progress, or more-active civil participation. At the moment, because of data limitations, this pillar focuses on measuring the extent to which governments are becoming more efficient in the use of ICTs and providing increasing online services to their citizens, and thus improving their e-participation. It also assess the extent to which ICTs are present in education, as a proxy for the potential benefits that are associated with the use of ICTs in education.
In general, measuring the impacts of ICTs is a complex task, and the development of rigorous quantitative data to do so is still in its infancy. As a result, many of the dimensions where ICTs are producing important impacts—especially when these impacts are not translated into commercial activities, as is the case for the environment and for health—cannot be covered yet. Therefore this subindex should be regarded as a work in progress that will evolve to accommodate new data on many of these dimensions as they become available.
COMPUTATION METHODOLOGY AND DATAIn order to capture as comprehensively as possible all relevant dimensions of societies’ networked readiness, the NRI 2013 is composed of a mixture of quantitative and survey data, as shown in Figure 3.
Of the 54 variables composing the NRI this year, 27 are quantitative data, collected primarily by international
organizations such as International Telecommunication Union (ITU), the World Bank, and the United Nations. International sources ensure the validation and comparability of data across countries.
The remaining 27 variables capture aspects that are more qualitative in nature or for which internationally comparable quantitative data are not available for a large enough number of countries, but that nonetheless are crucial to fully measure national networked readiness. These data come from the Executive Opinion Survey (the Survey), which the Forum administers annually to over 15,000 business leaders in all economies included in the Report.4 The Survey represents a unique source of insight on many critical aspects related to the enabling environment, such as the effectiveness of law-making bodies and the intensity of local competition; to ICT readiness, such as the quality of the educational system and the accessibility of digital content; to ICT usage, such as capacity to innovate and the importance of government vision for ICTs; and to impact, such as the impact of ICTs on developing new products and services and improving access to basic services.
The NRI’s coverage every year is determined by the Survey coverage and data availability for indicators obtained from other sources, mostly international organizations. This year the Report includes 144 economies, two more than in the 2012 edition. Five new countries are included: Gabon, Guinea, Liberia, Seychelles, and Sierra Leone. Libya was re-included after a year of absence. Three previously covered countries had to be excluded from this year’s Report:
Figure 3: Breakdown of indicators used in the Networked Readiness Index 2013 by data source
TOTAL: 54 INDICATORS
INDICATORS FROM OTHER SOURCES27 INDICATORS
(50%)
EXECUTIVE OPINION SURVEY
27 INDICATORS(50%)
@ 2013 World Economic Forum

The Global Information Technology Report 2013 | 9
Chapter 1.1: The Networked Readiness Index 2013
Survey data could not be collected in Belize or Angola; in Syria, the political situation did not allow the Survey to be carried out. In the case of Tunisia, we decided not to report the results this year because an important structural break in the data makes comparisons with past years difficult. We hope to re-include these countries in the future.
More details on variables included in the Index and their computation can be found in Appendix A and in the Technical Notes and Sources section at the end of the Report.
THE CURRENT NETWORKED READINESS LANDSCAPE: INSIGHTS FROM THE NRI 2013This section provides an overview of the networked readiness landscape of the world as assessed by the NRI 2013. It It presents the results of the top 10 performers and selected countries by region, in the following order: Europe and the Commonwealth of Independent States, Asia and the Pacific, Latin America and the Caribbean, sub-Saharan Africa, and the Middle East and North Africa. Tables 1 through 5 report the 2013 rankings for the overall NRI, its four subindexes, and its ten pillars. In addition, the Country/Economy Profiles and Data Tables sections at the end of the Report present the detailed results for the 144 economies covered by the study and the 54 indicators composing the NRI. To complement the analysis of the results, Box 1 discusses the persisting new digital divide across and within regions as revealed by the NRI results, and Box 2 examines increasing returns to ICT, skills, and innovation investment and suggests that an investment threshold in these three areas may exist and that without reaching it, the return may be negligible. Finally, Appendix A of the present chapter details the structure of the NRI and describes the method of calculation.
TOP 10Two groups of economies dominate the top ranks of the NRI: Northern European economies and the so-called Asian Tigers. Among the Northern European countries, four of the five Nordic economies represented in the NRI—Finland, Sweden, Norway, and Denmark (in rank order)—continue to feature in the top 10. Iceland, the last of the Nordics, is not too far behind, at 17th place (see Table 1). The performance of this group in terms of readiness is particularly outstanding. All five Nordics feature in the top 10 of this subindex. Within this subindex, on the infrastructure and digital content pillar, four countries occupy the top positions. Overall, the four Nordic economies, the Netherlands, and the United Kingdom comprise no less than six Northern European countries among the top 10. As highlighted in the previous edition and elsewhere in this Report, the gap between those countries and the ones in the Southern and Eastern parts of Europe is profound. A
second group of economies that posts a remarkable performance is the Asian Tigers: Singapore, Taiwan (China), the Republic of Korea, and Hong Kong SAR. The latter, the lowest-ranked of the four, comes in at 14th place. All boast outstanding business and innovation environments that are consistently ranked among the most conducive in the world. The Tigers also stand out for their governments’ leadership in promoting the digital agenda, and the impact of ICTs on society tends to be larger in these economies.
Overtaking Singapore and neighboring Sweden, Finland (1st) reaches the top of the NRI rankings for the first time, thanks to improvements across the board. The country shows progress on two-thirds of the 54 indicators of the NRI and posts a very consistent performance across all categories of the NRI. Finland appears in the top three of each of the four subindexes and in the top 10 of nine of the 10 pillars, topping two (skills and economic impacts). Among the 144 economies, only Sweden achieves as impressive a level of excellence and consistency. Finland’s lowest rank among the 10 pillars is its 19th position in the affordability pillar, which can hardly be considered a weakness given that, among high-income countries, ICT services in Finland are among the most affordable (it comes in 5th, with Iceland and Sweden leading the category). As set out in the government’s Digital Agenda for 2011–2020, Finland has set in motion a virtuous digital circle offering exceptionally conducive institutional (3rd) and business (7th) environments, world-class infrastructure (2nd), and arguably one of the best educational systems in the world. As a result, ICTs are ubiquitous and penetration rates are among the highest globally. Ninety percent of households are equipped with a computer and 90 percent of the population use the Internet, mostly at broadband speeds. Finland is an innovation hub, boasting the world’s highest number of PCT applications per capita in the domain of ICTs, and the third highest when considering all domains. But the impact of ICTs extends well beyond innovation, permeating the entire economy and society. For instance, Finland ranks 1st on the indicator capturing the extent to which ICTs create new services and products.
Singapore remains 2nd overall, while slightly improving its score. The city-state ranks 1st in a record four pillars, while Finland leads only two. Singapore shows the way in the environment subindex, earning the top spot in both the political and regulatory environment pillar and the business and innovation environment pillar. The extreme efficiency and business friendliness of its institutional framework, strong intellectual property protection, intense competition, and high university enrollment rate lead to these outstanding outcomes. Singapore’s readiness (11th) is also world class, thanks to its excellent digital infrastructure (19th) and skill base (2nd). The affordability of ICTs (55th) is Singapore’s
@ 2013 World Economic Forum

Chapter 1.1: The Networked Readiness Index 2013
10 | The Global Information Technology Report 2013
only relative weakness. Within such a conducive environment, it is not surprising to see Singapore in 3rd position in terms of ICT usage. Among other things, the city boasts the world’s largest number of mobile broadband subscriptions per capita, above 100 percent. Furthermore, it leads the government usage pillar and outperforms the Nordics, including Finland. Within this pillar, Singapore achieves the maximum possible score on the UN’s Government Online Services Index. Finally, it ranks 1st on the indicator capturing the importance of ICTs for government and 4th in assessing the success of latter in promoting ICTs. In this context, it comes as no surprise that Singapore leads the impact subindex, appearing in the top 10 of each of the eight comprising indicators.
Sweden (3rd) maintains its score but declines two positions and abandons the top spot to Finland. Despite this slight decline in rank, the country undeniably remains one of the few truly knowledge-based economies of the world. Aside from Finland, Sweden is the only country to appear in the top 10 of nine pillars. Unlike its neighbor, however, it does not lead in any of them. But such remarkable consistency earns Sweden the top spot in the usage subindex, reflecting the impressive level of ICT adoption by businesses and the population at large. A conducive environment, associated with a high degree of readiness and widespread usage, largely contribute to Sweden’s innovation capacity. The country boasts the world’s highest number of PCT patent applications per capita, ahead of Switzerland and Finland. Amid such an outstanding assessment, a handful of indicators call for attention: the average corporate tax rate is fairly high—equivalent to 53 percent of profits (114th)—and two indicators point to somewhat lengthy administrative procedures.
The Netherlands climbs two ranks to 4th place, thanks to small gains on most of the indicators. Its performance is consistently strong judging by its presence in the top 10 of seven pillars. Like the top three economies discussed above, the Netherlands offers a very conducive environment, placing 6th in the regulatory and political environment pillar and 5th in the business and innovation pillar, even though red tape remains extensive. The country’s level of ICT readiness is also very high (13th), thanks to a strong skill base and world-class infrastructure, although it is somewhat undermined by lower marks in the affordability pillar (60th). The Netherlands earns excellent marks in terms of ICT usage (5th, up four). In particular, the country boasts the world’s 2nd highest fixed broadband Internet subscription rate, with 39 subscriptions per 100 population; moreover, 92 percent of the population use the Internet, the third-largest proportion. Ninety-four percent of households are equipped with a computer and have Internet access; on both these indicators, the Netherlands ranks 2nd worldwide. Amid these positive results, the country’s
5th rank in the government usage pillar comes as a disappointment. Finally, the Netherlands ranks 2nd in the impact subindex, just behind Singapore. In particular, it ranks in the top 10 of the indicator capturing the impact of ICTs on the creation of new business models (5th), on the offering of new products and services (8th), and on access to basic services (5th). The country also earns the maximum score in the UN’s E-Participation Index. The high share of knowledge-intensive jobs in the economy—almost 50 percent, the 3rd highest in the world—and the country’s capacity for innovation further contribute to its outstanding performance in the impact subindex.
Progressing two ranks, Norway enters the top five at 5th place. Overall, Norway’s performance is outstanding, as reflected in its 2nd and 3rd place, respectively, in the individual usage pillar (behind Denmark) and in the infrastructure and digital content pillar (behind Iceland and Finland). Yet, despite this strong performance, the country’s results are slightly less consistent than those observed in Finland and Sweden. Unlike its neighbors, it ranks in the top 10 of four pillars but does not lead any. Of particular concern is Norway’s performance on the skills category, where it places 27th—far below Finland, Iceland, and Sweden.
Despite improving its score slightly, Switzerland slips one notch to 6th overall. It features in the top 10 of seven pillars—the second highest total—and leads the business usage pillar. The cost of ICTs is by far the weakest aspect of the country’s performance, with Switzerland ranking a mediocre 68th in the affordability pillar. Despite full liberalization of ICT services, its average mobile cellular tariffs are among the highest in the world, even when accounting for differences in costs of living (120th). Another area of relative weakness is the lack of government efforts to promote ICTs. Switzerland ranks 31st in this category, far behind most of the Asian Tigers, the Gulf countries, and the Nordics. This stands at odds with the excellent results in the other two pillars of the usage subindex, namely the business usage pillar (1st) and the individual usage pillar (10th).
Up three notches, the United Kingdom (7th) posts the biggest rank improvement among the top 10 economies. The country offers one of the most conducive environments for ICT development, ranking 6th in this subindex. In particular, it offers a sound and conducive political and regulatory environment (7th). The country also boasts high levels of ICT adoption. ICTs are pervasive among the population, businesses, and the government. Yet in all these categories, it is almost systematically outperformed by the Nordics, the Asian Tigers, or both, signaling room for improvement. Finally, the country is among the best when it comes to ICT impacts, ranking 4th and 14th in terms of social and economic impacts, respectively. Most noticeably, the country ranks 1st for the role of ICTs in giving rise to new
@ 2013 World Economic Forum

The Global Information Technology Report 2012 | 11
1.1: The Networked Readiness Index 2013
Table 1: The Networked Readiness Index 2013
2012 rank Rank Country/Economy Score (out of 142) Group*
1 Finland 5.98 3 ADV 2 Singapore 5.96 2 ADV 3 Sweden 5.91 1 ADV 4 Netherlands 5.81 6 ADV 5 Norway 5.66 7 ADV 6 Switzerland 5.66 5 ADV 7 United Kingdom 5.64 10 ADV 8 Denmark 5.58 4 ADV 9 United States 5.57 8 ADV 10 Taiwan, China 5.47 11 ADV 11 Korea, Rep. 5.46 12 ADV 12 Canada 5.44 9 ADV 13 Germany 5.43 16 ADV 14 Hong Kong SAR 5.40 13 ADV 15 Israel 5.39 20 ADV 16 Luxembourg 5.37 21 ADV 17 Iceland 5.31 15 ADV 18 Australia 5.26 17 ADV 19 Austria 5.25 19 ADV 20 New Zealand 5.25 14 ADV 21 Japan 5.24 18 ADV 22 Estonia 5.12 24 ADV 23 Qatar 5.10 28 MENA 24 Belgium 5.10 22 ADV 25 United Arab Emirates 5.07 30 MENA 26 France 5.06 23 ADV 27 Ireland 5.05 25 ADV 28 Malta 4.90 26 ADV 29 Bahrain 4.83 27 MENA 30 Malaysia 4.82 29 DEVASIA 31 Saudi Arabia 4.82 34 MENA 32 Lithuania 4.72 31 CEE 33 Portugal 4.67 33 ADV 34 Chile 4.59 39 LATAM 35 Cyprus 4.59 32 ADV 36 Puerto Rico 4.55 36 ADV 37 Slovenia 4.53 37 ADV 38 Spain 4.51 38 ADV 39 Barbados 4.49 35 LATAM 40 Oman 4.48 40 MENA 41 Latvia 4.43 41 CEE 42 Czech Republic 4.38 42 ADV 43 Kazakhstan 4.32 55 CIS 44 Hungary 4.29 43 CEE 45 Turkey 4.22 52 CEE 46 Panama 4.22 57 LATAM 47 Jordan 4.20 47 MENA 48 Montenegro 4.20 46 CEE 49 Poland 4.19 49 CEE 50 Italy 4.18 48 ADV 51 Croatia 4.17 45 CEE 52 Uruguay 4.16 44 LATAM 53 Costa Rica 4.15 58 LATAM 54 Russian Federation 4.13 56 CIS 55 Mauritius 4.12 53 SSA 56 Azerbaijan 4.11 61 CIS 57 Brunei Darussalam 4.11 54 DEVASIA 58 China 4.03 51 DEVASIA 59 Mongolia 4.01 63 CIS 60 Brazil 3.97 65 LATAM 61 Slovak Republic 3.95 64 ADV 62 Kuwait 3.94 62 MENA 63 Mexico 3.93 76 LATAM 64 Greece 3.93 59 ADV 65 Georgia 3.93 88 CIS 66 Colombia 3.91 73 LATAM 67 Macedonia, FYR 3.89 66 CEE 68 India 3.88 69 DEVASIA 69 Sri Lanka 3.88 71 DEVASIA 70 South Africa 3.87 72 SSA 71 Bulgaria 3.87 70 CEE 72 Trinidad and Tobago 3.87 60 LATAM
2012 rank Rank Country/Economy Score (out of 142) Group*
73 Ukraine 3.87 75 CIS 74 Thailand 3.86 77 DEVASIA 75 Romania 3.86 67 CEE 76 Indonesia 3.84 80 DEVASIA 77 Moldova 3.84 78 CIS 78 Bosnia and Herzegovina 3.80 84 CEE 79 Seychelles 3.80 n/a SSA 80 Egypt 3.78 79 MENA 81 Cape Verde 3.78 81 SSA 82 Armenia 3.76 94 CIS 83 Albania 3.75 68 CEE 84 Vietnam 3.74 83 DEVASIA 85 Jamaica 3.74 74 LATAM 86 Philippines 3.73 86 DEVASIA 87 Serbia 3.70 85 CEE 88 Rwanda 3.68 82 SSA 89 Morocco 3.64 91 MENA 90 Dominican Republic 3.62 87 LATAM 91 Ecuador 3.58 96 LATAM 92 Kenya 3.54 93 SSA 93 El Salvador 3.53 103 LATAM 94 Lebanon 3.53 95 MENA 95 Ghana 3.51 97 SSA 96 Botswana 3.50 89 SSA 97 Liberia 3.48 n/a SSA 98 Gambia, The 3.47 101 SSA 99 Argentina 3.47 92 LATAM 100 Guyana 3.45 90 LATAM 101 Iran, Islamic Rep. 3.43 104 MENA 102 Guatemala 3.42 98 LATAM 103 Peru 3.39 106 LATAM 104 Paraguay 3.37 111 LATAM 105 Pakistan 3.35 102 DEVASIA 106 Cambodia 3.34 108 DEVASIA 107 Senegal 3.33 100 SSA 108 Venezuela 3.33 107 LATAM 109 Honduras 3.32 99 LATAM 110 Uganda 3.30 110 SSA 111 Namibia 3.29 105 SSA 112 Tajikistan 3.29 114 CIS 113 Nigeria 3.27 112 SSA 114 Bangladesh 3.22 113 DEVASIA 115 Zambia 3.19 109 SSA 116 Zimbabwe 3.17 124 SSA 117 Suriname 3.13 121 LATAM 118 Kyrgyz Republic 3.09 115 CIS 119 Bolivia 3.01 127 LATAM 120 Côte d’Ivoire 3.00 122 SSA 121 Gabon 2.97 n/a SSA 122 Mali 2.97 126 SSA 123 Benin 2.97 117 SSA 124 Cameroon 2.95 125 SSA 125 Nicaragua 2.93 131 LATAM 126 Nepal 2.93 128 DEVASIA 127 Tanzania 2.92 123 SSA 128 Ethiopia 2.85 130 SSA 129 Malawi 2.83 116 SSA 130 Burkina Faso 2.80 135 SSA 131 Algeria 2.78 118 MENA 132 Libya 2.77 n/a MENA 133 Mozambique 2.76 120 SSA 134 Timor-Leste 2.72 132 DEVASIA 135 Mauritania 2.71 139 MENA 136 Swaziland 2.69 136 SSA 137 Madagascar 2.69 134 SSA 138 Lesotho 2.68 133 SSA 139 Yemen 2.63 141 MENA 140 Guinea 2.61 n/a SSA 141 Haiti 2.58 142 LATAM 142 Chad 2.53 138 SSA 143 Sierra Leone 2.53 n/a SSA 144 Burundi 2.30 137 SSA
Note: Group classification follows the International Monetary Fund’s classification (situation as of October 2012).* Groups: ADV = Advanced economies; CEE = Central and Eastern Europe; CIS = Commonwealth of Independent States and Mongolia; DEVASIA = Developing Asia; LATAM = Latin America and
the Caribbean; MENA = Middle East and North Africa; SSA = Sub-Saharan Africa.
@ 2013 World Economic Forum

1.1: The Networked Readiness Index 2013
12 | The Global Information Technology Report 2012
Table 2: Environment subindex and pillars
ENVIRONMENT SUBINDEX
Rank Country/Economy Score Rank Score Rank Score
1 Singapore 5.89 1 5.97 1 5.80 2 New Zealand 5.65 2 5.92 6 5.38 3 Finland 5.59 3 5.84 7 5.34 4 Netherlands 5.53 6 5.67 5 5.40 5 Sweden 5.48 5 5.67 11 5.30 6 United Kingdom 5.48 7 5.62 8 5.33 7 Switzerland 5.46 8 5.60 9 5.32 8 Hong Kong SAR 5.44 15 5.27 2 5.61 9 Norway 5.42 9 5.52 10 5.31 10 Canada 5.42 12 5.36 3 5.47 11 Australia 5.29 10 5.39 21 5.19 12 Denmark 5.27 14 5.30 19 5.23 13 Luxembourg 5.25 4 5.77 34 4.73 14 Qatar 5.19 18 5.10 12 5.29 15 Ireland 5.17 16 5.24 24 5.10 16 United States 5.11 22 4.94 13 5.29 17 Belgium 5.09 23 4.94 18 5.23 18 Malaysia 5.07 24 4.88 16 5.25 19 United Arab Emirates 5.05 26 4.84 17 5.25 20 Germany 5.05 11 5.38 36 4.71 21 Iceland 5.02 25 4.88 22 5.15 22 Austria 4.99 17 5.21 31 4.78 23 Israel 4.97 28 4.69 15 5.26 24 Taiwan, China 4.97 33 4.51 4 5.44 25 Saudi Arabia 4.87 29 4.68 25 5.07 26 Japan 4.86 19 5.04 37 4.68 27 France 4.84 20 5.02 39 4.66 28 Bahrain 4.83 40 4.39 14 5.27 29 Rwanda 4.81 13 5.30 59 4.32 30 Chile 4.80 38 4.40 20 5.20 31 Estonia 4.71 27 4.84 45 4.59 32 Korea, Rep. 4.70 42 4.25 23 5.14 33 South Africa 4.69 21 5.00 55 4.38 34 Cyprus 4.67 41 4.35 26 4.99 35 Puerto Rico 4.65 35 4.46 30 4.83 36 Barbados 4.63 32 4.59 38 4.67 37 Oman 4.61 34 4.47 33 4.75 38 Portugal 4.57 43 4.24 27 4.91 39 Malta 4.53 31 4.59 50 4.47 40 Spain 4.49 44 4.14 29 4.85 41 Mauritius 4.48 36 4.42 46 4.53 42 Jordan 4.35 48 4.05 40 4.65 43 Latvia 4.33 52 4.02 42 4.65 44 Slovenia 4.33 61 3.81 28 4.85 45 Lithuania 4.31 51 4.02 44 4.60 46 Turkey 4.31 54 3.97 43 4.64 47 Hungary 4.23 49 4.04 51 4.42 48 Panama 4.22 69 3.69 32 4.76 49 Czech Republic 4.21 46 4.06 56 4.36 50 Uruguay 4.20 58 3.91 47 4.50 51 Liberia 4.17 53 4.01 58 4.34 52 Montenegro 4.16 72 3.67 41 4.65 53 Seychelles 4.14 50 4.03 63 4.25 54 Gambia, The 4.13 30 4.68 116 3.58 55 Poland 4.10 62 3.80 53 4.41 56 Botswana 4.10 39 4.40 103 3.80 57 Brunei Darussalam 4.09 45 4.11 77 4.07 58 Namibia 4.04 37 4.41 112 3.67 59 Macedonia, FYR 4.04 80 3.59 49 4.48 60 Thailand 4.00 81 3.59 52 4.42 61 Zambia 3.99 64 3.77 65 4.22 62 Slovak Republic 3.99 70 3.68 61 4.30 63 Sri Lanka 3.95 68 3.70 67 4.21 64 Ghana 3.95 57 3.92 84 3.99 65 Cape Verde 3.94 55 3.97 92 3.91 66 Kazakhstan 3.93 77 3.63 64 4.23 67 Jamaica 3.93 59 3.87 82 4.00 68 Bulgaria 3.91 101 3.31 48 4.50 69 Kuwait 3.90 71 3.67 71 4.13 70 Croatia 3.90 90 3.48 60 4.32 71 China 3.88 56 3.97 105 3.78 72 Iran, Islamic Rep. 3.86 67 3.70 80 4.03
ENVIRONMENT SUBINDEX
Rank Country/Economy Score Rank Score Rank Score
73 Georgia 3.86 100 3.34 54 4.39 74 Morocco 3.85 73 3.66 79 4.04 75 Mexico 3.85 79 3.60 74 4.09 76 Mongolia 3.84 93 3.41 62 4.28 77 Azerbaijan 3.84 66 3.72 86 3.96 78 Indonesia 3.83 82 3.57 73 4.10 79 Cambodia 3.83 65 3.75 91 3.92 80 Tajikistan 3.80 47 4.06 121 3.54 81 Guyana 3.79 84 3.55 81 4.02 82 Costa Rica 3.78 74 3.66 94 3.90 83 Italy 3.77 95 3.39 69 4.16 84 Albania 3.76 102 3.31 66 4.22 85 India 3.75 75 3.65 99 3.85 86 Lebanon 3.74 133 2.76 35 4.73 87 Greece 3.73 103 3.29 68 4.16 88 Uganda 3.71 60 3.83 115 3.59 89 Romania 3.70 106 3.25 70 4.14 90 Armenia 3.70 104 3.27 72 4.12 91 Peru 3.69 121 3.04 57 4.34 92 Bosnia and Herzegovina 3.68 97 3.36 83 3.99 93 Trinidad and Tobago 3.66 91 3.42 93 3.90 94 Nigeria 3.66 89 3.48 101 3.83 95 Dominican Republic 3.65 109 3.22 75 4.08 96 Colombia 3.64 92 3.41 95 3.87 97 Vietnam 3.63 85 3.51 108 3.75 98 Kenya 3.63 87 3.49 106 3.76 99 Egypt 3.62 96 3.39 98 3.85 100 Philippines 3.60 98 3.36 100 3.84 101 Senegal 3.60 114 3.11 76 4.08 102 Russian Federation 3.58 108 3.24 90 3.92 103 Malawi 3.58 63 3.80 131 3.36 104 Ethiopia 3.55 83 3.56 119 3.55 105 Ukraine 3.54 124 3.01 78 4.07 106 Serbia 3.54 115 3.10 85 3.98 107 Brazil 3.53 78 3.63 126 3.42 108 Tanzania 3.52 76 3.65 128 3.38 109 Moldova 3.52 117 3.09 88 3.94 110 Burkina Faso 3.49 88 3.49 122 3.49 111 Mali 3.47 99 3.35 114 3.59 112 Honduras 3.47 111 3.21 109 3.72 113 Ecuador 3.46 118 3.07 96 3.86 114 Sierra Leone 3.44 86 3.50 127 3.39 115 Benin 3.44 94 3.41 123 3.47 116 Pakistan 3.42 123 3.03 102 3.81 117 El Salvador 3.41 129 2.86 87 3.95 118 Guatemala 3.39 127 2.92 97 3.85 119 Cameroon 3.36 126 2.97 107 3.75 120 Mozambique 3.36 105 3.26 124 3.45 121 Lesotho 3.32 116 3.09 118 3.55 122 Nepal 3.31 119 3.05 117 3.57 123 Gabon 3.31 107 3.25 129 3.37 124 Paraguay 3.29 138 2.65 89 3.93 125 Madagascar 3.26 134 2.73 104 3.79 126 Argentina 3.25 131 2.82 110 3.68 127 Côte d’Ivoire 3.23 128 2.87 113 3.60 128 Bangladesh 3.19 137 2.71 111 3.68 129 Bolivia 3.19 110 3.22 137 3.17 130 Libya 3.18 130 2.83 120 3.54 131 Timor-Leste 3.18 125 3.00 130 3.36 132 Zimbabwe 3.13 120 3.05 135 3.22 133 Swaziland 3.12 112 3.21 138 3.03 134 Nicaragua 3.11 122 3.03 136 3.18 135 Suriname 3.08 135 2.73 125 3.43 136 Mauritania 3.07 113 3.18 140 2.95 137 Kyrgyz Republic 3.02 136 2.72 132 3.32 138 Yemen 2.91 140 2.51 133 3.30 139 Guinea 2.84 132 2.77 141 2.91 140 Venezuela 2.83 142 2.43 134 3.22 141 Haiti 2.65 143 2.40 142 2.89 142 Burundi 2.63 144 2.30 139 2.96 143 Algeria 2.60 141 2.46 143 2.74 144 Chad 2.59 139 2.59 144 2.58
Political and Business and regulatory innovation environment environment
Political and Business and regulatory innovation environment environment
@ 2013 World Economic Forum

The Global Information Technology Report 2012 | 13
1.1: The Networked Readiness Index 2013
Table 3: Readiness subindex and pillars
READINESS SUBINDEX
Rank Country/Economy Score Rank Score Rank Score Rank Score
1 Finland 6.51 2 6.87 19 6.22 1 6.45 2 Iceland 6.43 1 6.87 5 6.55 9 5.87 3 Sweden 6.38 4 6.83 7 6.48 10 5.84 4 United States 6.25 7 6.80 15 6.31 20 5.62 5 Canada 6.17 5 6.81 43 5.69 6 6.02 6 Norway 6.15 3 6.84 23 6.09 27 5.52 7 Denmark 6.04 14 6.40 22 6.09 18 5.63 8 Switzerland 6.02 8 6.71 68 5.25 4 6.10 9 Austria 6.01 9 6.60 37 5.89 24 5.55 10 United Kingdom 5.99 13 6.42 35 5.90 15 5.66 11 Singapore 5.96 19 6.20 55 5.50 2 6.18 12 Cyprus 5.92 21 6.08 28 6.02 16 5.66 13 Netherlands 5.92 11 6.48 60 5.39 8 5.89 14 Germany 5.88 10 6.50 53 5.52 19 5.62 15 Belgium 5.84 18 6.20 70 5.20 3 6.11 16 Ireland 5.80 16 6.24 61 5.38 12 5.78 17 Taiwan, China 5.80 22 5.99 54 5.50 7 5.91 18 Luxembourg 5.79 12 6.43 48 5.61 33 5.33 19 Hong Kong SAR 5.70 27 5.78 17 6.28 52 5.05 20 Lithuania 5.67 33 5.23 14 6.32 29 5.46 21 Malta 5.65 15 6.26 72 5.15 26 5.53 22 Israel 5.59 29 5.73 44 5.66 32 5.37 23 Korea, Rep. 5.56 20 6.13 83 4.88 14 5.67 24 Estonia 5.55 26 5.79 56 5.44 30 5.43 25 Australia 5.51 6 6.81 97 4.07 17 5.64 26 France 5.40 28 5.76 86 4.84 21 5.59 27 Latvia 5.38 41 4.83 16 6.30 54 5.01 28 Japan 5.36 24 5.84 92 4.50 13 5.73 29 Ukraine 5.34 74 3.85 2 6.88 35 5.30 30 New Zealand 5.33 17 6.22 100 3.96 11 5.81 31 Slovenia 5.33 25 5.82 85 4.86 36 5.30 32 Russian Federation 5.29 43 4.72 18 6.23 61 4.91 33 Costa Rica 5.28 76 3.77 6 6.52 23 5.56 34 Portugal 5.27 34 5.23 57 5.44 48 5.14 35 Bahrain 5.27 39 4.97 46 5.64 44 5.20 36 Turkey 5.27 48 4.56 4 6.59 81 4.65 37 Poland 5.26 38 5.00 47 5.63 47 5.15 38 Italy 5.25 40 4.94 49 5.61 45 5.18 39 Saudi Arabia 5.23 36 5.07 65 5.35 37 5.29 40 United Arab Emirates 5.23 30 5.46 89 4.70 25 5.54 41 Croatia 5.14 57 4.28 26 6.03 51 5.09 42 Mongolia 5.13 60 4.18 10 6.43 72 4.78 43 Bosnia and Herzegovina 5.08 64 4.13 31 5.99 49 5.11 44 Qatar 5.06 35 5.22 103 3.92 5 6.04 45 Trinidad and Tobago 5.02 53 4.41 58 5.40 39 5.25 46 Moldova 5.02 55 4.31 25 6.06 78 4.69 47 Greece 5.00 46 4.62 73 5.13 41 5.25 48 Georgia 4.99 68 4.03 11 6.39 83 4.56 49 Chile 4.99 61 4.18 33 5.94 66 4.85 50 Kazakhstan 4.98 63 4.14 36 5.90 62 4.91 51 Azerbaijan 4.98 75 3.82 20 6.16 57 4.96 52 Romania 4.98 47 4.62 62 5.36 58 4.95 53 Czech Republic 4.97 23 5.85 99 3.97 50 5.10 54 Mauritius 4.97 77 3.73 12 6.36 67 4.82 55 Jordan 4.97 81 3.55 27 6.03 34 5.33 56 Oman 4.92 66 4.05 34 5.90 68 4.81 57 Malaysia 4.87 73 3.85 50 5.58 43 5.20 58 Kuwait 4.87 45 4.64 71 5.18 71 4.79 59 Hungary 4.87 58 4.25 74 5.10 42 5.24 60 Panama 4.86 51 4.42 32 5.99 99 4.17 61 Spain 4.85 31 5.43 102 3.93 46 5.18 62 Montenegro 4.82 42 4.79 93 4.42 40 5.25 63 Thailand 4.78 71 3.95 45 5.64 76 4.75 64 Sri Lanka 4.78 101 3.05 29 6.02 38 5.26 65 Barbados 4.76 32 5.25 111 3.48 22 5.56 66 China 4.76 83 3.46 40 5.82 53 5.01 67 Serbia 4.71 54 4.39 84 4.87 65 4.86 68 India 4.70 111 2.80 1 7.00 95 4.31 69 Puerto Rico 4.70 52 4.42 n/a n/a 55 4.97 70 Uruguay 4.66 49 4.50 80 4.94 85 4.53 71 Indonesia 4.66 89 3.26 39 5.82 63 4.88 72 Albania 4.62 79 3.60 66 5.29 56 4.96
READINESS SUBINDEX
Rank Country/Economy Score Rank Score Rank Score Rank Score
73 Armenia 4.60 72 3.88 77 4.97 59 4.94 74 Brazil 4.53 62 4.16 76 5.01 91 4.42 75 Bulgaria 4.53 37 5.03 106 3.76 70 4.79 76 Mexico 4.47 82 3.53 63 5.36 87 4.51 77 Jamaica 4.46 65 4.10 87 4.81 88 4.48 78 Paraguay 4.44 67 4.04 52 5.53 107 3.74 79 Vietnam 4.43 114 2.76 38 5.86 79 4.68 80 Colombia 4.41 96 3.18 67 5.29 74 4.77 81 Venezuela 4.41 85 3.42 51 5.55 96 4.26 82 Egypt 4.41 93 3.19 8 6.47 115 3.56 83 Cape Verde 4.40 103 3.04 42 5.72 90 4.43 84 Macedonia, FYR 4.36 69 3.99 94 4.40 77 4.70 85 Philippines 4.36 84 3.42 82 4.89 73 4.77 86 Lebanon 4.29 88 3.27 95 4.12 28 5.49 87 Zimbabwe 4.28 129 2.18 9 6.47 98 4.18 88 Morocco 4.28 95 3.18 30 6.02 114 3.63 89 Ecuador 4.26 78 3.71 91 4.54 84 4.54 90 El Salvador 4.16 92 3.20 41 5.72 117 3.55 91 Bangladesh 4.14 109 2.84 13 6.34 128 3.24 92 Slovak Republic 4.12 56 4.29 113 3.32 75 4.75 93 Pakistan 4.11 104 3.00 21 6.15 129 3.19 94 Brunei Darussalam 4.06 50 4.47 135 2.33 31 5.38 95 South Africa 4.04 59 4.21 104 3.91 102 4.01 96 Algeria 4.00 119 2.62 64 5.35 101 4.02 97 Argentina 3.98 70 3.99 114 3.29 80 4.66 98 Dominican Republic 3.94 98 3.08 79 4.94 105 3.79 99 Liberia 3.93 142 1.57 3 6.78 122 3.42 100 Suriname 3.92 118 2.66 90 4.64 89 4.46 101 Ghana 3.89 121 2.51 59 5.40 106 3.77 102 Honduras 3.86 107 2.88 78 4.96 108 3.72 103 Kyrgyz Republic 3.78 90 3.26 107 3.67 92 4.40 104 Uganda 3.76 106 2.88 75 5.07 125 3.33 105 Guyana 3.75 94 3.19 110 3.50 82 4.56 106 Seychelles 3.73 44 4.67 139 1.61 60 4.92 107 Botswana 3.72 100 3.06 109 3.57 86 4.52 108 Guatemala 3.72 116 2.69 81 4.92 118 3.53 109 Iran, Islamic Rep. 3.69 97 3.13 115 3.13 69 4.79 110 Kenya 3.68 110 2.84 105 3.81 93 4.39 111 Cambodia 3.49 87 3.31 112 3.47 109 3.68 112 Nepal 3.33 140 1.62 69 5.20 131 3.17 113 Haiti 3.33 144 1.53 24 6.09 143 2.37 114 Gabon 3.33 125 2.32 96 4.11 116 3.55 115 Namibia 3.27 102 3.04 117 3.09 111 3.67 116 Rwanda 3.25 105 2.98 116 3.12 113 3.64 117 Yemen 3.24 123 2.43 88 4.75 138 2.54 118 Tajikistan 3.22 126 2.30 131 2.49 64 4.86 119 Peru 3.08 86 3.31 138 1.86 100 4.07 120 Senegal 3.07 108 2.86 118 3.07 126 3.30 121 Nicaragua 3.07 91 3.25 136 2.31 112 3.64 122 Côte d’Ivoire 3.07 99 3.07 119 2.96 130 3.17 123 Nigeria 3.02 115 2.70 120 2.96 123 3.40 124 Bolivia 3.01 138 1.74 122 2.89 94 4.39 125 Gambia, The 3.00 117 2.68 124 2.81 120 3.50 126 Libya 2.91 80 3.56 141 1.00 97 4.18 127 Chad 2.90 127 2.22 98 4.06 141 2.43 128 Benin 2.85 113 2.79 133 2.39 124 3.39 129 Zambia 2.85 133 2.02 127 2.69 104 3.84 130 Swaziland 2.84 112 2.80 137 2.03 110 3.68 131 Cameroon 2.80 137 1.75 125 2.79 103 3.87 132 Guinea 2.80 132 2.10 108 3.58 135 2.73 133 Mauritania 2.80 134 1.95 101 3.94 139 2.50 134 Timor-Leste 2.71 122 2.48 123 2.82 133 2.82 135 Tanzania 2.70 124 2.36 130 2.58 132 3.16 136 Lesotho 2.68 130 2.16 134 2.35 119 3.53 137 Madagascar 2.57 143 1.56 121 2.90 127 3.26 138 Burundi 2.50 128 2.20 n/a n/a 134 2.79 139 Malawi 2.41 120 2.58 140 1.17 121 3.47 140 Ethiopia 2.34 141 1.62 126 2.78 137 2.61 141 Mali 2.32 139 1.65 128 2.67 136 2.63 142 Burkina Faso 2.27 136 1.79 129 2.59 142 2.43 143 Mozambique 2.22 135 1.81 132 2.42 140 2.44 144 Sierra Leone 1.74 131 2.11 141 1.00 144 2.10
Infrastructure and digital content Affordability Skills
Infrastructure and digital content Affordability Skills
@ 2013 World Economic Forum

1.1: The Networked Readiness Index 2013
14 | The Global Information Technology Report 2012
Table 4: Usage subindex and pillars
USAGE SUBINDEX
Rank Country/Economy Score Rank Score Rank Score Rank Score
1 Sweden 6.00 3 6.53 4 5.89 8 5.56 2 Finland 5.97 6 6.40 3 5.97 10 5.55 3 Singapore 5.86 11 6.13 14 5.18 1 6.29 4 Korea, Rep. 5.86 7 6.39 11 5.31 3 5.89 5 Netherlands 5.78 5 6.42 8 5.53 15 5.39 6 Denmark 5.75 1 6.65 7 5.56 24 5.05 7 Norway 5.75 2 6.62 12 5.23 14 5.39 8 Switzerland 5.70 10 6.15 1 6.11 31 4.86 9 Japan 5.62 13 5.88 2 6.01 27 4.98 10 Luxembourg 5.62 4 6.47 16 4.97 13 5.41 11 United Kingdom 5.59 9 6.17 15 5.05 9 5.55 12 Germany 5.57 14 5.88 5 5.81 26 5.01 13 United States 5.51 18 5.66 10 5.37 11 5.49 14 Israel 5.45 28 5.43 6 5.67 20 5.23 15 Taiwan, China 5.45 20 5.66 13 5.19 12 5.49 16 Qatar 5.35 16 5.82 27 4.47 5 5.75 17 Austria 5.23 19 5.66 9 5.39 35 4.65 18 Australia 5.22 15 5.88 25 4.54 19 5.25 19 New Zealand 5.20 17 5.78 23 4.54 18 5.29 20 Hong Kong SAR 5.18 12 5.91 19 4.77 30 4.87 21 Iceland 5.15 8 6.35 20 4.77 50 4.32 22 France 5.13 24 5.52 18 4.86 25 5.02 23 United Arab Emirates 5.07 36 4.90 28 4.31 2 5.99 24 Canada 5.04 27 5.44 24 4.54 22 5.14 25 Estonia 5.01 23 5.53 29 4.13 17 5.36 26 Belgium 4.97 25 5.48 17 4.94 41 4.48 27 Malta 4.92 22 5.59 38 3.81 16 5.37 28 Ireland 4.87 21 5.59 22 4.58 43 4.44 29 Malaysia 4.83 46 4.44 26 4.49 7 5.57 30 Bahrain 4.83 30 5.13 56 3.59 4 5.78 31 Saudi Arabia 4.74 47 4.39 30 4.10 6 5.73 32 Portugal 4.50 41 4.71 36 3.86 28 4.93 33 Spain 4.46 31 5.12 41 3.80 42 4.46 34 Barbados 4.44 26 5.48 43 3.72 64 4.13 35 Slovenia 4.43 32 5.06 32 3.94 52 4.30 36 Lithuania 4.41 37 4.86 42 3.75 36 4.60 37 Oman 4.36 50 4.31 52 3.62 21 5.14 38 Czech Republic 4.35 29 5.18 31 4.08 93 3.79 39 Puerto Rico 4.31 59 3.94 21 4.59 46 4.40 40 Chile 4.24 53 4.12 44 3.71 29 4.90 41 Brunei Darussalam 4.21 49 4.32 59 3.56 33 4.75 42 Kazakhstan 4.18 54 4.06 85 3.34 23 5.13 43 Latvia 4.16 38 4.84 51 3.64 75 3.99 44 Brazil 4.08 58 3.97 34 3.90 48 4.38 45 Italy 4.08 34 4.93 46 3.68 108 3.62 46 Hungary 4.07 42 4.67 61 3.50 69 4.03 47 Croatia 4.06 39 4.83 81 3.36 73 3.99 48 Cyprus 4.05 44 4.52 60 3.51 65 4.13 49 Slovak Republic 4.04 35 4.92 65 3.47 100 3.71 50 Poland 4.01 33 5.00 74 3.41 107 3.62 51 Panama 4.00 65 3.59 39 3.81 37 4.60 52 Azerbaijan 3.99 64 3.68 58 3.57 34 4.71 53 Montenegro 3.95 56 4.01 71 3.43 47 4.39 54 Uruguay 3.94 51 4.17 72 3.43 55 4.22 55 Kuwait 3.94 40 4.83 83 3.35 105 3.63 56 Russian Federation 3.91 45 4.51 95 3.24 74 3.99 57 Seychelles 3.85 62 3.76 64 3.48 51 4.31 58 China 3.80 83 2.96 35 3.86 38 4.58 59 Costa Rica 3.79 71 3.37 37 3.84 61 4.17 60 Jordan 3.79 66 3.55 55 3.59 56 4.22 61 Macedonia, FYR 3.78 52 4.13 123 2.94 54 4.27 62 Turkey 3.78 68 3.51 48 3.65 60 4.18 63 Bulgaria 3.75 48 4.32 101 3.18 98 3.74 64 Colombia 3.75 76 3.09 77 3.39 32 4.77 65 Mauritius 3.71 70 3.38 73 3.42 49 4.34 66 Mexico 3.68 82 2.98 62 3.50 39 4.55 67 Trinidad and Tobago 3.67 61 3.77 97 3.23 70 4.01 68 Greece 3.66 43 4.53 107 3.11 118 3.34 69 Romania 3.66 57 3.97 94 3.24 96 3.76 70 Indonesia 3.58 92 2.74 40 3.81 58 4.20 71 Morocco 3.55 67 3.54 99 3.20 81 3.92 72 South Africa 3.53 81 2.99 33 3.91 102 3.70
USAGE SUBINDEX
Rank Country/Economy Score Rank Score Rank Score Rank Score
73 Vietnam 3.52 78 3.08 88 3.30 62 4.16 74 Argentina 3.51 60 3.92 90 3.28 117 3.35 75 Egypt 3.49 69 3.43 108 3.11 80 3.92 76 Philippines 3.46 95 2.69 47 3.65 67 4.04 77 Georgia 3.46 75 3.16 112 3.07 63 4.14 78 Serbia 3.45 55 4.01 135 2.70 104 3.64 79 Armenia 3.44 77 3.08 89 3.30 78 3.94 80 Mongolia 3.41 90 2.79 78 3.39 66 4.06 81 India 3.41 121 1.97 45 3.70 40 4.55 82 Moldova 3.39 72 3.36 129 2.86 76 3.97 83 Thailand 3.39 88 2.84 63 3.50 86 3.84 84 Kenya 3.38 115 2.08 53 3.62 44 4.43 85 Albania 3.37 84 2.93 79 3.38 95 3.79 86 Dominican Republic 3.36 93 2.73 82 3.36 72 3.99 87 Bosnia and Herzegovina 3.34 73 3.32 104 3.15 111 3.55 88 Ecuador 3.33 85 2.92 92 3.27 94 3.79 89 Jamaica 3.32 86 2.89 86 3.32 97 3.76 90 Sri Lanka 3.32 110 2.19 57 3.57 57 4.20 91 Peru 3.32 87 2.89 93 3.26 90 3.81 92 Gambia, The 3.32 118 2.03 50 3.64 53 4.28 93 Guatemala 3.28 96 2.67 49 3.65 114 3.51 94 El Salvador 3.27 91 2.79 100 3.20 88 3.83 95 Ukraine 3.27 74 3.17 84 3.35 121 3.28 96 Cape Verde 3.25 103 2.37 122 2.96 45 4.41 97 Guyana 3.24 106 2.25 54 3.60 85 3.87 98 Lebanon 3.21 63 3.70 116 3.02 134 2.90 99 Botswana 3.20 98 2.57 96 3.23 91 3.80 100 Senegal 3.16 113 2.09 66 3.47 82 3.91 101 Namibia 3.12 99 2.53 76 3.40 116 3.43 102 Ghana 3.12 102 2.40 103 3.15 89 3.81 103 Tajikistan 3.12 107 2.20 87 3.32 87 3.83 104 Cambodia 3.09 112 2.14 70 3.44 103 3.69 105 Venezuela 3.07 80 3.02 120 2.97 126 3.21 106 Iran, Islamic Rep. 3.06 108 2.20 119 2.99 71 4.00 107 Rwanda 3.05 139 1.50 67 3.46 59 4.20 108 Nigeria 3.04 111 2.16 68 3.45 113 3.52 109 Zambia 3.04 122 1.84 80 3.36 79 3.92 110 Paraguay 3.01 97 2.66 110 3.09 123 3.27 111 Honduras 3.01 101 2.45 75 3.40 127 3.17 112 Suriname 2.97 79 3.07 113 3.06 138 2.78 113 Bolivia 2.96 104 2.34 109 3.09 115 3.45 114 Liberia 2.93 126 1.74 69 3.45 109 3.59 115 Mali 2.93 125 1.76 114 3.06 77 3.96 116 Côte d’Ivoire 2.92 117 2.07 105 3.14 112 3.54 117 Uganda 2.89 131 1.65 106 3.13 84 3.90 118 Pakistan 2.89 123 1.83 91 3.27 110 3.56 119 Cameroon 2.86 130 1.65 98 3.21 101 3.71 120 Tanzania 2.86 127 1.68 102 3.16 99 3.73 121 Bangladesh 2.83 128 1.65 132 2.81 68 4.03 122 Gabon 2.83 105 2.34 130 2.85 120 3.30 123 Kyrgyz Republic 2.81 94 2.70 138 2.65 130 3.08 124 Nicaragua 2.76 120 1.98 111 3.07 125 3.21 125 Zimbabwe 2.72 114 2.09 115 3.03 132 3.05 126 Burkina Faso 2.71 140 1.49 131 2.83 92 3.80 127 Benin 2.70 109 2.19 117 3.01 135 2.90 128 Mozambique 2.66 141 1.45 125 2.90 106 3.62 129 Libya 2.65 89 2.80 136 2.69 143 2.44 130 Ethiopia 2.62 143 1.34 140 2.62 83 3.91 131 Malawi 2.60 136 1.56 121 2.97 122 3.27 132 Mauritania 2.58 116 2.08 126 2.88 137 2.79 133 Madagascar 2.55 132 1.60 118 3.00 131 3.05 134 Nepal 2.54 137 1.54 127 2.87 124 3.21 135 Lesotho 2.52 129 1.65 133 2.79 128 3.12 136 Timor-Leste 2.51 124 1.80 139 2.63 129 3.11 137 Sierra Leone 2.50 133 1.59 141 2.59 119 3.33 138 Swaziland 2.49 119 1.98 124 2.90 140 2.58 139 Guinea 2.47 138 1.53 128 2.86 133 3.02 140 Algeria 2.42 100 2.46 144 2.15 139 2.65 141 Chad 2.34 142 1.35 134 2.79 136 2.89 142 Yemen 2.27 135 1.57 137 2.68 141 2.56 143 Haiti 2.17 134 1.58 142 2.56 144 2.36 144 Burundi 2.04 144 1.33 143 2.31 142 2.47
Individual Business Governent usage usage usage
Individual Business Governent usage usage usage
@ 2013 World Economic Forum

The Global Information Technology Report 2012 | 15
1.1: The Networked Readiness Index 2013
Table 5: Impact subindex and pillars
IMPACT SUBINDEX
Rank Country/Economy Score Rank Score Rank Score
1 Singapore 6.13 2 5.98 1 6.28 2 Netherlands 6.00 4 5.93 3 6.08 3 Finland 5.86 1 5.99 9 5.74 4 Sweden 5.77 3 5.93 10 5.62 5 Korea, Rep. 5.71 12 5.24 2 6.19 6 Taiwan, China 5.65 7 5.49 6 5.82 7 Israel 5.54 6 5.63 14 5.45 8 United Kingdom 5.48 14 5.09 4 5.86 9 Switzerland 5.44 5 5.80 24 5.08 10 United States 5.43 11 5.32 11 5.55 11 Norway 5.32 13 5.17 13 5.47 12 Hong Kong SAR 5.28 15 5.03 12 5.54 13 Denmark 5.25 9 5.33 19 5.18 14 Germany 5.22 10 5.32 22 5.12 15 Estonia 5.19 23 4.55 5 5.83 16 Canada 5.14 16 4.93 17 5.35 17 Japan 5.12 8 5.36 31 4.88 18 Australia 5.01 20 4.61 15 5.41 19 United Arab Emirates 4.94 28 4.13 7 5.75 20 France 4.86 17 4.92 32 4.79 21 Luxembourg 4.81 25 4.47 20 5.15 22 New Zealand 4.81 26 4.47 21 5.15 23 Qatar 4.80 33 3.85 8 5.75 24 Austria 4.76 22 4.57 29 4.95 25 Iceland 4.65 24 4.54 33 4.76 26 Puerto Rico 4.56 21 4.58 37 4.53 27 Malaysia 4.52 29 4.02 25 5.02 28 Belgium 4.51 19 4.67 41 4.34 29 Malta 4.50 31 4.00 26 5.01 30 Lithuania 4.49 30 4.01 28 4.96 31 Saudi Arabia 4.43 42 3.64 18 5.22 32 Bahrain 4.39 52 3.39 16 5.38 33 Ireland 4.36 18 4.77 56 3.96 34 Chile 4.35 35 3.73 27 4.97 35 Portugal 4.32 36 3.70 30 4.94 36 Spain 4.22 32 3.86 36 4.58 37 Kazakhstan 4.18 66 3.28 23 5.09 38 Barbados 4.13 27 4.24 52 4.03 39 Brunei Darussalam 4.07 48 3.43 35 4.71 40 Slovenia 4.05 34 3.82 46 4.27 41 Oman 4.04 61 3.34 34 4.75 42 Hungary 4.00 41 3.66 40 4.35 43 Czech Republic 3.97 40 3.66 44 4.28 44 Montenegro 3.87 39 3.67 49 4.08 45 Latvia 3.87 38 3.68 51 4.06 46 Uruguay 3.83 53 3.39 45 4.27 47 Colombia 3.83 70 3.24 38 4.42 48 Panama 3.80 73 3.22 39 4.38 49 Costa Rica 3.75 46 3.50 53 3.99 50 Brazil 3.74 50 3.40 48 4.08 51 Cyprus 3.73 45 3.50 55 3.97 52 Mexico 3.72 72 3.23 47 4.22 53 Russian Federation 3.72 54 3.38 50 4.06 54 Jordan 3.70 49 3.42 54 3.98 55 China 3.69 83 3.08 42 4.29 56 India 3.67 43 3.63 73 3.71 57 Slovak Republic 3.67 44 3.54 66 3.80 58 Mongolia 3.65 86 3.02 43 4.29 59 Azerbaijan 3.65 59 3.35 57 3.94 60 Italy 3.63 37 3.69 80 3.57 61 Rwanda 3.62 58 3.35 61 3.88 62 Egypt 3.60 67 3.28 58 3.93 63 Croatia 3.59 55 3.38 68 3.79 64 Turkey 3.54 68 3.26 63 3.82 65 Cape Verde 3.53 76 3.20 62 3.86 66 Dominican Republic 3.53 79 3.16 59 3.89 67 Senegal 3.51 60 3.35 75 3.67 68 Philippines 3.50 56 3.37 76 3.62 69 Seychelles 3.49 78 3.19 69 3.78 70 Sri Lanka 3.47 62 3.33 77 3.62 71 Kenya 3.47 47 3.46 84 3.47 72 Peru 3.45 77 3.20 74 3.70
IMPACT SUBINDEX
Rank Country/Economy Score Rank Score Rank Score
73 Gambia, The 3.44 63 3.31 79 3.57 74 Moldova 3.43 84 3.05 65 3.80 75 Vietnam 3.39 89 2.97 64 3.81 76 Georgia 3.39 97 2.90 60 3.88 77 Poland 3.38 64 3.31 86 3.45 78 Macedonia, FYR 3.36 92 2.96 70 3.77 79 Nigeria 3.34 65 3.28 88 3.40 80 Mauritius 3.33 82 3.10 78 3.57 81 Ukraine 3.32 74 3.21 87 3.43 82 Greece 3.31 80 3.12 83 3.51 83 Armenia 3.31 69 3.26 90 3.37 84 Guatemala 3.31 57 3.36 100 3.26 85 El Salvador 3.30 103 2.85 71 3.76 86 Indonesia 3.30 101 2.85 72 3.74 87 Bulgaria 3.30 75 3.20 89 3.39 88 Thailand 3.28 108 2.77 67 3.79 89 Albania 3.26 88 2.99 81 3.54 90 Ecuador 3.25 90 2.97 82 3.52 91 Jamaica 3.23 81 3.10 92 3.36 92 South Africa 3.23 51 3.40 112 3.05 93 Mali 3.17 71 3.23 108 3.11 94 Argentina 3.14 91 2.96 96 3.32 95 Trinidad and Tobago 3.12 100 2.87 91 3.37 96 Bosnia and Herzegovina 3.12 96 2.90 95 3.33 97 Romania 3.12 94 2.92 97 3.31 98 Serbia 3.09 105 2.83 93 3.36 99 Iran, Islamic Rep. 3.09 106 2.82 94 3.36 100 Ghana 3.08 85 3.04 107 3.11 101 Kuwait 3.04 125 2.60 85 3.47 102 Tajikistan 3.03 111 2.75 98 3.31 103 Guyana 3.02 107 2.80 102 3.24 104 Venezuela 3.01 95 2.91 106 3.11 105 Botswana 2.97 114 2.73 103 3.21 106 Pakistan 2.97 99 2.88 113 3.05 107 Cambodia 2.94 124 2.62 101 3.26 108 Honduras 2.94 98 2.89 114 2.99 109 Liberia 2.91 110 2.75 109 3.08 110 Ethiopia 2.90 127 2.53 99 3.27 111 Morocco 2.89 122 2.65 105 3.13 112 Zambia 2.89 115 2.71 110 3.07 113 Benin 2.88 87 3.01 123 2.75 114 Bolivia 2.88 123 2.62 104 3.14 115 Uganda 2.86 121 2.65 111 3.07 116 Lebanon 2.86 102 2.85 120 2.86 117 Mozambique 2.82 116 2.71 117 2.93 118 Nicaragua 2.80 120 2.67 116 2.93 119 Cameroon 2.78 104 2.84 126 2.72 120 Côte d’Ivoire 2.77 93 2.93 129 2.61 121 Paraguay 2.75 109 2.76 122 2.75 122 Namibia 2.75 117 2.70 121 2.80 123 Kyrgyz Republic 2.75 126 2.56 115 2.93 124 Malawi 2.73 112 2.74 127 2.71 125 Burkina Faso 2.72 118 2.70 124 2.74 126 Bangladesh 2.71 128 2.52 118 2.90 127 Tanzania 2.61 136 2.34 119 2.89 128 Zimbabwe 2.55 119 2.68 132 2.42 129 Nepal 2.54 135 2.36 125 2.73 130 Suriname 2.53 113 2.74 137 2.33 131 Timor-Leste 2.50 132 2.38 128 2.61 132 Gabon 2.42 129 2.44 133 2.41 133 Sierra Leone 2.42 133 2.37 131 2.46 134 Mauritania 2.39 130 2.42 136 2.36 135 Madagascar 2.38 139 2.25 130 2.50 136 Guinea 2.33 131 2.40 140 2.25 137 Swaziland 2.33 140 2.25 134 2.40 138 Libya 2.32 137 2.33 138 2.31 139 Chad 2.30 138 2.33 139 2.26 140 Lesotho 2.21 144 2.03 135 2.39 141 Haiti 2.20 134 2.37 142 2.03 142 Algeria 2.11 143 2.08 141 2.15 143 Yemen 2.08 142 2.20 143 1.96 144 Burundi 2.06 141 2.23 144 1.90
Economic Social impacts impacts
Economic Social impacts impacts
@ 2013 World Economic Forum

Chapter 1.1: The Networked Readiness Index 2013
16 | The Global Information Technology Report 2013
organizational models and 2nd for the impact of ICTs in creating new services and products, which highlights the importance of ICTs for innovation in service-based economies.
Denmark ranks 8th overall, yet it is only 4th among the Nordics. Down four places, the country worsens its showing in almost two-thirds of the indicators comprising the NRI. The level of networked readiness remains astounding, however. Denmark tops the individual usage pillar, boasting some of the highest rates of Internet usage (6th), households with personal computers (6th), broadband Internet subscriptions (3rd), and mobile broadband subscriptions (6th).
Down one, the United States slips to 9th place despite a performance essentially unchanged from the previous year. This constitutes the country’s worst showing since the first edition of the GITR in 2001, in which it ranked 1st, although changes to the methodology and in the composition of the NRI over time cause the results not to be strictly comparable. The United States now appears in the top 10 of only two pillars, compared with six just one year ago. The country still possesses many strengths, which have contributed to making it the world’s innovation powerhouse for decades. However, this leadership is now being contested. The United States ranks only 12th worldwide for the number of PCT patent applications in 2009 and 2010 on a per capita basis. The rate of 134 applications per million population is less than half that of leading Sweden (297 applications), Switzerland (285), and Finland (279).
Gaining one rank, Taiwan, China, enters the top 10. Second among the Tigers, Taiwan owes its fast-paced economic development to ICTs, which have been at the heart of its industrialization since the early 1980s. In addition to being a major manufacturing base for electronics and high-tech products, Taiwan has become an innovation hub. Beyond the ICT sector, technology has permeated the entire society. Usage of ICTs is widespread (15th) and their impacts are profound both economically (7th) and socially (6th). On a less positive note, Taiwan’s performance is undermined by the relatively mediocre quality of its political and regulatory environment (33rd), Taiwan’s second-worst pillar rank.5
EUROPE AND THE COMMONWEALTH OF INDEPENDENT STATESSeveral European countries continue to lead the rankings, showcasing their strong efforts and commitment to fully develop and leverage ICTs to boost their competitiveness and the well-being of their citizens. As presented in the previous section, seven European countries, led by Finland and Sweden, are positioned within the top 10. Within the European Union, while stark intra-regional disparities persist, it is worth noting that the divergence across Member States in the NRI is significantly narrower than it is in the Global Competitiveness Index,6 the most comprehensive analysis for measuring the set of policies, institutions, and factors that drive the productivity of an economy. This reflects the longstanding efforts of the European
Figure 4: The Networked Readiness Index map
Scoren 5.4–7.0 (best)n 5.0–5.4n 4.0–5.0n 3.3–4.0n 1.0 (worst)–3.3n Not covered
Note: An interactive version of this map is available at www.weforum.org/gitr.
@ 2013 World Economic Forum

The Global Information Technology Report 2013 | 17
Chapter 1.1: The Networked Readiness Index 2013
Box 1: Sketching the new digital divide
The Networked Readiness Index (NRI) aims to measure the ability of countries to leverage information and communication technologies (ICTs) for improved competitiveness and well-being. This ability depends on multiple factors, as detailed in this chapter and reflected in the comprehensive framework underpinning the NRI. The NRI results confirm the presence of the digital divide between advanced economies on the one hand and emerging and developing economies on the other.
Figure 4 presents an intensity map of the world, with economies color-coded based on their NRI overall score measured on a 1-to-7 scale, with best- and worst-performing economies appearing in dark green and red, respectively. The contrast between advanced economies (see Table 1 for classification) and the rest of the world is stark and betrays the inability or limited capacity of a vast majority of countries to fully reap the benefits of ICTs. The green color, corresponding to a score of 5 and above, paints parts of Western Europe, with all Nordics but one painted dark green, along with the United States, Canada, Australia, New Zealand, Japan, and the Asian Tigers. The rest of the map is almost entirely devoid of green. The only exceptions are Israel (in 15th place, with an NRI score of 5.4), Estonia (22nd, 5.1), Qatar (23rd, 5.1), and the United Arab Emirates (25th, 5.1)—all pockets of strong performance in their respective regions, which are characterized by serious shortcomings.
Although a vast majority of them trail the advanced economies, the developing and emerging economies do not draw a homogenous picture—far from it. The map is mostly yellow (corresponding to NRI scores between 4 and 5) in Central and Eastern Asia and orange (scores between 3.3 and 4), with red patches in the Caucasus. The picture is predominantly orange in the rest of Developing Asia. In South
Asia, Bangladesh and Nepal show in red, while the Southeast Asia region presents a slightly brighter image, devoid of red and with Malaysia in yellow. The orange color also dominates in Latin America and the Caribbean. There, Chile, Uruguay, Panama, and Costa Rica contribute to a brighter picture, but 19 countries score below the mid-point and four of them are coded red (scores lower than 3.3) on the map. The picture is predominantly red across sub-Saharan Africa, where only a handful of nations, including South Africa and Kenya, appear in orange. Mauritius (not shown on the map) is the only one of the region’s 33 studied countries to obtain a score above 4. Finally, the patchwork of colors—from green to red—in the Middle East and North Africa (MENA) region betrays its profound diversity. In the NRI rankings, a gap of 111 places separates Qatar (23rd, with a score of 5.1) from Yemen (139th, 2.6).
In Europe—home to advanced, emerging, and developing economies—the picture is very mixed. A patch of yellow stretches almost uninterruptedly from the Iberian Peninsula through Italy, Slovenia, the Czech Republic, Poland, and the Baltics on to Russia. Adjacent is a cluster of underperformers, depicted in orange and comprising most of the Balkan countries, Romania, and Ukraine. Greece belongs to this group. Sitting 63 places behind Finland, it is the only advanced economy, along with the Slovak Republic, to score lower than 4.
Looking in greater detail, Figure A reveals that the digital divide is present across the 10 pillars of the NRI, even though the average scores necessarily conceal vast differences within the two groups. A traditional conception of the digital divide tends to focus on differences in terms of infrastructure and technological adoption. Despite rapid growth, the divide
(Cont’d.)
Figure A: The digital divide in the 10 pillars of the NRI
1. Political and regulatory environment
6. Individual usage
5. Skills7. Business usage
4. Affordability8. Governmentusage
3. Infrastructure anddigital content
9. Economicimpacts
2. Business and innovation environment
10. Socialimpacts
1
2
3
4
5
6
7
Note: Pillar scores are measured on a 1-to-7 scale (where 1 is the lowest score and 7 is the highest).
n Emerging and developing economies
n Advanced economies
@ 2013 World Economic Forum

Chapter 1.1: The Networked Readiness Index 2013
18 | The Global Information Technology Report 2013
Box 1: Sketching the new digital divide (cont’d.)
in these two areas remains high. Of the 10 pillars, infrastructure and digital content and individual usage are the two where the score differentials between advanced economies and the rest of the world are the biggest (2.7). Although mobile telephony is becoming ubiquitous almost everywhere, figures for Internet usage and broadband access, let alone mobile broadband access and PC ownership, remain low in most parts of the world.
Table A reports aggregate penetration rates (weighted by population) for various technologies in the 109 developing economies and 35 advanced economies covered by the NRI. As of 2011, there were 81 mobile telephony subscriptions per 100 population in the developing economies under review, not too far from the 111 subscriptions per 100 population of advanced economies. However, when it comes to Internet access, the ratios are much more skewed. Seventy-seven percent of individuals in advanced economies use the Internet, about three times as many as in developing countries (25 percent). The figures for PC ownership yield a similar ratio of 3.5 to 1 higher. In terms of mobile broadband subscriptions, the ratio is 7.3 to 1 in favor of advanced economies. Mobile telephony alone will not allow developing countries to bridge the digital divide. One must hope that the
same degree of innovation, competition, and attention that contributed to making mobile telephony affordable, useful, and ubiquitous will spread to other technologies.
Figure A reveals that the divide is not limited to mere differences in terms of ICT adoption. It extends well beyond, covering all aspects of networked readiness. In particular, the gap is large when it comes to ICT impacts. This is arguably the result of biggest concern, as impact is ultimately what really matters. Narrowing this new digital divide will take even more effort than narrowing the gap in ICT access.
In the 2012 edition of the GITR, we had already highlighted the digital divide in our analysis. Very little progress has been made this year toward reducing this divide, with a few exceptions. Several members of the Gulf Cooperation Council and the Commonwealth of Independent States have posted significant improvements. But these encouraging developments have only a negligible impact on the overall picture and conclusions drawn here. The lack of convergence since last year is not surprising given the complexity and multiplicity of factors driving a country’s networked readiness. It will take time and considerable effort for the developing world to reduce the gap.
Developing Advanced All Ratio of advanced to Population-weighted rates economies (109) economies (35) economies (144) developing economies
Mobile cellular telephone subscriptions per 100 pop. 81.3 110.7 85.7 1.4
Fixed (wired) broadband subscriptions per 100 pop. 5.1 28.7 8.7 5.7
Active mobile broadband subscriptions per 100 pop. 8.8 64.8 17.0 7.3
Percentage of individuals using the Internet 25.0 77.3 32.8 3.1
Percentage of households with a computer 22.2 77.7 31.2 3.5
Source: Authors’ calculation, based on ITU’s World Telecommunication/ICT Indicators Database 2012 (December 2012 edition).Note: See Table 1 for country classification. Penetration rates are based on the sample of 144 economies included in the NRI. For each technology, economies for which no data are available for 2011 are excluded from the calculation.
Table A: Penetration of various technologies, 2011
Union to narrow the digital divide in Europe and build an internal digital market, as corroborated by the launch of a new Digital Agenda for Europe,7 one of the seven flagship initiatives of the European Commission’s Europe 2020 Strategy for growth and jobs for the present decade.
Within Europe—beyond the Nordic countries, the Netherlands, Switzerland, and the United Kingdom—Germany in 13th place and going up three notches is leveraging ICTs quite efficiently, especially in terms of boosting its economic impacts for competitiveness, where it scores within the top 10. The country continues to boast a highly developed ICT infrastructure (10th), which translates into a high uptake by individuals
(14th), with one of the highest broadband Internet subscriptions (8th) in the world, and by businesses (5th) that are extensively using ICTs in their transactions with other businesses (14th) and with consumers (14th). In addition, the outstanding innovation capacity of the local firms (3rd) coupled with a well-performing educational system (20th) results in the already-mentioned high levels of economic impacts (10th) and in innovation and knowledge-intensive activities (15th).
Luxembourg, in 16th place and three ranks higher than last year, continues to improve its ICT infrastructure (12th) and its strong uptake by individuals, businesses, and government. Since identifying ICTs as one of the crucial sectors needed to diversify its economy and
@ 2013 World Economic Forum

The Global Information Technology Report 2013 | 19
Chapter 1.1: The Networked Readiness Index 2013
improve efficiency in other crucial sectors, such as the financial sector, Luxembourg’s government’s strong vision (5th) in upgrading ICT uptake has resulted in one of the world’s highest rates of Internet users (5th) and households with a personal computer (3rd) and an Internet connection (6th). Notwithstanding these achievements, the economic impacts of ICTs (25th) to boost innovation, while improving, still remains below other very advanced economies, the result of some weaknesses in an innovation system that has recently been developed. Further strengthening the country’s national innovation capacity would thus yield better results for the ICT infrastructure and uptake that is already world class.
Within the top 20, as last year, Austria places 19th, with a rather stable profile. The country continues to exhibit a very strong ICT infrastructure and digital content (9th) that, coupled with a good skill base (24th), allows for a strong individual uptake (19th), with high rates of Internet users (15th) and extensive use of the Internet for economic transactions between businesses (3rd) and with consumers (16th). Moreover, the country’s long-lasting investments in innovation and the integration of ICTs in this favorable ecosystem result in good economic impacts (22nd). On a less positive note, Austria continues to suffer from high tax rates (120th) and cumbersome procedures (97th) to open a business, which can hinder the ability of existing and new businesses to appear and grow.
Once again, Estonia ranks as the highest Central and Eastern European country, in 22nd place, gaining two positions in the rankings. The strong vision of its government (23rd) and its success (14th) in developing ICTs as one of the critical industries for the local economy continues to yield good impacts (15th), both in economic (23rd) and social (5th) terms, where the country depicts one of the strongest performances across the globe. Following the example of the Nordic countries, Estonia has managed to develop a strong ICT infrastructure and encourage a strong uptake by citizens (23rd), by businesses in their transactions with other businesses and government (15th), and by the government (23rd), which continues to expand its offerings of online services. Going forward, the country could benefit even further by strengthening its innovation system, which still suffers from some weaknesses and limits the private sector’s capacity to innovate (33rd) and thus benefit from the full potential that ICTs can offer.
Belgium, in 24th place—two notches down from last year—continues to leverage ICTs strongly to obtain high economic impacts (19th) thanks to a well-developed ICT infrastructure (18th), a world-class educational system (3rd), and an innovation and entrepreneurship-prone environment (18th) that allows for a fairly high innovation capacity in local firms (11th). In order to keep boosting ICT uptake, mobile cellular tariffs should
fall (127th), as this seems to affect mobile phone subscriptions (50th) and especially mobile broadband subscriptions (56th). Furthermore, the government could expand its offerings of online services (39th), notably the facilities to increase citizens’ online participation (81st), which remains below the EU average.
Despite a drop of three positions, France—in 26th place—achieves a good and harmonious uptake of ICTs across all different agents in society and achieves strong economic impacts (17th), thanks to a good skill base (21st). Overall, ICT infrastructure and digital content has continued to improve (28th) and, although a bit more costly to access (86th), overall use has remained high, with the government significantly expanding its offerings of online services (8th). On a less positive note, a slight deterioration in the business and innovation environment (39th), along with a high tax system (130th), can potentially impede future ICT-related startups.
Portugal and Spain, despite their current economic difficulties, maintain their positions in the rankings at 33rd and 38th place, respectively. Both countries have managed to develop a solid ICT infrastructure (34th and 31st, respectively), which has resulted in relatively good levels of ICT uptake by most stakeholders. This is the case especially for Spain, where both the government’s offerings of online services (23rd) and Internet broadband subscriptions (26th), including mobile broadband (25th), are high and close to those of other Western European economies despite the high cost of mobile telephony (132nd). In both cases, the economic impacts that could accrue from ICTs are somewhat jeopardized because of weaknesses in their innovation systems and the quality of their educational systems (94th and 97th, respectively), which limit the capacity of businesses to innovate (40th and 44th, respectively) and, therefore, hinder the needed economic transformation of both countries toward higher-knowledge-intensive activities (53rd and 37th, respectively).
In Southeastern Europe, Slovenia, stable in 37th place, continues its regional leadership in terms of leveraging ICTs. With a well-developed ICT infrastructure and a good skill base (36th) despite some quality concerns in the educational system (63rd), the country has obtained high levels of ICT penetration, with Internet users reaching close to three-quarters of the population (28th) and a high level of broadband Internet subscriptions (24th), despite the relatively high cost of ICT access (85th). In order to improve the economic impacts of ICTs (34th), Slovenia should continue strengthening its rather pro-business environment while addressing some of the weaknesses of its innovation system, such as the lack of available venture capital (113th). This rather positive outlook contrasts with the situation of other countries in the region, such as Bosnia and Herzegovina and Serbia in 78th and 87th positions, respectively, which reflect a yet insufficiently
@ 2013 World Economic Forum

Chapter 1.1: The Networked Readiness Index 2013
20 | The Global Information Technology Report 2013
developed ICT infrastructure and uptake and weak innovation systems that hamper their capacity to fully leverage ICTs to boost competitiveness.
Stable in 42nd place, the Czech Republic continues to strive in terms of a well-developed ICT infrastructure (23rd) and high penetration in terms of individual usage (29th), with many Internet users (27th) and mobile broadband subscriptions (21st), despite the high cost of ICTs (99th). As a result, e-commerce, both between businesses (23rd) and between businesses and consumers (8th), is well developed. On a less positive note, and although governmental online services have increased, they remain relatively low (53rd). Going forward, the country could benefit more from ICTs to boost innovation (82nd) and raise competitiveness by addressing some of the current weaknesses in the innovation system, such as limited venture capital (84th). Other countries in Central Europe—such as Hungary, Poland, and the Slovak Republic in 44th, 49th, and 61st place, respectively—have also remained stable with little variation in the rankings, despite relatively well developed ICT infrastructures and penetration rates. However, serious weaknesses in their innovation systems hinder their capacity to properly integrate their digital development into a well-performing ecosystem that allows for higher innovation rates. In addition, Bulgaria and Romania, in 71st and 75th place, respectively, close the EU rankings, with lower rates of ICT uptake and unstable environments that impede their potential for higher economic and social returns.
Turkey, in 45th place, ascends seven notches in the rankings, thanks to an overall improvement in its political and regulatory framework (54th) and in its business and innovation environment (43rd); a significant improvement in developing crucial ICT infrastructure, such as international Internet broadband capacity (42nd); and, above all, a drop in tariffs to access ICTs (4th), which have allowed for higher ICT penetration in terms of broadband subscriptions (56th) and Internet users (69th). Notwithstanding this progress, the country still suffers from an insufficiently developed skills pool (81st), the result of a low secondary education enrollment rate (88th) and a poor educational system (100th) that hamper the capacity of the country to fully leverage ICTs to boost innovation and raise national productivity levels. Addressing these weaknesses while improving government online tools to boost citizens’ participation could help the country increase both its economic and social impacts going forward.
A drop of two places leaves Italy in 50th position. Deterioration in the country’s political and regulatory environment (95th) and a relative stagnation in its progress toward improving its ICT infrastructure (40th), boosting a higher ICT uptake, and consequently obtaining higher economic and social impacts have resulted in this small decline. Overall, it is worth noting
the perception of a lack of coherent government vision to boost ICTs (118th) and the limited role that ICTs play in organizing economic transactions between businesses (101st) and between businesses and consumers (83rd). These factors, coupled with the persistent weaknesses in the innovation system (69th) and in the quality of education (87th), are hindering the country’s capacity to leverage ICTs better and obtain higher economic and social impacts.
As in Italy, the rapid deterioration of the political and regulatory environment (103rd), the lack of a government vision to boost ICTs (138th), and the stark weaknesses in the national innovation system that hold back the capacity of local firms to innovate (104th) have resulted in Greece’s drop of five positions, down to 64th place. The current economic difficulties have slightly affected the country’s otherwise fairly well developed ICT infrastructure (46th), mainly in terms of international Internet bandwidth (51st), although individual uptake (43rd) has improved, notably in the number of Internet users (51st). In terms of obtaining better returns for national ICT investments, the country will need to address the already-mentioned weaknesses in its innovation system and improve the quality of its educational system (115th).
Within the Commonwealth of Independent States, several countries have fully recognized the potential of ICTs to leapfrog and diversify their economies, and important progress has been recorded since last year.
Leading the region, Kazakhstan depicts a strong performance with a rise of 12 positions to 43rd place. Improvements virtually across the board—led by a strong government vision (35th) that continues to develop the ICT infrastructure (63rd) and supports stronger ICT uptake—as evidenced by the number of Internet users (62nd), along with households with a personal computer (63rd) and those with Internet access (55th), which have almost doubled since the last observation—have driven this good result. Notwithstanding this progress, the economic impacts (66th) accruing from a higher use of ICTs remain modest in their ability to spur new services or products (92nd) and raise the national competitiveness, mainly because of a low capacity for local innovation (92nd), an educational system that is deemed insufficient for the challenges ahead (101st), weaknesses in the political and regulatory environment (77th), and some concerns about the functioning of the judicial system (94th).
The Russian Federation, overtaking China as the leading large emerging economy, rises two positions to 54th place thanks to improvements in higher rates of general ICT uptake, with growing numbers of Internet users (57th) and, especially, a spectacular increase in mobile broadband subscriptions (20th) that has multiplied exponentially, as almost half of the population now benefit from it. Despite this progress, the country
@ 2013 World Economic Forum

The Global Information Technology Report 2013 | 21
Chapter 1.1: The Networked Readiness Index 2013
continues to suffer from low rates of e-business (107th), a weak political and regulatory framework (108th), and a poor business and innovation environment (90th) that affects its capacity to further leverage ICTs to boost its economy and benefit from higher rates of products and service innovation (123rd).
Azerbaijan, in 56th place, continues its ascension in the rankings as a result of an improvement in its ICT infrastructure, especially in terms of international Internet bandwidth capacity (64th), that—coupled with affordable prices (20th)—result in higher rates of ICT uptake. This is seen in rising numbers of broadband subscriptions (53rd), including mobile broadband (50th), which has rapidly expanded in the past year. Despite these significant advances in boosting the national connectivity, economic and social impacts (59th) could be further enhanced if the current weaknesses in fostering innovation and entrepreneurship (86th) and increasing the quality of the educational system (109th) were addressed.
Within the region, Georgia and Armenia—showing some of the highest gains in our rankings, of 23 and 12 positions, respectively—reach 65th and 82nd place, respectively. They are joined by Ukraine and Tajikistan with more moderate rises of two positions to 73rd and 112th place, respectively, in this overall regional positive trend. On a less positive note, the Kyrgyz Republic, at 118th, has not managed to join its neighbors in better leveraging ICTs to boost its economic competitiveness.
ASIA AND THE PACIFICAsia is home to some of the wealthiest economies and some of the most successful development stories in the world, but also to some of the poorest countries. A similarly profound diversity characterizes Asia’s digital landscape, thus making it impossible to draw a uniform picture of the region. The most digitized and innovative economies—the Asian Tigers—co-exist in the region with some of the least-connected ones. Nowhere else does the regional digital divide run so deeply. Regardless of their position on the development ladder, all Asian economies have much to gain from increased networked readiness. It will allow populations of the least-advanced countries to gain access to much-needed basic services, improved government transparency and efficiency, and—for the most advanced, many of which suffer from anemic economic growth—it will contribute to boosting their innovation capacity. The NRI reveals that in the case of Asia’s best-performing economies, the governments typically lead the digital effort, unlike in Europe. At the heart of Asia, and representative of its immense diversity, the Association of Southeast Asian Nations (ASEAN) is fairly dynamic. Led by Singapore, all eight ASEAN members covered by the NRI improve their overall score and a majority progress in the rankings, albeit in some
cases—such as Cambodia and the Philippines—from a low base.
The Republic of Korea (11th) gains one rank and now stands in the doorway of the top 10. The country’s performance is particularly lopsided. Korea ranks 32nd and 23rd in the environment subindex and the readiness subindex, respectively. By contrast—and remarkably enough—it places 4th in the usage subindex and 5th in the impact subindex.
The lowest-ranked Tiger economy, Hong Kong SAR, places 14th overall. Its performance is arguably more balanced than those of Taiwan and Korea: Hong Kong ranks no lower than 30th in nine of the ten pillars.8 The most positive aspect is its 2nd rank in the business and innovation environment pillar, just behind Singapore. ICT usage is widespread (20th), and Hong Kong holds the record for the most mobile telephone subscriptions per capita, with 215 for every 100 population.
Australia occupies the 18th rank, one notch lower than a year ago. The county’s performance is undermined by a poor score in the affordability pillar. Although most of the 19 main ICT service categories are fully liberalized, average prices of mobile telephony and Internet remain very high by international standards, earning Australia the 97th rank in this category.
Ahead of its neighbor in the previous edition of the NRI, New Zealand drops six places to 20th, two lower than Australia this year. The quality of its regulatory and business environment is outstanding, earning New Zealand the 2nd spot in the environment subindex, just behind Singapore. In particular, the transparency and efficiency of its institutions are among the world’s best. The excellent skill base of the population (6th) also contributes to the country’s high degree of readiness. As for most advanced economies featuring high in the NRI, the affordability pillar (100th) is New Zealand’s only real weakness.
One of the world’s most prolific innovators, Japan ranks a disappointing 21st overall and is down three spots from the previous edition. A number of important shortcomings in the environment subindex, including red tape, prevent the country from playing a leading role in the NRI. The biggest competitive advantage of Japan is without doubt its innovative and sophisticated business sector (2nd). Technology and innovation have greatly contributed to making Japan one of the most productive economies worldwide. But beyond the tremendous impact of technology on the economy, it has not had an important impact on society at large (31st). A more conducive institutional framework, including a renewed commitment by the government, could usher in new drivers of growth for Japan.
Despite losing one rank, Malaysia (30th) remains the best-ranked economy in Developing Asia. Trying to emulate the success of Korea and other Asian Tigers, the Malaysian government has been pursuing
@ 2013 World Economic Forum

Chapter 1.1: The Networked Readiness Index 2013
22 | The Global Information Technology Report 2013
a long-term transformation plan with the ambition of achieving high-income status by the end of the decade, with ICTs playing a critical role. Most government-related indicators reflect this commitment, and Malaysia places 7th in the government usage pillar. Businesses are quite aggressive at adopting technology and are increasingly innovative. The government-led efforts seem to be starting to have a transformational impact on the economy (29th) and the society at large (25th). Areas of weaker performance include infrastructure (73rd) and individual usage (46th), owing to the relatively low rates of adoption of the latest technologies.
China posts a fall of seven places in the rankings this year, and occupies the 58th position overall and second among the BRICS countries,9 falling below Russia (54th). To better leverage ICTs, China faces important challenges across the board. Its institutional framework (56th), and especially its business environment (105th), present serious shortcomings that stifle entrepreneurship and innovation, including excessive red tape, high taxes (127th), and questionable intellectual property protection—for instance, almost 80 percent of installed software in China is estimated to be pirated. Our study also points to the limited or delayed availability of new technologies (107th) despite the presence of pockets of technological excellence in certain sectors and regions of the country. In terms of readiness, the country ranks a low 83rd in the infrastructure and digital content pillar, mainly because of its underdeveloped Internet infrastructure, especially in certain rural areas that do not benefit from the rapid development experienced in urban centers. China gets high marks in the affordability and skills categories, placing 40th and 53rd, respectively. Looking at actual ICT usage (58th), penetration rates remain quite low in absolute terms but should be considered in the light of the sheer size of the country and the large rural population. A mere 40 percent of individuals use the Internet on a regular basis. There are 12 fixed broadband Internet subscriptions for every 100 population; mobile broadband Internet is nearly as widespread, with 10 subscriptions per 100 population. By contrast, ICT usage among businesses is extensive (35th). China is becoming more and more innovative, and this in turn encourages further and quicker adoption of technologies. The government is placing great hopes in ICTs to boost productivity and, ultimately, growth. Its efforts in promoting and using ICTs are reflected in China’s strong showing in the government usage pillar (38th).
With a performance essentially unchanged from the previous edition, India progresses one rank to 68th. India’s performance remains very mixed. The most worrisome aspects are the mediocre quality of the political, regulatory, and business environment (85th), as well as its lack of digital infrastructure (111th). Extensive red tape stands in the way of businesses,
and corporate tax at 62 percent of profit is among the highest in the world. Other variables within the environment subindex are better assessed, including the availability of new technologies (47th), the availability of venture capital (26th), the intensity of local competition (34th), and the quality of management schools (33rd). A critical determinant of a country’s readiness, India’s literacy rate is among the lowest in the sample at 63 percent (121st). On the other hand, intense competition in the sector and innovations for the “bottom of the pyramid” have made India the leader in the affordability pillar, thus providing a significant boost to its readiness. Partly owing to the weaknesses noted above, adoption of ICTs remains dismally low in India, as reflected in its 121st rank in the individual usage pillar. Although mobile telephony is becoming ubiquitous, only one person in ten uses the Internet regularly. Accessing it at broadband speed remains the privilege of a very few, with a single fixed broadband Internet subscription for every 100 population. Mobile broadband access has already become more widespread, with two subscriptions per 100 population. By contrast, businesses are early and assiduous adopters of new technologies (40th). And the government is placing a lot of emphasis on ICTs as a way to address some of the country’s most pressing issues, including job creation, corruption and red tape, and education. Whether this vision will translate into a transformation of the economy and society remains to be seen. But already ICTs are having an—albeit small—transformational impact on the economy, which is partly reflected in India’s performance in the economic impacts pillar (43rd).
Thanks to a two-place improvement, Sri Lanka (69th) now trails its neighbor by just one rank, even though the country fails to improve its score. Sri Lanka and India are the only two countries in the South Asia Association for Regional Cooperation (SAARC) group to rank higher than the 100th mark. A huge gulf separates them from other SAARC members Pakistan (105th, down three), Bangladesh (114th, down one), and Nepal (126th).
Within ASEAN, Thailand (74th) leads a group of four members that do not leverage ICTs to their full potential. Trailing by more than 70 and 40 places behind Singapore and Malaysia, respectively, Thailand exhibits a number of weaknesses across the board. The highlights of its performance are the relative affordability of ICTs (45th), in particular mobile telephony, and the quality of its business and innovation environment (52nd). However, in this latter category as elsewhere, Thailand alternates good and poor assessments. Aside from mobile telephony, other technologies remain relatively scant, translating to a middling 88th rank in the individual usage pillar. Also the institutional environment does not seem to be particularly conducive (81st) and the government does not appear to be particularly ardent at pushing
@ 2013 World Economic Forum

The Global Information Technology Report 2013 | 23
Chapter 1.1: The Networked Readiness Index 2013
the digital agenda nationwide (86th). In this dimension, the satisfactory ranks obtained in both the Government Online Service Index (64th) and E-Participation Index (46th) conceal relatively low marks (0.51 and 0.32, respectively, on a 0-to-1 scale).
ASEAN’s most populous country, Indonesia, advances by four ranks and climbs to 76th place. The affordability pillar is where Indonesia ranks the highest (39th). Elsewhere, its most positive features are found in the usage subindex, where Indonesia improves by no less than 15 places to reach 70th position. In particular, the country ranks an impressive 40th for business usage. Companies are quick at absorbing the latest technologies and are becoming increasingly innovative. Mobile telephony is already ubiquitous, but other technologies exhibit spectacular growth rates, though from a very low base (92nd in individual usage pillar, up 11). For instance, mobile broadband technology increased more than tenfold between 2010 and 2011, reaching 22 subscriptions per 100 population (48th). Also, Indonesians are notoriously very assiduous users of virtual social networks (only 51st, but with an impressive score of 5.7 on a 1-to-7 scale). Finally, a 17-place jump in the government usage also contributes to the positive trend. Unfortunately, these positive results do not—yet—translate into similar progress in the various measures of ICT impact, earning Indonesia a low 86th rank in this subindex, unchanged from a year ago.
With a performance essentially unchanged from the previous year, Vietnam loses one rank to place 84th. As for most ASEAN countries, the affordability pillar constitutes the best aspect of Vietnam’s performance (38th). For the rest, many shortcomings are present in all dimensions of the NRI. Perhaps the most worrisome aspect is the poor overall quality of the political, regulatory, and business environments. As a result, Vietnam ranks a disappointing 97th in the environment subindex. Such lack of conduciveness is not only detrimental to ICT development, but also seriously undermines the country’s competitiveness in general.
Second to last within ASEAN, the Philippines remains in 86th position despite a significant improvement in its overall score. The country manages to boost its marks where it is the most desperately needed, namely the environment subindex. Up 11 spots year to year, the Philippines still ranks a dismal 100th in this dimension, the very last among ASEAN countries. In particular, the extent of red tape remains alarming despite some progress, and the Philippines is among the worst worldwide in several related indicators. On a much more positive note, the country ranks 68th in terms of ICT impacts (up 16). The role of ICTs in creating new products and services (43rd) and organization models (33rd) is not negligible and contributes to this encouraging result.
Twenty places behind the Philippines and closing the rankings among ASEAN countries, Cambodia (106th) improves its showing by two ranks. The country ranks beyond the 100th mark in six of the ten pillars of the NRI. Amid this mostly gloomy picture, the fact that it shows progress on approximately two-thirds of the indicators is encouraging.
LATIN AMERICA AND THE CARIBBEANDigitally connecting the hemisphere remains one of the key challenges for the region, as recognized during the Sixth Summit of the Americas, which took place in Colombia in April 2012.10 While several countries— including Panama, Mexico, Colombia, and El Salvador—have made remarkable improvements that are clearly reflected in important gains in the scores and rankings of the NRI, overall, Latin America and the Caribbean still suffers from a serious lag that prevents it from fully leveraging the potential of ICTs to boost regional productivity. The social and, most remarkably, economic impacts accruing from ICTs remain low in comparison to other regions, despite government-led efforts to develop and upgrade ICT infrastructure and despite governments’ increasing use of Internet to communicate and interact with individuals and the business community. Weaknesses in the political and regulatory environment, the existence of large segments of the population with a low skill base, and poor development of the innovation system are all factors hindering the potential that ICT developments could have on the regional economy.
Chile, in 34th place and up this year by five positions, remains once again the country within Latin America that is making the strongest efforts to leverage ICTs to boost its competitiveness and increase civil participation. In the past year, the country has continued its attempts to strengthen ICT infrastructure and increase connectivity and the use of the Internet (50th)—although still far from the values of more advanced economies, this depicts one of the highest scores for this set of indicators in the region. In addition, the government has continued to increase its offerings of online services (24th) and supports the online active participation of its citizens (19th) in the decision-making process. That, coupled with its entrepreneurial-friendly and efficient legal framework, result in relatively high values in terms of economic (35th) and especially social (27th) impacts accruing from ICTs. Notwithstanding this favorable outlook, the economic impacts of ICTs in terms of boosting technological and non-technological innovation are not yet fully leveraged because of some important and recurring weaknesses in the quality of the educational system (91st) and a relatively low capacity to innovate (83rd). Boosting innovation and improving the quality of education for all segments of the population should be the two key areas to strengthen going forward
@ 2013 World Economic Forum

Chapter 1.1: The Networked Readiness Index 2013
24 | The Global Information Technology Report 2013
to keep supporting Chile’s transition toward higher-value-added economic activities.
With its slight drop of four positions, Barbados remains one of the best performers in the region thanks mainly to its outstanding educational system (7th) and very high connectivity, both in terms of ICT infrastructure and digital content (38th) and in its level of Internet users (30th), despite the still-high cost of accessing ICTs (111th). In addition, the country boasts a relatively efficient environment for ICT development and uptake (36th) that widely supports the high levels of individuals (26th) and businesses (43rd) using ICTs in their transactions. However, the government seems to lag behind in fully leveraging the potential of ICTs. Despite recognition of its vision for developing ICTs (36th), the offerings of online services for citizens and businesses (95th), as well as the opportunities for citizen participation (111th), remain limited. Addressing these weaknesses and strengthening the overall innovation capacity of indigenous firms (91st) would allow Barbados to benefit more from ICTs.
Panama continues its steady ascent in the rankings, rising 11 positions to 46th place. The country’s strategy to fully develop ICTs as one of the key factors driving its productivity and supporting crucial sectors of its economy, such as logistics and banking, seems to be paying off. Further efforts to address long-lasting structural weaknesses in terms of the quality of education (112th) and innovation (94th) will be crucial going forward; these weaknesses are also taking a toll on the potential economic impacts (73rd) accruing from ICTs. Overall, the clear, firm vision of the government (20th) to continue its efforts to develop its national ICT infrastructure are reflected in the doubling of international Internet bandwidth capacity (36th) and in the number of households with a computer and Internet connection (77th). While still low in comparison with international standards, these improvements have led to a higher ICT uptake by all agents in the society.
Despite a decline in the rankings, Uruguay, in 52nd place, remains one of the Latin American countries that is leveraging ICTs better to obtain meaningful economic and social impacts. Overall, the country continues to develop its ICT infrastructure, expanding its international Internet bandwidth capacity (44th). It now enjoys full mobile network coverage for its entire population (1st), although this remains relatively costly (80th), especially in terms of mobile cellular tariffs (94th). Overall, the efforts to expand ICT uptake in the population continue to improve and, for the first time, more than half of the population is using the Internet (53rd) and benefiting from one of the highest school Internet access rates in the world (15th). Notwithstanding these important strengths, the economic impacts of ICTs, especially in supporting Uruguay’s transition to a more knowledge-based economy (67th), face two primary limitations. First, the local innovation system is insufficiently developed,
thus not allowing local businesses to rely on a high capacity to innovate (74th). Second, the quality of the educational system (107th), while one of the best in the region, does not seem to provide the skills that are increasingly demanded by local firms. As a result and going forward, continuing the good progress in increasing ICT uptake should be accompanied by further efforts to strengthen the local innovation system in order to obtain greater economic impacts that can boost national competitiveness.
Costa Rica, together with Panama, remains the leader in ICT uptake in Central America and climbs five positions in the rankings to 53rd place. Overall, the country has continued its efforts to develop its very affordable (6th) ICT infrastructure, especially in terms of improving its international Internet bandwidth capacity (40th) that, coupled with a well-performing educational system (21st), allows for an overall strong ICT readiness (33rd). However, ICT uptake, especially among individuals (71st), remains relatively low. Moreover, concerns in the political and regulatory framework (74th)—notably in terms of the time needed to enforce contracts (122nd) and in the business and innovation environment (94th), with excessive red tape (132nd) needed to start a business—also affect the national capacity to leverage ICTs even further to boost national competitiveness.
Rising five positions since last year thanks to improvements in ICT infrastructure (62nd) and ICT uptake (44th), Brazil is now in 60th place. In the past year, the country has more than doubled its international Internet bandwidth capacity per user (47th) and expanded its mobile network coverage to its entire population. As a result, ICT uptake by individuals has sharply increased (58th) in virtually all dimensions analyzed in the NRI. Notwithstanding this progress, expanded coverage’s translation into greater economic impacts in terms of innovation and higher competitiveness has somewhat stagnated (50th). This is mainly the result of important weaknesses in the business and innovation environment (126th), which still suffers from excessive red tape and burdensome procedures, and the quality of the educational system (116th), which does not seem to provide the necessary skills for a rapidly changing economy in need of a wider talent pool.
Mexico experiences a sharp rise of 13 positions to attain 63rd place in the rankings, driven mainly by government efforts to deeply develop its offerings of online services (28th), increase its citizens’ participation to support their government (25th), and an overall improvement in the business and innovation environment. Despite these important steps forward, the country has made less progress in further developing its ICT infrastructure (82nd) and significantly reducing its access costs (63rd), notably in terms of mobile telephony (102nd). As a result, ICT uptake in terms of
@ 2013 World Economic Forum

The Global Information Technology Report 2013 | 25
Chapter 1.1: The Networked Readiness Index 2013
Internet users (78th) or households with Internet access has not progressed. This, coupled with a skills shortage (87th) because of the low quality of the educational system (100th), has resulted in little progress in terms of economic impacts accruing from ICTs (72nd). Adopting and implementing a holistic digital agenda that could boost the development and uptake of ICTs and their inclusion in a more robust innovation system could help address some of these important weaknesses and provide better results.
Colombia ranks in 66th place, seven notches up since last year, thanks to efforts to drive prices of fixed broadband Internet tariffs (75th) down that have resulted in an increase in the number of Internet users (70th); and thanks also to the continued effort, led by the government, to increase the number of available online services (16th) and the support for raising citizens’ online participation (11th). Despite these remarkable improvements, the country still suffers from an underdeveloped ICT infrastructure and digital content (96th), along with a political and regulatory framework (92nd) and a business and innovation environment (95th) that hampers the country’s capacity to fully leverage ICTs for competitiveness. The result is limited economic impacts (70th).
A lack of progress in upgrading a rather costly access (114th) to national ICT infrastructure has caused Argentina to fall seven positions to 99th place. The country boasts fairly good results in terms of international Internet bandwidth capacity (52nd) and high levels of educational enrollment, notably at the tertiary level (21st). However, the poor business climate for entrepreneurship and innovation (110th) and weaknesses in the political and regulatory environment are hindering the country’s potential to obtain greater economic impacts (91st) and move the national economy toward more knowledge-intensive activities (82nd).
Despite going up three places in the rankings to 103rd place, Peru continues to lag significantly in terms of leveraging ICTs to modernize its national economy. Even with a government push to increase the number of online services and a reduction in the cost of accessing broadband Internet (107th), insufficient progress in developing the national ICT infrastructure (86th) has resulted in the relative stagnation of ICT uptake, notably in terms of the number of Internet users (77th) and households with computers (82nd) or an Internet connection (83rd). Moreover, notwithstanding its relatively pro-business environment (57th), weaknesses in the political and regulatory environment (121st), the poor quality of its educational system (132nd), and its low capacity to innovate (103rd) are factors that are hampering the country’s ability to obtain greater economic impacts and allow the national economy to transition toward higher-value-added activities.
Finally, Paraguay (104th), Venezuela (108th), Bolivia (119th), and Haiti (141st) close the regional rankings. These four countries fall behind others in the region because of important ICT connectivity weaknesses and an innovation-adverse environment that prevents high economic impacts that would result from innovation and the economic transformation of these countries toward knowledge-intensive activities.
SUB-SAHARAN AFRICASub-Saharan Africa has continued to make significant efforts to build its ICT infrastructure, as reflected by important improvements in developing its broadband infrastructure and the expansion of its mobile network coverage. As a result, ICT usage, while still very low, has picked up slightly, as seen especially by an increase in the number of Internet users and the continued commitment of some governments in the region to expand the number of available online services. Despite this positive trend, the stubbornly high sharp digital divide from more advanced economies, notably in terms of ICT-driven economic and social impacts, persists. A still-costly access to ICT infrastructure and relatively low levels of skills with low educational attainments and unfavorable business conditions for entrepreneurship and innovation are hindering the region’s capacity to fully leverage the potential of the increasingly available ICT infrastructure. As a result, only two countries—Mauritius (55th) and South Africa (70th)—are positioned in the top half of the rankings, while nine out of the bottom ten belong to the region.
Mauritius, in 55th place, two down from last year, continues to lead by far the regional classification thanks to a fairly strong political and regulatory framework (36th) and the government’s strong vision (48th) to build and deploy ICTs as one of the three key strategic priority sectors for the development of the national economy. Overall, the country has continued to build its ICT structure, ensuring that it becomes affordable in order to support a stronger uptake from all agents in the country. As a result, broadband Internet subscriptions (60th) and Internet users (81st) have slightly increased, although the results also show that the use of ICTs for transactions between businesses (48th) is more extended than it is for individuals (92nd). The impacts of ICTs remain modest (80th), despite the presence of a business-friendly environment (46th), mainly because an insufficiently developed innovation capacity (112th) hampers the country’s capacity to fully leverage ICTs to boost innovation and competitiveness.
Going up two positions, South Africa is in 70th place. Despite a sharp improvement in the development of its ICT infrastructure (59th)—notably in terms of international Internet bandwidth capacity (66th)—and a strong uptake by the business community (33rd), the ICT impacts (92nd), particularly the social ones
@ 2013 World Economic Forum

Chapter 1.1: The Networked Readiness Index 2013
26 | The Global Information Technology Report 2013
Box 2: Charting the increasing returns to ICTs and skills investments
In the past decade, as ICTs have become ubiquitous, policies aimed at assessing and monitoring ICTs have shifted their focus from determining the level of connectivity of a country to determining the benefits that this connectivity can yield in terms of the positive impacts to boost competitiveness and well-being. Understanding, identifying, and measuring all the potential impacts of ICTs are not easy tasks, notably but not only because of a lack of data. The NRI has made an important first step toward getting a better handle on the benefits accruing from ICTs so that countries can improve national innovation, enable the shift of national economic structures toward higher-value-added activities, improve government efficiency, and expand citizens’ access to basic services and a broader civil participation.
Moreover, this policy shift toward assessing the impacts of ICTs has gained importance in the current economic context, where many developed economies face serious financial and economic difficulties and where governments and firms are forced to control their budgets more tightly. For these reasons, governments and businesses face the stark need to quantify the returns to different investment options. Similarly, developing economies must choose between different investment opportunities in order to render their economic growth more stable and sustained over time.
Running an econometric model to test the causality or provide an accurate estimate of the returns on any public investment is statistically challenging because of the difficulty in accounting for the totality of the potential results and isolating the individual contribution of the many interrelated
factors that influence the results. Against this backdrop, a correlation analysis could shed some preliminary light on the relationship that may exist between a particular set of investments and the expected returns on it. Figure A presents the relationship between the scores in the impacts subindex and the readiness subindex showings of the NRI.
As can be seen, the relationship between the scores of the two subindexes, while positive, does not seem to be fully linear but rather denotes an exponential relationship, suggesting that the higher the ICT readiness of a country is, the proportionally higher the economic and social impacts are. In other words, the correlation analysis suggests not only that a cumulative effect of readiness on ICTs and skills investments exists, but also that a minimum threshold in complementary investments—such as direct investments in ICT infrastructure and skills—may also exist for a country to start attaining meaningful and raising economic and social impacts.
These findings bear some important policy consequences both for developing and developed economies. For the former, a minimum set of investments in building an ICT infrastructure and developing the necessary skill base for its optimal exploitation is needed in order to obtain results. This may take several years of continued investment. For the latter, it seems that investments in ICTs and skills development have the potential to yield increasing returns by boosting innovation for productivity gains and enhancing societal well-being.
Figure A: Correlation analysis between the NRI 2013 impact subindex and the readiness subindex
Source: Authors’ calculations.
1 2 3 4 5 6 7
1
2
3
4
5
6
7
Impa
ct s
ubin
dex
scor
e, 1
–7 s
cale
Readiness subindex score, 1–7 scale
R ² = 0.7382
@ 2013 World Economic Forum

The Global Information Technology Report 2013 | 27
Chapter 1.1: The Networked Readiness Index 2013
(112th), remain limited. The perception of a lack of clear government vision (105th) to orchestrate and implement a holistic ICT strategy for the country, coupled with deficiencies in the educational system for some segments of the population (102nd), play negatively in this process and outweigh a rather positive political and regulatory framework for ICT development (21st) and pro-business environment (55th).
Already in the second half of the rankings and falling six positions this year, Rwanda is in 88th place. This drop is the result of a certain stagnation in ICT infrastructure development (105th) and uptake in society (139th), despite the strong government vision of developing the ICT industry as a priority (10th) and its efforts to increase the number of available online services, which nevertheless remain low (103rd). Overall, ICT impacts remain limited (61st) because of poor ICT infrastructure (105th) that is costly to access (116th) and impedes ICT uptake in society. Moreover, a weak skill base (113th), together with large segments of the population who remain illiterate (115th) and a low tertiary education enrollment rate (123rd), also affect Rwanda’s capacity to fully leverage ICTs to boost innovation and competitiveness, despite the presence of a fairly sophisticated, stable, and strong political and regulatory environment for the development of ICTs (13th).
In East Africa, Kenya at 92nd place climbs one position this year. Overall, despite the government’s strong vision for developing ICTs (28th), the country’s overall readiness (110th) remains low because of insufficient development of an infrastructure (110th) that is costly to access (105th), combined with a weak skill base (93rd) that suffers from low secondary enrollment rates (109th) and high level of illiteracy (97th). In addition to addressing these weaknesses to increase its digital connectivity, the country needs to improve its business and innovation environment (106th) in order to fully leverage ICTs and boost their positive impacts (71st) in the economy and society. Also in East Africa, Uganda, Zambia, and Tanzania—in 110th, 115th, and 127th place, respectively—suffer from strong connectivity gaps and environments that lack the conditions to allow for a full leverage of the benefits of ICTs.
Ghana goes up two positions to 95th place, though the country still must overcome serious handicaps to fully leverage ICTs. Its insufficient ICT infrastructure and digital content development (121st), coupled with a weak skill base (106th), result in a poor digital usage across all agents (102nd) and, inevitably, in low economic and social impacts (100th).
Finally, several countries in West and South Africa, despite a wider proliferation of mobile technologies than in past years, are positioned at the bottom of the rankings—the consequence of insufficient development of ICT infrastructure that hinders their ICT uptake and results in a poor digital connectivity. Moreover,
unfavorable framework conditions for innovation and entrepreneurship result in a poor performance in terms of leveraging ICTs to boost innovation and raise national productivity.
MIDDLE EAST AND NORTH AFRICAThis region boasts one of the most diverse performances in the world. On the one hand, Israel and several Gulf Cooperation Council states have sharply improved their overall performances and have continued their investments to make ICTs one of the key national industries that attempt to diversify and transform their economies. On the other hand, several North African and Levantine nations have either fallen—or stagnated, in the best cases—in their efforts to leverage ICTs as part of their economic and social transformation toward more knowledge-intensive activities and open societies.
Israel, in 15th position, consolidates its regional leadership and climbs five places since last year. Important gains derived from improving its ICT infrastructure by increasing its international Internet bandwidth (39th), coupled with government efforts to expand the number of online services (15th) and online information and participatory tools to raise the citizens’ overall participation (7th), have led to this positive performance. The country continues to boast one of the highest rates of ICT patents (4th), which reflects the importance of the sector in the national economy, and an environment that is highly conducive to innovation and entrepreneurship (15th), despite the lengthy time it still takes to open a business (90th) and to enforce contracts (124th). In order to continue leveraging the full potential of ICTs efficiently, and notwithstanding its high secondary (26th) and tertiary (32th) education enrollments, the country should aim at improving further the quality of the educational system (53rd)—notably in the fields of mathematics and science (89th)—despite certain poles of excellence.
Leading the Arab world, Qatar (23rd) rises five places in the rankings thanks to the government’s sharp effort to expand its offerings of online services (27th) and increase the online participation of citizens (22nd). Moreover, mobile broadband subscriptions have exploded, leaping from 9.6 percent last year (43rd) to 70.3 percent this year (11th). While fixed broadband affordability remains a pending issue (108th)—which may affect the level of broadband Internet subscriptions (62nd)—the overall level of penetration and use of ICTs (16th) is high. That, coupled with the government’s strong vision and its commitment to rapidly develop ICTs (2nd) as a means to diversify its economy, along with its efforts to create a business-friendly environment (12th) to spur entrepreneurship, have resulted in this strong overall assessment. Going forward, in order to translate the existing good ICT uptake into stronger economic impacts (33rd), the country should continue investing
@ 2013 World Economic Forum

Chapter 1.1: The Networked Readiness Index 2013
28 | The Global Information Technology Report 2013
in increasing the level of university enrollment (108th) so it can benefit from a higher local talent pool and strengthen its overall innovation system.
The United Arab Emirates goes up five places to 25th position. As part of the country’s long-term strategy to diversify its economy, the government has continued to drive the development of the ICT industry decisively and to expand the use of ICTs to all segments of the economy and society (1st). Available government online services (9th), as well the online participation of citizens (11th) and the important rise in mobile broadband subscriptions (49th), have driven this rise in the rankings. Overall—despite the high fixed broadband Internet tariffs (99th), which may be affecting the number of broadband Internet subscriptions (52nd)—the country’s investments in increasing its ICT infrastructure, especially in terms of international Internet bandwidth (49th) and skills upgrading (25th), have provided the right conditions for a higher ICT uptake in the past year (23rd). Although the country continues to boast a very favorable business environment (17th) despite its excessive and cumbersome, complex process for enforcing contracts (137th), increasing the economic impacts of ICTs (28th) in terms of more innovation and higher-value-added activities will require higher levels of tertiary education (84th) and a consolidation of efforts to strengthen the national innovation system.
With a fairly stable profile, dropping two positions to 29th place, Bahrain continues to depict a robust performance. That assessment has been slightly affected by the perception of a certain stagnation in terms of the skills development that is crucial to enable the transition of the local economy toward higher-value-added activities. Overall, the strong government leadership for the extensive use and development of ICTs in the country (4th) has allowed a fairly well developed ICT infrastructure (39th), especially in terms of mobile network coverage (1st) and despite a low international Internet bandwidth capacity (73rd). Although the country counts on a fairly sophisticated business environment (14th), boosting the economic impacts derived from ICTs (52nd) will require continued support to strengthen the overall innovation system, especially at the business level, which retains a very low capacity (117th).
Saudi Arabia, in 31st place, goes up three notches in the rankings this year. This rise is driven mainly by a fall in the cost of using ICTs (65th), a strong government effort to expand the amount and quality of available online services (19th), and the creation of an environment in which citizens can increase their participation to support government (22nd). The government’s clear vision of the potential of ICTs to modernize and diversify the local economy (7th) has resulted in a fairly well developed ICT infrastructure (36th) that, together with a business-friendly environment (25th) and despite the still-cumbersome process for starting a business
(102nd), provides the right ingredients for properly leveraging ICT and obtaining significant positive economic (42nd) and social (18th) impacts. Moving forward, skills development—by improving the quality of the educational system, especially for math and science (37th), and by boosting educational enrollment, especially at tertiary level (70th)—should become a priority. This would expand the local pool of talent and contribute to the transition toward a less resource-dependent and more knowledge-intensive economy (59th).
With a score identical to last year, Jordan remains stable in 47th place, leading the group of Levantine states where Lebanon ranks in 94th place, one position up from last year. ICT infrastructure (81st), notably international bandwidth capacity (97th), remains a challenge for Jordan, and despite the efforts to liberalize the market and render access to the existing infrastructure affordable (27th), ICT uptake by individuals (66th) remains low, especially in terms of broadband subscriptions (87th).
Stable at 62nd place, Kuwait continues to lag behind in the region in terms of leveraging ICTs, with low levels of both social (85th) and, especially, economic impacts (125th). Despite a very sharp rise ICT uptake in terms of Internet users (26th) and households with computers (38th), as well as Internet access (44th), the country still suffers from a shortage of skills (71st). This shortage, coupled with a low capacity to innovate (113th) and an environment that is less business friendly (71st) than those of other Gulf Cooperation Council states, result in the low economic impacts.
In North Africa, Egypt boasts the strongest performance in this year’s rankings in 80th place, one notch down from last year. ICT infrastructure (98th) remains underdeveloped, especially in terms of expanding international Internet bandwidth capacity (114th). In spite of strong efforts to render its access affordable (8th), the penetration of ICTs in society is modest (69th) although improving, especially in terms of Internet users (73rd). Strengthening the technological capacity of local firms (86th), upgrading available skills (115th), and creating a more business friendly environment (98th) could result in greater economic impacts (67th) and contribute to stimulating the growth and job opportunities the country needs.
Morocco, at 89th position, moves two notches up in the rankings. At present, the country does not seem to be able to fully leverage ICTs to boost the desired economic (122nd) and social impacts (105th). A low skill base (114th)—the result of a poor educational system (105th), low adult literacy (130th), and low secondary (113th) and tertiary education (103rd) enrollment rates—and a weak innovation capacity (115th) are at the very basis of this inability. In addition, poor infrastructure development (95th), despite being affordable (30th), results in fairly low levels of ICT uptake by individuals
@ 2013 World Economic Forum

The Global Information Technology Report 2013 | 29
Chapter 1.1: The Networked Readiness Index 2013
(67th). Moving forward, addressing these weaknesses will enable the country to benefit more fully from the potential positive impacts that ICT could bring, which would enable it to further modernize its national economy and improve its innovation and competitiveness capacity.
Falling 13 places, Algeria in 131st position continues to display weak leverage of ICT, with one of the lowest economic (143rd) and social (141st) impacts in the sample. A poor ICT infrastructure (119th) coupled with a weak skill base (101th) result in very low levels of ICT usage by all agents (140th), most markedly by businesses (144th). In addition, severe weaknesses in its political and regulatory framework (141st) and the absence of a business- and innovation-friendly environment (143rd) act as strong filters that hinder the capacity of any positive impacts to accrue.
CONCLUSIONSThe world has changed a lot in the 12 years since the first edition of the GITR. The Internet bubble is now a thing of the past, and many developing and emerging economies have become global technological and economic players achieving higher growth than more advanced economies, which continue to struggle to emerge from one of the worst economic crises since the 1930s. At the same time, the world has become increasingly hyperconnected, where the immediateness and a sense of constant accessibility are changing economic and social relations as well as opening a wide range of new opportunities for new products, services, and business models. Unsurprisingly, both developed and developing economies have turned to ICTs as a toolbox that can potentially boost competitiveness, growth, and employment in this rapidly changing and uncertain context. However, the relationships among these objectives are complex and the interplay and co-evolution of the many different factors render it sometimes difficult for stakeholders to understand, measure, and track progress and make decisions.
For more than a decade, the NRI has aimed at shedding light on these relationships with the adoption of a comprehensive framework that analyses the determinants that drive the capacity of societies to benefit from ICts and transform themselves.
Against this backdrop, the analysis of the ICT landscape—thanks to the NRI results—reveals that in the past year, little progress has been made in bridging the new digital divide in terms of benefiting from higher economic and social impacts accruing from ICTs. Emerging and developing economies still trail significantly behind more advanced nations. However, the situation is not homogenous across all regions, with some countries in the Community of Independent States, the Gulf Cooperation Council, and ASEAN recording impressive progress, especially in terms of strengthening their ICT
infrastructure and higher rates of ICT uptake. In other regions, such as Latin America and Africa, progress in improving digital connectivity has been slower. In the large emerging BRICS economies, progress has also been relatively slow, with China dropping in the rankings and with India, the Russian Federation, and Brazil recording only small gains.
Furthermore, large intra-regional differences exist. In Latin America, for example, Panama has rapidly developed its ICT infrastructure and improved its ICT uptake rates. This trend has accentuated the stark intra-regional disparities that appear in virtually all regions and across developed and developing countries. Asia, for example, is home to some of the world’s most successful economies in the digital landscape, while others continue to suffer from profound structural weaknesses and an underdeveloped ICT infrastructure. In Europe, the gap between the most advanced Nordic economies that lead the global rankings and those countries in Southern and Central and Eastern Europe is remarkable—and alarming—despite the many efforts to create an internal digital market and improve the digital connectivity of converging countries. This finding highlights the need to adopt harmonious and comprehensive strategies that do not focus only on improving access to ICTs. While important, access is only one ingredient in the recipe for success. Improving the ecosystem for spurring entrepreneurship and strengthening the conditions that enhance innovation are also crucial to boost competitiveness and well-being, to enhance economic growth, and to create jobs.
Finally, the nonlinear relationship between the digital readiness of a country and its economic and social impacts suggests the existence of increasing returns to ICTs, skills, and innovation investments. In other words, the more that countries invest in ICTs, skill development, and innovation, the proportionally higher returns they achieve. Conversely, the relationship also seems to point to a certain readiness threshold that may hinder the ability of certain countries to achieve any meaningful results if they do not invest sufficiently in these dimensions.
With the GITR series and the NRI, the World Economic Forum provides a comprehensive analytical framework for assessing not only the progress made in raising ICT connectivity in different countries, but also—and more importantly—in obtaining the desired economic and social impacts that higher connectivity can yield in generating growth and high-quality employment in a rapidly changing context. Designed and produced as a framework for multi-stakeholder dialogue, it also serves to identify and define policies and measures that can catalyze change toward better leveraging ICTs and achieve its full potential.
@ 2013 World Economic Forum
Chapter 1.1: The Networked Readiness Index 2013
30 | The Global Information Technology Report 2013
NOTES 1 Jipp 1963.
2 Katz 2012, p. 2.
3 Katz 2012, p. 3.
4 For detailed information of the Forum’s Executive Opinion Survey, including the instrument, coverage administration, data edition, and score computation, refer to the dedicated chapter in The Global Competitiveness Report 2012–2013, available at www.weforum.org/gcr.
5 The assessment of Taiwan’s networked readiness is based on partial data because a number of international organizations provide only limited data.
6 See World Economic Forum 2012.
7 See the European Commission’s Digital Agenda, available at http://ec.europa.eu/digital-agenda/.
8 The assessment of Hong Kong’s networked readiness is based on partial data because of its limited coverage by a number of international organizations.
9 BRICS economies is a term used to refer to a group of five large emerging economies: Brazil, the Russian Federation, India, China, and South Africa.
10 See http://www.summit-americas.org/default_en.htm.
REFERENCESEuropean Commission. Digital Agenda for Europe: A Europe 2020
Initiative. Available at http://ec.europa.eu/digital-agenda/.
ITU (International Telecommunication Union). 2012. World Telecomunication/ICT Indicators Database (December 2012 edition.) Available at http://www.itu.int/ITU-D/ict/publications/world/world.html.
Jipp, A. 1963. “Wealth of Nations and Telephone Density.” Telecommunications Journal (July): 199–201.
Katz, R. 2012. The Impact of Broadband on the Economy: Research to Date and Policy Issues. ITU Broadband Series, April. Geneva: ITU. Available at http://www.itu.int/ITU-D/treg/broadband/ITU-BB-Reports_Impact-of-Broadband-on-the-Economy.pdf.
World Economic Forum. 2012. The Global Competitiveness Report 2012–2013. Geneva: World Economic Forum. Available at www.weforum.org/gcr.
@ 2013 World Economic Forum

The Global Information Technology Report 2013 | 31
This appendix presents the structure of the Networked Readiness Index 2013 (NRI). As explained in the chapter, the NRI framework separates environmental factors from ICT readiness, usage, and impact. That distinction is reflected in the NRI structure, which comprises four subindexes. Each subindex is in turn divided into a number of pillars, for a total of 10. The 54 individual indicators used in the computation of the NRI are distributed among the 10 pillars.
In the list below, the number preceding the period indicates the pillar to which the variable belongs (e.g., indicator 2.05 belongs to the 2nd pillar; indicator 8.03 belongs to the 8th pillar). The numbering of the indicators matches the numbering of the data tables at the end of the Report.
The computation of the NRI is based on successive aggregations of scores, from the indicator level (i.e., the most disaggregated level) to the overall NRI score (i.e., the highest level). Unless noted otherwise, we use an arithmetic mean to aggregate individual indicators within each pillar and also for higher aggregation levels (i.e., pillars and subindexes).a
Throughout the Report, scores in the various dimensions of the NRI pillars are reported with a precision of two decimal points. However, exact figures are always used at every step of the computation of the NRI.
Variables that are derived from the World Economic Forum’s Executive Opinion Survey (the Survey) are identified here by an asterisk (*). All the other indicators come from external sources, as described in the Technical Notes and Sources section at the end of the Report. These variables are transformed into a 1-to-7 scale in order to align them with the Survey’s results. We apply a min-max transformation, which preserves the order of, and the relative distance between, scores.b
NETWORKED READINESS INDEX 2013
Networked Readiness Index = 1/4 Environment subindex + 1/4 Readiness subindex + 1/4 Usage subindex + 1/4 Impact subindex
ENVIRONMENT SUBINDEX
Environment subindex = 1/2 Political and regulatory environment + 1/2 Business and innovation environment
1st pillar: Political and regulatory environment1.01 Effectiveness of law-making bodies*1.02 Laws relating to ICTs*1.03 Judicial independence*1.04 Efficiency of legal system in settling disputes*c
1.05 Efficiency of legal system in challenging regulations*c
1.06 Intellectual property protection*1.07 Software piracy rate, % software installed1.08 Number of procedures to enforce a contractd
1.09 Number of days to enforce a contractd
2nd pillar: Business and innovation environment2.01 Availability of latest technologies*2.02 Venture capital availability*2.03 Total tax rate, % profits2.04 Number of days to start a businesse
2.05 Number of procedures to start a businesse
2.06 Intensity of local competition*2.07 Tertiary education gross enrollment rate, %2.08 Quality of management schools*2.09 Government procurement of advanced technology
products*
Appendix A: Structure and computation of the Networked Readiness Index 2013
@ 2013 World Economic Forum

1.1: The Networked Readiness Index 2013
32 | The Global Information Technology Report 2013
READINESS SUBINDEX
Readiness subindex = 1/3 Infrastructure and digital content + 1/3 Affordability + 1/3 Skills
3rd pillar: Infrastructure and digital content3.01 Electricity production, kWh/capita3.02 Mobile network coverage, % population3.03 International Internet bandwidth, kb/s per user3.04 Secure Internet servers per million population3.05 Accessibility of digital content*
4th pillar: Affordabilityf
4.01 Mobile cellular tariffs, PPP $/min.4.02 Fixed broadband Internet tariffs, PPP $/month4.03 Internet and telephony sectors competition index, 0–2
(best)
5th pillar: Skills5.01 Quality of educational system*5.02 Quality of math and science education*5.03 Secondary education gross enrollment rate, %5.04 Adult literacy rate, %
USAGE SUBINDEX
Usage subindex = 1/3 Individual usage + 1/3 Business usage + 1/3 Government usage
6th pillar: Individual usage6.01 Mobile phone subscriptions per 100 population6.02 Percentage of individuals using the Internet 6.03 Percentage of households with computer6.04 Households with Internet access, %6.05 Fixed broadband Internet subscriptions per 100
population6.06 Mobile broadband Internet subscriptions per 100
population6.07 Use of virtual social networks*
7th pillar: Business usage7.01 Firm-level technology absorption*7.02 Capacity for innovation*7.03 PCT patent applications per million population7.04 Business-to-business Internet use*g
7.05 Business-to-consumer Internet use*g
7.06 Extent of staff training*
8th pillar: Government usage8.01 Importance of ICTs to government vision of the future*8.02 Government Online Service Index, 0–1 (best)8.03 Government success in ICT promotion*
IMPACT SUBINDEX
Impact subindex = 1/2 Economic impacts + 1/2 Social impacts
9th pillar: Economic impacts9.01 Impact of ICTs on new services and products*9.02 PCT ICT patent applications per million population9.03 Impact of ICTs on new organizational models*9.04 Employment in knowledge-intensive activities, %
workforce
10th pillar: Social impacts10.01 Impact of ICTs on access to basic services*10.02 Internet access in schools*10.03 ICT use and government efficiency*10.04 E-Participation Index, 0–1 (best)
NOTES a Formally, for a category i composed of K indicators, we have:
When two individual indicators are averaged (e.g., indicators 1.04) and 1.05 in the 1st pillar), each receives half the weight of a normal indicator.
b Formally, we have:
6 x country score – sample minimum
+ 1 ( sample maximum – sample minimum ) The sample minimum and sample maximum are, respectively, the
lowest and highest country scores in the sample of economies covered by the GCI. In some instances, adjustments were made to account for extreme outliers. For those indicators for which a higher value indicates a worse outcome (i.e., indicators 1.07, 1.08, 1.09, 2.03, 2.04, 2.05, 4.01, and 4.02), the transformation formula takes the following form, thus ensuring that 1 and 7 still corresponds to the worst and best possible outcomes, respectively:
– 6 x country score – sample minimum
+ 7 ( sample maximum – sample minimum ) c For indicators 1.04 and 1.05, the average of the respective scores
is used in the computation of the NRI.
d For indicators 1.08 and 1.09, the average of the respective normalized scores is used in the computation of the NRI.
e For indicators 2.04 and 2.05, the average of the respective normalized scores is used in the computation of the NRI.
categoryiK
�k=1
indicatorkK
�
@ 2013 World Economic Forum

The Global Information Technology Report 2013 | 33
1.1: The Networked Readiness Index 2013
f The affordability pillar is computed as follows: the average of the normalized scores of indicators 4.01 mobile cellular tariffs and 4.02 Fixed broadband Internet tariffs is multiplied by a competition factor, the value of which is derived from indicator 4.03 Internet and telephony sectors competition index. It corresponds to the score achieved by an economy on this indicator normalized on a scale from 0.75 (worst) to 1.00 (best), using the min-max transformation described above. A normalized score of 0.75 is assigned to an economy with a competition index score of 0, which means that a monopolistic situation prevails in the 19 categories of ICT services considered. A normalized score of 1.00 is assigned to an economy where all 19 categories are fully liberalized. Where data are missing for indicator 4.03 (i.e., Puerto Rico and Timor-Leste), the score on the affordability pillar, which is simply the average of the normalized scores of indicators 4.01 and 4.02, is used. For example, Tanzania obtains a score of 1.00 on the competition index. This translates into a competition factor of 0.875, which multiplies 2.944, corresponding to the average of Tanzania’s normalized scores on the two tariff measures. Tanzania’s score on the affordability pillar therefore is 2.576 (130th). The competition index score for Taiwan, China, was derived from national sources.
g For indicators 7.04 and 7.05, the average of the respective scores is used in the computation of the NRI. For Albania, Ecuador, Georgia, Rwanda, and Sri Lanka, these two indicators are replaced by an indicator derived from the 2010 and 2011 editions of the Executive Opinion Survey. The associated question was: “To what extent do companies in your country use the Internet for their business activities? (e.g., buying and selling goods, interacting with customers and suppliers) [1 = not at all; 7 = extensively].” Results for these countries are presented in The Global Information Technology Report 2012 (p.371) available at www.weforum.org/gitr.
@ 2013 World Economic Forum

@ 2013 World Economic Forum

The Global Information Technology Report 2013 | 35
CHAPTER 1.2
Digitization for Economic Growth and Job Creation: Regional and Industry Perspectives
KARIM SABBAGH
ROMAN FRIEDRICH
BAHJAT EL-DARWICHE
MILIND SINGH
ALEX KOSTER
Booz & Company
Digitization—the mass adoption of connected digital services by consumers, enterprises, and governments—has emerged in recent years as a key economic driver that accelerates growth and facilitates job creation. In the current environment of a sluggish global economy, digitization can play an important role in assisting policymakers to spur economic growth and employment. Booz & Company’s econometric analysis estimates that, despite the unfavorable global economic climate, digitization provided a US$193 billion boost to world economic output and created 6 million jobs globally in 2011.1
However, the impact of digitization by country and by sector is uneven. Developed economies enjoy higher economic growth benefits by a factor of almost 25 percent, although they tend to lag behind emerging economies in job creation by a similar margin. The main reason for the differing effects of digitization is the economic structures of developed and emerging economies. Developed countries rely chiefly on domestic consumption, which makes nontradable sectors important. Across developed economies, digitization improves productivity and has a measurable effect on growth. However, the result can be job losses because lower-skill, lower-value-added work is sent abroad to emerging markets, where labor is cheaper. By contrast, emerging markets are more export-oriented and driven by tradable sectors. They tend to gain more from digitization’s effect on employment than from its influence on growth.
Policymakers can harness these varying effects of digitization through three main measures, which go beyond their current roles of setting policy and regulations. First, they should create digitization plans for targeted sectors in which they wish to maximize the impact of digitization. Second, they should encourage the development of the necessary capabilities and enablers to achieve these digitization plans. Finally, policymakers should work in concert with industry, consumers, and government agencies to establish an inclusive information and communication technologies (ICT) ecosystem that encourages greater uptake and usage of digital services.
DIGITIZATION’S ECONOMIC IMPACTThroughout the world, ICTs continue to proliferate at breakneck speed, but their effects are uneven across countries and sectors. In late 2011, the number of mobile telephones in the United States exceeded the country’s population. By early 2012, the number of mobile lines worldwide was more than 6 billion—nearly as many
The authors wish to thank the following for their contributions to this chapter: Raul Katz, Columbia Business School; Pantelis Koutroumpis, Imperial College, London; and Rawia Abdel Samad, Oussama Ahmad, and Sandeep Ganediwalla of Booz & Company.
@ 2013 World Economic Forum

1.2: Digitization for Economic Growth and Job Creation
36 | The Global Information Technology Report 2013
economy and 6 million jobs worldwide in 2011. The most advanced economies (North America and Western Europe) accounted for approximately 29 percent of the output gain, but just 6 percent of the employment impact. Emerging economies accounted for 71 percent of the gain in gross domestic product (GDP) and 94 percent of the global employment impact (Table 1).
Impact on GDP per capitaOur analysis reveals that an increase of 10 percent in a country’s digitization score fuels a 0.75 percent growth in its GDP per capita. As an economic accelerant, digitization therefore is 4.7 times more powerful than the 0.16 percent average impact of broadband deployment on per capita GDP, according to several previous studies.2 Additionally, the economic effect of digitization accelerates as countries move to more advanced stages of digitization. Digitally constrained economies receive the least benefit, largely because they have yet to establish an ICT ecosystem that can capitalize on the benefits of digitization.
In 2011, East Asia, Western Europe, and Latin America received the greatest total GDP per capita impact from digitization, surpassing North America. The impact of digitization improvements in East Asia and Latin America was higher than that in North America and Western Europe, even though these regions have lower GDP impact coefficients. This is because the economies in East Asia and Latin America are still at the transitional stage and were able to achieve the biggest digitization leaps. Eastern Europe and Africa benefited the least from their digitization gains in terms of their impact on GDP.
Impact on unemploymentDigitization creates jobs, with a 10 point increase in the digitization score leading to a 1.02 percent drop in the unemployment rate. This is 4.6 times greater than the effect that the widespread adoption of broadband has on reducing unemployment; broadband cuts the unemployment rate by just 0.22 percent.3
In 2011, digitization had the greatest employment effect in constrained and emerging digitized economies. East Asia, South Asia, and Latin America received the most employment growth of all regions, with more than 4 million jobs created as a result of these regions’ digitization improvements. Conversely, digitization provided little employment growth in North America and Western Europe. These advanced-stage economies probably realize fewer employment benefits because, as their digitization increases, their productivity improves; some jobs get replaced by technology; and lower-value-added, labor-intensive tasks go overseas to emerging markets where labor is cheaper.
By contrast, digitization has more significant employment effects in emerging markets for three main reasons. First, the digitization gain in some
as the global population of around 7 billion. Internet penetration is not as deep, but with global Internet access growing more than fivefold in recent years, and with increases of more than 20-fold during the past decade in regions such as the Middle East and Africa, a similar ubiquity may not be far off.
Access to ICT services is no longer the primary issue facing policymakers. Instead, the critical question is how to maximize the adoption, utilization, and impact of these services. Digitization has emerged as a key driver and enabler of socioeconomic benefits.
In 2012, Booz & Company set out to quantify the impact of digitization by creating an index that scores digitization by country (Box 1). This analysis allows us to go beyond anecdotal evidence of the effect of digitization to measure its level and the actual impact it has on economic and social factors. The research highlights the notion that countries that have increased their digitization level have realized gains in their economies, their societies, and the functioning of their public sectors. Indeed, the more advanced a country becomes in terms of digitization, the greater the benefits—increased digitization yields improving returns. These effects are not evenly distributed by the level of economic development or by the sector.
The ability of digitization to boost output and employment has measurable global effects. Digitization has provided an additional US$193 billion to the world
Box 1: Measuring digitization
Booz & Company’s Digitization Index is a composite score that calculates the level of a country’s digitization using 23 indicators to measure the following six key attributes:
• Ubiquity: The extent to which consumers and enter-prises have universal access to digital services and applications.
• Affordability: The extent to which digital services are priced in a range that makes them available to as many people as possible.
• Reliability: The quality of available digital services.
• Speed: The extent to which digital services can be accessed in real time.
• Usability: The ease of use of digital services and the ability of local ecosystems to boost the adoption of these services.
• Skill: The ability of users to incorporate digital services into their lives and businesses.
The Digitization Index measures a country’s level of digitization on a scale of 0 to 100, with 100 signifying the most advanced, to identify its distinct stage of digital development: constrained, emerging, transitional, or advanced.
Source: Sabbagh et al., 2012.
@ 2013 World Economic Forum

The Global Information Technology Report 2013 | 37
1.2: Digitization for Economic Growth and Job Creation
emerging regions is higher than it is in the advanced economies. Second, some of these regions have very large populations (e.g., China and India), which means that a marginal improvement in the unemployment rate leads to a large number of jobs. Finally, offshoring grows in tandem with digitization. As companies in digitally advanced countries improve their productivity thanks to digitization, they transfer jobs to digitally emerging countries.
DIGITIZATION’S SECTORAL IMPACTTo understand the marked differences in impact that digitization has in terms of productivity and job creation across emerging and developed economies, we first need to understand how digitization affects the functioning of any enterprise. A typical company’s functions can be broken down into four areas: business, go-to-market, production, and operations. Digitization has a profound and accelerating impact across these strategies.
• Business: Digitization is fundamentally reshaping business models. It is lowering barriers to entry and expanding market reach for enterprises. For example, it is possible for Skype to provide telephony to more than 500 million users globally using voice over Internet protocol (VoIP) technology, fundamentally disrupting business models for operators worldwide and forcing many to launch their own VoIP business models in response.
• Go-to-market: Digitization is changing how companies build brands and products, communicate, and provide services to their customers. Companies are increasingly relying on social media to build brands. More and more, subscribers are forming their purchase opinions online, even for items that they then buy offline. Close to 40 percent of those online actually use the web to research items that they buy in physical outlets. Digitization is also enabling companies to create products tailored to customers’ tastes. For example, BMW offers a build-your-own-BMW online service, which allows for more than a million different combinations in the finished product. The role of the web as a retail channel is causing substantial disruptions, with companies significantly expanding market reach, leading to the emergence of new winners and losers. Starting from roughly the same position in 2001, Amazon.com grew its annual sales from US$3.1 billion to US$48 billion in 2011, while the brick-and-mortar retailer Borders lost market share and ultimately filed for bankruptcy.
• Production: Digitization is also changing the way companies manage their production assets. It
has enabled companies to move labor-intensive tasks to emerging economies while competing to develop the best design and user interface. For example, Samsung acts as a supplier to Apple for its iPhone products, but both compete aggressively in the consumer market by trying to differentiate themselves in their design and user interface. Digitization is also leading to the emergence of new manufacturing technologies, with the advent of 3-D printing creating a new way to manufacture complex products and leading to the import of jobs back to developed economies.
• Operations: Finally, digitization has had the greatest impact on the way companies organize and operate to generate competitive advantage. Digitization has created more global entities, seamlessly in touch across continents, and has redefined the concept of office space. One in four American workers regularly telecommutes, a fact that has a profound impact on how companies organize and manage resources. Digitization is also allowing companies to outsource or completely automate a number of their back-end functions, enabling them to become more efficient.
The type and extent of the impact that digitization has on a sector of the economy is determined mainly by the interaction of the four areas outlined above. For example, if digitization significantly enhances market access, then job growth will be more likely in that sector. However, if digitization primarily drives efficiency growth but does not lead to new market creation, then that sector is likely to lose jobs.
To better understand these dynamics, we examined five key economic activities in developed markets that would yield conclusions that can guide policy responses. We identified these five areas by initially dividing the overall economy into three major sectors: primary, secondary, and tertiary.4 The primary sector relates to agriculture, farming, and mining—the extraction, collection, and primary processing of natural materials.
Table 1: Digitization’s impact on GDP and jobs, 2011
Regional impact
GDP impact Number of Region (US$ billions) jobs created
Africa 8.3 618,699Commonwealth of Independent States 11.8 340,820East Asia and the Pacific 55.8 2,370,241Eastern Europe 7.0 159,015Latin America and the Caribbean 27.0 636,737Middle East and North Africa 16.5 377,772North America 25.3 167,650South Asia 9.4 1,117,753Western Europe 31.5 213,578
Total 192.6 6,002,266
Source: Booz & Company analysis.
@ 2013 World Economic Forum

1.2: Digitization for Economic Growth and Job Creation
38 | The Global Information Technology Report 2013
The secondary sector encompasses manufacturing—the making, building, and assembling of finished products. The tertiary sector provides services to consumers and businesses and includes retailers, transportation and entertainment companies, banks, and healthcare providers.
We focused our analysis on subsectors in the secondary and tertiary sectors, where activities affected by digitization tend to cluster—financial services, manufacturing, retail, and hospitality (digitization has less effect on the primary sector). We also looked at the impact on the overall services sector. We looked at these subsectors in six advanced-digitization countries—which are also developed economies and members of the Organisation for Economic Co-operation and Development (OECD)—Australia, Germany, Norway, Sweden, the United Kingdom, and the United States. Our econometric analysis used three industry metrics: output, productivity, and employment. Output measures the subsector’s contribution to GDP. Productivity determines the subsector’s level of value-added per employee. Employment tracks the number of workers in each subsector.
This analysis allows an understanding of how the positive national effect of digitization plays out differently in economic subsectors. For example, we estimate that, in Germany, approximately 8.7 percent of the rate of change in GDP between 2010 and 2011 is attributable to advances in digitization. Its contribution to employment was lower: 7.7 percent of the jobs
added in Germany between 2010 and 2011 came from increased digitization. There is a clear relationship between productivity gains and job losses, as shown by the results for financial services and manufacturing. By contrast, other subsectors increased employment and output, although their productivity grew at a slower pace (Figure 1).
As digitization increases, financial services gain the most in terms of output and productivity. Increased digitization, however, cut jobs in financial services and manufacturing because productivity gains surpassed output gains. Conversely, digitization created jobs in services subsectors, with particularly notable gains in the hospitality and retail subsectors.
Although there are insufficient data to study how digitization leads to job creation in certain sectors in emerging markets, evidence from two closely knit economies—the United States and Mexico—illustrates the overall trend (Figure 1b). Financial services and manufacturing businesses in the Unites States shed jobs because they were able to transfer labor-intensive or support activities to Mexico, where labor costs are lower. Companies took advantage of offshoring for operations, logistics, customer care, legal, and communications services. The productivity gains in financial services and manufacturing were a result of this ability to decrease labor costs while increasing output. The net result was a 6 percent decline in the number of jobs in the US tradable sectors between 2002 and 2009 and a
Figure 1: Digitization impact on output, productivity, and employment
Source: Booz & Company.Notes: Services refers to overall services other than financial services. Data for 1a are from six OECD countries: Australia, Germany, Norway, Sweden, the United Kingdom, and the United States.
These data are based on a 10 percent increase in digitization.
SectorIndustry output
(% growth)
Industry productivity (% growth)
Industry employment
(implied) SectorUnited States
(% growth)Mexico
(% growth)
Financial
servicet
Financial
service–3 16
Manufacturing t Manufacturing –5 2
Retail s Retail 2 5
Services s Services 2 7
Hospitality s Hospitality 2 13Hospitality
Services
Retail
Manufacturing
Financialservice 1.98
1.52
1.27
1.34
1.19
2.82
0.41
1.00
0.71
1.79
1a: Impact by industry, developed markets 1b: Employment growth by industry, closely knit economies (2006–08)
@ 2013 World Economic Forum

The Global Information Technology Report 2013 | 39
1.2: Digitization for Economic Growth and Job Creation
concomitant 15.2 percent increase of employment in tradable sectors in Mexico during the same years.5
The effect on retail—rising employment with some output and productivity growth—demonstrates how a proper measurement of digitization is superior to anecdotal evidence. A superficial look indicates that small retailers are closing because of online shopping. Instead, advancing digitization in retail actually creates new markets and new employment opportunities. Retailers are expanding internationally. As their reach spreads, their supply chains become more complex and require more people to manage them. The impact on the hospitality industry is similar, with new business models emerging and new markets created. Digitization allows for improved inventory management and higher occupancy rates, both of which are useful when dealing with nonfungible items such as airline seats or hotel rooms.
The extent of productivity gains experienced by the subsectors is also highly correlated to the extent of digitization seen in these sectors. In Booz & Company’s 2011 publication, Measuring Industry Digitization: Leaders and Laggards in the Digital Economy, we established that the most digitized sector is financial services, followed by manufacturing, retail, and hospitality.6 Productivity impact in these sectors follows the same order, with financial services leading the pack and hospitality benefitting the least from the sectors covered.
POLICY IMPLICATIONSAs the spread and depth of digitization increases globally, so do its roles as a key driver of growth and as a source of national competitive advantage. Policymakers have focused until now on improving the reach and affordability of ICT services—most recently facilitating, and even investing in, large-scale broadband deployment. Though important, this is just one part of the story. Policymakers in the future need to become digital market makers—creators of a digital economy that provides its citizens, enterprises, and economic sectors with the competitive advantage essential to thrive in an increasingly global market.
Becoming a digital market maker requires policymakers to undertake three activities: designing sector digitization plans, building capabilities, and jump-starting and monitoring the wider digitization ecosystem (Figure 2). In designing sector digitization plans, policymakers should seek to develop competitive advantage and generate jobs in sectors that are already critical to the national economy. Policymakers should then foster the development of capabilities and enablers necessary to achieve these digitization plans. Finally, policymakers should work in concert with industry, consumers, and government agencies to jump-start and continuously monitor an inclusive digitization ecosystem that will encourage the uptake of digital applications in these sectors and that will keep them competitive.
Figure 2: Sector digitization plans and capability design needs: Digital market makers’ approach
Source: Booz & Company.
National vision
PRIORITY SECTORS
TRADE-OFFS
Right-to-win capabilities
Retail Hospitality
Financial Healthcare
Manufacturing Others
Job creation
Productivitygain
CAPABILITIES
Capital
ENABLERS
Infrastructure
Skills
Development Facilitation
Financing
Governance
Prioritized sectors
Capabilities
Impact Demand
ICT Sector
Design sector digitization plans Build capabilities and enablers Jump-start and monitor ecosystem
@ 2013 World Economic Forum

1.2: Digitization for Economic Growth and Job Creation
40 | The Global Information Technology Report 2013
Design sector digitization plansThe rapidly accelerating pace of digitization means that policymakers are not in a position to be able to spread their efforts across all sectors. First they must determine which sectors will provide, or are providing, national competitive advantage and decide how digitization can reinforce these trends. Second, they need to explicitly understand the trade-offs between job creation and productivity growth that increasing digitization will bring. For example, accelerating digitization in manufacturing in most OECD countries will lead to significant productivity gains, but also job losses. Finally, policymakers need to work closely with national leaders to identify and understand these trade-offs up front, and then work on mechanisms to offset potential job losses.
For example, Singapore’s digitization agenda seeks to increase competitiveness in targeted sectors while promoting social welfare. In particular, ports play a vital role in this export-driven island economy. The Infocomm Development Authority of Singapore and the Maritime and Port Authority of Singapore (MPA) have therefore jointly launched WISEPORT, the world’s first port WiMax (a fast wireless standard) network that provides coverage within 15 kilometers of the southern coastline. In addition, the MPA has established a fund that encourages maritime technology, resulting in digital initiatives such as the intelligent bunker management system and SingTel AlTrac, a secure global satellite tracking system, built by the incumbent operator SingTel.
Build capabilitiesBecoming a digital market maker requires policymakers first to adopt a holistic ecosystem perspective. ICTs range beyond basic infrastructure, and policymakers need to look at a multilayered ICT ecosystem categorized in 42 buckets to understand what role they need to play in each to enable creation of digital markets (Figure 3).
Where the private sector does not have sufficient incentive to undertake the development of critical digital infrastructure, the state needs to play the role of a developer, becoming a participant in the market—either directly or through a public-private partnership. Finland, for example, has developed the VTT Technical Research Centre, which provides multidisciplinary research and development services to both the public and private sectors. In another case, Malaysia has launched the MyHealth initiative, which allows online provision of a range of healthcare services to the nation’s population.
Where there are opportunities for the private sector but the risks are high or the returns are not guaranteed, the state can play the role of financier. Examples include Australia’s Digital Enterprise initiative, which seeks to increase digital participation by small- and medium-sized enterprises and civil society organizations.
If there are opportunities and the private sector is undertaking the necessary activities, the state can play the role of a facilitator—a role with functions that range from being a regulator to being a demand stimulator of digital services. Examples here include the training programs launched by telecommunications authorities in Japan and the Republic of Korea.
Choosing which role to play and finding the right partnerships for executing that role represent a new set of capability challenges for policymakers. Building a digital market would require them to master all three capabilities and then identify, in a targeted manner, which roles they will play and in which sectors.
Finally, the ability to play these roles will be influenced by the presence (or absence) of basic enablers in the economy: capital, access to cutting-edge thinking, and digital infrastructure. Policymakers need to ensure the development of world-class research bodies; the availability of seed and venture capital; and the development of reliable, high-quality infrastructure. For example, Saudi Arabia is trying to develop world-class research institutes in the King Abdullah University of Science and Technology, while also setting up an incubator in the King Abdulaziz City for Science and Technology and working with operators to ensure the availability of high-speed digital infrastructure. Another example is Germany’s ICT 2020 plan, which provides funding to small- and medium-sized businesses engaged in research and development activities within the ICT sector.7
Jump-start and monitor the wider digitization ecosystemThe challenge for all stakeholders has been to monitor the execution and the impact of the digital ecosystem. Investing in digitization requires more than a leap of faith; it necessitates that policymakers measure, track, and demonstrate conclusively the significant impact of every dollar that is invested in digitization. This is especially critical now, when most countries in the developed world are gripped by fiscal austerity measures. A partnership that includes institutions such as the International Telecommunication Union, the United Nations, the OECD, Eurostat, and the World Bank has defined a list of 48 core ICT indicators in an attempt to harmonize tracking at a global level.8
Policymakers need to institutionalize systems to measure and monitor the progress of ICTs, and monitor the progress of digitization against those plans, while creating accountability for their digitization targets. This is a challenging process for two reasons. First, monitoring the progress of a national plan takes years and requires balancing social and economic interests. Policymakers need to ensure that government leaders fully understand and endorse the measurements, goals, and trade-offs between these interests. Second, there is currently
@ 2013 World Economic Forum

The Global Information Technology Report 2013 | 41
1.2: Digitization for Economic Growth and Job Creation
Figure 3: A holistic ecosystem perspective
Layer 1 Layer 2 Layer 3
Layer 3 Layer 4
Source: Booz & Company.Note: ISP = Internet service provider; M2M = machine to machine; MVNO = mobile virtual network operator; RFID = radio-frequency identification. * Wireless support services include operations and maintenance, and data clearing.
Information technology
Services
Software
Digital media
Hardware
Managed services
Integration services
Support services
Online services
Software development
Digital content
End-user equipment
IT equipment
Hardware components
Communication
Service provision
Network equipment
(hardware & proprietary software)
WIreless
Wireline
Interconnection
WIreless
Wireline
Interconnection
Managed services
Integration services
Support services
Online services
Software development
Digital content
End-user equipment
IT equipment
Hardware components
WIreless
Wireline
Interconnection
WIreless
Wireline
Interconnection
Application management services Hosting infrastructure services Research & development
Wireline operators ISPs Support services
Maintenance & support IT consulting ICT education & training
Content creation Content aggregation Content distribution
Systems integration Product assembly
Cable Satellite
Data center equipment (servers, storage, etc.) Network equipment (routers, hubs, switches, etc.)
PCs & peripherals Laptops Tablets Handheld devices Multimedia devices
Wireless network equipment
Online platforms
Wireline network equipment
Terrestrial Submarine Satellite Support services
Packaged applications Gaming Customized applications Systems software
Semiconductor devices Electronic components Microprocessor devices Sensors (RFIDs, M2M,etc.)
Wireless operators MVNOs Support services* Tower companies
@ 2013 World Economic Forum

1.2: Digitization for Economic Growth and Job Creation
42 | The Global Information Technology Report 2013
no standard, replicable tool to measure digitization on which policymakers, economists, and private-sector stakeholders agree. Policymakers need to invest the time and effort required to ensure that all sector participants agree to a consistent set of metrics.
CONCLUSIONEver since Adam Smith proposed the theory of absolute advantage enjoyed by a country in producing a good or service, policymakers have sought to build and maintain this advantage in key sectors of their economies. Digitization is emerging as a new tool to build and sustain such absolute advantages, and in some cases even to claim the “right to win” and beat the competition in certain sectors—a critical capability that underpins all other national economic efforts.
Creating digital markets and boosting digitization can yield significant economic benefits and lead to substantial social benefits to societies and communities. Digitization has the potential to boost productivity, create new jobs, and enhance the quality of life for society at large. For example, if emerging markets could double the Digitization Index score for their poorest citizens over the next 10 years, the result would be a global US$4.4 trillion gain in nominal GDP, an extra US$930 billion in the cumulative household income for the poorest, and 64 million new jobs for today’s socially and economically most marginal groups. This would enable 580 million people to climb above the poverty line.9
If policymakers want to capture these rich returns, then they need to go back to the drawing board and figure out how they can build their digital markets—the markets where the bulk of the world’s information and goods will be bought and sold in the upcoming decade of digitization.
NOTES 1 Booz & Company analysis. We have estimated the GDP and
employment impact caused by the increased digitization in most countries and aggregated to get the global impact.
2 Koutroumpis 2009; Katz and Koutroumpis 2012; Katz et al. 2010.
3 Koutroumpis 2009; Katz and Koutroumpis 2012; Katz et al. 2010.
4 For an explanation of these three sectors, see The Times 100 Business Case Studies, available at http://businesscasestudies.co.uk/business-theory/strategy/primary-secondary-and-tertiary-activity.html#axzz2EifjmtUr.
5 OECD.Stat; http://stats.oecd.org/.
6 Friedrich et al. 2011.
7 BMBF 2007.
8 For more on the core list of indicators, see http://www.itu.int/ITU-D/ict/coreindicators/index.html.
9 El-Darwiche et al. 2012.
REFERENCESBMBF (Federal Ministry of Education and Research). 2007. ICT 2020:
Research for Innovations. Berlin: Federal Ministry of Education and Research (BMBF). Available at http://www.bmbf.de/pub/ict_2020.pdf.
El-Darwiche, B., A. Sharma, M. Singh, and R. Abdel Samad. 2012. Digitization in Emerging Economies: Unleashing Opportunities at the Bottom of the Pyramid. Beirut: Booz & Company. Available at http://www.booz.com/media/uploads/BoozCo_Digitization-in-Emerging-Economies.pdf.
Friedrich, R., F. Gröne, A. Koster, and M. Le Merle. 2011. Measuring Industry Digitization: Leaders and Laggards in the Digital Economy. Düsseldorf: Booz & Company. Available at http://www.booz.com/media/uploads/BoozCo-Measuring-Industry-Digitization-Leaders-Laggards-Digital-Economy.pdf.
Katz, R., and P. Koutroumpis. 2012. “Measuring Socio-Economic Digitization: A Paradigm Shift,” Social Science Research Network. Available at http://papers.ssrn.com/sol3/papers.cfm?abstract_id=2070035.
Katz, R., S. Vaterlaus, P. Zenhäusern, and S. Suter. 2010. “The Impact of Broadband on Jobs and the German Economy.” Intereconomics 45 (1): 26–34. Available at http://www.intereconomics.eu/downloads/getfile.php?id=721&human=1.
Koutroumpis, P. 2009. “The Economic Impact of Broadband on Growth: A Simultaneous Approach.” Telecommunications Policy 33 (9): 471–85. Available at http://www.sciencedirect.com/science/article/pii/S0308596109000767.
OECD (Organisation for Economic Co-operation and Development). OECD.StatExtracts (database). Available at http://stats.oecd.org/.
Sabbagh, K., R. Friedrich, B. El-Darwiche, and M. Singh. 2012. Maximizing the Impact of Digitization. Beirut: Booz & Company. Available at http://www.booz.com/media/uploads/BoozCo_Maximizing-the-Impact-of-Digitization.pdf.
@ 2013 World Economic Forum

The Global Information Technology Report 2013 | 43
CHAPTER 1.3
Convergent Objectives, Divergent Strategies: A Taxonomy of National Broadband and ICT Plans
ROBERT PEPPER
JOHN GARRITY
Cisco Systems
High-speed broadband Internet Protocol (IP) networks have become integral to daily life. As one of the few general-purpose technologies, broadband is becoming increasingly pervasive, continually improving and catalyzing new inventions and innovations.1
At the national level, governments have recognized broadband’s significant contribution to economic performance as well as social development. The UN Broadband Commission estimates that 119 countries have implemented broadband policies; during the global economic crisis of 2008 and 2009, at least a dozen countries included broadband network investment in their countercyclical fiscal stimulus measures.2
However, the surge in formal broadband policies highlights the variation in action across countries. A critical question now is whether the divergence in policy packages will result in significant differences in the efficacy of plans. To begin this research and establish a foundation for understanding the global landscape of national broadband and information and communication technology (ICT) plans, this chapter reviews plans around the world and presents a taxonomy for classification. First, we detail the existing relationship among broadband, economic growth, and employment. Second, we analyze a cross-section of national plans, considering their objectives and policy components. We then propose a taxonomy examining the degree of broadband supply- and demand-side emphasis. This taxonomy establishes a common language that can guide governments through the development of national broadband plans; it also can serve as a baseline for evaluating the factors of success for implemented plans.
BROADBAND ADOPTION AND ECONOMIC IMPACTSBroadband adoption encompasses the expansion of broadband availability as well as the use of devices, applications, content, and services that leverage high-speed IP communications. Government policies can impact all facets of adoption. Countries that do not consider the need to make progress on broadband risk significant loss of competitiveness.
The rationale for increasing broadband adoption, through both expanding infrastructure and increasing broadband usage, is based on both short- and long-term impacts. In the short term, the construction of high-speed networks stimulates local economies by immediately employing labor and purchasing materials. Several studies have identified short-term employment effects stemming from (1) direct labor employed to build broadband infrastructure and (2) indirect and induced jobs that are created by suppliers and services supporting the construction activity. One review of six studies that estimate various employment impacts suggests that, on average, 1.56 direct and indirect jobs result per employment opportunity focused on
@ 2013 World Economic Forum

1.3: Convergent Objectives, Divergent Strategies
44 | The Global Information Technology Report 2013
broadband network construction; this figure rises to 2.78 for direct, indirect, and induced jobs created.3
In the long term, business utilization of broadband can result in network effects and gains in productivity. In the United States, the employment impacts caused by network effects are estimated to be 1.17 jobs per direct and indirect job.4 Recent research by Qiang and Xu at the World Bank examined cross-country time-series and firm-level data; they determine that broadband has “long-term effects on growth, and contributes to the growth of a number of non-telecom industries, especially high-tech industries.”5
THE ROLE OF GOVERNMENT IN BROADBAND ADOPTIONPublic policies in broadband development vary in the extent of intervention and the degree to which policy levers focus on broadband availability (supply) or usage (demand). Although the fiscal stimulus packages of many countries, for example, responded to the global crisis by direct public-sector investment in broadband infrastructure, public policy also facilitates expansion by establishing rules and regulations under which the private sector is encouraged to expand connectivity.
Increasing broadband adoption requires demand-driving policy measures as well. In order to fully utilize broadband infrastructure, individuals, enterprises (small, medium, and large), and government entities require the skills, devices, applications, and content that motivate the interest and ability of stakeholders to incorporate IP technology. Both sets of policy actions—supply expanding and demand driving—are integral, particularly
in countries where broadband penetration levels are significantly below the thresholds of critical mass where increasing returns to investment occur (estimated to be at 20 percent subscription penetration).6
ANALYSIS OF PLANSIn late 2012, we conducted a review of national broadband and ICT plans across the world and categorized each policy. We first identified the 60 largest countries in the world (a group constituting over 90 percent of global gross domestic product and 95 percent of current Internet users), and reviewed all national broadband policy environments to determine whether a current national broadband and ICT plan exists. Of the 60, we identified 43 countries with plans; of those 43 we were able to closely review 28 plans with official English versions. These 28 plans represent a cross-section of countries across geographic regions as well as income levels. Appendix A lists each plan, its economy of origin, and the year of its publication.
Our review also compared the national plans against a scorecard of broadband policies based on a review of telecommunications policy literature. This comparison against the scorecard allows for the categorization and descriptive analysis of each plan. As far as we know, this taxonomy is the first attempt to characterize an international sample of national broadband and ICT plans.
CONVERGENT OBJECTIVESAlthough the plans reviewed range widely in their policy recommendations, they converge on the overarching
Figure 1: Coverage and download speeds, 2011
0 20 40 60 80 100
0
5
10
15
20
25
30
35
Households with Internet (%)
Aver
age
dow
nloa
d sp
eed
(Mb/
s)
Source: ITU World Telecommunications/ICT Indicators Database 2012; Ookla Net Index 2012.
Advanced economies
Emerging economies
@ 2013 World Economic Forum

The Global Information Technology Report 2013 | 45
1.3: Convergent Objectives, Divergent Strategies
objective of increasing broadband and ICTs in order to advance their respective economies. To a lesser degree, the specific targets and indicators of the plans vary. We identified three main categories of goals presented across the plans: coverage (subscriptions or availability), speed (primarily download), and economic impacts (including employment). We group the remaining targets, predominantly sector-specific, into a fourth category of “other” goals.
Coverage targets focus on connecting people and territories to IP networks. Commonly measured as a percentage of individuals or households, some countries also include targets for connecting businesses as well as public institutions, such as schools and hospitals. The indicators utilized vary from actual subscriptions to simply geographic coverage of broadband infrastructure that provides access. Speed targets are closely associated with coverage, and broadband definitions vary widely, from nascent levels below 1 megabit per second (Mb/s) to ultra-fast broadband speed targets at the 100 Mb/s level.
Economic impact goals identified in the plans range from specific employment targets as a result of broadband and ICTs to aggregate value-added measured by expenditure. The remaining targets range from sector-specific ones such as increasing electronic government services to increasing country rankings in international indexes. Appendix B presents specific examples from national plans. The economies are divided into “Advanced” and “Emerging,” demonstrating that historic income differences do not dictate the aggressiveness of broadband targets.
MORE ON COVERAGE AND SPEEDCoverage and speed targets comprise the main goals listed across the plans reviewed here, reflecting an international emphasis on these objectives. For example, Target 3 of the UN Broadband Commission is to connect at least 40 percent of households in developing countries to broadband Internet by 2015.7 The European Commission’s Digital Agenda for Europe 2010–2020 emphasizes broadband coverage for all by 2013, including fast broadband coverage of at least 30 Mb/s for all by 2020, with 50 percent of households subscribed to ultra-fast broadband of 100 Mb/s.8
Comparing the current levels of coverage and speed of the 60 largest countries illustrates the relationship between household adoption of the Internet and average download speeds (Figure 1). Coverage and speed are highly correlated (with a correlation coefficient of 0.7), suggesting a concurrent policy approach to coverage and speed targets. Categorizing economies into advanced and emerging groups further illustrates that, although the majority of households in advanced economies are connected to the Internet (seen in the x-axis of the figure), only a few emerging economies
have a majority of households connected.9 And although some advanced and emerging economies have similar coverage and speed levels, a few emerging countries appear as outliers, with very high average speed (Romania, for example) or very high household coverage (Qatar).
Coverage and download speed, although important, are not the only factors that should be taken into account. Fully leveraging the benefits of broadband requires adequate upload speed as well as latency (Box 1).
POLICY OPTIONS: SUPPLY- AND DEMAND-SIDE DRIVERSOther research has characterized broadband markets as an ecosystem with components covering hard infrastructure as distinct from policy environments, or applications and content access as distinct from connectivity and user skills. We have applied a
Box 1: Networks fit for purpose: Beyond download speed targets
Although the high download speed targets of many national broadband and ICT plans are laudable, ensuring full utilization of broadband technology requires an equal emphasis on additional components of broadband quality: upload speed and latency.
High download speeds are necessary for the consumption of large data files or the streaming of content, but synchronous communication, such as video conferencing, requires a parallel high speed of upload. Additionally, latency (measured as the time required for round-trip data transmission, calculated in milliseconds) is also critical for two-way communication over the Internet in a wide range of applications.
As more applications and services are hosted “in the cloud,” upload speed and latency become more essential. Cisco’s Visual Networking Index 2012–2017 estimates that nearly three-quarters of mobile IP traffic is cloud-based. That share is forecasted to rise to 84 percent of all mobile data traffic by 2017.
Additionally, Cisco’s Global Cloud Index estimates that, for business and consumer applications delivered by the cloud, an advanced level of cloud application readiness requires latency below 100 milliseconds. This latency threshold is required in order to support high-definition (HD) video conferencing, advanced multiplayer gaming, and the streaming of super HD video. Intermediate cloud application readiness (to support IP telephony, basic gaming, basic video chat, basic video conferencing, advanced social networking, and HD video streaming) requires latency of between 100 and 159 milliseconds. Basic readiness is above 160 milliseconds.
Sources: Cisco Mobile VNI Forecast 2012–2017; Cisco Cloud Readiness Index 2012.
@ 2013 World Economic Forum

1.3: Convergent Objectives, Divergent Strategies
46 | The Global Information Technology Report 2013
supply-side versus demand-side approach, because this distinction more clearly demonstrates the fact that public policy can impact most facets of broadband adoption (Figure 2). The supply- versus demand-side categorization also points to the separate and distinct outcomes of expanding availability of broadband or stimulating utilization.
On the supply side, we have categorized the range of policy options into five groups, with specific examples of recommendations that are included in national broadband and ICT plans.
1. Competition and investment policies. These policies encourage private-sector entry and investment in broadband networks, as well as technology- or service-neutral rules that give operators the greatest degree of flexibility. In addition, they can include policies that promote effective competition in international gateways and/or wholesale nondiscriminatory access. For example, the United States’ Connecting America: The National Broadband Plan (2010) included a wide range of recommendations to provide greater clarity on its broadband market and encourage investment; the recommendations in that plan ranged from reviewing wholesale competition regulations and clarifying interconnection rights and obligations to recommending balance in policies around copper retirement.10
2. Spectrum allocation and assignment. These policies allocate and assign spectrum to allow both existing and new companies to provide bandwidth-intensive broadband services. These policies also encourage the implementation of rules to allow operators to engage in spectrum trading. The Slovak Republic’s National Strategy for Broadband Access in the Slovak Republic (2009) outlines a vision of effective utilization of spectrum frequency.11 The plan recommends the transition toward the digital dividend, repurposing excess spectrum obtained by switching analogue to digital broadcasting.
3. Reducing infrastructure deployment costs. These include policies that allow for access to rights-of-way, infrastructure sharing, and/or open access on critical infrastructure. Public rights-of-way can include existing infrastructure owned by public entities, such as railways or electricity grids. Open-access policies can include government-sponsored or dominant-operator networks to enable greater competition in downstream markets. Germany’s Federal Government Broadband Strategy (2009) includes measures to optimize the shared use of existing infrastructure and facilities.12 Among these measures are developing an infrastructure atlas and database on construction sites, and promoting collaboration on ducts and other infrastructure.
4. Core network expansion: Market led, government led, or a mix. This category includes explicit and implicit strategies for core network infrastructure expansion that are: (1) market driven with few government directives, (2) a government-led (or majority-owned) network company, or (3) some combination of public and private cooperation in core infrastructure buildout that can encompass an official public-private partnership or a division in roles between public and private entities to provide the core network. Australia’s National Broadband Network (2009) is an example of a national plan where a government-owned entity will provide national core network infrastructure.13
5. Inclusive broadband availability. These policies focus directly on closing broadband availability gaps for remote or marginalized populations. Options here include actions to build out infrastructure to underserved and/or rural areas, possibly utilizing universal service obligations and/or universal service funds. The United Kingdom’s Britain’s Superfast Broadband Future (2010) report emphasizes the Broadband Delivery UK
Figure 2: Categories of supply- and demand-side policies
Source: Authors.
SUPPLY-SIDE POLICIES DEMAND-SIDE POLICIES
I. Competition and investment I. Affordability of devices and access
II. Spectrum allocation and assignment
II. Government leadership in broadband use and online activity
III. Reducing infrastructure deployment costs
III. ICT skills development
IV. Core network expansion: Market led, government led, or a mix
IV. Online and local content, applications, new technologies, and services
V. Inclusive broadband availability (e.g., with universal service obligations or universal service funds)
V. Consumer protection and empowerment
@ 2013 World Economic Forum

The Global Information Technology Report 2013 | 47
1.3: Convergent Objectives, Divergent Strategies
model for delivering connectivity in rural and hard-to-reach areas to stimulate private-sector investment with available funding.14
Demand-side policies focus on greater broadband adoption through intensifying the motivators of usage. From increasing affordability to fostering trust in the online environment, these policies are categorized into the following dimensions:
1. Affordability of devices and access. These policies include, but are not limited to, targeted subsidies for device purchases by low-income households, decreasing or removing luxury taxes on ICT devices, and low-cost leasing programs. Morocco’s Digital Morocco 2013 (2008) strategy highlights programs to subsidize computers and Internet connections for teachers and students.15 The strategy also emphasizes public-private partnerships to offer similar low-cost device-and-access packages to different sections of the population.
2. Government leadership to utilize and promote broadband. These include policies that encourage the deployment of e-government services and portals, as well as the government operating as an “anchor-tenant” for broadband service. Japan’s New Strategy in Information and Communications Technology (IT) (2010) highlights recommendations for improving and increasing the availability of e-government services and for driving efficiency in government ICT systems.16 These services include an emphasis on cloud technology and promoting citizen participation in political activities by electronic voting.
3. ICT skills development. This category includes programs to increase ICT-related skills and familiarity across the population, such as digital literacy programs. ICT skills development policies also target actions intended to increase community usage and access through “telecenters” and public-access sites as well as increasing technical skills, such as computer science and network engineering. Nigeria’s National Information Communication Technology (ICT) Policy DRAFT (2012) emphasizes the introduction of ICT training at all school levels through the development of specialized training institutes.17 It also provides for computer and Internet access in public facilities such as post offices, schools, and libraries.
4. Facilitating online and local content, applications, new technologies, and services. These policies include programs such as targeted campaigns to increase and localize online content, sometimes
with a focus on translation into local language(s). This category also includes actions and legislation that can foster new applications, technologies, and services by supporting e-transactions or online payments and enforcing intellectual property protection to foster innovation in online services and applications. Qatar’s National ICT Plan: 2015 (2011) recommends policies to accelerate small- and medium-sized enterprise use and involvement in ICT services.18 The plan also emphasizes local content creation, technology to recognize Arabic characters, and a focus on an e-health system that employs broadband and ICTs to enhance healthcare services.
5. Consumer protection and empowerment. These policies protect consumers and enhance transparency between businesses and customers. They include clear regulations around personal data, privacy, and truth in advertising of broadband offerings. These actions help to ensure consumer trust in conducting private and business activity online. The Philippine Digital Strategy: Transformation 2.0 (2011) calls for online consumer protection, consumer awareness, and the creation of data security as well as data privacy regulations.19
TAXONOMY FOR BROADBAND AND ICT PLANSWe classified plans based on their relative emphasis on supply- and/or demand-side policies within the categories identified above. Plans moved from limited in their focus to extensive along both supply- and demand-side dimensions as they increase in the number of policy categories included in a plan. We set this threshold when plans have policy recommendations in at least four of the five categories listed under each supply and demand.
Comparing the extent of both supply- and demand-side level policy coverage, we then sorted national plans into four relevant categories. The most comprehensive plans that include extensive supply- and demand-side coverage are defined as broad-based, while plans that are more heavily focused on one dimension are either supply-driven or demand-driven. The plans that have been published with fewer specific recommendations across the range of policy options are classified as emergent. Figure 3 illustrates the typology and the number of plans in each category; Appendix A lists each plan.
Broad-based plans are the most comprehensive and incorporate a wide range of policy recommendations on both supply- and demand-side dimensions. Of the 28 plans reviewed, 9 plans are categorized here as broad-based and focus on increasing the availability of high-speed networks as well as the activity on those networks
@ 2013 World Economic Forum

1.3: Convergent Objectives, Divergent Strategies
48 | The Global Information Technology Report 2013
to drive utilization. Examples of broad-based plans include the United States’s Connecting America: The National Broadband Plan (2010), Qatar’s National ICT Plan 2015 (2011), and Egypt’s eMisr National Broadband Plan (2011).20
Supply-driven plans focus on actions to build out infrastructure and increase broadband availability through competition and investment policies; they also include direct action to reach underserved populations. The nine supply-driven plans identified here, however, vary in the extent of public investment directed to core infrastructure expansion. Australia’s National Broadband Network (2009), for example, initiates the construction of a government-owned public infrastructure network, while Germany’s Federal Government’s Broadband Strategy (2009) and the United Kingdom’s Superfast Broadband Future (2010) focus on market players to drive core investment and provide public investment at the municipal level for underserved regions to access high-speed infrastructure.21
In some cases, such as in Australia, a supply-driven plan may be complemented with a demand-driven one. In 2011, Australia released its National Digital Economy Strategy,22 emphasizing policies in most of the demand-side categories noted above; the two Australia plans together formulate a comprehensive approach to increasing availability and utilization of broadband.
Other examples of the eight demand-driven plans identified here include Morocco’s Digital Morocco 2013 (2008) and Poland’s Strategy for the Development of the Information Society in Poland until 2013 (2008).23 These plans focus more on intensifying the utilization of broadband and ICTs to drive economic growth.
Few plans are categorized as emergent, as the effort to formulate a national strategy tends to result in a comprehensive set of policy recommendations. However, the classification reinforces the importance of a broad review of available policy levers in the pursuance of goals of increasing broadband availability and utilization.
A distributional review of the plans highlights that, while the demand-driven plans range widely in the years of their publication (they start in 2005 and go to 2012, with no more than two plans published in the same year), the supply-driven plans are heavily concentrated in 2009. This trend reflects the broadband infrastructure investment emphasis as a series of countercyclical responses to the global economic crisis. Additionally, all nine of the broad-based plans identified here were published from 2010 to 2012, signaling an evolution in the way national governments are now shifting policy emphasis to encompass both supply and demand.
CONCLUSION: DIVERGENT PLANS, COMMON UNDERSTANDINGCountries around the world have developed national plans to accelerate broadband adoption. These plans vary by both goals and policy recommendations. Our taxonomy of broad-based, supply-driven, demand-driven, and emergent provides a clear method for categorizing national broadband and ICT plans on the breadth of their policy options. This classification is a starting point in the review and comparison of national plans. Further, it can aid policymakers in countries that have strategic plans underway as they work to increase broadband adoption.
Further research on the efficacy of existing broadband plans and evidence that points to the identification of an optimal policy formulation is crucial. Additional issues that need to be addressed include determining whether there are differential impacts of supply- versus demand-side policies; if such differences do exist, whether they depend on current levels of broadband adoption (e.g., are supply-side policies more relevant in countries with extensive Internet adoption or vice versa), and determining which variables—such as the implementing agency and the extent of the consultative process—impact how successful a plan is in achieving the target goals.
Figure 3: Taxonomy for national broadband/ICT plans
Source: Authors’ calculations.Note: The number in parentheses is the number of plans in each category out of the 28 plans reviewed.
DEMAND-SIDE
Limited Extensive
SUPPLY-SIDE
Limited Emergent (2) Demand driven (8)
Extensive Supply driven (9) Broad based (9)
@ 2013 World Economic Forum

The Global Information Technology Report 2013 | 49
1.3: Convergent Objectives, Divergent Strategies
What is clear now is that the relationship between broadband and national objectives, such as growth and employment, has led to an increasing number of broadband and ICT plans. As variations in plans exist, this taxonomy establishes a common descriptive language for broadband plans and thus sets the baseline for continued research that will enable us to achieve further detail in understanding how best to unleash the potential benefits of broadband for all governments, businesses, and citizens.
NOTES 1 See Bresnahan and Trajtenberg 1995, who define general-
purpose technologies, and Qiang and Xu 2012, who measure the impact of ICTs across sectors in various economies and determine that broadband is the ICT that has the characteristics of general-purpose technology.
2 UN Broadband Commission 2012 and Qiang 2010.
3 Kelly and Rossotto 2012. Note that country-specific effects may be present. Induced employment typically refers to employment that results from added consumption of goods and services by direct and indirect employment.
4 Atkinson, Castro, and Ezell 2009 review the network effect multiplier on employment in the United States.
5 Qiang and Xu 2012.
6 Koutroumpis 2009 has identified that increasing returns to broadband investment occurs when a critical mass of penetration is reached at levels above 20 percent (20 subscriptions per 100 people).
7 UN Broadband Commission 2011.
8 EC Digital Agenda for Europe 2010–2020.
9 Advanced versus Emerging economy classification as defined by the International Monetary Fund’s World Economic Outlook database, April 2012.
10 FCC 2010.
11 The Slovak Republic 2009.
12 Federal Ministry of Economics and Technology 2009.
13 Australian Government, Department of Broadband 2009.
14 BIS 2010.
15 Kingdom of Morocco 2008.
16 Prime Minister of Japan and His Cabinet 2010.
17 Nigeria 2012.
18 ICT Qatar 2011.
19 Philippine Government 2011.
20 FCC 2010; ICT Qatar 2011; eMisr (Egypt) 2011.
21 Australian Government 2009; Federal Ministry of Economics and Technology 2009; BIS 2010.
22 Australian Government 2011.
23 Kingdom of Morocco 2008; The Republic of Poland 2008.
REFERENCESAtkinson, R. D., D. Castro, and S. J. Ezell. 2009. The Digital Road to
Recovery: A Stimulus Plan to Create Jobs, Boost Productivity and Revitalize America. Available at http://dx.doi.org/10.2139/ssrn.1334688.
Australian Government, Department of Broadband. 2009. What Is the NBN? Available at http://www.nbn.gov.au/about-the-nbn/what-is-the-nbn/.
———. 2011. National Digital Economy Strategy. Available at http://www.nbn.gov.au/the-vision/digitaleconomystrategy/.
BIS (Department for Business, Information and Skills). 2010. Britain’s Superfast Broadband Future. London: BIS. Available at http://www.culture.gov.uk/publications/7829.aspx.
Bresnahan, T. F. and M. Trajtenberg. 1995. “General Purpose Technologies ‘Engines of Growth’?” Journal of Econometrics 65 (1): 83–108.
Cisco. 2012. Cisco Global Cloud Index: Forecast and Methodology, 2011–2016. Available at http://www.cisco.com/en/US/solutions/collateral/ns341/ns525/ns537/ns705/ns1175/Cloud_Index_White_Paper.html.
———. 2013. Visual Networking Index: Forecast and Methodology, 2012–2017. Available at http://www.cisco.com/en/US/solutions/collateral/ns341/ns525/ns537/ns705/ns827/white_paper_c11-520862.pdf.
EC (European Commission). Digital Agenda for Europe 2010–2020. Available at http://ec.europa.eu/information_society/digital-agenda/scoreboard/index_en.htm.
eMisr (Egypt). 2011. eMisr National Broadband Plan. Available at http://www.tra.gov.eg/emisr/.
FCC (Federal Communications Commission). 2010. Connecting America: The National Broadband Plan. Available at http://www.broadband.gov/download-plan/.
Federal Ministry of Economics and Technology (Germany). 2009. The Federal Government’s Broadband Strategy. Berlin: Federal Ministry of Economics and Technology. Available at http://www.bmwi.de/English/Redaktion/Pdf/broadband-strategy,property=pdf,bereich=bmwi,sprache=en,rwb=true.pdf.
ICT Qatar. 2011. Qatar’s National ICT Plan 2015. Available at http://www.ictqatar.qa/en/documents/document/qatar-s-national-ict-plan-2015-advancing-digital-agenda.
IMF (International Monetary Fund). 2012. World Economic Outlook database. Available at http://www.imf.org/external/pubs/ft/weo/2012/01/index.htm.
ITU (International Telecommunication Union). 2012. World Telecommunications/ICT Indicators Database 2012. 16th Edition. Available at http://www.itu.int/ITU-D/ict/publications/world/world.html.
Kelly, T. and C. M. Rossotto. 2012. Broadband Strategies Handbook. Washington, DC: World Bank.
Koutroumpis, P. 2009. “The Economic Impact of Broadband on Growth: A Simultaneous Approach.” Telecommunications Policy 33 (9): 471–85. Available at http://www.sciencedirect.com/science/ article/pii/S0308596109000767.
Kingdom of Morocco, Ministry of Industry, Trade, and New Technologies. 2008. Digital Morocco 2013: The National Strategy for Information Society and Digital Economy. Available at http://www.egov.ma/SiteCollectionDocuments/Morocco%20Digital.pdf.
Nigeria. 2012. National Information Communication Technology (ICT) Policy DRAFT. Available at http://www.commtech.gov.ng/downloads/National_ICT_Policy_DRAFT_090112.pdf.
Ookla. 2012. Net Index. Available at http://www.netindex.com/source-data/.
Philippine Government. 2011. Philippine Digital Strategy: Transformation 2.0. Available at http://ilearn.gov.ph/PhilippineDigitalStrategy2011-2016.pdf.
Prime Minister of Japan and His Cabinet. 2010. A New Strategy in Information and Communications Technology (IT). May 11. Available at http://www.kantei.go.jp/foreign/policy/it/100511_full.pdf.
@ 2013 World Economic Forum
1.3: Convergent Objectives, Divergent Strategies
50 | The Global Information Technology Report 2013
The Republic of Poland, Ministry of Interior and Administration. 2008. The Strategy for the Development of the Information Society in Poland until 2013. Available at http://bip.msw.gov.pl/download.php?s=4&id=6188.
Qiang, C. Z-W. 2010. “Broadband Infrastructure Investment in Stimulus Packages: Relevance for Developing Countries.” info 12 (2):.41–56.
Qiang, C. Z.-W. and L. C. Xu. 2012. “Telecommunications and Economic Performance: Macro and Micro Evidence.” Working Paper. Washington, DC: World Bank.
The Slovak Republic. 2009. National Strategy for Broadband Access in the Slovak Republic. Available at http://www.telecom.gov.sk/index/open_file.php?file=telekom/Strategia/Broadband/NSSP_2011_en.pdf&lang=en.
United Nations Broadband Commission. 2011. “Broadband Targets for 2015.” Available at http://www.broadbandcommission.org/Documents/Broadband_Targets.pdf.
———. 2012. The State of Broadband 2012: Achieving Digital Inclusion for All Geneva: ITU. Available at http://www.broadbandcommission.org/Documents/bb-annualreport2012.pdf.
@ 2013 World Economic Forum

The Global Information Technology Report 2013 | 51
1.3: Convergent Objectives, Divergent Strategies
Appendix A: Broadband and ICT plans reviewed
The table below illustrates the different categories of policies present in each broadband/ICT plan reviewed. The roman numerals refer to the policy categories shown in Figure 2.
Supply-side policies Demand-side policies
Category National broadband and ICT plan name Economy Year I II III IV V I II III IV V
Broad-
based plan
eMisr National Broadband Plan Egypt 2011 n n n n n n n n n n
National Telecom Policy 2012 India 2012 n n n n n n n n n n
National Information Communication Technology
(ICT) Policy DRAFT
Nigeria 2012n n n n n n n n n
The Philippine Digital Strategy: Transformation
2.0: Digitally Empowered Nation
Philippines 2011n n n n n n n n n
2015: Qatar’s National ICT Plan Qatar 2011 n n n n n n n n n
National Development Plan 2030: Our Future –
Make It Work
South Africa 2012n n n n n n n n n
ICT for Everyone: A Digital Agenda for Sweden Sweden 2011 n n n n n n n n n
National Broadband Policy Thailand 2010 n n n n n n n n n
Connecting America: The National Broadband
Plan
United States 2010n n n n n n n n n n
Supply-
driven plan
The National Broadband Network Australia 2009 n n n n
Broadband Canada: Connecting Rural Canadians Canada 2009 n n n n
The National Broadband Access Policy -
Broadband Strategy of the Czech Republic
Czech Republic 2005n n n n n n n
The Federal Government’s Broadband Strategy Germany 2009 n n n n n n
Next Generation Broadband: Gateway to a
Knowledge Ireland
Ireland 2009n n n n n n
The National Broadband Plan: Enabling High
Speed Broadband Under MyICMS 886 *
Malaysia 2004n n n n n n n
Ultra-Fast Broadband Initiative + Rural Broadband
Initiative
New Zealand 2009n n n n n
National Strategy for Broadband Access in the
Slovak Republic
Slovak Republic 2009n n n n n n
Britain’s Superfast Broadband Future United Kingdom 2010 n n n n n n n
Demand-driven
plan
#AU20: The National Digital Economy Strategy Australia 2011 n n n n
2008 Digital 21 Strategy Hong Kong SAR 2007 n n n n n n n n
National Broadband Strategy Hungary 2005 n n n n n n n n
A New Strategy in Information and
Communications Technology (IT)
Japan 2010 n n n n n
Digital Morocco 2013: The National Strategy for
Information Society and Digital Economy
Morocco 2008n n n n n n
Draft National IT Policy (Revised) 2012 Pakistan 2012 n n n n n n n
The Strategy for the Development of the
Information Society in Poland until 2013
Poland 2008 n n n n n
Realising the iN2015 Vision – Singapore: An
Intelligent Nation, A Global City
Singapore 2006n n n n n n n n
Emergent
plan
Plan for a Digital Canada Canada 2010 n n n n n n
Estrategia Digital: Digital Development Strategy
2007–2012
Chile 2007 n n n n
* In 2010, Malaysia launched five initiatives as part of a National Broadband Initiative; however, we were unable to obtain an official comprehensive document to review here.Note: The plans we reviewed consist of the most current plans with official English language versions. In a few cases, we included draft plan documents that were released to the public for review.
@ 2013 World Economic Forum

1.3: Convergent Objectives, Divergent Strategies
52 | The Global Information Technology Report 2013
Appendix B: Examples of goals found in national broadband/ICT plans, by economy groups
vGoal
Economy group Broadband coverage Broadband speeds
Economic impacts (including
employment)
Other goals
(including sector-specific targets)
Advanced
economies
Germany
By 2014, 75 percent of households
to have Internet access of at least
50 Mb/s
New Zealand
By 2020, download speeds of at
least 100 Mb/s and upload speeds
of at least 50 Mb/s (connected to 75
percent of New Zealanders)
Singapore
By 2015, achieve a twofold increase
in the value-added of the ICT
industry to S$26 billion, a threefold
increase in ICT export revenue to
S$60 billion and create 80,000
additional jobs
United States
By 2020, create a nationwide,
wireless, interoperable broadband
public safety network and a clean
energy economy where every
citizen can use broadband to track
and manage real-time energy
consumption
Sweden
By 2020, 90 percent of all
households and businesses have
access to broadband at a minimum
speed of 100 Mb/s
United Kingdom
By 2015, all homes will have access
to a minimum level of service of
2 Mb/s
Japan
By 2020, create new related
markets worth 70 trillion yen
Australia
By 2015, 495,000 telehealth
consultations will have been
delivered, providing remote access
to specialists for patients in rural,
remote, and outer metropolitan
areas; by 2020, 25 percent of all
specialists will be participating in
delivering telehealth consultations to
remote patients
Emerging
economies
Thailand
By 2015, develop the broadband
network to provide access for at
least 80 percent of the population,
and access for at least 95 percent
by 2020
Egypt
By 2021, 90 percent of households
will have access to 25 Mb/s
broadband availability and 90
percent of the population will have
4G/LTE coverage
Pakistan
In 10 years, create 5 million new
jobs across Pakistan linked to the
ICT- and IT-enabled services (ITES)
sectors; quadruple the percentage of
women participating in the ICT and
ITES workforce from the current 13
percent; double the GDP per capita
by improving agricultural yields
using ICTs and ITES; leverage the
cellular phone network for education
and access to information; localize
content and broad-based growth of
the ICT and ITES sectors
Philippines
By 2016, increase the country’s
score on the UN e-Participation
Index from 24.49 in 2008 to
above 40; at least 50 percent of
government websites will include
interactive services (up from 31
percent in 2010); at least 20 percent
of government websites will include
transactional services (up from 4.61
percent in 2010)
South Africa
By 2020, achieve target of 100
percent broadband penetration
Slovak Republic
By 2020, fast broadband (greater
than 30 Mb/s) coverage for all;
greater than 100 Mb/s for 50
percent of households’ broadband
subscriptions
Morocco
By 2013, establish 58,000 jobs in
IT (up from 32,000 in 2008); direct
additional GDP: 7 billion Morocco
Dirham (MAD); indirect additional
GDP: 20 billion MAD
India
Enable citizens to participate in and
contribute to e-governance in key
sectors such as health, education,
skill development, employment,
governance, banking, and so on
to ensure equitable and inclusive
growth
@ 2013 World Economic Forum

The Global Information Technology Report 2013 | 53
CHAPTER 1.4
The Importance of National Policy Leadership
PHILLIPPA BIGGS
ANNA POLOMSKA
on behalf of the Broadband Commission Secretariat
ITU/UNESCO Broadband Commission for Digital
Development
With one-third of the world’s population now online, the impact of—and need for—coordination between government policies and commercial strategies in the rollout and use of information and communication technologies (ICTs) have never been greater. As cross-cutting technologies, ICTs are creeping into our lives today in many different forms—from how we exchange news and views to how we share photos, meet up, or locate our friends, or even ourselves.
The use—and sometimes the abuse—of ICTs are driven by extremely fast technological evolution within a changing policy environment (Figure 1). A growing number of countries now recognize the importance of policy leadership and a clear cross-sectoral vision that can maximize the economic and social returns of ICTs. This can be seen in the strong growth in the number of national broadband plans (Figure 2). This chapter provides a brief overview of the growth of such national broadband plans and describes characteristics of a good plan, with reference to several examples: the US, UK, and Polish national broadband plans.
THE CHANGING POLICY CONTEXTThroughout the 1960s and 1970s, economic arguments of natural monopolies and economies of scale underpinned the state’s function as investor, operator, and (self-)regulator of telecommunication networks and services in many countries. Beginning in the 1980s, market liberalization saw private and competitive operators dramatically accelerate network rollout, reduce prices, and boost the efficiency of telecommunication service provision; these changes continued throughout the 1990s.1 Regulators, initially established as arbiters overseeing the transition to a competitive market, subsequently carved out a role for themselves in overseeing principles of universal service provision, competition, and consumer protection.
The late 1990s and early 2000s witnessed the development of an equilibrium of sorts in Europe and North America, with private operator(s) in charge of investment, operations, and service provision; government in charge of high-level policy; and the regulator in charge of more specific concerns. Consensus opinion cast the die in favor of competitive, market-based mechanisms for the provision of telecommunication services, with governments cast in the role of “gap-fillers,” facilitators, and enablers, especially in instances of market failure.
This chapter reflects the views of its authors only and in no way reflects the views of ITU or its membership. The chapter draws on data and analysis taken from the ITU Trends in Telecommunication Reform Report 2012, and Chapter 1 of that report, “Overview of Trends in the ICT Market and in ICT Regulation,” authored by Nancy Sundberg and Youlia Lozanova.
@ 2013 World Economic Forum

1.4: The Importance of National Policy Leadership
54 | The Global Information Technology Report 2013
More recently, however, the pendulum of opinion may be shifting back to accord greater importance to the role of government in the rollout and deployment of telecommunication services. There are several forces driving this trend:
1. A growing body of evidence indicates sizeable positive externalities and strong returns to broadband networks. Statistical cross-country regression work generally puts broadband’s contribution to growth in GDP at between 0.25 percent and 1.4 percent, but this contribution is highly variable and depends on data availability, model specifications, and the individual country’s economic structure.2 Such externalities underline how broadband networks are a part of national infrastructure that is vital for a nation’s economic competitiveness,3 and may help create a greater exchange of information and knowledge as an important national or international public good.4
2. As well as sizeable returns, the scale of network investments needed are today so massive, and take place over such long time horizons, that
many operators are struggling to finance network upgrades in the move to Internet Protocol (IP)–based networks,5 and are seeking alternative sources of funding, including from the state.6 For example, it is estimated that €50 billion are needed for energy and broadband network upgrades in Europe alone.7 Meanwhile, New Zealand’s Ultra-Fast Broadband (UFB) network buildout is expected to result in a total savings of $NZ 32.8 billion over 20 years across all sectors of the economy (including healthcare, education, the business sector, and the dairy sector)8—savings that cannot be reflected or taken into account by the investment plans of any single operator.
3. Handset functionality, the speed of convergence, and the use of mobiles to deliver education, healthcare, and m-money (as well as Facebook updates or the organization of flashmobs and riots) means that mobile operators, vendors, and social networking services may be asked to play teacher, doctor, banker, and sometimes even policeman under certain circumstances.9
Figure 1: The institutional context and enabling environment for policy
Source: Secretariat of the Broadband Commission for Digital Development.Note: CIRT = computer incident response team; CERT = computer emergency response team.
Legislation
Legislators
Judiciary
Law enforcement agencies
Police
Ministry of internal affairs
Other ministries
CIRTs/CERTs
International &
regional organizations
Regulation
ICT regulator
Data protection agency
Consumer protection agency
Competition agency
Operations
Network & service providers
Vendors
Research institutes
Standardization organizations
Policy
Ministry of
ICT/communications
END USERS
@ 2013 World Economic Forum

The Global Information Technology Report 2013 | 55
1.4: The Importance of National Policy Leadership
As the technical capabilities of ICTs grow, operators—and policymakers—are taking on new roles as they grapple with more complex issues, including privacy and security. Alongside codified legislation, law enforcement, and specific regulation, policy visions for a connected nation can play a vital coordinating role and may optimize outcomes across the institutional context to the benefit of end users, who find themselves impacted by diverse policy considerations (Figure 1).
THE NEED FOR NATIONAL POLICY LEADERSHIPPolicy leadership can help highlight the role of broadband in national development, provide an enabling environment for private investment, coordinate dialogue, and encourage work across different sectors and ministries. Over the last few years, policy decision makers, communication ministries, and national regulators have made broadband a policy priority. The number of broadband plans and policies, as tracked by ITU and the Broadband Commission, has more than doubled since December 2009 (Figure 2). The explosion in national broadband plans in 2010–11 occurred partly in response to the financial crisis and the prioritization of national infrastructure investments in economic stimulus plans.10
By September 2012, some 119—or 62 percent—of all economies had developed a national plan, strategy, or policy to promote broadband; 12 countries—or 6 percent—are planning to introduce such measures in the near future (see Figure 3 and Appendix A). Europe
has a marked preference for national broadband plans, with some 88 percent of European countries having a plan and/or universal access and service (UAS) definition (Figure 4). Africa was well endowed with national plans from fairly early on, with ICTs included in International Monetary Fund/World Bank Poverty Reduction Strategy Papers. Plans have changed focus over time, with earlier plans produced between 2002 and 2006 generally tending to focus on ICTs or the Information Society. Plans between 2006 and the present have tended to focus explicitly on broadband; more recently, plans focus on broader, cross-sectoral considerations of the digital agenda.
The region with the fewest national broadband plans is the Arab States, which have generally revised universal service objectives to include broadband. However, 62 countries—or 32 percent of all countries—still do not have any broadband plan, strategy, or policy in place (Figure 3). Further, for those countries with plans, achieving progress in implementation may be more challenging or slower than envisaged. The number of national regulatory bodies also continues to grow. By September 2012, 159 countries had national regulatory bodies, up from 152 in 2008 and 124 in 2002.11
Best-practice cases for broadband plans are by now well established. In his chapter for Trends in Telecommunication Reform 2012,12 Horton suggests that:
• Plans should be cross-sectoral across a range of different sectors (although they should also
Figure 2: Growth in national broadband policies, 2005–12
0
20
40
60
80
100
120
20122011201020092008200720062005
No.
of c
ount
ries
Source: ITU World Telecommunication/ICT Regulatory Database.
@ 2013 World Economic Forum

1.4: The Importance of National Policy Leadership
56 | The Global Information Technology Report 2013
Figure 3: Countries with a national policy, strategy, or plan to promote broadband, mid 2012
Source: ITU/UNESCO Broadband Commission for Digital Development.
Figure 4: Policy instruments used to promote universal service, 2012
0
5
10
15
20
25
30
35
40
EuropeCISAsia-PacificArab StatesAmericasAfrica
Tota
l cou
ntrie
s su
rvey
ed (%
)
Source: ITU World Telecommunication/ICT Regulatory Database.Note: UAS = Universal access and service.
n Have a plan (61.7 percent, or 119 economies)n Planning to adopt (6.2 percent, or 12 economies) n No plan (32.1 percent, or 62 economies)
n UAS definition (includes broadband)n Both a plan and a UAS definitionn National broadband plan
@ 2013 World Economic Forum

The Global Information Technology Report 2013 | 57
1.4: The Importance of National Policy Leadership
assign a coordinating agency to be responsible for implementing the plan overall, in conjunction with other involved bodies).13
• Plans should make the case for broadband, specific to the needs and economic structure of that country, based on market analysis and benchmarking (Box 2).
• Plans should be developed in consultation with, and based on consensus with, a broad range of stakeholders.
In addition, comprehensive broadband plans can typically be characterized in the following ways:
• Many plans emphasize an important role for public-private partnership.
• Plans should consider both demand- and supply-side considerations. This may mean supporting the development of human skills, literacy, and demand among, for example, schools and small- and medium-sized enterprises, as well as taking into account (in many developing countries) the role of government in driving demand.
• Plans should look forward over a timescale of 5 to 10 years, as it may often be difficult to predict technological evolution over longer time horizons.
• Plans should be broadly technology-neutral. Plans can still include technology-specific measures (for example, they can consider spectrum issues in order to facilitate the rollout of mobile broadband). However, there should be no major implications in terms of favoring specific technologies over others.
• Plans should contain detailed, measurable goals and strategies to allow for the evaluation of progress. They may often also contain consideration of special interest groups such as schools, hospitals, universities, diverse languages, and access by minorities or people with specific needs.
In industrialized countries with high broadband penetrations, plans still play an important role as a clear statement of national policy priorities, such as targets for coverage or for a minimum speed (for example, the United Kingdom’s digital agenda defines a national minimum speed of 2 Mb/s; see Box 3). The example of the National Broadband Plan of the United States illustrates many of the above aspects (Box 1).
National broadband plans should be based on a thorough market analysis and benchmarking in order to best understand current market trends and optimize
network deployment to areas of maximum demand and usage. The US National Broadband Plan was notable for its thorough and detailed benchmarking of the national situation in broadband. However, even today, one-third of all American citizens have yet to adopt broadband.14 In Poland, benchmarking and analysis have played a significant role in helping attract and channel local investment and foreign direct investment (Box 2).
State funding for high-speed broadband networks may raise issues of competitive concerns and the crowding out of private-sector investment. For example, the European Commission recently conducted a
Box 1: The US National Broadband Plan
In 2009, the US Congress charged the Federal Communications Commission (FCC) with creating a National Broadband Plan to ensure that every American has “access to broadband capability.” Creating the plan would entail exploring broadband deployment, adoption, and affordability, as well as the use of broadband to advance US national priorities, including civic participation; public safety; entrepreneurial activity; and the delivery of healthcare, energy, and education, among other priorities.
The FCC conducted an extensive public consultation, with over 41,000 pages of comments reviewed and over 30 public meetings held throughout the country. On March 16, 2010, the FCC delivered the Broadband Plan to Congress to help Americans harness its potential.1 Since then, the FCC has emphasized the vital nature of broadband for US economic opportunity, job creation, innovation, and national competitiveness. Since the release of the Broadband Plan, the FCC has launched a number of programs that work toward its implementation. Among these programs are the Connect America Fund, which addresses universal service; a Mobility Fund for funding mobile coverage in unserved areas; the reformed Lifeline program for low-income Americans; and Connect2Compete to connect low-income students.
To promote regulatory certainty, the FCC has set out clear rules to protect the Internet’s openness and promote innovation, investment, and competition, and has taken steps to free up additional spectrum (for both licensed and unlicensed broadband, including the use of white space). The FCC is seeking to make 25 more MHz of spectrum available and will launch the world’s first incentive auctions to repurpose broadcast spectrum for mobile broadband. Since 2010, the FCC has made substantial progress, through over 60 initiatives, to achieve nearly 90 percent of items on its action agenda (www.broadband.gov). Today, the benefits of this dialogue on broadband are apparent—more Americans than ever are aware of the importance of broadband to their lives, investment in broadband infrastructure has risen significantly, and broadband speeds are increasing.
Note
1 See http://www.broadband.gov/plan/.
Source: Contributed by the Federal Communications Commission (FCC) of the United States, 2012.
@ 2013 World Economic Forum

1.4: The Importance of National Policy Leadership
58 | The Global Information Technology Report 2013
Box 2: The importance of benchmarking: The case of Poland
The Polish government introduced its Strategy for the Development of the Information Society in Poland until 2013 in 2008 and its long-term strategy, Poland 2030, in November 2011. Poland is currently preparing its forthcoming National Broadband Plan (the Plan) for 2013–20, under final consultation until mid-December 2012, enshrining the objectives of the European Union (EU)’s Digital Agenda. This Plan assumes that geographical areas of intervention will be determined on the basis of a nationwide coverage and infrastructure inventory exercise, under the Information System of Broadband Infrastructure (known by its Polish acronym SIIS) database.
The Plan sets out clear and measurable broadband targets:1
1. universal access to the Internet by 2013,
2. universal access to broadband of the speed of at least 30 Mb/s by 2020, and
3. at least 50 percent of households with an Internet access of at least 100 Mb/s by 2020.
In addition, a law adopted in 2010 and designed with the participation of the Office of Electronic Communications (UKE)—the act supporting the development of networks and services—speeds up investment and supports broadband Internet access in Poland by requiring duct infrastructure to be located along new and rebuilt roads.
Accurate data on existing infrastructure is vital to tailoring policy and regulation, and to attracting investment to areas without broadband. UKE collects data every year on infrastructure and broadband Internet access for both fiber and wireless networks. An understanding of coverage will optimize investments by operators and local government and allow for the long-term planning of telecommunication infrastructure development.
The Polish Telecommunication Institute, UKE, and the Ministry of Administration and Digitization (previously the Ministry of Infrastructure) have developed the dedicated SIIS database, implemented and overseen by UKE. Detailed information is presented in the form of tables, charts, and maps at the provincial and commune levels. UKE has collected data on the status of infrastructure and investment projects in the following areas:
• fiber optic network terminations,
• telecommunications network nodes,
• access nodes,
• coverage of cable and wireless networks,
• penetration of cable connections or wireless terminals in buildings,
• occurrence of cable connections or wireless terminals in residential buildings, and
• the existence of buildings enabling colocation.
The data are used by:
• telecommunication operators and Internet service providers for making business decisions about new investment projects and market competitiveness,
• other investors in planning investments,
• local self-government and other local government units,
• businesses and consumers for choosing the most attractive technologies and competitive market offers,
• regional operational programs and the Eastern Poland Operational Program for notifications to the European Union of plans for the rollout of regional broadband networks, and
• local government authorities for issuing opinions with regard to public resources expenditure on the rollout of telecommunication networks.
UKE uses these data as a tool for analysis to determine the direction for broadband network investment and development, address gaps in coverage, and support local government units—for example, through the establishment of areas entitled to apply for state aid in the further development of infrastructure. The database also helps big businesses and small- and medium-sized enterprises determine where—in which locations and which technologies—to invest.
Poland, during the preparation of guidelines for its new financial perspective for the years 2014–20, enshrines the objectives of the EU Digital Agenda in its forthcoming Plan, currently in draft form. The Plan assumes that the geographical areas of intervention will be determined on the basis of nationwide coverage and infrastructure inventory accumulated in the SIIS system. The system has become a tool to determine which areas are in need of funding, to detect and eliminate gaps in the coverage of high-speed network bandwidth and improve offers aimed at the less-developed areas, and to determine in what locations and in what technology investment is justified.
Note
1 National Broadband Plan (Draft), available from the Ministry of Administration and Digitization (formerly the Ministry of Infrastructure), at http://www.transport.gov.pl/files/0/1794416/NARODOWYPLANSZEROKOPASMOWY.pdf.
Source: Contributed by the Office of Electronic Communications (UKE) of Poland, 2012.
@ 2013 World Economic Forum

The Global Information Technology Report 2013 | 59
1.4: The Importance of National Policy Leadership
consultation and sought comments on the application of EU state aid rules to the public funding of broadband networks over the summer of 2012, with a view to adopting definitive broadband guidelines in December 2012.15 The revised guidelines propose the possibility of supporting ultra-fast broadband networks under certain conditions.
The UK government has committed to ensuring the rapid rollout of superfast broadband across the country and “the best superfast broadband network in Europe by 2015.”16 It has detailed in precise terms how it intends to achieve this in the strategy document Britain’s Superfast Broadband Future (described in Box 3), which sets out clear arguments for greater access to broadband as well as identifying the services enabled by broadband.
LOOKING FORWARDCountries today are prioritizing the importance of policy leadership, as shown by the growth in the number of national broadband plans. International organizations also recognize the importance of policy leadership. Every year, ITU hosts a Global Symposium for Regulators and Global Regulators-Industry Dialogue (GRID) to debate the trends transforming the ICT environment and to consider their impact on the regulatory environment, with the outcomes published in the form of best-practice guidelines.17 The Broadband Commission for Digital Development meets twice annually to consider the trends and issues specific to broadband policy and publishes its annual State of Broadband report, providing a snapshot of the latest broadband market trends.
At a time of rapid technological evolution and heightened economic uncertainty, it is vital for governments, the industry, and regulators to work together to review and regularly update regulatory and policy frameworks. In this way we can ensure that the frameworks are flexible, appropriate, and regularly updated, can achieve optimal outcomes for network deployment and national economic competitiveness.
NOTES 1 ITU 2002.
2 Katz 2011.
3 See, for example, comments by US Vice-President Joe Biden, who said at Seneca High School, on July 1, 2009, “The bottom line is, you can’t function—a nation can’t compete in the 21st century—without immediate, high-quality access for everything from streaming video to information overline. . . . Getting broadband to every American is a priority for this Administration” (Nephin 2009). See also comments by Neelie Kroes, Vice-President of the European Commission responsible for the Digital Agenda, who asked at the European Telecom Network Operators Connecting Europe Facility Conference in Brussels in October 2012, “Are we going to take our place as the connected, competitive continent? Or are we going to stay antiquated and analogue?” (Kroes 2012).
Box 3: Britain’s Superfast Broadband Future
Britain’s Superfast Broadband Future sets out the UK government’s vision for broadband in the United Kingdom and how this will be achieved, including the benchmarking of current market deployment in the United Kingdom and the monitoring of progress. The vision was to have the “best superfast broadband network in Europe by 2015”—with targets of 90 percent of the population having access to superfast broadband (defined as 24 Mb/s) and the rest of the population to have access to at least 2 Mb/s by 2015.
The UK government has committed to investing £530 million in public funds by 2015 to support this goal. The three devolved administrations in Scotland, Wales, and Northern Ireland, and over 40 English local authorities, have developed local broadband plans and committed funding to match the government’s contribution. These projects are now entering the procurement phase; the scheme received state aid approval from the European Commission on November 20, 2012. A smaller, £20 million fund—the Rural Communities Broadband Fund—is targeted at small-scale broadband projects in rural areas, and has over 50 projects under consideration.
The government has also committed £150 million to establish an Urban Broadband Fund, which will support projects in major cities to provide high-speed connectivity—both fixed and wireless, with a strong emphasis on small- and medium-sized enterprises and on stimulating demand for high-speed broadband services.
The strategy foresees “private sector investment freed from unnecessary barriers, supported by government funding where the market cannot reach unaided.” A package of measures was announced on September 7, 2012, aimed at supporting and enabling private-sector investment, including streamlining planning restrictions on broadband infrastructure and producing new guidance to local authorities in relation to the laying of fiber and digging of trenches in streetworks schemes.
The strategy is technology-neutral. It recognizes that a mix of technologies—fixed, wireless, and satellite—are needed to deliver superfast broadband throughout the United Kingdom: one technology choice will not be suitable for all circumstances. However, extending high-capacity fiber optic deeper into the network will be a key feature of the United Kingdom’s network going forward. Progress is reported in the Ofcom Infrastructure Report, with 65 percent of premises now able to access superfast broadband and average download speeds having risen to 12.7 Mb/s.
Sources: UK Government, Department for Culture, Media & Sport; BIS 2010; Ofcom 2012.
Note: The United Kingdom also supports European targets for minimum broadband speeds of 30Mb/s to every home and business in Europe by 2020, and 50 percent take-up of 100 Mb/s services by 2020.
@ 2013 World Economic Forum

1.4: The Importance of National Policy Leadership
60 | The Global Information Technology Report 2013
4 Stiglitz 1999. In his chapter in Providing Global Public Goods: Managing Globalization, Stiglitz argues that telecommunications and the Internet are themselves global public goods; however, most observers agree that it is the knowledge and information provided over the Internet that are non-rivalrous and non-excludable, rather than the networks (which may be rivalrous and excludable).
5 According to the report Telecom Operators: Let’s Face It (Exane BNP Paribas-Arthur D. Little 2012), telecommunication companies face the choice of becoming mega operators with a global footprint, local heroes focusing mainly on their national market or immediate local markets, or engaging in a play for infrastructure only.
6 ITU 2009.
7 For example, under the Connecting Europe Facility (CEF), it is proposed to spend €50 billion over six years, from 2014 to 2020, with €9.2 billion earmarked for broadband and digital services to promote growth, jobs, and competitiveness through targeted infrastructure investment at the level of the European region. This will support the rollout of high-performing, sustainable, and joined-up trans-European networks in the fields of transport, energy, and broadband and digital services.
8 Alcatel Lucent Bell Labs 2011. The total impact of New Zealand’s Ultra-Fast Broadband (UFB) network of $NZ 32.8 billion over twenty years include 5.9 $NZ billion for healthcare, 3.6 billion $NZ for education, 14.2 $NZ billion for business, and 9.1 $NZ billion for dairy. Estimations of the economic benefits to New Zealand of UFB applications take into account both increased returns and savings.
9 See, for example, calls by Prime Minister David Cameron for social media services to be monitored and/or shut down during the riots in the United Kingdom in August 2011, available from www.guardian.co.uk/media/2011/aug/11/david-cameron-rioters-social-media.
10 ITU 2009.
11 ITU 2012.
12 Horton 2012.
13 Kelly and Rossotto 2012.
14 Statement by Mr Julius Genachowski, Chairman of the US Federal Communications Commission (FCC) to the New York meeting of the Broadband Commission for Digital Development on 23 September 2012.
15 “State Aid: Commission Consults on Draft Guidelines for Broadband Networks.” Available at http://europa.eu/rapid/pressReleasesAction.do?reference=IP/12/550&format=HTML&aged=0&language=EN&guiLanguage=en.
16 BIS 2010.
17 See ITU’s regulatory website, www.itu.int/ITU-D/treg/index.html; for details of the latest Global Symposium for Regulators, GSR-2011, see www.itu.int/ITU-D/treg/Events/Seminars/GSR/GSR11/index.html; and for previous GSR events, see www.itu.int/ITU-D/treg/Events/Seminars/GSR/index.html.
REFERENCESAlcatel Lucent Bell Labs. 2011. “Building the Benefits of Broadband:
How New Zealand Can Increase the Social & Economic Impacts of High-Speed Broadband.” Wellington, New Zealand: Alcatel-Lucent. Available at http://img.scoop.co.nz/media/pdfs/1202/Building_the_Benefits_of_Broadband_WhitePaper.pdf.
BIS (Department for Business, Innovation & Skills). 2010. Britain’s Superfast Broadband Future. London: BIS. Available at http://www.culture.gov.uk/publications/7829.aspx.
Exane BNP Paribas-Arthur D. Little. 2012. Telecom Operators: Let’s Face It. London and Paris: Exane BNP Paribas and Arthur D. Little. Available at http://www.adlittle.com/downloads/tx_adlreports/Arthur_D_Little_Exane_Study-Synthesis-2012.pdf.
Horton, B. 2012. “Setting National Broadband Policies, Strategies and Plans.” In Trends in Telecommunication Reform 2012. Geneva: ITU. Available from www.itu.int/ITU-D/treg/publications/trends12.html.
ITU. 2002. World Telecommunication Development Report 2002: Reinventing Telecoms. Geneva: ITU. Available at http://www.itu.int/ITU-D/ict/publications/wtdr_02/.
———. 2009. Confronting the Crisis: ICT Stimulus Plans for Economic Growth. Geneva: ITU. Available at www.itu.int/osg/csd/emerging_trends/crisis/confronting_the_crisis_2.pdf.
———. 2012. Trends in Telecommunication Reform 2012. Geneva: ITU. Available at www.itu.int/ITU-D/treg/publications/trends12.html.
Katz, R. L. 2011. “The Impact of Broadband on the Economy: Research to Date and Policy Issues.” In Trends in Telecommunication Reform 2010–2011: Enabling Tomorrow’s Digital World. Geneva: ITU. 19–57.Available at www.itu.int/ITU-D/treg/publications/trends10.html.
Kelly, T. and C. M. Rossotto. 2012. Broadband Strategies Handbook. Washington, DC: World Bank. Available at https://openknowledge.worldbank.org/handle/10986/6009.
Kroes, N. 2012. “Connecting Europe with Fast Broadband.” Speech delivered at the Connecting Europe Facility Conference, Brussels, October 2. European Commission Press Release, Speech 12/68. Available at http://europa.eu/rapid/press-release_SPEECH-12-668_en.htm#PR_metaPressRelease_bottom.
Nephin, D. 2009. “Biden Announces Program to Expand Broadband Internet Access for Rural Areas at Pa. Stop.” StarTribune.com, Minneapolis-St. Paul, Minnesota. July 1. Available at http://www.startribune.com/templates/Print_This_Story?sid=49613912.
Ofcom. 2012. Infrastructure Report: 2012 Update. Available at http://stakeholders.ofcom.org.uk/binaries/research/telecoms-research/infrastructure-report/Infrastructure-report2012.pdf.
Stiglitz, J. 1999. “Knowledge as a Global Public Good.” In Providing Global Public Goods: Managing Globalization. 308–25. Available at http://cgt.columbia.edu/files/papers/1999_Knowledge_as_Global_Public_Good_stiglitz.pdf.
United Nations Broadband Commission. 2012. The State of Broadband 2012: Achieving Digital Inclusion for All. Geneva: ITU. Available at http://www.broadbandcommission.org/Documents/bb-annualreport2012.pdf.
@ 2013 World Economic Forum

The Global Information Technology Report 2013 | 61
1.4: The Importance of National Policy Leadership
Appendix A: Selected economies with national broadband policies, 2012
Country/Economy Policy available?Year policy
was adopted Type Title/details
Afghanistan Yes 2008 Strategy Afghanistan National Development Strategy: 1387–1391 (2008–2013)
Albania Yes 2008 Strategy E-Albania
Algeria Yes 2008 Strategy E-Algérie 2013
Andorra Yes 2009 Policy Universal Access Service
Antigua & Barbuda Yes 2012 Strategy GATE 2012
Argentina Yes 2010a Plan Plan Nacional de Telecomunicaciones Argentina Conectada
Australia Yes 2009 Plan National Broadband Network
Austria Yes 2010 Plan Breitband strategie 2020
Azerbaijan Planned Pending
Bahrain Yes 2010 Policy National BB Network for the Kingdom of Bahrain
Bangladesh Yes 2009 Universal Access Service
Broadband National Policy Act 2009
Barbados Yes 2010 Plan National Information and Communication Technologies Strategic Plan of Barbados 2010–2015
Belgium Yes 2009 Plan België: digitaal hart van Europa
Belize Yes 2011 Strategy ICT National Strategy
Benin Planned
Bhutan Yes 2008 Plan National Broadband Master Plan Implementation Project (NBMIP)
Botswana Yes 2004 Strategy Botswana’s National ICT Policy
Brazil Yes 2010 Plan National Broadband Plan (Plano Nacional de Banda Larga – PNBL); Costa's Plan
Brunei Darussalam Yes 2008 Plan National Broadband Blueprint
Bulgaria Yes 2009 Strategy National Strategy of broadband development in Republic of Bulgaria
Burkina Faso Yes 2006 Policy Lettre de politique sectorielle 2006–2010
Burundi Yes 2011 Project Burundi/ICT: National projects for broadband connectivity; Burundi Community Telecentre Network (BCTN)
Canada Yes 2010 Plan Broadband Canada: Connecting Rural Canadians
Cape Verde Planned Pending
Central African Rep. Yes 2006 Strategy Politique, Stratégies et plan d'actions de l'édification de la Société de l'Information en République Centrafricaine
Chad Yes 2007 Plan Plan de développement des technologies de l’Information et de la Communication au Tchad ou PLAN NICI
Chile Yes 2010 Strategy Strategy for Digital Development; La Agenda Digital del Gobierno de Chile para el período 2010–2014/ICT as a part of Chile’s Strategy for Development: Present Issues and Challenges
@ 2013 World Economic Forum

1.4: The Importance of National Policy Leadership
62 | The Global Information Technology Report 2013
Country/Economy Policy available?Year policy
was adopted Type Title/details
China Yes 2010 Initiative Three Network Convergence—National Government Investment
Colombia Yes 2011 Plan Live Digital—Vive Digital
Comoros Planned
Congo Yes 2009 Program West Africa Cable System (WACS)
Cook Islands Yes 2003 Policy National ICT Policy
Costa Rica Yes 2012 Strategy Estrategia Nacional de Banda Acha
Côte d'Ivoire Yes 2010 Strategy Objectifs Strategiques du Gouvernment de Côte d’Ivoire en Matiere de Telecommunications et de TIC
Croatia Yes 2011 Strategy Strategy for Broadband Development in the Republic of Croatia for 2012–2015
Cuba Planned
Cyprus Yes 2012 Strategy Digital Strategy for Cyprus, which includes the Broadband Plan
Czech Republic Yes 2011 Strategy Digital Czech Republic—State policy in electronic communications
Denmark Yes 2010 Plan Digital work program by the Minister of Science, Technology and Innovation.
Djibouti Yes 2004 Program Plan d’action national pour l’exploitation des TIC en République de Djibouti pour le développement national, EASSy
Dominican Republic Yes 2007 Program Conectividad Rural de Banda Ancha E-Dominicana (includes rural broadband connectivity program)
Ecuador Yes 2011 Plan Estrategia Ecuador Digital 2.0 and BB PLAN
Egypt Yes 2011 Plan National Broadband Plan: A Framework for Broadband Development
Equatorial Guinea Yes 2010
Estonia Yes 2006 Strategy Information Society Development Plan 2013
Ethiopia Yes 2005 Policy ICT Policy
Fiji Yes 2011 Policy National Broadband Policy
Finland Yes 2005 Project Broadband 2015 Project; Kainuu Information Society Strategy 2007–2015
France Yes 2010 Plan Plan national très haut débit
Gabon Yes 2011 Strategy Digital Gabon: vaste Programme de réformes multi sectorielles dont la finalité est de faire du Gabon un Pays Emergent, à travers les pilliers suivants: Gabon Industriel, Gabon vert et Gabon des Services
Gambia Yes 2008 Plan The Gambian ICT4D-2012 Plan
Germany Yes 2009 Strategy Breitbandstrategie der Bundesregierung
Ghana Yes 2010 Strategy Broadband Wireless Access
Greece Yes 2006 Plan Digital Strategy 2006–2013
Grenada Yes 2006 Strategy Information and Communication Technology (ICT): A Strategy and Action Plan for Grenada: 2006–2010
Guinea Yes 2009 Plan Plan National de frequences/Plan de développement de l’infrastructure nationale d’information et de communication de la République de Guinée 2001–2004
Guyana Yes 2011 Project E-Guyana
@ 2013 World Economic Forum

The Global Information Technology Report 2013 | 63
1.4: The Importance of National Policy Leadership
Country/Economy Policy available?Year policy
was adopted Type Title/details
Honduras Yes 2010 Policy Resolución NR 005/10—Normativa que regulará la prestación de servicios de telecomunicaciones con conectividad de banda ancha
Hungary Yes 2010 Plan Digital Renewal Action Plan
Hong Kong SAR Yes 2008 Strategy Digital 21
Iceland Yes 2005 policy Telecom Policy Statement 2005–2010; new policy statement coming
India Yes 2011 Plan National Optical Fibre Network
Indonesia Yes 2010 Strategy Priorities of the Ministry of Communication and Information Technology Year 2010–2014
Iraq Planned
Ireland Yes 2008 Strategy Ireland's Broadband Strategy
Israel Yes 2012 initiative The Communication Initiative: fiber-based national broadband network
Italy Yes 2010 Plan Italia Digitale (Digital Italy, Plan)
Jamaica Yes 2007 Strategy National ICT Strategy
Japan Yes 2010 Plan New Broadband Super Highway (Haraguchi vision II)
Jordan Yes 2007 Strategy National ICT Strategy of Jordan
Kazakhstan Yes 2010 Strategy Programme of ICT Development
Kenya Yes 2006 Plan ICT MasterPlan 2012-2017
Korea, Rep. Yes 2009 Plan Ultra Broadband Convergence Network
Latvia Yes 2005 Strategy Broadband development strategy for 2006–2012
Lebanon Yes 2008 Strategy Lebanese Broadband Stakeholders Group (LBSG)
Liberia Planned National fiber backbone network
Liechtenstein Yes 2006 Universal Access Service
Communications Act—Law on Electronic Communication
Lithuania Yes 2005 Strategy Strategy of Broadband Infrastructure Development in Lithuania in 2005–2010
Luxembourg Yes 2010 Strategy Stratégie nationale pour les réseaux à “ultra-haut” debit–L’ “ultra-haut” débit pour tous
Macedonia, FYR Yes 2005 Strategy National Strategy for the Development of Electronic Communications with Information Technologies
Malawi Yes 2003 Project An Integrated ICT-led socioeconomic development policy for Malawi
Malaysia Yes 2010 Plan National BB Implementation NBI
Malta Yes 2012 Policy Provision of access at a fixed location
Marshall Islands Planned
Mauritius Yes 2012 Policy National Broadband Policy 2012–2020 (NBP2012)
Mexico Yes 2011 Strategy Digital Agenda
Micronesia Planned
Moldova Yes 2010 Program Hotărâre cu privire la aprobarea Programului de dezvoltare a accesului la Internet în bandă largă pe anii 2010-2013
Mongolia Yes 2011 Program National Program on Broadband Network up to 2015
@ 2013 World Economic Forum

1.4: The Importance of National Policy Leadership
64 | The Global Information Technology Report 2013
Country/Economy Policy available?Year policy
was adopted Type Title/details
Montenegro Yes 2012 Strategy Strategy for the Development of Information Society 2012–2016—Montenegro–Digital Society
Morocco Yes 2012 Plan Plan national pour le développement du haut et très haut débit au Maroc
Namibia Yes 2009 Policy Telecommunications Policy for the Republic of Namibia
Nepal Planned Currently a draft under consultation
Netherlands Yes 2010 Strategy Digital Agenda
New Zealand Yes 2010 Plan Ultra-fast broadband initiative, Five Point Government Action Plan for faster broadband
Nicaragua Planned
Nigeria Planned Policy National ICT policy—draft
Norway Yes 2001 Plan Action Plan on Broadband communication
Oman Yes 2012 Strategy National Broadband Strategy
Pakistan Yes 2007 Program National Broadband policy 2004, National Broadband Programme 2007
Panama Yes 2008 Strategy National ICT Strategy 2008–2018—la Autoridad de Innovación Gubernamental
Papua New Guinea Yes 2011 Policy National ICT Policy and PNG LNG Fibre cable project
Paraguay Yes 2011 Plan Paraguay 2013 Conectado y Plan Nacional de Telecomunicaciones—PNT
Peru Yes 2010 Plan Plan Nacional Para el Desarrollo de la Banda Ancha en el Perú
Philippines Yes 2011 Strategy The Philippine Digital Strategy, Transformation 2.0: Digitally Empowered Nation
Poland Yes 2008 and 2010 Strategy and Law
The Strategy for the Development of the Information Society in Poland until 2013 Mega-Bill: The act on supporting the development of telecommunications services and networks
Portugal Yes 2010 Strategy Digital Agenda 2015 (2010–2015),
Qatar Yes 2011 Plan Qatar’s National ICT Plan 2015: Advancing the Digital Agenda; Qatar National Broadband Network (Q.NBN)
Romania Yes 2007 Strategy The Regulatory Strategy for the Romanian Electronic Communications Sector for 2007–2010
Russian Federation Yes 2010 Strategy Information Society Strategy Information Society Programme
Rwanda Yes 2006 Plan Regional Connectivity Infrastructure Program (RCIP)
Samoa Yes 2010 Plan Broadband Spectrum Plan
Saudi Arabia Yes 2010 Universal Access Service
USF strategic Plan, Kingdom's strategy for the deployment of broadband services (waiting for official approval)
Senegal Planned
Serbia Yes 2009 Strategy BB Strategy till 2012, Стратегију развојa широкопојасног
приступа у Републици Србији до 2012. Године (Strategy for the development of broadband in the Republic of Serbia until 2012)
Singapore Yes 2005 Strategy Intelligent Nation 2015 (or iN2015)
Slovak Republic Yes 2006 Program Operačný Program Informatizácia Spoločnosti (Operational Program- Information society)
@ 2013 World Economic Forum

The Global Information Technology Report 2013 | 65
1.4: The Importance of National Policy Leadership
Country/Economy Policy available?Year policy
was adopted Type Title/details
Slovenia Yes 2008 Strategy Strategija razvoja širokopasovnih omrežij v Republiki Sloveniji (Broadband Network Development Strategy)
Solomon Islands Planned
South Africa Yes 2010 Policy Broadband Policy for SA
Spain Yes 2010 Plan Plan Avanza: Plan Avanza: 2005, Plan Avanza 2 aprobado el 16/07/2010
Sri Lanka Yes 2012 Plan 2012 - HSBB NBP to be launched, e- Sri Lanka
St. Kitts and Nevis Yes 2006 Plan National Information and Communications Technology (ICT) Strategic Plan
St. Lucia Planned
St. Vincent and the Grenadines
Planned
Sudan Planned
Sweden Yes 2011 Strategy BB Strategy for Sweden
Switzerland Yes 2007 Universal Access Service
The universal service with regard to telecommunications
Tanzania Yes 2004 Project National Information Communication and Technology Broadband Backbone (NICTBB)
Thailand Yes 2010 Policy The National Broadband Policy
Taiwan, China Yes 2011 Policy Broadband for Villages and Broadband for Tribes
Togo Planned
Tonga Yes 2011 Project Tonga-Fiji Connectivity Project : Pacific Regional Connectivity Program (PRCP)
Trinidad and Tobago Yes 2008 Strategy Trinidad & Tobago’s National Information & Communication Technology Strategy-Fastforward—Accelerating into the Digital Future
Tunisia Yes 2012 policy
Turkey Yes 2006 Strategy Information Society Strategy 2006–2010; Ninth Development Plan 2007–2013
Uganda Yes 2009 Strategy Uganda Broadband Infrastructure Strategy National Position Paper
United Kingdom Yes 2010 Strategy Britain’s Superfast Broadband Future, Broadband Delivery UK
United States Yes 2010 Plan Connecting America: The National Broadband Plan
Vanuatu Planned
Vietnam Yes 2010 Plan Master Plan of Viet Nam, from 2010 to 2015 and Prime Minister's Decree 1755/QĐ-TTg on the approval of a National Strategy on Transforming Viet Nam into an advanced ICT country
Zimbabwe Yes 2005 Initiative Connection to the undersea cable initiatives promotes broadband usage
Source: ITU/UNESCO Broadband Commission for Digital Development (www.broadbandcommission.org), based on the ITU ICT Eye regulatory database, available at https://www.itu.int/ITU-D/icteye/.
@ 2013 World Economic Forum

@ 2013 World Economic Forum

The Global Information Technology Report 2013 | 67
CHAPTER 1.5
Fiber Broadband: A Foundation for Social and Economic GrowthSEAN WILLIAMS
BT
Sustainable, long-term growth in the European Union (EU) is vital to the overall health of the world economy. For a developed region such as the European Union, a significant proportion of growth is likely to come from knowledge-based industries, underpinned by information and communication technologies (ICTs). Indeed, the European Commission’s Europe 2020 vision describes such a future for the region in the Digital Agenda.1
The foundation for digital prosperity is fiber broadband Internet access, often referred to as superfast broadband. In describing the economic benefits of Internet adoption, a report for the McKinsey Global Institute says: “[broadband] infrastructure, the backbone of the entire Internet ecosystem, is an irreplaceable prerequisite. It creates the platforms upon which users, and organizations experience the Internet, and upon which entrepreneurs and businesses innovate.”2
Indeed, superfast broadband access has the potential to transform local economies, businesses, households, and public services. It will help improve the performance of existing firms, enable new businesses to emerge, and encourage flexible working patterns. Superfast broadband is key to opening global markets to regions previously denied access, providing new job opportunities, and boosting productivity.
Statistical evidence of the positive economic impact of broadband infrastructure has existed for some years. According to the Broadband Commission, a joint body of the United Nations Educational, Scientific and Cultural Organization (UNESCO) and the International Telecommunication Union (ITU), every 10 percent increase in broadband penetration results in additional growth of 1.3 percent in national gross domestic product (GDP).3 Similarly, in a 2011 study across 33 countries in the Organisation for Economic Co-operation and Development (OECD) by Chalmers University of Technology, consultancy Arthur D. Little and ICT vendor Ericsson found that doubling the broadband speed for an economy increases GDP by 0.3 percent.4
New research now available from Regeneris Consulting provides even greater detail about the potential economic impact of superfast broadband in urban and—crucially—less-developed rural areas, as demonstrated later in this chapter.5
Investment in fiber broadband also has the potential to deliver social goods, for example by improving public service levels in areas such as health, education, e-government, and democratic participation at lower cost than would be available offline. Evidence for social goods is anecdotal rather than statistical.
The idea that broadband infrastructure can drive economic development has been championed for some time. Indeed, broadband infrastructure, coupled with a functioning and fair market for access and services, is central to Europe 2020 and the Digital Agenda for Europe;6 it underlies similar strategies adopted by
@ 2013 World Economic Forum

1.5: Fiber Broadband
68 | The Global Information Technology Report 2013
OECD governments, including the UK government;7 and is espoused on a global scale by the Broadband Commission.8
However, much of the thinking behind these strategies predates the euro crisis. We need to recognize that the effects of the global financial crisis that began in 2007 are still being felt more than five years later—and even now, there is no immediate end in sight.
We no longer operate in a world where “build it and they will come” is a viable strategy for developing national-scale infrastructure. Nor are communication markets currently in a healthy state. Revenues are shrinking for telecommunication providers at the same time that operating costs are increasing because of the rising demand for data on networks.
How can the global, international, and national visions for universal broadband Internet access be fulfilled? Should these visions be put on hold until more favorable economic conditions emerge, or should they even be abandoned?
No, the big vision still holds promise. However, new means of execution—in terms of both technology and market dynamics—are required for an era where the public purse is tightly constrained and the ability of private firms to raise capital is diminished.
This chapter advances the debate first by reviewing recent independent research from the economic consultancy Regeneris Consulting, detailing the economic impact of high-speed broadband infrastructure
on environments as diverse as capital cities and economically deprived rural regions. Second, it aims to articulate technical and market solutions that can meet the challenge of the current economic climate.
ECONOMIC IMPACTBT recently commissioned Regeneris Consulting to assess the potential economic benefits of BT’s £2.5 billion investment in fiber broadband in the UK market,9 focusing on four areas:
• Norfolk and Suffolk, a rural area;• Caerphilly, a town in Wales;• Sunderland, a city in the northeast of England; and• London, the United Kingdom’s capital city.
As businesses increasingly move into the digital realm, fast Internet access is arguably more important than conventional physical infrastructures in supporting vital flexibility. Where fiber broadband is prevalent, businesses can be encouraged to remain in or relocate to regions previously excluded from traditional regeneration, creating jobs and bringing economic growth to those areas.
Supplying commercial premises with fiber broadband will help businesses grow and benefit the local economy by facilitating flexible working patterns, enabling new startup businesses, and helping to improve the performance of existing businesses (see Figure 1).
Figure 1: Economic impacts of superfast broadband
Source: Regeneris Consulting, 2012.
Flexible workingpatterns
New business
Improved performance of existing firms
@ 2013 World Economic Forum

The Global Information Technology Report 2013 | 69
1.5: Fiber Broadband
Improved performance of existing firmsFiber broadband will allow businesses to operate more efficiently and to develop new products and services:
• Small and medium-sized firms will be able to take advantage of the latest generation of online collaboration tools—such as file and document sharing, shared workspaces, and high-definition video conferencing—that, before the advent of fiber broadband, only large enterprises could afford to exploit.
• Real-time online collaboration among colleagues and business partners can accelerate decision making and time to market, and reduce delays and the need for business travel. By reducing or even eliminating the requirement to travel, it can reduce a firm’s carbon footprint and improve employees’ work-life balance.
• Several people can share the same connection and not notice any degradation in performance, even if they are using bandwidth-hungry applications such as video conferencing or uploading large files.
• In all types of business, interaction with customers and suppliers can also be enhanced—for example, by enabling slicker, more interactive e-commerce sites, and by reducing the time needed to upload product demonstrations and how-to videos to both the business’s own site and social media sites such as YouTube.
Regeneris expects knowledge-based industries, and the places where they are most concentrated, to exploit faster broadband most effectively and generate the greatest impacts. For example, the time required for transferring large files such as videos, graphic designs, or software applications can be cut from hours to minutes.
New businessesFiber broadband is expected to help greater numbers of new businesses emerge by reducing barriers to entry in certain sectors. Although there are many ways in which this can occur, cloud computing is perhaps the most significant because it dramatically reduces the required upfront capital and ongoing support costs of setting up in business and allows steady, flexible growth.
Superfast connectivity will also help firms of all sizes exploit cloud computing so they can scale their information technology (IT) systems dynamically to fit their business needs, obviating the requirement for firms to invest in server hardware and software licenses. This can further help relieve the IT burden by making remote data storage and backup easy to operate in the
background. The burden of security and upgrade falls to the service provider and not to the business.
The carrot of abundant fiber broadband can also encourage firms with purely digital business models to relocate to previously underdeveloped areas.
Flexible working patternsWidespread availability of fiber broadband will allow more flexible working patterns, opening up new employment opportunities and enhancing the productivity of existing staff. With fiber broadband, employees will be able to access data and applications from home, on the move, or at the premises of customers or suppliers with the same alacrity as they can in the office.
Regeneris estimated the cumulative impact on jobs and gross value-added (GVA) among new and existing firms exploiting faster, next-generation broadband services over 15 years. In conducting the analysis, it was assumed that the uptake and exploitation of faster services will, in time, approach those currently found for ADSL services. Regeneris drew on research from across Europe to inform these assumptions.
Findings in detailFor any one location—whether a rural area, a town, or a city—Regeneris found that fiber broadband could create between £143 million and £19.8 billion in additional GVA. This equates to an annual increase in GVA of between 0.3 percent and 0.5 percent.
For the rural area of Norfolk and Suffolk, for example, Regeneris found that fiber broadband could lead to:
• an annual increase in GVA of 0.3 percent per annum over 15 years: every £1 a business invests in fiber broadband in this rural area will create nearly £15 in additional GVA for the UK economy;
• roughly 1,470 business startups and support for 7,780 home workers as a result of cloud computing; and
• around 1,810 jobs created through business startups and increased levels of trading at existing businesses.
For the UK town of Caerphilly, Regeneris found that fiber broadband could lead to:
• an annual increase in GVA of 0.5 percent per annum over 15 years: every £1 a business invests in fiber broadband in this town will create nearly £16 in additional GVA for the UK economy;
• roughly 140 business startups and support for 1,030 home workers as a result of cloud computing; and
• around 225 jobs created through business startups and increased levels of trading at existing businesses.
@ 2013 World Economic Forum

1.5: Fiber Broadband
70 | The Global Information Technology Report 2013
For the UK city of Sunderland, Regeneris found that fiber broadband could lead to:
• an annual increase in GVA of 0.4 percent per annum over 15 years: every £1 a business invests in fiber broadband in this city will create nearly £14 in additional GVA for the UK economy;
• roughly 320 business startups and support for 1,580 home workers as a result of cloud computing; and
• around 436 jobs created through business startups and increased levels of trading at existing businesses.
For London, the United Kingdom’s capital city, Regeneris found that fiber broadband could lead to:
• an annual increase in GVA of 0.5 percent per annum over 15 years: every £1 a business invests in fiber broadband will create nearly £10 in additional GVA for the UK economy;
• roughly 6,600 business startups and support for 73,000 home workers as a result of cloud computing; and
• around 26,200 jobs created through business startups and increased levels of trading at existing businesses.
In some economically deprived areas of the United Kingdom, these dynamics are already at work. For example, a business in Northern Ireland called Print It For Me saves two hours a day that was previously spent waiting for files to download.10 It also saves £7,500 a year by using cloud-based backup for its IT systems, replacing onsite equipment. The business concept is relatively simple, but it would not be possible without the ability to handle large files quickly over fiber broadband.
These types of businesses attract creative, tech-savvy people who, in turn, bring prosperity to the region. With this in mind, Cornwall and the Isles of Scilly in the far west of England aim to become one of the best-connected rural areas in Europe.11
In September 2010, BT announced an investment of £78.5 million, backed up by a further £53.5 million from the European Regional Development Convergence funds and investment from the local authority of Cornwall and the Isles of Scilly. The intention was, and remains, to boost the local economy by attracting and retaining high-tech, high-growth, creative, and low-carbon businesses that make use of high bandwidth.
According to local authority leaders, the rollout will create an estimated 4,000 new jobs and protect a further 2,000 jobs that are currently under threat from the recession.
SOCIAL IMPACTWhat applies to businesses in terms of increased efficiency and effectiveness can also apply to public services. Online delivery of services can unlock significant cost savings and serve to increase levels of satisfaction among citizens.
Nevertheless, the social impact of superfast broadband is more difficult to quantify than its impact on jobs and economic performance. Real benefits around improved access to lifelong learning, social inclusion, more flexible working possibilities, and enhanced social capital may be realized through superfast broadband.12 Also evident is the blurred area where the wider economic impacts of superfast broadband take-up translate into social goods such as retained and created jobs, reduced transport congestion that in turn reduces costs, enabled virtual agglomeration, and improved economic adaptability and resilience.13
Enough anecdotal evidence has accumulated over the years to present a body of potential best practice, even though it is not easy to measure social impacts objectively. Some of this evidence is presented below.
Citizen servicesIn 2010, the Guldborgsund Municipality in Denmark opened what is arguably the first video-linked citizen services center in Europe.14 The center enables citizens in the remote region to receive one-on-one advice from government officials at a much lower cost than a staffed center could provide. Without this cost savings, the center would have had to close, depriving the citizen of this service. Other Danish municipalities are looking to adopt the concept.
On a more humble scale, the cost to the United Kingdom’s Driver Vehicle Licensing Agency of issuing vehicle excise licenses has been cut by 45 percent since the process was transferred online, saving around £8 million a year. The new system was used by 18 million people in 2008.15
Fiber broadband makes such systems intuitive and fluid to use.
HealthcareThese dynamics can also be applied to health services. For example, the US Veterans Health Administration (VHA), which provides healthcare for approximately 6 million military veterans, makes extensive use of e-health technologies.16 Telemedicine is used in radiology, mental health, cardiology, pathology, dermatology, and in-home care tele-consultations for patients with spinal cord injuries and those with other chronic conditions.
The current and previous US administrations have cited the VHA as a model for the rest of the US healthcare industry for providing efficient and effective medical care. Other health authorities are looking to learn from the VHA’s techniques.17
@ 2013 World Economic Forum

The Global Information Technology Report 2013 | 71
1.5: Fiber Broadband
Of course, hospitals cannot be replaced by broadband connections, but many health services lend themselves to online delivery. Among these telemedicine services are booking appointments; consulting with experts; and providing information about healthy diet, exercise, treatment, and recovery after illness or treatment.
EducationWith fiber broadband, similar models can also be applied to education. Academic establishments can offer remote access to live lectures and self-paced tuition as part of lifelong learning, bringing access to education to those who—because of a disability or for economic or social reasons—are unable to regularly attend an academic institution.
Numerous examples of this are already in use across academia, which has benefitted from the high-bandwidth Joint Academic Network (JANET) for many years. One such instance is the Blackboard virtual learning environment running at Bradford University in the north of England, which enables students and academic staff to collaborate remotely on learning materials.18
Local schools can also use remote-access, shared-learning facilities to enable parents to participate more in their children’s education and build a sense of community around the school. One example of this is Radio Sandaig, run by Sandaig primary school in Scotland.19
Furthermore, fast broadband access enables existing health and education establishments to amplify the services they can offer in the region by tapping into the expertise available in national and even international centers of excellence.
AFFORDABLE FIBERHow will the vision for a sustainable, growing economy and improved society built on fiber broadband be achieved when the public coffers are all but empty and private capital expenditure is laboring under severe constraint?
The answer to this lies in two places: the technology used for fiber broadband, and the dynamics of a competitive market for access and value-added services. Deployment needs to be as efficient as possible, making the best use of the resources available and minimizing disruption associated with the transition.20
Why not mobile?With the arrival of 4G wireless infrastructure in various parts of Europe, the mobile phone network now offers connection speeds that potentially match those of fixed broadband. Tests show that early 4G networks are typically capable of delivering 36 Mb/s download and 16 Mb/s upload speeds.21 Economically loaded commercial networks in the field are, realistically, likely to be considerably below these speeds. So could mobile, rather than fixed wire, provide a viable economic infrastructure for superfast broadband?
The problem here is one of cost of deployment in a capital-constrained environment: mobile requires expensive new infrastructure and wireless spectrum is rationed, whereas fixed wire can leverage the telephone infrastructure already in place.
Furthermore, wireless uses a shared resource for connection to the customer. Thus, the more bandwidth customers consume, the more spectrum and/or base stations are required, so costs increase rapidly with uptake. Eventually this becomes uneconomic. Fixed-wire broadband has a far more graceful capacity-uplift roadmap, even when hybrid fiber/copper solutions, such as fiber-to-the-cabinet (FTTC), are deployed.
Arguably, a pure fiber infrastructure—where a fiber connection is provided to every subscribing premise (FTTP, also known as FTTx or FTT-home/-premise/-subscriber)22—is unlikely ever to be capacity-constrained because operators can simply add wavelengths to increase capacity if needed. However, the economic costs of universal FTTP delivery are prohibitive.
That said, high-speed mobile data does have a role to play in a superfast infrastructure, as an in-fill technology to reach remote communities where fixed line is uneconomic (see the section “Reaching the rest,” below).
Why FTTC?Where insufficient funding for the universal deployment of FTTP but an established copper telephone infrastructure exists, then FTTC makes economic sense because it leverages assets already in place, minimizes local disruption during rollout, and avoids the most expensive and complex replacement of individual connections to individual premises while still delivering very high broadband speeds.
Dogmatic attachment to FTTP as the only technology solution appropriate for fiber networks is actually a barrier to investing in fiber broadband because it massively increases the cost and disruption, undermines the business case, and thus delays deployment.23
The criticism leveled at FTTC is that it is not future-proofed. Further expenditure will be incurred in the future to upgrade the network to FTTP as demand for bandwidth increases. However, experience has shown that there is plenty of headroom in FTTC technology for bandwidth increases.
BT’s FTTC network in the United Kingdom is currently able to deliver up to 80 Mb/s downstream and up to 20Mb/s upstream speeds (depending on line lengths).24 This is double the speed obtainable from the technology available only 18 months ago, and is comfortably in excess of the Digital Agenda’s aim of a minimum coverage of 30 Mb/s.25
Technology providers are developing solutions that could deliver over 200 Mb/s on FTTC. Future
@ 2013 World Economic Forum

1.5: Fiber Broadband
72 | The Global Information Technology Report 2013
technologies, such as G.fast, could see speeds measured in gigabits over the final copper connection.26
That said, local factors such as housing density and copper line length also have a significant impact on the economics of technology choice.
Competitive marketThe other foundation for achieving an affordable and sustainable rollout of fiber broadband is a market for access and value-added services that serves to keep down consumer prices while ensuring high service levels and continued investment in the network. An environment that supports a large number of wholesale telecommunication providers and retail Internet service providers (ISPs) can enable this; it is also in the interests of consumers and the major network operators.
The UK example shows that a healthy number of wholesale telecommunication providers and retail ISPs is an important driver for achieving and maintaining a high number of end-subscribers, which underpins the business case for network investment.27
Competition drives down prices. If a retail ISP increases its price, there are dozens of others to which customers can turn. Competition also ensures that service standards are kept high. If a service provider lets standards slip, there are dozens of others waiting to snap up their customers. If any service provider withdraws from the market, customers have a choice of dozens of others to take their place.
BT is making the biggest purely commercial investment in fiber access without state aid in Europe, and is rolling out this fiber more quickly than any other provider. Already about 60 ISPs are testing BT’s fiber product.28 Its fiber broadband package has the same headline price as copper-based broadband to encourage rapid customer uptake.
Early indications show that this strategy is working. Plotted against similar fiber rollouts in Europe and Japan, BT appears to be ahead of the curve in terms of penetration and subscriber uptake (see Figures 2, 3, and 4). The UK government has committed to a target of having the best superfast broadband in Europe by 2015.
REACHING THE RESTIf superfast broadband is to fulfill its promise of contributing to social and economic growth in the most impoverished areas of the globe, it needs to connect all citizens, even those who are in the most remote regions.
The commercial business case for fiber investment will always fall short of full national coverage. That is just a fact of life for communication networks: as customers become more dispersed and more remote, the costs of reaching them become uneconomic.
Nevertheless, the Digital Agenda calls for 100 percent coverage of the population with a minimum of 30 Mb/s broadband by 2020. Public funding should be focused on reaching those outside the range of economically viable private investment.
In the United Kingdom, the government has pledged to provide £530 million to reach customers in the “final
Figure 2: Growth of superfast broadband household penetration, European Union
0
3
6
9
12
15
2012
Q2
2011
04
2011
Q2
2010
Q4
2010
Q2
2009
Q4
2009
Q2
2008
Q4
2008
Q2
2007
Q4
2007
Q2
2006
Q4
2006
Q2
2005
Q4
2005
Q2
2004
Q4
2004
Q2
2003
Q4
2003
Q2
2002
Q4
2002
Q2
Pene
trat
ion
(% a
ll ho
useh
olds
)
Source: BSG, 2012.
Belgium Denmark France Germany Italy Netherlands Portugal Spain Sweden United Kingdom United States
@ 2013 World Economic Forum

The Global Information Technology Report 2013 | 73
1.5: Fiber Broadband
Figure 3: Penetration of superfast broadband homes passed, United Kingdom and Japan
0
3
6
9
12
15
Yr3 Q4 Yr3 Q3 Yr3 Q2 Yr3 Q1 Yr2 Q4 Yr2 Q3 Yr2 Q2 Yr2 Q1 Yr1 Q4 Yr1 Q3 Yr1 Q2 Yr1 Q1
Pene
trat
ion
(% h
omes
pas
sed)
Number of quarters since the service was launched
Source: BSG, 2012.
United Kingdom Japan
Figure 4: Superfast broadband subscriber growth, United Kingdom and Japan
0
1
2
3
4
5
6
7
8
Yr3 Q4 Yr3 Q3 Yr3 Q2 Yr3 Q1 Yr2 Q4 Yr2 Q3 Yr2 Q2 Yr2 Q1 Yr1 Q4 Yr1 Q3 Yr1 Q2 Yr1 Q1
Pene
trat
ion
(% a
ll ho
useh
olds
with
sub
scrip
tion)
Number of quarters since the service was launched
Source: BSG, 2012.
United Kingdom Japan
@ 2013 World Economic Forum

1.5: Fiber Broadband
74 | The Global Information Technology Report 2013
third,”29 who fall outside the viable business case for private network development. BT believes that public funding and additional private investment could bring fiber broadband delivering up to 80 Mb/s to 90 percent of the United Kingdom by the end of 2017, as well as ensuring that perhaps 99 percent of premises are able to access broadband of more than 2 Mb/s.
Achieving 99 percent coverage would still leave some 280,000 premises unconnected, but technologies that are able to fill this gap—such as fixed copper and fiber networks or satellite and terrestrial wireless solutions—could be deployed to reach these premises. For example, in the remotest parts of the west of England, trials to use the 4G mobile network,30 along with wireless broadband in interleaved television spectrum for delivering broadband to the very last premises, are under way.
CONCLUSIONThe vision of social and economic growth through fiber broadband infrastructure that underpins a growth in knowledge- and ICT-based jobs still holds promise. The Regeneris research adds detail to a growing body of evidence.
Specifically, Regeneris found that, from rural areas, such as Norfolk and Suffolk, through towns and cities to the capital, fiber broadband could lead to a significant annual increase in GVA and the creation of jobs through business startups and improved business performance. Telecommunication providers such as BT can point to economically deprived areas, such as Cornwall and Northern Ireland, where these findings are apparent.
As Europe and the wider developed world attempts to emerge from the recent financial crisis and downturn, such growth will be vital.
The potential for social growth is strongly linked to economic growth: an increase in jobs and prosperity, along with a shift from waning high-carbon industries to low-carbon, knowledge-based businesses and reductions in travel and emissions all provide a social benefit as well as an economic one. Evidence of social growth is more anecdotal than evidence of economic growth that is more easily measured—how does one measure social growth?—but there are enough anecdotal examples to build a sound case.
The issue, then, is not whether or not fiber broadband can help drive social and economic growth, but instead how to achieve coverage as close as possible to 100 percent with minimum public expenditure. This chapter argues for market-based strategic solutions that governments and regional authorities are strongly urged to adopt.
First, technical neutrality is fundamental. Governments do not have a good track record of picking technology winners and should let the market choose solutions likely to attract the highest degree of private
investment. These solutions are likely to be those that leverage existing telecommunication assets.
This may mean surrendering a dogmatic attachment to deploying a pure fiber network. However, experience has shown that hybrid fiber/copper technologies, such as FTTC, can provide superfast broadband speeds and are continuously increasing their potential speeds, and at considerably lower costs and with less disruption than deploying pure fiber to every end point. Surely it is better to be able to afford superfast broadband for as close as possible to 100 percent of the population than to adhere to a technical specification that inhibits investment and leaves more of the population unconnected.
Second, both the infrastructure and the market for services must be designed to encourage competition. It is more efficient to build a common superfast broadband infrastructure shared by many equally competing service providers than to build multiple competing infrastructures. However, the common infrastructure provider must be regulated to prevent it from exploiting a monopolistic position, and the infrastructure must remain open to service-level competition. As shown in this chapter, multiple competing service providers can drive down prices and maintain high service levels for consumers.
Whether infrastructure providers are one or many, standardization at the system level is vital. Retail margins are wafer thin, so retail ISP systems for order handling, billing, repair, and so on need to be highly automated and integrated with wholesale telecommunication provider systems.
With the large majority of population coverage achieved through private investment, limited public funds can be focused on the most remote areas that are beyond the reach of the private business case.
NOTES 1 See European Commission 2010a for details about the Europe
2020 vision; see European Commission 2010b for the Digital Agenda for Europe.
2 du Rausas et al. 2011.
3 Broadband Commission 2010.
4 Ericsson 2011.
5 Regeneris Consulting 2012.
6 European Commission 2010a; 2010b.
7 BIS 2009.
8 Broadband Commission 2011.
9 Regeneris Consulting 2012.
10 See http://www.btplc.com/ngb/Casestudies/Business/Printitforme.pdf.
11 Charlesworth 2010.
12 BSG 2008.
13 BSG 2008.
14 Cisco 2011.
@ 2013 World Economic Forum

The Global Information Technology Report 2013 | 75
1.5: Fiber Broadband
15 BIS 2009.
16 Empirica, Work Research Centre, and the Institute of Integrated Study 2009.
17 Cruickshank 2012.
18 See http://www.bradford.ac.uk/management/about-the-school/student-resources/blackboard/ .
19 See http://www.sandaigprimary.co.uk/radio_sandaig/index.php.
20 See BSG 2008.
21 BBC News 2012.
22 See Wikipedia, “Fiber to the x” entry. Available at http://en.wikipedia.org/wiki/Fiber_to_the_x.
23 The Broadband Stakeholders Group released a report that estimated that FTTP to the entire United Kingdom would cost £28.8 billion. The report also looks at “whether an initial deployment of FTTC would inhibit a subsequent upgrade to FTTH. From a pure cost perspective it is not clear that this would be a problem. About 50% of the initial FTTC investment could be re-used in an FTTH upgrade.” Analysys Mason for the BSG 2008, p. 4.
24 Jackson 2012; see also BT 2010, p. 17; and the BT Openreach Fact Sheet, available at http://www.openreach.co.uk/orpg/home/products/super-fastfibreaccess/fibretothecabinet/fttc/downloads/GEA_FTTC_3.pdf.
25 See European Commission 2010b.
26 Maes 2012.
27 Ofcom 2010.
28 BT 2012, p. 45.
29 GOV.UK DCMS 2013.
30 BT 2011a, 2011b.
REFERENCESAnalysys Mason for BSG. 2008. The Costs of Deploying Fibre-Based
Next-Generation Broadband Infrastructure: Final Report. Report commissioned by the Broadband Stakeholder Group. Cambridge, UK: Analysys Mason Ltd. Available at http://www.dc10plus.net/resources/documents/http___www.broadbanduk.pdf.
BBC News. 2012. “4G Speed Put to the Test.” BBC News Technology, October 2. Available at http://www.bbc.co.uk/news/technology-19805535
BIS (Department for Business, Innovation & Skills). 2009. Digital Britain: Final Report. London: Department for Culture, Media & Sport and Department for Business, Innovation & Skills. Available at http://webarchive.nationalarchives.gov.uk/+/http://www.culture.gov.uk/images/publications/digitalbritain-finalreport-jun09.pdf.
Broadband Commission. 2010. A 2010 Leadership Imperative: The Future Built on Broadband. A report by the Broadband Commission. ITU and UNESCO, September. Available at http://www.broadbandcommission.org/Reports/Report_1.pdf.
———. 2011. Broadband: A Platform for Progress A report by the Broadband Commission. ITU and UNESCO, June. Available at http://www.broadbandcommission.org/Reports/Report_2.pdf.
BSG (Broadband Stakeholder Group). 2008. A Framework for Evaluating the Value of Next Generation Broadband, June. London: Plum Consulting. Available at http://broadband.cti.gr/el/download/BSG_Value_of_next_generation_broadband_06_2008.pdf.
———. 2012. Demand for Superfast Broadband: Understanding Demand in Europe, the US and Asia; How the UK Is Currently Performing; and What Might Impact Take-Up in the UK in the Future. London: Broadband Stakeholder Group. Available at http://www.broadbanduk.org/wp-content/uploads/2012/11/superfastbroadband.pdf.
BT. 2010. BT Group plc Annual Report 2010. Available at http://www.btplc.com/Sharesandperformance/Annualreportandreview/pdf/BTGroupAnnualReport2010.pdf.
———. 2011a. “Everything Everywhere and BT Wholesale to Deliver the UK’s First Live Customer Trial of 4G High Speed Broadband Technology.” BT Press Release, May 25. Available at http://www.btplc.com/news/Articles/ShowArticle.cfm?ArticleID=30F2E8DB-DFEC-4D1F-90E8-77D089DCD576.
———. 2011b. “Everything Everywhere and BT Wholesale Kick-Off 4G Live Trial.” BT Press Release, October 6. Available at http://www.btplc.com/news/Articles/ShowArticle.cfm?ArticleID=0B0E2C53-C4B2-4595-8BE7-B5E41C799023.
———. 2012. BT Annual Report and Form 20-F2012. Available at http://www.btplc.com/Sharesandperformance/Annualreportandreview/pdf/BTAnnualReport2012_smart.pdf.
Charlesworth, A. 2010. “Fibre Boosts Cornish Bid for Digital Business.” computing.co.uk, October 1. Available at http://www.computing.co.uk/ctg/news/1863412/fibre-boosts-cornish-bid-digital-business.
Cisco. 2011. “ Guldborgsund Municipality Enhances Citizen Services via Pervasive Video.” Cisco. Available at http://www.cisco.com/en/US/solutions/collateral/ns813/guldborgsund_cStudy.pdf.
Cruickshank, J. 2012. Telehealth: What Can the NHS Learn from Experience at the US Veterans Health Administration? London: 2020health.org. Available at http://www.2020health.org/2020health/Publication-2012/publications-2012/Telehealth.html.
du Rausas, M. P., J. Manyika, E. Hazan, J. Bughin, M. Chui, and R. Said. 2011. Internet Matters: The Net’s Sweeping Impact on Growth, Jobs, and Prosperity, May. McKinsey Global Institute. Available at http://www.mckinsey.com/insights/mgi/research/technology_and_innovation/internet_matters.
Empirica, Work Research Centre, and the Institute of Integrated Study, Vienna University of Technology. 2009. ICT & Ageing: European Study on Users, Markets and Technologies. Study funded by the European Commission. Bonn: Empirica. Available at http://www.ict-ageing.eu/?page_id=1325.
Ericsson. 2011. “New Study Quantifies the Impact of Broadband Speed on GDP.” Press Release, September 27. Available at http://www.ericsson.com/news/1550083.
European Commission. 2010a. Europe 2020: A Strategy for Smart, Sustainable and Inclusive Growth. Brussels: European Commission. Available at http://ec.europa.eu/eu2020/pdf/COMPLET%20EN%20BARROSO%20%20%20007%20-%20Europe%202020%20-%20EN%20version.pdf/.
———. 2010b. Digital Agenda for Europe: A Europe 2020 Initiative. Available at http://ec.europa.eu/digital-agenda/.
GOV.UK. DCMS (Department for Culture, Media & Sport). 2013. Policy: Stimulating Private Sector Investment to Achieve a Transformation in Broadband in the UK by 2015. Published February 27. Available at http://www.culture.gov.uk/what_we_do/telecommunications_and_online/7763.aspx.
Jackson, M. 2012. “BT Makes its 80Mbps Superfast FTTC Broadband Upgrade Available to ISPs.” ISPreview. Posted April 10. Available at http://www.ispreview.co.uk/index.php/2012/04/bt-makes-its-80mbps-superfast-fttc-broadband-upgrade-available.html.
Maes, J. 2012. “G.fast: Shifting the Limits of Copper.” At the Speed of Ideas, January 19. Bell Labs, Alcatel-Lucent. Available at http://www.uknof.org.uk/uknof21/Maes-Gfast.pdf.
Ofcom. 2010. “Review of the Wholesale Local Access Market: Statement.” Ofcom, July 10. Available at http://stakeholders.ofcom.org.uk/consultations/wla/statement.
Regeneris Consulting. 2012. Superfast Broadband: Boosting Business and the UK Economy. Report commissioned by BT. London: BT. Available at http://www.btsocialstudy.co.uk/investing_in_broadband.html.
@ 2013 World Economic Forum

@ 2013 World Economic Forum

The Global Information Technology Report 2013 | 77
CHAPTER 1.6
The Economic Impact of Next-Generation Mobile Services: How 3G Connections and the Use of Mobile Data Impact GDP GrowthCHRIS WILLIAMS
DAVIDE STRUSANI
DAVID VINCENT
DAVID KOVO
Deloitte LLP
Mobile communication services have become an essential part of how economies work and function, and the mobile telecommunication sector continues to offer unprecedented opportunities for economic growth in both developing and developed markets.
A series of studies have found a link between mobile penetration and economic growth.1 Mobile phones have improved communication, enhanced social inclusion, and expanded economic activity and productivity in sectors such as agriculture, healthcare, education, and finance.
Against this backdrop, Deloitte and the GSM Association (GSMA) have performed a comprehensive and up-to-date analysis of the role that basic mobile phone services play in generating economic growth.2 The study concludes that, in developing markets, increases in mobile penetration benefit gross domestic product (GDP) growth per capita and boost country productivity.
As technology develops, mobile services have the potential of impacting a country’s economy by providing high-value 3G and 4G data services that are accessed via smartphones, tablets, and dongles that deliver mobile data services to businesses and consumers. The relationship among economic growth, 3G telephony, and mobile data use has not yet been explicitly explored; this chapter seeks to address this gap.
The chapter presents the first study of (1) the impact on GDP per capita growth of consumers substituting a 3G connection for a 2G connection, and (2) the impact of increasing the usage of mobile data per 3G connection, based on data from Cisco Systems. The details of the econometric analysis conducted are reported in more detail in a 2012 report prepared by Deloitte for the GSMA.3
THE IMPACT OF 3G PENETRATION ON GDP GROWTHAs mobile telephony markets become more mature, the benefits to be derived from basic mobile voice and text services on growth and productivity are achieved. Although the impact of 2G services is significant, as more developed 3G technology replaces 2G, an incremental economic impact is observed. Differential economic growth is supported because these
Deloitte refers to Deloitte LLP, the UK member firm of Deloitte Touche Tohmatsu Limited (DTTL). Please see www.deloitte.co.uk/about for a detailed description of the legal structure of DTTL and its member firms. This publication contains general information only, and none of DTTL, its member firms, or their related entities (collectively, the Deloitte Network) is, by means of this publication, rendering professional advice or services. Before making any decision or taking any action that may affect your finances or your business, you should consult a qualified professional adviser. No entity in the Deloitte Network shall be responsible for any loss whatsoever sustained by any person who relies on this publication.
Particular thanks are owed to Gabriel Solomon (GSMA) and Robert Pepper (Cisco Systems) for their feedback on earlier drafts.
@ 2013 World Economic Forum

1.6: The Economic Impact of Next-Generation Mobile Services
78 | The Global Information Technology Report 2013
technology changes allow consumers and businesses to benefit from high-value wireless data and content services. This relationship had not yet been explicitly quantified yet.
The penetration of 3G technology—measured as the number of 3G connections per 100 people—has increased significantly worldwide in recent years: by 2011, 3G penetration had reached over 60 percent of the population in Western Europe and over 90 percent in the United States. This growth is supported by the availability of devices such as phones with 3G capabilities, smartphones, and tablets, all of which have recently proliferated.
In developed markets, where basic mobile penetration has long exceeded 100 percent, as well as in the higher-income consumer and business user segments in developing markets, a substitution effect has taken place in mobile telephony whereby mobile users who previously consumed standard services have been acquiring 3G connections. Although this substitution does not necessarily increase total mobile penetration, this section of the chapter quantifies the effect on GDP growth of consumers and businesses substituting a standard 2G mobile connection with a 3G connection.
The econometric approach adopted to measure this effect follows previous work on the impact of mobile penetration on GDP growth.4 Including both total mobile penetration and 3G penetration in the econometric model allows us to interpret the coefficient of the 3G penetration variable as the impact of increasing
3G penetration while keeping all other factors equal, including total mobile penetration.
The central issue of reverse causality between mobile and 3G penetration and income growth, whereby higher levels of mobile and 3G penetration are expected to affect GDP but also higher income levels affect penetration, was given explicit consideration. We employed the generalized method of moments estimator of Arellano and Bond (1991), whereby mobile penetration and 3G penetration are instrumented using their own lags.
A panel of 96 countries was constructed with data covering 2008 through 2011.5 Years before 2008 were not included in the analysis because of the late development of 3G networks in many countries.
The annual growth rate of real GDP per capita was expressed as a function of the lag of real GDP per capita, 3G penetration, mobile penetration, and a set of four determinants of growth. These determinants are government expenditure, trade volumes, aggregate investment, and total labor force. All variables have been transformed into logarithmic form.
This analysis finds that, for a given level of mobile penetration and across the whole sample of countries considered, those countries that had a 10 percent higher 3G penetration between 2008 and 2011 experienced an increase in their average annual GDP per capita growth rate of 0.15 percentage points.
These results indicate that countries with a proportionately higher share of 3G connections enjoy greater GDP per capita growth than countries with
+0.9% GDPper capital
growth
+1.5% GDPper capital
growth
+3% GDPper capital
growth
91%
+10%5%
79%
+10%
10%
108%
+10%
16%
Colombia Indonesia South Africa
n Average mobile penetration (2008–11) 10 percentage point increase in 3G penetration
n Average 3G penetration (2008–11)
Figure 1: Potential impact of a 10 percentage point 3G penetration increase, selected countries
Source: Deloitte analysis.Note: The size of the circle reflects the increase in GDP per capita growth due to the 10 percentage point increase in 3G penetration.
@ 2013 World Economic Forum

The Global Information Technology Report 2013 | 79
1.6: The Economic Impact of Next-Generation Mobile Services
comparable total mobile penetration but lower 3G penetration.
For a similar absolute increase in the number of 3G connections, those countries with lower initial 3G penetration experienced a higher impact on GDP per capita growth. To consider three specific countries—Colombia, Indonesia, and South Africa: if each country had 10 more 3G connections per 100 total connections—that is, an increase of 10 percentage points—Colombia would have enjoyed an additional growth rate in GDP per capita of 3 percentage points, Indonesia would have generated an additional growth in GDP per capita of 1.5 percentage points, and South Africa would have enjoyed an additional 0.9 percent GDP per capita growth (Figure 1).
THE IMPACT OF MOBILE DATA ON GDP GROWTHThe increase in 3G connections, supported by the proliferation of data-enabled devices that allow mobile Internet connectivity, has led to massive growth in mobile data usage.
The Cisco Systems Visual Networking Index shows that, on average, total mobile data usage has more than doubled every year from 2005 to 2010 in each country in the sample.6 In the United States, mobile data usage grew, on average, by 400 percent a year between 2005 and 2010, while in the Western European countries considered, it grew by an average of 350 percent. In countries such as Brazil, China, and India, total usage has also more than doubled, on average, every year since mobile data was introduced.
Mobile data usage per 3G connection also more than doubled, on average, every year from 2005 to 2010 in each country in the sample, despite the considerable increase in 3G connections. In the United States, mobile data usage per 3G connection grew, on average, by more than 300 percent a year between 2005 and 2010, while in the Western European countries considered it grew by 170 percent over the same period.
Growth in mobile data consumption, by transforming the way in which consumers and businesses operate and communicate, has had a notable impact on economic growth through increased productivity effects and economic activity. However, given the limited availability of data, this impact has not been fully investigated before.
For the first time, using detailed information provided by Cisco Systems on mobile data usage between 2005 and 2010 in 14 countries for which historical disaggregated data is available,7 mobile data usage for each 3G connection in a country can be calculated.
The econometric approach introduced by Arellano and Bond (1991) made it possible to address the potential endogeneity of mobile penetration and mobile data usage by instrumenting these variables using their own lags. This technique also best exploits the information—such as the cross-country variation in the sample and the variation within countries across time—contained in the dataset.
The annual growth rate of real GDP per capita was expressed as a function of the lag of real GDP per capita, mobile penetration, mobile data usage per 3G
Figure 2: The effect of doubling mobile data usage per 3G connection
0.0 0.5 1.0 1.5 2.0 2.5
0.0
0.3
0.6
0.9
1.2
1.5
India
China South Africa
Mexico United States
BrazilFrance
ItalyGermany
Korea, Rep.United Kingdom
Russian Federation
Japan
Canada
Average usage per 3G connection (GB/year)
Incr
ease
in g
row
th r
ate
of G
DP p
er c
apita
(%)
Source: Deloitte analysis.
@ 2013 World Economic Forum

1.6: The Economic Impact of Next-Generation Mobile Services
80 | The Global Information Technology Report 2013
connection, and a set of determinants of growth such as aggregate investment and labor force. Logarithms of all variables were used, with the exception of mobile penetration and mobile usage, to which the inverse hyperbolic sine transformation has been applied. An additional parameter has also been included within each inverse hyperbolic sine transformation to accommodate more general forms of nonlinearity.
This analysis finds a positive relationship between the volume of mobile data used by each 3G connection and increases in economic growth. On average, across the sample of 14 countries considered, if countries doubled their consumption of mobile data per 3G connection between 2005 and 2010, they would have experienced a growth rate of GDP 0.5 percentage points each year.
The results indicate that mobile data usage per 3G connection has a positive effect on the growth rate of GDP per capita. This effect grows linearly with the initial level of data usage per 3G connection in the country: countries with a higher average level of mobile data consumption per 3G connection experience a larger impact on GDP per capita growth from increasing this consumption (Figure 2).
Countries such as Russia, the United Kingdom, and the Republic of Korea—which are characterized by a higher level of data usage per 3G connection—experience an increase in GDP per capita growth of up to 1.4 percentage points. The effect is more limited for countries that are still developing mobile data usage, such as China, India, Mexico, and South Africa, supporting scope for further growth.
CONCLUSIONThis work has shown that, as more-developed 3G technology substitutes for 2G technology, there is a strong incremental impact on economic growth.
Although the study represents the first attempt to quantify the impact of advanced mobile telephony on GDP per capita growth, related studies consistently suggest that the adoption and use of successive new generations of mobile devices (i.e., consumers switching from 2G to 3G technologies and from 3G to 4G) have generated positive impacts also on employment growth.8
This economic growth is enhanced by the usage of mobile data services, which has boomed in developed markets in recent years and has a positive effect on an economy’s GDP per capita growth.
To achieve the benefits highlighted in this chapter, governments must focus on increasing 3G and potentially 4G penetration in markets where mobile data services are still developing by encouraging the substitution of basic mobile services with more advanced connections and by supporting a fast increase of mobile data consumption.
NOTES 1 Qiang and Rossotto with Kimura 2009; Waverman, Meschi, and
Fuss 2005; Deloitte 2006; Andrianaivo and Kpodar 2011; Lee, Levendis and Gutierrez 2009.
2 Deloitte 2012.
3 Deloitte 2012.
4 See Andrianaivo and Kpodar 2011; Lee, Levendis, and Gutierrez 2009.
5 See Deloitte 2012. These are the 96 countries for which 3G penetration data were available from 2008.
6 See Cisco VNI Mobile Highlights at http://www.cisco.com/web/solutions/sp/vni/vni_mobile_forecast_highlights/index.html; Cisco Systems has provided disaggregate historic data on mobile data usage for the purposes of this study.
7 The 14 countries for which data were available are Brazil, Canada, China, France, Germany, India, Italy, Japan, the Republic of Korea, Mexico, Russia, South Africa, the United Kingdom, and the United States.
8 For example, Shapiro and Hassett 2012.
REFERENCESAndrianaivo, M. and K. Kpodar. 2011. “ICT, Financial Inclusion, and
Growth: Evidence from African Countries.” IMF Working Papers. Washington, DC: IMF.
Arellano, M. and S. Bond. 1991. “Some Tests of Specification for Panel Data: Monte Carlo Evidence and an Application to Employment Equations.” Review of Economic Studies 58 (2): 277–97.
Cisco. VNI Mobile Forecast Highlights, 2012–2017. Available at http://www.cisco.com/web/solutions/sp/vni/vni_mobile_forecast_highlights/index.html.
Deloitte. 2006. Global Mobile Tax Review 2006–2007. Report prepared for the GSM Association. Available at http://www.gsma.com/newsroom/wp-content/uploads/2012/03/taxreport1.pdf.
———. 2012. What Is the Impact of Mobile Telephony on Economic Growth? Report prepared for the GSM Association. Available at http://www.gsma.com/publicpolicy/wp-content/uploads/2012/11/gsma-deloitte-impact-mobile-telephony-economic-growth.pdf.
Lee, S. H., J. Levendis, and L. Gutierrez. 2009. “Telecommunications and Economic Growth: An Empirical Analysis of Sub-Saharan Africa.” Serie Documentos de Trabajo no. 64. Available from SSRN at http://ssrn.com/abstract=1567703.
Qiang, C. Z.-W. and C. M. Rossotto (with K. Kimura). 2009. “Economic Impacts of Broadband.” In Information and Communications for Development: Extending Reach and Increasing Impact. Washington, DC: World Bank. 35–50.
Shapiro, R. J. and K. A. Hassett. 2012. “The Employment Effects of Advances in Internet and Wireless Technology: Evaluating the Transitions from 2G to 3G and from 3G to 4G.” Report. Washington, DC: New Policy Institute and NDN. Available at http://www.sonecon.com/docs/studies/Wireless_Technology_and_Jobs-Shapiro_Hassett-January_2012.pdf.
Waverman, L., M. Meschi, and M. Fuss, 2005. “The Impact of Telecoms on Economic Growth in Developing Markets.” The Vodafone Policy Paper Series (2): 10–23. Available at http://www.vodafone.com/content/dam/vodafone/about/public_policy/policy_papers/public_policy_series_2.pdf.
@ 2013 World Economic Forum

The Global Innovation Technology Report 2013 | 81
CHAPTER 1.7
Better Measurements for Realizing the Full Potential of Health Information Technologies
ELETTRA RONCHI, Organisation for Economic
Co-operation and Development
JULIA ADLER-MILSTEIN, University of Michigan
GENNA R. COHEN, University of Michigan
LAURA P. WINN, Harvard School of Public Health
ASHISH K. JHA, Harvard School of Public Health
Understanding the challenges to the adoption and effective use of information and communication technologies (ICTs) in health systems, along with their broader economic impacts, is critical to achieving their widespread penetration and to realizing the potential benefits to be had from their application. Today, ICT sophistication and the range of possible uses in the health sector are enormous. There is strong evidence that ICT implementation, when done effectively, can result in healthcare that is higher quality, safer, and more responsive to patients’ needs as well as more efficient (appropriate, available, and less wasteful). Advocates point to the potential reduction in medication errors in particular as a critical advantage. There is also growing evidence that health ICTs are essential to support the development of new, innovative models of care delivery.1
In addition to these health-related objectives, most governments in the Organisation for Ecoomic Co-operation and Development (OECD) countries recognize that health ICTs represent new and significant opportunities for economic growth. The global market for health ICT products and services is estimated at US$96 billion and growing.2 In Europe, this sector includes a number of large European-based companies as well as an estimated 5,000 small- and medium-sized enterprises (SMEs) operating in various subsectors of e-health. E-health is considered one of the six most promising lead markets of the European Union.3 Greater adoption of health ICTs is, therefore, projected to increase the demand for developers and skilled workers to implement, support, and use these technologies.
Despite their tremendous promise, incorporating ICTs into daily use in healthcare has proven difficult. More than two decades of effort across OECD countries provides a picture of significant public investments, notable successes, and also highly publicized delays and failures.4 This outcome highlights the large gap between what is possible and where we are now, with little known about how to fully leverage ICTs to improve the health and wellness of the population. Data on successful adoption and use across countries are therefore an essential learning tool for policy development in this area.5
This chapter briefly reviews OECD countries’ efforts to implement ICTs in healthcare systems and includes current perspectives on the state of implementation and benefits that can be realized. It then highlights areas where countries are finding it useful to share information and develop actionable indicators to monitor
The OECD benchmarking initiative described in this chapter is co-financed by a grant provided by the Commonwealth Fund, which the authors grate-fully acknowledge. The views presented here are those of the authors and not necessarily those of OECD Member countries, the Commonwealth Fund, or its directors, officers, or staff.
@ 2013 World Economic Forum

1.7: Better Measurements for Realizing the Full Potential of Health Information Technologies
82 | The Global Innovation Technology Report 2013
progress through international comparisons. The chapter concludes with a discussion on the process the OECD is now following to develop new measures to facilitate international comparisons in the context of their markedly different healthcare systems.
A GROWING IMPERATIVE: DOING MORE WITH LESSPolicymakers in OECD countries are faced with ever-increasing demands to make health systems more responsive to the patients they serve, to improve the quality of care, and to address disparities in health and in access to care. There is broad consensus that today’s healthcare systems are not able to deliver the high-quality care that patients and providers want at a cost that countries can afford. Therefore, there is an urgent need to improve care and increase efficiency simultaneously.
Health is one of the largest areas of public expenditure in OECD countries, and forecasts show health spending continuing to climb for the foreseeable future.6 From 1990 through 2010, an increasing share of the gross domestic product (GDP) of OECD countries has been devoted to the provision of healthcare. On average, total healthcare spending represented about 9.5 percent of GDP by 2010 (Figure 1)—up from just over 5 percent in 1970 and around 7 percent in 1990. In Japan, the share of spending allocated to health has increased substantially in recent years, to 9.5 percent (up from 7.6 percent in 2000), and is now equal to the OECD average. While the rate of increase in health spending has slowed in the period 2003–08, health expenditure growth has still exceeded economic growth in almost all OECD countries in the past 15 years.
Factors exerting upward pressure on health spending—such as demographic change, chronic diseases, and new technological advancements—will continue to drive health spending higher. According to OECD projections, public health spending could increase by between 50 percent and 90 percent by 2050. The message is simple yet urgent: the sustainability and affordability of health systems is a challenge that must be addressed.
Governments have a wide range of policy tools available to control the escalation of costs. “Command-and-control” policies can hold expenditures down in the short term, but they often have unintended consequences in the long term. In addition, such policies do little or nothing to moderate the underlying pressures that will continue to push health spending up.7
There are other promising avenues for controlling health spending in the longer term. For example, improving the quality of healthcare, increasing patient safety, and coordinating care across healthcare settings can all assist in controlling costs. Shifting care out of expensive, acute care settings and into the community
and the home has also gained greater prominence as the prevalence of chronic diseases (and often multiple chronic diseases) increases with aging populations. Recent evidence suggests that ICTs can play a critical role in achieving this set of goals. To reap the potential gains of ICTs, however, requires careful planning, significant upfront investments, and collaboration across a wide range of stakeholders. Thus many countries face a dilemma: short-term and long-term policy priorities may point in different directions. Without solid evidence on which to base decisions, spending on ICTs for health has become a matter of opinion and often a political gamble. Policymakers therefore seek a clearer view of the “theory of the case”—that is, better evidence on why they should support widespread use of ICTs in healthcare and how best to do this.
WHAT ICTs CAN (AND CANNOT) DO FOR HEALTHCARE SYSTEMSA more comprehensive use of ICTs can benefit healthcare systems in numerous ways. This section examines how expanded and better use of ICTs can contribute to job creation; help reduce healthcare spending; improve the safety of healthcare; and make shared, intelligible data a foundation for healthcare delivery innovation.
Promote new sources of growth and job creationThe health and social sectors employ a large and growing number of people in OECD countries and are projected to be one of the largest sources of job growth in the coming years. Employment in these sectors grew by 2.8 percent per year in nearly all OECD countries between 1995 and 2009—twice as fast as the total civilian employment growth rate of 1.3 percent (Figure 2).
Across OECD countries, the recent economic crisis has impacted the health and social sectors much less than other parts of the economy. Employment in these sectors continued to increase in 2008 and 2009, at a time when total civilian employment remained flat or even declined as economies entered into recession. In Ireland, for instance, employment in the health and social sectors grew by 3 percent from 2008 to 2009, while total employment fell by 8 percent.8
This trend is expected to continue and will probably accelerate in the next few years. The increased demand for workers in this area will stem largely from an aging population that requires care at home, at nursing care facilities, and in inpatient and outpatient settings.
The field of health information technology (IT) is set to contribute to this growth in several ways. First, greater adoption will stimulate demand for jobs that directly support the development of the new platforms and applications, their implementation, and their upkeep. It will also change the way physicians and nurses work, potentially creating new jobs for healthcare
@ 2013 World Economic Forum

The Global Innovation Technology Report 2013 | 83
1.7: Better Measurements for Realizing the Full Potential of Health Information Technologies
Figure 2. Employment growth rate in the health and social sectors compared with all sectors in the economy,
1995–2009 or nearest year
–3
0
3
6
9
Kore
a
Irela
nd
Luxe
mbo
urg
Spai
n
Mex
ico
New
Zea
land
Japa
n*
Aust
ralia
Belg
ium
Gree
ce
Port
ugal
Net
herla
nds
OEC
D
Switz
erla
nd
Turk
ey*
Nor
way
Aust
ria
Cana
da
Germ
any
Unite
d Ki
ngdo
m
Italy
Unite
d St
ates
*
Finl
and
Icel
and
Fran
ce
Den
mar
k
Czec
h Re
publ
ic
Swed
en*
Slov
ak R
epub
lic
Hung
ary
Pola
nd*
Source: OECD Health at a Glance, 2011.* Data are the average of 1995–2009 or nearest year, with the following exceptions: Japan (2003–09), Turkey (2000–09), the United States (2003–08), Sweden (2003–08), and Poland
(2000–07).
Aver
age
annu
al g
row
th r
ate
(%)
n Health and socialn Total civilian
Figure 1: Health expenditure as a share of GDP, OECD countries (2010)
0
5
10
15
20
Unite
d St
ates
Net
herla
nds1
Fran
ce
Germ
any
Cana
da
Switz
erla
nd
Den
mar
k
Aust
ria
Port
ugal
Belg
ium
2
Gree
ce
New
Zea
land
Unite
d Ki
ngdo
m
Spai
n (2
009)
Swed
en
OEC
D
Japa
n (2
009)
Nor
way
Italy
Icel
and
Irela
nd
Aust
ralia
(200
9)
Slov
enia
Slov
ak R
epub
lic
Finl
and
Chile
Luxe
mbo
urg
(200
9)
Isra
el (2
009)
3
Hung
ary
Czec
h Re
publ
ic
Kore
a
Pola
nd
Esto
nia
Mex
ico
Turk
ey (2
008)
Source: OECD, 2012.Notes: Data are for 2010 for all countries except Spain, Japan, Australia, Luxembourg, and Israel, which are for 2009.1. In the Netherlands, it is not possible to distinguish clearly the public and private share for the part of health expenditures related to investments.2. Total expenditure excluding investments.3. Information on data for Israel is available at http://dx.doi.org/10.1787/888932315602/.
Perc
ent G
DP
n Privaten Residual n Public
@ 2013 World Economic Forum

1.7: Better Measurements for Realizing the Full Potential of Health Information Technologies
84 | The Global Innovation Technology Report 2013
personnel who can use newly available data to identify opportunities to improve performance. The movement toward accountable care and larger, integrated delivery systems—a movement facilitated by a greater use of ICTs—is spurring investment in data, analytics, and care management platforms in many OECD countries.
In the United States, the Healthcare Information Technology for Economic and Clinical Health Act (HITECH) provisions of the 2009 American Recovery and Reinvestment Act (ARRA)—which promoted “meaningful use” criteria and increased investments in health ICTs—have set the conditions for employment growth in this sector.9 The number of online health IT job postings per month in the United States has increased by 199 percent since the passage of HITECH, growing from 4,850 in February 2009 to 14,512 health IT jobs in February 2012 (Figure 3). A study of actual employment found that more than 50,000 health IT jobs have been created between 2007 and 2011.10 According to the US Bureau of Labor Statistics, employment of medical records and health information technicians is expected to increase by 21 percent from 2010 to 2020, faster than the average for all other occupations.11
Efficiency gains and cost reductionIn addition to its impact on economic growth, the introduction of ICTs could improve the value created in the health sector.12 Specifically, ICT use is expected to lead to efficiency gains and cost reduction. The most frequently cited positive effects are generally attributed
to a reduced utilization of unnecessary healthcare services. More effective information sharing, such as the rapid electronic delivery of hospital discharge reports to general practitioners and the use of computerized provider order entry (CPOE) systems, can reduce the use of redundant laboratory and radiology tests—sometimes by as much as 24 percent.13 Clinical decision support features can influence prescribing behavior and can save money by informing physicians of the comparative effectiveness of alternative medical treatments. The use of picture archiving and communications systems (PACS) to acquire, store, retrieve, present, and distribute digital medical images can lead to a lower total number of x-rays, improved turnaround time, and some cost savings. In British Columbia, where PACS have been widely adopted, 87 percent of radiologists reported improvements in their reporting and consultation efficiency, and 93.6 percent indicated it had reduced the time spent locating radiological examinations for reviews.14
Other positive effects are expected to derive from greater efficiency in administrative processes, such as billing. A 2010 OECD report highlights the substantial administrative cost savings that can be found by introducing electronic claims processing through the New England Healthcare Electronic Data Interchange Network (NEHEN). Claims that cost US$5.00 to submit in labor costs per paper transaction were processed electronically at 15 cents per transaction after the introduction of NEHEN. In the Republic of Korea, all
Figure 3: Online health IT job postings per month in the United States, 2007–12
0
3,000
6,000
9,000
12,000
15,000
Jan
12
Nov
11
Sep
11
Jul 1
1
May
11
Mar
11
Jan
11
Nov
10
Sep
10
Jul 1
0
May
10
Mar
10
Jan
10
Nov
09
Sep
09
Jul 0
9
May
09
Mar
09
Jan
09
Nov
08
Sep
08
Jul 0
8
May
08
Mar
08
Jan
08
Nov
07
Sep
07
Jul 0
7
May
07
Mar
07
Jan
07
Source: Furukawa et al., 2012.Note: Data are based on the three-month moving average.
Num
ber o
f hea
lth IT
job
post
ings
per
mon
th
HITE
CH A
ct
Febr
uary
200
9
4,850
14,512
n Health IT clinical user jobs n Health IT implementation and support jobs
@ 2013 World Economic Forum

The Global Innovation Technology Report 2013 | 85
1.7: Better Measurements for Realizing the Full Potential of Health Information Technologies
hospital bill requests are completed through an electronic data interchange system implemented in 2003.15 Each year, the Health Insurance Review and Assessment Service (HIRA) manages a flow of nearly 1.2 billion cases of hospital bill requests. In 2010, the number of claims was 1.3 billion. All the data are transferred and stored in HIRA’s medical information system, which boasts the world’s largest capacity and can store up to 210 terabytes of information. With 1,751 staff assigned to the review process, HIRA is able to process over 40 percent of these bills electronically. HIRA is planning to increase electronic review in the next four years to 65 percent in order to maximize efficiency and simplify the process.
The 2007 Commonwealth Fund report, Bending the Curve,16 put the potential of aggregate system- wide savings of promoting health IT in the United States at US$88 billion over 10 years. The authors estimated that the cost reductions would result from a lower rate of medical errors, more efficient use of diagnostic testing, more effective drug utilization, and decreased provider costs, among other improvements. Additional savings would likely flow from better care coordination among multiple providers—and improved chronic care management—that would lead to both a decrease in provider time utilization and better health outcomes.
Improved healthcare deliveryElectronic health records (EHRs) can improve the quality and responsiveness of care by enabling timely access and better transmission of patient medical information across the healthcare continuum. The effective use of EHRs can also facilitate the evaluation of healthcare interventions and their quality at the practice level, clinical research and effective public health planning, and can be used to provide the information needed for incentive programs, such as pay-for-performance programs.
The potential of ICT applications to improve healthcare delivery extends, however, well beyond EHRs. Telehealth, for example, is increasingly viewed as an important tool for optimizing continuity in care and improving access to health services, particularly in rural and remote areas where healthcare resources and expertise are often scarce or even nonexistent. The introduction of telehealth in Canada has enabled assessments of patients in rural areas closer to home.
A recent study commissioned by Canada Health Infoway showed that, as of the end of the 2009–10 fiscal year, Canada had 5,710 telehealth systems in place in at least 1,175 communities.17 Many of these systems serviced the 21 percent of the Canadian population who live in rural or remote areas. There were nearly 260,000 instances of telehealth use in Canada in 2010, of which over 70 percent were for clinical consultations (Figure 4).
Mobile health applications increasingly provide unique and unprecedented opportunities for empowering patients and for meeting the growing needs of aging populations. Advocates of patient-centered healthcare have long argued that individuals should be able to take responsibility for their own health. The argument today applies widely to the management of chronic diseases such as diabetes and obesity, where health systems increasingly see their roles mainly as agents of support. To the extent that individuals are the best judges of their own welfare, the chances of the success of any care or prevention program will depend on patient engagement and meaningful co-ownership and co-production of healthy behaviors. Health ICTs to support self-management (such as personally controlled health records, mobile health applications, and social networks) have an important (and growing) role to play in addressing the “information asymmetry” between healthcare providers and consumers/patients, thus allowing individuals to participate more actively in making better-informed decisions about their own healthcare.
Reduced medical errors and improved patient safetyUnder the right conditions, health ICTs can reduce medical errors.18 Medication errors, in particular, account for a significant number of additional hospital admissions and consultations in primary care. Three types of medical errors are common: errors caused by forgetfulness or inattention on the part of both doctor
Source: Based on Canada Health Infoway et al., 2011.
Figure 4: Telehealth sessions in Canada, 2010
n Clinical Educational
n Administrative
@ 2013 World Economic Forum

1.7: Better Measurements for Realizing the Full Potential of Health Information Technologies
86 | The Global Innovation Technology Report 2013
and patient, errors of judgment or planning (rule-based errors), and errors resulting from a lack of knowledge. These errors can lead to adverse drug reactions, which is one of the leading causes of death in the United States (it is estimated to be between the 4th and the 6th highest cause).19 ICTs can prevent medication errors by making it easier for healthcare professionals to acquire and share information. With electronic drug prescriptions (e-prescribing), an expert system can be integrated to check for adverse drug reactions (ADRs). Such a system flags possible ADRs for patients taking multiple drugs. It also generally contains patient-specific information on the history of reactions—such as allergies to penicillin or sulfa drugs—and provides a warning if these drugs are being prescribed. Studies have shown that ICT systems (including e-prescribing) reduce medication errors and decrease adverse drug reactions.20 The Cochrane Review has shown that electronic prescribing improves quality (Box 1), but is equivocal on its cost-effectiveness.21
Improved management of chronic diseasesThe use of ICTs to improve the management of chronic diseases has also gained significant attention. First, ICTs can improve care coordination.22 The treatment of complex chronic diseases requires input across many different healthcare professions and multiple healthcare settings, thereby creating a complex set of data that the various people in the care process need to understand and use. Sharing patient information across providers
is essential to improve clinical outcomes and also to prevent unnecessary duplications. EHRs can greatly facilitate this task.
ICTs can also play an important role in increasing compliance with clinical care guidelines or protocol-based care, which is particularly valuable in the management of chronic diseases such as asthma, diabetes, and heart failure. These are conditions with a broad evidence base for how best to manage patients; ICTs can help ensure that providers adhere to this evidence. A study conducted by the Rand Corporation in 1998–2000 in the United States showed that patients received only 54.9 percent of recommended care out of a set of 439 quality indicators defined for 30 acute and chronic conditions. Quality-care indicators were based on recommendations pertaining to screening, diagnosis, treatment, and follow-up for each condition. Although more than 75 percent of the recommended care was provided for senile cataracts or breast cancer, recommendations for care did not exceed 50 percent for 10 conditions. Only 22.8 percent of recommended care was provided for hip fractures and only 10.5 percent for alcohol dependency. In many but not all cases, nonadherence with recommended care corresponded to an underuse of healthcare services.23
Other studies have produced similar evidence of nonadherence to recommended care in medical practice. ICT systems are important for increasing the uptake of preventive services such as screening tests for diabetes and cancer (Box 2).
Box 1: Impact of Computerized Physician Order Entry (CPOE) on medication error prevention
The Brigham and Women’s Hospital, an academic tertiary-care hospital with approximately 700 beds in Boston, conducted a study in 1999 of the impact of CPOE on medication errors. All patients admitted to three medical units were studied for seven- to ten-week periods in four different years. The baseline period of the first year was before implementation of CPOE, and the remaining three periods occurred after the implementation of increasingly sophisticated CPOE. The study found that:
• Non-missed-dose medication error rate fell 81 percent, from 142 per 1,000 patient days in the baseline period to 26.6 per 1,000 patient days in the final period.
• Non-intercepted serious medication errors (those with the potential to cause injury) fell 86 percent from the baseline to period 3, the final period.
• Large differences were seen for all main types of medication errors: dose errors, frequency errors, route errors, substitution errors, and allergies.
Source: 1 Bates et al. 1999.
Box 2: Chronic disease management toolkit in British Columbia, Canada
In 2002, the Health Department of British Columbia identified problems with the management of chronic diseases. A study of 20,000 patients with diabetes between 1996 and 2001 showed that no more than 50 percent of diabetes patients received all of the series of services and tests recommended in clinical practice guidelines (for example, having their blood sugar monitored through HbA1c), no matter how many times they saw their doctor.
British Columbia developed a chronic disease management (CDM) toolkit, a web-based information system for diabetes and congestive heart failure. CDM incorporates clinical practice guidelines into flow sheets and includes other features that allow health professionals to monitor care for chronic disease. Between 2002 and 2005—that is, within the first three years of implementation of the CDM toolkit—the proportion of people with diabetes who were receiving care that complied with the Canadian Diabetes Association guidelines had more than doubled, while the annual cost of diabetes care dropped over the same period from an average of CAD 4,400 (Canadian dollars) to CAD 3,966 per patient.
Sources: Krueger 2006; OECD 2010a.
@ 2013 World Economic Forum

The Global Innovation Technology Report 2013 | 87
1.7: Better Measurements for Realizing the Full Potential of Health Information Technologies
UNEVEN ICT ADOPTION ACROSS OECD COUNTRIESMaking sure that ICTs are in place is only the first step on a long and challenging journey toward taking full advantage of these technologies. Indeed, it is fair to say that, although the potential gains from greater ICT use have been apparent for years, most countries still face major implementation challenges and adoption has remained remarkably uneven.
In 2009, the Commonwealth Fund reported that only 46 percent of US doctors used electronic medical records, compared with over 90 percent of doctors in Australia and the United Kingdom (Figure 5).24 According to a recent survey of European Union countries,25 on average, only 6 percent of general practitioners reported using e-prescribing, the exceptions being Denmark (97 percent), Sweden (81 percent), and the Netherlands (71 percent).
ACCELERATING ADOPTION AND THE DEVELOPMENT OF BENEFITS FROM ICTs: OVERCOMING THE CHALLENGESEffective system-wide adoption of ICTs and the exchange of medical information continues to be logistically difficult for a variety of reasons. First, the way healthcare is financed and organized can create disincentives for providers (physicians, hospitals, others) to pursue ICTs.26 In particular, fee-for-service payment schemes do not create incentives to improve quality and reduce redundant utilization—two of the primary benefits of health ICTs. Providers therefore have little motivation to go through a costly and disruptive implementation,
particularly when they can benefit more directly from investing in biomedical technologies that will increase their own revenue.
This challenge can be addressed by designing payment systems that encourage the uptake of ICTs. This has been a central aspect of many recent programs to encourage the use of ICTs—examples include the Practice Incentive Programme (PIP) in Australia and the Quality Outcomes Framework (QOF) for primary care in the United Kingdom. It is important to note that the investments in ICTs are often part of a wider strategy to improve primary care and hospital performance and are linked with broader incentive regimes that pay for better performance, as well as reforms—such as disease management programs to improve chronic care. Often pay-for-performance schemes begin with paying for reporting that, in turn, provides financial incentives for ICT adoption and providing data on the quality of care in regular electronic form. Pay-for-reporting programs are often a necessary prelude to a more full-scale pay-for-performance scheme.27
A second barrier to ICT adoption and effective use is the broader issue of governance or stewardship. Too often, projects start without the systems that are needed to make progress—for instance, objectives need to be set in terms of the health gains expected, and appropriate workflow redesign, change management, education, and training need to be introduced.28 This lack of governance is also reflected in the absence of commonly defined and consistently implemented interoperability standards. Although healthcare organizations have access to an ever-increasing number
Figure 5: Use of electronic medical records by physicians in seven OECD countries, 2006 and 2009
0
20
40
60
80
100
CanadaUnited StatesGermanyAustraliaUnited KingdomNew ZealandNetherlands
Perc
ent
n 2006n 2009
Source: Schoen et al., 2009.Notes: Survey question for 2006: “Do you currently use electronic patient medical records in your practice?” Survey question for 2009: “Do you use electronic patient medical records in your
practice (not including billing systems)?”
@ 2013 World Economic Forum

1.7: Better Measurements for Realizing the Full Potential of Health Information Technologies
88 | The Global Innovation Technology Report 2013
of ICT products, their systems often cannot speak to each other, thus preventing the potential gains from sharing information. Linkages and health information exchange remain a serious problem. This market failure is widely recognized and governments are taking varying approaches to address it.
A third challenge relates to decisions on how healthcare organizations handle their digital information environment. This process profoundly affects the uptake of health ICTs and the transition to an e-health environment. The main challenge is integrating privacy policy, security, and technological requirements for access and the exchange of healthcare information. This is an area where public perception issues must be addressed. Keeping control over personal electronic medical information and privacy assurance remain the two top concerns for consumers. In particular, there is concern that information could have detrimental effects on employment, be used by health insurance companies to deny coverage or increase premiums, and harm social integration in the community.
Appropriate privacy protection should be incorporated into the design of new ICT systems and policies from the outset. However, such protection must be balanced with the value from broad information sharing.
BETTER MEASUREMENTS TO REALIZE THE FULL POTENTIAL OF HEALTH ICTsThe challenges to achieving widespread ICT adoption and meaningfully leveraging these tools to improve care are complex. Many countries are looking to learn from others’ successes and failures to inform their own policy development. This, however, requires a shared understanding of ICT definitions as well as approach to measuring adoption and impact.
In 2008, the OECD undertook a study of how member countries were monitoring progress in ICT implementation under their respective national e-health strategies. The study showed a rising interest in monitoring ICT adoption that had led to a proliferation of surveys of varying quality and utility. These surveys were sometimes conducted by official government statistical agencies, and more often by academic entities and private-sector collection agencies funded by government health departments.29 Most surveys were conducted as standalone surveys, on an ad hoc basis. In most cases, they focused on ICT adoption in the primary care sector.
The scope of the surveys and the methodologies used varied significantly and included sample surveys of medical practitioners and medical practices, inventories of the use of ICTs for administrative/clinical purposes in hospitals, self-administered surveys, censuses or large samples of service providers in public and private sectors, and population surveys.
Table 1 presents a simplified comparative analysis of the different data sources in terms of (1) relevance—that is, how well the data reflected the information priorities of policymakers; (2) feasibility—that is, how easily data can be gathered (cost and time to collect the data); (3) prevalence—that is, whether the type of data collection is frequently used or not; and (4) the extent of data comparability
The OECD study also reviewed how countries define ICTs in their surveys. With the exception of the terms electronic health record (EHR) and electronic medical record, there was very little or no overlap in the lists provided by countries. Notably, none included any general definition for either ICTs or healthcare. Even for the term EHR, the definitions used in questionnaires varied widely across countries (and often across surveys within the same country).
The variety in the way countries defined and measured ICTs inevitably made it difficult to compare data within and across countries, or to link survey data to other data sources. It was similarly challenging for countries to compare practices and policies from which they could learn.
Prompted by the 2008 study, OECD countries agreed to undertake the following actions:
• establish a measurement framework for ICTs in health systems,
• establish internationally agreed definitions of ICTs, and
• develop a model survey for the measurement of the availability and use of ICTs in the health sector.
The establishment of an international measurement frameworkMetrics and indicators have to be relevant to policymakers. In the early 1990s, the OECD developed a conceptual framework for the diffusion of ICTs. This framework recognizes that measuring ICTs is a moving
Table 1: Overview of main data collections reported by countries
Data collections Relevance Feasibility Prevalence Comparability
National statistics surveys of ICT use Low Low Low High
Use of administrative data Medium High Low Low
Surveys of the population Medium Low Low Low
Standalone surveys of healthcare providers (businesses or personnel) High Medium High Low
Source: OECD, 2010a.
@ 2013 World Economic Forum

The Global Innovation Technology Report 2013 | 89
1.7: Better Measurements for Realizing the Full Potential of Health Information Technologies
target. Countries follow an S-shaped curve that begins with increasing interest in availability and access (Figure 6). Once ICTs reach a critical stage of diffusion, policy interest shifts to the purpose and level of ICT use (intensity) and to its impact (and less on its access).30 There is likely to be some demand for all three types of indicator, but priorities will differ over time for different countries.
Measures need, therefore, to reflect this continuum, starting from ICT availability and adoption, moving next toward effective use and the extent of health information exchange, and ending with measuring outcomes and impact on health and the performance of the health system.
The establishment of internationally agreed definitions of ICTsTo avoid confusion over concepts and definitions, the OECD began by proposing to define ICTs with reference to the functions they offer. This approach was first tested in the United States in a 2008 national survey of physicians.31 An expert panel defined the key functions that constitute a “basic” and “fully functional” EHR, and then applied these definitions to the survey data to develop nationally comparable estimates.
Development of a model surveyOne of the key challenges in developing international measures is finding an approach that can be applied to all countries while taking into account the difference in their pace of ICT deployment. Previous work to improve
international comparability of surveys that measure the use of ICTs in households, businesses, and government indicated that developing and implementing a model survey composed of separate, self-contained modules can ensure flexibility and adaptability to a rapidly changing environment.32
The use of core modules (either as an add-on to existing country surveys or as a standalone survey) allows measurement on an internationally comparable basis. Additional modules and new indicators can be added to respond to evolving or country-specific policy needs in this area.
The framework underlying the elaboration of the model survey includes three main features that are of general applicability. These features are reviewed below.
1. Linking indicators to user needs: The model survey reflects common elements of national ICT use that, in turn, are guided by national policy priorities.
2. Flexibility and adaptability: The model survey is a flexible tool composed of separate, self-contained modules to ensure flexibility and adaptability to a rapidly changing environment. Although the use of core modules allows measurement on an internationally comparable basis, additional modules and new indicators within existing modules can be added to respond to evolving or country-specific policy needs in this area.
Figure 6: The diffusion curve of ICTs
Leve
l of a
ctiv
ity
Time
Source: Adapted from Figure 1.2 in OECD, 2011b.
@ 2013 World Economic Forum

1.7: Better Measurements for Realizing the Full Potential of Health Information Technologies
90 | The Global Innovation Technology Report 2013
3. Minimized burden: The model survey is designed to reduce respondent burden and enhance international comparability by being short, by making use of filter questions, and using a very limited number of quantitative questions.
MOVING FORWARD: THE OECD BENCHMARKING INITIATIVEGiven the rapid pace of developments, a narrow window of opportunity currently exists for countries to achieve international agreement on indicators and terminology. Recent work undertaken by the OECD in collaboration with Harvard School of Public Health, the World Health Organization, and the European Commission indicates that a nucleus of a few indicators may represent a reasonable starting point for the development of a common understanding about what should be included in the core module of a model survey on the adoption and use of ICTs in the health sector. These indicators are being organized into four broadly defined domains in which the measurement of availability and use represent today’s policy priorities for OECD countries:
1. Provider-centric electronic records systems: These systems are used by healthcare professionals to store and manage patient health information and data, and include functionalities that support the care delivery process. Examples include electronic medical records, EHRs, and electronic patient records.
2. Patient-centric electronic records systems: These systems are typically used by patients and their families to access and manage their health information and organize their healthcare. Examples are personal health records, patient portals, and other patient-centric electronic records.
3. Health information exchange: This area entails the process of electronically transferring (or aggregating and enabling access to) patient health information and data across provider organizations. Examples include the e-transfer of patient data between ambulatory care providers or the transmission of prescriptions from the provider to a pharmacy.
4. Telehealth: This program encompasses the broad set of technologies that support care between patients and providers, or among providers, who are not co-located. Examples include video-mediated consultations between physicians and patients, remote home monitoring of patients, and teleradiology.
CONCLUSIONSThis review has summarized evidence suggesting that the widespread adoption and use of health ICTs can enable an array of benefits. Among these are reducing medical errors, improving clinical care through adherence to evidence-based guidelines, and preventing duplication and inefficiency for complex care pathways. These technologies hold substantial value for the management of chronic diseases by enabling better coordination of care as well as greater patient involvement in their care.
Smooth, evidence-based implementation of health ICTs is, however, still a distant prospect. There is much work still to be done to gather relevant information for improving the quality of existing measurements as well as improving the linkages between policy and measurement.
Understanding the barriers and incentives to ICT use is critical to achieving more widespread penetration and realizing the far-reaching economic and social benefits to be reaped from their application. OECD countries have much to gain by joining their efforts and sharing the burden of developing measurements and testing indicators in this sector. Risk, delay, and cost can be minimized by learning from good international practices, but this will be possible only if we have a common set of indicators that are collected on a comparable basis. The OECD work to develop internationally comparable measures about ICT use in healthcare and the wide-based support it has received is a reflection of the critical need for such data today in both OECD and non-OECD countries.
NOTES 1 OECD 2010a, 2010b.
2 Boston Consulting Group 2008.
3 Lead markets are defined by the European Commission as markets with high growth potential in which EU industry can develop a global competitive advantage if it gets support from the public sector; http://www.euractiv.com/innovation-enterprise/lead-markets-gateway-growth-linksdossier-188437. See Commission of the European Communities 2007.
4 OECD 2010a.
5 OECD 2010a.
6 OECD 2012.
7 OECD 2010a.
8 OECD 2011a.
9 Executive Office of the President, Council of Economic Advisers 2009.
10 Furukawa 2012.
11 US Bureau of Labor Statistics 2012.
12 OECD 2010b.
13 Chaudry et al. 2006.
14 OECD 2010.
15 HIRA 2010.
@ 2013 World Economic Forum

The Global Innovation Technology Report 2013 | 91
1.7: Better Measurements for Realizing the Full Potential of Health Information Technologies
16 Schoen et al. 2007.
17 Praxia/Gartner 2001.
18 Scott et al. 2005; Chaudry et al. 2006; Shekelle and Goldzweig 2009; OECD 2010a.
19 Committee on Quality of Health Care in America: Institute of Medicine 2000; Lazarou, Pomeranz, and Corey 1998.
20 Chaudry et al. 2006.
21 Durieux et al. 2008.
22 OECD 2010b.
23 McGlynn et al. 2003.
24 Schoen et al. 2009.
25 EC 2008.
26 Ash and Bates 2005.
27 OECD 2010b.
28 OECD 2010a.
29 OECD 2010a.
30 OECD 2005.
31 DesRoches et al. 2008.
32 OECD 2011b.
REFERENCESAsh, J. S. and D. W. Bates. 2005. “Factors and Forces Affecting EHR
System Adoption: Report of a 2004 ACMI Discussion.” Journal of the American Medical Informatics Association 12 (1): 8–12.
Bates, D. W., J. M. Teich, J. Lee, D. Seger, G. J. Kuperman, N. Ma’Luf, D. Boyle, and L. Leape. 1999. “The Impact of Computerized Physician Order Entry on Medication Error Prevention.” Journal of the American Medical Informatics Association 6 (4): 313–21.
Boston Consulting Group. 2008. “Understanding the eHealth Market.” Paper presented at “Making the eHealth Connection: Global Partners, Local Solutions.” 2008, Bellagio, Italy.
Commission of the European Communities. 2007. Communication from the Commission to the Council, the European Parliament, the European Economic and Social Committee and the Committee of the Regions: A Lead Market Initiative for Europe. Brussels: COM (2007) 860 (final 21.12 2007). Available at http://eur-lex.europa.eu/LexUriServ/LexUriServ.do?uri=COM:2007:0860:FIN:en:PDF.
Committee on Quality of Health Care in America: Institute of Medicine. 2000. To Err Is Human: Building a Safer Health System. Washington, DC: National Academy Press.
Chaudhry, B., J. Wang, S. Wu, M. Maglione, W. Mojica, E. Roth, S. C. Morton, and P. G. Shekelle. 2006. “Systematic Review: Impact of Health Information Technology on Quality, Efficiency and Costs of Medical Care.” Annals of Internal Medicine 144 (10): 742–52.
DesRoches, C. M., E.G. Campbell, R. Sowmya, K. Donelan, T. G. Ferris, A. Jha, R. Kaushal, D. E. Levy, S. Rosenbaum, A. E. Shields, and D. Blumenthal. 2008. “Electronic Health Records in Ambulatory Care: A National Survey of Physicians.” New England Journal of Medicine 359 (1): 50–60.
Durieux, P., L. Trinquart, I. Colombet, J. Niès, R. T. Wlaton, A. Rajeswaran, M. Rège-Walther, E. Harvey, and B. Burnand. 2012. Computerized Advice on Drug Dosage to Improve Prescribing Practice (Review): The Cochrane Collaboration. JohnWiley & Sons, Ltd. Available at http://www.update-software.com/BCP/WileyPDF/EN/CD002894.pdf.
EC (European Commission). 2008. Benchmarking ICT Use among General Practitioners in Europe: Final Report. Brussels: European Commission Information Society and Media Directorate General.
Executive Office of the President, Council of Economic Advisers. 2009. “Preparing the Workers of Today for the Jobs of Tomorrow.” July. Available at http://www.whitehouse.gov/assets/documents/Jobs_of_the_Future.pdf.
Furukawa, M. F., D.Vibbert, and M. Swain. 2012. “HITECH and Health IT Jobs: Evidence from Online Job Postings.” Office of the National Coordinator for Health IT Data Brief #2. Washington, DC: ONC. Available at http://www.irsc.edu/uploadedFiles/Programs/HealthScience/HealthInformationTechnologyGrant/HITECH-Health-IT-Jobs.pdf.
Gerber, T., V. Olazabal, K. Brown, and A. Pablos-Mendez. 2010. “An Agenda for Action on Global E-Health.” Health Affairs 29 (2): 235–38.
HIRA (Health Insurance Review and Assessment Service). 2010. Going Together Toward Better Health, Better Life: HIRA Sustainability Report. Korea: HIRA.
Krueger H. 2006. “The Relationship between Long-Term Adherence to Recommended Clinical Procedures and Health Care Utilization for Adults with Diagnosed Type 2 Diabetes.” PhD dissertation, University of British Columbia, Department of Health Care and Epidemiology.
OECD (Organisation for Economic Co-operation and Development). 2005. Guide to Measuring the Information Sector. Paris: OECD Publishing.
———. 2010a. “Improving Health Sector Efficiency: The Role of Information and Communication Technologies.” OECD Health Policy Studies. Paris: OECD Publishing.
———. 2010b. “Value for Money in Health Spending.” OECD Health Policy Studies. Paris: OECD Publishing.
———. 2011a. Health at a Glance 2011: OECD Indicators. Paris: OECD Publishing.
———. 2011b. OECD Guide to Measuring the Information Society 2011. Paris: OECD Publishing. Available at http://dx.doi.org/10.1787/10.1787/9789264113541-en.
———. 2012. OECD Health Data 2012. Paris: OECD Publishing.
Lazarou, J., B. Pomeranz, and P. N. Corey. 1998. “Incidence of Adverse Drug Reactions in Hospitalized Patients: A Meta-Analysis of Prospective Studies.” JAMA 279: 1200–05.
McGlynn, E. A., S. M. Asch, J. Adams, J. Keesey, J. Hicks, A. DeCristofaro, and E. A. Kerr. 2003. “The Quality of Health Care Delivered to Adults in the United States.” New England Journal of Medicine 348 (26): 2635–45.
Praxia Information Intelligence and Gartner, Inc. 2011. Telehealth Benefits and Adoption: Connecting People and Providers Across Canada. A study commissioned by Canada Health Infoway. Toronto, Canada, and Stamford, CT: Praxia Information Intelligence and Gartner, Inc. Available at https://www2.infoway-inforoute.ca/Documents/telehealth_report_2010_en.pdf.
Schoen, C., S. Guterman, A. Shih, J. Lau, S. Kasimow, A. Gauthier, and K. Davis. 2007. Bending the Curve: Options for Achieving Savings and Value in U.S. Health Spending. A report prepared for the Commonwealth Fund Commission on High Performance Health System. The Commonwealth Fund, December.
Schoen, C., R. Osborn, M. M. Doty, D. Squires, J. Peugh, and S. Applebaum. 2009. “A Survey of Primary Care Physicians in Eleven Countries, 2009: Perspectives on Care, Costs, and Experiences.” Health Affairs 28 (6): w1171–w1183.
Scott, J. T., T. J. Rundall, T. M. Vogt, and J. Hsu. 2005. “Kaiser Permanente’s Experience of Implementing an Electronic Medical Record: A Qualitative Study.” BMJ 331: 1313–15.
Shekelle, P. and C. L. Goldzweig. 2009. Costs and Benefits of Health Information Technology: An Updated Systematic Review. London: The Health Foundation.
US Department of Labor, Bureau of Labor Statistics. Occupational Outlook Handbook, 2012–13 Edition. http://bls.gov/ooh/home.htm, accessed October 20, 2012.
@ 2013 World Economic Forum

@ 2013 World Economic Forum

The Global Information Technology Report 2013 | 93
CHAPTER 1.8
Re-Establishing the European Union’s Competitiveness with the Next Wave of Investment in Telecommunications
SCOTT BEARDSLEY
LUIS ENRIQUEZ
WIM TORFS
FERRY GRIJPINK
STAGG NEWMAN
SERGIO SANDOVAL
MALIN STRANDELL-JANSSON
McKinsey & Company
The liberalization of telecommunication markets that started in Europe in the 1990s allowed competitors into Europe’s markets and brought European consumers better service, lower prices, and a wealth of innovative services. It also enabled economic growth and established Europe as one of the world’s leaders in the production of telecommunication equipment and services. Liberalization unlocked a wave of investment that served to increase the capacity of fixed and mobile networks. This modernization added digital communications capabilities to the existing copper network infrastructure, but did not replace the “last mile to the home.”
Today, telecommunication networks worldwide face growing pressure to increase their capacity, driven by an explosion in consumer demand for newly available Internet services such as online or over-the-top video. To meet this demand, telecommunication players in the United States and Asia have already made massive investments to upgrade network technologies, focusing particularly on replacing the last mile of copper with fiber networks, which are much better for carrying big data. This has not happened in Europe, where the last mile still needs to be upgraded. At the same time, revenue and profitability growth in the European industry are falling. Europe’s telecommunication industry now lags the rest of the developed world in many measures, and the region may soon fall behind the many developing countries that are rapidly leapfrogging older technologies.
Low investment in telecommunications puts at risk not only future consumer benefits but also the region’s overall competitiveness. This chapter suggests that restoring both benefits and competitiveness will depend primarily on revising the European Union (EU) regulatory framework to allow revenues, profits, and thus rates of investment to recover. Although some Member States and the European Union as a whole have taken some encouraging policy steps, only bolder regulatory reform can release the scale of modernizing investment in telecommunications that Europe needs today if it is to re-establish its competiveness and enable future economic growth and consumer benefits.
EARLY COMPETITION: BENEFITS FOR EU TELECOMMUNICATION MARKETS AND CONSUMERSIn 1998, the European Union introduced a regulatory framework giving competing telecommunication operators the right to access existing copper and mobile networks at regulated wholesale rates. This policy innovation launched 15 years of intensified competition, producing substantial benefits for consumers:
• Lower prices. The price of a 10-minute fixed-to-fixed national call fell from €2.11 in 1998 to €0.72 in 2010—a reduction of 66 percent in 12 years.
@ 2013 World Economic Forum

1.8: Re-Establishing the European Union’s Competitiveness
94 | The Global Information Technology Report 2013
Similarly, the price of a medium-usage basket of mobile telecommunication services fell from €42.05 in 2002 to €19.99 in 2010, a decrease of 52 percent in 8 years. Much lower prices mean that consumers are enjoying many more minutes of voice services: in the United Kingdom, the volume of outgoing voice traffic grew by more than 900 percent between 1998 and 2009.
• Higher service levels. Competition forced providers to try harder to retain their customers by providing higher levels of service. Before 1998, consumers had to wait several weeks to get a fixed line installed at home, but they can now get one in a matter of days. On the mobile service side, network coverage has greatly improved, the percentage of dropped calls has fallen, and customers can port their number in one day for free instead of having to wait several weeks and pay for the privilege.
• Innovative services. Competition also spurred operators to develop innovative consumer services. For example, mobile virtual network operators in Europe have tailored services to the particular needs of specific segments of the population. These customized services include cheaper international calls for migrant workers and web communities, ring tones, icons, applications, and discounts specially designed for youth markets. Alternative fixed operators have similarly introduced innovations, including cheap Internet protocol (IP) telephony representing 24 percent of all outgoing fixed voice minutes in the European Union in 2010, fiber Internet access, and bundled offers.
INVESTMENT RELEASE: THE NEED FOR A NEW REVENUE MODEL The consumer benefits resulting from liberalization have been delivered by an infrastructure reaching the limits of its capability in terms of both its overall capacity and the performance provided to the end-user. Increased investment in both fixed and mobile will be required to re-establish Europe’s competitiveness, thus both satisfying consumer and business demand and reaping the economic and productivity benefits that high-speed broadband technologies can deliver.
However, the old funding model for financing infrastructure will no longer work. In today’s world, competition has reduced margins and operators are afraid to invest because they cannot be sure of making a return until the industry rules change. Stakeholders across the European telecommunication industry are debating the best way to reinvent the industry’s revenue model to release the next wave of infrastructure investment that Europe needs. Speed is critical because,
without more region-wide investment, Europe risks falling behind other regions.
New consumer demand requires major infrastructure investmentFixed infrastructure investment in the early days of market liberalization focused largely on upgrading existing networks by adding fiber to the core, high-speed Internet-based switching, and digital electronics (DSL modems)—all of which allowed faster data communications. But the “last mile” connections between the modern core and the home remained copper based, ultimately limiting transmission speeds and volumes. Meanwhile, mobile investments focused primarily on introducing digital cellular technology to improve voice services. This technology could carry data at low speeds, as long as traffic grew modestly. These “old” network configurations will not be enough to support the next wave of services that customers are demanding.
Worldwide, growing numbers of consumers want constant, high-quality wireless Internet access, along with higher traffic allowances and higher connection speeds, so they can enjoy newly available Internet services—such as over-the-top video—wherever they are. Greater technical and service expectations from customers have created an explosion in fixed and mobile Internet data traffic. As Figure 1 shows, the global volume of demand for fixed and mobile traffic is expected to grow by 34 percent and 84 percent, respectively, each year to 2015. In the United States, which leads the world in deploying 4G long-term evolution (LTE) mobile, today operators are experiencing year-on-year growth in demand of more than 100 percent.
The telecommunication industry everywhere needs to make huge investments in fixed and mobile infrastructure to cope with this new situation. But Europe’s investment need is particularly large. According to our estimates, upgrading the fixed telecommunication infrastructure in the EU15 countries to achieve fiber-to-the-home (FTTH) household coverage of around 50 percent and vector-based very high bit-rate digital subscriber line (VDSL) for all other households will require €200 to €250 billion.1 Similarly, revamping Europe’s mobile infrastructure to create a mobile network using LTE technology and covering 95 percent of the EU15 population will take another €50 to €70 billion.
Europe’s competitiveness lags in high-speed networksOther regions are getting ahead in deploying next-generation high-speed fixed and mobile telecommunication infrastructures. For instance, more than 90 percent of homes in the United States are already passed by cable operators using hybrid fiber
@ 2013 World Economic Forum
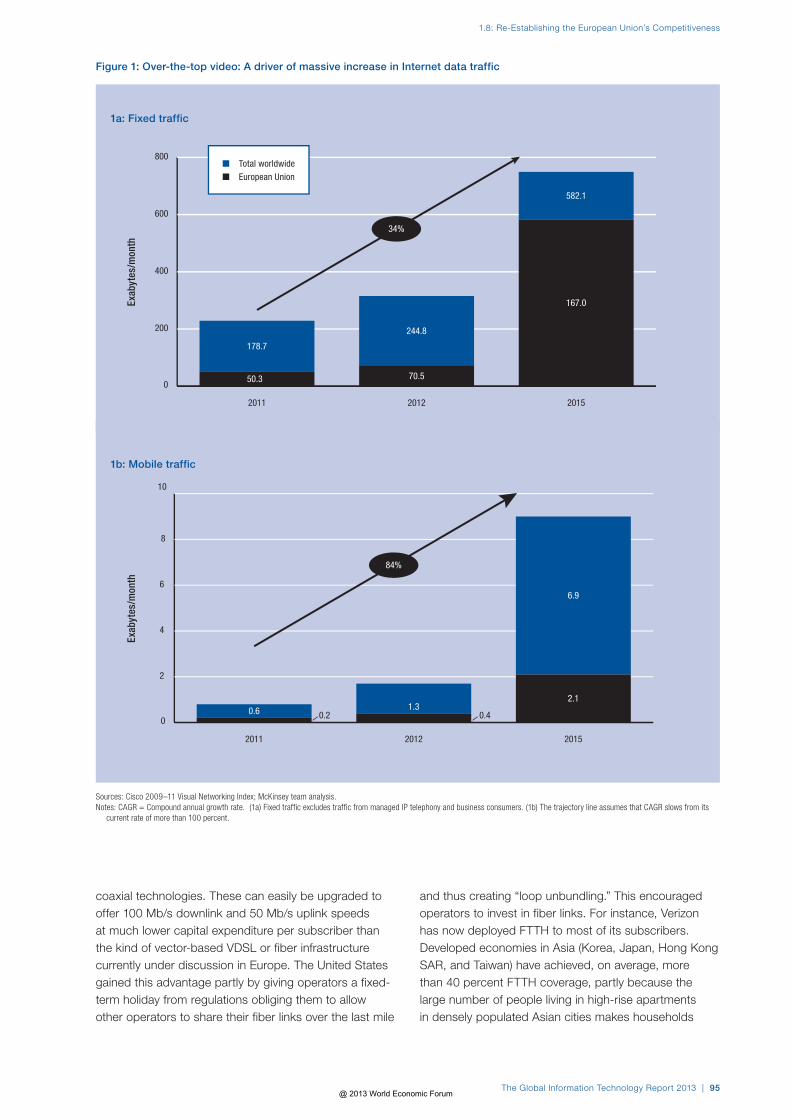
The Global Information Technology Report 2013 | 95
1.8: Re-Establishing the European Union’s Competitiveness
Figure 1: Over-the-top video: A driver of massive increase in Internet data traffic
0
200
400
600
800
201520122011
50.3
178.7
70.5
244.8
34%
167.0
582.1
0
2
4
6
8
10
201520122011
0.20.6 0.41.3
84%
2.1
6.9
Exab
ytes
/mon
thEx
abyt
es/m
onth
Sources: Cisco 2009–11 Visual Networking Index; McKinsey team analysis.Notes: CAGR = Compound annual growth rate. (1a) Fixed traffic excludes traffic from managed IP telephony and business consumers. (1b) The trajectory line assumes that CAGR slows from its
current rate of more than 100 percent.
n Total worldwiden European Union
1b: Mobile traffic
1a: Fixed traffic
coaxial technologies. These can easily be upgraded to offer 100 Mb/s downlink and 50 Mb/s uplink speeds at much lower capital expenditure per subscriber than the kind of vector-based VDSL or fiber infrastructure currently under discussion in Europe. The United States gained this advantage partly by giving operators a fixed-term holiday from regulations obliging them to allow other operators to share their fiber links over the last mile
and thus creating “loop unbundling.” This encouraged operators to invest in fiber links. For instance, Verizon has now deployed FTTH to most of its subscribers. Developed economies in Asia (Korea, Japan, Hong Kong SAR, and Taiwan) have achieved, on average, more than 40 percent FTTH coverage, partly because the large number of people living in high-rise apartments in densely populated Asian cities makes households
@ 2013 World Economic Forum

1.8: Re-Establishing the European Union’s Competitiveness
96 | The Global Information Technology Report 2013
easier to connect, but also because government support lowers the cost of deploying FTTH to network owners.
Both regions are also rapidly strengthening their mobile networks. In Q1 2012, around 64 percent of the worldwide 4G LTE subscriptions were in North America, 33 percent were in Asia Pacific, and only 3 percent were in Europe.
Technology leadership requires investmentWithout further investments, Europe will continue to lose technology leadership across the telecommunication value chain to other regions. In the network infrastructure and equipment industry, European-based companies lost 21 percent of the total industry profit pool between 2006 and 2011 to companies from other regions. In the handset market, European manufacturers lost 22 percent of their worldwide market share to Asian and North American companies between 2007 and the first half of 2012.
Today’s industry leaders on the services and applications side are mostly from outside the European Union. Most of the leading Internet companies—including Google, Facebook, eBay, Yahoo, Baidu, and Tencent—are based in either the United States or Asia; none of the 10 most visited Internet sites hails from Europe. Europe also has a low level of innovation. Five times more telecommunications-related patent applications are filed in the United States than in Europe.
Not surprisingly, Europe’s growing infrastructure and Internet service and application disadvantage is showing up in comparative Internet usage. With an Internet
protocol (IP) traffic of 4,818 petabytes (PB) per month, Europe lags the top traffic-generating regions of North America and Asia, which produce 7,091 PB/month and 6,906 PB/month, respectively.
The telecommunication sector’s impact on the economy at largeThe low impact of Europe’s telecommunication sector is evidenced by the fact that, for the first time since the 1990s, the industry in Europe is growing at a slower pace than the region’s gross domestic product (GDP) (Figure 2). This development is mirrored in the numbers reported by the European Union on the value-added by the entire ICT sector. In the United States, the value-added at current prices increased by 8 percent between 2007 and 2010, whereas it decreased in the European Union by 5 percent. In real terms, the value-added increased by 18 percent in the United States and by 7 percent in the European Union. The decrease in the European Union is the result of the price pressure on both retail and wholesale levels.
This decline in value-added has taken a toll in the number of full-time employees working in the industry, which—for a sample of 10 European markets (Austria, Belgium, Denmark, Germany, Greece, Ireland, Luxembourg, Portugal, Spain, and Sweden)—has dropped from 497,000 in 2000 to 357,000 in 2009.
0
100
200
300
400
500
+4% p.a.
+9% p.a.
+2% p.a.
+4% p.a.
200820062004 2005 200720022000 2001 2003199819961994 20091992 1993 1995 1997 1999
Telecommunication sector revenues Nominal GDP
Figure 2: Trends in the telecommunication sector, 1992–2010
Source: OECD, 2011.
Tota
l tel
ecom
mun
icat
ion
reve
nues
to G
DP,
EU c
ount
ries
(100
= 1
992)
@ 2013 World Economic Forum

The Global Information Technology Report 2013 | 97
1.8: Re-Establishing the European Union’s Competitiveness
2011201020092008
+3% p.a.
5250
4848
Figure 3: Operator revenue per subscriber, Europe vs. United States
2011201020092008
464547
51
–3% p.a.
US$/
mon
th p
er li
ne
US$/
mon
th p
er s
ubsc
riber
US$/
mon
th p
er li
ne
US$/
mon
th p
er s
ubsc
riber
Sources: Pyramid Research, 2011a, 2011b.
3b: Mobile operators3a: Fixed operators
n European Union n United States
2011201020092008
–2% p.a.
49494952
EUROPE’S OPERATOR REVENUES: MEETING THE INVESTMENT CHALLENGEEurope’s telecommunication sector needs a revitalizing injection of investment. But relatively low growth and profitability are hindering the region’s operators from meeting this new investment challenge.
Revenues for both fixed and mobile operators in Europe are falling. Average revenues from fixed-line
subscribers have dropped from US$51 a month per subscriber in 2008 to US$46 a month in 2011, a fall of 3 percent a year. This represents an annual revenue loss of around US$15 billion for the fixed industry since 2008.2 In the mobile sector, prices in Europe over the same period have decreased at around 8 percent a year. In contrast, US fixed-line prices increased by 3 percent
2011201020092008 2011201020092008
–8% p.a.
292931
37
@ 2013 World Economic Forum

1.8: Re-Establishing the European Union’s Competitiveness
98 | The Global Information Technology Report 2013
a year and mobile prices fell by only 2 percent a year between 2008 and 2011 (Figure 3).
Lower revenues in recent years have affected the European industry’s profitability. Between 2004 and 2011, the earnings before interest, taxes, depreciation, and amortization (EBITDA) margins for the fixed market contracted by 4 percent a year, representing €5 billion to €7 billion a year of profits foregone.
Declining revenues and thinning EBITDA margins mean the telecommunication industry in Europe is investing less (Figure 4). From 2005 to 2009, Europe invested, on average, US$141 per head in telecommunications, while the United States and Canada, in contrast, invested US$212 and US$230 per head, respectively, implying a telecommunications investment gap between Europe and the United States of around US$100 billion over those five years. Moreover, McKinsey analysis shows that up to 80 percent of the telecommunication investments in Europe’s 10 largest telecommunication markets are made by the two or three leading players in those markets.
Adding to their financial woes, large telecommunication operators have started to pay dividends to their shareholders reaching up to almost half of their cash flow in an effort to keep stock prices high despite all the indicators showing that the industry is past its initial peak. This understandable reaction only further diminishes the industry’s capacity to invest and recover its dynamism.
REGULATING FOR INVESTMENTLow investment in the telecommunication industry is hurting Europe’s competiveness and denying consumer benefits. Revenue growth and profitability in the industry need to increase in order to unlock the scale of investment required to restore them both. Bringing revenue growth back to 4 percent a year could generate €450–500 billion of additional revenue over the next 10 years, according to McKinsey estimates. This would, in turn, generate an additional €150–200 billion of profit at current EBITDA margins—enough to get started on the essential investments in fixed and mobile networks outlined above. Public funds might fill the rest of the investment gap.
Restoring the industry’s revenues to unlock investment requires a “New Deal”—that is, an industry framework that will not only allow pricing flexibility and promote consolidation among operators in both the fixed and mobile markets, but will also give operators the regulatory clarity needed to commit to larger, long-term investments in the industry.
Several policy steps in the right direction have been taken by EU Member States and by the European Union region as a whole. For instance, to encourage the construction of next-generation networks, the European Union has allocated some funding, initiated a public consultation on how to promote investment in these networks, and indicated in its policy statement in May
0
10
20
30
40
50
2009200820072005
40
444547
–4% p.a.
Figure 4: Annual capital expenditure, Western European operators (2005–09)
Sources: OECD, 2007, 2009, 2011.Notes: Western Europe comprises the EU15 (Austria, Belgium, Denmark, Finland, France, Germany, Greece, Ireland, Italy, Luxembourg, the Netherlands, Portugal, Spain, Sweden, and the United
Kingdom) plus Norway and Switzerland. Capital expenditure is calculated over five years; data for 2009 are the latest reported by the OECD; data for 2006 are not reported by the OECD.
Euro
s, b
illio
n
@ 2013 World Economic Forum

The Global Information Technology Report 2013 | 99
1.8: Re-Establishing the European Union’s Competitiveness
2012 that a more investment-friendly wholesale pricing regime is on its way (for more details, see Box 1).
INCENTIVES FOR INVESTMENTAs industry stakeholders shape the region-wide policy framework that Europe needs to underpin the rollout of next-generation fixed and mobile networks, McKinsey offers four additional ideas that relate specifically to market structure, pricing, wholesale access regulation, and spectrum.
• Allow a reduction in the number of fixed and mobile operators. As noted earlier, the fixed market in Europe is characterized by a large number of small players that compete on price; the few much larger players make little or no investment. Europe’s consumers might be better served by a fixed industry with fewer, stronger players able to make larger investments but sufficiently numerous to ensure competition remains vibrant.
Europe’s mobile market also needs considerably fewer operators. The EU15 has 56 mobile operators, while the United States has only four to cover a similar size territory and population. Authorities should consider allowing operators in Europe to consolidate so they can operate networks and use resources such as spectrum in a more efficient manner.
• Allow more pricing flexibility. Operators need the flexibility to adjust prices to customers so they reflect the bandwidth and volume of data traffic that the customers require. With that flexibility, operators could consider charging more to the customers who are raising operating costs by demanding higher speeds, more services, and greater capacity over the Internet.
• Restrict wholesale access regulation to a few basic services; for example, unused fiber and ducts. Combined with allowing operators “regulatory holidays” for a reasonable period on any investments in new generation networks, restricting in this way would give operators a better chance of recouping their investments.
• Give operators more spectrum in which to operate. Such an increase in spectrum could contribute to this positive investment outcome. For example, allocating the second wave of the digital dividend spectrum (700 Mz) to wireless broadband use; enabling operators to acquire enough low and high frequency to give them the coverage and capacity they need to meet both exploding data demand and the “need for speed”; and ensuring
that high-speed backhaul from cell sites is available by allocating appropriate frequencies for backhaul can all lift the investment value proposition.
A combination of the ideas mentioned above, along with the current measures implemented by the European Commission, could open the doors for the industry to
Box 1: Policy moves in the right direction
Some specific EU Member States and the European Union as a whole have made some recent regulatory changes that will help to unlock investment. These include:
• Supporting co-investment initiatives. Recently several operators in countries—including the Netherlands, Portugal, Spain, and Switzerland—have started to consider co-investment initiatives in which two or more operators would join forces to deploy expensive fiber networks. The operators will share the network, but will not be subject to wholesale access obligations that allow other operators access to the new network for a given period of time, usually the first five years.
• Allowing geographic differentiation. A forerunner in taking regional differences into account is the Portuguese decision not to regulate wholesale access in geographic areas where competition exists. In rural areas, operators can get support from public funding, which in turn will not be offered to companies operating in competitive areas.
• Providing public funding. In Sweden, government support for extensive municipal high-speed networks has stimulated the construction of next-generation fixed networks in rural areas, while mobile network sharing agreements have lowered the capital required to build new long-term evolution (LTE) infrastructure. At a regional level, the European Commission also recently created the Connecting Europe Facility to help fund the rollout of next-generation networks and pan-European digital services.
• Maintaining the current wholesale price for access to “unbundled” copper connections. The European Commission recently released guidelines indicating that wholesale prices for access to unbundled copper connections should be kept at their current levels so network operators can earn enough to fund the rollout of next-generation networks.
• Modernizing spectrum policy. The EU commission recently launched its Radio Spectrum Policy Program, which sets out general principles for managing spectrum in the European Union and defines key policy objectives. It has started to foster spectrum trading among operators to make more efficient use of available spectrum.
Source: McKinsey and Company.
@ 2013 World Economic Forum

1.8: Re-Establishing the European Union’s Competitiveness
100 | The Global Information Technology Report 2013
invest and revitalize the European economy and re-establish its competitiveness on the global scene.
NOTES1 EU15 countries are Austria, Belgium, Denmark, Finland, France,
Germany, Greece, Ireland, Italy, Luxembourg, the Netherlands, Portugal, Spain, Sweden, and the United Kingdom.
2 Incumbent operators of Austria, Belgium, France, Germany, the Netherlands, Norway, Portugal, Spain, Sweden, Switzerland, and the United Kingdom.
REFERENCESCisco. 2009–11. Visual Networking Index. Available at http://www.cisco.
com/en/US/netsol/ns827/networking_solutions_sub_solution.html.
ComScore. 2012. Media Matrix subscription service, September 21. Available at www.comscore.com.
European Commission. 1998. Communication from the Commission to the Council, the European Parliament, the Economic and Social Committee, and the Committee of the Regions. Fourth Report on the Implementation of the Telecommunications Regulatory Package. Available at http://ec.europa.eu/information_society/policy/ecomm/doc/library/annualreports/4threport/4finalen.pdf.
———. 2011. Telecommunication Market and Regulatory Developments. Available at http://ec.europa.eu/digital-agenda/sites/digital-agenda/files/Telecom_Horizontal_Chapter.pdf.
———. 2012a. “Connecting Europe Facility: Member States Reach an Agreement on Building our Future Iinfrastructure.” Press Release, June 7. Available at http://europa.eu/rapid/pressReleasesAction.do?reference=IP/12/583.
———. 2012b. Digital Agenda for Europe: Scoreboard 2012. Luxembourg: Publications Office of the European Union. Available at https://ec.europa.eu/digital-agenda/sites/digital-agenda/files/KKAH12001ENN-PDFWEB_1.pdf.
———. 2012c. “Fast and Ultra-Fast Internet.” In Digital Agenda for Europe: Scoreboard 2012. Luxembourg: Publications Office of the European Union. Chapter 2. Available at http://ec.europa.eu/digital-agenda/sites/digital-agenda/files/KKAH12001ENN-chap3-PDFWEB-3.pdf.
———. 2012d. “ICT R&D, Innovation and Growth.” In Digital Agenda for Europe: Scoreboard 2012. Luxembourg: Publications Office of the European Union. Chapter 3. Available at http://ec.europa.eu/digital-agenda/sites/digital-agenda/files/KKAH12001ENN-chap4-PDFWEB-4_0.pdf.
———. 2012e. Neelie Kroes, Vice-President of the European Commission responsible for the Digital Agenda. “Enhancing the Broadband Investment Environment.” Statement at Midday Briefing, Brussels, July 12. Available at http://europa.eu/rapid/pressReleasesAction.do?reference=SPEECH/12/552&format=HTML&aged=0&language=en&guiLanguage=en.
European Union. 2012. Decision No. 43/2012/EU of the European Parliament and of the Council of 14 March 2012, establishing a multiannual radio spectrum policy programme Text with EEA relevance. Available at http://eur-lex.europa.eu/LexUriServ/LexUriServ.do?uri=CELEX:32012D0243:EN:NOT.
OECD (Organisation for Economic Co-operation and Development). 2007. OECD Communications Outlook 2007. Available at http://www.oecd.org/sti/ieconomy/oecdcommunicationsoutlook2007.htm.
———. 2009. OECD Communications Outlook 2009. Available at http://www.oecd.org/sti/ieconomy/oecdcommunicationsoutlook2009.htm.
———. 2011. OECD Communications Outlook 2011. Paris: OECD. Available at http://www.oecd.org/sti/broadband/oecdcommunicationsoutlook2011.htm.
Pyramid Research. 2011a. “Fixed Communications Forecast.” Products: Growth Strategy Experts, September. Available at http://www.pyramidresearch.com.
———. 2011b. “Mobile Data Forecast.” Products: Growth Strategy Experts, September. Available at www.pyramidresearch.com.
Shah, N. 2012. “Vendor Share: Global Handset Market by Region: Q2 2012.” Strategy Analytics. Available at http://www.strategyanalytics.com/default.aspx?mod=reportabstractviewer&a0=7647.
Telecompaper. 2012. ”France Telecom Preparing to Cut Dividend: Report.” Telecompaper News: General, September 19. Available at http://www.telecompaper.com/news/france-telecom-preparing-to-cut-dividend-report.
Teligen Strategy Analytics. 2010. Report on Telecoms Price Developments from 1998 to 2010. Report produced for the European Commission Directorate General for Information Society. Available at https://ec.europa.eu/digital-agenda/download-scoreboard-reports.
@ 2013 World Economic Forum

The Global Information Technology Report 2013 | 101
CHAPTER 1.9
The Big Opportunity for Inclusive Growth
MIKAEL HAGSTRÖM
IAN MANOCHA
SAS Institute Inc.
How to use, exploit, and contextualize big data, and how to avoid its misuse, have become societal issues. These issues matter to everyone because big data will play a key role in overcoming the current economic inertia and achieving the objective of inclusive growth—the involvement of the broadest possible spectrum of people in wealth creation.
Many doubt the wisdom of direct government intervention and increased spending to create jobs. Huge sovereign debt makes this approach problematic in any case. Traditional policy levers to address structural unemployment—such as retraining, increased labor mobility, deregulation, and investment in research—are having a diminished impact, while fiscal consolidation and austerity measures appear to be slowing the return to economic growth.
BIG DATA AS A DRIVER OF BUSINESS OPPORTUNITIESHuge untapped opportunities exist in big data, but most commercial organizations in most sectors just do not know how to handle, identify, and exploit these opportunities. The management mindset must change.
This is also true of government, which can and must play a central role at the head of a broad coalition embracing business, academia, workers, and students to unlock the potential of big data.
If we can recognize big data as the new asset class that it is, the economic upswing could well match that of the second industrial revolution brought about by the mass production methods of Henry Ford and the scientific management techniques of Frederick Winslow Taylor.1
What is big data?Big data is a popular term used to describe the exponential growth in the volume, variety, and velocity of data. At the same time that volumes of data are growing, the data used by organizations large and small are becoming increasingly variable, complex, and difficult to manage using established data management tools. An example is the highs and lows in data volumes created by web traffic originating in multiple sources, both external and internal to an organization. In 2011 alone, 1.8 zettabytes (or 1.8 trillion gigabytes) of data were created2—the equivalent of every person on the planet writing three tweets per minute for 1,210 years.
The term big data is therefore relative. It applies—per the assessment of leading information technology (IT) analyst the Gartner Group—when extreme information management and processing issues “exceed the capability of traditional information technology along one or multiple dimensions to support the use of the information assets.”3 This problem presents a huge opportunity: Gartner estimates that, by 2015, big data will directly create 4.4 million IT jobs globally, of which
@ 2013 World Economic Forum
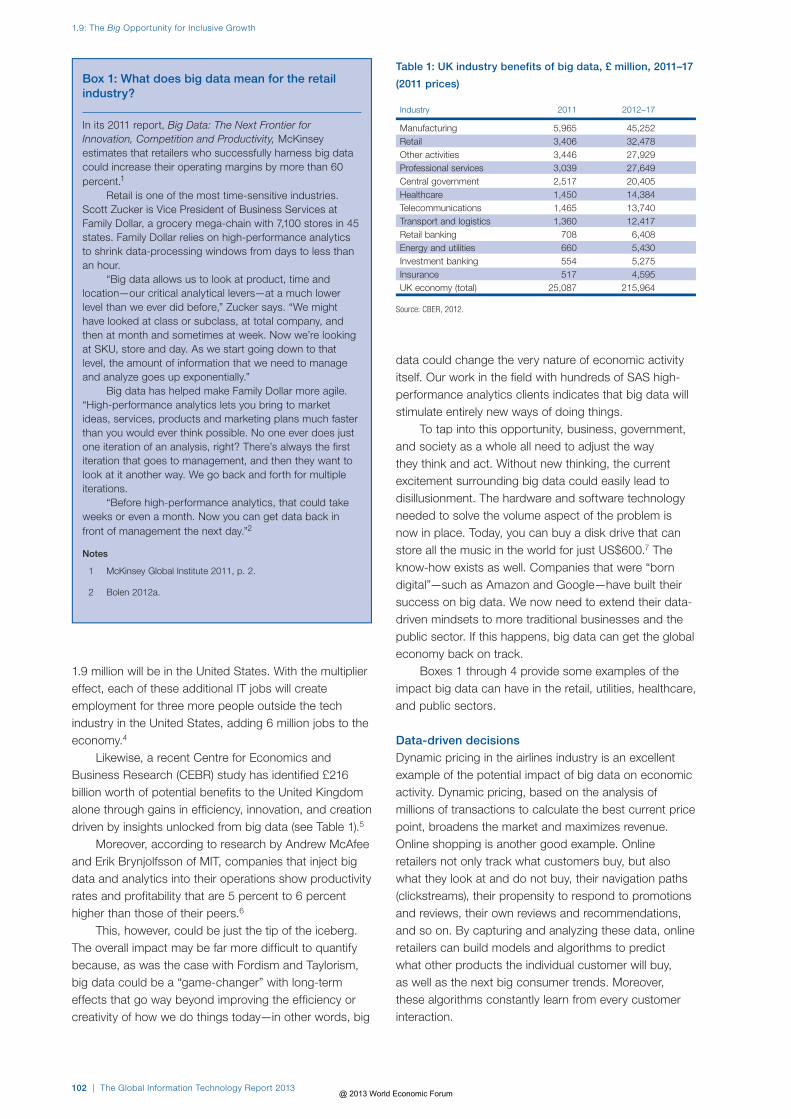
1.9: The Big Opportunity for Inclusive Growth
102 | The Global Information Technology Report 2013
1.9 million will be in the United States. With the multiplier effect, each of these additional IT jobs will create employment for three more people outside the tech industry in the United States, adding 6 million jobs to the economy.4
Likewise, a recent Centre for Economics and Business Research (CEBR) study has identified £216 billion worth of potential benefits to the United Kingdom alone through gains in efficiency, innovation, and creation driven by insights unlocked from big data (see Table 1).5
Moreover, according to research by Andrew McAfee and Erik Brynjolfsson of MIT, companies that inject big data and analytics into their operations show productivity rates and profitability that are 5 percent to 6 percent higher than those of their peers.6
This, however, could be just the tip of the iceberg. The overall impact may be far more difficult to quantify because, as was the case with Fordism and Taylorism, big data could be a “game-changer” with long-term effects that go way beyond improving the efficiency or creativity of how we do things today—in other words, big
data could change the very nature of economic activity itself. Our work in the field with hundreds of SAS high-performance analytics clients indicates that big data will stimulate entirely new ways of doing things.
To tap into this opportunity, business, government, and society as a whole all need to adjust the way they think and act. Without new thinking, the current excitement surrounding big data could easily lead to disillusionment. The hardware and software technology needed to solve the volume aspect of the problem is now in place. Today, you can buy a disk drive that can store all the music in the world for just US$600.7 The know-how exists as well. Companies that were “born digital”—such as Amazon and Google—have built their success on big data. We now need to extend their data-driven mindsets to more traditional businesses and the public sector. If this happens, big data can get the global economy back on track.
Boxes 1 through 4 provide some examples of the impact big data can have in the retail, utilities, healthcare, and public sectors.
Data-driven decisionsDynamic pricing in the airlines industry is an excellent example of the potential impact of big data on economic activity. Dynamic pricing, based on the analysis of millions of transactions to calculate the best current price point, broadens the market and maximizes revenue. Online shopping is another good example. Online retailers not only track what customers buy, but also what they look at and do not buy, their navigation paths (clickstreams), their propensity to respond to promotions and reviews, their own reviews and recommendations, and so on. By capturing and analyzing these data, online retailers can build models and algorithms to predict what other products the individual customer will buy, as well as the next big consumer trends. Moreover, these algorithms constantly learn from every customer interaction.
Table 1: UK industry benefits of big data, £ million, 2011–17
(2011 prices)
Industry 2011 2012–17
Manufacturing 5,965 45,252Retail 3,406 32,478Other activities 3,446 27,929Professional services 3,039 27,649Central government 2,517 20,405Healthcare 1,450 14,384Telecommunications 1,465 13,740Transport and logistics 1,360 12,417Retail banking 708 6,408Energy and utilities 660 5,430Investment banking 554 5,275Insurance 517 4,595UK economy (total) 25,087 215,964
Source: CBER, 2012.
Box 1: What does big data mean for the retail industry?
In its 2011 report, Big Data: The Next Frontier for Innovation, Competition and Productivity, McKinsey estimates that retailers who successfully harness big data could increase their operating margins by more than 60 percent.1
Retail is one of the most time-sensitive industries. Scott Zucker is Vice President of Business Services at Family Dollar, a grocery mega-chain with 7,100 stores in 45 states. Family Dollar relies on high-performance analytics to shrink data-processing windows from days to less than an hour.
“Big data allows us to look at product, time and location—our critical analytical levers—at a much lower level than we ever did before,” Zucker says. “We might have looked at class or subclass, at total company, and then at month and sometimes at week. Now we’re looking at SKU, store and day. As we start going down to that level, the amount of information that we need to manage and analyze goes up exponentially.”
Big data has helped make Family Dollar more agile. “High-performance analytics lets you bring to market ideas, services, products and marketing plans much faster than you would ever think possible. No one ever does just one iteration of an analysis, right? There’s always the first iteration that goes to management, and then they want to look at it another way. We go back and forth for multiple iterations.
“Before high-performance analytics, that could take weeks or even a month. Now you can get data back in front of management the next day.”2
Notes
1 McKinsey Global Institute 2011, p. 2.
2 Bolen 2012a.
@ 2013 World Economic Forum

The Global Information Technology Report 2013 | 103
1.9: The Big Opportunity for Inclusive Growth
`
Other examples of how we have seen big data analytics boosting our clients’ businesses include the ability to:
• recalculate entire risk portfolios in minutes and understand future possibilities to mitigate risk;8
• analyze millions of SKUs to determine optimal prices that maximize profit and clear inventory;9
• better understand customers to optimize product assortments;10
• send tailored recommendations to mobile devices at just the right time, while customers are in the right location to take advantage of offers;11
• analyze data from social media to detect new market trends and changes in demand;12 and
• use data mining to detect fraudulent behavior.13
In each case, success is determined by how effectively the organization (1) harnesses data and uses them creatively, (2) builds models that enable it to predict better and to optimize outcomes, and (3) transforms itself so that it is more agile in acting on insight. It is this last
requirement that poses the greatest challenge and it is here that government can play an active supporting role, as discussed below.
GOVERNMENT BIG DATA INITIATIVES TO TACKLE UNEMPLOYMENTGovernment is one of the largest users of data. It must now take the lead both as an exemplar and as an enabler of big data best practices. McKinsey estimates that the governments of developed European Union countries could save more than €100 billion (US$149 billion) in operational efficiency improvements alone by using big data.14 Our work with government agencies demonstrates that far more can be saved by using big data to reduce fraud and tax evasion.
Big data can also help government to make the leap from “fail and fix” to “predict to prevent.” A recent
Box 2: What does big data mean for utilities?
Most organizations never saw the era of big data coming. But U.S. Gas & Electric, a major energy retailer in 12 US states, has been watching closely.
“Our industry is on the cusp of smart meters,” says Greg Taffet, CIO of U.S. Gas & Electric. Taffet is referring to the digital devices that will deliver a steady stream of real-time demand and usage information from customer homes to utility providers. Electricity providers manually read meters once a month, feed the data into complex algorithms that take into account historical weather and demand patterns, and make purchasing and pricing decisions based on the results. “There is still a lot of interpretation of the data involved,” says Taffet.
Within the next five to ten years, smart meters will begin streaming usage data to both U.S. Gas & Electric and its customers, significantly affecting the company’s business model. Customers are likely to be more energy-conscious with usage data at their disposal. U.S. Gas & Electric will have an opportunity to offer new services and may even begin expanding into ancillary businesses, such as selling high-efficiency air conditioners or offering insulation services.
“We think this has the opportunity to benefit both our customers and our own business model,” says Taffet. He estimates that smart meters will result in 1,000 times the data coming through his systems. In preparation, Taffet is investing heavily in infrastructure, especially storage and processing capacity. “It is going to be a game changer,” he says.1
Note
1 Economist Intelligence Unit 2011, p. 22.
Box 3: What does big data mean for healthcare?
In its 2011 report, Big Data: The Next Frontier for Innovation, Competition and Productivity, McKinsey estimates that the potential value from data in US healthcare could be more than US$300 billion per year.1
“In healthcare, it’s a tidal wave of data. And our ability to restructure and change our culture is almost entirely informed by these data,” says Dr Jim LaBelle, corporate vice president of quality, medical management, and physician co-management at Scripps Health, the San Diego–based company that includes five hospitals.
For several years, Dr LaBelle has been overseeing an effort to change the culture at Scripps, from measuring quality almost entirely by the performance of physicians to measuring quality by the performance of processes, systems, and teams. “We are looking at monitoring variation around processes and driving out waste and supporting better care by developing a management system and partnership with the medical staff,” LaBelle says.
To inform its approach to these changes, Scripps collects and analyzes variation data. For example, in anticipation of re-engineering its emergency room procedures, Scripps looked at masses of data on wait times (such as the door-to-doctor metric) and cross-referenced the information against the type of injury, tests that were ordered, and how long it took to discharge the patient. “Then we did extensive simulation of our processes using real-life data, modeling how new and different processes might work,” LaBelle says.
Scripps found that the triage process added an unnecessary and wasteful step in getting patients from the door to a doctor. It was adding time and cost to the system, and not adding significant value. The company eliminated it. “We were able to reduce door-to-doctor time, add capacity to our emergency rooms, and improve the quality of our service.”2
Notes
1 McKinsey Global Institute 2011, p. 2.
2 Economist Intelligence Unit 2011, p. 11.
@ 2013 World Economic Forum

1.9: The Big Opportunity for Inclusive Growth
104 | The Global Information Technology Report 2013
study conducted by Global Pulse, in partnership with SAS Institute, using linguistic analytics, demonstrated how government agencies could harness big data from social media to help formulate policies to address unemployment.15 The primary goal of the research was to compare the qualitative information offered by social media with unemployment figures. We first selected related conversations from blogs, forums, and news from the United States and Ireland between June 2009 and June 2011.
Figure 1 illustrates the project workflow of the study.For all documents (blog posts, tweets, etc. in the
public domain), we assigned a quantitative score for mood state,16 based on the tone of the conversations. We also quantified unemployment-related documents that dealt with other topics, such as housing and transportation, in order to gain insight into populations’ coping mechanisms.
We analyzed these data in two primary ways. First, we correlated mood scores with the unemployment rate to discover leading indicators that forecast rises and falls in the unemployment rate. For example, the social media conversations in Ireland categorized as showing a confused mood preceded variations in the unemployment rate with a lead time of three months.17 Second, the volume of documents related to coping
mechanisms also showed a significant relationship with the unemployment rate, which may give insight into the reactions that can be expected from a population dealing with unemployment. For example, the conversations in the United States around the loss of housing increased two months after unemployment spikes.
Overall, in this initial research, Global Pulse underlined the potential of online conversations to complement official statistics by providing a qualitative picture demonstrating how people are feeling and coping with respect to their employment status.
The conversations that provided insight ranged from the banal, such as “my beer budget will obviously be cut” to the heartbreaking, “a few more months and we’ll have to seriously consider a bankruptcy” and “sorry water bill, this month I will have to pay the electric, next month the student loan.” Taken together, and tagged by mood score, the conversations revealed strong correlations with the unemployment rate, providing leading indicators that unemployment will rise or fall.
Thus, the study showed how linguistic analytics could provide government with the predict-to-prevent capabilities needed to take action before a problem manifests itself. At the level of the individual, this could mean that retraining is made available months before a job loss is experienced, thereby reducing dependence
Figure 1: Social media and unemployment project workflow
Source: Global Pulse and SAS Institute Inc. 2011, p. 3.Note: Black boxes: Online job-related conversations from blogs, forums, and news were automatically retrieved. Gray boxes: Each document was assigned a quantitative mood score based on the
tone or mood of the conversations—for example, happiness, depression, anxiety—it contained. The number of unemployment-related documents that also dealt with other topics, such as housing and transportation, was quantified and categorized into pre-defined lists of document topics representing potential coping mechanisms. White box: These measures—aggregated mood scores and the volume of conversations around different topics—were compared with official unemployment statistics over time in search of interesting correlations.
Public data: Blogs, forums, news
United States and Ireland
Unemployment-related conversations
Sentiments Topics
Official unemployment statistics
@ 2013 World Economic Forum

The Global Information Technology Report 2013 | 105
1.9: The Big Opportunity for Inclusive Growth
on benefits. The high market penetration of social media among young people makes this especially relevant for youth unemployment programs.
While this was a proof-of-concept project, it shows the potential of using social data to influence policy. Building larger databases over time and using richer geographical information related to the inputs would allow more detailed analysis and more nuanced approaches at the regional level.
PROPOSALS FOR LABOR MARKET TRANSFORMATIONIn the first two sections of this chapter, we discussed how big data can impact the economy in the private and public sectors, both by spurring innovation and growth and by giving government deeper insight into the needs of citizens. For big data to influence the economy further, we suggest several measures that are needed to create the right labor market conditions for big data–driven growth.
Needed now: A big data skills-for-growth programTalent shortage is the greatest obstacle to realizing value from big data. Based on current trends, by 2020 the world will generate 50 times the amount of information and 75 times the number of “information containers” it uses now, while IT staff to manage it will grow less than 1.5 times.18
Today’s youth is digitally literate to a degree older generations could never have imagined, yet the world is not producing anywhere near enough data scientists. Investigating big data to answer a business question typically involves a “mashup” of several analytical efforts, and this requires a new breed of professional.19 We need data scientists who are also domain specialists in all sectors, from chief digital officer down to entry-level workers. Our current educational institutions are behind the curve. There are few university programs that address big data analytics, let alone that provide degrees in data science, and there are virtually no schemes to retrain people in big data skills. We need more—far more—workers who are trained in using information to identify and execute business opportunities.
Putting the tools and methods of analytics into the hands of the workforce would industrialize the information-based service economy, much as Frederick Winslow Taylor’s and Henry Ford’s innovations industrialized factory management. In Singapore, the Infocomm Development Agency (IDA) has established a High-Performance Analytics Centre of Innovation, the first of its kind in Asia. Its role is to train professionals in data management and analytics, and to generate intellectual property through co-development with institutes of higher learning.
Big data to match people to jobs more effectivelyDespite high levels of unemployment, companies continue to experience significant skills shortages. In a recent survey of European decision makers, 43 percent reported that they are currently facing at least a moderate shortage of required skills.20 Often, the skills and location of unemployed workers do not correspond to the skills and location of positions available. Big data can help predict these gaps and mismatches before they become critical, and can put plans and programs in place to address those gaps.
Government requires better analytics to profile its data about the unemployed to identify specific characteristics, plan appropriate interventions, and then track the impact of measures taken over time. Better analytics can simplify job searches, automatically provide jobseekers with options, identify the capabilities they lack to qualify for certain jobs, and direct them to the necessary programs for retraining.
If “industrialized,” such an approach can enable unemployment agencies to be more proactive in matching people to jobs and jobs to people. From a big data perspective, the process is not that different from what many large companies are already doing to identify trends and match future supply and demand.
`
Box 4: The public sector can use big data to match skills to jobs
Singapore’s Ministry of Manpower has developed an SAS analytics solution that draws information from a variety of departmental sources to support its operations planning, case management, and the early detection of potential workplace and employment issues. This has enabled it to put resources in place in a timely manner to give employers greater visibility into skills availability, to identify and close skills gaps, and to offer a more targeted service to both employees and employers.1
Analytics can also be applied to anticipate employment needs effectively within a public-sector organization. Recruitment has traditionally been very slow in the US public sector (it currently takes an average of 105 days to fill a post at a federal agency).2 However, the state of North Carolina is using an SAS analytics application called NC WORKS that enables the state government to proactively manage and forecast talent needs. It provides the workforce with the intelligence needed to respond to the changing workforce demographics, including an aging and retiring staff.3
Notes
1 SAS Institute Inc. 2012b.
2 US OPM 2012.
3 SAS Institute Inc. 2011.
@ 2013 World Economic Forum

1.9: The Big Opportunity for Inclusive Growth
106 | The Global Information Technology Report 2013
Information and communication technologies to match jobs to people more effectivelyThe old Catch 22 is at work: workers cannot acquire skills and experience because employers only want workers with skills and experience. Deskilling has been a feature of employment booms and may provide part of the answer.21 The second industrial revolution was possible because companies such as Ford introduced production techniques that overcame the shortage of skilled engineers—opening up employment opportunities for unskilled and semiskilled workers. More recently, the media industry—once dependent on skilled typesetters, graphic artists, and other craft workers—has entered a new age largely as a result of deskilling, facilitated by digital technology.
The public sector can take the lead here. Policymakers should ask how they can redesign workplaces to reduce reliance on scarce managerial talent. Deskilling in public-sector organizations is likely to mean less top-heavy bureaucracy, flatter hierarchies, and greater workplace democracy, supported by big data to provide objective insight.
There is no reason why such an approach could not succeed in the private-sector corporate environment as well. In fact, this approach is highly likely to result in more agile and competitive enterprises as decisions are made more swiftly, but based on scientific analytics rather than executive fiat or company politics.
Restructure labor markets to optimize skills creationIn the era of big data, how do we optimize the labor value creation and delivery chain for a world where business must adapt and transform itself more and more rapidly? We must question our very perception of what constitutes a “job” and what constitutes a “profession.”
In an information-led economy, knowledge process outsourcing organizations (KPOs) will assume a more prominent position in the employment landscape. KPOs provide sources of technical talent, with the knowledge workers often located remotely from the customer.
Although the KPO model has been most closely associated with information and communication technology companies, it can be extended to other areas such as legal processes and research, intellectual property and patent-related services, engineering services, web development applications, CAD/CAM applications, clinical research, publishing, and marketing services. The advantage of KPOs is their flexibility. They do away with the traditional recruitment process, overcome barriers to labor mobility, and are low risk for the employer while offering high rewards and variety for the employee. The fast-changing nature of the digital economy means there will be increasing demand for people who want new challenges rather than routine.
KPOs provide domain knowledge (such as expertise in IT, legal, marketing, or accountancy) to organizations
that do not want to move such knowledge in-house, enabling these organizations to focus on core-competency areas that generate business growth. For example, KPOs might enable an electronics company to focus more on its core competence—developing innovative electronic circuitry—instead of employing people who file patents or run internal IT systems.
CONCLUSIONAs we have shown here, forward-thinking governments in economies from Singapore to Ireland are already taking positive steps toward inclusive growth through the creative use of big data and analytics. Others must follow.
The opportunity is very easy to grasp. Big data can deliver insight. With the application of high-performance analytics to big data, public and private organizations can get the intelligence they need to support decisions in hours or even minutes instead of days and weeks. In simple terms, this will enable businesses to move away from the traditional intuitive management approach, which we would characterize as “fail and fix” or “fail fast” to one we would characterize as “predict to prevent” and “predict to perfect.”
Fail and fix, though always wasteful, can work in boom years when there is margin for error. It does not work in the “new normal” of economic inertia. The fear of failure is too great. The crisis of 2008 should have spelled the end of the fail-and-fix approach. SAS High-Performance Analytics, which uses parallel processing and advanced statistical techniques, can reveal previously unseen patterns and relationships in big data. It can enable governments and financial institutions and regulators to avoid the meltdowns that have characterized the financial landscape in recent years—and it can support business creation, business efficiency, and business innovation. For that to happen, mindsets must change to put more trust in analytics and the people who can interpret data.
NOTES 1 Henry Ford (1863–1947) was the American industrialist and
sponsor of the development of the assembly line technique of mass production. Fordism is a concept used in various social theories and management studies about mass production and related socioeconomic phenomena. The term was introduced by Antonio Gramsci in 1934 in his essay “Americanism and Fordism,” in his Prison Notebooks. Frederick Winslow Taylor (1856–1915) was an American mechanical engineer who sought to improve industrial efficiency. Taylorism is a theory of management that analyzes and synthesizes workflows. Its main objective was improving economic efficiency, especially labor productivity.
2 Gantz and Reinsel 2011.
3 Gartner Group IT Glossary. “Big Data” definition: http://www.gartner.com/it-glossary/big-data/.
4 Thibodeau 2012.
5 CEBR 2012.
6 McAfee and Brynjolfsson 2012.
@ 2013 World Economic Forum

The Global Information Technology Report 2013 | 107
1.9: The Big Opportunity for Inclusive Growth
7 McKinsey Global Institute 2011, p. 2.
8 SAS 2010.
9 Bolen 2012a.
10 Bolen 2012b.
11 Bolen 2012c.
12 Stodder 2012.
13 SAS Institute Inc. 2012a.
14 McKinsey Global Institute 2011, p. 2
15 Global Pulse and SAS Institute Inc. 2011.
16 Mood State is a method by which SAS measures the overall mood and specific moods of a data corpus. Unlike sentiment analysis, which is a simple positive/negative/neutral decision, mood state analysis offers a more refined measure by which to judge social media. Documents are scored to provide mood scores for Anxiety, Confidence, Hostility, Confusion, Energy, and Happiness.
17 Global Pulse and SAS Institute Inc. 2011, p. 11.
18 Gantz and Reinsel 2011.
19 Davenport and Patil 2012.
20 Accenture 2012, p. 12.
21 Deskilling is the process by which skilled labor is eliminated within an industry or economy by the introduction of technologies operated by semiskilled or unskilled workers. This lowers the barriers to entry into the labor market.
REFERENCESAccenture. 2012. Turning the Tide: How Europe Can Rebuild Skills and
Generate Growth. Accenture, with the Federation of Enterprises in Belgium. April. Available at http://www.accenture.com/us-en/Pages/insight-turning-tide-how-europe-rebuild-skills-generate-growth.aspx.
Bolen, A. 2012a. “Will Big Data and High-Performance Analytics Flatten the World?” SAS Voices, April 11. Available at http://blogs.sas.com/content/sascom/2012/04/11/will-big-data-and-high-performance-analytics-flatten-the-world/.
———. 2012b. “Optimizing Assortments with Big Data and High-Performance Analytics.” SAS Voices, March 16. Available at http://blogs.sas.com/content/sascom/2012/03/16/optimizing-assortments-with-big-data-and-high-performance-analytics/.
———. 2012c. “High-Performance Analytics for Big Customer Data.” SAS Voices, February 22. Available at http://blogs.sas.com/content/sascom/2012/02/22/high-performance-analytics-for-big-customer-data/.
CEBR (Centre for Economics and Business Research). 2012. Data Equity: Unlocking the Value of Big Data. London: Centre for Economics and Business Research. Available at http://www.sas.com/offices/europe/uk/downloads/data-equity-cebr.pdf.
Davenport, T. H. and D. J. Patil. 2012. “Data Scientist: The Sexiest Job of the 21st Century.” Harvard Business Review, October 2012. Available at http://hbr.org/2012/10/data-scientist-the-sexiest-job-of-the-21st-century/ar/1.
Economist Intelligence Unit. 2011. 2011. “Big Data: Harnessing a Game-Changing Asset.” September. Available at http://www.sas.com/resources/asset/105404_0911.pdf.
Gantz, J. and D. Reinsel. 2011. “Extracting Value from Chaos.” IDC IVIEW, June. Available at http://www.emc.com/collateral/analyst-reports/idc-extracting-value-from-chaos-ar.pdf.
Gartner Group. IT Glossary. “Big Data” definition. Available at http://www.gartner.com/it-glossary/big-data.
Global Pulse and SAS Institute Inc. 2011.“Using Social Media and Online Conversations to Add Depth to Unemployment Statistics.” Methodological White Paper, December 8. Available at http://www.unglobalpulse.org/projects/can-social-media-mining-add-depth-unemployment-statistics.
Gramsci, A. 1934 (2011). “Americanism and Fordism.” Notebook 22, Antonia Gramsci’s Prison Notebooks 1920–1935. New York: Columbia University Press.
McAfee, A. and E. Brynjolfsson. 2012. “Big Data: The Management Revolution.” Harvard Business Review, October 2012. Available at http://hbr.org/2012/10/big-data-the-management-revolution/ar/1.
McKinsey Global Institute. 2011. Big Data: The Next Frontier for Innovation, Competition and Productivity, May. Available at http://www.mckinsey.com/insights/mgi/research/technology_and_innovation/big_data_the_next_frontier_for_innovation.
SAS Institute Inc. 2010. “Positive Creativity Solves Complex Risk Puzzle: United Overseas Bank CRO Discusses Interplay between Risk Classes and Developing Better Risk Controls for Banking in Near-Real Time.” Available at http://www.sas.com/success/uob_risk.html.
———. 2011. “NC Office of State Personnel Uses SAS to Support Workforce Planning.” SAS Institute. Available at http://www.sas.com/success/ncosp.html.
———. 2012a. Intelligence Quarterly: Fraud Prevention. Third quarter 2012. This publication cites many examples of how organizations are using data to detect and prevent fraud. Available at http://www.sas.com/news/intelligence_quarterly/q312.pdf.
———. 2012b. “SAS helps Singapore Ministry of Manpower Improve Its Planning and Operations.” Customer Success. Available at http://www.sas.com/success/mom.html.
Stodder, D. 2012. “Customer Analytics in the Age of Social Media.” The Knowledge Exchange, October 3. Available at http://www.sas.com/knowledge-exchange/customer-intelligence/featured/customer-analytics-in-the-age-of-social-media/index.html.
Thibodeau, P. 2012. “Big Data to Create 1.9M IT Jobs in U.S. by 2015, says Gartner.” Computerworld, October 22. Available at http://www.computerworld.com/s/article/9232721/Big_data_to_create_1.9M_IT_jobs_in_U.S._by_2015_says_Gartner.
US OPM (United States Office of Personnel Management). 2012. United States Office of Personnel Management Annual Performance Report, Fiscal Year 2011. February. Available at http://www.opm.gov/gpra/opmgpra/performance_report2011.pdf.
@ 2013 World Economic Forum

@ 2013 World Economic Forum

Part 2Case Studies of Leveraging ICTs for Competitiveness and Well-Being
@ 2013 World Economic Forum

@ 2013 World Economic Forum

The Global Information Technology Report 2013 | 111
CHAPTER 2.1
Colombia’s Digital Agenda: Successes and the Challenges AheadDIEGO MOLANO VEGA
Ministry of Information and Communication
Technologies of Colombia
In recent years, the information and communication technologies (ICT) sector has come to play a vital role and has gained in significance in the area of public policy in Colombia. The Colombian government considers the ICT sector to be a priority, acknowledging its importance and its potential impact on the national economy. It has taken critical steps toward increasing the country’s interconnectedness and fully developing a national digital ecosystem, which it recognizes as having great potential for generating wealth and socioeconomic development.
International studies suggest that a direct correlation exists between Internet penetration levels, ICT adoption, the generation of employment, and the reduction of poverty.1
A growing ICT industry creates new jobs in multiple industries and sectors. These jobs—unlike jobs in the primary and secondary sectors of the economy, such as agriculture and manufacturing—are focused on new activities of the third sector of the economy: services. ICT jobs are more competitive internationally and often have better salaries than jobs in the primary sectors. Furthermore, there is evidence that each job created by the ICT industry is a catalyst for the generation of employment in other sectors. In the Latin American context, the multiplier effect of employment in the ICT sector is estimated to be 2.42—that is, each job in the ICT industry generates more than 2 new jobs in other areas of the economy.2
At the same time, the development of the ICT industry increases the competitiveness of countries by allowing them to take advantage of opportunities in a market that is increasingly interconnected and that also facilitates the generation of local and global business opportunities.
A strong, more developed ICT industry makes a country more globally competitive, as demonstrated by the correlation between the Networked Readiness Index, which measures a country’s preparedness to leverage ICTs, and the Global Competitiveness Index, which measures a country’s overall capacity to boost competitiveness.3 It is clear that ICTs have great development potential, and also that those countries that are best prepared to take advantage of ICTs are those that obtain the most benefit from them.
In recent years, Colombia has made important progress: it has improved its ranking in the Networked Readiness Index more quickly than the global average, and it has established itself as the leader in Latin America in terms of e-government tools.
BARRIERS TO WIDESPREAD INTERNET USE IN COLOMBIAColombia has been addressing multiple barriers to achieve widespread Internet use. Obstacles arise in all parts of the digital ecosystem: infrastructure, services, applications, and users.
@ 2013 World Economic Forum

2.1: Colombia’s Digital Agenda
112 | The Global Information Technology Report 2013
Since President Juan Manuel Santos took office in 2010, four main obstacles to the goal of achieving widespread Internet use in the country have been identified:
1. The Internet is not perceived as useful. Surveys have revealed that one of the reasons why the general public and micro-enterprises do not use the Internet is that they do not see it as useful or necessary.4 The lack of specialized and useful applications and content for the general public and micro-enterprises would explain this view.
2. The costs of installing the infrastructure are too high. In 2010, just 200 municipalities out of the country’s 1,102 had access to the fiber-optic network. The use of communication networks has been restricted by geographical features and the scattered distribution of urban areas, as well as administrative problems that hinder the use of the infrastructure that is already present.
3. The resources available to the state for investing in infrastructure are limited. This adds to the previous problem.
4. The purchasing power of Colombians is limited. The costs of hardware and subscribing to the service to get Internet access are relatively high for the majority of the population, and many citizens simply do not have the opportunity, from an economic perspective, to use the Internet.
The lack of relevant content in local languages and the similar lack of interfaces that are accessible to the general public and that give people important information for their everyday lives and businesses largely explain why they perceive the Internet to be of limited use. Penetration is low because there is little demand in light of the perceived limited usefulness of the service.
On the other hand, although it has been shown that Colombia has relative advantages in terms of costs, infrastructure, business environment, and risk, the sector’s development is limited by a lack of human resources and its industry’s lack of experience.
AN AMBITIOUS PLAN TO WIDELY EXPAND THE USE OF THE INTERNET IN COLOMBIAIn order to grow the ICT sector in Colombia, the Plan Vive Digital—the most ambitious public policy strategy ever implemented by the Colombian government for the ICT sector—was established. This plan, to be implemented during the presidential period 2010–14, aims to give the country a technological leap through wide dissemination of the Internet and the development of its national digital ecosystem (its users, infrastructure, applications, and services). The plan responds to the challenge identified by the government of achieving
democratic prosperity through the appropriation and use of technology. Vive Digital is betting on making the Internet ubiquitous. As seen above, a direct correlation between Internet penetration and the adoption of ICTs with employment generation and poverty reduction has been demonstrated. Vive Digital uses this correlation to yield an impact with significant social and economic benefits.
Plan Vive Digital: Strategy and objectivesTo achieve widespread Internet use, Plan Vive Digital has established three specific objectives for 2014:
1. Triple the number of municipalities connected to the information highway. The aim is to extend the infrastructure to connect 1,053 of the country’s municipalities to the national fiber-optic network.
2. Connect 50 percent of micro-enterprises and small- and medium-sized enterprises (known as MIPYMEs) and 50 percent of homes to the Internet.
3. Increase the number of Internet connections fourfold. By 2014, we want to reach 8.8 million Internet connections.5
Strengthening the digital ecosystemVive Digital envisages the development of the country’s digital ecosystem based on four components:
1. expanding the infrastructure,2. creating services at lower prices,3. developing applications and digital content, and4. fostering ICT adoption and use.
The foregoing has the purpose of establishing a virtuous cycle, where a better infrastructure will allow more and better services at lower prices, which in turn stimulates the development of content and applications, and thus the growth of demand.
Expanding the infrastructureVive Digital has already achieved a great deal. Colombia has gone from 2.2 million Internet connections to 6.2 million in the last 2.5 years. In 2013, Colombia will reach 7.8 million Internet connections; in 2014, 8.8 million connections. During this period, significant progress has been made in infrastructure as the tender of the National Fiber Optics project was assigned: in 2010, only 200 municipalities were connected with optical fiber, and now there are 553 municipalities with optical fiber access. In 2013, Vive Digital will connect 226 municipalities more; and in 2014, it has the goal of connecting a total of 1,078 municipalities, reaching 96 percent of the national territory. Currently, the project has installed more than 15,000 kilometers of optical fiber.6
@ 2013 World Economic Forum

The Global Information Technology Report 2013 | 113
2.1: Colombia’s Digital Agenda
One of the fundamental tools for providing nationwide Internet access is mobile Internet connection, for which the fourth-generation (4G) spectrum auction is currently underway (although it is important to note that Colombia was the first country in the region to launch 4G mobile services). The auction process for Advanced Wireless Services (AWS) and 2.6 GHz bands, which has been under discussion since 2012, has gone through a series of steps that result in granting participation to the different interested parties and organizations. All these assignment procedures are carried out by the Ministry of Information and Communication Technologies (ICT Ministry) based on the technology neutrality principle stated in article 2 of Law 1341 of 2009. Regarding access to spectrum, that law also establishes that spectrum permits must always observe this principle and be adjusted to the ministry’s policies, guaranteeing that the usage of assigned spectrum does not generate interference with other services, is compatible with international spectrum usage trends, does not affect national security, and contributes to national sustained growth.
As part of the country’s infrastructure development activities, content distribution network infrastructure will be acquired and content companies will be encouraged to deploy this infrastructure. Infrastructure protocols for home telecommunications will be created that are confirmed to be both feasible for the industry and favorable for users; the coverage of communications in the country will be expanded through the universalization of access to public television and the launch of digital radio with the purpose of determining its implementation feasibility at the national level. Finally, improvements to the Disaster Prevention and Assistance Telecommunication Network are being implemented in order to allow for faster, more efficient, and more effective responses when facing emergencies and disasters in Colombia.
Creating services at lower pricesServices are a vital component of the development of digital connectivity. The infrastructure allows operators to expand their service offerings, increasing coverage as well as technological engagement on the part of users. Some examples of services are Internet service, mobile phone service, and text messaging services.
To ensure that by 2014 the country will have competitive offerings of new-generation technology, Vive Digital envisages doubling the number of Internet access terminals and updating regulations with the purpose of promoting new services, the wider use of ICT infrastructures, and ensuring massive citizen access to IT. Colombia has implemented measures that have allowed, through public-private actions, the widespread use of the Internet; these measures include subsidies for Internet access aimed at lower-income inhabitants. As
a consequence, broadband connections grew by 180 percent in the country in 2.5 years.7
The penetration of personal computers (PCs) has also increased recently, thanks to the policy that eliminated the sales taxes and duties on computers. The result is that Colombia is now the place where the cheapest computers in the region can be found.8
In addition, according to the latest study, the penetration rate in mobile telephony is 105.3 percent.9 Household connections grew from 17 percent in 2010 up to 33.8 percent in 2012.10 By 2013, Colombia expects that 43 percent of households will be connected; the target for 2014 is to connect 50 percent of households. In addition, Vive Digital has given 82,000 computers to children and youth in more than 3,500 educational sites through the Computadores para Educar (the Computers to Educate Program, or CPE). Approximately 7 million children have benefited from the purchase of 577,000 computers, which are being delivered to more than 13,500 educational centers. This is the largest purchase of computers ever made by the Colombian government.
In another instance of Colombia’s progress, on August 28, 2008, Colombia adopted the European digital terrestrial television standard, DVB-T, using MPEG4 H.264, with a channel bandwidth of 6 MHz. Following the recommendation of the Comisión Nacional de Televisión (National Television Commission, or its acronym in Spanish, CNTV) to migrate from the DVB-T standard for digital terrestrial television delivery to the more advanced DVB-T2 standard, the Colombian government officially adopted DVB-T2 on December 20, 2011. Regulations for the adoption of this more advanced standard for digital terrestrial television in Colombia are established in Acuerdo CNTV 002/2012 (a regulation issued by the CNTV—Hoy en Liquidación).11
Developing applications and digital contentThe expansion of applications and digital content offerings, focused on local needs, will yield greater productivity on the part of consumers as well as an increase in development opportunities.
Applications are computing tools that allow users to communicate, execute procedures, and learn and work from different types of terminals, such as computers, tablets, or mobile phones. Digital content offerings refers to the content that can be accessed by the applications. Together, advances in these two areas are essential for a healthy digital ecosystem and are already well under way.
Since 2010, the ICT Ministry’s e-government program, Gobierno en Línea, has framed its activities in the National Development Plan 2010–2014 and in the Plan Vive Digital, especially in the applications, content, and users components defined by the digital ecosystem of Vive Digital.
@ 2013 World Economic Forum

2.1: Colombia’s Digital Agenda
114 | The Global Information Technology Report 2013
The e-government department promotes the implementation and use of the e-government strategy by means of two initiatives: (1) encourage good government through the use of ICTs, and (2) give citizens the power to interact with the state through the use of ICTs.
• Encourage good government through the use of ICTs. This initiative is intended to strengthen e-government in public administration institutions and to promote the implementation of the strategy in the legislative and judicial branches of the public power, in the autonomous public organizations, and in the rest of public sector. The initiative is supported by three processes in order to fulfill its objective: (1) design and innovate to collect and create the directives, products, and services of the strategy; (2) provide technical services and solutions; and (3) appropriate e-government in the state to promote knowledge, implementation, and use of online government tools by public officials and employees.
• Give citizens the power to interact with the state through the use of ICTs. This initiative is intended to strengthen the capacities of citizens and businesses to relate to public organizations and to create opportunities for collaboration, participation, and information for social development. This process is called Adoption of e-Government in Society.
In 2012, the national government online website, Gobierno en Línea, had the following results:
• An increase in the offerings and quality of online procedures and services to approximately 1,024 partial and total online procedures and services throughout the country.
• The promotion of e-government culture through electronic channels: 50 percent of citizens and 78 percent of businesses interacted with the state through electronic channels in 2012.
• A total of 19,222 public officials and contractors were taught and made familiar with ICTs.
• Policies and directives to promote e-government development: directives were implemented in security, usage, interoperability, data access, and zero paper.
• Improvements in the information exchange between public organizations: 56 public organizations released information exchange services in the interoperability platform.
• Promotion of mechanisms to optimize the technological infrastructure of the organizations: the Government Intranet Data Center has 77 applications from 12 organizations that have on-demand computing services, generating savings of US$3.3 million on infrastructure services.
• Now 137 organizations use the state’s high-speed network.
• The launch of the Urna de Cristal (Crystal Ballot Box) has made the government more open to oversight and has elevated the level of accountability of government officials.12 Meanwhile, hiring processes at both the national and regional levels are monitored by the Electronic Hiring System.13
Strengthening the digital content industry is of paramount importance to a successful digital ecosystem. Colombia is currently implementing a digital content policy to address this need. One of the main goals of this policy is that, by the end of 2014, there will be 17 digital centers all across the country (called Vive Labs). These centers will provide a place in which anyone can learn digital content skills and will empower new entrepreneurs with high-quality equipment and licensed software.
In another example, Fortalecimiento de la Industria TI (FITI) is a program that aims to contribute to the transformation of the IT industry in a world-class sector.14 In order to fulfill this aim, the program works through different action lines that integrate a systemic model.
In addition, the MIPYME Vive Digital program seeks to boost competitiveness, productivity, and employment in the country by widely expanding the use of the Internet among micro-, small- and medium-sized enterprises in Colombia. Vive Digital’s objective is to increase Internet penetration among micro-enterprises to 50 percent. When President Santo took office, only 7 percent of micro-enterprises were connected and used the Internet, mainly because they were not aware of how the Internet could be helpful to them. The initiative has centered its efforts on deploying applications for micro-enterprises through medium-sized and large enterprises that can improve their business relationship and processes using these applications with hundreds or thousands of micro-enterprises, which are their providers or distributors. In this way, micro-enterprises see the real business value of the Internet and appropriate its use in their daily operations. The government is also working with ICT providers (such as telecommunication operators, PC vendors, and software developers) to change and complement their products so that they include business applications specifically for micro-enterprise sectors. Internet penetration among micro-enterprises had increased almost threefold by December 2012, and is now at 20 percent.
@ 2013 World Economic Forum

The Global Information Technology Report 2013 | 115
2.1: Colombia’s Digital Agenda
The Apps.co program seeks to have a strong digital entrepreneurship ecosystem in Colombia. The results are very impressive: more than 21,000 Colombians are learning how to code, and more than 480 projects are looking for business opportunities. All these projects are being supported by accelerators and institutions that have been trained by Bob Dolf and Steve Blank, two of the most successful entrepreneurs in the world. Currently the ICT Ministry is supporting 70 companies looking for venture capital investment. In that way, the ministry aims to foster both ICT entrepreneurship and private investment within the country.
Fostering ICT adoption and useThe model is based on the premise that it is necessary to encourage the offering of and demand for digital services at the same time. The objective is to create a virtuous cycle: expanding the infrastructure promotes the offer of low-cost services, which encourage the development of digital applications and content, which in turn stimulate demand for these two products on the part of users, who will then have more incentives to acquire and use these services—thus increasing the size of the market.
The CPE program is responsible for bridging the social and regional gap of Colombia by bringing ICTs to children in rural and remote zones and by training teachers to be better acquainted with technology. The aim is to improve the quality of education in public schools. This program also helps the environment by recycling obsolete computers. According to an impact evaluation, the CPE reduces dropout rates, raises standardized test scores, and increases the probability that a child will enroll in higher education.
When President Santos took office in August 2010, there was a ratio of 20 students per computer. On December 2012, this ratio was reduced to 15 to 1, thanks to the delivery of more than 250,000 terminals (including laptops, PCs, and tablets). The program has also trained 14,000 public school teachers in the use of ICTs. Aligned with environmental initiatives, the program has refurbished 753 tons of obsolete computers (approximately 36,600 computers) in order to reduce the impact that ICTs have on the environment.
In 2013, the CPE program plans to deliver 266,147 terminals to 12,100 public schools, libraries, and community centers (which includes 4,500 new establishments that had not received this benefit earlier). It also plans to provide 150 hours of teacher training in ICTs (at least one teacher in each establishment), and to train 180,000 parents for 12 hours in order to develop their ICT skills. Finally, in 2013, CPE expects to set a record in terms of environmental strategy by refurbishing more than 29,800 obsolete computers (612 tons) taken from public schools.
Another initiative from the ICT Ministry, En TIC Confío is a nationwide program that seeks to promote confidence and security in the use of the Internet and other ICTs in Colombia, as well as divulging and appropriating content concerned with the productive, creative, safe, respectful, and responsible use of ICTs in order to help improve the quality of life for all Colombian people.
Through this ICT Ministry program, we seek to recognize and prevent behaviors that occur every day and are present in the virtual world as sexting, cyberbullying, phishing, Internet addiction, and child pornography. En TIC Confío is focused on guardians, teachers, parents, and children in the educational community. To date, it has reached 78,915 people through interactive conferences. Since 2011, it has produced over 700 pieces of related content that aims to empower the fight against these unwanted behaviors.
In 2012, 1,476 URLs to sites containing child pornography were published by the ICT Ministry platform so they could be blocked by Colombian ISPs.
By the end of 2014, it is expected that 150,000 people will have been effectively reached by the conference for the responsible use of ICTs. Furthermore, 300 new pieces of content for the program will have been generated, and outreach campaigns such as Ciberpapaya, Cibercuidado, and Monstruos en Red will allow us to achieve at least 20 million impacts in media (print, radio, television, and the web).
Another project, the Digital Citizenship Program, seeks to promote access, use, dissemination, and adoption of ICTs among public servants and in the public education sector. The initiative aims to increase levels of incorporation, adaptation, and integration of technologies as required for achievement of sustainable growth in Colombia, ensuring increased productivity and competitiveness while consolidating the quality of the Colombian educational system. Every public servant and teacher in Colombia is to be trained and certified under the program by 2014.
To date, there have been 300,000 people registered for the Digital Citizenship Program; by 2014, 700,000 are expected to have completed their digital citizenship training.15
Redvolucion is another interesting social project aimed at encouraging and inspiring a significantly heightened use of the Internet by community members through stimulating education and training. It also aims to promote the use of ICTs to meet various everyday needs, thereby creating an emotional engagement with technology.16 The online portal is equipped with a variety of learning activities related to ICTs on an interactive multimedia web platform. Training is targeted at the lower strata of society and is carried out by high school students.
@ 2013 World Economic Forum

2.1: Colombia’s Digital Agenda
116 | The Global Information Technology Report 2013
To date, over 110 educational institutions are included in Redvolution´s project. The goal for 2014 is to reach 3,000 educational institutions.
REGIONAL IMPACTThe goal of the ICT Ministry is to impact all 32 departments in Colombia through three strategies:17
1. Promotion of the ICTs offered in each of the departments of Colombia through:— promoting the creation of regional ICT
institutions,— providing support for the integration of the
different ICT issues into the development plans of both departments and towns, and
— representing ICTs in the regions via ICT regional advisers.
2. Joint financing of regional projects through the Vive Digital Regional initiative, which would entail:— providing technical support in the
development of projects to be presented in official announcements,
— developing nationwide announcements for joint financing of regional projects, and
— supporting the execution of regional projects through a local supervision support scheme.
3. Regional research development, which would include:— developing regional research studies as a tool
for the decision-making process, and— developing best-practices studies in the
execution of regional agreements.
To date, the ICT Ministry is working in 26 of the country’s 32 regions on the joint financing of projects to strengthen regional digital ecosystems. The budget for the joint financing of ICT regional projects to support Colombian regions grew nearly sevenfold, from US$26 million (47 billion pesos) in the previous quarter to US$180 million (323.5 billion pesos) in the current one.
Additionally, a public policy for the regionalization of ICTs, which considers the equity in available opportunities for the regions and the elimination of boundaries, the encouragement of innovation, and good governance as basic performance principles, has been structured.
The ICT Ministry motivated the departmental and town governments to include ICTs as part of their development plans, with the destination of services resources for more than US$44 million (78 billion pesos) for the joint financing of regional projects.
GENERAL ACHIEVEMENTS• On February 28, 2012, Colombia won the award
for the government with the most innovative telecommunication policies in the world. It won
the Government Leadership Award 2012 for the Plan Vive Digital at the Global Telecommunications Conference in Barcelona, based on “the management and strategies established by solid telecommunication regulators, based on clear principles that encourage private investment and healthy competition in the last twelve months.” Winning this award highlights Vive Digital as an innovative telecommunication policy with a high economic and social impact. The CPE program of the ICT Ministry was designated as a world model for exemplary performance in access to technologies and knowledge at the opening of the World Summit on the Information Society that is held in Geneva, Switzerland. In addition, the CPE program was chosen as a project that generates lessons that can be replicated elsewhere in the world. For CPE, the fundamental principle is to reach the teachers with training in their own context, so that they get the most out of technology. That is the added value of this social program, as well as the care and maintenance that allows educational venues in Colombia to have technical support.
• Colombia is the second highest ranked country in Latin America and the Caribbean for e-government, according to the Survey of the Economic and Social Department of the United Nations.
• Colombia is the sixth highest ranked country worldwide for electronic participation, according to the Survey of the Economic and Social Department of the United Nations.
• Colombia is the tenth best ranked country worldwide on electronic services, according to the Survey of the Economic and Social Department of the United Nations.
The technological challenges that face the country are significant. However, we have identified these challenges and we have the desire and willingness to do what it takes to overcome them. To that end, we rely on a highly qualified technical team and on the support of the national government. The goals have been established and we are on track. Little by little, we have witnessed how the investments we have made in infrastructure have improved the development of the digital ecosystem in Colombia.
These investments are an indispensable stepping stone in moving forward with the adoption and ownership of IT as an important tool for decreasing unemployment and poverty, while increasing the country’s competitiveness. The impact of the Plan Vive
@ 2013 World Economic Forum

The Global Information Technology Report 2013 | 117
2.1: Colombia’s Digital Agenda
Digital can also be seen in the latest study of digital consumption in Colombia, released in February 2013.18
NOTES1 See http://www.mintic.gov.co/index.php/english-life-digital and
studies from Raul Katz (Columbia University). For more information regarding Katz’s work, visit http://www.udesa.edu.ar/files/UAAdministracion/CV%20profesores/RAUL%20KATZ.PDF.
2 See studies by Raul Katz, Columbia University, 2010; http://www.mintic.gov.co/index.php/english-life-digital; UNCTAD 2010.
3 World Bank 2010; World Economic Forum 2011.
4 For the attitude of the general public, see the ICT Ministry’s 2010 survey of 2,300 low-income inhabitants in 43 municipalities; Ipsos Media IT’s 2012 survey of 1,005 inhabitants in major cities of Colombia. For the attitude of small and medium-sized businesses, see the ICT Ministry’s 2010 survey of 1,500 small and medium-sized enterprises in 43 municipalities. These surveys were conducted by McKinsey & Company while assessing the ICT diagnosis for the Plan Vive Digital in October 2010.
5 The definition of Internet connections in Plan Vive Digital includes wired connections of speeds of more than 1,024 kb/s and 3G/4G wireless connections.
6 ICT Ministry data.
7 ICT Min 2013.
8 Intel, 2012 notebook price comparison study, Colombia-USA, November 22; IDC, 2012 notebook and PC price comparison study, Latin American countries.
9 ICT Ministry 2013.
10 ICT Ministry 2013.
11 CNTV 2012. Acuerdo No. 002 of 2012 is published on the Authority’s Internet site at http://www.antv.gov.co/normatividad/acuerdos/2012/acuerdo_002.pdf.
12 More information about the Crystal Ballot Box is available at http://www.urnadecristal.gov.co/.
13 For more information, visit http://www.colombiacompra.gov.co/.
14 For information about FITI, see http://www.fiti.gov.co/.
15 For information about the Digital Citizenship Program, see http://web.unad.edu.co/ciudadaniadigital/.
16 Details about Redvolucion can be found at http://redvolucion.gov.co/s/inicio.
17 Colombia is divided into 32 departments. These in turn are divided into municipalities.
18 See the presentation of the survey (in Spanish) at http://www.slideshare.net/DiegoMolanoVega/encuesta-de-consumo-digital.
REFERENCESCNT (Comisión Nacional de Television). 2012. Acuerdo No. 002, 6 April.
Available at http://www.antv.gov.co/normatividad/acuerdos/2012/acuerdo_002.pdf.
ICT Ministry (Ministry of Information and Communication Technologies). 2013. ICT Report 4T of 2012. March. ICT Ministry. Available at http://www.mintic.gov.co/images/documentos/cifras_del_sector/boletin_4t_banda_ancha_vive_digital_2012.pdf.
UNCTAD (United Nations Conference on Trade and Development). 2010. Information Economy Report 2010: ICTs, Enterprises and Poverty Alleviation. New York and Geneva: United Nations. Available at http://unctad.org/en/docs/ier2010_embargo2010_en.pdf.
World Economic Forum. 2011. The Global Information Technology Report 2010–2011: Transformations 2.0. Geneva: World Economic Forum.
@ 2013 World Economic Forum

@ 2013 World Economic Forum

The Global Information Technology Report 2013 | 119
CHAPTER 2.2
The Metamorphosis to a Knowledge-Based Society: RwandaALEX NTALE, Rwanda ICT Chamber, Private
Sector Federation
ATSUSHI YAMANAKA, Rwanda Development
Board-ICT/Japan International Cooperation Agency
DIDIER NKURIKIYIMFURA, Ministry of Youth and
ICT of Rwanda
Rwanda’s economy has continued to grow at comparably good rates, averaging 8 percent per annum, despite the global recessionary period that started in 2008. The country’s continuing growth in the midst of the global downturn can be attributed to its good governance and sound fiscal discipline, as well as to the commitment from both its public and private sectors to build a more equitable country.
In the World Bank’s Doing Business 2012 report,1 Rwanda is ranked number one in East Africa with respect to starting up a business, registering property, protecting investors’ interests, enforcing contracts, and obtaining access to credit. The 2012 Global Competitiveness Report, published by the World Economic Forum,2 ranked Rwanda the most competitive economy among the East Africa Community countries and third in sub-Saharan Africa. Rwanda also received the top ranking in East Africa, and 7th in the continent, among countries with active mobile broadband subscriptions per 100 inhabitants in 2011 in the United Nations Broadband Commission report.3
Unlike most African nations, Rwanda has limited natural resources. This limitation presents an opportunity for Rwanda to take an approach to development that differs from that of its neighbors—an approach where information and communication technologies (ICTs) form the linchpin of its plans to fundamentally transform its economy. At the beginning of the decade, Rwanda drew up a blueprint—dubbed Vision 2020—for how to achieve this goal. Adopted in 2000, Vision 2020 outlines several initiatives, programs, and strategies for transforming Rwanda into a middle-income country and transitioning its agrarian economy into an information-rich, knowledge-based one by 2020.
Over the past decade, the government and the private sector have invested massively in building the right infrastructure, skills, and institutional frameworks to provide an environment that is conducive to meeting this target: from the establishment of higher institutions of learning to the laying of fiber-optic cable nationwide, this landlocked country is overcoming all obstacles and moving forward.
The fact that the country is landlocked alone poses challenges for a nation with big ambitions. But the distance from Rwanda to the coast—both from Mombasa in neighboring Kenya and from Dar es Salaam in Tanzania—was circumvented by connecting to two submarine cables (the Eastern Africa Submarine Cable System, or EASSY, through Uganda to Kenya in Mombasa and The East African Marine System, or TEAMS, submarine cable through Tanzania at the Dar es Salaam coast). This is crucial because it creates the redundancies that ensure high-quality, reliable connections with no, or minimum, interruptions even when a fiber-optic cable has been inadvertently cut by road construction or farming activities. The advantages
@ 2013 World Economic Forum

2.2: The Metamorphosis to a Knowledge-Based Society: Rwanda
120 | The Global Information Technology Report 2013
of this approach have been witnessed most recently when the Mombasa submarine landing site experienced fiber-optic cable cuts that tampered with Internet usage in Kenya and neighboring Uganda, but Internet usage was maintained in Rwanda because of the redundancy from the Tanzanian coast. Besides laying the national fiber backbone, which is underground, Rwanda has also rolled out fiber on its electricity national grid network. This creates extra coverage above ground and reduces the risk of cut cables that tends to haunt underground cable networks.
In addition, Rwanda has differentiated itself by adopting an approach that translates into putting forth a framework that goes beyond merely utilizing ICTs as enablers for socioeconomic development. The country also strongly emphasizes the need to explore how to become the ICT service provider for the region and the continent at large. Naturally this requires strong, harmonious policy and regulatory frameworks to supplement the infrastructure already in place.
POLICY FRAMEWORKS AND ACHIEVEMENTSIn order to transform Rwanda into a knowledge-based economy, the government integrated ICTs into its Vision 2020 to enable it to leapfrog the key stages of industrialization. The aim was to transform the agro-based economy into a service-oriented, information-rich, and knowledge-based one that is globally competitive. Rwanda’s unique experience is driven by the strong partnership among the regulatory, policy, and implementing bodies, which are all under the charge of the Ministry of Youth and ICT.
The national ICT strategy and plan—commonly known as the National Information Communication Infrastructure Plan (the NICI Plan)—was adopted by Rwanda in 2000, under the auspices of the United Nations Economic Commission for Africa, as a holistic approach to using ICTs for development. Each of four five-year phases (NICI spans 20 years in total) characterizes this strategy and is aligned with the country’s overall development goals and vision.
NICI I: The creation of an enabling environmentThe first phase, NICI I, effectively focused on creating an environment conducive to using ICTs as tools for development in Rwanda by putting in place effective implementation and coordination mechanisms. These included, but were not limited to, the appropriate institutional, legal, and regulatory frameworks that would support rapid development of Rwanda’s ICT sector, liberalize the telecommunications industry, and reduce entry barriers to the telecommunications market.
NICI II: The development of ICT infrastructureThe second phase of the plan, NICI II, concentrated on establishing critical national ICT infrastructure. Huge
investments have been made in developing world-class ICT infrastructure. The results are highlighted below:
• A high-speed fiber-optic backbone network now interconnects all districts and border points of the country. This network interconnects all government institutions and other private enterprises located in Kigali as part of the Kigali Metropolitan Network. In addition, Rwanda acquired international capacity equivalent to 2.5 gigabytes (GB), connecting to two international routes through submarine fiber-optic cables.
• Mobile phone/data coverage for Rwanda’s population reached 96 percent in 2011 both through the efforts of aggressive public investment and the introduction of transparent competition among private-sector telecommunications operators.
• A state-of-the-art Tier 3 Data Center, the first of its kind in the region, offers 99.98 percent reliability and cloud services.
• The Karisimbi ICT infrastructure project is equipped with a communications, navigation surveillance, and automated traffic management system to ease the flow of air traffic and reduce the risk of flight delays and cancellations in the busy airspace of the Common Market for Eastern and Southern Africa/East African Community region.
• The establishment of a digital terrestrial television (DTT) transmission system boosts television, radio, and telecommunication coverage and the deployment of digital television transmitters have improved nationwide television coverage—to 95 percent coverage of the nation’s physical territory—hence satisfying citizens’ rights to access to information.
• Multipurpose community telecenters, public information kiosks, and ICT buses have been deployed across the country to increase access to ICTs, provide ICT literacy training, and raise ICT awareness, among other services. The establishment of an innovation center provides an ecosystem in which startups combine innovation and entrepreneurship to produce homegrown solutions for local challenges along with globally scalable knowledge.
Enhanced service-delivery programsOwing to the robust ICT infrastructure that has been put in place, the government has been able to improve operational efficiency in the public sector. ICT initiatives that foster development in key economic sectors and
@ 2013 World Economic Forum

The Global Information Technology Report 2013 | 121
2.2: The Metamorphosis to a Knowledge-Based Society: Rwanda
that greatly improve Rwanda’s service-delivery system have been established. These initiatives fall into three main categories:
• In business: – business incubators and career development support services;
– online trade information portals; – online tax calculators; – a credit reference bureau; – a land administration and management information system;
– an electronic case management system for legal cases;
– online business registration; – a smart national identification system; and – improvements in online banking and the e-transaction regulatory system.
• In agriculture: – E-Soko—a mobile market information solution that allows farmers and consumers to access market information for agricultural products; and
– the agricultural management information system.
• In healthcare: – Open MRS—an open-source medical records system that facilitates nationwide tracking of patient data;
– TRACnet—a system that allows the central collection and storage of clinical health information;
– Mobile e-Health—a system used by community health workers to collect data for Open MRS and TRACnet systems; and
– telemedicine facilities connecting hospitals in rural areas to referral hospitals in urban areas.
The impact of ICTs on foreign direct investment in RwandaWith the huge investments in ICT infrastructure, over US$540 million in foreign direct investment (FDI) has been attracted to the ICT sector. This has led to an influx of foreign institutions setting up operations in Rwanda. Among these are VISA, Inc., the multinational financial services and global payment systems giant that set up its Rwandan offices in late 2011; and Airtel, the fourth-largest telecommunications company in the world, which began operations in March 2012.
NICI III: Service developmentThe third phase of the plan, NICI III (also known as the NICI-2015 Plan), is focusing on the development of services by leveraging ICTs to improve service delivery to Rwandan citizens. NICI III’s overarching goal focuses on accelerating service development through ICTs,
thereby facilitating sustainable economic competitiveness and increasing ICTs’ contribution to GDP. In this phase, emphasis is placed on five focus areas that will accelerate service development and fuel economic growth:
• Skills development: developing high-quality skills and a competent knowledge base for workers;
• Private-sector development: developing a vibrant, competitive, and innovative ICT sector and ICT-enabled private sector;
• Community development: empowering and transforming communities through improved access to information and services;
• E-government: improving government operational efficiency and service delivery; and
• Cyber security: securing Rwanda’s cyberspace and information assets.
With the establishment of the Kigali Free Trade Zone, Rwanda again looks at moving forward and fast-tracking development in all sectors. The zone will be home to various industries, including an ICT park. It will provide tax incentives for businesses situated there, especially those targeting the export market—these incentives include a 0 percent corporate tax value-added tax exemption, a 0 percent import duty, and a 100 percent research and development costs write-off, among other advantages. At the core of the technology park will be Carnegie Mellon University, a world-class university with which the government of Rwanda has partnered to establish a center of excellence that will develop much-needed, highly skilled ICT professionals. The technology park, which will be heavily oriented toward research and development, is envisioned to foster key clusters in ICTs, including business process outsourcing, cloud computing, ICT education and training, e-government, cyber security, and mobile solutions.
The composition of the ICT industryRwanda’s ICT private sector is classified into eight categories under the ICT Chamber in the Private Sector Federation. Although the industry is still young, it is growing quickly, both domestically, with new business registrations from fresh ICT graduates, and with foreign multinationals. The composition of the industry can be categorized according to different business lines: software developers, telecommunication and Internet service providers, broadcasters, information technology equipment resellers, ICT capacity-building businesses, system integrators under ICT solutions providers, and, of course, cyber café operators. These different business
@ 2013 World Economic Forum

2.2: The Metamorphosis to a Knowledge-Based Society: Rwanda
122 | The Global Information Technology Report 2013
lines are organized as associations, with forums to share experiences and challenges that may face them all. Cross-cutting ICT issues within the associations are represented by the ICT Chamber; for matters that pertain to the general business environment and are not unique to ICTs, the Private Sector Federation is engaged. Although the most vibrant of these business lines or associations are the telecommunications and Internet service providers groups, the industry continues to evolve.
The development of the telecommunication industryThe telecommunication industry is dominated by three mobile phone operators: MTN Rwanda, Tigo Rwanda, and Airtel, with a combined mobile phone penetration rate of 47.5 percent as of August 2012, and over 10 licensed Internet service providers.
Total investment in the telecommunications sector in 2011 was over US$46 million; it exceeded US$36 million for the first six months of 2012.
Telecommunication market shareMTN Rwanda is leading in terms of mobile subscribers, with 63.7 percent of the market share, followed by Tigo, which has 33.9 percent. Airtel Rwanda, which began operating in March 2012, has the lowest market share—2.4 percent, as illustrated in Figure 1.
Network performance and coverageAll three operators are making the investments necessary to upgrade their respective networks and be
competitive. The coverage for each network is depicted in Table 1.
Table 1: Coverage of operators, June 2012
Geographical Population Operator coverage (%) coverage (%)
MTN Rwanda 97.9 97.7Tigo Rwanda 78.7 97.1Airtel Rwanda 3.0 9.0
Source: PMO, 2012.
Trend of fixed and mobile subscribersIn a clear indicator of the success of the adoption of ICTs, the mobile phone penetration rate of Rwanda rose meteorically between 2002 and 2012. Figure 2 shows the trend in the numbers of both fixed line and mobile subscribers from the year 2002 to June 2012, and illustrates how phone penetration took off in 2007. Between June 2012 and October 2012 alone, mobile teledensity has risen from 44.4 percent to 47.5 percent.
Internet penetration rateFrom 2008 to 2010, there was an exponential increase of Internet penetration, made possible by the increase of competition in the telecommunication sector. In 2011, we observed a slight decrease in Internet penetration because of the revocation of the mobile license of one of the operators, Rwandatel.
Figure 1: Telecommunications market share, incumbent Internet service providers
Source: ITU World Telecommunications/ICT Indicators Database 2012; Ookla Net Index 2012.
n MTN Rwanda
n Tigo Rwanda
n Airtel Rwanda
1a: Market share, March 2012 1b: Market share, June 2012
@ 2013 World Economic Forum

The Global Information Technology Report 2013 | 123
2.2: The Metamorphosis to a Knowledge-Based Society: Rwanda
HUMAN CAPACITY BUILDINGIn line with Vision 2020, the government of Rwanda is committed to investing in human capital. This translates into nurturing a strong skills base and fostering an environment that promotes knowledge and skills transfer between academia and industry.
Carnegie Mellon University-RwandaOne of the approaches to knowledge creation and transfer can be seen in the induction of Carnegie Mellon University (CMU) in Rwanda as a means to transform graduate education. With a history of excellence in higher education, and as a global thought leader in technology innovation, Carnegie Mellon is the first US research institution offering degrees in Africa with an in-country presence and resident faculty—transporting first-class education to the Rwandan education scene. CMU’s presence will dramatically transform the knowledge base in the country and incorporate capacity building.
ICTs in educationThe government of Rwanda has implemented numerous ICT initiatives in education that are transforming the field. These initiatives include training in ICTs for primary and secondary school teachers; scholarships in science and technology; the ICT Training & Research Institute at Kigali Institute of Science and Technology (KIST); the Educational Management Information System, and the Rwanda Development Gateway—an information portal that includes education information.
The One Laptop per Child initiative is aimed at familiarizing Rwandan schoolchildren with computers and preparing them to gain quality skills through ICT-based innovative education content. This ongoing program has already distributed more than 110,000 laptops in primary schools across the country.
At tertiary-level institutions, the National Electronic Distance Education and Training Programme complements campus-based education by deploying electronic message technologies, in addition to the tele-education program at the Kigali Institute of Education and African Virtual University at KIST.
ICT innovation center: The Knowledge Lab (kLab)In tandem with Rwanda’s journey to becoming a knowledge-based economy, the government—in partnership with the private sector and the Japan International Cooperation Agency—have put in place kLab, an ICT innovation center with the mission of promoting and supporting the development of innovative ICT solutions by nurturing a community of entrepreneurs facilitated by experienced mentors.
KLab brings like-minded innovators together and provides the resources needed to explore and exchange their ideas—resulting in innovative solutions to local problems. KLab hosts coding competitions, seminars, classes, and other community-led events. Similar initiatives across the world have shown that the synergy created through such an environment is a critical aspect in the growth of a healthy ICT sector.
Figure 2: Trends of fixed and mobile subscribers, 2002–12
0
1
2
3
4
5
6
20122011201020092008200720062005200420032002
No.
of s
ubsc
riber
s, m
illio
ns
Source: Rwanda Utilities Regulatory Authority (RURA).
@ 2013 World Economic Forum

2.2: The Metamorphosis to a Knowledge-Based Society: Rwanda
124 | The Global Information Technology Report 2013
CHALLENGES AND THE WAY FORWARDDespite the tremendous progress that has been made, the ICT sector continues to encounter challenges that hinder its development. Among these challenges are:
• The limited availability and high costs of energy: The nation is known as the “land of a thousand hills.” This geographical configuration has posed challenges to the penetration of the national grid network and has led to limited electricity availability in those places that are not easily accessible. The high costs of electricity have stemmed from its limited generation, which has—in the past—depended on hydro generation. Coupled with high transmission costs and legacy power management systems, these factors have led to the high costs of energy in Rwanda.
The challenge has been understood and measures are being taken to address it, beginning with a huge campaign for alternative energy sources such as solar and biomass fuels, among others. The potential of employing new mechanisms of transmission and distribution management through a SMART electricity grid and energy market design are also being considered.
• A shortage of highly skilled ICT personnel: The shortage of highly skilled ICT personnel has resulted in key investment opportunities being missed. As early 1997, three years after the country’s devastating genocide, Rwanda recognized the need for technology as a driver of growth. The government thus established KIST with the sole purpose of producing highly skilled engineers to serve the nation’s development goals. However, the demand kept growing, with the result that more and more universities have been introducing ICT-focused courses. But even with all these efforts, there is still a skills gap. This gap has been identified as a consequence of the late adoption of ICTs by the students.
This obstacle is now being solved by early ICT adoption. ICT courses are now introduced at very early stages through initiatives such as One Laptop per Child. It was also in response to this challenge that Rwanda invited CMU to set up a campus in Rwanda to provide training in highly specialized ICT courses.
• Low broadband Internet penetration: Although Rwanda ranks above many African countries in Internet penetration, the penetration rates by which it leads are still very low by its own standards; it is actively working to address this situation. In the end, Rwanda considers that providing affordable and stable broadband access throughout all parts of the
country is essential to its development. Rwanda’s telecommunications market is still dominated by voice-centric mobile services.
With nationwide fiber-optic coverage, the country is embarking on ensuring that last-mile access is provided to fully maximize the opportunity at hand. A study has been commissioned with the aim of mapping out Rwanda’s broadband needs across the entire country in order to bridge the digital divide through last mile broadband connectivity. The plan is to install fiber to some premises and wireless broadband for the rest.
• Limited access to finance: There is still a void in Rwanda’s technology sector with regard to funding, especially for early-stage companies that need angel and venture capital. The ecosystem that attracts FDI flow is nonexistent at the moment. Coupled with high lending rates, the lack of finance makes it difficult for would-be entrepreneurs to see ICTs as an avenue for establishing business. Unlike other sectors—such as financial services and real estate, which have seen a boom in venture capital flow—technology has not yet benefitted from its potential. The lending regime in Rwanda is also such that loans are given against collateral; in most cases, this is the company’s assets. This model does not fit well with ICT companies, since the assets are usually in software, which banks consider to be highly risky and do not fit well in their risk analysis models.
Working with local banks, initiatives are being launched to help financial institutions develop risk analysis models that can address the industry’s needs—particularly those that are into software development. Campaigns are also being carried out to attract venture capital firms from the region and beyond to look at the opportunities in Rwanda. One such initiative—the Rwanda Innovation Endowment Fund—seeks to facilitate startup companies in three major areas: ICTs, agriculture, and manufacturing. The initiative, which will provide funding up to US$50,000 to qualifying projects, aims at promoting the most promising innovations with seed capital.
CONCLUSIONRwanda is making the remarkable journey from an agrarian economy to a knowledge-based economy with a strong focus on providing services and information. The Rwandan experience can serve as an illustration of how a nation with limited natural resources can invest in human capital and make use of ICTs to transcend economic shortcomings and emerge as a leader in its region.
The aligned vision of all stakeholders in the ICT sector, along with the partnerships with all other sectors
@ 2013 World Economic Forum

The Global Information Technology Report 2013 | 125
2.2: The Metamorphosis to a Knowledge-Based Society: Rwanda
at the national level, will translate into ICTs acting to enable all tiers of socioeconomic development in Rwanda. The unified efforts of all sectors to adopt ICTs in their operations have made all the difference.
The country’s experience has not been without challenges: bridging the knowledge and skills gap to create an information-rich, skilled society base and bridging the digital divide are two focal points of interest addressed in the ICT and education policies of Rwanda. The induction of CMU in Rwanda, along with the concerted efforts made at the tertiary level to produce quality technopreneurs, will pay off by creating a strong, highly skilled workforce. In addition, by laying a backbone of optical fiber around the country and at all border points, Rwanda has invested heavily in laying the groundwork to make sure every Rwandan has access to communication technologies. This intricate groundwork will also serve to attract more FDI to Rwanda as a means to further stimulate ICT growth in the region.
Rwanda’s ambitions permeate its borders: it intends to capitalize on its central location in Africa and act as a hub for banking and financial services, as well as business process outsourcing services, leveraging on the strength of its ICT sector. With seven years to meet Vision 2020 and counting, Rwanda is already emerging as a regional ICT leader. The country confidently looks to heralding ICT growth not only in the region, but also on the continent as a whole.
NOTES1 World Bank 2011.
2 World Economic Forum 2012.
3 United Nations Broadband Commission 2012.
REFERENCESPMO (Prime Minister’s Office). 2012. Brief Report on Telecom
Operations. Rwanda Utilities Regulatory Authority, December.
United Nations Broadband Commission. 2012. The State of Broadband 2012: Achieving Digital Inclusion for All. 2012. Geneva: ITU and UNESCO. Available at http://www.broadbandcommission.org/Documents/bb-annualreport2012.pdf.
World Bank. 2011. Doing Business 2012. Washington, DC: World Bank.
World Economic Forum. 2012. The Global Competitiveness Report 2012–2013. Geneva: World Economic Forum.
@ 2013 World Economic Forum

@ 2013 World Economic Forum

The Global Information Technology Report 2013 | 127
CHAPTER 2.3
E-Government in Latin America: A Review of the Success in Colombia, Uruguay, and Panama
MIGUEL A. PORRÚA
Organization of American States
Most Latin American countries entered the 21st century with a gloomy economic outlook. Although the 1990s did not acquire the “lost decade” stamp of the 1980s, Latin American economies were not able to leap forward and catch up to the level of socioeconomic development of the most advanced nations. The dawn of the 1990s witnessed shock to the financial markets with the real currency crisis in Brazil; the 2000s began with the financial crisis in Argentina, with its decision—made in 2001—to suspend payments to international creditors on its sovereign debt. The consequences of this decision are still fishtailing around the tables of international courts, as can be seen clearly in a report issued by the Congressional Research Service in February 2013 under the title Argentina´s Defaulted Sovereign Debt: Dealing with the “Holdouts.”1
The first decade of the new century ended up presenting a remarkable socioeconomic advancement in the majority of Latin American countries. Part of that general progress runs parallel to a conscious and valued effort to bring the countries of the region into the knowledge-based society. This conscious effort is emphasized in the cases of Colombia, Uruguay, and Panama, which will be analyzed in this chapter.
THE ARRIVAL OF E-GOVERNMENT IN LATIN AMERICAIn the crisis context described above, governments in the region live under constant pressure to meet the needs of their citizens with the fewest resources possible. This call for efficient management of public finances has been answered in most countries by state modernization programs that are in their second or third generation and are thereby becoming a stable institutional framework for any public administration transformation. Most of these programs rely on significant financial and technical support from the American Development Bank and, to a lesser extent, the World Bank.
While maintaining a primary focus on the efficiency and effectiveness of public administration, these state modernization programs are actually a widespread call for transparency in the public sector. The Latinobarómetro annual report continues to express concern about the future sustainability of some democracies in the region for two main reasons.2 First, a large proportion of citizens wait eternally for the economic benefits of democracy to arrive. Second, high levels of corruption permanently call into question the credibility of public institutions and those in command of them.
At the beginning of the century, information and communication technologies (ICTs) began to make a serious breakthrough in all areas of Latin American society. That magical combination of telecommunications and computing, manifested in the Internet, began to demonstrate its huge potential—not only by enriching
@ 2013 World Economic Forum
2.3: E-Government in Latin America
128 | The Global Information Technology Report 2013
the more creative entrepreneurs but also by touching on every area of daily life, transforming it forever.
Al Gore, the former vice president of the United States, deserves credit for making a big push to introduce ICTs in the US government, showing countries throughout the world how this can be done.
In the 1990s, when the Washington Consensus preached trade liberalization, financial market openness, market-driven currency exchange rates, tax reforms, and other well-known economic policy prescriptions to Latin America, ideas about the new public management (NPM) methods also appeared in the region. Although the countries that followed the NPM creed were left with a network of autonomous institutions responsible for certain government services and some successful public service outsourcing processes, the public management system in the region remained largely over-regulated and process-focused. As a consequence, the importance of results and efficiency never were recognized. Several of the government-controlled autonomous institutions that provide water, electricity, or telephony services still in operation in the region illustrate this trend of the 1990s.
The described context in Latin American countries presents a scenario in which one of the theories developed by Douglas Holmes on the “Internet effect” in the public sector is particularly relevant.3 According to this theory, the Internet comes to public administration as a tool that invites people to re-think and, above all, one that creates excitement in a sector characterized by conservatism and boredom.
Quite soon the term e-government, popularized by the Clinton administration in the mid-1990s, found its Spanish version as e-gobierno in Latin America. The term and what it represents was widely adopted and began to impact the functioning of government. However, adopting is far from embracing. During the second half of the 1990s, we see mere flirtations with e-government in Latin America through isolated actions, but no evidence of generalized use.
Analyzing these early forays into e-government by Latin American countries with the privileged lens granted by time passed, we can classify these early attempts as reasonably successful and essential to the further development of e-government in the region. In Chile, during the administration of President Eduardo Frei (1994–2000), the first strategic documents on the use of ICTs to improve the competitiveness of the country in general and the functioning of the Chilean public administration in particular were developed. In 1999, Chile’s Internal Revenue System was one of the first public institutions in Latin America to have an interactive presence on the Internet, and 5 percent of its tax returns were filed online that year.4
Around the same time, in 2000, under President Andres Pastrana (1998–2002), Colombia launched its national Agenda for Connectivity. In August of the
same year, the Agenda for Connectivity released the Colombian State Portal, funded by the Presidential Anti-Corruption Program. The Agenda for Connectivity subsequently guided the progress of e-government in the Andean country until it was renamed “Government Online” and revised under President Alvaro Uribe.
Equally visionary in the use of new technologies in the public sector was the government of Fernando Henrique Cardoso (1995–2003) in Brazil. The SOCINFO (Society + Information) program, launched in 1999, not only laid the foundation for development of the ICT industry in Brazil over the next decade, but also was the starting point for regional pioneering projects of e-government such as Receitanet (which allows citizens to file and pay taxes online) and Comprasnet (which manages government procurement through the Internet). The use of ICTs in electoral processes in Brazil would merit its own paper, since Brazil’s experience in this area is recognized as one of the most advanced in the world—the country allows all votes to be cast electronically through over 400,000 electronic voting machines.5
The pioneering steps taken by Chile, Colombia, and Brazil were soon followed by Argentina, Mexico, Peru, Uruguay, Panama, and others that began by using the Internet as a means of interacting with their citizens in areas related to tax collection, public procurement, or customs. This is not surprising because, for those looking for public investment in ICTs, the easy-to-sell speech included concepts such as “more revenue collection,” “lower expenses,” or, ideally, a combination of both. In addition, the adoption of the Inter-American Convention against Corruption in 1996 pushed transparency to a central place in the political agenda of the region, thereby increasing interest in any tool that could support a more transparent management of public resources.
Throughout the first decade of the 21st century, every Latin American country made some effort to advance e-government. However, many of these efforts are characterized by their secondary place in the political agenda and the lack of fulfillment they showed toward some of their promised impact, particularly in terms of usage of online services. Today, although many countries have established appropriate institutional structures and have set out their respective visions in comprehensive plans, others remain working on their first plans and are still seeking the appropriate institutional solution.
A quick glance at the website of the Network on Electronic Government of Latin America and the Caribbean (RED GEALC; www.redgealc.net), in particular the different editions of the e-government awards excelGOV,6 lets us conclude that the majority of American countries have successfully implemented numerous e-government solutions in all areas of public administration. There is, therefore, a wealth of experience
@ 2013 World Economic Forum

The Global Information Technology Report 2013 | 129
2.3: E-Government in Latin America
from which to learn and a foundation on which to build a plan for the next steps to accelerate progress.
Although the efforts made so far are commendable, and those who have led from either the political or the managerial sphere deserve the highest recognition from their citizens, we live in a global world where frequently one needs to run in order to remain in the same place. Indexes, global studies, and rankings related to the use of ICTs in the public sector indicate that, although most of Latin America trotted toward a knowledge-based society, some countries in Asia and Europe were galloping.
In the second half of the first decade of this century, a group of Latin American countries followed in the footsteps of those pioneers of e-government to emerge as leaders and show the region that, although in the discipline of e-government there is no recipe that guarantees positive results, there are some good practices that seem to lead to success. We consider three of these countries in the sections that follow: Colombia, Uruguay, and Panama.
THE PATH TAKEN BY COLOMBIAColombia had been one of the close followers of the pioneers, but it lost traction during the transition from President Pastrana to President Uribe. It is now regaining that traction under the leadership of President Santos.
Colombia took its first steps in e-government in an encouraging fashion. First, the country undertook an exercise of reflection and strategizing at a high political level that resulted in the document CONPES 3072 (National Council for Economic and Social Policy),7 which—as early as 1999—included an introduction with the following paragraph, remarkable for its time because of its vision of the far-reaching nature of ICTs:
Information Technologies are tools that enable the development of a new economy [E-conomía], the construction of a more modern and efficient National State, universal access to information, and the acquisition and effective use of knowledge—all these building blocks to the development of a modern society [author’s translation].
The Internet had not yet exploded, smart phones had not even been imagined, and the founder of Facebook was still in high school when the government of Colombia talked about the e-economy, the connection of ICTs, the construction of a modern state, and the acquisition and use of knowledge. Fourteen years ago, this was quite a vision for policymakers in Latin America.
This strategic document, which incorporates the first Colombian Agenda for Connectivity as an annex, was followed a few months later by Presidential Directive 02, signed by President Andres Pastrana. This directive
became one of the first strategic documents related to the knowledge-based society in the region, emphasizing the purpose of the Agenda and saying in part:
The National Government has designed the Agenda for Connectivity as a state policy, which seeks to expand the use of information technology in Colombia and thereby increase the competitiveness of the productive sector, modernize public institutions and socialize access to information [author’s translation].
During President Pastrana’s administration, the Presidential Program for ICT Development and the Colombian Government Portal were also launched.
In the early years of President Alvaro Uribe’s administration (2002–10), the focus was on bringing some institutional order to the management of knowledge-based society initiatives and providing human and financial resources for the Agenda for Connectivity. By this time, the Agenda had become state policy. The government under President Uribe maintained the Agenda and strengthened its link to the National Development Plan 2003–2006, which validated and reaffirmed it, making it a driving force for fundamental elements of socioeconomic progress such as education, health, safety, and local development.
In addition, President Uribe showed his commitment to the advancement of ICTs in the country with the signing of two decrees: Decree 3816 of 2003 established the Intersectoral Council for Policies and Management of Information for Public Administration. This decree became a key element for the approval of resources for the Agenda for Connectivity as well as for the adoption of interoperability standards within the Colombian government. Decree 1151, issued in 2008, launched an updated view of e-government in Colombia—the Government Online Strategy—along with a set of goals to be achieved by all branches of government, as well as a timetable and a mechanism for monitoring them.
The arrival of President Juan Manuel Santos gave a definite boost to Colombia in its progress in the use of ICTs in the country as a whole and in the government in particular. Building on the accumulated experience and giving continuity to the team that had been working in the Colombian Government Online Strategy for years, the Ministry of Information and Communication Technologies launched the Vive Digital (Live Digital) strategy.8 In just two years, Vive Digital achieved remarkable results,9 making Colombia the winner of the well-known Global System for Mobile Communications Association (GSMA) Government Leadership Award given during the Mobile World Congress in Barcelona in February 2012.
In this environment, Colombia’s rise in the most widely used e-government rankings—such as the
@ 2013 World Economic Forum

2.3: E-Government in Latin America
130 | The Global Information Technology Report 2013
Networked Readiness Index (NRI) published by the World Economic Forum and the E-Government Survey published by the United Nations Department for Economic and Social Affairs (UNDESA)—is not surprising. As shown in Figure 1, during the period 2005–11 Colombia experienced an upward trend that positions it as one of the leaders in the region in the use of ICTs the modernization of public administration. The country moves from 57th position in 2003 to 43rd position in 2012, going as high as 31st place in 2010.
Colombia’s experience provides some important lessons for other countries that are still defining their approach to e-government:
1. Political support must be strong. In Colombia, the introduction of ICTs in the society in general and the public sector in particular has always counted on strong political support at the highest level, from the first directive signed by President Pastrana in 1999 to the launching of Vive Digital by President Santos in 2010.
2. The use of ICTs must be state policy. The continuity of plans, initiatives, and teams throughout the last few years underscores the importance of the principle stated in the first ICT strategic document released in 1999, which set up the Agenda for Connectivity as a state policy that seeks to expand the use of ICTs in Colombia to increase the competitiveness of the productive
sector, modernize public institutions, and socialize access to information.
3. Financial resources must be sufficient. Since its launching in 1999, the Agenda for Connectivity has had the financial resources needed to carry out its planned initiatives. Initially, the Agenda depended heavily on international financial cooperation, as evidenced by the fact that it was created under a United Nations Development Programme Transparency project, but gradually gained its place in the general state budget. Under the leadership of the Minister of Information and Communication Technologies, Diego Molano Vega, the government of Colombia announced ICT investments of US$750 million per year (5.5 billion Colombian pesos for four years),10 thanks in part to partnerships with the private sector, which will contribute 40 percent of the total amount.
4. E-government must reflect and respond to the concerns of citizens. Colombia soon discovered that it was essential to focus on the citizen to succeed in e-government. The country became a pioneer of the concept of apropiación—a Spanish comprehensive concept that refers to access, adoption, usage, and sense of ownership—and created an office dedicated to this matter within the Government Online program. This citizen adoption-ownership vision is understood as the
Figure 1: Colombia’s position in the UNDESA E-Government rankings, 2003–12
20
30
40
50
60
201220102008200520042003
E-Go
vern
men
t ran
k
Source: UNDESA E-Government Survey, available at http://www.unpan.org/egovkb/global_reports/08report.htm.
@ 2013 World Economic Forum

The Global Information Technology Report 2013 | 131
2.3: E-Government in Latin America
need to listen to citizens; to communicate with them before, during, and after the implementation of e-government solutions; to seek and attract them to e-government through modern marketing tools; and to ensure a minimum level of connectivity and a basic knowledge of how to use the tools.
5. Cooperation across nations enhances progress. According to Roberto López, the general manager of the regional e-government network RED GEALC, during the past 10 years, Colombia has been the most active participant of all countries in Latin America in the network’s activities. Colombia has requested the most information, participated in more expert exchanges, presented the most candidates for the excelGOV awards, and been involved in more working groups and research activities than any other country in the network. Throughout this decade, Colombia has learned from other countries’ experiences in order to move faster and more successfully along the path of e-government. The website of the RED GEALC, in the horizontal cooperation area,11 illustrates this idea with specific activities.
6. Institutional and workforce capacity must be excellent. The Colombian government has conducted one of the most important efforts in Latin America in building institutional capacity through the training of its human resources. Through agreements with the OAS, CINTEL, SENA, universities, and other institutions, the government program has trained nearly 200,000 civil servants in different areas related to e-government.
THE ROUTE TAKEN BY URUGUAYThe Oriental Republic of Uruguay has demonstrated that it is not necessary to be one of the economic powerhouses of a region to take big steps toward integrating the country, particularly the government, into a knowledge-based society.
Uruguay took its first steps toward e-government early, with the creation of the National Committee for Information Society. In 2000, the issuance of Decree 225, signed by President Jorge Batlle (2000–05), launched the Uruguay in Network initiative. But e-government really took off in the Southern Cone country during the administration of President Tabaré Vázquez (2005–10).
Although the country’s e-government portal was launched and efforts to bring connectivity to schools began in the early 2000s, it was the creation of the Agency for Electronic Government and Information Society (AGESIC) in 2007 that provided the basis for
Uruguay’s recent rapid progress in e-government.12 AGESIC is physically near the Office of the President, and it became the institutional space for careful strategic thinking focused on the digital agenda of the country, as reflected in the Uruguay Digital Agenda 2008–10 (Agenda Digital Uruguay is now in its second, 2011–15, version).13 This document is a comprehensive exercise that focuses on the building blocks of e-government, establishing elements such as a public key infrastructure, an interoperability platform, a computer emergency readiness team (CERT), and a mechanism for online payments. It also sets up operational initiatives that introduced Uruguay to the knowledge-based international arena. Among these initiatives is the Plan Ceibal14—which was awarded the highly regarded excelGOV Prize 2009 by the RED GEALC.
These early achievements of AGESIC soon acquired international visibility, and were probably one reason that Uruguay became home to the first meeting of Ministers and High Authorities of Electronic Government in Latin America and the Caribbean.15 This meeting was organized by the OAS in collaboration with the International Development Bank and the International Development Research Center as well as AGESIC itself. Colombia, as noted earlier, is the most internationally oriented of the RED GEALC network countries, and Uruguay certainly comes second on the list of those looking for international experiences; the country is always ready to learn and share knowledge beyond its own borders.
President José “Pepe” Mujica not only underscored the importance of ICTs for Uruguay’s development, but also enhanced support for AGESIC. President Mujica himself participated in the international e-government event “Towards an Integrated State” in May 2011, giving a speech where he publicly reiterated his presidency’s support of the e-government initiatives led by AGESIC and defended the principle of putting ICTs at the service of citizens and humanizing the current technology-oriented society.
Along with this support, AGESIC counted on two additional elements that help to explain Uruguay’s recent success in the field of e-government. First, political support was reflected in the program’s financial resources. Since its inception, AGESIC’s budget allowed it to expand from 30 employees in 2007 to 160 in late 2011, and to lead numerous initiatives—such as the e-Government Interoperability Platform and the REDUY communications infrastructure initiative16—with its own financial resources. Moreover, the Uruguayan government entrusted the leadership of AGESIC to an executive director who offers a deep knowledge of public administration and a business profile linked to the field of technology. This combination of qualifications in the most senior AGESIC executive, Jose Clastornik, has
@ 2013 World Economic Forum

2.3: E-Government in Latin America
132 | The Global Information Technology Report 2013
proven instrumental to both the political and operational success of the institution.
A remarkable aspect of the Uruguayan progress toward a knowledge-based society is the significant role played by Uruguayan businessmen linked to ICTs. Among its members, the Uruguayan Chamber of Information Technologies (CUTI) has many small- and medium-sized Uruguayan enterprises with regional presence and recognition.17 These companies have elevated Uruguayan technology exports from US$50 million in 2000 to US$225 million in 2010.18 This availability of advanced knowledge and technology solutions within the country has undoubtedly been a catalyst for expanding Uruguayan e-government.
Table 1 shows Uruguay’s path to success, as seen in The Global Information Technology Report 2012 published by the World Economic Forum. The country moves from 65th in the world in 2005 to 44th in 2012. Uruguay’s experience offers some lessons, listed below, that can benefit other countries currently implementing or planning to implement initiatives in this area:
1. Presidential proximity is crucial. In addition to political support at the highest level, proximity to the president is essential for managing the day-to-day activities of e-government. In this sense, the functional independence from the presidency has been instrumental to the success of AGESIC managing the operational portion of its agenda, as has been AGESIC’s formal link to the Office of the President through the Deputy Secretary of the Office of the President, who is a member of AGESIC’s board.
2. Excellent, well-qualified leaders are essential. Overcoming difficult challenges requires leaders with the best credentials. In the case of AGESIC, having a chief executive officer with business experience, deep ICT industry knowledge, and a history of working in public service has been a key factor in its success.
3. Local ICT businesses must be nurtured. The availability of a well-developed local ICT industry has been a cornerstone in Uruguayan progress toward a knowledge-based society. It has provided easy and immediate access to knowledgeable advice and qualified professionals
to implement elements ranging from design to deployment and subsequent operation. By being local, these qualified ICT professionals not only can act faster but also can understand the local culture better, thereby increasing the chances of success in the implementation of e-government projects.
THE WAY OF PANAMAAlthough President Mireya Moscoso (1999–2004)’s mandate created the e-Panama National Commission in October 2001, aside from the national strategic document Agenda for Connectivity and some sectoral progress—especially in the form of the introduction of ICTs in education—Panama made no outstanding advances during this period. The e-Panama Commission, which at the time constituted a good planning exercise, never had the necessary financial resources to achieve the goals proposed. According to media reports, the resources available to the commission did not exceed US$1 million in two years of operation.19
In 2004, then-new President Martin Torrijos (2004–09) provided an important push for ICTs in Panama. Even before taking office, President Torrijos showed clear signs that he attached great importance to ICTs as tools for state modernization. Just 30 days after taking office, he signed Decree 102, which created the Secretariat for Government Innovation. This decree provides the secretariat with broad powers to advance the knowledge-based society, both in the country in general and in the Panamanian government in particular. In practical terms, it raised the matter to a ministerial level, because the secretary reports directly to the president, thus endowing the Secretary for Government Innovation with a significant level of access to and dialogue with cabinet ministers. Projects such as the Digital Agenda, PanamáCompra, PanamaTramita, and others that allow Panama to advance its modernization efforts were brought forward, setting the basis for the development of the information society in Panama.
The government of President Ricardo Martinelli (2009–present) made a smooth transition from the former Secretariat for Government Innovation to what became the Authority for Government Innovation (AIG) by passing Act 65 in October 2009. Led by a general manager who reports directly to the president, the AIG has enhanced international cooperation, particularly with
Table 1: The evolution of Uruguay in the Networked Readiness Index rankings, 2005–12
Year 2006–2007 2007–2008 2008–2009 2009–2010 2010–2011 2012
Rank 60 65 65 57 45 44
Source: World Economic Forum, The Global Information Technology Report, various years.
@ 2013 World Economic Forum

The Global Information Technology Report 2013 | 133
2.3: E-Government in Latin America
the Republic of Korea, and has increased collaboration with the private sector to compensate for limited financial resources.
The AIG has retained those aspects of the secretariat that were considered to be functioning well, including some members of the team; performed a strategic review; and planned to refocus its efforts and provide a renewed push to lift Panama’s score in the e-government rankings of the NRI and UNDESA’s Survey. Under the leadership of Eduardo Jaen, the AIG emphasizes two key goals on which Panama will build its final leap to e-government. The first is to bring connectivity to every municipality in the country. The second is to put the management of public resources across the government in order through the modern solution of government resource planning (GRP). The Paperless Panama project, the 311 Citizen Service Center, and the municipal e-government program MuNet Panama are some of the initiatives that, in little more than two years, have given Panama international recognition as well as helped it progress in the previously mentioned e-government rankings.20
This progress, shown in Table 2, can be attributed to the following reasons and might be a valuable reference for other countries:
1. Extraordinary political support at the highest level. As discussed above, the last three presidents of Panama have included ICTs both in their speeches and actions, passing legislation and launching initiatives. President Martinelli especially emphasized the importance of ICTs during his speech at the 67th United Nations General Assembly in September 2012, presenting them as key instruments to accomplish the Millennium Development Goals.
2. A continuous and participatory planning effort. The last of these efforts, the AIG Strategic Plan 2010–14,21 shows a clear vision not limited by the usual need for results in the short term. Long-term initiatives such as infrastructure deployment projects and organizational culture transformation are included among other actions of more immediate impact such as e-safety and the municipal e-government program.
3. Legal independence and functioning autonomy. Although AIG’s position in the
organizational chart of the government of Panama is near the Office of the President, it is also its own legal entity. This independence provides an important operational freedom that has been instrumental in establishing alliances and agility in project implementation. This autonomy became very instrumental in attracting Eduardo Jaen as general manager. He brought not only a business view to the management of ICTs in government but also the valuable experience of having been IBM’s general manager for Central America.
COMMON ELEMENTS: THE TRIANGLE OF SUCCESSThe recent experiences of Colombia, Uruguay, and Panama confirm the theories of those who research e-government and the suspicions of those who work every day in this field. Although there is no magic formula for success in advancing ICTs in public administration, those who do succeed share some common ingredients.
The first of these common ingredients is the political support of the highest authority in the country. In all three cases analyzed, the support of the president has been instrumental in mobilizing other critical elements, such as legislative changes, institutional strategy, and budgetary allocation.
Another common ingredient in these e-government success stories is the attention paid to the qualification of human resources. This component has two equally relevant sides: the leader and the team. Although they have not done it alone, Jose Clastornik (Uruguay), Eduardo Jaén (Panama), and Diego Molano Vega (Colombia) share a common characteristic that became crucial for the advancement of e-government in their respective countries. All three, for different reasons, are able to communicate directly with the highest authority in the government and know how to interact in their country’s political sphere. At the same time, they are each very knowledgeable about ICTs, after having had successful careers in the private sector.
A third factor—usually a consequence of the previous two—is the availability of financial resources. In recent years, Latin America has seen too frequently how sound political speeches on the subject of ICTs failed to change the life of any citizen and never moved beyond a nice planning document adorning the bookshelf of some ministerial office or multilateral organization. On many occasions, this is because of one fundamental
Table 2: The evolution of Panama in the Networked Readiness Index, 2005–12
Year 2005 2006–2007 2007–2008 2008–2009 2009–2010 2010–2011 2012
Rank 66 65 64 66 58 60 57
Source: World Economic Forum, The Global Information Technology Report, various years.
@ 2013 World Economic Forum

2.3: E-Government in Latin America
134 | The Global Information Technology Report 2013
reason: they did not “put their money where their mouth is,” as the famous saying goes. In those countries where ICTs do not have their own line in the national budget, years will continue to go by without solid ground being established for future socioeconomic progress.
The budgets of other countries, such as Uruguay, ensure that ICTs have sufficient financial resources by allocating specific amounts to e-government in their budgets. Table 3 shows the evolution of investment in e-government in Uruguay over the last five years.
OTHER FACTORS CONTRIBUTING TO SUCCESSAlthough slightly less relevant and less evident than the three elements discussed above, some other aspects that have accelerated the progress of e-government in the countries studied are worth mentioning.
One such element is the search for international points of reference. As pointed out earlier, the organized effort to study, understand, and learn from what others have done, along with the initiative needed to visit countries that are more advanced and invite them to help, have been part of the corporate and political culture of the three countries studied. Colombia, Uruguay, and Panama have made this idea a dogma. They have participated in numerous instances of international relations and cooperation and have taken full advantage of the experience of others.
Another important aspect that should be considered is concerned with the ICT-related business capacity installed in the country. Colombia very cleverly used its Vive Digital push to generate an emerging entrepreneurial sector in the field of ICTs. These entrepreneurs were able to grow because of the investment efforts of the government; this, in turn, ensures that Colombia has the local knowledge needed to progress.22 Uruguay has enjoyed a thriving and exporting technology sector for the past 15 years. And Panama, with its enviable geographical location, also has a large number of ICT multinationals operating within its borders.
Finally, in all three countries a certain element of continuity has been maintained in both their plans and their working teams. In some cases, the ruling party itself changed; in other cases, the ruling party remained in power. But in all three countries, a change of party or president did not mean a radical break in approach or policy. In all three, many members of the team remained in place and the majority of initiatives were continued, and the changes provided an opportunity to review the
strategic approach, introduce new projects, and adapt the priority areas to ever-changing citizens’ needs and technology opportunities.
THE CHALLENGES AHEADAll governments in the region—those more advanced in providing e-government and those lagging behind—face a similar challenge to remain competitive in the global e-government arena: connectivity. According to the last NRI,23 published by the World Economic Forum in 2012, in the Latin American region, only Uruguay and Chile are ranked among the top 50 countries worldwide for broadband Internet subscriptions. Uruguay ranked 47th on this indicator with 10.9 percent penetration and Chile ranked 50th with 10.5 percent. The Netherlands, ranked 1st in the world in the 2012 NRI for broadband Internet subscriptions, had a penetration rate almost four times those of the Latin American top countries. In mobile broadband subscriptions, the panorama does not improve much. Uruguay (ranked 42nd) and Chile (45th) had rates of 9.7 percent and 9.0 percent, respectively. Ecuador was in 47th place, with a rate of 8.3 percent. Korea, the top country in this indicator, showed a mobile broadband subscription rate of 78 percent.
As Chile discovered during its early e-government efforts, merely making modern e-government solutions available to the citizens does not guarantee that citizens will use them. Colombia, an avid observer of international experiences, quickly realized that well-planned marketing and active promotion under the umbrella of an “Appropriation Office” would help to reach out to those who are connected. The problem is that, as the above-mentioned figures show, broadband connectivity still benefits a minority of the population. It should not be a surprise, then, that the main objective of the latest Colombian ICT strategy, Vive Digital, is to multiply the number of broadband connections in the country by four, with strong emphasis on low-income households.
Closing the connectivity gap between Latin American and developed countries will require the deployment of a great deal of infrastructure throughout the region. Regardless of the method chosen (optic fiber, dark fiber, satellite, whitespaces, etc., and their multiple combinations), the necessary investments are challenging. If the governments in Latin America are to take seriously the connectivity gap and the hurdle it poses for the socioeconomic progress of the region, they
Table 3: E-government Office annual budget, Uruguay (2008–12)
2008 2009 2010 2011 2012
Annual budget (US dollars) 9,231,536 7,485,041 9,966,243 15,165,654 16,988,859
Source: AGESIC, available at www.agesic.org.uy.
@ 2013 World Economic Forum

The Global Information Technology Report 2013 | 135
2.3: E-Government in Latin America
will need to work with the private sector and put in place decisive policy actions. For these big investments to become a reality, financial contributions from the private sector will be critical. In addition, some minimum policy commitments will have to be made and implemented. At a minimum, legislation must be passed that attracts investment into the sector by opening it to competition, establishes the necessary investment protection, creates a framework for public-private partnerships, and makes good use of all the radio spectrum available. The more ambitious countries, such as Colombia under the Vive Digital, will even set up tax breaks for the imports of computing equipment.
Even before the arrival of the Internet, the region suffered a connectivity gap between those with access to phone service and those without it. In order to close this gap, beginning in 1994, programs of universal access funds for telecommunications proliferated in Latin America. In general, these programs are funded by charging a percentage (between 0 and 1 percent) of telecommunication companies´ revenues.
Leaving the enormous Brazil fund aside, today close to US$1 billion is available in the bank accounts of these universal access funds. It is paradoxical that the region keeps losing the information society race partly because of its low broadband connectivity at the same time that it sits on these valuable resources, which should be devoted to connectivity-related initiatives. These funds, however, will not be nearly enough to close the digital divide that separates Latin America from the most advanced countries in the world, especially because those advanced countries continue to pour effort and support into initiatives that promote and expand ICTs. For example, last year Australia launched its National Broadband Network initiative.24 This country, which has a smaller surface area than Brazil, plans on investing US$35 billion (US$8 billion of which will be contributed by the private sector) to provide access to broadband connection to all Australians by 2015.
An additional challenge—that will grow in importance as e-government advances—is the issue of interoperability,25 both domestic and international. No e-government solution can bring efficiency to public administration if it is not interoperable. If a solution is designed outside an interoperability framework, it will probably need to rely on the ability of the citizen to provide data and documents, even if online, that are already in the hands of another section of the government. In most Latin American countries, interoperability is left to the will of the authorities involved in any specific public procedure or service. Countries such as Brazil, Chile, Colombia, and México—although they have the required infrastructure in place and have defined the interoperability standards—are still struggling to get the necessary commitments from all actors involved.
The interoperability problem becomes bigger when you consider cross-border situations. E-government will be seriously limited in its ability to deliver on its promises if applications and databases are not able to communicate among themselves outside national borders. Customs procedures, health services, security, judicial collaboration, natural disaster cooperation, international transportation, and many other services require international interoperability if they are going to provide citizens with efficient services. The RED GEALC network has participated in discussions and research on regional interoperability over the past five years, but this is just a tiny light in an uncertain scenario. The exchanges have taken place at a technical level, but interoperability has not yet gained ground in the regional political agenda. Given the difficulty of the topic and its relevance for a region that wants to take the most possible advantage of e-government, political leaders should start paying attention to it as soon as possible.
Despite these significant challenges, e-government is an unstoppable reality. Arguably it will continue to grow in Latin America because it has already shown positive impact in the lives of Latin American citizens. The rankings mentioned are merely an objective mechanism allowing comparison among countries and analysis of their evolution. The relevance lies in what is behind the rankings. Behind Colombia´s position are citizens who, thanks to ICTs, participate more than ever before in the design of public policy. More than 50,000 Colombians participated in the design of the National Educational Plan 2006–15. Uruguay´s position in the rankings is the reflection of the satisfaction experienced by the parents of the 45,000 newborns per year who can register them electronically immediately after they are born, providing them with the right at the center of many human rights—identity. Behind Panama´s rankings are entrepreneurs who used to need five days to set up a company; now, thanks to PanamaEmprende, they can do it in 15 minutes.
MOVING FORWARDTwo forces will combine to keep pushing the advancement of e-government in Latin America. First, people who taste the flavor of the efficiency of the online world through the private sector often become anxious demanders for the same efficiency in their governments. Many Latin Americans are already enjoying the convenience of online purchasing or banking, and want their governments to imitate that type of interaction. Second, all governments face the challenge of attending to the needs of a growing population with ever-increasing demands under a tight budget that rarely expands. This situation generates an urgent plea to make the most out of every dollar managed by the government—also known as efficiency. Every plan to bring efficiency into government will have ICTs as a key supporting tool.
@ 2013 World Economic Forum
2.3: E-Government in Latin America
136 | The Global Information Technology Report 2013
NOTES1 Hornbeck 2013.
2 See www.latinobarometro.org for information about the organization Latinobarómetro and its annual report; see also The Economist 2003.
3 Holmes 2001.
4 See http://home.sii.cl/.
5 See the Superior Electoral Court website at http://www.tse.jus.br/internet/ingles/index.htm.
6 Information about these awards can be found on the RED GEALC website at http://www.redgealc.net/premios-excelgob-2009/content/3711/en/.
7 The CONPES 3072 document is available at http://www.dnp.gov.co/CONPES.aspx.
8 See http://vivedigital.gov.co/.
9 See http://www.mintic.gov.co/index.php/vive-digital/logros.
10 See http://www.mintic.gov.co/index.php/vive-digital/plan/preguntas-frecuentes.
11 See RED GEALC’s “Horizontal Cooperation Fund,” available at http://www.redgealc.net/horizontal-cooperation-fund/content/2024/en/.
12 See http://www.agesic.gub.uy/.
13 For details of the Agenda Digital Uruguay, see http://www.agesic.gub.uy/innovaportal/v/1443/1/agesic/mapa_de_ruta:_agenda_digital_uruguay_2011-2015.html.
14 For further information about Plan Ceibal, see http://www.ceibal.edu.uy/Paginas/Inicio.aspx.
15 For details about the meeting, which took place in March, 2009, see http://www.redgealc.org/montevideo-marzo-2009/contenido/2673/es/.
16 See http://www.agesic.gub.uy/innovaportal/v/518/1/agesic/plataforma_de_gobierno_electronico_del_estado_uruguayo.html?menuderecho=3 for details about the e-Government Interoperability Platform; see http://www.agesic.gub.uy/innovaportal/v/504/1/agesic/red_uy.html?menuderecho=3 for details about the REDUY communications infrastructure initiative.
17 Information about CUTI can be found at http://www.cuti.org.uy/.
18 Oriental Republic of Uruguay 2011.
19 Guerra 2004.
20 For details about all these projects, see http://www.innovacion.gob.pa/proyectos.
21 See http://www.innovacion.gob.pa/descargas/AIG-PLAN-ESTRATEGICO-2010-2014.pdf.
22 See http://www.mintic.gov.co/index.php/vive-digital/iniciativas.
23 To download The Global Information Technology Report or view and interact with the data platform, see http://reports.weforum.org/global-information-technology-2012/#=.
24 For information about Australia’s Department of Broadband, Communications and the Digital Economy, see http://www.dbcde.gov.au/broadband.
25 A complex and complete definition of interoperability beyond the ICT field can be found at www.wikipedia.org. For the purposes of this chapter, we refer to interoperability as the capacity of applications to communicate and exchange data within and across borders.
REFERENCESCáceres. R. B. 2011. Uso de las Fondos de Acceso Universal de
Telecomunicaciones en Países de América Latina y el Caribe. Santiago de Chile: UNECLAC.
The Economist. 2003. “The Latinobarómetro Poll: The Stubborn Survival of Frustrated Democrats.” The Economist, October 30. Available at http://www.latinobarometro.org/docs/The_Economist_31-10-03.pdf.
Gnius, Juan B. 2012. “Inversión y Regulación: Una Aproximación Plural.” Santiago de Chile: Signals Consulting. Available at http://signalsconsultinglatinamerica.blogspot.com/2012/03/inversion-y-regulacion-una-aproximacion.html.
Guerra, D. 2004. “Dejan sin efecto funciones de la Comisión e-Panamá.” La Prensa, September 30. Available at http://mensual.prensa.com/mensual/contenido/2004/09/30/hoy/negocios/38959.html.
Holmes, D. 2001. eGov: e-business Strategies for Government. London: Nicholas Brealey Publishing.
Hornbeck, J. 2013. Argentina´s Defaulted Sovereign Debt: Dealing with the “Holdouts.” CRS Report for Congress, February 6. Congressional Research Service. Available at http://www.fas.org/sgp/crs/row/R41029.pdf.
Oriental Republic of Uruguay. 2011. Uruguay XXI: Promoción de Inversiones y Exportadiones. Montevideo: Oriental Republic of Uruguay. Available at http://www.uruguayxxi.gub.uy/wp-content/uploads/2012/07/Outsourcing-Uruguay-XXI-Oct-2011.pdf.
RED GEALC. excelGOV Awards 2009 catalogue. Montevideo, 2009. Available at http://redgealc.org/premios-excelgob-2009/contenido/3711/es/.
UNDESA (United Nations Department of Economic and Social Affairs). Various years. e-Government Surveys, 2003–12. New York: United Nations Public Administration Network.
World Economic Forum. 2006. World Economic Forum. The Global Information Technology Report 2005–2006: Leveraging ICT for Development. Hampshire: Palgrave Macmillan.
———. 2007. The Global Information Technology Report 2006–2007: Connecting to the Networked Economy. Hampshire: Palgrave Macmillan.
———. 2008. The Global Information Technology Report 2007–2008: Fostering Innovation through Networked Readiness. Hampshire: Palgrave Macmillan.
———. 2009. The Global Information Technology Report 2008–2009: Mobility in a Networked World. Geneva: World Economic Forum.
———. 2010. The Global Information Technology Report 2009–2010: ICT for Sustainability.Geneva: World Economic Forum.
———. 2011. The Global Information Technology Report 2010–2011: Transformations 2.0. Geneva: World Economic Forum.
———. 2012. The Global Information Technology Report 2011–2012: Living in a Hyperconnected World. Geneva: World Economic Forum.
@ 2013 World Economic Forum

Part 3Country/Economy Profiles
@ 2013 World Economic Forum

@ 2013 World Economic Forum
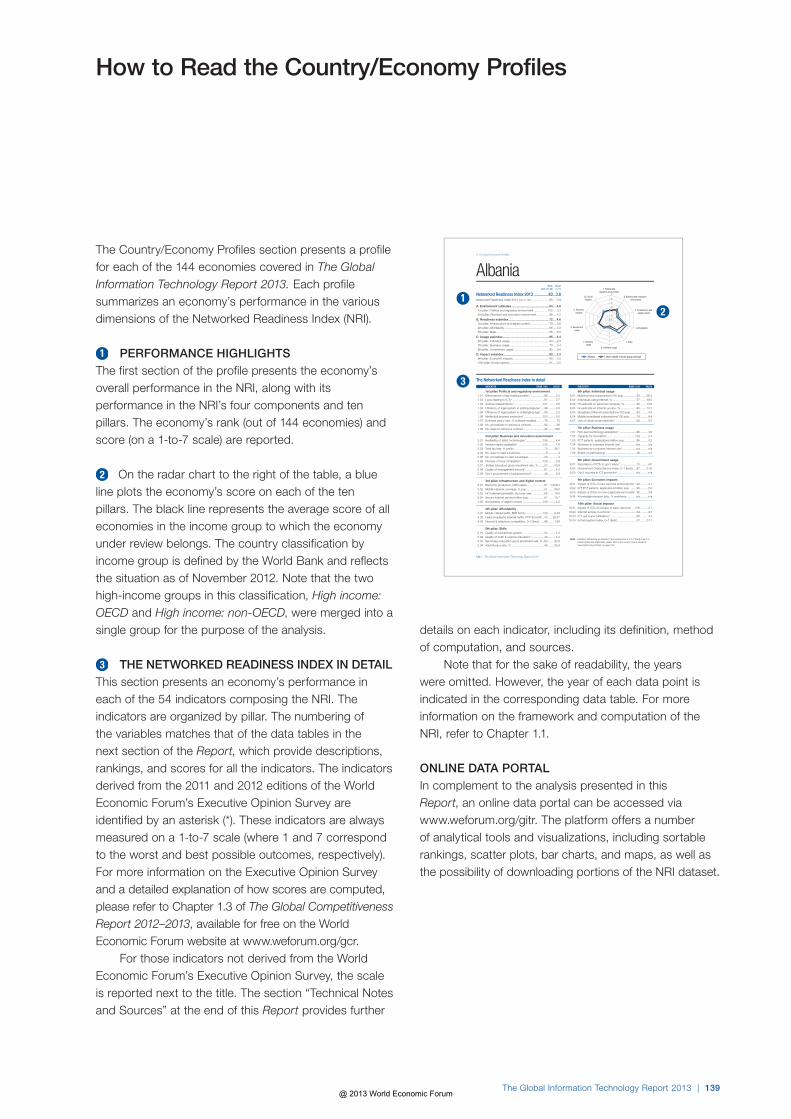
How to Read the Country/Economy Profiles
The Global Information Technology Report 2013 | 139
The Country/Economy Profiles section presents a profile for each of the 144 economies covered in The Global Information Technology Report 2013. Each profile summarizes an economy’s performance in the various dimensions of the Networked Readiness Index (NRI).
PERFORMANCE HIGHLIGHTSThe first section of the profile presents the economy’s overall performance in the NRI, along with its performance in the NRI’s four components and ten pillars. The economy’s rank (out of 144 economies) and score (on a 1-to-7 scale) are reported.
On the radar chart to the right of the table, a blue line plots the economy’s score on each of the ten pillars. The black line represents the average score of all economies in the income group to which the economy under review belongs. The country classification by income group is defined by the World Bank and reflects the situation as of November 2012. Note that the two high-income groups in this classification, High income: OECD and High income: non-OECD, were merged into a single group for the purpose of the analysis.
THE NETWORKED READINESS INDEX IN DETAILThis section presents an economy’s performance in each of the 54 indicators composing the NRI. The indicators are organized by pillar. The numbering of the variables matches that of the data tables in the next section of the Report, which provide descriptions, rankings, and scores for all the indicators. The indicators derived from the 2011 and 2012 editions of the World Economic Forum’s Executive Opinion Survey are identified by an asterisk (*). These indicators are always measured on a 1-to-7 scale (where 1 and 7 correspond to the worst and best possible outcomes, respectively). For more information on the Executive Opinion Survey and a detailed explanation of how scores are computed, please refer to Chapter 1.3 of The Global Competitiveness Report 2012–2013, available for free on the World Economic Forum website at www.weforum.org/gcr.
For those indicators not derived from the World Economic Forum’s Executive Opinion Survey, the scale is reported next to the title. The section “Technical Notes and Sources” at the end of this Report provides further
details on each indicator, including its definition, method of computation, and sources.
Note that for the sake of readability, the years were omitted. However, the year of each data point is indicated in the corresponding data table. For more information on the framework and computation of the NRI, refer to Chapter 1.1.
ONLINE DATA PORTALIn complement to the analysis presented in this Report, an online data portal can be accessed via www.weforum.org/gitr. The platform offers a number of analytical tools and visualizations, including sortable rankings, scatter plots, bar charts, and maps, as well as the possibility of downloading portions of the NRI dataset.
The Networked Readiness Index in detailINDICATOR RANK /144 VALUE
1st pillar: Political and regulatory environment 1.01 Effectiveness of law-making bodies* ..................88 ......... 3.3 1.02 Laws relating to ICTs* ........................................81 ......... 3.7 1.03 Judicial independence* ....................................121 ......... 2.6 1.04 Efficiency of legal system in settling disputes* ....98 ......... 3.3 1.05 Efficiency of legal system in challenging regs* ....93 ......... 3.3 1.06 Intellectual property protection* ........................103 ......... 3.0 1.07 Software piracy rate, % software installed ..........76 .......... 75 1.08 No. procedures to enforce a contract ................90 .......... 39 1.09 No. days to enforce a contract ..........................25 ........ 390
2nd pillar: Business and innovation environment 2.01 Availability of latest technologies* .....................106 ......... 4.4 2.02 Venture capital availability* ...............................132 ......... 1.8 2.03 Total tax rate, % profits ......................................73 ....... 38.7 2.04 No. days to start a business ................................8 ............ 4 2.05 No. procedures to start a business ....................20 ............ 4 2.06 Intensity of local competition* ...........................128 ......... 3.9 2.07 Tertiary education gross enrollment rate, % ........57 ....... 43.9 2.08 Quality of management schools* ........................61 ......... 4.3 2.09 Gov’t procurement of advanced tech* ...............46 ......... 3.9
3rd pillar: Infrastructure and digital content 3.01 Electricity production, kWh/capita ......................87 .. 1,648.4 3.02 Mobile network coverage, % pop ......................51 ....... 99.0 3.03 Int’l Internet bandwidth, kb/s per user................65 ....... 19.0 3.04 Secure Internet servers/million pop ....................87 ....... 13.7 3.05 Accessibility of digital content* .........................108 ......... 4.2
4th pillar: Affordability 4.01 Mobile cellular tariffs, PPP $/min. .....................100 ....... 0.39 4.02 Fixed broadband Internet tariffs, PPP $/month ..43 ..... 26.37 4.03 Internet & telephony competition, 0–2 (best) ......88 ....... 1.69
5th pillar: Skills 5.01 Quality of educational system* ...........................52 ......... 4.0 5.02 Quality of math & science education* .................40 ......... 4.5 5.03 Secondary education gross enrollment rate, % ..63 ....... 90.9 5.04 Adult literacy rate, % ..........................................58 ....... 95.9
INDICATOR RANK /144 VALUE
6th pillar: Individual usage 6.01 Mobile phone subscriptions/100 pop. ................90 ....... 96.4 6.02 Individuals using Internet, %...............................57 ....... 49.0 6.03 Households w/ personal computer, % ...............95 ....... 15.6 6.04 Households w/ Internet access, % ....................85 ....... 13.7 6.05 Broadband Internet subscriptions/100 pop. .......83 ......... 4.0 6.06 Mobile broadband subscriptions/100 pop. .........78 ......... 8.8 6.07 Use of virtual social networks* ...........................66 ......... 5.5
7th pillar: Business usage 7.01 Firm-level technology absorption* ......................80 ......... 4.6 7.02 Capacity for innovation* ...................................128 ......... 2.4 7.03 PCT patents, applications/million pop. ..............88 ......... 0.2 7.04 Business-to-business Internet use* ...................n/a ......... n/a 7.05 Business-to-consumer Internet use* .................n/a ......... n/a 7.06 Extent of staff training* .......................................36 ......... 4.4
8th pillar: Government usage 8.01 Importance of ICTs to gov’t vision* .....................70 ......... 4.0 8.02 Government Online Service Index, 0–1 (best) .....87 ....... 0.42 8.03 Gov’t success in ICT promotion* .......................n/a ......... n/a
9th pillar: Economic impacts 9.01 Impact of ICTs on new services and products* ..93 ......... 4.1 9.02 ICT PCT patents, applications/million pop. .......95 ......... 0.0 9.03 Impact of ICTss on new organizational models* .90 ......... 3.9 9.04 Knowledge-intensive jobs, % workforce ............n/a ......... n/a
10th pillar: Social impacts 10.01 Impact of ICTs on access to basic services* ....106 ......... 3.7 10.02 Internet access in schools* ................................54 ......... 4.5 10.03 ICT use & gov’t efficiency* .................................65 ......... 4.3 10.04 E-Participation Index, 0–1 (best).........................91 ....... 0.11
Rank Score (out of 144) (1–7)
Networked Readiness Index 2013 ..............83 ..3.8Networked Readiness Index 2012 (out of 142) ...................... 68 .....3.9
A. Environment subindex ..............................................84 ....3.81st pillar: Political and regulatory environment ................. 102 .....3.32nd pillar: Business and innovation environment ............... 66 .....4.2
B. Readiness subindex .................................................72 ....4.63rd pillar: Infrastructure and digital content ........................ 79 .....3.64th pillar: Affordability ........................................................ 66 .....5.35th pillar: Skills ................................................................... 56 .....5.0
C. Usage subindex ........................................................85 ....3.46th pillar: Individual usage .................................................. 84 .....2.97th pillar: Business usage .................................................. 79 .....3.48th pillar: Government usage ............................................. 95 .....3.8
D. Impact subindex .......................................................89 ....3.39th pillar: Economic impacts .............................................. 88 .....3.010th pillar: Social impacts .................................................. 81 .....3.5
Albania3: Country/Economy Profiles
142 | The Global Information Technology Report 2013
Note: Indicators followed by an asterisk (*) are measured on a 1-to-7 (best) scale. For further details and explanation, please refer to the section “How to Read the Country/Economy Profiles” on page 139.
Albania Lower-middle-income group average
1. Political and regulatory environment
6. Individual usage
5. Skills7. Business usage
4. Affordability8. Governmentusage
3. Infrastructure anddigital content
9. Economicimpacts
2. Business and innovation environment
10. Socialimpacts
1
2
3
4
5
6
7
@ 2013 World Economic Forum

@ 2013 World Economic Forum

Index of Country/Economy Profiles
Country/Economy Page
Albania 142
Algeria 143
Argentina 144
Armenia 145
Australia 146
Austria 147
Azerbaijan 148
Bahrain 149
Bangladesh 150
Barbados 151
Belgium 152
Benin 153
Bolivia 154
Bosnia and Herzegovina 155
Botswana 156
Brazil 157
Brunei Darussalam 158
Bulgaria 159
Burkina Faso 160
Burundi 161
Cambodia 162
Cameroon 163
Canada 164
Cape Verde 165
Chad 166
Chile 167
China 168
Colombia 169
Costa Rica 170
Côte d’Ivoire 171
Croatia 172
Cyprus 173
Czech Republic 174
Denmark 175
Dominican Republic 176
Ecuador 177
Country/Economy Page
Egypt 178
El Salvador 179
Estonia 180
Ethiopia 181
Finland 182
France 183
Gabon 184
Gambia, The 185
Georgia 186
Germany 187
Ghana 188
Greece 189
Guatemala 190
Guinea 191
Guyana 192
Haiti 193
Honduras 194
Hong Kong SAR 195
Hungary 196
Iceland 197
India 198
Indonesia 199
Iran, Islamic Rep. 200
Ireland 201
Israel 202
Italy 203
Jamaica 204
Japan 205
Jordan 206
Kazakhstan 207
Kenya 208
Korea, Rep. 209
Kuwait 210
Kyrgyz Republic 211
Latvia 212
Lebanon 213
Country/Economy Page
Lesotho 214
Liberia 215
Libya 216
Lithuania 217
Luxembourg 218
Macedonia, FYR 219
Madagascar 220
Malawi 221
Malaysia 222
Mali 223
Malta 224
Mauritania 225
Mauritius 226
Mexico 227
Moldova 228
Mongolia 229
Montenegro 230
Morocco 231
Mozambique 232
Namibia 233
Nepal 234
Netherlands 235
New Zealand 236
Nicaragua 237
Nigeria 238
Norway 239
Oman 240
Pakistan 241
Panama 242
Paraguay 243
Peru 244
Philippines 245
Poland 246
Portugal 247
Puerto Rico 248
Qatar 249
Country/Economy Page
Romania 250
Russian Federation 251
Rwanda 252
Saudi Arabia 253
Senegal 254
Serbia 255
Seychelles 256
Sierra Leone 257
Singapore 258
Slovak Republic 259
Slovenia 260
South Africa 261
Spain 262
Sri Lanka 263
Suriname 264
Swaziland 265
Sweden 266
Switzerland 267
Taiwan, China 268
Tajikistan 269
Tanzania 270
Thailand 271
Timor-Leste 272
Trinidad and Tobago 273
Turkey 274
Uganda 275
Ukraine 276
United Arab Emirates 277
United Kingdom 278
United States 279
Uruguay 280
Venezuela 281
Vietnam 282
Yemen 283
Zambia 284
Zimbabwe 285
@ 2013 World Economic Forum

The Networked Readiness Index in detailINDICATOR RANK /144 VALUE
1st pillar: Political and regulatory environment1.01 Effectiveness of law-making bodies* ..................88 ......... 3.31.02 Laws relating to ICTs* ........................................81 ......... 3.71.03 Judicial independence* ....................................121 ......... 2.61.04 Efficiency of legal system in settling disputes* ....98 ......... 3.31.05 Efficiency of legal system in challenging regs* ....93 ......... 3.31.06 Intellectual property protection* ........................103 ......... 3.01.07 Software piracy rate, % software installed ..........76 .......... 751.08 No. procedures to enforce a contract ................90 .......... 391.09 No. days to enforce a contract ..........................25 ........ 390
2nd pillar: Business and innovation environment2.01 Availability of latest technologies* .....................106 ......... 4.42.02 Venture capital availability* ...............................132 ......... 1.82.03 Total tax rate, % profits ......................................73 ....... 38.72.04 No. days to start a business ................................8 ............ 42.05 No. procedures to start a business ....................20 ............ 42.06 Intensity of local competition* ...........................128 ......... 3.92.07 Tertiary education gross enrollment rate, % ........57 ....... 43.92.08 Quality of management schools* ........................61 ......... 4.32.09 Gov’t procurement of advanced tech* ...............46 ......... 3.9
3rd pillar: Infrastructure and digital content3.01 Electricity production, kWh/capita ......................87 .. 1,648.43.02 Mobile network coverage, % pop ......................51 ....... 99.03.03 Int’l Internet bandwidth, kb/s per user................65 ....... 19.03.04 Secure Internet servers/million pop ....................87 ....... 13.73.05 Accessibility of digital content* .........................108 ......... 4.2
4th pillar: Affordability4.01 Mobile cellular tariffs, PPP $/min. .....................100 ....... 0.394.02 Fixed broadband Internet tariffs, PPP $/month ..43 ..... 26.374.03 Internet & telephony competition, 0–2 (best) ......88 ....... 1.69
5th pillar: Skills5.01 Quality of educational system* ...........................52 ......... 4.05.02 Quality of math & science education* .................40 ......... 4.55.03 Secondary education gross enrollment rate, % ..63 ....... 90.95.04 Adult literacy rate, % ..........................................58 ....... 95.9
INDICATOR RANK /144 VALUE
6th pillar: Individual usage 6.01 Mobile phone subscriptions/100 pop. ................90 ....... 96.4 6.02 Individuals using Internet, %...............................57 ....... 49.0 6.03 Households w/ personal computer, % ...............95 ....... 15.6 6.04 Households w/ Internet access, % ....................85 ....... 13.7 6.05 Broadband Internet subscriptions/100 pop. .......83 ......... 4.0 6.06 Mobile broadband subscriptions/100 pop. .........78 ......... 8.8 6.07 Use of virtual social networks* ...........................66 ......... 5.5
7th pillar: Business usage 7.01 Firm-level technology absorption* ......................80 ......... 4.6 7.02 Capacity for innovation* ...................................128 ......... 2.4 7.03 PCT patents, applications/million pop. ..............88 ......... 0.2 7.04 Business-to-business Internet use* ...................n/a ......... n/a 7.05 Business-to-consumer Internet use* .................n/a ......... n/a 7.06 Extent of staff training* .......................................36 ......... 4.4
8th pillar: Government usage 8.01 Importance of ICTs to gov’t vision* .....................70 ......... 4.0 8.02 Government Online Service Index, 0–1 (best) .....87 ....... 0.42 8.03 Gov’t success in ICT promotion* .......................n/a ......... n/a
9th pillar: Economic impacts 9.01 Impact of ICTs on new services and products* ..93 ......... 4.1 9.02 ICT PCT patents, applications/million pop. .......95 ......... 0.0 9.03 Impact of ICTs on new organizational models* ...90 ......... 3.9 9.04 Knowledge-intensive jobs, % workforce ............n/a ......... n/a
10th pillar: Social impacts 10.01 Impact of ICTs on access to basic services* ....106 ......... 3.7 10.02 Internet access in schools* ................................54 ......... 4.5 10.03 ICT use & gov’t efficiency* .................................65 ......... 4.3 10.04 E-Participation Index, 0–1 (best).........................91 ....... 0.11
Rank Score (out of 144) (1–7)
Networked Readiness Index 2013 ..............83 ..3.8Networked Readiness Index 2012 (out of 142) ...................... 68 .....3.9
A. Environment subindex ..............................................84 ....3.81st pillar: Political and regulatory environment ................. 102 .....3.32nd pillar: Business and innovation environment ............... 66 .....4.2
B. Readiness subindex .................................................72 ....4.63rd pillar: Infrastructure and digital content ........................ 79 .....3.64th pillar: Affordability ........................................................ 66 .....5.35th pillar: Skills ................................................................... 56 .....5.0
C. Usage subindex ........................................................85 ....3.46th pillar: Individual usage .................................................. 84 .....2.97th pillar: Business usage .................................................. 79 .....3.48th pillar: Government usage ............................................. 95 .....3.8
D. Impact subindex .......................................................89 ....3.39th pillar: Economic impacts .............................................. 88 .....3.010th pillar: Social impacts .................................................. 81 .....3.5
Albania3: Country/Economy Profiles
142 | The Global Information Technology Report 2013
Note: Indicators followed by an asterisk (*) are measured on a 1-to-7 (best) scale. For further details and explanation, please refer to the section “How to Read the Country/Economy Profiles” on page 139.
Albania Lower-middle-income group average
1. Political and regulatory environment
6. Individual usage
5. Skills7. Business usage
4. Affordability8. Governmentusage
3. Infrastructure anddigital content
9. Economicimpacts
2. Business and innovation environment
10. Socialimpacts
1
2
3
4
5
6
7
@ 2013 World Economic Forum

The Networked Readiness Index in detailINDICATOR RANK /144 VALUE
1st pillar: Political and regulatory environment1.01 Effectiveness of law-making bodies* ................130 ......... 2.41.02 Laws relating to ICTs* ......................................140 ......... 2.31.03 Judicial independence* ....................................123 ......... 2.51.04 Efficiency of legal system in settling disputes* ..132 ......... 2.61.05 Efficiency of legal system in challenging regs* ..137 ......... 2.51.06 Intellectual property protection* ........................142 ......... 1.81.07 Software piracy rate, % software installed ..........94 .......... 841.08 No. procedures to enforce a contract ..............129 .......... 451.09 No. days to enforce a contract ..........................98 ........ 630
2nd pillar: Business and innovation environment2.01 Availability of latest technologies* .....................142 ......... 3.42.02 Venture capital availability* ...............................138 ......... 1.82.03 Total tax rate, % profits ....................................137 ....... 72.02.04 No. days to start a business ..............................97 .......... 252.05 No. procedures to start a business ..................137 .......... 142.06 Intensity of local competition* ...........................144 ......... 3.12.07 Tertiary education gross enrollment rate, % ........76 ....... 32.12.08 Quality of management schools* ......................131 ......... 3.02.09 Gov’t procurement of advanced tech* .............142 ......... 2.2
3rd pillar: Infrastructure and digital content3.01 Electricity production, kWh/capita ......................92 .. 1,223.73.02 Mobile network coverage, % pop ....................116 ....... 81.53.03 Int’l Internet bandwidth, kb/s per user................88 ......... 8.93.04 Secure Internet servers/million pop ..................128 ......... 0.93.05 Accessibility of digital content* .........................137 ......... 3.3
4th pillar: Affordability4.01 Mobile cellular tariffs, PPP $/min. .......................49 ....... 0.204.02 Fixed broadband Internet tariffs, PPP $/month ..61 ..... 30.234.03 Internet & telephony competition, 0–2 (best) ....107 ....... 1.31
5th pillar: Skills5.01 Quality of educational system* .........................131 ......... 2.55.02 Quality of math & science education* ...............129 ......... 2.75.03 Secondary education gross enrollment rate, % ..54 ....... 94.95.04 Adult literacy rate, % ........................................112 ....... 72.6
INDICATOR RANK /144 VALUE
6th pillar: Individual usage 6.01 Mobile phone subscriptions/100 pop. ................86 ....... 99.0 6.02 Individuals using Internet, %.............................110 ....... 14.0 6.03 Households w/ personal computer, % ...............87 ....... 20.0 6.04 Households w/ Internet access, % ....................92 ....... 10.0 6.05 Broadband Internet subscriptions/100 pop. .......88 ......... 2.8 6.06 Mobile broadband subscriptions/100 pop. .......126 ......... 0.0 6.07 Use of virtual social networks* ...........................88 ......... 5.2
7th pillar: Business usage 7.01 Firm-level technology absorption* ....................144 ......... 3.2 7.02 Capacity for innovation* ...................................143 ......... 1.9 7.03 PCT patents, applications/million pop. ..............98 ......... 0.1 7.04 Business-to-business Internet use* ..................139 ......... 2.7 7.05 Business-to-consumer Internet use* ................139 ......... 2.4 7.06 Extent of staff training* .....................................142 ......... 2.6
8th pillar: Government usage 8.01 Importance of ICTs to gov’t vision* ...................140 ......... 2.6 8.02 Government Online Service Index, 0–1 (best) ...120 ....... 0.25 8.03 Gov’t success in ICT promotion* ......................137 ......... 2.8
9th pillar: Economic impacts 9.01 Impact of ICTs on new services and products* 144 ......... 2.4 9.02 ICT PCT patents, applications/million pop. .......82 ......... 0.0 9.03 Impact of ICTs on new organizational models* .144 ......... 2.1 9.04 Knowledge-intensive jobs, % workforce .............76 ....... 19.1
10th pillar: Social impacts 10.01 Impact of ICTs on access to basic services* ....142 ......... 2.6 10.02 Internet access in schools* ..............................132 ......... 2.4 10.03 ICT use & gov’t efficiency* ...............................144 ......... 2.3 10.04 E-Participation Index, 0–1 (best).......................106 ....... 0.05
Rank Score (out of 144) (1–7)
Networked Readiness Index 2013 ............131 ..2.8Networked Readiness Index 2012 (out of 142) .................... 118 .....3.0
A. Environment subindex ............................................143 ....2.61st pillar: Political and regulatory environment ................. 141 .....2.52nd pillar: Business and innovation environment ............. 143 .....2.7
B. Readiness subindex .................................................96 ....4.03rd pillar: Infrastructure and digital content ...................... 119 .....2.64th pillar: Affordability ........................................................ 64 .....5.35th pillar: Skills ................................................................. 101 .....4.0
C. Usage subindex ......................................................140 ....2.46th pillar: Individual usage ................................................ 100 .....2.57th pillar: Business usage ................................................ 144 .....2.18th pillar: Government usage ........................................... 139 .....2.7
D. Impact subindex .....................................................142 ....2.19th pillar: Economic impacts ............................................ 143 .....2.110th pillar: Social impacts ................................................ 141 .....2.1
Algeria3: Country/Economy Profiles
The Global Information Technology Report 2013 | 143
Note: Indicators followed by an asterisk (*) are measured on a 1-to-7 (best) scale. For further details and explanation, please refer to the section “How to Read the Country/Economy Profiles” on page 139.
Algeria Upper-middle-income group average
1. Political and regulatory environment
6. Individual usage
5. Skills7. Business usage
4. Affordability8. Governmentusage
3. Infrastructure anddigital content
9. Economicimpacts
2. Business and innovation environment
10. Socialimpacts
1
2
3
4
5
6
7
@ 2013 World Economic Forum

The Networked Readiness Index in detailINDICATOR RANK /144 VALUE
1st pillar: Political and regulatory environment1.01 Effectiveness of law-making bodies* ................141 ......... 2.01.02 Laws relating to ICTs* ......................................117 ......... 3.21.03 Judicial independence* ....................................133 ......... 2.31.04 Efficiency of legal system in settling disputes* ..129 ......... 2.71.05 Efficiency of legal system in challenging regs* ..142 ......... 2.11.06 Intellectual property protection* ........................134 ......... 2.41.07 Software piracy rate, % software installed ..........69 .......... 691.08 No. procedures to enforce a contract ................56 .......... 361.09 No. days to enforce a contract ..........................87 ........ 590
2nd pillar: Business and innovation environment2.01 Availability of latest technologies* .....................109 ......... 4.3
2.02 Venture capital availability* ...............................135 ......... 1.8 2.03 Total tax rate, % profits ....................................142 ..... 108.3 2.04 No. days to start a business ..............................99 .......... 26 2.05 No. procedures to start a business ..................137 .......... 14 2.06 Intensity of local competition* ...........................117 ......... 4.1 2.07 Tertiary education gross enrollment rate, % ........21 ....... 71.2 2.08 Quality of management schools* ........................34 ......... 4.9 2.09 Gov’t procurement of advanced tech* .............131 ......... 2.6
3rd pillar: Infrastructure and digital content 3.01 Electricity production, kWh/capita ......................64 .. 3,041.8 3.02 Mobile network coverage, % pop ......................96 ....... 94.1 3.03 Int’l Internet bandwidth, kb/s per user................52 ....... 25.7 3.04 Secure Internet servers/million pop ....................64 ....... 33.6 3.05 Accessibility of digital content* ...........................86 ......... 4.8
4th pillar: Affordability 4.01 Mobile cellular tariffs, PPP $/min. .....................137 ....... 0.86 4.02 Fixed broadband Internet tariffs, PPP $/month ..87 ..... 37.30 4.03 Internet & telephony competition, 0–2 (best) ........1 ....... 2.00
5th pillar: Skills 5.01 Quality of educational system* ...........................89 ......... 3.4 5.02 Quality of math & science education* ...............115 ......... 3.1 5.03 Secondary education gross enrollment rate, % ..76 ....... 88.5 5.04 Adult literacy rate, % ..........................................50 ....... 97.8
INDICATOR RANK /144 VALUE
6th pillar: Individual usage 6.01 Mobile phone subscriptions/100 pop. ................26 ..... 134.9 6.02 Individuals using Internet, %...............................60 ....... 47.7 6.03 Households w/ personal computer, % ...............59 ....... 47.0 6.04 Households w/ Internet access, % ....................66 ....... 34.0 6.05 Broadband Internet subscriptions/100 pop. .......54 ....... 10.5 6.06 Mobile broadband subscriptions/100 pop. .........72 ....... 11.7 6.07 Use of virtual social networks* ...........................48 ......... 5.8
7th pillar: Business usage 7.01 Firm-level technology absorption* ....................106 ......... 4.3 7.02 Capacity for innovation* .....................................95 ......... 2.9 7.03 PCT patents, applications/million pop. ..............66 ......... 1.2 7.04 Business-to-business Internet use* ....................84 ......... 4.8 7.05 Business-to-consumer Internet use* ..................65 ......... 4.6 7.06 Extent of staff training* .......................................78 ......... 3.8
8th pillar: Government usage 8.01 Importance of ICTs to gov’t vision* ...................139 ......... 2.6 8.02 Government Online Service Index, 0–1 (best) .....59 ....... 0.53 8.03 Gov’t success in ICT promotion* ......................128 ......... 3.2
9th pillar: Economic impacts 9.01 Impact of ICTs on new services and products* ..94 ......... 4.1 9.02 ICT PCT patents, applications/million pop. .......61 ......... 0.3 9.03 Impact of ICTs on new organizational models* ...78 ......... 4.1 9.04 Knowledge-intensive jobs, % workforce .............82 ....... 17.7
10th pillar: Social impacts 10.01 Impact of ICTs on access to basic services* ....111 ......... 3.6 10.02 Internet access in schools* ................................87 ......... 3.7 10.03 ICT use & gov’t efficiency* ...............................126 ......... 3.2 10.04 E-Participation Index, 0–1 (best).........................51 ....... 0.29
Rank Score (out of 144) (1–7)
Networked Readiness Index 2013 ..............99 ..3.5Networked Readiness Index 2012 (out of 142) ...................... 92 .....3.5
A. Environment subindex ............................................126 ....3.21st pillar: Political and regulatory environment ................. 131 .....2.82nd pillar: Business and innovation environment ............. 110 .....3.7
B. Readiness subindex .................................................97 ....4.03rd pillar: Infrastructure and digital content ........................ 70 .....4.04th pillar: Affordability ...................................................... 114 .....3.35th pillar: Skills ................................................................... 80 .....4.7
C. Usage subindex ........................................................74 ....3.56th pillar: Individual usage .................................................. 60 .....3.97th pillar: Business usage .................................................. 90 .....3.38th pillar: Government usage ........................................... 117 .....3.3
D. Impact subindex .......................................................94 ....3.19th pillar: Economic impacts .............................................. 91 .....3.010th pillar: Social impacts .................................................. 96 .....3.3
Argentina3: Country/Economy Profiles
144 | The Global Information Technology Report 2013
Note: Indicators followed by an asterisk (*) are measured on a 1-to-7 (best) scale. For further details and explanation, please refer to the section “How to Read the Country/Economy Profiles” on page 139.
Argentina Upper-middle-income group average
1. Political and regulatory environment
6. Individual usage
5. Skills7. Business usage
4. Affordability8. Governmentusage
3. Infrastructure anddigital content
9. Economicimpacts
2. Business and innovation environment
10. Socialimpacts
1
2
3
4
5
6
7
@ 2013 World Economic Forum

The Networked Readiness Index in detailINDICATOR RANK /144 VALUE
1st pillar: Political and regulatory environment1.01 Effectiveness of law-making bodies* ..................79 ......... 3.41.02 Laws relating to ICTs* ........................................50 ......... 4.31.03 Judicial independence* ....................................110 ......... 2.81.04 Efficiency of legal system in settling disputes* ....75 ......... 3.61.05 Efficiency of legal system in challenging regs* ....79 ......... 3.51.06 Intellectual property protection* ..........................80 ......... 3.41.07 Software piracy rate, % software installed ........100 .......... 881.08 No. procedures to enforce a contract ..............137 .......... 491.09 No. days to enforce a contract ..........................49 ........ 440
2nd pillar: Business and innovation environment2.01 Availability of latest technologies* .....................101 ......... 4.52.02 Venture capital availability* .................................89 ......... 2.42.03 Total tax rate, % profits ......................................75 ....... 38.82.04 No. days to start a business ..............................34 ............ 82.05 No. procedures to start a business ....................10 ............ 32.06 Intensity of local competition* ...........................130 ......... 3.82.07 Tertiary education gross enrollment rate, % ........52 ....... 48.92.08 Quality of management schools* ......................127 ......... 3.22.09 Gov’t procurement of advanced tech* .............108 ......... 3.1
3rd pillar: Infrastructure and digital content3.01 Electricity production, kWh/capita ......................85 .. 1,838.33.02 Mobile network coverage, % pop ......................72 ....... 98.93.03 Int’l Internet bandwidth, kb/s per user................58 ....... 22.23.04 Secure Internet servers/million pop ....................67 ....... 27.73.05 Accessibility of digital content* ...........................75 ......... 4.9
4th pillar: Affordability 4.01 Mobile cellular tariffs, PPP $/min. .......................35 ....... 0.174.02 Fixed broadband Internet tariffs, PPP $/month ..85 ..... 36.934.03 Internet & telephony competition, 0–2 (best) ....115 ....... 1.21
5th pillar: Skills5.01 Quality of educational system* ...........................79 ......... 3.5
5.02 Quality of math & science education* .................71 ......... 4.0 5.03 Secondary education gross enrollment rate, % ..74 ....... 88.75.04 Adult literacy rate, % ..........................................11 ....... 99.6
INDICATOR RANK /144 VALUE
6th pillar: Individual usage 6.01 Mobile phone subscriptions/100 pop. ................78 ..... 103.6 6.02 Individuals using Internet, %...............................83 ....... 32.0 6.03 Households w/ personal computer, % ...............87 ....... 20.0 6.04 Households w/ Internet access, % ....................86 ....... 13.6 6.05 Broadband Internet subscriptions/100 pop. .......76 ......... 5.0 6.06 Mobile broadband subscriptions/100 pop. .........45 ....... 25.9 6.07 Use of virtual social networks* ...........................68 ......... 5.4
7th pillar: Business usage 7.01 Firm-level technology absorption* ......................96 ......... 4.4 7.02 Capacity for innovation* .....................................62 ......... 3.2 7.03 PCT patents, applications/million pop. ..............57 ......... 1.7 7.04 Business-to-business Internet use* ....................54 ......... 5.2 7.05 Business-to-consumer Internet use* ..................82 ......... 4.4 7.06 Extent of staff training* .......................................98 ......... 3.6
8th pillar: Government usage 8.01 Importance of ICTs to gov’t vision* .....................56 ......... 4.2 8.02 Government Online Service Index, 0–1 (best) ...106 ....... 0.33 8.03 Gov’t success in ICT promotion* ........................52 ......... 4.7
9th pillar: Economic impacts 9.01 Impact of ICTs on new services and products* ..70 ......... 4.4 9.02 ICT PCT patents, applications/million pop. .......51 ......... 0.4 9.03 Impact of ICTs on new organizational models* ...66 ......... 4.2 9.04 Knowledge-intensive jobs, % workforce .............56 ....... 24.1
10th pillar: Social impacts 10.01 Impact of ICTs on access to basic services* ......77 ......... 4.1 10.02 Internet access in schools* ................................78 ......... 3.9 10.03 ICT use & gov’t efficiency* .................................49 ......... 4.5 10.04 E-Participation Index, 0–1 (best).......................124 ....... 0.00
Rank Score (out of 144) (1–7)
Networked Readiness Index 2013 ..............82 ..3.8Networked Readiness Index 2012 (out of 142) ...................... 94 .....3.5
A. Environment subindex ..............................................90 ....3.71st pillar: Political and regulatory environment ................. 104 .....3.32nd pillar: Business and innovation environment ............... 72 .....4.1
B. Readiness subindex .................................................73 ....4.63rd pillar: Infrastructure and digital content ........................ 72 .....3.94th pillar: Affordability ........................................................ 77 .....5.05th pillar: Skills ................................................................... 59 .....4.9
C. Usage subindex ........................................................79 ....3.46th pillar: Individual usage .................................................. 77 .....3.17th pillar: Business usage .................................................. 89 .....3.38th pillar: Government usage ............................................. 78 .....3.9
D. Impact subindex .......................................................83 ....3.39th pillar: Economic impacts .............................................. 69 .....3.310th pillar: Social impacts .................................................. 90 .....3.4
Armenia3: Country/Economy Profiles
The Global Information Technology Report 2013 | 145
Note: Indicators followed by an asterisk (*) are measured on a 1-to-7 (best) scale. For further details and explanation, please refer to the section “How to Read the Country/Economy Profiles” on page 139.
Armenia Lower-middle-income group average
1. Political and regulatory environment
6. Individual usage
5. Skills7. Business usage
4. Affordability8. Governmentusage
3. Infrastructure anddigital content
9. Economicimpacts
2. Business and innovation environment
10. Socialimpacts
1
2
3
4
5
6
7
@ 2013 World Economic Forum

The Networked Readiness Index in detailINDICATOR RANK /144 VALUE
1st pillar: Political and regulatory environment1.01 Effectiveness of law-making bodies* ..................18 ......... 4.91.02 Laws relating to ICTs* ........................................17 ......... 5.31.03 Judicial independence* ......................................14 ......... 6.01.04 Efficiency of legal system in settling disputes* ....18 ......... 5.01.05 Efficiency of legal system in challenging regs* ....19 ......... 4.71.06 Intellectual property protection* ..........................19 ......... 5.31.07 Software piracy rate, % software installed ............5 .......... 231.08 No. procedures to enforce a contract ................12 .......... 281.09 No. days to enforce a contract ..........................29 ........ 395
2nd pillar: Business and innovation environment2.01 Availability of latest technologies* .......................19 ......... 6.22.02 Venture capital availability* .................................28 ......... 3.32.03 Total tax rate, % profits ....................................107 ....... 47.52.04 No. days to start a business ................................2 ............ 22.05 No. procedures to start a business ......................3 ............ 22.06 Intensity of local competition* ...............................6 ......... 5.92.07 Tertiary education gross enrollment rate, % ........10 ....... 79.92.08 Quality of management schools* ........................16 ......... 5.32.09 Gov’t procurement of advanced tech* ...............58 ......... 3.7
3rd pillar: Infrastructure and digital content3.01 Electricity production, kWh/capita ......................10 11,488.73.02 Mobile network coverage, % pop ......................51 ....... 99.03.03 Int’l Internet bandwidth, kb/s per user................32 ....... 50.43.04 Secure Internet servers/million pop ......................6 .. 2,002.63.05 Accessibility of digital content* ...........................20 ......... 6.1
4th pillar: Affordability4.01 Mobile cellular tariffs, PPP $/min. .....................121 ....... 0.544.02 Fixed broadband Internet tariffs, PPP $/month ..94 ..... 40.244.03 Internet & telephony competition, 0–2 (best) ......63 ....... 1.91
5th pillar: Skills5.01 Quality of educational system* ...........................15 ......... 5.05.02 Quality of math & science education* .................24 ......... 4.95.03 Secondary education gross enrollment rate, % ....1 ..... 131.35.04 Adult literacy rate, % ..........................................15 ....... 99.0
INDICATOR RANK /144 VALUE
6th pillar: Individual usage 6.01 Mobile phone subscriptions/100 pop. ................67 ..... 108.3 6.02 Individuals using Internet, %...............................18 ....... 79.0 6.03 Households w/ personal computer, % ...............18 ....... 82.6 6.04 Households w/ Internet access, % ....................17 ....... 78.9 6.05 Broadband Internet subscriptions/100 pop. .......25 ....... 24.3 6.06 Mobile broadband subscriptions/100 pop. .........10 ....... 73.0 6.07 Use of virtual social networks* ...........................17 ......... 6.2
7th pillar: Business usage 7.01 Firm-level technology absorption* ......................15 ......... 5.9 7.02 Capacity for innovation* .....................................32 ......... 3.9 7.03 PCT patents, applications/million pop. ..............20 ....... 77.5 7.04 Business-to-business Internet use* ....................31 ......... 5.6 7.05 Business-to-consumer Internet use* ....................9 ......... 5.8 7.06 Extent of staff training* .......................................28 ......... 4.6
8th pillar: Government usage 8.01 Importance of ICTs to gov’t vision* .....................26 ......... 4.7 8.02 Government Online Service Index, 0–1 (best) .......9 ....... 0.86 8.03 Gov’t success in ICT promotion* ........................39 ......... 4.8
9th pillar: Economic impacts 9.01 Impact of ICTs on new services and products* ..28 ......... 5.1 9.02 ICT PCT patents, applications/million pop. .......19 ....... 20.7 9.03 Impact of ICTs on new organizational models* ...28 ......... 4.9 9.04 Knowledge-intensive jobs, % workforce .............12 ....... 42.9
10th pillar: Social impacts 10.01 Impact of ICTs on access to basic services* ......23 ......... 5.4 10.02 Internet access in schools* ................................12 ......... 6.1 10.03 ICT use & gov’t efficiency* .................................46 ......... 4.6 10.04 E-Participation Index, 0–1 (best)...........................8 ....... 0.76
Rank Score (out of 144) (1–7)
Networked Readiness Index 2013 ..............18 ..5.3Networked Readiness Index 2012 (out of 142) ...................... 17 .....5.3
A. Environment subindex ..............................................11 ....5.31st pillar: Political and regulatory environment ................... 10 .....5.42nd pillar: Business and innovation environment ............... 21 .....5.2
B. Readiness subindex .................................................25 ....5.53rd pillar: Infrastructure and digital content .......................... 6 .....6.84th pillar: Affordability ........................................................ 97 .....4.15th pillar: Skills ................................................................... 17 .....5.6
C. Usage subindex ........................................................18 ....5.26th pillar: Individual usage .................................................. 15 .....5.97th pillar: Business usage .................................................. 25 .....4.58th pillar: Government usage ............................................. 19 .....5.3
D. Impact subindex .......................................................18 ....5.09th pillar: Economic impacts .............................................. 20 .....4.610th pillar: Social impacts .................................................. 15 .....5.4
Australia3: Country/Economy Profiles
146 | The Global Information Technology Report 2013
Note: Indicators followed by an asterisk (*) are measured on a 1-to-7 (best) scale. For further details and explanation, please refer to the section “How to Read the Country/Economy Profiles” on page 139.
Australia High-income group average
1. Political and regulatory environment
6. Individual usage
5. Skills7. Business usage
4. Affordability8. Governmentusage
3. Infrastructure anddigital content
9. Economicimpacts
2. Business and innovation environment
10. Socialimpacts
1
2
3
4
5
6
7
@ 2013 World Economic Forum

The Networked Readiness Index in detailINDICATOR RANK /144 VALUE
1st pillar: Political and regulatory environment1.01 Effectiveness of law-making bodies* ..................37 ......... 4.21.02 Laws relating to ICTs* ........................................21 ......... 5.21.03 Judicial independence* ......................................30 ......... 5.21.04 Efficiency of legal system in settling disputes* ....25 ......... 4.81.05 Efficiency of legal system in challenging regs* ....22 ......... 4.61.06 Intellectual property protection* ..........................16 ......... 5.51.07 Software piracy rate, % software installed ............5 .......... 231.08 No. procedures to enforce a contract ..................4 .......... 251.09 No. days to enforce a contract ..........................31 ........ 397
2nd pillar: Business and innovation environment2.01 Availability of latest technologies* .......................13 ......... 6.32.02 Venture capital availability* .................................39 ......... 3.02.03 Total tax rate, % profits ....................................120 ....... 53.12.04 No. days to start a business ..............................97 .......... 252.05 No. procedures to start a business ....................88 ............ 82.06 Intensity of local competition* ...............................7 ......... 5.82.07 Tertiary education gross enrollment rate, % ........23 ....... 68.22.08 Quality of management schools* ........................37 ......... 4.82.09 Gov’t procurement of advanced tech* ...............50 ......... 3.8
3rd pillar: Infrastructure and digital content3.01 Electricity production, kWh/capita ......................25 .. 7,987.83.02 Mobile network coverage, % pop ......................51 ....... 99.03.03 Int’l Internet bandwidth, kb/s per user................19 ....... 81.93.04 Secure Internet servers/million pop ....................20 ..... 993.23.05 Accessibility of digital content* .............................9 ......... 6.3
4th pillar: Affordability4.01 Mobile cellular tariffs, PPP $/min. .......................15 ....... 0.084.02 Fixed broadband Internet tariffs, PPP $/month ..78 ..... 35.334.03 Internet & telephony competition, 0–2 (best) ........1 ....... 2.00
5th pillar: Skills5.01 Quality of educational system* ...........................26 ......... 4.7
5.02 Quality of math & science education* .................43 ......... 4.4 5.03 Secondary education gross enrollment rate, % ..40 ....... 98.95.04 Adult literacy rate, % ..........................................15 ....... 99.0
INDICATOR RANK /144 VALUE
6th pillar: Individual usage 6.01 Mobile phone subscriptions/100 pop. ................13 ..... 154.8 6.02 Individuals using Internet, %...............................15 ....... 79.8 6.03 Households w/ personal computer, % ...............25 ....... 78.1 6.04 Households w/ Internet access, % ....................24 ....... 75.4 6.05 Broadband Internet subscriptions/100 pop. .......21 ....... 25.4 6.06 Mobile broadband subscriptions/100 pop. .........23 ....... 42.6 6.07 Use of virtual social networks* ...........................20 ......... 6.2
7th pillar: Business usage 7.01 Firm-level technology absorption* ......................13 ......... 5.9 7.02 Capacity for innovation* .......................................9 ......... 5.0 7.03 PCT patents, applications/million pop. ..............10 ..... 154.7 7.04 Business-to-business Internet use* ......................3 ......... 6.2 7.05 Business-to-consumer Internet use* ..................16 ......... 5.6 7.06 Extent of staff training* .......................................12 ......... 5.0
8th pillar: Government usage 8.01 Importance of ICTs to gov’t vision* .....................77 ......... 3.9 8.02 Government Online Service Index, 0–1 (best) .....26 ....... 0.75 8.03 Gov’t success in ICT promotion* ........................58 ......... 4.6
9th pillar: Economic impacts 9.01 Impact of ICTs on new services and products* ..33 ......... 5.0 9.02 ICT PCT patents, applications/million pop. .......14 ....... 30.3 9.03 Impact of ICTs on new organizational models* ...49 ......... 4.5 9.04 Knowledge-intensive jobs, % workforce .............27 ....... 36.7
10th pillar: Social impacts 10.01 Impact of ICTs on access to basic services* ......18 ......... 5.6 10.02 Internet access in schools* ................................25 ......... 5.7 10.03 ICT use & gov’t efficiency* .................................14 ......... 5.3 10.04 E-Participation Index, 0–1 (best).........................41 ....... 0.37
Rank Score (out of 144) (1–7)
Networked Readiness Index 2013 ..............19 ..5.2Networked Readiness Index 2012 (out of 142) ...................... 19 .....5.3
A. Environment subindex ..............................................22 ....5.01st pillar: Political and regulatory environment ................... 17 .....5.22nd pillar: Business and innovation environment ............... 31 .....4.8
B. Readiness subindex ...................................................9 ....6.03rd pillar: Infrastructure and digital content .......................... 9 .....6.64th pillar: Affordability ........................................................ 37 .....5.95th pillar: Skills ................................................................... 24 .....5.6
C. Usage subindex ........................................................17 ....5.26th pillar: Individual usage .................................................. 19 .....5.77th pillar: Business usage .................................................... 9 .....5.48th pillar: Government usage ............................................. 35 .....4.6
D. Impact subindex .......................................................24 ....4.89th pillar: Economic impacts .............................................. 22 .....4.610th pillar: Social impacts .................................................. 29 .....5.0
Austria3: Country/Economy Profiles
The Global Information Technology Report 2013 | 147
Note: Indicators followed by an asterisk (*) are measured on a 1-to-7 (best) scale. For further details and explanation, please refer to the section “How to Read the Country/Economy Profiles” on page 139.
Austria High-income group average
1. Political and regulatory environment
6. Individual usage
5. Skills7. Business usage
4. Affordability8. Governmentusage
3. Infrastructure anddigital content
9. Economicimpacts
2. Business and innovation environment
10. Socialimpacts
1
2
3
4
5
6
7
@ 2013 World Economic Forum

The Networked Readiness Index in detailINDICATOR RANK /144 VALUE
1st pillar: Political and regulatory environment1.01 Effectiveness of law-making bodies* ..................59 ......... 3.81.02 Laws relating to ICTs* ........................................46 ......... 4.41.03 Judicial independence* ......................................86 ......... 3.41.04 Efficiency of legal system in settling disputes* ....76 ......... 3.61.05 Efficiency of legal system in challenging regs* ....58 ......... 3.91.06 Intellectual property protection* ..........................53 ......... 3.91.07 Software piracy rate, % software installed ..........99 .......... 871.08 No. procedures to enforce a contract ................90 .......... 391.09 No. days to enforce a contract ............................5 ........ 237
2nd pillar: Business and innovation environment2.01 Availability of latest technologies* .......................81 ......... 4.82.02 Venture capital availability* .................................59 ......... 2.82.03 Total tax rate, % profits ......................................77 ....... 40.02.04 No. days to start a business ..............................34 ............ 82.05 No. procedures to start a business ....................48 ............ 62.06 Intensity of local competition* ...........................131 ......... 3.82.07 Tertiary education gross enrollment rate, % ........92 ....... 19.32.08 Quality of management schools* ......................123 ......... 3.32.09 Gov’t procurement of advanced tech* ...............19 ......... 4.4
3rd pillar: Infrastructure and digital content3.01 Electricity production, kWh/capita ......................79 .. 2,108.93.02 Mobile network coverage, % pop ........................1 ..... 100.03.03 Int’l Internet bandwidth, kb/s per user................64 ....... 19.13.04 Secure Internet servers/million pop ..................100 ......... 4.73.05 Accessibility of digital content* ...........................71 ......... 5.0
4th pillar: Affordability4.01 Mobile cellular tariffs, PPP $/min. .......................28 ....... 0.154.02 Fixed broadband Internet tariffs, PPP $/month ..16 ..... 18.554.03 Internet & telephony competition, 0–2 (best) ....104 ....... 1.35
5th pillar: Skills5.01 Quality of educational system* .........................109 ......... 3.15.02 Quality of math & science education* .................99 ......... 3.55.03 Secondary education gross enrollment rate, % ..48 ....... 96.95.04 Adult literacy rate, % ............................................3 ....... 99.8
INDICATOR RANK /144 VALUE
6th pillar: Individual usage 6.01 Mobile phone subscriptions/100 pop. ................64 ..... 108.7 6.02 Individuals using Internet, %...............................56 ....... 50.0 6.03 Households w/ personal computer, % ...............86 ....... 21.5 6.04 Households w/ Internet access, % ....................62 ....... 35.3 6.05 Broadband Internet subscriptions/100 pop. .......53 ....... 10.7 6.06 Mobile broadband subscriptions/100 pop. .........50 ....... 21.5 6.07 Use of virtual social networks* ...........................41 ......... 5.9
7th pillar: Business usage 7.01 Firm-level technology absorption* ......................73 ......... 4.7 7.02 Capacity for innovation* .....................................39 ......... 3.5 7.03 PCT patents, applications/million pop. ..............77 ......... 0.4 7.04 Business-to-business Internet use* ....................78 ......... 4.8 7.05 Business-to-consumer Internet use* ..................77 ......... 4.4 7.06 Extent of staff training* .......................................56 ......... 4.1
8th pillar: Government usage 8.01 Importance of ICTs to gov’t vision* .......................9 ......... 5.4 8.02 Government Online Service Index, 0–1 (best) .....97 ....... 0.37 8.03 Gov’t success in ICT promotion* ..........................8 ......... 5.6
9th pillar: Economic impacts 9.01 Impact of ICTs on new services and products* ..41 ......... 4.9 9.02 ICT PCT patents, applications/million pop. .......95 ......... 0.0 9.03 Impact of ICTs on new organizational models* ...39 ......... 4.6 9.04 Knowledge-intensive jobs, % workforce .............69 ....... 20.3
10th pillar: Social impacts 10.01 Impact of ICTs on access to basic services* ......37 ......... 4.9 10.02 Internet access in schools* ................................79 ......... 3.9 10.03 ICT use & gov’t efficiency* .................................19 ......... 5.2 10.04 E-Participation Index, 0–1 (best).........................81 ....... 0.13
Rank Score (out of 144) (1–7)
Networked Readiness Index 2013 ..............56 ..4.1Networked Readiness Index 2012 (out of 142) ...................... 61 .....3.9
A. Environment subindex ..............................................77 ....3.81st pillar: Political and regulatory environment ................... 66 .....3.72nd pillar: Business and innovation environment ............... 86 .....4.0
B. Readiness subindex .................................................51 ....5.03rd pillar: Infrastructure and digital content ........................ 75 .....3.84th pillar: Affordability ........................................................ 20 .....6.25th pillar: Skills ................................................................... 57 .....5.0
C. Usage subindex ........................................................52 ....4.06th pillar: Individual usage .................................................. 64 .....3.77th pillar: Business usage .................................................. 58 .....3.68th pillar: Government usage ............................................. 34 .....4.7
D. Impact subindex .......................................................59 ....3.69th pillar: Economic impacts .............................................. 59 .....3.410th pillar: Social impacts .................................................. 57 .....3.9
Azerbaijan3: Country/Economy Profiles
148 | The Global Information Technology Report 2013
Note: Indicators followed by an asterisk (*) are measured on a 1-to-7 (best) scale. For further details and explanation, please refer to the section “How to Read the Country/Economy Profiles” on page 139.
Azerbaijan Upper-middle-income group average
1. Political and regulatory environment
6. Individual usage
5. Skills7. Business usage
4. Affordability8. Governmentusage
3. Infrastructure anddigital content
9. Economicimpacts
2. Business and innovation environment
10. Socialimpacts
1
2
3
4
5
6
7
@ 2013 World Economic Forum

The Networked Readiness Index in detailINDICATOR RANK /144 VALUE
1st pillar: Political and regulatory environment1.01 Effectiveness of law-making bodies* ..................47 ......... 4.01.02 Laws relating to ICTs* ........................................32 ......... 4.91.03 Judicial independence* ......................................32 ......... 5.11.04 Efficiency of legal system in settling disputes* ....30 ......... 4.61.05 Efficiency of legal system in challenging regs* ....28 ......... 4.51.06 Intellectual property protection* ..........................28 ......... 5.11.07 Software piracy rate, % software installed ..........44 .......... 541.08 No. procedures to enforce a contract ..............136 .......... 481.09 No. days to enforce a contract ..........................99 ........ 635
2nd pillar: Business and innovation environment2.01 Availability of latest technologies* .......................24 ......... 6.22.02 Venture capital availability* ...................................7 ......... 4.32.03 Total tax rate, % profits ........................................4 ....... 13.92.04 No. days to start a business ..............................43 ............ 92.05 No. procedures to start a business ....................74 ............ 72.06 Intensity of local competition* .............................33 ......... 5.4
2.07 Tertiary education gross enrollment rate, % .......n/a ......... n/a2.08 Quality of management schools* ........................79 ......... 4.12.09 Gov’t procurement of advanced tech* ...............20 ......... 4.4
3rd pillar: Infrastructure and digital content3.01 Electricity production, kWh/capita ......................11 10,308.03.02 Mobile network coverage, % pop ........................1 ..... 100.03.03 Int’l Internet bandwidth, kb/s per user................73 ....... 14.73.04 Secure Internet servers/million pop ....................48 ..... 117.93.05 Accessibility of digital content* ...........................31 ......... 5.9
4th pillar: Affordability4.01 Mobile cellular tariffs, PPP $/min. .......................32 ....... 0.164.02 Fixed broadband Internet tariffs, PPP $/month ..74 ..... 34.654.03 Internet & telephony competition, 0–2 (best) ......61 ....... 1.92
5th pillar: Skills5.01 Quality of educational system* ...........................35 ......... 4.4
5.02 Quality of math & science education* .................56 ......... 4.2 5.03 Secondary education gross enrollment rate, % ..24 ..... 103.1 5.04 Adult literacy rate, % ..........................................78 ....... 91.9
INDICATOR RANK /144 VALUE
6th pillar: Individual usage 6.01 Mobile phone subscriptions/100 pop. ................34 ..... 128.0 6.02 Individuals using Internet, %...............................21 ....... 77.0 6.03 Households w/ personal computer, % .................7 ....... 90.0 6.04 Households w/ Internet access, % ....................20 ....... 76.8 6.05 Broadband Internet subscriptions/100 pop. .......43 ....... 13.8 6.06 Mobile broadband subscriptions/100 pop. .........75 ......... 9.5 6.07 Use of virtual social networks* ...........................15 ......... 6.2
7th pillar: Business usage 7.01 Firm-level technology absorption* ......................21 ......... 5.8 7.02 Capacity for innovation* ...................................117 ......... 2.5 7.03 PCT patents, applications/million pop. ..............54 ......... 1.9 7.04 Business-to-business Internet use* ....................29 ......... 5.6 7.05 Business-to-consumer Internet use* ..................97 ......... 4.0 7.06 Extent of staff training* .......................................25 ......... 4.6
8th pillar: Government usage 8.01 Importance of ICTs to gov’t vision* .......................8 ......... 5.4 8.02 Government Online Service Index, 0–1 (best) .......9 ....... 0.86 8.03 Gov’t success in ICT promotion* ..........................6 ......... 5.7
9th pillar: Economic impacts 9.01 Impact of ICTs on new services and products* ..35 ......... 5.0 9.02 ICT PCT patents, applications/million pop. .......70 ......... 0.1 9.03 Impact of ICTs on new organizational models* ...40 ......... 4.6 9.04 Knowledge-intensive jobs, % workforce .............68 ....... 20.7
10th pillar: Social impacts 10.01 Impact of ICTs on access to basic services* ......13 ......... 5.8 10.02 Internet access in schools* ................................35 ......... 5.3 10.03 ICT use & gov’t efficiency* ...................................6 ......... 5.6 10.04 E-Participation Index, 0–1 (best).........................19 ....... 0.66
Rank Score (out of 144) (1–7)
Networked Readiness Index 2013 ..............29 ..4.8Networked Readiness Index 2012 (out of 142) ...................... 27 .....4.9
A. Environment subindex ..............................................28 ....4.81st pillar: Political and regulatory environment ................... 40 .....4.42nd pillar: Business and innovation environment ............... 14 .....5.3
B. Readiness subindex .................................................35 ....5.33rd pillar: Infrastructure and digital content ........................ 39 .....5.04th pillar: Affordability ........................................................ 46 .....5.65th pillar: Skills ................................................................... 44 .....5.2
C. Usage subindex ........................................................30 ....4.86th pillar: Individual usage .................................................. 30 .....5.17th pillar: Business usage .................................................. 56 .....3.68th pillar: Government usage ............................................... 4 .....5.8
D. Impact subindex .......................................................32 ....4.49th pillar: Economic impacts .............................................. 52 .....3.410th pillar: Social impacts .................................................. 16 .....5.4
Bahrain3: Country/Economy Profiles
The Global Information Technology Report 2013 | 149
Note: Indicators followed by an asterisk (*) are measured on a 1-to-7 (best) scale. For further details and explanation, please refer to the section “How to Read the Country/Economy Profiles” on page 139.
Bahrain High-income group average
1. Political and regulatory environment
6. Individual usage
5. Skills7. Business usage
4. Affordability8. Governmentusage
3. Infrastructure anddigital content
9. Economicimpacts
2. Business and innovation environment
10. Socialimpacts
1
2
3
4
5
6
7
@ 2013 World Economic Forum

The Networked Readiness Index in detailINDICATOR RANK /144 VALUE
1st pillar: Political and regulatory environment1.01 Effectiveness of law-making bodies* ................101 ......... 3.11.02 Laws relating to ICTs* ......................................118 ......... 3.11.03 Judicial independence* ....................................104 ......... 2.81.04 Efficiency of legal system in settling disputes* ..101 ......... 3.31.05 Efficiency of legal system in challenging regs* ....71 ......... 3.61.06 Intellectual property protection* ........................131 ......... 2.41.07 Software piracy rate, % software installed ........103 .......... 901.08 No. procedures to enforce a contract ..............110 .......... 411.09 No. days to enforce a contract ........................141 ..... 1,442
2nd pillar: Business and innovation environment2.01 Availability of latest technologies* .....................105 ......... 4.42.02 Venture capital availability* ...............................122 ......... 2.02.03 Total tax rate, % profits ......................................60 ....... 35.02.04 No. days to start a business ..............................81 .......... 192.05 No. procedures to start a business ....................74 ............ 72.06 Intensity of local competition* .............................83 ......... 4.72.07 Tertiary education gross enrollment rate, % ......111 ....... 10.62.08 Quality of management schools* ........................91 ......... 3.92.09 Gov’t procurement of advanced tech* .............134 ......... 2.6
3rd pillar: Infrastructure and digital content3.01 Electricity production, kWh/capita ....................119 ..... 257.53.02 Mobile network coverage, % pop ......................51 ....... 99.03.03 Int’l Internet bandwidth, kb/s per user..............132 ......... 1.53.04 Secure Internet servers/million pop ..................133 ......... 0.63.05 Accessibility of digital content* .........................115 ......... 4.0
4th pillar: Affordability4.01 Mobile cellular tariffs, PPP $/min. .........................4 ....... 0.034.02 Fixed broadband Internet tariffs, PPP $/month ..17 ..... 18.874.03 Internet & telephony competition, 0–2 (best) ....113 ....... 1.25
5th pillar: Skills5.01 Quality of educational system* ...........................97 ......... 3.25.02 Quality of math & science education* ...............113 ......... 3.25.03 Secondary education gross enrollment rate, % 117 ....... 51.45.04 Adult literacy rate, % ........................................127 ....... 56.8
INDICATOR RANK /144 VALUE
6th pillar: Individual usage 6.01 Mobile phone subscriptions/100 pop. ..............126 ....... 56.1 6.02 Individuals using Internet, %.............................126 ......... 5.0 6.03 Households w/ personal computer, % .............127 ......... 3.1 6.04 Households w/ Internet access, % ..................117 ......... 2.6 6.05 Broadband Internet subscriptions/100 pop. .....112 ......... 0.3 6.06 Mobile broadband subscriptions/100 pop. .......124 ......... 0.0 6.07 Use of virtual social networks* .........................123 ......... 4.5
7th pillar: Business usage 7.01 Firm-level technology absorption* ....................111 ......... 4.2 7.02 Capacity for innovation* ...................................131 ......... 2.4 7.03 PCT patents, applications/million pop. ............117 ......... 0.0 7.04 Business-to-business Internet use* ..................126 ......... 4.1 7.05 Business-to-consumer Internet use* ................117 ......... 3.6 7.06 Extent of staff training* .....................................136 ......... 3.0
8th pillar: Government usage 8.01 Importance of ICTs to gov’t vision* .....................68 ......... 4.1 8.02 Government Online Service Index, 0–1 (best) .....83 ....... 0.44 8.03 Gov’t success in ICT promotion* ........................72 ......... 4.4
9th pillar: Economic impacts 9.01 Impact of ICTs on new services and products* 100 ......... 4.0 9.02 ICT PCT patents, applications/million pop. .......95 ......... 0.0 9.03 Impact of ICTs on new organizational models* .112 ......... 3.6 9.04 Knowledge-intensive jobs, % workforce ...........101 ......... 7.3
10th pillar: Social impacts 10.01 Impact of ICTs on access to basic services* ....100 ......... 3.8 10.02 Internet access in schools* ..............................122 ......... 2.6 10.03 ICT use & gov’t efficiency* ...............................104 ......... 3.7 10.04 E-Participation Index, 0–1 (best).........................96 ....... 0.08
Rank Score (out of 144) (1–7)
Networked Readiness Index 2013 ............114 ..3.2Networked Readiness Index 2012 (out of 142) .................... 113 .....3.2
A. Environment subindex ............................................128 ....3.21st pillar: Political and regulatory environment ................. 137 .....2.72nd pillar: Business and innovation environment ............. 111 .....3.7
B. Readiness subindex .................................................91 ....4.13rd pillar: Infrastructure and digital content ...................... 109 .....2.84th pillar: Affordability ........................................................ 13 .....6.35th pillar: Skills ................................................................. 128 .....3.2
C. Usage subindex ......................................................121 ....2.86th pillar: Individual usage ................................................ 128 .....1.77th pillar: Business usage ................................................ 132 .....2.88th pillar: Government usage ............................................. 68 .....4.0
D. Impact subindex .....................................................126 ....2.79th pillar: Economic impacts ............................................ 128 .....2.510th pillar: Social impacts ................................................ 118 .....2.9
Bangladesh3: Country/Economy Profiles
150 | The Global Information Technology Report 2013
Note: Indicators followed by an asterisk (*) are measured on a 1-to-7 (best) scale. For further details and explanation, please refer to the section “How to Read the Country/Economy Profiles” on page 139.
Bangladesh Low-income group average
1. Political and regulatory environment
6. Individual usage
5. Skills7. Business usage
4. Affordability8. Governmentusage
3. Infrastructure anddigital content
9. Economicimpacts
2. Business and innovation environment
10. Socialimpacts
1
2
3
4
5
6
7
@ 2013 World Economic Forum

The Networked Readiness Index in detailINDICATOR RANK /144 VALUE
1st pillar: Political and regulatory environment1.01 Effectiveness of law-making bodies* ..................10 ......... 5.11.02 Laws relating to ICTs* ........................................56 ......... 4.21.03 Judicial independence* ......................................19 ......... 5.71.04 Efficiency of legal system in settling disputes* ....28 ......... 4.71.05 Efficiency of legal system in challenging regs* ....32 ......... 4.51.06 Intellectual property protection* ..........................30 ......... 4.91.07 Software piracy rate, % software installed .........n/a ......... n/a1.08 No. procedures to enforce a contract ................78 .......... 381.09 No. days to enforce a contract ........................137 ..... 1,340
2nd pillar: Business and innovation environment2.01 Availability of latest technologies* .......................28 ......... 6.02.02 Venture capital availability* .................................94 ......... 2.32.03 Total tax rate, % profits ....................................101 ....... 45.42.04 No. days to start a business ..............................77 .......... 182.05 No. procedures to start a business ....................88 ............ 82.06 Intensity of local competition* .............................70 ......... 4.9
2.07 Tertiary education gross enrollment rate, % ........33 ....... 61.82.08 Quality of management schools* ........................21 ......... 5.22.09 Gov’t procurement of advanced tech* ...............34 ......... 4.0
3rd pillar: Infrastructure and digital content3.01 Electricity production, kWh/capita ......................56 .. 3,793.93.02 Mobile network coverage, % pop ......................51 ....... 99.03.03 Int’l Internet bandwidth, kb/s per user................38 ....... 38.23.04 Secure Internet servers/million pop ....................29 ..... 401.63.05 Accessibility of digital content* ...........................28 ......... 6.0
4th pillar: Affordability4.01 Mobile cellular tariffs, PPP $/min. .....................104 ....... 0.404.02 Fixed broadband Internet tariffs, PPP $/month 105 ..... 50.444.03 Internet & telephony competition, 0–2 (best) ....116 ....... 1.20
5th pillar: Skills5.01 Quality of educational system* .............................7 ......... 5.45.02 Quality of math & science education* ...................7 ......... 5.65.03 Secondary education gross enrollment rate, % ..22 ..... 103.75.04 Adult literacy rate, % .........................................n/a ......... n/a
INDICATOR RANK /144 VALUE
6th pillar: Individual usage 6.01 Mobile phone subscriptions/100 pop. ................36 ..... 127.0 6.02 Individuals using Internet, %...............................30 ....... 71.8 6.03 Households w/ personal computer, % ...............45 ....... 61.4 6.04 Households w/ Internet access, % ....................48 ....... 51.0 6.05 Broadband Internet subscriptions/100 pop. .......29 ....... 22.1 6.06 Mobile broadband subscriptions/100 pop. ...........7 ....... 77.1 6.07 Use of virtual social networks* ...........................26 ......... 6.1
7th pillar: Business usage 7.01 Firm-level technology absorption* ......................37 ......... 5.4 7.02 Capacity for innovation* .....................................91 ......... 2.9 7.03 PCT patents, applications/million pop. ..............32 ....... 11.3 7.04 Business-to-business Internet use* ....................49 ......... 5.3 7.05 Business-to-consumer Internet use* ..................60 ......... 4.7 7.06 Extent of staff training* .......................................30 ......... 4.6
8th pillar: Government usage 8.01 Importance of ICTs to gov’t vision* .....................36 ......... 4.5 8.02 Government Online Service Index, 0–1 (best) .....95 ....... 0.37 8.03 Gov’t success in ICT promotion* ........................48 ......... 4.7
9th pillar: Economic impacts 9.01 Impact of ICTs on new services and products* ..63 ......... 4.5 9.02 ICT PCT patents, applications/million pop. .......34 ......... 1.8 9.03 Impact of ICTs on new organizational models* ...63 ......... 4.2 9.04 Knowledge-intensive jobs, % workforce ...............1 ....... 57.6
10th pillar: Social impacts 10.01 Impact of ICTs on access to basic services* ......33 ......... 5.1 10.02 Internet access in schools* ................................33 ......... 5.3 10.03 ICT use & gov’t efficiency* .................................47 ......... 4.5 10.04 E-Participation Index, 0–1 (best).......................111 ....... 0.03
Rank Score (out of 144) (1–7)
Networked Readiness Index 2013 ..............39 ..4.5Networked Readiness Index 2012 (out of 142) ...................... 35 .....4.6
A. Environment subindex ..............................................36 ....4.61st pillar: Political and regulatory environment ................... 32 .....4.62nd pillar: Business and innovation environment ............... 38 .....4.7
B. Readiness subindex .................................................65 ....4.83rd pillar: Infrastructure and digital content ........................ 32 .....5.34th pillar: Affordability ...................................................... 111 .....3.55th pillar: Skills ................................................................... 22 .....5.6
C. Usage subindex ........................................................34 ....4.46th pillar: Individual usage .................................................. 26 .....5.57th pillar: Business usage .................................................. 43 .....3.78th pillar: Government usage ............................................. 64 .....4.1
D. Impact subindex .......................................................38 ....4.19th pillar: Economic impacts .............................................. 27 .....4.210th pillar: Social impacts .................................................. 52 .....4.0
Barbados3: Country/Economy Profiles
The Global Information Technology Report 2013 | 151
Note: Indicators followed by an asterisk (*) are measured on a 1-to-7 (best) scale. For further details and explanation, please refer to the section “How to Read the Country/Economy Profiles” on page 139.
Barbados High-income group average
1. Political and regulatory environment
6. Individual usage
5. Skills7. Business usage
4. Affordability8. Governmentusage
3. Infrastructure anddigital content
9. Economicimpacts
2. Business and innovation environment
10. Socialimpacts
1
2
3
4
5
6
7
@ 2013 World Economic Forum

The Networked Readiness Index in detailINDICATOR RANK /144 VALUE
1st pillar: Political and regulatory environment1.01 Effectiveness of law-making bodies* ..................63 ......... 3.71.02 Laws relating to ICTs* ........................................33 ......... 4.91.03 Judicial independence* ......................................28 ......... 5.21.04 Efficiency of legal system in settling disputes* ....45 ......... 4.21.05 Efficiency of legal system in challenging regs* ....41 ......... 4.21.06 Intellectual property protection* ..........................24 ......... 5.21.07 Software piracy rate, % software installed ............7 .......... 241.08 No. procedures to enforce a contract ..................5 .......... 261.09 No. days to enforce a contract ..........................62 ........ 505
2nd pillar: Business and innovation environment2.01 Availability of latest technologies* .........................9 ......... 6.52.02 Venture capital availability* .................................23 ......... 3.52.03 Total tax rate, % profits ....................................124 ....... 57.72.04 No. days to start a business ................................8 ............ 42.05 No. procedures to start a business ....................10 ............ 32.06 Intensity of local competition* ...............................4 ......... 6.02.07 Tertiary education gross enrollment rate, % ........22 ....... 70.62.08 Quality of management schools* ..........................2 ......... 6.02.09 Gov’t procurement of advanced tech* ...............25 ......... 4.1
3rd pillar: Infrastructure and digital content3.01 Electricity production, kWh/capita ......................17 .. 8,726.73.02 Mobile network coverage, % pop ......................28 ....... 99.93.03 Int’l Internet bandwidth, kb/s per user................12 ..... 131.13.04 Secure Internet servers/million pop ....................23 ..... 599.63.05 Accessibility of digital content* ...........................15 ......... 6.2
4th pillar: Affordability4.01 Mobile cellular tariffs, PPP $/min. .....................127 ....... 0.584.02 Fixed broadband Internet tariffs, PPP $/month ..31 ..... 22.134.03 Internet & telephony competition, 0–2 (best) ........1 ....... 2.00
5th pillar: Skills5.01 Quality of educational system* .............................5 ......... 5.45.02 Quality of math & science education* ...................3 ......... 6.25.03 Secondary education gross enrollment rate, % ..11 ..... 110.55.04 Adult literacy rate, % ..........................................15 ....... 99.0
INDICATOR RANK /144 VALUE
6th pillar: Individual usage 6.01 Mobile phone subscriptions/100 pop. ................50 ..... 116.6 6.02 Individuals using Internet, %...............................19 ....... 78.0 6.03 Households w/ personal computer, % ...............23 ....... 78.9 6.04 Households w/ Internet access, % ....................21 ....... 76.5 6.05 Broadband Internet subscriptions/100 pop. .........9 ....... 33.0 6.06 Mobile broadband subscriptions/100 pop. .........56 ....... 19.4 6.07 Use of virtual social networks* ...........................19 ......... 6.2
7th pillar: Business usage 7.01 Firm-level technology absorption* ......................31 ......... 5.6 7.02 Capacity for innovation* .....................................11 ......... 5.0 7.03 PCT patents, applications/million pop. ..............15 ..... 106.2 7.04 Business-to-business Internet use* ....................21 ......... 5.8 7.05 Business-to-consumer Internet use* ..................37 ......... 5.1 7.06 Extent of staff training* .......................................20 ......... 4.8
8th pillar: Government usage 8.01 Importance of ICTs to gov’t vision* .....................69 ......... 4.0 8.02 Government Online Service Index, 0–1 (best) .....39 ....... 0.65 8.03 Gov’t success in ICT promotion* ........................63 ......... 4.5
9th pillar: Economic impacts 9.01 Impact of ICTs on new services and products* ..31 ......... 5.1 9.02 ICT PCT patents, applications/million pop. .......18 ....... 23.2 9.03 Impact of ICTs on new organizational models* ...30 ......... 4.8 9.04 Knowledge-intensive jobs, % workforce .............10 ....... 43.4
10th pillar: Social impacts 10.01 Impact of ICTs on access to basic services* ......22 ......... 5.4 10.02 Internet access in schools* ................................28 ......... 5.7 10.03 ICT use & gov’t efficiency* .................................50 ......... 4.5 10.04 E-Participation Index, 0–1 (best).........................81 ....... 0.13
Rank Score (out of 144) (1–7)
Networked Readiness Index 2013 ..............24 ..5.1Networked Readiness Index 2012 (out of 142) ...................... 22 .....5.1
A. Environment subindex ..............................................17 ....5.11st pillar: Political and regulatory environment ................... 23 .....4.92nd pillar: Business and innovation environment ............... 18 .....5.2
B. Readiness subindex .................................................15 ....5.83rd pillar: Infrastructure and digital content ........................ 18 .....6.24th pillar: Affordability ........................................................ 70 .....5.25th pillar: Skills ..................................................................... 3 .....6.1
C. Usage subindex ........................................................26 ....5.06th pillar: Individual usage .................................................. 25 .....5.57th pillar: Business usage .................................................. 17 .....4.98th pillar: Government usage ............................................. 41 .....4.5
D. Impact subindex .......................................................28 ....4.59th pillar: Economic impacts .............................................. 19 .....4.710th pillar: Social impacts .................................................. 41 .....4.3
Belgium3: Country/Economy Profiles
152 | The Global Information Technology Report 2013
Note: Indicators followed by an asterisk (*) are measured on a 1-to-7 (best) scale. For further details and explanation, please refer to the section “How to Read the Country/Economy Profiles” on page 139.
Belgium High-income group average
1. Political and regulatory environment
6. Individual usage
5. Skills7. Business usage
4. Affordability8. Governmentusage
3. Infrastructure anddigital content
9. Economicimpacts
2. Business and innovation environment
10. Socialimpacts
1
2
3
4
5
6
7
@ 2013 World Economic Forum

The Networked Readiness Index in detailINDICATOR RANK /144 VALUE
1st pillar: Political and regulatory environment1.01 Effectiveness of law-making bodies* ..................41 ......... 4.11.02 Laws relating to ICTs* ......................................120 ......... 3.11.03 Judicial independence* ....................................101 ......... 2.91.04 Efficiency of legal system in settling disputes* ....91 ......... 3.31.05 Efficiency of legal system in challenging regs* ....66 ......... 3.71.06 Intellectual property protection* ..........................91 ......... 3.21.07 Software piracy rate, % software installed .........n/a ......... n/a1.08 No. procedures to enforce a contract ..............116 .......... 421.09 No. days to enforce a contract ........................117 ........ 795
2nd pillar: Business and innovation environment2.01 Availability of latest technologies* .....................113 ......... 4.22.02 Venture capital availability* ...............................102 ......... 2.22.03 Total tax rate, % profits ....................................131 ....... 65.92.04 No. days to start a business ..............................99 .......... 262.05 No. procedures to start a business ....................30 ............ 52.06 Intensity of local competition* .............................93 ......... 4.52.07 Tertiary education gross enrollment rate, % ......102 ....... 13.32.08 Quality of management schools* ........................53 ......... 4.42.09 Gov’t procurement of advanced tech* ...............62 ......... 3.7
3rd pillar: Infrastructure and digital content3.01 Electricity production, kWh/capita ....................143 ....... 14.83.02 Mobile network coverage, % pop ......................51 ....... 99.03.03 Int’l Internet bandwidth, kb/s per user..............117 ......... 3.43.04 Secure Internet servers/million pop ..................131 ......... 0.83.05 Accessibility of digital content* .........................128 ......... 3.6
4th pillar: Affordability4.01 Mobile cellular tariffs, PPP $/min. .......................99 ....... 0.394.02 Fixed broadband Internet tariffs, PPP $/month 128 ... 107.584.03 Internet & telephony competition, 0–2 (best) ....135 ....... 0.50
5th pillar: Skills5.01 Quality of educational system* ...........................71 ......... 3.65.02 Quality of math & science education* .................51 ......... 4.35.03 Secondary education gross enrollment rate, % 116 ....... 51.45.04 Adult literacy rate, % ........................................135 ....... 42.4
INDICATOR RANK /144 VALUE
6th pillar: Individual usage 6.01 Mobile phone subscriptions/100 pop. ..............102 ....... 85.3 6.02 Individuals using Internet, %.............................131 ......... 3.5 6.03 Households w/ personal computer, % .............132 ......... 2.5 6.04 Households w/ Internet access, % ...................n/a ......... n/a 6.05 Broadband Internet subscriptions/100 pop. .....131 ......... 0.0 6.06 Mobile broadband subscriptions/100 pop. .......126 ......... 0.0 6.07 Use of virtual social networks* .........................102 ......... 5.0
7th pillar: Business usage 7.01 Firm-level technology absorption* ....................114 ......... 4.2 7.02 Capacity for innovation* ...................................121 ......... 2.5 7.03 PCT patents, applications/million pop. ............110 ......... 0.0 7.04 Business-to-business Internet use* ..................123 ......... 4.2 7.05 Business-to-consumer Internet use* ..................84 ......... 4.3 7.06 Extent of staff training* .....................................133 ......... 3.1
8th pillar: Government usage 8.01 Importance of ICTs to gov’t vision* ...................110 ......... 3.4 8.02 Government Online Service Index, 0–1 (best) ...127 ....... 0.20 8.03 Gov’t success in ICT promotion* ......................132 ......... 3.1
9th pillar: Economic impacts 9.01 Impact of ICTs on new services and products* ..64 ......... 4.5 9.02 ICT PCT patents, applications/million pop. .......95 ......... 0.0 9.03 Impact of ICTs on new organizational models* .117 ......... 3.5 9.04 Knowledge-intensive jobs, % workforce ............n/a ......... n/a
10th pillar: Social impacts 10.01 Impact of ICTs on access to basic services* ....115 ......... 3.5 10.02 Internet access in schools* ..............................127 ......... 2.5 10.03 ICT use & gov’t efficiency* ...............................112 ......... 3.5 10.04 E-Participation Index, 0–1 (best).........................96 ....... 0.08
Rank Score (out of 144) (1–7)
Networked Readiness Index 2013 ............123 ..3.0Networked Readiness Index 2012 (out of 142) .................... 117 .....3.0
A. Environment subindex ............................................115 ....3.41st pillar: Political and regulatory environment ................... 94 .....3.42nd pillar: Business and innovation environment ............. 123 .....3.5
B. Readiness subindex ...............................................128 ....2.93rd pillar: Infrastructure and digital content ...................... 113 .....2.84th pillar: Affordability ...................................................... 133 .....2.45th pillar: Skills ................................................................. 124 .....3.4
C. Usage subindex ......................................................127 ....2.76th pillar: Individual usage ................................................ 109 .....2.27th pillar: Business usage ................................................ 117 .....3.08th pillar: Government usage ........................................... 135 .....2.9
D. Impact subindex .....................................................113 ....2.99th pillar: Economic impacts .............................................. 87 .....3.010th pillar: Social impacts ................................................ 123 .....2.8
Benin3: Country/Economy Profiles
The Global Information Technology Report 2013 | 153
Note: Indicators followed by an asterisk (*) are measured on a 1-to-7 (best) scale. For further details and explanation, please refer to the section “How to Read the Country/Economy Profiles” on page 139.
Benin Low-income group average
1. Political and regulatory environment
6. Individual usage
5. Skills7. Business usage
4. Affordability8. Governmentusage
3. Infrastructure anddigital content
9. Economicimpacts
2. Business and innovation environment
10. Socialimpacts
1
2
3
4
5
6
7
@ 2013 World Economic Forum

The Networked Readiness Index in detailINDICATOR RANK /144 VALUE
1st pillar: Political and regulatory environment1.01 Effectiveness of law-making bodies* ..................91 ......... 3.21.02 Laws relating to ICTs* ......................................110 ......... 3.21.03 Judicial independence* ......................................97 ......... 3.11.04 Efficiency of legal system in settling disputes* ..104 ......... 3.21.05 Efficiency of legal system in challenging regs* ....99 ......... 3.21.06 Intellectual property protection* ..........................88 ......... 3.21.07 Software piracy rate, % software installed ..........82 .......... 791.08 No. procedures to enforce a contract ................99 .......... 401.09 No. days to enforce a contract ..........................88 ........ 591
2nd pillar: Business and innovation environment2.01 Availability of latest technologies* .....................134 ......... 3.62.02 Venture capital availability* .................................30 ......... 3.32.03 Total tax rate, % profits ....................................140 ....... 83.42.04 No. days to start a business ............................128 .......... 502.05 No. procedures to start a business ..................139 .......... 152.06 Intensity of local competition* ...........................135 ......... 3.7
2.07 Tertiary education gross enrollment rate, % ........66 ....... 38.6 2.08 Quality of management schools* ......................120 ......... 3.4 2.09 Gov’t procurement of advanced tech* ...............79 ......... 3.5
3rd pillar: Infrastructure and digital content 3.01 Electricity production, kWh/capita ....................109 ..... 626.1 3.02 Mobile network coverage, % pop ....................133 ....... 45.9 3.03 Int’l Internet bandwidth, kb/s per user..............108 ......... 4.7 3.04 Secure Internet servers/million pop ....................91 ......... 9.5 3.05 Accessibility of digital content* .........................129 ......... 3.6
4th pillar: Affordability 4.01 Mobile cellular tariffs, PPP $/min. .....................111 ....... 0.46 4.02 Fixed broadband Internet tariffs, PPP $/month 110 ..... 54.67 4.03 Internet & telephony competition, 0–2 (best) ....130 ....... 0.80
5th pillar: Skills 5.01 Quality of educational system* ...........................96 ......... 3.3 5.02 Quality of math & science education* ...............103 ......... 3.5 5.03 Secondary education gross enrollment rate, % ..91 ....... 81.0 5.04 Adult literacy rate, % ..........................................82 ....... 91.2
INDICATOR RANK /144 VALUE
6th pillar: Individual usage 6.01 Mobile phone subscriptions/100 pop. ..............106 ....... 82.8 6.02 Individuals using Internet, %...............................90 ....... 30.0 6.03 Households w/ personal computer, % ...............79 ....... 27.0 6.04 Households w/ Internet access, % ....................95 ......... 9.4 6.05 Broadband Internet subscriptions/100 pop. .....108 ......... 0.7 6.06 Mobile broadband subscriptions/100 pop. .........98 ......... 2.8 6.07 Use of virtual social networks* .........................140 ......... 3.9
7th pillar: Business usage 7.01 Firm-level technology absorption* ....................138 ......... 3.7 7.02 Capacity for innovation* .....................................61 ......... 3.2 7.03 PCT patents, applications/million pop. ..............99 ......... 0.1 7.04 Business-to-business Internet use* ..................132 ......... 3.9 7.05 Business-to-consumer Internet use* ................100 ......... 4.0 7.06 Extent of staff training* .....................................103 ......... 3.6
8th pillar: Government usage 8.01 Importance of ICTs to gov’t vision* ...................115 ......... 3.3 8.02 Government Online Service Index, 0–1 (best) .....91 ....... 0.41 8.03 Gov’t success in ICT promotion* ......................115 ......... 3.6
9th pillar: Economic impacts 9.01 Impact of ICTs on new services and products* 129 ......... 3.5 9.02 ICT PCT patents, applications/million pop. .......95 ......... 0.0 9.03 Impact of ICTs on new organizational models* .101 ......... 3.7 9.04 Knowledge-intensive jobs, % workforce .............91 ....... 14.3
10th pillar: Social impacts 10.01 Impact of ICTs on access to basic services* ....117 ......... 3.5 10.02 Internet access in schools* ..............................100 ......... 3.4 10.03 ICT use & gov’t efficiency* ...............................123 ......... 3.4 10.04 E-Participation Index, 0–1 (best).........................62 ....... 0.21
Rank Score (out of 144) (1–7)
Networked Readiness Index 2013 ............119 ..3.0Networked Readiness Index 2012 (out of 142) .................... 127 .....2.9
A. Environment subindex ............................................129 ....3.21st pillar: Political and regulatory environment ................. 110 .....3.22nd pillar: Business and innovation environment ............. 137 .....3.2
B. Readiness subindex ...............................................124 ....3.03rd pillar: Infrastructure and digital content ...................... 138 .....1.74th pillar: Affordability ...................................................... 122 .....2.95th pillar: Skills ................................................................... 94 .....4.4
C. Usage subindex ......................................................113 ....3.06th pillar: Individual usage ................................................ 104 .....2.37th pillar: Business usage ................................................ 109 .....3.18th pillar: Government usage ........................................... 115 .....3.4
D. Impact subindex .....................................................114 ....2.99th pillar: Economic impacts ............................................ 123 .....2.610th pillar: Social impacts ................................................ 104 .....3.1
Bolivia3: Country/Economy Profiles
154 | The Global Information Technology Report 2013
Note: Indicators followed by an asterisk (*) are measured on a 1-to-7 (best) scale. For further details and explanation, please refer to the section “How to Read the Country/Economy Profiles” on page 139.
Bolivia Lower-middle-income group average
1. Political and regulatory environment
6. Individual usage
5. Skills7. Business usage
4. Affordability8. Governmentusage
3. Infrastructure anddigital content
9. Economicimpacts
2. Business and innovation environment
10. Socialimpacts
1
2
3
4
5
6
7
@ 2013 World Economic Forum

The Networked Readiness Index in detailINDICATOR RANK /144 VALUE
1st pillar: Political and regulatory environment1.01 Effectiveness of law-making bodies* ................100 ......... 3.11.02 Laws relating to ICTs* ........................................95 ......... 3.61.03 Judicial independence* ......................................78 ......... 3.51.04 Efficiency of legal system in settling disputes* ..105 ......... 3.21.05 Efficiency of legal system in challenging regs* ....87 ......... 3.31.06 Intellectual property protection* ........................130 ......... 2.51.07 Software piracy rate, % software installed ..........62 .......... 661.08 No. procedures to enforce a contract ................68 .......... 371.09 No. days to enforce a contract ..........................90 ........ 595
2nd pillar: Business and innovation environment2.01 Availability of latest technologies* .......................89 ......... 4.62.02 Venture capital availability* ...............................127 ......... 1.92.03 Total tax rate, % profits ......................................19 ....... 24.12.04 No. days to start a business ............................119 .......... 372.05 No. procedures to start a business ..................123 .......... 112.06 Intensity of local competition* ...........................138 ......... 3.62.07 Tertiary education gross enrollment rate, % ........68 ....... 38.12.08 Quality of management schools* ........................50 ......... 4.42.09 Gov’t procurement of advanced tech* ...............94 ......... 3.3
3rd pillar: Infrastructure and digital content3.01 Electricity production, kWh/capita ......................53 .. 4,158.33.02 Mobile network coverage, % pop ......................41 ....... 99.73.03 Int’l Internet bandwidth, kb/s per user................69 ....... 17.83.04 Secure Internet servers/million pop ....................75 ....... 20.33.05 Accessibility of digital content* ...........................45 ......... 5.4
4th pillar: Affordability4.01 Mobile cellular tariffs, PPP $/min. .......................83 ....... 0.344.02 Fixed broadband Internet tariffs, PPP $/month ....8 ..... 15.684.03 Internet & telephony competition, 0–2 (best) ......71 ....... 1.86
5th pillar: Skills5.01 Quality of educational system* .........................106 ......... 3.15.02 Quality of math & science education* .................21 ......... 5.05.03 Secondary education gross enrollment rate, % ..71 ....... 89.35.04 Adult literacy rate, % ..........................................49 ....... 97.9
INDICATOR RANK /144 VALUE
6th pillar: Individual usage 6.01 Mobile phone subscriptions/100 pop. ..............104 ....... 84.5 6.02 Individuals using Internet, %...............................42 ....... 60.0 6.03 Households w/ personal computer, % ...............73 ....... 33.7 6.04 Households w/ Internet access, % ....................74 ....... 23.0 6.05 Broadband Internet subscriptions/100 pop. .......59 ......... 9.7 6.06 Mobile broadband subscriptions/100 pop. .........77 ......... 9.2 6.07 Use of virtual social networks* ...........................63 ......... 5.6
7th pillar: Business usage 7.01 Firm-level technology absorption* ....................105 ......... 4.3 7.02 Capacity for innovation* ...................................101 ......... 2.8 7.03 PCT patents, applications/million pop. ..............53 ......... 2.0 7.04 Business-to-business Internet use* ..................105 ......... 4.5 7.05 Business-to-consumer Internet use* ..................88 ......... 4.2 7.06 Extent of staff training* .....................................109 ......... 3.5
8th pillar: Government usage 8.01 Importance of ICTs to gov’t vision* ...................113 ......... 3.3 8.02 Government Online Service Index, 0–1 (best) .....95 ....... 0.37 8.03 Gov’t success in ICT promotion* ........................85 ......... 4.1
9th pillar: Economic impacts 9.01 Impact of ICTs on new services and products* 104 ......... 3.9 9.02 ICT PCT patents, applications/million pop. .......69 ......... 0.1 9.03 Impact of ICTs on new organizational models* ...92 ......... 3.8 9.04 Knowledge-intensive jobs, % workforce ............n/a ......... n/a
10th pillar: Social impacts 10.01 Impact of ICTs on access to basic services* ......60 ......... 4.3 10.02 Internet access in schools* ................................71 ......... 4.2 10.03 ICT use & gov’t efficiency* .................................96 ......... 3.8 10.04 E-Participation Index, 0–1 (best).......................124 ....... 0.00
Rank Score (out of 144) (1–7)
Networked Readiness Index 2013 ..............78 ..3.8Networked Readiness Index 2012 (out of 142) ...................... 84 .....3.7
A. Environment subindex ..............................................92 ....3.71st pillar: Political and regulatory environment ................... 97 .....3.42nd pillar: Business and innovation environment ............... 83 .....4.0
B. Readiness subindex .................................................43 ....5.13rd pillar: Infrastructure and digital content ........................ 64 .....4.14th pillar: Affordability ........................................................ 31 .....6.05th pillar: Skills ................................................................... 49 .....5.1
C. Usage subindex ........................................................87 ....3.36th pillar: Individual usage .................................................. 73 .....3.37th pillar: Business usage ................................................ 104 .....3.28th pillar: Government usage ........................................... 111 .....3.6
D. Impact subindex .......................................................96 ....3.19th pillar: Economic impacts .............................................. 96 .....2.910th pillar: Social impacts .................................................. 95 .....3.3
Bosnia and Herzegovina3: Country/Economy Profiles
The Global Information Technology Report 2013 | 155
Note: Indicators followed by an asterisk (*) are measured on a 1-to-7 (best) scale. For further details and explanation, please refer to the section “How to Read the Country/Economy Profiles” on page 139.
Bosnia and Herzegovina Upper middle income group average
1. Political and regulatory environment
6. Individual usage
5. Skills7. Business usage
4. Affordability8. Governmentusage
3. Infrastructure anddigital content
9. Economicimpacts
2. Business and innovation environment
10. Socialimpacts
1
2
3
4
5
6
7
@ 2013 World Economic Forum

The Networked Readiness Index in detailINDICATOR RANK /144 VALUE
1st pillar: Political and regulatory environment1.01 Effectiveness of law-making bodies* ..................15 ......... 5.01.02 Laws relating to ICTs* ........................................90 ......... 3.71.03 Judicial independence* ......................................22 ......... 5.51.04 Efficiency of legal system in settling disputes* ....16 ......... 5.01.05 Efficiency of legal system in challenging regs* ....15 ......... 4.91.06 Intellectual property protection* ..........................45 ......... 4.11.07 Software piracy rate, % software installed ..........86 .......... 801.08 No. procedures to enforce a contract ................12 .......... 281.09 No. days to enforce a contract ..........................97 ........ 625
2nd pillar: Business and innovation environment2.01 Availability of latest technologies* .......................93 ......... 4.62.02 Venture capital availability* .................................47 ......... 2.92.03 Total tax rate, % profits ......................................22 ....... 25.32.04 No. days to start a business ............................133 .......... 612.05 No. procedures to start a business ..................114 .......... 102.06 Intensity of local competition* .............................74 ......... 4.82.07 Tertiary education gross enrollment rate, % ......121 ......... 7.42.08 Quality of management schools* ........................92 ......... 3.92.09 Gov’t procurement of advanced tech* ...............65 ......... 3.6
3rd pillar: Infrastructure and digital content3.01 Electricity production, kWh/capita ....................121 ..... 224.13.02 Mobile network coverage, % pop ......................87 ....... 96.03.03 Int’l Internet bandwidth, kb/s per user................90 ......... 8.43.04 Secure Internet servers/million pop ....................93 ......... 8.93.05 Accessibility of digital content* .........................103 ......... 4.4
4th pillar: Affordability4.01 Mobile cellular tariffs, PPP $/min. .....................101 ....... 0.404.02 Fixed broadband Internet tariffs, PPP $/month 104 ..... 49.464.03 Internet & telephony competition, 0–2 (best) ....112 ....... 1.27
5th pillar: Skills5.01 Quality of educational system* ...........................55 ......... 4.05.02 Quality of math & science education* .................66 ......... 4.15.03 Secondary education gross enrollment rate, % ..89 ....... 81.75.04 Adult literacy rate, % ........................................104 ....... 84.5
INDICATOR RANK /144 VALUE
6th pillar: Individual usage 6.01 Mobile phone subscriptions/100 pop. ................20 ..... 142.8 6.02 Individuals using Internet, %.............................124 ......... 7.0 6.03 Households w/ personal computer, % .............111 ......... 6.5 6.04 Households w/ Internet access, % ..................122 ......... 2.0 6.05 Broadband Internet subscriptions/100 pop. .....105 ......... 0.8 6.06 Mobile broadband subscriptions/100 pop. .........71 ....... 11.8 6.07 Use of virtual social networks* .........................103 ......... 5.0
7th pillar: Business usage 7.01 Firm-level technology absorption* ......................98 ......... 4.4 7.02 Capacity for innovation* .....................................96 ......... 2.8 7.03 PCT patents, applications/million pop. ............106 ......... 0.0 7.04 Business-to-business Internet use* ..................120 ......... 4.2 7.05 Business-to-consumer Internet use* ................108 ......... 3.8 7.06 Extent of staff training* .......................................68 ......... 3.9
8th pillar: Government usage 8.01 Importance of ICTs to gov’t vision* .....................67 ......... 4.1 8.02 Government Online Service Index, 0–1 (best) ...100 ....... 0.36 8.03 Gov’t success in ICT promotion* ........................83 ......... 4.2
9th pillar: Economic impacts 9.01 Impact of ICTs on new services and products* 108 ......... 3.8 9.02 ICT PCT patents, applications/million pop. .......95 ......... 0.0 9.03 Impact of ICTs on new organizational models* .116 ......... 3.5 9.04 Knowledge-intensive jobs, % workforce .............84 ....... 17.1
10th pillar: Social impacts 10.01 Impact of ICTs on access to basic services* ......89 ......... 4.0 10.02 Internet access in schools* ................................96 ......... 3.5 10.03 ICT use & gov’t efficiency* .................................70 ......... 4.2 10.04 E-Participation Index, 0–1 (best).......................111 ....... 0.03
Rank Score (out of 144) (1–7)
Networked Readiness Index 2013 ..............96 ..3.5Networked Readiness Index 2012 (out of 142) ...................... 89 .....3.6
A. Environment subindex ..............................................56 ....4.11st pillar: Political and regulatory environment ................... 39 .....4.42nd pillar: Business and innovation environment ............. 103 .....3.8
B. Readiness subindex ...............................................107 ....3.73rd pillar: Infrastructure and digital content ...................... 100 .....3.14th pillar: Affordability ...................................................... 109 .....3.65th pillar: Skills ................................................................... 86 .....4.5
C. Usage subindex ........................................................99 ....3.26th pillar: Individual usage .................................................. 98 .....2.67th pillar: Business usage .................................................. 96 .....3.28th pillar: Government usage ............................................. 91 .....3.8
D. Impact subindex .....................................................105 ....3.09th pillar: Economic impacts ............................................ 114 .....2.710th pillar: Social impacts ................................................ 103 .....3.2
Botswana3: Country/Economy Profiles
156 | The Global Information Technology Report 2013
Note: Indicators followed by an asterisk (*) are measured on a 1-to-7 (best) scale. For further details and explanation, please refer to the section “How to Read the Country/Economy Profiles” on page 139.
Botswana Upper-middle-income group average
1. Political and regulatory environment
6. Individual usage
5. Skills7. Business usage
4. Affordability8. Governmentusage
3. Infrastructure anddigital content
9. Economicimpacts
2. Business and innovation environment
10. Socialimpacts
1
2
3
4
5
6
7
@ 2013 World Economic Forum

The Networked Readiness Index in detailINDICATOR RANK /144 VALUE
1st pillar: Political and regulatory environment1.01 Effectiveness of law-making bodies* ................120 ......... 2.71.02 Laws relating to ICTs* ........................................47 ......... 4.41.03 Judicial independence* ......................................71 ......... 3.81.04 Efficiency of legal system in settling disputes* ....84 ......... 3.51.05 Efficiency of legal system in challenging regs* ....61 ......... 3.81.06 Intellectual property protection* ..........................75 ......... 3.51.07 Software piracy rate, % software installed ..........40 .......... 531.08 No. procedures to enforce a contract ..............124 .......... 441.09 No. days to enforce a contract ........................111 ........ 731
2nd pillar: Business and innovation environment2.01 Availability of latest technologies* .......................50 ......... 5.32.02 Venture capital availability* .................................51 ......... 2.82.03 Total tax rate, % profits ....................................136 ....... 69.32.04 No. days to start a business ............................141 ........ 1192.05 No. procedures to start a business ..................132 .......... 132.06 Intensity of local competition* .............................45 ......... 5.12.07 Tertiary education gross enrollment rate, % ........83 ....... 25.62.08 Quality of management schools* ........................52 ......... 4.42.09 Gov’t procurement of advanced tech* ...............53 ......... 3.8
3rd pillar: Infrastructure and digital content3.01 Electricity production, kWh/capita ......................73 .. 2,413.83.02 Mobile network coverage, % pop ......................24 ..... 100.03.03 Int’l Internet bandwidth, kb/s per user................47 ....... 28.03.04 Secure Internet servers/million pop ....................58 ....... 54.23.05 Accessibility of digital content* ...........................82 ......... 4.9
4th pillar: Affordability 4.01 Mobile cellular tariffs, PPP $/min. .....................130 ....... 0.684.02 Fixed broadband Internet tariffs, PPP $/month ..11 ..... 16.584.03 Internet & telephony competition, 0–2 (best) ........1 ....... 2.00
5th pillar: Skills5.01 Quality of educational system* .........................116 ......... 3.05.02 Quality of math & science education* ...............132 ......... 2.65.03 Secondary education gross enrollment rate, % ..19 ..... 105.85.04 Adult literacy rate, % ..........................................85 ....... 90.3
INDICATOR RANK /144 VALUE
6th pillar: Individual usage 6.01 Mobile phone subscriptions/100 pop. ................40 ..... 124.3 6.02 Individuals using Internet, %...............................62 ....... 45.0 6.03 Households w/ personal computer, % ...............64 ....... 45.4 6.04 Households w/ Internet access, % ....................59 ....... 37.8 6.05 Broadband Internet subscriptions/100 pop. .......63 ......... 8.6 6.06 Mobile broadband subscriptions/100 pop. .........53 ....... 20.9 6.07 Use of virtual social networks* ...........................47 ......... 5.8
7th pillar: Business usage 7.01 Firm-level technology absorption* ......................47 ......... 5.2 7.02 Capacity for innovation* .....................................34 ......... 3.7 7.03 PCT patents, applications/million pop. ..............50 ......... 2.8 7.04 Business-to-business Internet use* ....................40 ......... 5.5 7.05 Business-to-consumer Internet use* ..................28 ......... 5.3 7.06 Extent of staff training* .......................................33 ......... 4.4
8th pillar: Government usage 8.01 Importance of ICTs to gov’t vision* .....................80 ......... 3.9 8.02 Government Online Service Index, 0–1 (best) .....32 ....... 0.67 8.03 Gov’t success in ICT promotion* ........................81 ......... 4.2
9th pillar: Economic impacts 9.01 Impact of ICTs on new services and products* ..34 ......... 5.0 9.02 ICT PCT patents, applications/million pop. .......56 ......... 0.4 9.03 Impact of ICTs on new organizational models* ...34 ......... 4.7 9.04 Knowledge-intensive jobs, % workforce .............75 ....... 19.3
10th pillar: Social impacts 10.01 Impact of ICTs on access to basic services* ......68 ......... 4.2 10.02 Internet access in schools* ................................88 ......... 3.7 10.03 ICT use & gov’t efficiency* .................................53 ......... 4.4 10.04 E-Participation Index, 0–1 (best).........................31 ....... 0.50
Rank Score (out of 144) (1–7)
Networked Readiness Index 2013 ..............60 ..4.0Networked Readiness Index 2012 (out of 142) ...................... 65 .....3.9
A. Environment subindex ............................................107 ....3.51st pillar: Political and regulatory environment ................... 78 .....3.62nd pillar: Business and innovation environment ............. 126 .....3.4
B. Readiness subindex .................................................74 ....4.53rd pillar: Infrastructure and digital content ........................ 62 .....4.24th pillar: Affordability ........................................................ 76 .....5.05th pillar: Skills ................................................................... 91 .....4.4
C. Usage subindex ........................................................44 ....4.16th pillar: Individual usage .................................................. 58 .....4.07th pillar: Business usage .................................................. 34 .....3.98th pillar: Government usage ............................................. 48 .....4.4
D. Impact subindex .......................................................50 ....3.79th pillar: Economic impacts .............................................. 50 .....3.410th pillar: Social impacts .................................................. 48 .....4.1
Brazil3: Country/Economy Profiles
The Global Information Technology Report 2013 | 157
Note: Indicators followed by an asterisk (*) are measured on a 1-to-7 (best) scale. For further details and explanation, please refer to the section “How to Read the Country/Economy Profiles” on page 139.
Brazil Upper-middle-income group average
1. Political and regulatory environment
6. Individual usage
5. Skills7. Business usage
4. Affordability8. Governmentusage
3. Infrastructure anddigital content
9. Economicimpacts
2. Business and innovation environment
10. Socialimpacts
1
2
3
4
5
6
7
@ 2013 World Economic Forum

The Networked Readiness Index in detailINDICATOR RANK /144 VALUE
1st pillar: Political and regulatory environment1.01 Effectiveness of law-making bodies* ..................24 ......... 4.71.02 Laws relating to ICTs* ........................................61 ......... 4.11.03 Judicial independence* ......................................33 ......... 5.11.04 Efficiency of legal system in settling disputes* ....34 ......... 4.51.05 Efficiency of legal system in challenging regs* ....49 ......... 4.01.06 Intellectual property protection* ..........................47 ......... 4.01.07 Software piracy rate, % software installed ..........65 .......... 671.08 No. procedures to enforce a contract ..............134 .......... 471.09 No. days to enforce a contract ..........................75 ........ 540
2nd pillar: Business and innovation environment2.01 Availability of latest technologies* .......................65 ......... 5.02.02 Venture capital availability* .................................35 ......... 3.12.03 Total tax rate, % profits ......................................11 ....... 16.82.04 No. days to start a business ............................139 ........ 1012.05 No. procedures to start a business ..................139 .......... 152.06 Intensity of local competition* .............................71 ......... 4.82.07 Tertiary education gross enrollment rate, % ........91 ....... 19.62.08 Quality of management schools* ........................58 ......... 4.32.09 Gov’t procurement of advanced tech* ...............18 ......... 4.4
3rd pillar: Infrastructure and digital content3.01 Electricity production, kWh/capita ......................16 .. 9,218.13.02 Mobile network coverage, % pop .....................n/a ......... n/a3.03 Int’l Internet bandwidth, kb/s per user................59 ....... 22.03.04 Secure Internet servers/million pop ....................50 ..... 113.33.05 Accessibility of digital content* ...........................46 ......... 5.4
4th pillar: Affordability4.01 Mobile cellular tariffs, PPP $/min. .....................110 ....... 0.454.02 Fixed broadband Internet tariffs, PPP $/month 120 ..... 81.204.03 Internet & telephony competition, 0–2 (best) ....131 ....... 0.78
5th pillar: Skills5.01 Quality of educational system* ...........................25 ......... 4.75.02 Quality of math & science education* .................23 ......... 4.95.03 Secondary education gross enrollment rate, % ....9 ..... 111.85.04 Adult literacy rate, % ..........................................62 ....... 95.2
INDICATOR RANK /144 VALUE
6th pillar: Individual usage 6.01 Mobile phone subscriptions/100 pop. ................62 ..... 109.2 6.02 Individuals using Internet, %...............................47 ....... 56.0 6.03 Households w/ personal computer, % ...............21 ....... 79.6 6.04 Households w/ Internet access, % ....................35 ....... 65.0 6.05 Broadband Internet subscriptions/100 pop. .......72 ......... 5.7 6.06 Mobile broadband subscriptions/100 pop. .........83 ......... 6.3 6.07 Use of virtual social networks* ...........................22 ......... 6.1
7th pillar: Business usage 7.01 Firm-level technology absorption* ......................62 ......... 4.9 7.02 Capacity for innovation* .....................................68 ......... 3.2 7.03 PCT patents, applications/million pop. ..............49 ......... 3.1 7.04 Business-to-business Internet use* ....................55 ......... 5.2 7.05 Business-to-consumer Internet use* ..................61 ......... 4.7 7.06 Extent of staff training* .......................................52 ......... 4.1
8th pillar: Government usage 8.01 Importance of ICTs to gov’t vision* .....................29 ......... 4.7 8.02 Government Online Service Index, 0–1 (best) .....44 ....... 0.59 8.03 Gov’t success in ICT promotion* ........................31 ......... 5.0
9th pillar: Economic impacts 9.01 Impact of ICTs on new services and products* ..71 ......... 4.4 9.02 ICT PCT patents, applications/million pop. .......40 ......... 1.3 9.03 Impact of ICTs on new organizational models* ...57 ......... 4.3 9.04 Knowledge-intensive jobs, % workforce .............47 ....... 28.4
10th pillar: Social impacts 10.01 Impact of ICTs on access to basic services* ......32 ......... 5.1 10.02 Internet access in schools* ................................34 ......... 5.3 10.03 ICT use & gov’t efficiency* .................................45 ......... 4.6 10.04 E-Participation Index, 0–1 (best).........................34 ....... 0.47
Rank Score (out of 144) (1–7)
Networked Readiness Index 2013 ..............57 ..4.1Networked Readiness Index 2012 (out of 142) ...................... 54 .....4.0
A. Environment subindex ..............................................57 ....4.11st pillar: Political and regulatory environment ................... 45 .....4.12nd pillar: Business and innovation environment ............... 77 .....4.1
B. Readiness subindex .................................................94 ....4.13rd pillar: Infrastructure and digital content ........................ 50 .....4.54th pillar: Affordability ...................................................... 135 .....2.35th pillar: Skills ................................................................... 31 .....5.4
C. Usage subindex ........................................................41 ....4.26th pillar: Individual usage .................................................. 49 .....4.37th pillar: Business usage .................................................. 59 .....3.68th pillar: Government usage ............................................. 33 .....4.7
D. Impact subindex .......................................................39 ....4.19th pillar: Economic impacts .............................................. 48 .....3.410th pillar: Social impacts .................................................. 35 .....4.7
Brunei Darussalam3: Country/Economy Profiles
158 | The Global Information Technology Report 2013
Note: Indicators followed by an asterisk (*) are measured on a 1-to-7 (best) scale. For further details and explanation, please refer to the section “How to Read the Country/Economy Profiles” on page 139.
Brunei Darussalam High-income group average
1. Political and regulatory environment
6. Individual usage
5. Skills7. Business usage
4. Affordability8. Governmentusage
3. Infrastructure anddigital content
9. Economicimpacts
2. Business and innovation environment
10. Socialimpacts
1
2
3
4
5
6
7
@ 2013 World Economic Forum

The Networked Readiness Index in detailINDICATOR RANK /144 VALUE
1st pillar: Political and regulatory environment1.01 Effectiveness of law-making bodies* ................111 ......... 2.91.02 Laws relating to ICTs* ........................................70 ......... 4.01.03 Judicial independence* ....................................102 ......... 2.91.04 Efficiency of legal system in settling disputes* ..122 ......... 2.81.05 Efficiency of legal system in challenging regs* ..114 ......... 2.91.06 Intellectual property protection* ........................105 ......... 3.01.07 Software piracy rate, % software installed ..........61 .......... 641.08 No. procedures to enforce a contract ................90 .......... 391.09 No. days to enforce a contract ..........................79 ........ 564
2nd pillar: Business and innovation environment2.01 Availability of latest technologies* .......................98 ......... 4.52.02 Venture capital availability* .................................58 ......... 2.82.03 Total tax rate, % profits ......................................34 ....... 28.72.04 No. days to start a business ..............................77 .......... 182.05 No. procedures to start a business ....................20 ............ 42.06 Intensity of local competition* ...........................101 ......... 4.32.07 Tertiary education gross enrollment rate, % ........43 ....... 56.92.08 Quality of management schools* ......................101 ......... 3.72.09 Gov’t procurement of advanced tech* ...............81 ......... 3.4
3rd pillar: Infrastructure and digital content3.01 Electricity production, kWh/capita ......................38 .. 5,587.63.02 Mobile network coverage, % pop ......................24 ..... 100.03.03 Int’l Internet bandwidth, kb/s per user................23 ....... 70.63.04 Secure Internet servers/million pop ....................46 ..... 139.13.05 Accessibility of digital content* ...........................72 ......... 5.0
4th pillar: Affordability4.01 Mobile cellular tariffs, PPP $/min. .....................133 ....... 0.784.02 Fixed broadband Internet tariffs, PPP $/month ..52 ..... 29.024.03 Internet & telephony competition, 0–2 (best) ....103 ....... 1.36
5th pillar: Skills5.01 Quality of educational system* ...........................98 ......... 3.25.02 Quality of math & science education* .................68 ......... 4.05.03 Secondary education gross enrollment rate, % ..72 ....... 88.95.04 Adult literacy rate, % ..........................................44 ....... 98.4
INDICATOR RANK /144 VALUE
6th pillar: Individual usage 6.01 Mobile phone subscriptions/100 pop. ................22 ..... 140.7 6.02 Individuals using Internet, %...............................54 ....... 51.0 6.03 Households w/ personal computer, % ...............61 ....... 46.8 6.04 Households w/ Internet access, % ....................54 ....... 45.0 6.05 Broadband Internet subscriptions/100 pop. .......38 ....... 16.4 6.06 Mobile broadband subscriptions/100 pop. .........42 ....... 29.9 6.07 Use of virtual social networks* ...........................82 ......... 5.3
7th pillar: Business usage 7.01 Firm-level technology absorption* ....................125 ......... 4.0 7.02 Capacity for innovation* .....................................64 ......... 3.2 7.03 PCT patents, applications/million pop. ..............47 ......... 3.6 7.04 Business-to-business Internet use* ....................96 ......... 4.6 7.05 Business-to-consumer Internet use* ..................64 ......... 4.6 7.06 Extent of staff training* .....................................118 ......... 3.3
8th pillar: Government usage 8.01 Importance of ICTs to gov’t vision* ...................108 ......... 3.4 8.02 Government Online Service Index, 0–1 (best) .....70 ....... 0.49 8.03 Gov’t success in ICT promotion* ......................102 ......... 3.9
9th pillar: Economic impacts 9.01 Impact of ICTs on new services and products* ..96 ......... 4.1 9.02 ICT PCT patents, applications/million pop. .......43 ......... 0.9 9.03 Impact of ICTs on new organizational models* ...94 ......... 3.8 9.04 Knowledge-intensive jobs, % workforce .............46 ....... 28.6
10th pillar: Social impacts 10.01 Impact of ICTs on access to basic services* ......88 ......... 4.0 10.02 Internet access in schools* ................................50 ......... 4.7 10.03 ICT use & gov’t efficiency* .................................98 ......... 3.8 10.04 E-Participation Index, 0–1 (best).......................111 ....... 0.03
Rank Score (out of 144) (1–7)
Networked Readiness Index 2013 ..............71 ..3.9Networked Readiness Index 2012 (out of 142) ...................... 70 .....3.9
A. Environment subindex ..............................................68 ....3.91st pillar: Political and regulatory environment ................. 101 .....3.32nd pillar: Business and innovation environment ............... 48 .....4.5
B. Readiness subindex .................................................75 ....4.53rd pillar: Infrastructure and digital content ........................ 37 .....5.04th pillar: Affordability ...................................................... 106 .....3.85th pillar: Skills ................................................................... 70 .....4.8
C. Usage subindex ........................................................63 ....3.76th pillar: Individual usage .................................................. 48 .....4.37th pillar: Business usage ................................................ 101 .....3.28th pillar: Government usage ............................................. 98 .....3.7
D. Impact subindex .......................................................87 ....3.39th pillar: Economic impacts .............................................. 75 .....3.210th pillar: Social impacts .................................................. 89 .....3.4
Bulgaria3: Country/Economy Profiles
The Global Information Technology Report 2013 | 159
Note: Indicators followed by an asterisk (*) are measured on a 1-to-7 (best) scale. For further details and explanation, please refer to the section “How to Read the Country/Economy Profiles” on page 139.
Bulgaria Upper-middle-income group average
1. Political and regulatory environment
6. Individual usage
5. Skills7. Business usage
4. Affordability8. Governmentusage
3. Infrastructure anddigital content
9. Economicimpacts
2. Business and innovation environment
10. Socialimpacts
1
2
3
4
5
6
7
@ 2013 World Economic Forum

The Networked Readiness Index in detailINDICATOR RANK /144 VALUE
1st pillar: Political and regulatory environment1.01 Effectiveness of law-making bodies* ..................86 ......... 3.31.02 Laws relating to ICTs* ......................................111 ......... 3.21.03 Judicial independence* ....................................126 ......... 2.51.04 Efficiency of legal system in settling disputes* ....78 ......... 3.61.05 Efficiency of legal system in challenging regs* ....81 ......... 3.51.06 Intellectual property protection* ..........................71 ......... 3.61.07 Software piracy rate, % software installed .........n/a ......... n/a1.08 No. procedures to enforce a contract ................68 .......... 371.09 No. days to enforce a contract ..........................51 ........ 446
2nd pillar: Business and innovation environment2.01 Availability of latest technologies* .....................138 ......... 3.62.02 Venture capital availability* ...............................136 ......... 1.82.03 Total tax rate, % profits ......................................93 ....... 43.62.04 No. days to start a business ..............................62 .......... 132.05 No. procedures to start a business ....................10 ............ 32.06 Intensity of local competition* ...........................105 ......... 4.32.07 Tertiary education gross enrollment rate, % ......132 ......... 3.92.08 Quality of management schools* ......................105 ......... 3.72.09 Gov’t procurement of advanced tech* ...............88 ......... 3.4
3rd pillar: Infrastructure and digital content3.01 Electricity production, kWh/capita ....................138 ....... 41.63.02 Mobile network coverage, % pop ....................131 ....... 61.13.03 Int’l Internet bandwidth, kb/s per user..............124 ......... 2.23.04 Secure Internet servers/million pop ..................134 ......... 0.63.05 Accessibility of digital content* .........................136 ......... 3.3
4th pillar: Affordability4.01 Mobile cellular tariffs, PPP $/min. .......................84 ....... 0.354.02 Fixed broadband Internet tariffs, PPP $/month 130 ... 120.004.03 Internet & telephony competition, 0–2 (best) ....132 ....... 0.75
5th pillar: Skills5.01 Quality of educational system* .........................124 ......... 2.85.02 Quality of math & science education* .................80 ......... 3.85.03 Secondary education gross enrollment rate, % 143 ....... 22.65.04 Adult literacy rate, % ........................................141 ....... 28.7
INDICATOR RANK /144 VALUE
6th pillar: Individual usage 6.01 Mobile phone subscriptions/100 pop. ..............133 ....... 45.3 6.02 Individuals using Internet, %.............................134 ......... 3.0 6.03 Households w/ personal computer, % .............134 ......... 2.1 6.04 Households w/ Internet access, % ..................122 ......... 2.0 6.05 Broadband Internet subscriptions/100 pop. .....124 ......... 0.1 6.06 Mobile broadband subscriptions/100 pop. .......126 ......... 0.0 6.07 Use of virtual social networks* .........................135 ......... 4.1
7th pillar: Business usage 7.01 Firm-level technology absorption* ....................118 ......... 4.1 7.02 Capacity for innovation* ...................................135 ......... 2.3 7.03 PCT patents, applications/million pop. ............113 ......... 0.0 7.04 Business-to-business Internet use* ..................115 ......... 4.3 7.05 Business-to-consumer Internet use* ................118 ......... 3.6 7.06 Extent of staff training* .....................................137 ......... 2.9
8th pillar: Government usage 8.01 Importance of ICTs to gov’t vision* .....................86 ......... 3.7 8.02 Government Online Service Index, 0–1 (best) ...117 ....... 0.29 8.03 Gov’t success in ICT promotion* ........................36 ......... 4.9
9th pillar: Economic impacts 9.01 Impact of ICTs on new services and products* 107 ......... 3.8 9.02 ICT PCT patents, applications/million pop. .......95 ......... 0.0 9.03 Impact of ICTs on new organizational models* .128 ......... 3.2 9.04 Knowledge-intensive jobs, % workforce ............n/a ......... n/a
10th pillar: Social impacts 10.01 Impact of ICTs on access to basic services* ....126 ......... 3.2 10.02 Internet access in schools* ..............................141 ......... 1.7 10.03 ICT use & gov’t efficiency* .................................79 ......... 4.1 10.04 E-Participation Index, 0–1 (best).........................76 ....... 0.16
Rank Score (out of 144) (1–7)
Networked Readiness Index 2013 ............130 ..2.8Networked Readiness Index 2012 (out of 142) .................... 135 .....2.7
A. Environment subindex ............................................110 ....3.51st pillar: Political and regulatory environment ................... 88 .....3.52nd pillar: Business and innovation environment ............. 122 .....3.5
B. Readiness subindex ...............................................142 ....2.33rd pillar: Infrastructure and digital content ...................... 136 .....1.84th pillar: Affordability ...................................................... 129 .....2.65th pillar: Skills ................................................................. 142 .....2.4
C. Usage subindex ......................................................126 ....2.76th pillar: Individual usage ................................................ 140 .....1.57th pillar: Business usage ................................................ 131 .....2.88th pillar: Government usage ............................................. 92 .....3.8
D. Impact subindex .....................................................125 ....2.79th pillar: Economic impacts ............................................ 118 .....2.710th pillar: Social impacts ................................................ 124 .....2.7
Burkina Faso3: Country/Economy Profiles
160 | The Global Information Technology Report 2013
Note: Indicators followed by an asterisk (*) are measured on a 1-to-7 (best) scale. For further details and explanation, please refer to the section “How to Read the Country/Economy Profiles” on page 139.
Burkina Faso Low-income group average
1. Political and regulatory environment
6. Individual usage
5. Skills7. Business usage
4. Affordability8. Governmentusage
3. Infrastructure anddigital content
9. Economicimpacts
2. Business and innovation environment
10. Socialimpacts
1
2
3
4
5
6
7
@ 2013 World Economic Forum

The Networked Readiness Index in detailINDICATOR RANK /144 VALUE
1st pillar: Political and regulatory environment1.01 Effectiveness of law-making bodies* ................133 ......... 2.31.02 Laws relating to ICTs* ......................................144 ......... 2.01.03 Judicial independence* ....................................143 ......... 1.71.04 Efficiency of legal system in settling disputes* ..134 ......... 2.61.05 Efficiency of legal system in challenging regs* ..141 ......... 2.41.06 Intellectual property protection* ........................141 ......... 1.91.07 Software piracy rate, % software installed .........n/a ......... n/a1.08 No. procedures to enforce a contract ..............124 .......... 441.09 No. days to enforce a contract ........................120 ........ 832
2nd pillar: Business and innovation environment2.01 Availability of latest technologies* .....................144 ......... 3.22.02 Venture capital availability* ...............................143 ......... 1.62.03 Total tax rate, % profits ....................................118 ....... 53.02.04 No. days to start a business ..............................34 ............ 82.05 No. procedures to start a business ....................20 ............ 42.06 Intensity of local competition* ...........................140 ......... 3.52.07 Tertiary education gross enrollment rate, % ......134 ......... 3.22.08 Quality of management schools* ......................136 ......... 2.82.09 Gov’t procurement of advanced tech* .............139 ......... 2.4
3rd pillar: Infrastructure and digital content3.01 Electricity production, kWh/capita ....................142 ....... 15.53.02 Mobile network coverage, % pop ....................113 ....... 83.03.03 Int’l Internet bandwidth, kb/s per user..............125 ......... 1.93.04 Secure Internet servers/million pop ..................143 ......... 0.13.05 Accessibility of digital content* .........................142 ......... 2.8
4th pillar: Affordability4.01 Mobile cellular tariffs, PPP $/min. ......................n/a ......... n/a4.02 Fixed broadband Internet tariffs, PPP $/month .n/a ......... n/a4.03 Internet & telephony competition, 0–2 (best) ......95 ....... 1.54
5th pillar: Skills5.01 Quality of educational system* .........................143 ......... 2.05.02 Quality of math & science education* ...............112 ......... 3.25.03 Secondary education gross enrollment rate, % 137 ....... 28.05.04 Adult literacy rate, % ........................................118 ....... 67.2
INDICATOR RANK /144 VALUE
6th pillar: Individual usage 6.01 Mobile phone subscriptions/100 pop. ..............143 ....... 22.3 6.02 Individuals using Internet, %.............................141 ......... 1.1 6.03 Households w/ personal computer, % .............131 ......... 2.6 6.04 Households w/ Internet access, % ..................115 ......... 2.7 6.05 Broadband Internet subscriptions/100 pop. .....140 ......... 0.0 6.06 Mobile broadband subscriptions/100 pop. .......126 ......... 0.0 6.07 Use of virtual social networks* .........................143 ......... 3.3
7th pillar: Business usage 7.01 Firm-level technology absorption* ....................143 ......... 3.5 7.02 Capacity for innovation* ...................................144 ......... 1.8 7.03 PCT patents, applications/million pop. ............123 ......... 0.0 7.04 Business-to-business Internet use* ..................138 ......... 3.3 7.05 Business-to-consumer Internet use* ................137 ......... 2.7 7.06 Extent of staff training* .....................................143 ......... 2.4
8th pillar: Government usage 8.01 Importance of ICTs to gov’t vision* ...................135 ......... 2.7 8.02 Government Online Service Index, 0–1 (best) ...134 ....... 0.15 8.03 Gov’t success in ICT promotion* ......................138 ......... 2.8
9th pillar: Economic impacts 9.01 Impact of ICTs on new services and products* 139 ......... 3.0 9.02 ICT PCT patents, applications/million pop. .......95 ......... 0.0 9.03 Impact of ICTs on new organizational models* .142 ......... 2.7 9.04 Knowledge-intensive jobs, % workforce ............n/a ......... n/a
10th pillar: Social impacts 10.01 Impact of ICTs on access to basic services* ....144 ......... 2.4 10.02 Internet access in schools* ..............................143 ......... 1.5 10.03 ICT use & gov’t efficiency* ...............................140 ......... 2.6 10.04 E-Participation Index, 0–1 (best).......................124 ....... 0.00
Rank Score (out of 144) (1–7)
Networked Readiness Index 2013 ............144 ..2.3Networked Readiness Index 2012 (out of 142) .................... 137 .....2.6
A. Environment subindex ............................................142 ....2.61st pillar: Political and regulatory environment ................. 144 .....2.32nd pillar: Business and innovation environment ............. 139 .....3.0
B. Readiness subindex ...............................................138 ....2.53rd pillar: Infrastructure and digital content ...................... 128 .....2.24th pillar: Affordability ....................................................... n/a .....n/a5th pillar: Skills ................................................................. 134 .....2.8
C. Usage subindex ......................................................144 ....2.06th pillar: Individual usage ................................................ 144 .....1.37th pillar: Business usage ................................................ 143 .....2.38th pillar: Government usage ........................................... 142 .....2.5
D. Impact subindex .....................................................144 ....2.19th pillar: Economic impacts ............................................ 141 .....2.210th pillar: Social impacts ................................................ 144 .....1.9
Burundi3: Country/Economy Profiles
The Global Information Technology Report 2013 | 161
Note: Indicators followed by an asterisk (*) are measured on a 1-to-7 (best) scale. For further details and explanation, please refer to the section “How to Read the Country/Economy Profiles” on page 139.
Burundi Low-income group average
1. Political and regulatory environment
6. Individual usage
5. Skills7. Business usage
4. Affordability8. Governmentusage
3. Infrastructure anddigital content
9. Economicimpacts
2. Business and innovation environment
10. Socialimpacts
1
2
3
4
5
6
7
@ 2013 World Economic Forum

The Networked Readiness Index in detailINDICATOR RANK /144 VALUE
1st pillar: Political and regulatory environment1.01 Effectiveness of law-making bodies* ..................48 ......... 4.01.02 Laws relating to ICTs* ........................................89 ......... 3.71.03 Judicial independence* ......................................91 ......... 3.31.04 Efficiency of legal system in settling disputes* ....56 ......... 4.01.05 Efficiency of legal system in challenging regs* ....40 ......... 4.21.06 Intellectual property protection* ..........................85 ......... 3.31.07 Software piracy rate, % software installed .........n/a ......... n/a1.08 No. procedures to enforce a contract ..............124 .......... 441.09 No. days to enforce a contract ..........................34 ........ 401
2nd pillar: Business and innovation environment2.01 Availability of latest technologies* .......................79 ......... 4.82.02 Venture capital availability* .................................44 ......... 2.92.03 Total tax rate, % profits ......................................15 ....... 22.52.04 No. days to start a business ............................136 .......... 852.05 No. procedures to start a business ..................102 ............ 92.06 Intensity of local competition* .............................72 ......... 4.82.07 Tertiary education gross enrollment rate, % ......101 ....... 14.52.08 Quality of management schools* ........................96 ......... 3.82.09 Gov’t procurement of advanced tech* ...............24 ......... 4.1
3rd pillar: Infrastructure and digital content3.01 Electricity production, kWh/capita ....................133 ....... 86.33.02 Mobile network coverage, % pop ......................51 ....... 99.03.03 Int’l Internet bandwidth, kb/s per user................74 ....... 13.53.04 Secure Internet servers/million pop ..................110 ......... 2.53.05 Accessibility of digital content* ...........................92 ......... 4.6
4th pillar: Affordability4.01 Mobile cellular tariffs, PPP $/min. .......................51 ....... 0.204.02 Fixed broadband Internet tariffs, PPP $/month 119 ..... 78.724.03 Internet & telephony competition, 0–2 (best) ......65 ....... 1.88
5th pillar: Skills5.01 Quality of educational system* ...........................58 ......... 3.95.02 Quality of math & science education* .................90 ......... 3.75.03 Secondary education gross enrollment rate, % 119 ....... 46.65.04 Adult literacy rate, % ........................................109 ....... 73.9
INDICATOR RANK /144 VALUE
6th pillar: Individual usage 6.01 Mobile phone subscriptions/100 pop. ................92 ....... 96.2 6.02 Individuals using Internet, %.............................133 ......... 3.1 6.03 Households w/ personal computer, % .............120 ......... 4.3 6.04 Households w/ Internet access, % ..................136 ......... 0.2 6.05 Broadband Internet subscriptions/100 pop. .....120 ......... 0.2 6.06 Mobile broadband subscriptions/100 pop. .......100 ......... 2.2 6.07 Use of virtual social networks* .........................107 ......... 4.9
7th pillar: Business usage 7.01 Firm-level technology absorption* ......................61 ......... 4.9 7.02 Capacity for innovation* .....................................65 ......... 3.2 7.03 PCT patents, applications/million pop. ............123 ......... 0.0 7.04 Business-to-business Internet use* ....................87 ......... 4.7 7.05 Business-to-consumer Internet use* ..................94 ......... 4.1 7.06 Extent of staff training* .......................................74 ......... 3.9
8th pillar: Government usage 8.01 Importance of ICTs to gov’t vision* .....................55 ......... 4.2 8.02 Government Online Service Index, 0–1 (best) ...128 ....... 0.19 8.03 Gov’t success in ICT promotion* ........................47 ......... 4.7
9th pillar: Economic impacts 9.01 Impact of ICTs on new services and products* ..79 ......... 4.3 9.02 ICT PCT patents, applications/million pop. .......95 ......... 0.0 9.03 Impact of ICTs on new organizational models* ...75 ......... 4.1 9.04 Knowledge-intensive jobs, % workforce ...........108 ......... 2.5
10th pillar: Social impacts 10.01 Impact of ICTs on access to basic services* ......74 ......... 4.1 10.02 Internet access in schools* ................................83 ......... 3.8 10.03 ICT use & gov’t efficiency* .................................76 ......... 4.1 10.04 E-Participation Index, 0–1 (best).......................124 ....... 0.00
Rank Score (out of 144) (1–7)
Networked Readiness Index 2013 ............106 ..3.3Networked Readiness Index 2012 (out of 142) .................... 108 .....3.3
A. Environment subindex ..............................................79 ....3.81st pillar: Political and regulatory environment ................... 65 .....3.72nd pillar: Business and innovation environment ............... 91 .....3.9
B. Readiness subindex ...............................................111 ....3.53rd pillar: Infrastructure and digital content ........................ 87 .....3.34th pillar: Affordability ...................................................... 112 .....3.55th pillar: Skills ................................................................. 109 .....3.7
C. Usage subindex ......................................................104 ....3.16th pillar: Individual usage ................................................ 112 .....2.17th pillar: Business usage .................................................. 70 .....3.48th pillar: Government usage ........................................... 103 .....3.7
D. Impact subindex .....................................................107 ....2.99th pillar: Economic impacts ............................................ 124 .....2.610th pillar: Social impacts ................................................ 101 .....3.3
Cambodia3: Country/Economy Profiles
162 | The Global Information Technology Report 2013
Note: Indicators followed by an asterisk (*) are measured on a 1-to-7 (best) scale. For further details and explanation, please refer to the section “How to Read the Country/Economy Profiles” on page 139.
Cambodia Low-income group average
1. Political and regulatory environment
6. Individual usage
5. Skills7. Business usage
4. Affordability8. Governmentusage
3. Infrastructure anddigital content
9. Economicimpacts
2. Business and innovation environment
10. Socialimpacts
1
2
3
4
5
6
7
@ 2013 World Economic Forum

The Networked Readiness Index in detailINDICATOR RANK /144 VALUE
1st pillar: Political and regulatory environment1.01 Effectiveness of law-making bodies* ..................95 ......... 3.11.02 Laws relating to ICTs* ......................................119 ......... 3.11.03 Judicial independence* ....................................127 ......... 2.51.04 Efficiency of legal system in settling disputes* ....88 ......... 3.41.05 Efficiency of legal system in challenging regs* ....91 ......... 3.31.06 Intellectual property protection* ........................100 ......... 3.11.07 Software piracy rate, % software installed ..........92 .......... 831.08 No. procedures to enforce a contract ..............116 .......... 421.09 No. days to enforce a contract ........................118 ........ 800
2nd pillar: Business and innovation environment2.01 Availability of latest technologies* .....................123 ......... 4.02.02 Venture capital availability* ...............................108 ......... 2.22.03 Total tax rate, % profits ....................................109 ....... 49.12.04 No. days to start a business ..............................69 .......... 152.05 No. procedures to start a business ....................30 ............ 52.06 Intensity of local competition* .............................97 ......... 4.42.07 Tertiary education gross enrollment rate, % ......104 ....... 12.42.08 Quality of management schools* ........................46 ......... 4.52.09 Gov’t procurement of advanced tech* ...............43 ......... 3.9
3rd pillar: Infrastructure and digital content3.01 Electricity production, kWh/capita ....................117 ..... 299.43.02 Mobile network coverage, % pop ....................132 ....... 58.03.03 Int’l Internet bandwidth, kb/s per user..............140 ......... 0.33.04 Secure Internet servers/million pop ..................125 ......... 1.03.05 Accessibility of digital content* .........................127 ......... 3.6
4th pillar: Affordability4.01 Mobile cellular tariffs, PPP $/min. .......................88 ....... 0.364.02 Fixed broadband Internet tariffs, PPP $/month 129 ... 115.214.03 Internet & telephony competition, 0–2 (best) ....102 ....... 1.36
5th pillar: Skills5.01 Quality of educational system* ...........................66 ......... 3.75.02 Quality of math & science education* .................75 ......... 3.95.03 Secondary education gross enrollment rate, % 118 ....... 51.35.04 Adult literacy rate, % ........................................116 ....... 70.7
INDICATOR RANK /144 VALUE
6th pillar: Individual usage 6.01 Mobile phone subscriptions/100 pop. ..............129 ....... 52.4 6.02 Individuals using Internet, %.............................126 ......... 5.0 6.03 Households w/ personal computer, % .............117 ......... 5.4 6.04 Households w/ Internet access, % ..................126 ......... 1.3 6.05 Broadband Internet subscriptions/100 pop. .....138 ......... 0.0 6.06 Mobile broadband subscriptions/100 pop. .......126 ......... 0.0 6.07 Use of virtual social networks* .........................119 ......... 4.7
7th pillar: Business usage 7.01 Firm-level technology absorption* ....................113 ......... 4.2 7.02 Capacity for innovation* ...................................110 ......... 2.7 7.03 PCT patents, applications/million pop. ..............85 ......... 0.2 7.04 Business-to-business Internet use* ....................53 ......... 5.2 7.05 Business-to-consumer Internet use* ................101 ......... 3.9 7.06 Extent of staff training* .......................................83 ......... 3.8
8th pillar: Government usage 8.01 Importance of ICTs to gov’t vision* .....................83 ......... 3.8 8.02 Government Online Service Index, 0–1 (best) ...113 ....... 0.30 8.03 Gov’t success in ICT promotion* ........................65 ......... 4.5
9th pillar: Economic impacts 9.01 Impact of ICTs on new services and products* 101 ......... 3.9 9.02 ICT PCT patents, applications/million pop. .......71 ......... 0.1 9.03 Impact of ICTs on new organizational models* .108 ......... 3.6 9.04 Knowledge-intensive jobs, % workforce ............n/a ......... n/a
10th pillar: Social impacts 10.01 Impact of ICTs on access to basic services* ....119 ......... 3.4 10.02 Internet access in schools* ..............................130 ......... 2.4 10.03 ICT use & gov’t efficiency* .................................91 ......... 3.9 10.04 E-Participation Index, 0–1 (best).......................111 ....... 0.03
Rank Score (out of 144) (1–7)
Networked Readiness Index 2013 ............124 ..2.9Networked Readiness Index 2012 (out of 142) .................... 125 .....2.9
A. Environment subindex ............................................119 ....3.41st pillar: Political and regulatory environment ................. 126 .....3.02nd pillar: Business and innovation environment ............. 107 .....3.8
B. Readiness subindex ...............................................131 ....2.83rd pillar: Infrastructure and digital content ...................... 137 .....1.84th pillar: Affordability ...................................................... 125 .....2.85th pillar: Skills ................................................................. 103 .....3.9
C. Usage subindex ......................................................119 ....2.96th pillar: Individual usage ................................................ 130 .....1.77th pillar: Business usage .................................................. 98 .....3.28th pillar: Government usage ........................................... 101 .....3.7
D. Impact subindex .....................................................119 ....2.89th pillar: Economic impacts ............................................ 104 .....2.810th pillar: Social impacts ................................................ 126 .....2.7
Cameroon3: Country/Economy Profiles
The Global Information Technology Report 2013 | 163
Note: Indicators followed by an asterisk (*) are measured on a 1-to-7 (best) scale. For further details and explanation, please refer to the section “How to Read the Country/Economy Profiles” on page 139.
Cameroon Lower-middle-income group average
1. Political and regulatory environment
6. Individual usage
5. Skills7. Business usage
4. Affordability8. Governmentusage
3. Infrastructure anddigital content
9. Economicimpacts
2. Business and innovation environment
10. Socialimpacts
1
2
3
4
5
6
7
@ 2013 World Economic Forum

The Networked Readiness Index in detailINDICATOR RANK /144 VALUE
1st pillar: Political and regulatory environment1.01 Effectiveness of law-making bodies* ....................6 ......... 5.31.02 Laws relating to ICTs* ........................................22 ......... 5.21.03 Judicial independence* ........................................5 ......... 6.31.04 Efficiency of legal system in settling disputes* ......9 ......... 5.41.05 Efficiency of legal system in challenging regs* ....12 ......... 5.11.06 Intellectual property protection* ..........................17 ......... 5.41.07 Software piracy rate, % software installed ..........14 .......... 271.08 No. procedures to enforce a contract ................56 .......... 361.09 No. days to enforce a contract ..........................82 ........ 570
2nd pillar: Business and innovation environment2.01 Availability of latest technologies* .......................18 ......... 6.32.02 Venture capital availability* .................................20 ......... 3.62.03 Total tax rate, % profits ......................................25 ....... 26.92.04 No. days to start a business ..............................10 ............ 52.05 No. procedures to start a business ......................1 ............ 12.06 Intensity of local competition* .............................19 ......... 5.62.07 Tertiary education gross enrollment rate, % ........37 ....... 60.02.08 Quality of management schools* ..........................5 ......... 5.72.09 Gov’t procurement of advanced tech* ...............47 ......... 3.8
3rd pillar: Infrastructure and digital content3.01 Electricity production, kWh/capita ........................4 17,522.83.02 Mobile network coverage, % pop ......................51 ....... 99.03.03 Int’l Internet bandwidth, kb/s per user................24 ....... 70.23.04 Secure Internet servers/million pop ....................15 .. 1,368.63.05 Accessibility of digital content* ...........................16 ......... 6.2
4th pillar: Affordability4.01 Mobile cellular tariffs, PPP $/min. .......................92 ....... 0.374.02 Fixed broadband Internet tariffs, PPP $/month ..37 ..... 24.714.03 Internet & telephony competition, 0–2 (best) ........1 ....... 2.00
5th pillar: Skills5.01 Quality of educational system* .............................6 ......... 5.45.02 Quality of math & science education* .................14 ......... 5.35.03 Secondary education gross enrollment rate, % ..29 ..... 101.55.04 Adult literacy rate, % ..........................................15 ....... 99.0
INDICATOR RANK /144 VALUE
6th pillar: Individual usage 6.01 Mobile phone subscriptions/100 pop. ..............109 ....... 79.7 6.02 Individuals using Internet, %...............................12 ....... 83.0 6.03 Households w/ personal computer, % ...............15 ....... 83.9 6.04 Households w/ Internet access, % ....................17 ....... 78.9 6.05 Broadband Internet subscriptions/100 pop. .......12 ....... 31.8 6.06 Mobile broadband subscriptions/100 pop. .........30 ....... 38.4 6.07 Use of virtual social networks* ...........................10 ......... 6.3
7th pillar: Business usage 7.01 Firm-level technology absorption* ......................30 ......... 5.6 7.02 Capacity for innovation* .....................................25 ......... 4.1 7.03 PCT patents, applications/million pop. ..............19 ....... 78.1 7.04 Business-to-business Internet use* ....................27 ......... 5.7 7.05 Business-to-consumer Internet use* ..................17 ......... 5.6 7.06 Extent of staff training* .......................................23 ......... 4.7
8th pillar: Government usage 8.01 Importance of ICTs to gov’t vision* .....................51 ......... 4.2 8.02 Government Online Service Index, 0–1 (best) .......6 ....... 0.89 8.03 Gov’t success in ICT promotion* ........................38 ......... 4.8
9th pillar: Economic impacts 9.01 Impact of ICTs on new services and products* ..23 ......... 5.3 9.02 ICT PCT patents, applications/million pop. .......15 ....... 29.7 9.03 Impact of ICTs on new organizational models* ...14 ......... 5.1 9.04 Knowledge-intensive jobs, % workforce .............14 ....... 42.4
10th pillar: Social impacts 10.01 Impact of ICTs on access to basic services* ......28 ......... 5.3 10.02 Internet access in schools* ................................13 ......... 6.1 10.03 ICT use & gov’t efficiency* .................................32 ......... 4.9 10.04 E-Participation Index, 0–1 (best).........................15 ....... 0.68
Rank Score (out of 144) (1–7)
Networked Readiness Index 2013 ..............12 ..5.4Networked Readiness Index 2012 (out of 142) ........................ 9 .....5.5
A. Environment subindex ..............................................10 ....5.41st pillar: Political and regulatory environment ................... 12 .....5.42nd pillar: Business and innovation environment ................. 3 .....5.5
B. Readiness subindex ...................................................5 ....6.23rd pillar: Infrastructure and digital content .......................... 5 .....6.84th pillar: Affordability ........................................................ 43 .....5.75th pillar: Skills ..................................................................... 6 .....6.0
C. Usage subindex ........................................................24 ....5.06th pillar: Individual usage .................................................. 27 .....5.47th pillar: Business usage .................................................. 24 .....4.58th pillar: Government usage ............................................. 22 .....5.1
D. Impact subindex .......................................................16 ....5.19th pillar: Economic impacts .............................................. 16 .....4.910th pillar: Social impacts .................................................. 17 .....5.3
Canada3: Country/Economy Profiles
164 | The Global Information Technology Report 2013
Note: Indicators followed by an asterisk (*) are measured on a 1-to-7 (best) scale. For further details and explanation, please refer to the section “How to Read the Country/Economy Profiles” on page 139.
Canada High-income group average
1. Political and regulatory environment
6. Individual usage
5. Skills7. Business usage
4. Affordability8. Governmentusage
3. Infrastructure anddigital content
9. Economicimpacts
2. Business and innovation environment
10. Socialimpacts
1
2
3
4
5
6
7
@ 2013 World Economic Forum
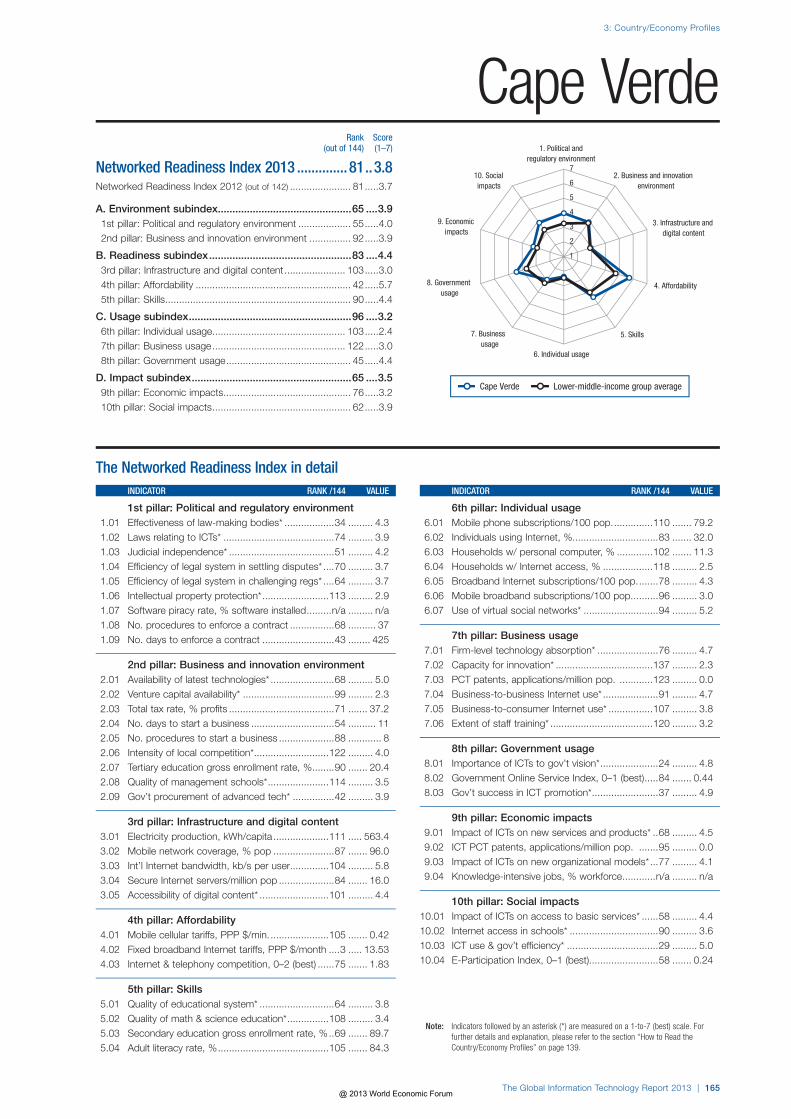
The Networked Readiness Index in detailINDICATOR RANK /144 VALUE
1st pillar: Political and regulatory environment1.01 Effectiveness of law-making bodies* ..................34 ......... 4.31.02 Laws relating to ICTs* ........................................74 ......... 3.91.03 Judicial independence* ......................................51 ......... 4.21.04 Efficiency of legal system in settling disputes* ....70 ......... 3.71.05 Efficiency of legal system in challenging regs* ....64 ......... 3.71.06 Intellectual property protection* ........................113 ......... 2.91.07 Software piracy rate, % software installed .........n/a ......... n/a1.08 No. procedures to enforce a contract ................68 .......... 371.09 No. days to enforce a contract ..........................43 ........ 425
2nd pillar: Business and innovation environment2.01 Availability of latest technologies* .......................68 ......... 5.02.02 Venture capital availability* .................................99 ......... 2.32.03 Total tax rate, % profits ......................................71 ....... 37.22.04 No. days to start a business ..............................54 .......... 112.05 No. procedures to start a business ....................88 ............ 82.06 Intensity of local competition* ...........................122 ......... 4.02.07 Tertiary education gross enrollment rate, % ........90 ....... 20.42.08 Quality of management schools* ......................114 ......... 3.52.09 Gov’t procurement of advanced tech* ...............42 ......... 3.9
3rd pillar: Infrastructure and digital content3.01 Electricity production, kWh/capita ....................111 ..... 563.43.02 Mobile network coverage, % pop ......................87 ....... 96.03.03 Int’l Internet bandwidth, kb/s per user..............104 ......... 5.83.04 Secure Internet servers/million pop ....................84 ....... 16.03.05 Accessibility of digital content* .........................101 ......... 4.4
4th pillar: Affordability4.01 Mobile cellular tariffs, PPP $/min. .....................105 ....... 0.424.02 Fixed broadband Internet tariffs, PPP $/month ....3 ..... 13.534.03 Internet & telephony competition, 0–2 (best) ......75 ....... 1.83
5th pillar: Skills5.01 Quality of educational system* ...........................64 ......... 3.85.02 Quality of math & science education* ...............108 ......... 3.45.03 Secondary education gross enrollment rate, % ..69 ....... 89.75.04 Adult literacy rate, % ........................................105 ....... 84.3
INDICATOR RANK /144 VALUE
6th pillar: Individual usage 6.01 Mobile phone subscriptions/100 pop. ..............110 ....... 79.2 6.02 Individuals using Internet, %...............................83 ....... 32.0 6.03 Households w/ personal computer, % .............102 ....... 11.3 6.04 Households w/ Internet access, % ..................118 ......... 2.5 6.05 Broadband Internet subscriptions/100 pop. .......78 ......... 4.3 6.06 Mobile broadband subscriptions/100 pop. .........96 ......... 3.0 6.07 Use of virtual social networks* ...........................94 ......... 5.2
7th pillar: Business usage 7.01 Firm-level technology absorption* ......................76 ......... 4.7 7.02 Capacity for innovation* ...................................137 ......... 2.3 7.03 PCT patents, applications/million pop. ............123 ......... 0.0 7.04 Business-to-business Internet use* ....................91 ......... 4.7 7.05 Business-to-consumer Internet use* ................107 ......... 3.8 7.06 Extent of staff training* .....................................120 ......... 3.2
8th pillar: Government usage 8.01 Importance of ICTs to gov’t vision* .....................24 ......... 4.8 8.02 Government Online Service Index, 0–1 (best) .....84 ....... 0.44 8.03 Gov’t success in ICT promotion* ........................37 ......... 4.9
9th pillar: Economic impacts 9.01 Impact of ICTs on new services and products* ..68 ......... 4.5 9.02 ICT PCT patents, applications/million pop. .......95 ......... 0.0 9.03 Impact of ICTs on new organizational models* ...77 ......... 4.1 9.04 Knowledge-intensive jobs, % workforce ............n/a ......... n/a
10th pillar: Social impacts 10.01 Impact of ICTs on access to basic services* ......58 ......... 4.4 10.02 Internet access in schools* ................................90 ......... 3.6 10.03 ICT use & gov’t efficiency* .................................29 ......... 5.0 10.04 E-Participation Index, 0–1 (best).........................58 ....... 0.24
Rank Score (out of 144) (1–7)
Networked Readiness Index 2013 ..............81 ..3.8Networked Readiness Index 2012 (out of 142) ...................... 81 .....3.7
A. Environment subindex ..............................................65 ....3.91st pillar: Political and regulatory environment ................... 55 .....4.02nd pillar: Business and innovation environment ............... 92 .....3.9
B. Readiness subindex .................................................83 ....4.43rd pillar: Infrastructure and digital content ...................... 103 .....3.04th pillar: Affordability ........................................................ 42 .....5.75th pillar: Skills ................................................................... 90 .....4.4
C. Usage subindex ........................................................96 ....3.26th pillar: Individual usage ................................................ 103 .....2.47th pillar: Business usage ................................................ 122 .....3.08th pillar: Government usage ............................................. 45 .....4.4
D. Impact subindex .......................................................65 ....3.59th pillar: Economic impacts .............................................. 76 .....3.210th pillar: Social impacts .................................................. 62 .....3.9
Cape Verde3: Country/Economy Profiles
The Global Information Technology Report 2013 | 165
Note: Indicators followed by an asterisk (*) are measured on a 1-to-7 (best) scale. For further details and explanation, please refer to the section “How to Read the Country/Economy Profiles” on page 139.
Cape Verde Lower-middle-income group average
1. Political and regulatory environment
6. Individual usage
5. Skills7. Business usage
4. Affordability8. Governmentusage
3. Infrastructure anddigital content
9. Economicimpacts
2. Business and innovation environment
10. Socialimpacts
1
2
3
4
5
6
7
@ 2013 World Economic Forum

The Networked Readiness Index in detailINDICATOR RANK /144 VALUE
1st pillar: Political and regulatory environment1.01 Effectiveness of law-making bodies* ................136 ......... 2.31.02 Laws relating to ICTs* ......................................137 ......... 2.41.03 Judicial independence* ....................................136 ......... 2.21.04 Efficiency of legal system in settling disputes* ..131 ......... 2.71.05 Efficiency of legal system in challenging regs* ..121 ......... 2.81.06 Intellectual property protection* ........................138 ......... 2.11.07 Software piracy rate, % software installed .........n/a ......... n/a1.08 No. procedures to enforce a contract ..............110 .......... 411.09 No. days to enforce a contract ........................113 ........ 743
2nd pillar: Business and innovation environment2.01 Availability of latest technologies* .....................143 ......... 3.3
2.02 Venture capital availability* ...............................124 ......... 2.0 2.03 Total tax rate, % profits ....................................129 ....... 65.4 2.04 No. days to start a business ............................134 .......... 62 2.05 No. procedures to start a business ..................102 ............ 9 2.06 Intensity of local competition* ...........................142 ......... 3.3 2.07 Tertiary education gross enrollment rate, % ......136 ......... 2.3 2.08 Quality of management schools* ......................128 ......... 3.2 2.09 Gov’t procurement of advanced tech* .............112 ......... 3.1
3rd pillar: Infrastructure and digital content 3.01 Electricity production, kWh/capita ....................144 ......... 8.7 3.02 Mobile network coverage, % pop ....................121 ....... 75.0 3.03 Int’l Internet bandwidth, kb/s per user..............141 ......... 0.2 3.04 Secure Internet servers/million pop ...................n/a ......... n/a 3.05 Accessibility of digital content* .........................141 ......... 2.9
4th pillar: Affordability 4.01 Mobile cellular tariffs, PPP $/min. .....................135 ....... 0.83 4.02 Fixed broadband Internet tariffs, PPP $/month ..35 ..... 23.24 4.03 Internet & telephony competition, 0–2 (best) ......97 ....... 1.50
5th pillar: Skills 5.01 Quality of educational system* .........................113 ......... 3.0 5.02 Quality of math & science education* ...............111 ......... 3.2 5.03 Secondary education gross enrollment rate, % 141 ....... 25.4 5.04 Adult literacy rate, % ........................................139 ....... 34.5
INDICATOR RANK /144 VALUE
6th pillar: Individual usage 6.01 Mobile phone subscriptions/100 pop. ..............141 ....... 31.8 6.02 Individuals using Internet, %.............................138 ......... 1.9 6.03 Households w/ personal computer, % .............143 ......... 0.4 6.04 Households w/ Internet access, % ..................139 ......... 0.1 6.05 Broadband Internet subscriptions/100 pop. .....142 ......... 0.0 6.06 Mobile broadband subscriptions/100 pop. .......126 ......... 0.0 6.07 Use of virtual social networks* .........................141 ......... 3.5
7th pillar: Business usage 7.01 Firm-level technology absorption* ....................137 ......... 3.7 7.02 Capacity for innovation* ...................................105 ......... 2.7 7.03 PCT patents, applications/million pop. ............107 ......... 0.0 7.04 Business-to-business Internet use* ..................137 ......... 3.5 7.05 Business-to-consumer Internet use* ................136 ......... 2.8 7.06 Extent of staff training* .....................................139 ......... 2.9
8th pillar: Government usage 8.01 Importance of ICTs to gov’t vision* .....................95 ......... 3.6 8.02 Government Online Service Index, 0–1 (best) ...137 ....... 0.10 8.03 Gov’t success in ICT promotion* ......................121 ......... 3.5
9th pillar: Economic impacts 9.01 Impact of ICTs on new services and products* 137 ......... 3.2 9.02 ICT PCT patents, applications/million pop. .......95 ......... 0.0 9.03 Impact of ICTs on new organizational models* .138 ......... 2.8 9.04 Knowledge-intensive jobs, % workforce ............n/a ......... n/a
10th pillar: Social impacts 10.01 Impact of ICTs on access to basic services* ....131 ......... 3.2 10.02 Internet access in schools* ..............................144 ......... 1.5 10.03 ICT use & gov’t efficiency* ...............................131 ......... 3.2 10.04 E-Participation Index, 0–1 (best).......................111 ....... 0.03
Rank Score (out of 144) (1–7)
Networked Readiness Index 2013 ............142 ..2.5Networked Readiness Index 2012 (out of 142) .................... 138 .....2.6
A. Environment subindex ............................................144 ....2.61st pillar: Political and regulatory environment ................. 139 .....2.62nd pillar: Business and innovation environment ............. 144 .....2.6
B. Readiness subindex ...............................................127 ....2.93rd pillar: Infrastructure and digital content ...................... 127 .....2.24th pillar: Affordability ........................................................ 98 .....4.15th pillar: Skills ................................................................. 141 .....2.4
C. Usage subindex ......................................................141 ....2.36th pillar: Individual usage ................................................ 142 .....1.47th pillar: Business usage ................................................ 134 .....2.88th pillar: Government usage ........................................... 136 .....2.9
D. Impact subindex .....................................................139 ....2.39th pillar: Economic impacts ............................................ 138 .....2.310th pillar: Social impacts ................................................ 139 .....2.3
Chad3: Country/Economy Profiles
166 | The Global Information Technology Report 2013
Note: Indicators followed by an asterisk (*) are measured on a 1-to-7 (best) scale. For further details and explanation, please refer to the section “How to Read the Country/Economy Profiles” on page 139.
Chad Low-income group average
1. Political and regulatory environment
6. Individual usage
5. Skills7. Business usage
4. Affordability8. Governmentusage
3. Infrastructure anddigital content
9. Economicimpacts
2. Business and innovation environment
10. Socialimpacts
1
2
3
4
5
6
7
@ 2013 World Economic Forum

The Networked Readiness Index in detailINDICATOR RANK /144 VALUE
1st pillar: Political and regulatory environment1.01 Effectiveness of law-making bodies* ..................52 ......... 3.91.02 Laws relating to ICTs* ........................................31 ......... 4.91.03 Judicial independence* ......................................24 ......... 5.31.04 Efficiency of legal system in settling disputes* ....23 ......... 4.81.05 Efficiency of legal system in challenging regs* ....21 ......... 4.61.06 Intellectual property protection* ..........................61 ......... 3.71.07 Software piracy rate, % software installed ..........53 .......... 611.08 No. procedures to enforce a contract ................56 .......... 361.09 No. days to enforce a contract ..........................58 ........ 480
2nd pillar: Business and innovation environment2.01 Availability of latest technologies* .......................32 ......... 5.92.02 Venture capital availability* .................................31 ......... 3.22.03 Total tax rate, % profits ......................................30 ....... 28.12.04 No. days to start a business ..............................34 ............ 82.05 No. procedures to start a business ....................74 ............ 72.06 Intensity of local competition* .............................39 ......... 5.3
2.07 Tertiary education gross enrollment rate, % ........25 ....... 66.12.08 Quality of management schools* ........................14 ......... 5.42.09 Gov’t procurement of advanced tech* ...............37 ......... 3.9
3rd pillar: Infrastructure and digital content3.01 Electricity production, kWh/capita ......................60 .. 3,649.33.02 Mobile network coverage, % pop ........................1 ..... 100.03.03 Int’l Internet bandwidth, kb/s per user................61 ....... 20.43.04 Secure Internet servers/million pop ....................56 ....... 67.53.05 Accessibility of digital content* ...........................55 ......... 5.2
4th pillar: Affordability 4.01 Mobile cellular tariffs, PPP $/min. .......................72 ....... 0.294.02 Fixed broadband Internet tariffs, PPP $/month ..39 ..... 24.844.03 Internet & telephony competition, 0–2 (best) ........1 ....... 2.00
5th pillar: Skills5.01 Quality of educational system* ...........................91 ......... 3.4
5.02 Quality of math & science education* ...............117 ......... 3.0 5.03 Secondary education gross enrollment rate, % ..70 ....... 89.45.04 Adult literacy rate, % ..........................................41 ....... 98.6
INDICATOR RANK /144 VALUE
6th pillar: Individual usage 6.01 Mobile phone subscriptions/100 pop. ................32 ..... 129.7 6.02 Individuals using Internet, %...............................50 ....... 53.9 6.03 Households w/ personal computer, % ...............60 ....... 46.8 6.04 Households w/ Internet access, % ....................64 ....... 35.0 6.05 Broadband Internet subscriptions/100 pop. .......49 ....... 11.6 6.06 Mobile broadband subscriptions/100 pop. .........59 ....... 18.0 6.07 Use of virtual social networks* ...........................31 ......... 6.0
7th pillar: Business usage 7.01 Firm-level technology absorption* ......................44 ......... 5.2 7.02 Capacity for innovation* .....................................83 ......... 3.0 7.03 PCT patents, applications/million pop. ..............44 ......... 5.5 7.04 Business-to-business Internet use* ....................38 ......... 5.5 7.05 Business-to-consumer Internet use* ..................31 ......... 5.2 7.06 Extent of staff training* .......................................38 ......... 4.3
8th pillar: Government usage 8.01 Importance of ICTs to gov’t vision* .....................30 ......... 4.6 8.02 Government Online Service Index, 0–1 (best) .....24 ....... 0.75 8.03 Gov’t success in ICT promotion* ........................57 ......... 4.6
9th pillar: Economic impacts 9.01 Impact of ICTs on new services and products* ..30 ......... 5.1 9.02 ICT PCT patents, applications/million pop. .......50 ......... 0.6 9.03 Impact of ICTs on new organizational models* ...35 ......... 4.7 9.04 Knowledge-intensive jobs, % workforce .............42 ....... 30.6
10th pillar: Social impacts 10.01 Impact of ICTs on access to basic services* ......35 ......... 5.0 10.02 Internet access in schools* ................................48 ......... 4.7 10.03 ICT use & gov’t efficiency* .................................18 ......... 5.2 10.04 E-Participation Index, 0–1 (best).........................19 ....... 0.66
Rank Score (out of 144) (1–7)
Networked Readiness Index 2013 ..............34 ..4.6Networked Readiness Index 2012 (out of 142) ...................... 39 .....4.4
A. Environment subindex ..............................................30 ....4.81st pillar: Political and regulatory environment ................... 38 .....4.42nd pillar: Business and innovation environment ............... 20 .....5.2
B. Readiness subindex .................................................49 ....5.03rd pillar: Infrastructure and digital content ........................ 61 .....4.24th pillar: Affordability ........................................................ 33 .....5.95th pillar: Skills ................................................................... 66 .....4.8
C. Usage subindex ........................................................40 ....4.26th pillar: Individual usage .................................................. 53 .....4.17th pillar: Business usage .................................................. 44 .....3.78th pillar: Government usage ............................................. 29 .....4.9
D. Impact subindex .......................................................34 ....4.39th pillar: Economic impacts .............................................. 35 .....3.710th pillar: Social impacts .................................................. 27 .....5.0
Chile3: Country/Economy Profiles
The Global Information Technology Report 2013 | 167
Note: Indicators followed by an asterisk (*) are measured on a 1-to-7 (best) scale. For further details and explanation, please refer to the section “How to Read the Country/Economy Profiles” on page 139.
Chile Upper-middle-income group average
1. Political and regulatory environment
6. Individual usage
5. Skills7. Business usage
4. Affordability8. Governmentusage
3. Infrastructure anddigital content
9. Economicimpacts
2. Business and innovation environment
10. Socialimpacts
1
2
3
4
5
6
7
@ 2013 World Economic Forum

The Networked Readiness Index in detailINDICATOR RANK /144 VALUE
1st pillar: Political and regulatory environment1.01 Effectiveness of law-making bodies* ..................33 ......... 4.31.02 Laws relating to ICTs* ........................................51 ......... 4.31.03 Judicial independence* ......................................66 ......... 3.91.04 Efficiency of legal system in settling disputes* ....44 ......... 4.21.05 Efficiency of legal system in challenging regs* ....53 ......... 3.91.06 Intellectual property protection* ..........................51 ......... 3.91.07 Software piracy rate, % software installed ..........79 .......... 771.08 No. procedures to enforce a contract ................68 .......... 371.09 No. days to enforce a contract ..........................35 ........ 406
2nd pillar: Business and innovation environment2.01 Availability of latest technologies* .....................107 ......... 4.42.02 Venture capital availability* .................................22 ......... 3.52.03 Total tax rate, % profits ....................................127 ....... 63.72.04 No. days to start a business ............................112 .......... 332.05 No. procedures to start a business ..................132 .......... 132.06 Intensity of local competition* .............................37 ......... 5.32.07 Tertiary education gross enrollment rate, % ........82 ....... 25.92.08 Quality of management schools* ........................68 ......... 4.22.09 Gov’t procurement of advanced tech* ...............16 ......... 4.4
3rd pillar: Infrastructure and digital content3.01 Electricity production, kWh/capita ......................69 .. 2,776.03.02 Mobile network coverage, % pop ......................48 ....... 99.53.03 Int’l Internet bandwidth, kb/s per user..............120 ......... 2.73.04 Secure Internet servers/million pop ..................111 ......... 2.43.05 Accessibility of digital content* ...........................51 ......... 5.3
4th pillar: Affordability4.01 Mobile cellular tariffs, PPP $/min. .........................9 ....... 0.064.02 Fixed broadband Internet tariffs, PPP $/month ..51 ..... 28.884.03 Internet & telephony competition, 0–2 (best) ....109 ....... 1.29
5th pillar: Skills5.01 Quality of educational system* ...........................57 ......... 3.95.02 Quality of math & science education* .................33 ......... 4.65.03 Secondary education gross enrollment rate, % ..90 ....... 81.25.04 Adult literacy rate, % ..........................................65 ....... 94.3
INDICATOR RANK /144 VALUE
6th pillar: Individual usage 6.01 Mobile phone subscriptions/100 pop. ..............115 ....... 73.2 6.02 Individuals using Internet, %...............................74 ....... 38.3 6.03 Households w/ personal computer, % ...............71 ....... 35.4 6.04 Households w/ Internet access, % ....................71 ....... 23.7 6.05 Broadband Internet subscriptions/100 pop. .......48 ....... 11.6 6.06 Mobile broadband subscriptions/100 pop. .........76 ......... 9.5 6.07 Use of virtual social networks* .........................108 ......... 4.9
7th pillar: Business usage 7.01 Firm-level technology absorption* ......................71 ......... 4.7 7.02 Capacity for innovation* .....................................23 ......... 4.1 7.03 PCT patents, applications/million pop. ..............35 ......... 9.0 7.04 Business-to-business Internet use* ....................89 ......... 4.7 7.05 Business-to-consumer Internet use* ..................47 ......... 4.9 7.06 Extent of staff training* .......................................45 ......... 4.2
8th pillar: Government usage 8.01 Importance of ICTs to gov’t vision* .....................22 ......... 4.8 8.02 Government Online Service Index, 0–1 (best) .....59 ....... 0.53 8.03 Gov’t success in ICT promotion* ........................46 ......... 4.7
9th pillar: Economic impacts 9.01 Impact of ICTs on new services and products* ..49 ......... 4.7 9.02 ICT PCT patents, applications/million pop. .......29 ......... 3.9 9.03 Impact of ICTs on new organizational models* ...37 ......... 4.7 9.04 Knowledge-intensive jobs, % workforce ...........100 ......... 7.4
10th pillar: Social impacts 10.01 Impact of ICTs on access to basic services* ......39 ......... 4.8 10.02 Internet access in schools* ................................31 ......... 5.4 10.03 ICT use & gov’t efficiency* .................................39 ......... 4.7 10.04 E-Participation Index, 0–1 (best).........................62 ....... 0.21
Rank Score (out of 144) (1–7)
Networked Readiness Index 2013 ..............58 ..4.0Networked Readiness Index 2012 (out of 142) ...................... 51 .....4.1
A. Environment subindex ..............................................71 ....3.91st pillar: Political and regulatory environment ................... 56 .....4.02nd pillar: Business and innovation environment ............. 105 .....3.8
B. Readiness subindex .................................................66 ....4.83rd pillar: Infrastructure and digital content ........................ 83 .....3.54th pillar: Affordability ........................................................ 40 .....5.85th pillar: Skills ................................................................... 53 .....5.0
C. Usage subindex ........................................................58 ....3.86th pillar: Individual usage .................................................. 83 .....3.07th pillar: Business usage .................................................. 35 .....3.98th pillar: Government usage ............................................. 38 .....4.6
D. Impact subindex .......................................................55 ....3.79th pillar: Economic impacts .............................................. 83 .....3.110th pillar: Social impacts .................................................. 42 .....4.3
China3: Country/Economy Profiles
168 | The Global Information Technology Report 2013
Note: Indicators followed by an asterisk (*) are measured on a 1-to-7 (best) scale. For further details and explanation, please refer to the section “How to Read the Country/Economy Profiles” on page 139.
China Upper-middle-income group average
1. Political and regulatory environment
6. Individual usage
5. Skills7. Business usage
4. Affordability8. Governmentusage
3. Infrastructure anddigital content
9. Economicimpacts
2. Business and innovation environment
10. Socialimpacts
1
2
3
4
5
6
7
@ 2013 World Economic Forum

The Networked Readiness Index in detailINDICATOR RANK /144 VALUE
1st pillar: Political and regulatory environment1.01 Effectiveness of law-making bodies* ................117 ......... 2.81.02 Laws relating to ICTs* ........................................57 ......... 4.21.03 Judicial independence* ......................................96 ......... 3.21.04 Efficiency of legal system in settling disputes* ....97 ......... 3.31.05 Efficiency of legal system in challenging regs* ....89 ......... 3.31.06 Intellectual property protection* ..........................89 ......... 3.21.07 Software piracy rate, % software installed ..........40 .......... 531.08 No. procedures to enforce a contract ................43 .......... 341.09 No. days to enforce a contract ........................139 ..... 1,346
2nd pillar: Business and innovation environment2.01 Availability of latest technologies* .......................91 ......... 4.62.02 Venture capital availability* .................................53 ......... 2.82.03 Total tax rate, % profits ....................................139 ....... 74.42.04 No. days to start a business ..............................62 .......... 132.05 No. procedures to start a business ....................88 ............ 82.06 Intensity of local competition* .............................79 ......... 4.7
2.07 Tertiary education gross enrollment rate, % ........61 ....... 42.92.08 Quality of management schools* ........................74 ......... 4.12.09 Gov’t procurement of advanced tech* ...............52 ......... 3.8
3rd pillar: Infrastructure and digital content3.01 Electricity production, kWh/capita ......................90 .. 1,254.33.02 Mobile network coverage, % pop ....................113 ....... 83.03.03 Int’l Internet bandwidth, kb/s per user................72 ....... 16.83.04 Secure Internet servers/million pop ....................73 ....... 21.23.05 Accessibility of digital content* ...........................94 ......... 4.6
4th pillar: Affordability 4.01 Mobile cellular tariffs, PPP $/min. .......................69 ....... 0.284.02 Fixed broadband Internet tariffs, PPP $/month ..75 ..... 34.814.03 Internet & telephony competition, 0–2 (best) ........1 ....... 2.00
5th pillar: Skills5.01 Quality of educational system* ...........................77 ......... 3.6
5.02 Quality of math & science education* ...............107 ......... 3.4 5.03 Secondary education gross enrollment rate, % ..43 ....... 97.55.04 Adult literacy rate, % ..........................................70 ....... 93.4
INDICATOR RANK /144 VALUE
6th pillar: Individual usage 6.01 Mobile phone subscriptions/100 pop. ................87 ....... 98.5 6.02 Individuals using Internet, %...............................70 ....... 40.4 6.03 Households w/ personal computer, % ...............76 ....... 29.9 6.04 Households w/ Internet access, % ....................72 ....... 23.4 6.05 Broadband Internet subscriptions/100 pop. .......70 ......... 6.9 6.06 Mobile broadband subscriptions/100 pop. .........90 ......... 3.7 6.07 Use of virtual social networks* ...........................75 ......... 5.4
7th pillar: Business usage 7.01 Firm-level technology absorption* ......................93 ......... 4.4 7.02 Capacity for innovation* .....................................66 ......... 3.2 7.03 PCT patents, applications/million pop. ..............68 ......... 1.0 7.04 Business-to-business Internet use* ....................70 ......... 5.0 7.05 Business-to-consumer Internet use* ..................45 ......... 4.9 7.06 Extent of staff training* .......................................99 ......... 3.6
8th pillar: Government usage 8.01 Importance of ICTs to gov’t vision* .....................62 ......... 4.1 8.02 Government Online Service Index, 0–1 (best) .....16 ....... 0.84 8.03 Gov’t success in ICT promotion* ........................84 ......... 4.1
9th pillar: Economic impacts 9.01 Impact of ICTs on new services and products* ..67 ......... 4.5 9.02 ICT PCT patents, applications/million pop. .......76 ......... 0.1 9.03 Impact of ICTs on new organizational models* ...55 ......... 4.4 9.04 Knowledge-intensive jobs, % workforce .............66 ....... 21.6
10th pillar: Social impacts 10.01 Impact of ICTs on access to basic services* ......82 ......... 4.1 10.02 Internet access in schools* ................................76 ......... 4.0 10.03 ICT use & gov’t efficiency* .................................73 ......... 4.2 10.04 E-Participation Index, 0–1 (best).........................11 ....... 0.74
Rank Score (out of 144) (1–7)
Networked Readiness Index 2013 ..............66 ..3.9Networked Readiness Index 2012 (out of 142) ...................... 73 .....3.9
A. Environment subindex ..............................................96 ....3.61st pillar: Political and regulatory environment ................... 92 .....3.42nd pillar: Business and innovation environment ............... 95 .....3.9
B. Readiness subindex .................................................80 ....4.43rd pillar: Infrastructure and digital content ........................ 96 .....3.24th pillar: Affordability ........................................................ 67 .....5.35th pillar: Skills ................................................................... 74 .....4.8
C. Usage subindex ........................................................64 ....3.76th pillar: Individual usage .................................................. 76 .....3.17th pillar: Business usage .................................................. 77 .....3.48th pillar: Government usage ............................................. 32 .....4.8
D. Impact subindex .......................................................47 ....3.89th pillar: Economic impacts .............................................. 70 .....3.210th pillar: Social impacts .................................................. 38 .....4.4
Colombia3: Country/Economy Profiles
The Global Information Technology Report 2013 | 169
Note: Indicators followed by an asterisk (*) are measured on a 1-to-7 (best) scale. For further details and explanation, please refer to the section “How to Read the Country/Economy Profiles” on page 139.
Colombia Upper-middle-income group average
1. Political and regulatory environment
6. Individual usage
5. Skills7. Business usage
4. Affordability8. Governmentusage
3. Infrastructure anddigital content
9. Economicimpacts
2. Business and innovation environment
10. Socialimpacts
1
2
3
4
5
6
7
@ 2013 World Economic Forum

The Networked Readiness Index in detailINDICATOR RANK /144 VALUE
1st pillar: Political and regulatory environment1.01 Effectiveness of law-making bodies* ................139 ......... 2.21.02 Laws relating to ICTs* ........................................65 ......... 4.11.03 Judicial independence* ......................................40 ......... 4.71.04 Efficiency of legal system in settling disputes* ....73 ......... 3.61.05 Efficiency of legal system in challenging regs* ....47 ......... 4.01.06 Intellectual property protection* ..........................68 ......... 3.61.07 Software piracy rate, % software installed ..........50 .......... 581.08 No. procedures to enforce a contract ................99 .......... 401.09 No. days to enforce a contract ........................122 ........ 852
2nd pillar: Business and innovation environment2.01 Availability of latest technologies* .......................57 ......... 5.22.02 Venture capital availability* ...............................101 ......... 2.22.03 Total tax rate, % profits ....................................122 ....... 55.02.04 No. days to start a business ............................132 .......... 602.05 No. procedures to start a business ..................126 .......... 122.06 Intensity of local competition* .............................60 ......... 5.02.07 Tertiary education gross enrollment rate, % ........60 ....... 43.02.08 Quality of management schools* ........................19 ......... 5.22.09 Gov’t procurement of advanced tech* ...............75 ......... 3.5
3rd pillar: Infrastructure and digital content3.01 Electricity production, kWh/capita ......................82 .. 2,023.63.02 Mobile network coverage, % pop ....................126 ....... 69.53.03 Int’l Internet bandwidth, kb/s per user................40 ....... 36.23.04 Secure Internet servers/million pop ....................51 ..... 111.33.05 Accessibility of digital content* ...........................56 ......... 5.2
4th pillar: Affordability4.01 Mobile cellular tariffs, PPP $/min. .......................18 ....... 0.094.02 Fixed broadband Internet tariffs, PPP $/month ..24 ..... 20.464.03 Internet & telephony competition, 0–2 (best) ......91 ....... 1.63
5th pillar: Skills5.01 Quality of educational system* ...........................21 ......... 4.95.02 Quality of math & science education* .................41 ......... 4.55.03 Secondary education gross enrollment rate, % ..30 ..... 101.55.04 Adult literacy rate, % ..........................................57 ....... 96.2
INDICATOR RANK /144 VALUE
6th pillar: Individual usage 6.01 Mobile phone subscriptions/100 pop. ................96 ....... 92.2 6.02 Individuals using Internet, %...............................68 ....... 42.1 6.03 Households w/ personal computer, % ...............65 ....... 45.3 6.04 Households w/ Internet access, % ....................68 ....... 33.6 6.05 Broadband Internet subscriptions/100 pop. .......61 ......... 8.7 6.06 Mobile broadband subscriptions/100 pop. .......101 ......... 2.0 6.07 Use of virtual social networks* ...........................43 ......... 5.8
7th pillar: Business usage 7.01 Firm-level technology absorption* ......................50 ......... 5.1 7.02 Capacity for innovation* .....................................43 ......... 3.5 7.03 PCT patents, applications/million pop. ..............58 ......... 1.6 7.04 Business-to-business Internet use* ....................34 ......... 5.6 7.05 Business-to-consumer Internet use* ..................38 ......... 5.1 7.06 Extent of staff training* .......................................29 ......... 4.6
8th pillar: Government usage 8.01 Importance of ICTs to gov’t vision* .....................78 ......... 3.9 8.02 Government Online Service Index, 0–1 (best) .....67 ....... 0.50 8.03 Gov’t success in ICT promotion* ........................56 ......... 4.6
9th pillar: Economic impacts 9.01 Impact of ICTs on new services and products* ..48 ......... 4.7 9.02 ICT PCT patents, applications/million pop. .......63 ......... 0.2 9.03 Impact of ICTs on new organizational models* ...43 ......... 4.5 9.04 Knowledge-intensive jobs, % workforce .............50 ....... 27.4
10th pillar: Social impacts 10.01 Impact of ICTs on access to basic services* ......54 ......... 4.6 10.02 Internet access in schools* ................................58 ......... 4.5 10.03 ICT use & gov’t efficiency* .................................87 ......... 4.0 10.04 E-Participation Index, 0–1 (best).........................46 ....... 0.32
Rank Score (out of 144) (1–7)
Networked Readiness Index 2013 ..............53 ..4.1Networked Readiness Index 2012 (out of 142) ...................... 58 .....4.0
A. Environment subindex ..............................................82 ....3.81st pillar: Political and regulatory environment ................... 74 .....3.72nd pillar: Business and innovation environment ............... 94 .....3.9
B. Readiness subindex .................................................33 ....5.33rd pillar: Infrastructure and digital content ........................ 76 .....3.84th pillar: Affordability .......................................................... 6 .....6.55th pillar: Skills ................................................................... 23 .....5.6
C. Usage subindex ........................................................59 ....3.86th pillar: Individual usage .................................................. 71 .....3.47th pillar: Business usage .................................................. 37 .....3.88th pillar: Government usage ............................................. 61 .....4.2
D. Impact subindex .......................................................49 ....3.79th pillar: Economic impacts .............................................. 46 .....3.510th pillar: Social impacts .................................................. 53 .....4.0
Costa Rica3: Country/Economy Profiles
170 | The Global Information Technology Report 2013
Note: Indicators followed by an asterisk (*) are measured on a 1-to-7 (best) scale. For further details and explanation, please refer to the section “How to Read the Country/Economy Profiles” on page 139.
Costa Rica Upper-middle-income group average
1. Political and regulatory environment
6. Individual usage
5. Skills7. Business usage
4. Affordability8. Governmentusage
3. Infrastructure anddigital content
9. Economicimpacts
2. Business and innovation environment
10. Socialimpacts
1
2
3
4
5
6
7
@ 2013 World Economic Forum

The Networked Readiness Index in detailINDICATOR RANK /144 VALUE
1st pillar: Political and regulatory environment1.01 Effectiveness of law-making bodies* ................114 ......... 2.81.02 Laws relating to ICTs* ......................................126 ......... 2.91.03 Judicial independence* ....................................137 ......... 2.11.04 Efficiency of legal system in settling disputes* ..119 ......... 2.91.05 Efficiency of legal system in challenging regs* ..120 ......... 2.81.06 Intellectual property protection* ........................122 ......... 2.61.07 Software piracy rate, % software installed ..........88 .......... 811.08 No. procedures to enforce a contract ................36 .......... 331.09 No. days to enforce a contract ........................114 ........ 770
2nd pillar: Business and innovation environment2.01 Availability of latest technologies* .......................77 ......... 4.82.02 Venture capital availability* ...............................140 ......... 1.72.03 Total tax rate, % profits ......................................76 ....... 39.52.04 No. days to start a business ............................108 .......... 322.05 No. procedures to start a business ..................114 .......... 102.06 Intensity of local competition* .............................78 ......... 4.72.07 Tertiary education gross enrollment rate, % ......118 ......... 8.32.08 Quality of management schools* ........................83 ......... 4.12.09 Gov’t procurement of advanced tech* ...............86 ......... 3.4
3rd pillar: Infrastructure and digital content3.01 Electricity production, kWh/capita ....................116 ..... 304.63.02 Mobile network coverage, % pop ......................98 ....... 92.13.03 Int’l Internet bandwidth, kb/s per user................67 ....... 18.03.04 Secure Internet servers/million pop ..................129 ......... 0.93.05 Accessibility of digital content* .........................134 ......... 3.4
4th pillar: Affordability4.01 Mobile cellular tariffs, PPP $/min. .......................75 ....... 0.304.02 Fixed broadband Internet tariffs, PPP $/month 111 ..... 63.984.03 Internet & telephony competition, 0–2 (best) ....114 ....... 1.22
5th pillar: Skills5.01 Quality of educational system* ...........................95 ......... 3.35.02 Quality of math & science education* .................73 ......... 4.05.03 Secondary education gross enrollment rate, % 139 ....... 27.15.04 Adult literacy rate, % ........................................128 ....... 56.2
INDICATOR RANK /144 VALUE
6th pillar: Individual usage 6.01 Mobile phone subscriptions/100 pop. ..............101 ....... 86.1 6.02 Individuals using Internet, %.............................136 ......... 2.2 6.03 Households w/ personal computer, % .............135 ......... 1.8 6.04 Households w/ Internet access, % ..................129 ......... 1.1 6.05 Broadband Internet subscriptions/100 pop. .....117 ......... 0.2 6.06 Mobile broadband subscriptions/100 pop. .......126 ......... 0.0 6.07 Use of virtual social networks* ...........................84 ......... 5.3
7th pillar: Business usage 7.01 Firm-level technology absorption* ......................66 ......... 4.8 7.02 Capacity for innovation* ...................................139 ......... 2.2 7.03 PCT patents, applications/million pop. ............111 ......... 0.0 7.04 Business-to-business Internet use* ..................102 ......... 4.5 7.05 Business-to-consumer Internet use* ................120 ......... 3.5 7.06 Extent of staff training* .......................................44 ......... 4.2
8th pillar: Government usage 8.01 Importance of ICTs to gov’t vision* .....................94 ......... 3.6 8.02 Government Online Service Index, 0–1 (best) ...104 ....... 0.33 8.03 Gov’t success in ICT promotion* ........................91 ......... 4.0
9th pillar: Economic impacts 9.01 Impact of ICTs on new services and products* ..86 ......... 4.2 9.02 ICT PCT patents, applications/million pop. .......95 ......... 0.0 9.03 Impact of ICTs on new organizational models* .110 ......... 3.6 9.04 Knowledge-intensive jobs, % workforce ............n/a ......... n/a
10th pillar: Social impacts 10.01 Impact of ICTs on access to basic services* ....127 ......... 3.2 10.02 Internet access in schools* ..............................138 ......... 1.8 10.03 ICT use & gov’t efficiency* ...............................108 ......... 3.6 10.04 E-Participation Index, 0–1 (best).........................81 ....... 0.13
Rank Score (out of 144) (1–7)
Networked Readiness Index 2013 ............120 ..3.0Networked Readiness Index 2012 (out of 142) .................... 122 .....3.0
A. Environment subindex ............................................127 ....3.21st pillar: Political and regulatory environment ................. 128 .....2.92nd pillar: Business and innovation environment ............. 113 .....3.6
B. Readiness subindex ...............................................122 ....3.13rd pillar: Infrastructure and digital content ........................ 99 .....3.14th pillar: Affordability ...................................................... 119 .....3.05th pillar: Skills ................................................................. 130 .....3.2
C. Usage subindex ......................................................116 ....2.96th pillar: Individual usage ................................................ 117 .....2.17th pillar: Business usage ................................................ 105 .....3.18th pillar: Government usage ........................................... 112 .....3.5
D. Impact subindex .....................................................120 ....2.89th pillar: Economic impacts .............................................. 93 .....2.910th pillar: Social impacts ................................................ 129 .....2.6
Côte d’Ivoire3: Country/Economy Profiles
The Global Information Technology Report 2013 | 171
Note: Indicators followed by an asterisk (*) are measured on a 1-to-7 (best) scale. For further details and explanation, please refer to the section “How to Read the Country/Economy Profiles” on page 139.
Côte d’Ivoire Lower-middle-income group average
1. Political and regulatory environment
6. Individual usage
5. Skills7. Business usage
4. Affordability8. Governmentusage
3. Infrastructure anddigital content
9. Economicimpacts
2. Business and innovation environment
10. Socialimpacts
1
2
3
4
5
6
7
@ 2013 World Economic Forum

The Networked Readiness Index in detailINDICATOR RANK /144 VALUE
1st pillar: Political and regulatory environment1.01 Effectiveness of law-making bodies* ..................90 ......... 3.21.02 Laws relating to ICTs* ........................................73 ......... 3.91.03 Judicial independence* ....................................106 ......... 2.81.04 Efficiency of legal system in settling disputes* ..137 ......... 2.51.05 Efficiency of legal system in challenging regs* ..129 ......... 2.71.06 Intellectual property protection* ..........................76 ......... 3.51.07 Software piracy rate, % software installed ..........40 .......... 531.08 No. procedures to enforce a contract ................78 .......... 381.09 No. days to enforce a contract ..........................84 ........ 572
2nd pillar: Business and innovation environment2.01 Availability of latest technologies* .......................54 ......... 5.22.02 Venture capital availability* ...............................112 ......... 2.12.03 Total tax rate, % profits ......................................44 ....... 32.82.04 No. days to start a business ..............................43 ............ 92.05 No. procedures to start a business ....................48 ............ 62.06 Intensity of local competition* ...........................120 ......... 4.02.07 Tertiary education gross enrollment rate, % ........50 ....... 54.12.08 Quality of management schools* ........................87 ......... 3.92.09 Gov’t procurement of advanced tech* .............129 ......... 2.7
3rd pillar: Infrastructure and digital content3.01 Electricity production, kWh/capita ......................66 .. 2,865.73.02 Mobile network coverage, % pop ........................1 ..... 100.03.03 Int’l Internet bandwidth, kb/s per user................62 ....... 19.93.04 Secure Internet servers/million pop ....................35 ..... 224.63.05 Accessibility of digital content* ...........................47 ......... 5.4
4th pillar: Affordability4.01 Mobile cellular tariffs, PPP $/min. .......................56 ....... 0.244.02 Fixed broadband Internet tariffs, PPP $/month ..41 ..... 25.824.03 Internet & telephony competition, 0–2 (best) ........1 ....... 2.00
5th pillar: Skills5.01 Quality of educational system* ...........................99 ......... 3.25.02 Quality of math & science education* .................26 ......... 4.85.03 Secondary education gross enrollment rate, % ..51 ....... 95.75.04 Adult literacy rate, % ..........................................39 ....... 98.8
INDICATOR RANK /144 VALUE
6th pillar: Individual usage 6.01 Mobile phone subscriptions/100 pop. ................52 ..... 116.4 6.02 Individuals using Internet, %...............................33 ....... 70.7 6.03 Households w/ personal computer, % ...............46 ....... 60.0 6.04 Households w/ Internet access, % ....................41 ....... 61.4 6.05 Broadband Internet subscriptions/100 pop. .......36 ....... 19.6 6.06 Mobile broadband subscriptions/100 pop. .........35 ....... 34.9 6.07 Use of virtual social networks* ...........................90 ......... 5.2
7th pillar: Business usage 7.01 Firm-level technology absorption* ......................77 ......... 4.7 7.02 Capacity for innovation* .....................................72 ......... 3.1 7.03 PCT patents, applications/million pop. ..............34 ......... 9.8 7.04 Business-to-business Internet use* ....................52 ......... 5.2 7.05 Business-to-consumer Internet use* ..................74 ......... 4.5 7.06 Extent of staff training* .....................................124 ......... 3.2
8th pillar: Government usage 8.01 Importance of ICTs to gov’t vision* ...................111 ......... 3.4 8.02 Government Online Service Index, 0–1 (best) .....40 ....... 0.64 8.03 Gov’t success in ICT promotion* ......................104 ......... 3.8
9th pillar: Economic impacts 9.01 Impact of ICTs on new services and products* ..76 ......... 4.4 9.02 ICT PCT patents, applications/million pop. .......39 ......... 1.3 9.03 Impact of ICTs on new organizational models* ...82 ......... 4.0 9.04 Knowledge-intensive jobs, % workforce .............44 ....... 30.1
10th pillar: Social impacts 10.01 Impact of ICTs on access to basic services* ......66 ......... 4.3 10.02 Internet access in schools* ................................49 ......... 4.7 10.03 ICT use & gov’t efficiency* ...............................117 ......... 3.5 10.04 E-Participation Index, 0–1 (best).........................51 ....... 0.29
Rank Score (out of 144) (1–7)
Networked Readiness Index 2013 ..............51 ..4.2Networked Readiness Index 2012 (out of 142) ...................... 45 .....4.2
A. Environment subindex ..............................................70 ....3.91st pillar: Political and regulatory environment ................... 90 .....3.52nd pillar: Business and innovation environment ............... 60 .....4.3
B. Readiness subindex .................................................41 ....5.13rd pillar: Infrastructure and digital content ........................ 57 .....4.34th pillar: Affordability ........................................................ 26 .....6.05th pillar: Skills ................................................................... 51 .....5.1
C. Usage subindex ........................................................47 ....4.16th pillar: Individual usage .................................................. 39 .....4.87th pillar: Business usage .................................................. 81 .....3.48th pillar: Government usage ............................................. 73 .....4.0
D. Impact subindex .......................................................63 ....3.69th pillar: Economic impacts .............................................. 55 .....3.410th pillar: Social impacts .................................................. 68 .....3.8
Croatia3: Country/Economy Profiles
172 | The Global Information Technology Report 2013
Note: Indicators followed by an asterisk (*) are measured on a 1-to-7 (best) scale. For further details and explanation, please refer to the section “How to Read the Country/Economy Profiles” on page 139.
Croatia High-income group average
1. Political and regulatory environment
6. Individual usage
5. Skills7. Business usage
4. Affordability8. Governmentusage
3. Infrastructure anddigital content
9. Economicimpacts
2. Business and innovation environment
10. Socialimpacts
1
2
3
4
5
6
7
@ 2013 World Economic Forum

The Networked Readiness Index in detailINDICATOR RANK /144 VALUE
1st pillar: Political and regulatory environment1.01 Effectiveness of law-making bodies* ..................27 ......... 4.61.02 Laws relating to ICTs* ........................................44 ......... 4.41.03 Judicial independence* ......................................39 ......... 4.81.04 Efficiency of legal system in settling disputes* ....32 ......... 4.61.05 Efficiency of legal system in challenging regs* ....18 ......... 4.71.06 Intellectual property protection* ..........................44 ......... 4.21.07 Software piracy rate, % software installed ..........34 .......... 481.08 No. procedures to enforce a contract ..............121 .......... 431.09 No. days to enforce a contract ........................112 ........ 735
2nd pillar: Business and innovation environment2.01 Availability of latest technologies* .......................42 ......... 5.52.02 Venture capital availability* .................................45 ......... 2.92.03 Total tax rate, % profits ......................................17 ....... 23.02.04 No. days to start a business ..............................34 ............ 82.05 No. procedures to start a business ....................48 ............ 62.06 Intensity of local competition* .............................43 ......... 5.1
2.07 Tertiary education gross enrollment rate, % ........48 ....... 54.62.08 Quality of management schools* ........................30 ......... 5.02.09 Gov’t procurement of advanced tech* ...............55 ......... 3.7
3rd pillar: Infrastructure and digital content3.01 Electricity production, kWh/capita ......................50 .. 4,793.33.02 Mobile network coverage, % pop ......................27 ..... 100.03.03 Int’l Internet bandwidth, kb/s per user................31 ....... 53.63.04 Secure Internet servers/million pop ....................18 .. 1,121.33.05 Accessibility of digital content* ...........................42 ......... 5.5
4th pillar: Affordability 4.01 Mobile cellular tariffs, PPP $/min. .......................22 ....... 0.124.02 Fixed broadband Internet tariffs, PPP $/month ..32 ..... 22.954.03 Internet & telephony competition, 0–2 (best) ....107 ....... 1.31
5th pillar: Skills5.01 Quality of educational system* ...........................22 ......... 4.8
5.02 Quality of math & science education* .................13 ......... 5.3 5.03 Secondary education gross enrollment rate, % ..41 ....... 98.85.04 Adult literacy rate, % ..........................................45 ....... 98.3
INDICATOR RANK /144 VALUE
6th pillar: Individual usage 6.01 Mobile phone subscriptions/100 pop. ................89 ....... 97.7 6.02 Individuals using Internet, %...............................44 ....... 57.7 6.03 Households w/ personal computer, % ...............42 ....... 63.9 6.04 Households w/ Internet access, % ....................45 ....... 57.4 6.05 Broadband Internet subscriptions/100 pop. .......37 ....... 18.9 6.06 Mobile broadband subscriptions/100 pop. .........41 ....... 30.8 6.07 Use of virtual social networks* ...........................49 ......... 5.7
7th pillar: Business usage 7.01 Firm-level technology absorption* ......................43 ......... 5.2 7.02 Capacity for innovation* .....................................89 ......... 2.9 7.03 PCT patents, applications/million pop. ..............38 ......... 7.7 7.04 Business-to-business Internet use* ....................62 ......... 5.0 7.05 Business-to-consumer Internet use* ..................48 ......... 4.8 7.06 Extent of staff training* .......................................85 ......... 3.8
8th pillar: Government usage 8.01 Importance of ICTs to gov’t vision* .....................60 ......... 4.1 8.02 Government Online Service Index, 0–1 (best) .....51 ....... 0.56 8.03 Gov’t success in ICT promotion* ......................101 ......... 3.9
9th pillar: Economic impacts 9.01 Impact of ICTs on new services and products* ..65 ......... 4.5 9.02 ICT PCT patents, applications/million pop. .......32 ......... 2.0 9.03 Impact of ICTs on new organizational models* ...73 ......... 4.1 9.04 Knowledge-intensive jobs, % workforce .............41 ....... 31.4
10th pillar: Social impacts 10.01 Impact of ICTs on access to basic services* ......38 ......... 4.9 10.02 Internet access in schools* ................................36 ......... 5.2 10.03 ICT use & gov’t efficiency* .................................62 ......... 4.3 10.04 E-Participation Index, 0–1 (best).........................96 ....... 0.08
Rank Score (out of 144) (1–7)
Networked Readiness Index 2013 ..............35 ..4.6Networked Readiness Index 2012 (out of 142) ...................... 32 .....4.7
A. Environment subindex ..............................................34 ....4.71st pillar: Political and regulatory environment ................... 41 .....4.42nd pillar: Business and innovation environment ............... 26 .....5.0
B. Readiness subindex .................................................12 ....5.93rd pillar: Infrastructure and digital content ........................ 21 .....6.14th pillar: Affordability ........................................................ 28 .....6.05th pillar: Skills ................................................................... 16 .....5.7
C. Usage subindex ........................................................48 ....4.16th pillar: Individual usage .................................................. 44 .....4.57th pillar: Business usage .................................................. 60 .....3.58th pillar: Government usage ............................................. 65 .....4.1
D. Impact subindex .......................................................51 ....3.79th pillar: Economic impacts .............................................. 45 .....3.510th pillar: Social impacts .................................................. 55 .....4.0
Cyprus3: Country/Economy Profiles
The Global Information Technology Report 2013 | 173
Note: Indicators followed by an asterisk (*) are measured on a 1-to-7 (best) scale. For further details and explanation, please refer to the section “How to Read the Country/Economy Profiles” on page 139.
Cyprus High-income group average
1. Political and regulatory environment
6. Individual usage
5. Skills7. Business usage
4. Affordability8. Governmentusage
3. Infrastructure anddigital content
9. Economicimpacts
2. Business and innovation environment
10. Socialimpacts
1
2
3
4
5
6
7
@ 2013 World Economic Forum

The Networked Readiness Index in detailINDICATOR RANK /144 VALUE
1st pillar: Political and regulatory environment1.01 Effectiveness of law-making bodies* ................106 ......... 3.01.02 Laws relating to ICTs* ........................................41 ......... 4.61.03 Judicial independence* ......................................75 ......... 3.71.04 Efficiency of legal system in settling disputes* ..115 ......... 3.01.05 Efficiency of legal system in challenging regs* ..118 ......... 2.91.06 Intellectual property protection* ..........................56 ......... 3.81.07 Software piracy rate, % software installed ..........20 .......... 351.08 No. procedures to enforce a contract ..................8 .......... 271.09 No. days to enforce a contract ..........................93 ........ 611
2nd pillar: Business and innovation environment2.01 Availability of latest technologies* .......................43 ......... 5.52.02 Venture capital availability* .................................84 ......... 2.42.03 Total tax rate, % profits ....................................110 ....... 49.22.04 No. days to start a business ..............................87 .......... 202.05 No. procedures to start a business ..................102 ............ 92.06 Intensity of local competition* .............................13 ......... 5.72.07 Tertiary education gross enrollment rate, % ........30 ....... 63.52.08 Quality of management schools* ........................95 ......... 3.82.09 Gov’t procurement of advanced tech* .............122 ......... 2.9
3rd pillar: Infrastructure and digital content3.01 Electricity production, kWh/capita ......................23 .. 8,110.63.02 Mobile network coverage, % pop ......................45 ....... 99.63.03 Int’l Internet bandwidth, kb/s per user................16 ....... 91.13.04 Secure Internet servers/million pop ....................30 ..... 387.23.05 Accessibility of digital content* ...........................21 ......... 6.1
4th pillar: Affordability4.01 Mobile cellular tariffs, PPP $/min. .....................114 ....... 0.504.02 Fixed broadband Internet tariffs, PPP $/month 100 ..... 43.274.03 Internet & telephony competition, 0–2 (best) ......68 ....... 1.87
5th pillar: Skills5.01 Quality of educational system* ...........................59 ......... 3.95.02 Quality of math & science education* .................78 ......... 3.85.03 Secondary education gross enrollment rate, % ..67 ....... 90.35.04 Adult literacy rate, % ..........................................15 ....... 99.0
INDICATOR RANK /144 VALUE
6th pillar: Individual usage 6.01 Mobile phone subscriptions/100 pop. ................42 ..... 123.4 6.02 Individuals using Internet, %...............................27 ....... 73.0 6.03 Households w/ personal computer, % ...............36 ....... 69.9 6.04 Households w/ Internet access, % ....................33 ....... 66.6 6.05 Broadband Internet subscriptions/100 pop. .......39 ....... 15.8 6.06 Mobile broadband subscriptions/100 pop. .........21 ....... 43.4 6.07 Use of virtual social networks* ...........................35 ......... 6.0
7th pillar: Business usage 7.01 Firm-level technology absorption* ......................49 ......... 5.1 7.02 Capacity for innovation* .....................................22 ......... 4.1 7.03 PCT patents, applications/million pop. ..............29 ....... 14.7 7.04 Business-to-business Internet use* ....................23 ......... 5.8 7.05 Business-to-consumer Internet use* ....................8 ......... 5.9 7.06 Extent of staff training* .......................................48 ......... 4.2
8th pillar: Government usage 8.01 Importance of ICTs to gov’t vision* ...................114 ......... 3.3 8.02 Government Online Service Index, 0–1 (best) .....53 ....... 0.54 8.03 Gov’t success in ICT promotion* ......................103 ......... 3.8
9th pillar: Economic impacts 9.01 Impact of ICTs on new services and products* ..82 ......... 4.3 9.02 ICT PCT patents, applications/million pop. .......31 ......... 2.6 9.03 Impact of ICTs on new organizational models* ...86 ......... 4.0 9.04 Knowledge-intensive jobs, % workforce .............19 ....... 40.5
10th pillar: Social impacts 10.01 Impact of ICTs on access to basic services* ......49 ......... 4.7 10.02 Internet access in schools* ................................21 ......... 5.8 10.03 ICT use & gov’t efficiency* .................................88 ......... 4.0 10.04 E-Participation Index, 0–1 (best).........................54 ....... 0.26
Rank Score (out of 144) (1–7)
Networked Readiness Index 2013 ..............42 ..4.4Networked Readiness Index 2012 (out of 142) ...................... 42 .....4.3
A. Environment subindex ..............................................49 ....4.21st pillar: Political and regulatory environment ................... 46 .....4.12nd pillar: Business and innovation environment ............... 56 .....4.4
B. Readiness subindex .................................................53 ....5.03rd pillar: Infrastructure and digital content ........................ 23 .....5.94th pillar: Affordability ........................................................ 99 .....4.05th pillar: Skills ................................................................... 50 .....5.1
C. Usage subindex ........................................................38 ....4.46th pillar: Individual usage .................................................. 29 .....5.27th pillar: Business usage .................................................. 31 .....4.18th pillar: Government usage ............................................. 93 .....3.8
D. Impact subindex .......................................................43 ....4.09th pillar: Economic impacts .............................................. 40 .....3.710th pillar: Social impacts .................................................. 44 .....4.3
Czech Republic3: Country/Economy Profiles
174 | The Global Information Technology Report 2013
Note: Indicators followed by an asterisk (*) are measured on a 1-to-7 (best) scale. For further details and explanation, please refer to the section “How to Read the Country/Economy Profiles” on page 139.
Czech Republic High-income group average
1. Political and regulatory environment
6. Individual usage
5. Skills7. Business usage
4. Affordability8. Governmentusage
3. Infrastructure anddigital content
9. Economicimpacts
2. Business and innovation environment
10. Socialimpacts
1
2
3
4
5
6
7
@ 2013 World Economic Forum

The Networked Readiness Index in detailINDICATOR RANK /144 VALUE
1st pillar: Political and regulatory environment1.01 Effectiveness of law-making bodies* ..................17 ......... 4.91.02 Laws relating to ICTs* ........................................12 ......... 5.41.03 Judicial independence* ......................................13 ......... 6.01.04 Efficiency of legal system in settling disputes* ....13 ......... 5.11.05 Efficiency of legal system in challenging regs* ....20 ......... 4.61.06 Intellectual property protection* ..........................21 ......... 5.31.07 Software piracy rate, % software installed ............7 .......... 241.08 No. procedures to enforce a contract ................48 .......... 351.09 No. days to enforce a contract ..........................38 ........ 410
2nd pillar: Business and innovation environment2.01 Availability of latest technologies* .......................20 ......... 6.22.02 Venture capital availability* .................................69 ......... 2.62.03 Total tax rate, % profits ......................................28 ....... 27.72.04 No. days to start a business ..............................16 ............ 62.05 No. procedures to start a business ....................20 ............ 42.06 Intensity of local competition* .............................29 ......... 5.4
2.07 Tertiary education gross enrollment rate, % ........15 ....... 74.42.08 Quality of management schools* ........................25 ......... 5.12.09 Gov’t procurement of advanced tech* ...............63 ......... 3.7
3rd pillar: Infrastructure and digital content3.01 Electricity production, kWh/capita ......................30 .. 6,952.13.02 Mobile network coverage, % pop ......................81 ....... 97.03.03 Int’l Internet bandwidth, kb/s per user..................8 ..... 159.53.04 Secure Internet servers/million pop ......................4 .. 2,180.73.05 Accessibility of digital content* ...........................17 ......... 6.2
4th pillar: Affordability 4.01 Mobile cellular tariffs, PPP $/min. .......................10 ....... 0.064.02 Fixed broadband Internet tariffs, PPP $/month ..66 ..... 31.854.03 Internet & telephony competition, 0–2 (best) ......64 ....... 1.89
5th pillar: Skills5.01 Quality of educational system* ...........................19 ......... 5.0
5.02 Quality of math & science education* .................38 ......... 4.5 5.03 Secondary education gross enrollment rate, % ....7 ..... 118.7 5.04 Adult literacy rate, % ..........................................15 ....... 99.0
INDICATOR RANK /144 VALUE
6th pillar: Individual usage 6.01 Mobile phone subscriptions/100 pop. ................33 ..... 128.5 6.02 Individuals using Internet, %.................................6 ....... 90.0 6.03 Households w/ personal computer, % .................6 ....... 90.4 6.04 Households w/ Internet access, % ......................7 ....... 90.1 6.05 Broadband Internet subscriptions/100 pop. .........3 ....... 37.6 6.06 Mobile broadband subscriptions/100 pop. ...........6 ....... 80.2 6.07 Use of virtual social networks* ...........................29 ......... 6.0
7th pillar: Business usage 7.01 Firm-level technology absorption* ......................18 ......... 5.8 7.02 Capacity for innovation* .....................................13 ......... 4.9 7.03 PCT patents, applications/million pop. ................7 ..... 196.7 7.04 Business-to-business Internet use* ....................22 ......... 5.8 7.05 Business-to-consumer Internet use* ..................20 ......... 5.5 7.06 Extent of staff training* .......................................10 ......... 5.1
8th pillar: Government usage 8.01 Importance of ICTs to gov’t vision* .....................33 ......... 4.5 8.02 Government Online Service Index, 0–1 (best) .....13 ....... 0.86 8.03 Gov’t success in ICT promotion* ........................67 ......... 4.5
9th pillar: Economic impacts 9.01 Impact of ICTs on new services and products* ..17 ......... 5.4 9.02 ICT PCT patents, applications/million pop. .......11 ....... 41.2 9.03 Impact of ICTs on new organizational models* ...13 ......... 5.2 9.04 Knowledge-intensive jobs, % workforce ...............6 ....... 45.1
10th pillar: Social impacts 10.01 Impact of ICTs on access to basic services* ......20 ......... 5.5 10.02 Internet access in schools* ................................19 ......... 5.9 10.03 ICT use & gov’t efficiency* .................................26 ......... 5.0 10.04 E-Participation Index, 0–1 (best).........................28 ....... 0.55
Rank Score (out of 144) (1–7)
Networked Readiness Index 2013 ................ 8 ..5.6Networked Readiness Index 2012 (out of 142) ........................ 4 .....5.7
A. Environment subindex ..............................................12 ....5.31st pillar: Political and regulatory environment ................... 14 .....5.32nd pillar: Business and innovation environment ............... 19 .....5.2
B. Readiness subindex ...................................................7 ....6.03rd pillar: Infrastructure and digital content ........................ 14 .....6.44th pillar: Affordability ........................................................ 22 .....6.15th pillar: Skills ................................................................... 18 .....5.6
C. Usage subindex ..........................................................6 ....5.86th pillar: Individual usage .................................................... 1 .....6.77th pillar: Business usage .................................................... 7 .....5.68th pillar: Government usage ............................................. 24 .....5.0
D. Impact subindex .......................................................13 ....5.39th pillar: Economic impacts ................................................ 9 .....5.310th pillar: Social impacts .................................................. 19 .....5.2
Denmark3: Country/Economy Profiles
The Global Information Technology Report 2013 | 175
Note: Indicators followed by an asterisk (*) are measured on a 1-to-7 (best) scale. For further details and explanation, please refer to the section “How to Read the Country/Economy Profiles” on page 139.
Denmark High-income group average
1. Political and regulatory environment
6. Individual usage
5. Skills7. Business usage
4. Affordability8. Governmentusage
3. Infrastructure anddigital content
9. Economicimpacts
2. Business and innovation environment
10. Socialimpacts
1
2
3
4
5
6
7
@ 2013 World Economic Forum

The Networked Readiness Index in detailINDICATOR RANK /144 VALUE
1st pillar: Political and regulatory environment1.01 Effectiveness of law-making bodies* ................124 ......... 2.61.02 Laws relating to ICTs* ........................................68 ......... 4.01.03 Judicial independence* ....................................120 ......... 2.61.04 Efficiency of legal system in settling disputes* ....95 ......... 3.31.05 Efficiency of legal system in challenging regs* ..119 ......... 2.91.06 Intellectual property protection* ........................119 ......... 2.71.07 Software piracy rate, % software installed ..........77 .......... 761.08 No. procedures to enforce a contract ................43 .......... 341.09 No. days to enforce a contract ..........................53 ........ 460
2nd pillar: Business and innovation environment2.01 Availability of latest technologies* .......................60 ......... 5.22.02 Venture capital availability* ...............................111 ......... 2.22.03 Total tax rate, % profits ......................................89 ....... 42.52.04 No. days to start a business ..............................81 .......... 192.05 No. procedures to start a business ....................74 ............ 72.06 Intensity of local competition* .............................56 ......... 5.02.07 Tertiary education gross enrollment rate, % ........73 ....... 34.02.08 Quality of management schools* ........................88 ......... 3.92.09 Gov’t procurement of advanced tech* ...............93 ......... 3.3
3rd pillar: Infrastructure and digital content3.01 Electricity production, kWh/capita ......................89 .. 1,529.33.02 Mobile network coverage, % pop ....................117 ....... 81.23.03 Int’l Internet bandwidth, kb/s per user................80 ....... 11.83.04 Secure Internet servers/million pop ....................74 ....... 20.33.05 Accessibility of digital content* ...........................78 ......... 4.9
4th pillar: Affordability4.01 Mobile cellular tariffs, PPP $/min. .....................109 ....... 0.444.02 Fixed broadband Internet tariffs, PPP $/month ..70 ..... 32.534.03 Internet & telephony competition, 0–2 (best) ........1 ....... 2.00
5th pillar: Skills5.01 Quality of educational system* .........................137 ......... 2.45.02 Quality of math & science education* ...............142 ......... 2.15.03 Secondary education gross enrollment rate, % ..97 ....... 76.15.04 Adult literacy rate, % ..........................................90 ....... 89.5
INDICATOR RANK /144 VALUE
6th pillar: Individual usage 6.01 Mobile phone subscriptions/100 pop. ................99 ....... 87.2 6.02 Individuals using Internet, %...............................79 ....... 35.5 6.03 Households w/ personal computer, % ...............89 ....... 18.9 6.04 Households w/ Internet access, % ....................89 ....... 11.8 6.05 Broadband Internet subscriptions/100 pop. .......82 ......... 4.0 6.06 Mobile broadband subscriptions/100 pop. .........81 ......... 7.7 6.07 Use of virtual social networks* ...........................58 ......... 5.6
7th pillar: Business usage 7.01 Firm-level technology absorption* ......................57 ......... 4.9 7.02 Capacity for innovation* ...................................118 ......... 2.5 7.03 PCT patents, applications/million pop. ..............81 ......... 0.2 7.04 Business-to-business Internet use* ....................47 ......... 5.4 7.05 Business-to-consumer Internet use* ..................49 ......... 4.8 7.06 Extent of staff training* .......................................76 ......... 3.9
8th pillar: Government usage 8.01 Importance of ICTs to gov’t vision* .....................98 ......... 3.6 8.02 Government Online Service Index, 0–1 (best) .....55 ....... 0.54 8.03 Gov’t success in ICT promotion* ........................80 ......... 4.2
9th pillar: Economic impacts 9.01 Impact of ICTs on new services and products* ..53 ......... 4.7 9.02 ICT PCT patents, applications/million pop. .......79 ......... 0.1 9.03 Impact of ICTs on new organizational models* ...41 ......... 4.5 9.04 Knowledge-intensive jobs, % workforce .............87 ....... 15.8
10th pillar: Social impacts 10.01 Impact of ICTs on access to basic services* ......86 ......... 4.0 10.02 Internet access in schools* ..............................102 ......... 3.4 10.03 ICT use & gov’t efficiency* .................................60 ......... 4.3 10.04 E-Participation Index, 0–1 (best).........................34 ....... 0.47
Rank Score (out of 144) (1–7)
Networked Readiness Index 2013 ..............90 ..3.6Networked Readiness Index 2012 (out of 142) ...................... 87 .....3.6
A. Environment subindex ..............................................95 ....3.71st pillar: Political and regulatory environment ................. 109 .....3.22nd pillar: Business and innovation environment ............... 75 .....4.1
B. Readiness subindex .................................................98 ....3.93rd pillar: Infrastructure and digital content ........................ 98 .....3.14th pillar: Affordability ........................................................ 79 .....4.95th pillar: Skills ................................................................. 105 .....3.8
C. Usage subindex ........................................................86 ....3.46th pillar: Individual usage .................................................. 93 .....2.77th pillar: Business usage .................................................. 82 .....3.48th pillar: Government usage ............................................. 72 .....4.0
D. Impact subindex .......................................................66 ....3.59th pillar: Economic impacts .............................................. 79 .....3.210th pillar: Social impacts .................................................. 59 .....3.9
Dominican Republic3: Country/Economy Profiles
176 | The Global Information Technology Report 2013
Note: Indicators followed by an asterisk (*) are measured on a 1-to-7 (best) scale. For further details and explanation, please refer to the section “How to Read the Country/Economy Profiles” on page 139.
Dominican Republic Upper-middle-income group average
1. Political and regulatory environment
6. Individual usage
5. Skills7. Business usage
4. Affordability8. Governmentusage
3. Infrastructure anddigital content
9. Economicimpacts
2. Business and innovation environment
10. Socialimpacts
1
2
3
4
5
6
7
@ 2013 World Economic Forum

The Networked Readiness Index in detailINDICATOR RANK /144 VALUE
1st pillar: Political and regulatory environment1.01 Effectiveness of law-making bodies* ................126 ......... 2.51.02 Laws relating to ICTs* ........................................78 ......... 3.81.03 Judicial independence* ....................................128 ......... 2.51.04 Efficiency of legal system in settling disputes* ..130 ......... 2.71.05 Efficiency of legal system in challenging regs* ..138 ......... 2.51.06 Intellectual property protection* ........................115 ......... 2.81.07 Software piracy rate, % software installed ..........67 .......... 681.08 No. procedures to enforce a contract ................90 .......... 391.09 No. days to enforce a contract ..........................86 ........ 588
2nd pillar: Business and innovation environment2.01 Availability of latest technologies* .....................102 ......... 4.52.02 Venture capital availability* .................................68 ......... 2.62.03 Total tax rate, % profits ......................................56 ....... 34.62.04 No. days to start a business ............................129 .......... 562.05 No. procedures to start a business ..................132 .......... 132.06 Intensity of local competition* ...........................103 ......... 4.32.07 Tertiary education gross enrollment rate, % ........64 ....... 39.82.08 Quality of management schools* ........................94 ......... 3.82.09 Gov’t procurement of advanced tech* ...............60 ......... 3.7
3rd pillar: Infrastructure and digital content3.01 Electricity production, kWh/capita ......................93 .. 1,208.13.02 Mobile network coverage, % pop ......................95 ....... 94.63.03 Int’l Internet bandwidth, kb/s per user................48 ....... 27.73.04 Secure Internet servers/million pop ....................77 ....... 19.73.05 Accessibility of digital content* .........................109 ......... 4.2
4th pillar: Affordability4.01 Mobile cellular tariffs, PPP $/min. .......................93 ....... 0.374.02 Fixed broadband Internet tariffs, PPP $/month ..97 ..... 41.944.03 Internet & telephony competition, 0–2 (best) ........1 ....... 2.00
5th pillar: Skills5.01 Quality of educational system* ...........................93 ......... 3.35.02 Quality of math & science education* ...............102 ......... 3.55.03 Secondary education gross enrollment rate, % ..79 ....... 87.85.04 Adult literacy rate, % ..........................................79 ....... 91.9
INDICATOR RANK /144 VALUE
6th pillar: Individual usage 6.01 Mobile phone subscriptions/100 pop. ................76 ..... 104.5 6.02 Individuals using Internet, %...............................88 ....... 31.4 6.03 Households w/ personal computer, % ...............78 ....... 28.8 6.04 Households w/ Internet access, % ....................81 ....... 16.9 6.05 Broadband Internet subscriptions/100 pop. .......80 ......... 4.2 6.06 Mobile broadband subscriptions/100 pop. .........73 ....... 10.3 6.07 Use of virtual social networks* .........................113 ......... 4.8
7th pillar: Business usage 7.01 Firm-level technology absorption* ....................101 ......... 4.3 7.02 Capacity for innovation* .....................................82 ......... 3.0 7.03 PCT patents, applications/million pop. ..............97 ......... 0.1 7.04 Business-to-business Internet use* ...................n/a ......... n/a 7.05 Business-to-consumer Internet use* .................n/a ......... n/a 7.06 Extent of staff training* .......................................90 ......... 3.7
8th pillar: Government usage 8.01 Importance of ICTs to gov’t vision* .....................82 ......... 3.8 8.02 Government Online Service Index, 0–1 (best) .....79 ....... 0.46 8.03 Gov’t success in ICT promotion* .......................n/a ......... n/a
9th pillar: Economic impacts 9.01 Impact of ICTs on new services and products* ..89 ......... 4.2 9.02 ICT PCT patents, applications/million pop. .......87 ......... 0.0 9.03 Impact of ICTs on new organizational models* ...83 ......... 4.0 9.04 Knowledge-intensive jobs, % workforce .............81 ....... 18.1
10th pillar: Social impacts 10.01 Impact of ICTs on access to basic services* ......87 ......... 4.0 10.02 Internet access in schools* ................................98 ......... 3.5 10.03 ICT use & gov’t efficiency* .................................72 ......... 4.2 10.04 E-Participation Index, 0–1 (best).........................58 ....... 0.24
Rank Score (out of 144) (1–7)
Networked Readiness Index 2013 ..............91 ..3.6Networked Readiness Index 2012 (out of 142) ...................... 96 .....3.5
A. Environment subindex ............................................113 ....3.51st pillar: Political and regulatory environment ................. 118 .....3.12nd pillar: Business and innovation environment ............... 96 .....3.9
B. Readiness subindex .................................................89 ....4.33rd pillar: Infrastructure and digital content ........................ 78 .....3.74th pillar: Affordability ........................................................ 91 .....4.55th pillar: Skills ................................................................... 84 .....4.5
C. Usage subindex ........................................................88 ....3.36th pillar: Individual usage .................................................. 85 .....2.97th pillar: Business usage .................................................. 92 .....3.38th pillar: Government usage ............................................. 94 .....3.8
D. Impact subindex .......................................................90 ....3.29th pillar: Economic impacts .............................................. 90 .....3.010th pillar: Social impacts .................................................. 82 .....3.5
Ecuador3: Country/Economy Profiles
The Global Information Technology Report 2013 | 177
Note: Indicators followed by an asterisk (*) are measured on a 1-to-7 (best) scale. For further details and explanation, please refer to the section “How to Read the Country/Economy Profiles” on page 139.
Ecuador Upper-middle-income group average
1. Political and regulatory environment
6. Individual usage
5. Skills7. Business usage
4. Affordability8. Governmentusage
3. Infrastructure anddigital content
9. Economicimpacts
2. Business and innovation environment
10. Socialimpacts
1
2
3
4
5
6
7
@ 2013 World Economic Forum

The Networked Readiness Index in detailINDICATOR RANK /144 VALUE
1st pillar: Political and regulatory environment1.01 Effectiveness of law-making bodies* ................122 ......... 2.61.02 Laws relating to ICTs* ........................................87 ......... 3.71.03 Judicial independence* ......................................53 ......... 4.11.04 Efficiency of legal system in settling disputes* ....86 ......... 3.41.05 Efficiency of legal system in challenging regs* ..100 ......... 3.21.06 Intellectual property protection* ..........................83 ......... 3.31.07 Software piracy rate, % software installed ..........53 .......... 611.08 No. procedures to enforce a contract ..............116 .......... 421.09 No. days to enforce a contract ........................130 ..... 1,010
2nd pillar: Business and innovation environment2.01 Availability of latest technologies* .....................115 ......... 4.22.02 Venture capital availability* .................................40 ......... 3.02.03 Total tax rate, % profits ......................................90 ....... 42.62.04 No. days to start a business ..............................25 ............ 72.05 No. procedures to start a business ....................48 ............ 62.06 Intensity of local competition* ...........................121 ......... 4.0
2.07 Tertiary education gross enrollment rate, % ........75 ....... 32.42.08 Quality of management schools* ......................137 ......... 2.8
2.09 Gov’t procurement of advanced tech* ...............95 ......... 3.3
3rd pillar: Infrastructure and digital content 3.01 Electricity production, kWh/capita ......................86 .. 1,743.7 3.02 Mobile network coverage, % pop ......................41 ....... 99.73.03 Int’l Internet bandwidth, kb/s per user..............114 ......... 3.8
3.04 Secure Internet servers/million pop ..................105 ......... 3.0 3.05 Accessibility of digital content* .........................100 ......... 4.4
4th pillar: Affordability 4.01 Mobile cellular tariffs, PPP $/min. .........................8 ....... 0.054.02 Fixed broadband Internet tariffs, PPP $/month ..13 ..... 17.254.03 Internet & telephony competition, 0–2 (best) ....101 ....... 1.40
5th pillar: Skills5.01 Quality of educational system* .........................139 ......... 2.3
5.02 Quality of math & science education* ...............139 ......... 2.3 5.03 Secondary education gross enrollment rate, % 101 ....... 72.55.04 Adult literacy rate, % ........................................113 ....... 72.0
INDICATOR RANK /144 VALUE
6th pillar: Individual usage 6.01 Mobile phone subscriptions/100 pop. ................82 ..... 101.1 6.02 Individuals using Internet, %...............................73 ....... 38.7 6.03 Households w/ personal computer, % ...............70 ....... 36.4 6.04 Households w/ Internet access, % ....................70 ....... 30.5 6.05 Broadband Internet subscriptions/100 pop. .......91 ......... 2.2 6.06 Mobile broadband subscriptions/100 pop. .........46 ....... 24.0 6.07 Use of virtual social networks* ...........................38 ......... 5.9
7th pillar: Business usage 7.01 Firm-level technology absorption* ......................86 ......... 4.6 7.02 Capacity for innovation* .....................................80 ......... 3.0 7.03 PCT patents, applications/million pop. ..............72 ......... 0.6 7.04 Business-to-business Internet use* ..................111 ......... 4.4 7.05 Business-to-consumer Internet use* ..................80 ......... 4.4 7.06 Extent of staff training* .....................................129 ......... 3.1
8th pillar: Government usage 8.01 Importance of ICTs to gov’t vision* ...................122 ......... 3.1 8.02 Government Online Service Index, 0–1 (best) .....42 ....... 0.60 8.03 Gov’t success in ICT promotion* ........................92 ......... 4.0
9th pillar: Economic impacts 9.01 Impact of ICTs on new services and products* ..98 ......... 4.0 9.02 ICT PCT patents, applications/million pop. .......67 ......... 0.2 9.03 Impact of ICTs on new organizational models* ...80 ......... 4.0 9.04 Knowledge-intensive jobs, % workforce .............43 ....... 30.3
10th pillar: Social impacts 10.01 Impact of ICTs on access to basic services* ....104 ......... 3.8 10.02 Internet access in schools* ..............................116 ......... 3.0 10.03 ICT use & gov’t efficiency* .................................94 ......... 3.8 10.04 E-Participation Index, 0–1 (best).........................15 ....... 0.68
Rank Score (out of 144) (1–7)
Networked Readiness Index 2013 ..............80 ..3.8Networked Readiness Index 2012 (out of 142) ...................... 79 .....3.8
A. Environment subindex ..............................................99 ....3.61st pillar: Political and regulatory environment ................... 96 .....3.42nd pillar: Business and innovation environment ............... 98 .....3.8
B. Readiness subindex .................................................82 ....4.43rd pillar: Infrastructure and digital content ........................ 93 .....3.24th pillar: Affordability .......................................................... 8 .....6.55th pillar: Skills ................................................................. 115 .....3.6
C. Usage subindex ........................................................75 ....3.56th pillar: Individual usage .................................................. 69 .....3.47th pillar: Business usage ................................................ 108 .....3.18th pillar: Government usage ............................................. 80 .....3.9
D. Impact subindex .......................................................62 ....3.69th pillar: Economic impacts .............................................. 67 .....3.310th pillar: Social impacts .................................................. 58 .....3.9
Egypt3: Country/Economy Profiles
178 | The Global Information Technology Report 2013
Note: Indicators followed by an asterisk (*) are measured on a 1-to-7 (best) scale. For further details and explanation, please refer to the section “How to Read the Country/Economy Profiles” on page 139.
Egypt Lower-middle-income group average
1. Political and regulatory environment
6. Individual usage
5. Skills7. Business usage
4. Affordability8. Governmentusage
3. Infrastructure anddigital content
9. Economicimpacts
2. Business and innovation environment
10. Socialimpacts
1
2
3
4
5
6
7
@ 2013 World Economic Forum

The Networked Readiness Index in detailINDICATOR RANK /144 VALUE
1st pillar: Political and regulatory environment1.01 Effectiveness of law-making bodies* ................137 ......... 2.21.02 Laws relating to ICTs* ......................................116 ......... 3.21.03 Judicial independence* ....................................116 ......... 2.71.04 Efficiency of legal system in settling disputes* ..123 ......... 2.81.05 Efficiency of legal system in challenging regs* ..117 ......... 2.91.06 Intellectual property protection* ........................133 ......... 2.41.07 Software piracy rate, % software installed ..........86 .......... 801.08 No. procedures to enforce a contract ................43 .......... 341.09 No. days to enforce a contract ........................116 ........ 786
2nd pillar: Business and innovation environment2.01 Availability of latest technologies* .......................88 ......... 4.72.02 Venture capital availability* .................................95 ......... 2.32.03 Total tax rate, % profits ......................................60 ....... 35.02.04 No. days to start a business ..............................75 .......... 172.05 No. procedures to start a business ....................88 ............ 82.06 Intensity of local competition* .............................64 ......... 4.92.07 Tertiary education gross enrollment rate, % ........85 ....... 23.42.08 Quality of management schools* ........................99 ......... 3.82.09 Gov’t procurement of advanced tech* .............113 ......... 3.1
3rd pillar: Infrastructure and digital content3.01 Electricity production, kWh/capita ......................98 ..... 939.53.02 Mobile network coverage, % pop ......................90 ....... 95.03.03 Int’l Internet bandwidth, kb/s per user..............101 ......... 6.03.04 Secure Internet servers/million pop ....................82 ....... 16.93.05 Accessibility of digital content* ...........................68 ......... 5.1
4th pillar: Affordability4.01 Mobile cellular tariffs, PPP $/min. .......................63 ....... 0.264.02 Fixed broadband Internet tariffs, PPP $/month ..54 ..... 29.394.03 Internet & telephony competition, 0–2 (best) ........1 ....... 2.00
5th pillar: Skills5.01 Quality of educational system* .........................134 ......... 2.55.02 Quality of math & science education* ...............133 ......... 2.55.03 Secondary education gross enrollment rate, % 105 ....... 67.65.04 Adult literacy rate, % ........................................103 ....... 84.5
INDICATOR RANK /144 VALUE
6th pillar: Individual usage 6.01 Mobile phone subscriptions/100 pop. ................27 ..... 133.5 6.02 Individuals using Internet, %.............................102 ....... 17.7 6.03 Households w/ personal computer, % ...............96 ....... 13.3 6.04 Households w/ Internet access, % ....................97 ......... 8.0 6.05 Broadband Internet subscriptions/100 pop. .......85 ......... 3.3 6.06 Mobile broadband subscriptions/100 pop. .........92 ......... 3.6 6.07 Use of virtual social networks* ...........................57 ......... 5.6
7th pillar: Business usage 7.01 Firm-level technology absorption* ......................92 ......... 4.5 7.02 Capacity for innovation* ...................................107 ......... 2.7 7.03 PCT patents, applications/million pop. ............100 ......... 0.1 7.04 Business-to-business Internet use* ..................117 ......... 4.3 7.05 Business-to-consumer Internet use* ..................59 ......... 4.7 7.06 Extent of staff training* .......................................81 ......... 3.8
8th pillar: Government usage 8.01 Importance of ICTs to gov’t vision* ...................126 ......... 3.1 8.02 Government Online Service Index, 0–1 (best) .....32 ....... 0.67 8.03 Gov’t success in ICT promotion* ......................123 ......... 3.4
9th pillar: Economic impacts 9.01 Impact of ICTs on new services and products* ..88 ......... 4.2 9.02 ICT PCT patents, applications/million pop. .......95 ......... 0.0 9.03 Impact of ICTs on new organizational models* ...76 ......... 4.1 9.04 Knowledge-intensive jobs, % workforce .............95 ....... 12.5
10th pillar: Social impacts 10.01 Impact of ICTs on access to basic services* ......98 ......... 3.8 10.02 Internet access in schools* ..............................103 ......... 3.4 10.03 ICT use & gov’t efficiency* ...............................113 ......... 3.5 10.04 E-Participation Index, 0–1 (best).........................28 ....... 0.55
Rank Score (out of 144) (1–7)
Networked Readiness Index 2013 ..............93 ..3.5Networked Readiness Index 2012 (out of 142) .................... 103 .....3.4
A. Environment subindex ............................................117 ....3.41st pillar: Political and regulatory environment ................. 129 .....2.92nd pillar: Business and innovation environment ............... 87 .....4.0
B. Readiness subindex .................................................90 ....4.23rd pillar: Infrastructure and digital content ........................ 92 .....3.24th pillar: Affordability ........................................................ 41 .....5.75th pillar: Skills ................................................................. 117 .....3.6
C. Usage subindex ........................................................94 ....3.36th pillar: Individual usage .................................................. 91 .....2.87th pillar: Business usage ................................................ 100 .....3.28th pillar: Government usage ............................................. 88 .....3.8
D. Impact subindex .......................................................85 ....3.39th pillar: Economic impacts ............................................ 103 .....2.910th pillar: Social impacts .................................................. 71 .....3.8
El Salvador3: Country/Economy Profiles
The Global Information Technology Report 2013 | 179
Note: Indicators followed by an asterisk (*) are measured on a 1-to-7 (best) scale. For further details and explanation, please refer to the section “How to Read the Country/Economy Profiles” on page 139.
El Salvador Lower-middle-income group average
1. Political and regulatory environment
6. Individual usage
5. Skills7. Business usage
4. Affordability8. Governmentusage
3. Infrastructure anddigital content
9. Economicimpacts
2. Business and innovation environment
10. Socialimpacts
1
2
3
4
5
6
7
@ 2013 World Economic Forum

The Networked Readiness Index in detailINDICATOR RANK /144 VALUE
1st pillar: Political and regulatory environment1.01 Effectiveness of law-making bodies* ..................30 ......... 4.41.02 Laws relating to ICTs* ..........................................3 ......... 5.81.03 Judicial independence* ......................................21 ......... 5.51.04 Efficiency of legal system in settling disputes* ....41 ......... 4.31.05 Efficiency of legal system in challenging regs* ....39 ......... 4.21.06 Intellectual property protection* ..........................34 ......... 4.71.07 Software piracy rate, % software installed ..........34 .......... 481.08 No. procedures to enforce a contract ................48 .......... 351.09 No. days to enforce a contract ..........................43 ........ 425
2nd pillar: Business and innovation environment2.01 Availability of latest technologies* .......................36 ......... 5.82.02 Venture capital availability* .................................33 ......... 3.22.03 Total tax rate, % profits ....................................132 ....... 67.32.04 No. days to start a business ..............................25 ............ 72.05 No. procedures to start a business ....................30 ............ 52.06 Intensity of local competition* .............................25 ......... 5.52.07 Tertiary education gross enrollment rate, % ........29 ....... 64.32.08 Quality of management schools* ........................48 ......... 4.52.09 Gov’t procurement of advanced tech* ...............35 ......... 4.0
3rd pillar: Infrastructure and digital content3.01 Electricity production, kWh/capita ......................14 .. 9,673.53.02 Mobile network coverage, % pop ......................24 ..... 100.03.03 Int’l Internet bandwidth, kb/s per user................54 ....... 24.43.04 Secure Internet servers/million pop ....................25 ..... 532.83.05 Accessibility of digital content* ...........................11 ......... 6.3
4th pillar: Affordability4.01 Mobile cellular tariffs, PPP $/min. .......................85 ....... 0.354.02 Fixed broadband Internet tariffs, PPP $/month ..55 ..... 29.454.03 Internet & telephony competition, 0–2 (best) ........1 ....... 2.00
5th pillar: Skills5.01 Quality of educational system* ...........................49 ......... 4.15.02 Quality of math & science education* .................19 ......... 5.05.03 Secondary education gross enrollment rate, % ..18 ..... 106.65.04 Adult literacy rate, % ............................................1 ....... 99.8
INDICATOR RANK /144 VALUE
6th pillar: Individual usage 6.01 Mobile phone subscriptions/100 pop. ................24 ..... 139.0 6.02 Individuals using Internet, %...............................23 ....... 76.5 6.03 Households w/ personal computer, % ...............34 ....... 71.4 6.04 Households w/ Internet access, % ....................29 ....... 70.8 6.05 Broadband Internet subscriptions/100 pop. .......23 ....... 24.8 6.06 Mobile broadband subscriptions/100 pop. .........24 ....... 42.0 6.07 Use of virtual social networks* .............................7 ......... 6.4
7th pillar: Business usage 7.01 Firm-level technology absorption* ......................34 ......... 5.5 7.02 Capacity for innovation* .....................................33 ......... 3.8 7.03 PCT patents, applications/million pop. ..............26 ....... 34.3 7.04 Business-to-business Internet use* ....................15 ......... 5.9 7.05 Business-to-consumer Internet use* ..................15 ......... 5.7 7.06 Extent of staff training* .......................................46 ......... 4.2
8th pillar: Government usage 8.01 Importance of ICTs to gov’t vision* .....................23 ......... 4.8 8.02 Government Online Service Index, 0–1 (best) .....18 ....... 0.82 8.03 Gov’t success in ICT promotion* ........................14 ......... 5.4
9th pillar: Economic impacts 9.01 Impact of ICTs on new services and products* ....7 ......... 5.5 9.02 ICT PCT patents, applications/million pop. .......21 ....... 14.9 9.03 Impact of ICTs on new organizational models* ...12 ......... 5.2 9.04 Knowledge-intensive jobs, % workforce .............24 ....... 38.8
10th pillar: Social impacts 10.01 Impact of ICTs on access to basic services* ........8 ......... 5.8 10.02 Internet access in schools* ..................................2 ......... 6.4 10.03 ICT use & gov’t efficiency* .................................10 ......... 5.5 10.04 E-Participation Index, 0–1 (best)...........................8 ....... 0.76
Rank Score (out of 144) (1–7)
Networked Readiness Index 2013 ..............22 ..5.1Networked Readiness Index 2012 (out of 142) ...................... 24 .....5.1
A. Environment subindex ..............................................31 ....4.71st pillar: Political and regulatory environment ................... 27 .....4.82nd pillar: Business and innovation environment ............... 45 .....4.6
B. Readiness subindex .................................................24 ....5.63rd pillar: Infrastructure and digital content ........................ 26 .....5.84th pillar: Affordability ........................................................ 56 .....5.45th pillar: Skills ................................................................... 30 .....5.4
C. Usage subindex ........................................................25 ....5.06th pillar: Individual usage .................................................. 23 .....5.57th pillar: Business usage .................................................. 29 .....4.18th pillar: Government usage ............................................. 17 .....5.4
D. Impact subindex .......................................................15 ....5.29th pillar: Economic impacts .............................................. 23 .....4.610th pillar: Social impacts .................................................... 5 .....5.8
Estonia3: Country/Economy Profiles
180 | The Global Information Technology Report 2013
Note: Indicators followed by an asterisk (*) are measured on a 1-to-7 (best) scale. For further details and explanation, please refer to the section “How to Read the Country/Economy Profiles” on page 139.
Estonia High-income group average
1. Political and regulatory environment
6. Individual usage
5. Skills7. Business usage
4. Affordability8. Governmentusage
3. Infrastructure anddigital content
9. Economicimpacts
2. Business and innovation environment
10. Socialimpacts
1
2
3
4
5
6
7
@ 2013 World Economic Forum

The Networked Readiness Index in detailINDICATOR RANK /144 VALUE
1st pillar: Political and regulatory environment1.01 Effectiveness of law-making bodies* ..................70 ......... 3.51.02 Laws relating to ICTs* ......................................121 ......... 3.11.03 Judicial independence* ....................................109 ......... 2.81.04 Efficiency of legal system in settling disputes* ....62 ......... 3.81.05 Efficiency of legal system in challenging regs* ....75 ......... 3.51.06 Intellectual property protection* ..........................65 ......... 3.71.07 Software piracy rate, % software installed .........n/a ......... n/a1.08 No. procedures to enforce a contract ................78 .......... 381.09 No. days to enforce a contract ..........................73 ........ 530
2nd pillar: Business and innovation environment2.01 Availability of latest technologies* .....................132 ......... 3.82.02 Venture capital availability* ...............................118 ......... 2.12.03 Total tax rate, % profits ......................................47 ....... 33.32.04 No. days to start a business ..............................69 .......... 152.05 No. procedures to start a business ..................102 ............ 92.06 Intensity of local competition* ...........................139 ......... 3.62.07 Tertiary education gross enrollment rate, % ......120 ......... 7.62.08 Quality of management schools* ......................108 ......... 3.62.09 Gov’t procurement of advanced tech* ...............59 ......... 3.7
3rd pillar: Infrastructure and digital content3.01 Electricity production, kWh/capita ....................137 ....... 50.63.02 Mobile network coverage, % pop ....................137 ....... 10.03.03 Int’l Internet bandwidth, kb/s per user................95 ......... 7.03.04 Secure Internet servers/million pop ..................142 ......... 0.23.05 Accessibility of digital content* .........................140 ......... 3.0
4th pillar: Affordability4.01 Mobile cellular tariffs, PPP $/min. .......................27 ....... 0.154.02 Fixed broadband Internet tariffs, PPP $/month 115 ..... 70.624.03 Internet & telephony competition, 0–2 (best) ....140 ....... 0.00
5th pillar: Skills5.01 Quality of educational system* ...........................85 ......... 3.45.02 Quality of math & science education* ...............105 ......... 3.45.03 Secondary education gross enrollment rate, % 130 ....... 37.65.04 Adult literacy rate, % ........................................138 ....... 39.0
INDICATOR RANK /144 VALUE
6th pillar: Individual usage 6.01 Mobile phone subscriptions/100 pop. ..............144 ....... 16.7 6.02 Individuals using Internet, %.............................142 ......... 1.1 6.03 Households w/ personal computer, % .............137 ......... 1.4 6.04 Households w/ Internet access, % ..................140 ......... 0.1 6.05 Broadband Internet subscriptions/100 pop. .....139 ......... 0.0 6.06 Mobile broadband subscriptions/100 pop. .......114 ......... 0.3 6.07 Use of virtual social networks* .........................142 ......... 3.4
7th pillar: Business usage 7.01 Firm-level technology absorption* ....................139 ......... 3.7 7.02 Capacity for innovation* ...................................133 ......... 2.3 7.03 PCT patents, applications/million pop. ............122 ......... 0.0 7.04 Business-to-business Internet use* ..................130 ......... 4.0 7.05 Business-to-consumer Internet use* ................134 ......... 3.0 7.06 Extent of staff training* .....................................130 ......... 3.1
8th pillar: Government usage 8.01 Importance of ICTs to gov’t vision* .....................59 ......... 4.1 8.02 Government Online Service Index, 0–1 (best) .....75 ....... 0.47 8.03 Gov’t success in ICT promotion* ......................105 ......... 3.8
9th pillar: Economic impacts 9.01 Impact of ICTs on new services and products* 124 ......... 3.6 9.02 ICT PCT patents, applications/million pop. .......95 ......... 0.0 9.03 Impact of ICTs on new organizational models* .120 ......... 3.4 9.04 Knowledge-intensive jobs, % workforce .............96 ....... 12.4
10th pillar: Social impacts 10.01 Impact of ICTs on access to basic services* ....124 ......... 3.3 10.02 Internet access in schools* ..............................119 ......... 2.8 10.03 ICT use & gov’t efficiency* .................................90 ......... 3.9 10.04 E-Participation Index, 0–1 (best).........................43 ....... 0.34
Rank Score (out of 144) (1–7)
Networked Readiness Index 2013 ............128 ..2.9Networked Readiness Index 2012 (out of 142) .................... 130 .....2.9
A. Environment subindex ............................................104 ....3.61st pillar: Political and regulatory environment ................... 83 .....3.62nd pillar: Business and innovation environment ............. 119 .....3.5
B. Readiness subindex ...............................................140 ....2.33rd pillar: Infrastructure and digital content ...................... 141 .....1.64th pillar: Affordability ...................................................... 126 .....2.85th pillar: Skills ................................................................. 137 .....2.6
C. Usage subindex ......................................................130 ....2.66th pillar: Individual usage ................................................ 143 .....1.37th pillar: Business usage ................................................ 140 .....2.68th pillar: Government usage ............................................. 83 .....3.9
D. Impact subindex .....................................................110 ....2.99th pillar: Economic impacts ............................................ 127 .....2.510th pillar: Social impacts .................................................. 99 .....3.3
Ethiopia3: Country/Economy Profiles
The Global Information Technology Report 2013 | 181
Note: Indicators followed by an asterisk (*) are measured on a 1-to-7 (best) scale. For further details and explanation, please refer to the section “How to Read the Country/Economy Profiles” on page 139.
Ethiopia Low-income group average
1. Political and regulatory environment
6. Individual usage
5. Skills7. Business usage
4. Affordability8. Governmentusage
3. Infrastructure anddigital content
9. Economicimpacts
2. Business and innovation environment
10. Socialimpacts
1
2
3
4
5
6
7
@ 2013 World Economic Forum

The Networked Readiness Index in detailINDICATOR RANK /144 VALUE
1st pillar: Political and regulatory environment1.01 Effectiveness of law-making bodies* ....................3 ......... 5.61.02 Laws relating to ICTs* ..........................................4 ......... 5.71.03 Judicial independence* ........................................2 ......... 6.51.04 Efficiency of legal system in settling disputes* ......2 ......... 6.01.05 Efficiency of legal system in challenging regs* ......1 ......... 5.91.06 Intellectual property protection* ............................1 ......... 6.31.07 Software piracy rate, % software installed ..........10 .......... 251.08 No. procedures to enforce a contract ................36 .......... 331.09 No. days to enforce a contract ..........................24 ........ 375
2nd pillar: Business and innovation environment2.01 Availability of latest technologies* .........................3 ......... 6.62.02 Venture capital availability* .................................13 ......... 3.9
2.03 Total tax rate, % profits ......................................81 ....... 40.6 2.04 No. days to start a business ..............................67 .......... 14 2.05 No. procedures to start a business ....................10 ............ 3 2.06 Intensity of local competition* .............................68 ......... 4.9 2.07 Tertiary education gross enrollment rate, % ..........3 ....... 93.7 2.08 Quality of management schools* ........................10 ......... 5.6 2.09 Gov’t procurement of advanced tech* ...............14 ......... 4.5
3rd pillar: Infrastructure and digital content 3.01 Electricity production, kWh/capita ........................7 14,982.0 3.02 Mobile network coverage, % pop ......................47 ....... 99.5 3.03 Int’l Internet bandwidth, kb/s per user................14 ..... 118.4 3.04 Secure Internet servers/million pop ....................13 .. 1,486.7 3.05 Accessibility of digital content* .............................5 ......... 6.4
4th pillar: Affordability 4.01 Mobile cellular tariffs, PPP $/min. .......................13 ....... 0.07 4.02 Fixed broadband Internet tariffs, PPP $/month ..50 ..... 28.85 4.03 Internet & telephony competition, 0–2 (best) ......75 ....... 1.83
5th pillar: Skills 5.01 Quality of educational system* .............................2 ......... 5.8 5.02 Quality of math & science education* ...................2 ......... 6.2 5.03 Secondary education gross enrollment rate, % ..16 ..... 107.5 5.04 Adult literacy rate, % ..........................................15 ....... 99.0
INDICATOR RANK /144 VALUE
6th pillar: Individual usage 6.01 Mobile phone subscriptions/100 pop. ..................9 ..... 166.0 6.02 Individuals using Internet, %.................................7 ....... 89.4 6.03 Households w/ personal computer, % ...............13 ....... 85.1 6.04 Households w/ Internet access, % ....................11 ....... 84.2 6.05 Broadband Internet subscriptions/100 pop. .......16 ....... 29.5 6.06 Mobile broadband subscriptions/100 pop. ...........5 ....... 87.1 6.07 Use of virtual social networks* .............................8 ......... 6.3
7th pillar: Business usage 7.01 Firm-level technology absorption* ........................6 ......... 6.1 7.02 Capacity for innovation* .......................................4 ......... 5.6 7.03 PCT patents, applications/million pop. ................3 ..... 279.3 7.04 Business-to-business Internet use* ......................1 ......... 6.3 7.05 Business-to-consumer Internet use* ....................6 ......... 6.0 7.06 Extent of staff training* .........................................2 ......... 5.4
8th pillar: Government usage 8.01 Importance of ICTs to gov’t vision* .....................18 ......... 4.9 8.02 Government Online Service Index, 0–1 (best) .......7 ....... 0.88 8.03 Gov’t success in ICT promotion* ........................12 ......... 5.4
9th pillar: Economic impacts 9.01 Impact of ICTs on new services and products* ....1 ......... 5.9 9.02 ICT PCT patents, applications/million pop. .........1 ..... 126.5 9.03 Impact of ICTs on new organizational models* .....2 ......... 5.6 9.04 Knowledge-intensive jobs, % workforce ...............8 ....... 43.8
10th pillar: Social impacts 10.01 Impact of ICTs on access to basic services* ......11 ......... 5.8 10.02 Internet access in schools* ..................................3 ......... 6.4 10.03 ICT use & gov’t efficiency* .................................15 ......... 5.3 10.04 E-Participation Index, 0–1 (best).........................11 ....... 0.74
Rank Score (out of 144) (1–7)
Networked Readiness Index 2013 ................ 1 ..6.0Networked Readiness Index 2012 (out of 142) ........................ 3 .....5.8
A. Environment subindex ................................................3 ....5.61st pillar: Political and regulatory environment ..................... 3 .....5.82nd pillar: Business and innovation environment ................. 7 .....5.3
B. Readiness subindex ...................................................1 ....6.53rd pillar: Infrastructure and digital content .......................... 2 .....6.94th pillar: Affordability ........................................................ 19 .....6.25th pillar: Skills ..................................................................... 1 .....6.5
C. Usage subindex ..........................................................2 ....6.06th pillar: Individual usage .................................................... 6 .....6.47th pillar: Business usage .................................................... 3 .....6.08th pillar: Government usage ............................................. 10 .....5.5
D. Impact subindex .........................................................3 ....5.99th pillar: Economic impacts ................................................ 1 .....6.010th pillar: Social impacts .................................................... 9 .....5.7
Finland3: Country/Economy Profiles
182 | The Global Information Technology Report 2013
Note: Indicators followed by an asterisk (*) are measured on a 1-to-7 (best) scale. For further details and explanation, please refer to the section “How to Read the Country/Economy Profiles” on page 139.
Finland High-income group average
1. Political and regulatory environment
6. Individual usage
5. Skills7. Business usage
4. Affordability8. Governmentusage
3. Infrastructure anddigital content
9. Economicimpacts
2. Business and innovation environment
10. Socialimpacts
1
2
3
4
5
6
7
@ 2013 World Economic Forum

The Networked Readiness Index in detailINDICATOR RANK /144 VALUE
1st pillar: Political and regulatory environment1.01 Effectiveness of law-making bodies* ..................28 ......... 4.51.02 Laws relating to ICTs* ........................................24 ......... 5.11.03 Judicial independence* ......................................37 ......... 4.91.04 Efficiency of legal system in settling disputes* ....37 ......... 4.41.05 Efficiency of legal system in challenging regs* ....27 ......... 4.51.06 Intellectual property protection* ............................9 ......... 5.61.07 Software piracy rate, % software installed ..........22 .......... 371.08 No. procedures to enforce a contract ................15 .......... 291.09 No. days to enforce a contract ..........................25 ........ 390
2nd pillar: Business and innovation environment2.01 Availability of latest technologies* .......................16 ......... 6.32.02 Venture capital availability* .................................57 ......... 2.82.03 Total tax rate, % profits ....................................130 ....... 65.72.04 No. days to start a business ..............................25 ............ 72.05 No. procedures to start a business ....................30 ............ 52.06 Intensity of local competition* .............................28 ......... 5.52.07 Tertiary education gross enrollment rate, % ........44 ....... 56.72.08 Quality of management schools* ..........................8 ......... 5.62.09 Gov’t procurement of advanced tech* ...............49 ......... 3.8
3rd pillar: Infrastructure and digital content3.01 Electricity production, kWh/capita ......................18 .. 8,722.73.02 Mobile network coverage, % pop ......................51 ....... 99.03.03 Int’l Internet bandwidth, kb/s per user................20 ....... 78.63.04 Secure Internet servers/million pop ....................31 ..... 354.13.05 Accessibility of digital content* ...........................38 ......... 5.6
4th pillar: Affordability4.01 Mobile cellular tariffs, PPP $/min. .....................126 ....... 0.574.02 Fixed broadband Internet tariffs, PPP $/month ..46 ..... 27.564.03 Internet & telephony competition, 0–2 (best) ........1 ....... 2.00
5th pillar: Skills5.01 Quality of educational system* ...........................41 ......... 4.25.02 Quality of math & science education* .................25 ......... 4.95.03 Secondary education gross enrollment rate, % ....8 ..... 113.25.04 Adult literacy rate, % ..........................................15 ....... 99.0
INDICATOR RANK /144 VALUE
6th pillar: Individual usage 6.01 Mobile phone subscriptions/100 pop. ................93 ....... 94.8 6.02 Individuals using Internet, %...............................16 ....... 79.6 6.03 Households w/ personal computer, % ...............24 ....... 78.2 6.04 Households w/ Internet access, % ....................23 ....... 75.9 6.05 Broadband Internet subscriptions/100 pop. .........5 ....... 36.0 6.06 Mobile broadband subscriptions/100 pop. .........33 ....... 36.6 6.07 Use of virtual social networks* ...........................24 ......... 6.1
7th pillar: Business usage 7.01 Firm-level technology absorption* ......................35 ......... 5.5 7.02 Capacity for innovation* .....................................10 ......... 5.0 7.03 PCT patents, applications/million pop. ..............14 ..... 108.2 7.04 Business-to-business Internet use* ....................25 ......... 5.7 7.05 Business-to-consumer Internet use* ..................25 ......... 5.4 7.06 Extent of staff training* .......................................41 ......... 4.3
8th pillar: Government usage 8.01 Importance of ICTs to gov’t vision* .....................50 ......... 4.3 8.02 Government Online Service Index, 0–1 (best) .......8 ....... 0.88 8.03 Gov’t success in ICT promotion* ........................60 ......... 4.5
9th pillar: Economic impacts 9.01 Impact of ICTs on new services and products* ..10 ......... 5.5 9.02 ICT PCT patents, applications/million pop. .......13 ....... 30.4 9.03 Impact of ICTs on new organizational models* ...22 ......... 5.0 9.04 Knowledge-intensive jobs, % workforce .............17 ....... 40.8
10th pillar: Social impacts 10.01 Impact of ICTs on access to basic services* ......29 ......... 5.3 10.02 Internet access in schools* ................................59 ......... 4.4 10.03 ICT use & gov’t efficiency* .................................28 ......... 5.0 10.04 E-Participation Index, 0–1 (best).........................25 ....... 0.58
Rank Score (out of 144) (1–7)
Networked Readiness Index 2013 ..............26 ..5.1Networked Readiness Index 2012 (out of 142) ...................... 23 .....5.1
A. Environment subindex ..............................................27 ....4.81st pillar: Political and regulatory environment ................... 20 .....5.02nd pillar: Business and innovation environment ............... 39 .....4.7
B. Readiness subindex .................................................26 ....5.43rd pillar: Infrastructure and digital content ........................ 28 .....5.84th pillar: Affordability ........................................................ 86 .....4.85th pillar: Skills ................................................................... 21 .....5.6
C. Usage subindex ........................................................22 ....5.16th pillar: Individual usage .................................................. 24 .....5.57th pillar: Business usage .................................................. 18 .....4.98th pillar: Government usage ............................................. 25 .....5.0
D. Impact subindex .......................................................20 ....4.99th pillar: Economic impacts .............................................. 17 .....4.910th pillar: Social impacts .................................................. 32 .....4.8
France3: Country/Economy Profiles
The Global Information Technology Report 2013 | 183
Note: Indicators followed by an asterisk (*) are measured on a 1-to-7 (best) scale. For further details and explanation, please refer to the section “How to Read the Country/Economy Profiles” on page 139.
France High-income group average
1. Political and regulatory environment
6. Individual usage
5. Skills7. Business usage
4. Affordability8. Governmentusage
3. Infrastructure anddigital content
9. Economicimpacts
2. Business and innovation environment
10. Socialimpacts
1
2
3
4
5
6
7
@ 2013 World Economic Forum

The Networked Readiness Index in detailINDICATOR RANK /144 VALUE
1st pillar: Political and regulatory environment1.01 Effectiveness of law-making bodies* ..................62 ......... 3.71.02 Laws relating to ICTs* ......................................134 ......... 2.61.03 Judicial independence* ....................................117 ......... 2.61.04 Efficiency of legal system in settling disputes* ....60 ......... 3.81.05 Efficiency of legal system in challenging regs* ....50 ......... 4.01.06 Intellectual property protection* ..........................99 ......... 3.11.07 Software piracy rate, % software installed .........n/a ......... n/a1.08 No. procedures to enforce a contract ................78 .......... 381.09 No. days to enforce a contract ........................131 ..... 1,070
2nd pillar: Business and innovation environment2.01 Availability of latest technologies* .....................121 ......... 4.12.02 Venture capital availability* ...............................100 ......... 2.3
2.03 Total tax rate, % profits ......................................92 ....... 43.52.04 No. days to start a business ............................131 .......... 582.05 No. procedures to start a business ..................102 ............ 92.06 Intensity of local competition* ...........................132 ......... 3.8
2.07 Tertiary education gross enrollment rate, % .......n/a ......... n/a2.08 Quality of management schools* ......................130 ......... 3.1
2.09 Gov’t procurement of advanced tech* .............117 ......... 3.0
3rd pillar: Infrastructure and digital content 3.01 Electricity production, kWh/capita ......................94 .. 1,127.6 3.02 Mobile network coverage, % pop ....................119 ....... 79.03.03 Int’l Internet bandwidth, kb/s per user..............100 ......... 6.3
3.04 Secure Internet servers/million pop ....................94 ......... 8.5 3.05 Accessibility of digital content* .........................144 ......... 2.5
4th pillar: Affordability 4.01 Mobile cellular tariffs, PPP $/min. .....................116 ....... 0.514.02 Fixed broadband Internet tariffs, PPP $/month .n/a ......... n/a4.03 Internet & telephony competition, 0–2 (best) ........1 ....... 2.00
5th pillar: Skills5.01 Quality of educational system* .........................127 ......... 2.7
5.02 Quality of math & science education* ...............123 ......... 2.8 5.03 Secondary education gross enrollment rate, % 115 ....... 53.15.04 Adult literacy rate, % ..........................................95 ....... 88.4
INDICATOR RANK /144 VALUE
6th pillar: Individual usage 6.01 Mobile phone subscriptions/100 pop. ................48 ..... 117.3 6.02 Individuals using Internet, %.............................123 ......... 8.0 6.03 Households w/ personal computer, % .............108 ......... 7.6 6.04 Households w/ Internet access, % ..................103 ......... 6.0 6.05 Broadband Internet subscriptions/100 pop. .....114 ......... 0.3 6.06 Mobile broadband subscriptions/100 pop. .......126 ......... 0.0 6.07 Use of virtual social networks* .........................121 ......... 4.7
7th pillar: Business usage 7.01 Firm-level technology absorption* ......................97 ......... 4.4 7.02 Capacity for innovation* ...................................141 ......... 2.0 7.03 PCT patents, applications/million pop. ..............87 ......... 0.2 7.04 Business-to-business Internet use* ..................104 ......... 4.5 7.05 Business-to-consumer Internet use* ................129 ......... 3.2 7.06 Extent of staff training* .......................................93 ......... 3.7
8th pillar: Government usage 8.01 Importance of ICTs to gov’t vision* .....................90 ......... 3.7 8.02 Government Online Service Index, 0–1 (best) ...128 ....... 0.19 8.03 Gov’t success in ICT promotion* ........................86 ......... 4.1
9th pillar: Economic impacts 9.01 Impact of ICTs on new services and products* 121 ......... 3.6 9.02 ICT PCT patents, applications/million pop. .......95 ......... 0.0 9.03 Impact of ICTs on new organizational models* .141 ......... 2.7 9.04 Knowledge-intensive jobs, % workforce ............n/a ......... n/a
10th pillar: Social impacts 10.01 Impact of ICTs on access to basic services* ....134 ......... 3.1 10.02 Internet access in schools* ..............................142 ......... 1.7 10.03 ICT use & gov’t efficiency* ...............................130 ......... 3.2 10.04 E-Participation Index, 0–1 (best).........................91 ....... 0.11
Rank Score (out of 144) (1–7)
Networked Readiness Index 2013 ............121 ..3.0Networked Readiness Index 2012 (out of 142) ..................... n/a .....n/a
A. Environment subindex ............................................123 ....3.31st pillar: Political and regulatory environment ................. 107 .....3.32nd pillar: Business and innovation environment ............. 129 .....3.4
B. Readiness subindex ...............................................114 ....3.33rd pillar: Infrastructure and digital content ...................... 125 .....2.34th pillar: Affordability ........................................................ 96 .....4.15th pillar: Skills ................................................................. 116 .....3.6
C. Usage subindex ......................................................122 ....2.86th pillar: Individual usage ................................................ 105 .....2.37th pillar: Business usage ................................................ 130 .....2.88th pillar: Government usage ........................................... 120 .....3.3
D. Impact subindex .....................................................132 ....2.49th pillar: Economic impacts ............................................ 129 .....2.410th pillar: Social impacts ................................................ 133 .....2.4
Gabon3: Country/Economy Profiles
184 | The Global Information Technology Report 2013
Note: Indicators followed by an asterisk (*) are measured on a 1-to-7 (best) scale. For further details and explanation, please refer to the section “How to Read the Country/Economy Profiles” on page 139.
Gabon Upper-middle-income group average
1. Political and regulatory environment
6. Individual usage
5. Skills7. Business usage
4. Affordability8. Governmentusage
3. Infrastructure anddigital content
9. Economicimpacts
2. Business and innovation environment
10. Socialimpacts
1
2
3
4
5
6
7
@ 2013 World Economic Forum

The Networked Readiness Index in detailINDICATOR RANK /144 VALUE
1st pillar: Political and regulatory environment1.01 Effectiveness of law-making bodies* ..................23 ......... 4.81.02 Laws relating to ICTs* ........................................49 ......... 4.31.03 Judicial independence* ......................................49 ......... 4.31.04 Efficiency of legal system in settling disputes* ....21 ......... 4.91.05 Efficiency of legal system in challenging regs* ....26 ......... 4.51.06 Intellectual property protection* ..........................36 ......... 4.71.07 Software piracy rate, % software installed .........n/a ......... n/a1.08 No. procedures to enforce a contract ................36 .......... 331.09 No. days to enforce a contract ..........................36 ........ 407
2nd pillar: Business and innovation environment2.01 Availability of latest technologies* .......................71 ......... 4.92.02 Venture capital availability* .................................66 ......... 2.62.03 Total tax rate, % profits ....................................143 ..... 283.52.04 No. days to start a business ............................103 .......... 272.05 No. procedures to start a business ....................88 ............ 82.06 Intensity of local competition* .............................82 ......... 4.7
2.07 Tertiary education gross enrollment rate, % ......129 ......... 4.1 2.08 Quality of management schools* ........................31 ......... 4.92.09 Gov’t procurement of advanced tech* ...............13 ......... 4.5
3rd pillar: Infrastructure and digital content3.01 Electricity production, kWh/capita ....................123 ..... 142.73.02 Mobile network coverage, % pop ....................108 ....... 85.03.03 Int’l Internet bandwidth, kb/s per user..............130 ......... 1.63.04 Secure Internet servers/million pop ..................107 ......... 2.83.05 Accessibility of digital content* ...........................79 ......... 4.9
4th pillar: Affordability4.01 Mobile cellular tariffs, PPP $/min. .......................80 ....... 0.324.02 Fixed broadband Internet tariffs, PPP $/month 136 ... 952.004.03 Internet & telephony competition, 0–2 (best) ....118 ....... 1.13
5th pillar: Skills5.01 Quality of educational system* ...........................29 ......... 4.6
5.02 Quality of math & science education* .................74 ......... 4.0 5.03 Secondary education gross enrollment rate, % 114 ....... 54.15.04 Adult literacy rate, % ........................................132 ....... 50.0
INDICATOR RANK /144 VALUE
6th pillar: Individual usage 6.01 Mobile phone subscriptions/100 pop. ..............111 ....... 78.9 6.02 Individuals using Internet, %.............................117 ....... 10.9 6.03 Households w/ personal computer, % .............115 ......... 5.7 6.04 Households w/ Internet access, % ..................122 ......... 2.0 6.05 Broadband Internet subscriptions/100 pop. .....134 ......... 0.0 6.06 Mobile broadband subscriptions/100 pop. .......113 ......... 0.5 6.07 Use of virtual social networks* ...........................97 ......... 5.1
7th pillar: Business usage 7.01 Firm-level technology absorption* ......................68 ......... 4.8 7.02 Capacity for innovation* .....................................52 ......... 3.3 7.03 PCT patents, applications/million pop. ............123 ......... 0.0 7.04 Business-to-business Internet use* ....................64 ......... 5.0 7.05 Business-to-consumer Internet use* ..................75 ......... 4.5 7.06 Extent of staff training* .......................................22 ......... 4.7
8th pillar: Government usage 8.01 Importance of ICTs to gov’t vision* .....................27 ......... 4.7 8.02 Government Online Service Index, 0–1 (best) ...107 ....... 0.32 8.03 Gov’t success in ICT promotion* ........................16 ......... 5.2
9th pillar: Economic impacts 9.01 Impact of ICTs on new services and products* ..58 ......... 4.6 9.02 ICT PCT patents, applications/million pop. .......95 ......... 0.0 9.03 Impact of ICTs on new organizational models* ...59 ......... 4.3 9.04 Knowledge-intensive jobs, % workforce ............n/a ......... n/a
10th pillar: Social impacts 10.01 Impact of ICTs on access to basic services* ......53 ......... 4.6 10.02 Internet access in schools* ................................77 ......... 4.0 10.03 ICT use & gov’t efficiency* .................................42 ......... 4.7 10.04 E-Participation Index, 0–1 (best).......................124 ....... 0.00
Rank Score (out of 144) (1–7)
Networked Readiness Index 2013 ..............98 ..3.5Networked Readiness Index 2012 (out of 142) .................... 101 .....3.4
A. Environment subindex ..............................................54 ....4.11st pillar: Political and regulatory environment ................... 30 .....4.72nd pillar: Business and innovation environment ............. 116 .....3.6
B. Readiness subindex ...............................................125 ....3.03rd pillar: Infrastructure and digital content ...................... 117 .....2.74th pillar: Affordability ...................................................... 124 .....2.85th pillar: Skills ................................................................. 120 .....3.5
C. Usage subindex ........................................................92 ....3.36th pillar: Individual usage ................................................ 118 .....2.07th pillar: Business usage .................................................. 50 .....3.68th pillar: Government usage ............................................. 53 .....4.3
D. Impact subindex .......................................................73 ....3.49th pillar: Economic impacts .............................................. 63 .....3.310th pillar: Social impacts .................................................. 79 .....3.6
Gambia, The3: Country/Economy Profiles
The Global Information Technology Report 2013 | 185
Note: Indicators followed by an asterisk (*) are measured on a 1-to-7 (best) scale. For further details and explanation, please refer to the section “How to Read the Country/Economy Profiles” on page 139.
Gambia, The Low-income group average
1. Political and regulatory environment
6. Individual usage
5. Skills7. Business usage
4. Affordability8. Governmentusage
3. Infrastructure anddigital content
9. Economicimpacts
2. Business and innovation environment
10. Socialimpacts
1
2
3
4
5
6
7
@ 2013 World Economic Forum

The Networked Readiness Index in detailINDICATOR RANK /144 VALUE
1st pillar: Political and regulatory environment1.01 Effectiveness of law-making bodies* ..................69 ......... 3.61.02 Laws relating to ICTs* ........................................79 ......... 3.81.03 Judicial independence* ......................................95 ......... 3.21.04 Efficiency of legal system in settling disputes* ....89 ......... 3.41.05 Efficiency of legal system in challenging regs* ..106 ......... 3.11.06 Intellectual property protection* ........................126 ......... 2.61.07 Software piracy rate, % software installed ........106 .......... 911.08 No. procedures to enforce a contract ................36 .......... 331.09 No. days to enforce a contract ..........................12 ........ 285
2nd pillar: Business and innovation environment2.01 Availability of latest technologies* .......................94 ......... 4.62.02 Venture capital availability* ...............................104 ......... 2.22.03 Total tax rate, % profits ......................................10 ....... 16.52.04 No. days to start a business ................................2 ............ 22.05 No. procedures to start a business ......................3 ............ 22.06 Intensity of local competition* ...........................127 ......... 3.92.07 Tertiary education gross enrollment rate, % ........77 ....... 30.02.08 Quality of management schools* ......................110 ......... 3.62.09 Gov’t procurement of advanced tech* ...............61 ......... 3.7
3rd pillar: Infrastructure and digital content3.01 Electricity production, kWh/capita ......................84 .. 1,940.23.02 Mobile network coverage, % pop ......................50 ....... 99.13.03 Int’l Internet bandwidth, kb/s per user................50 ....... 26.73.04 Secure Internet servers/million pop ....................79 ....... 18.73.05 Accessibility of digital content* ...........................70 ......... 5.0
4th pillar: Affordability4.01 Mobile cellular tariffs, PPP $/min. .......................58 ....... 0.244.02 Fixed broadband Internet tariffs, PPP $/month ....7 ..... 15.294.03 Internet & telephony competition, 0–2 (best) ........1 ....... 2.00
5th pillar: Skills5.01 Quality of educational system* .........................114 ......... 3.05.02 Quality of math & science education* ...............101 ......... 3.55.03 Secondary education gross enrollment rate, % ..82 ....... 86.25.04 Adult literacy rate, % ............................................4 ....... 99.7
INDICATOR RANK /144 VALUE
6th pillar: Individual usage 6.01 Mobile phone subscriptions/100 pop. ................81 ..... 102.3 6.02 Individuals using Internet, %...............................76 ....... 36.6 6.03 Households w/ personal computer, % ...............91 ....... 18.2 6.04 Households w/ Internet access, % ....................82 ....... 16.6 6.05 Broadband Internet subscriptions/100 pop. .......66 ......... 7.5 6.06 Mobile broadband subscriptions/100 pop. .........52 ....... 21.3 6.07 Use of virtual social networks* ...........................60 ......... 5.6
7th pillar: Business usage 7.01 Firm-level technology absorption* ....................123 ......... 4.0 7.02 Capacity for innovation* ...................................116 ......... 2.5 7.03 PCT patents, applications/million pop. ..............60 ......... 1.4 7.04 Business-to-business Internet use* ...................n/a ......... n/a 7.05 Business-to-consumer Internet use* .................n/a ......... n/a 7.06 Extent of staff training* .....................................101 ......... 3.6
8th pillar: Government usage 8.01 Importance of ICTs to gov’t vision* .....................91 ......... 3.7 8.02 Government Online Service Index, 0–1 (best) .....42 ....... 0.60 8.03 Gov’t success in ICT promotion* .......................n/a ......... n/a
9th pillar: Economic impacts 9.01 Impact of ICTs on new services and products* 102 ......... 3.9 9.02 ICT PCT patents, applications/million pop. .......52 ......... 0.4 9.03 Impact of ICTs on new organizational models* .119 ......... 3.5 9.04 Knowledge-intensive jobs, % workforce .............62 ....... 22.2
10th pillar: Social impacts 10.01 Impact of ICTs on access to basic services* ......67 ......... 4.2 10.02 Internet access in schools* ................................65 ......... 4.3 10.03 ICT use & gov’t efficiency* .................................36 ......... 4.7 10.04 E-Participation Index, 0–1 (best).........................62 ....... 0.21
Rank Score (out of 144) (1–7)
Networked Readiness Index 2013 ..............65 ..3.9Networked Readiness Index 2012 (out of 142) ...................... 88 .....3.6
A. Environment subindex ..............................................73 ....3.91st pillar: Political and regulatory environment ................. 100 .....3.32nd pillar: Business and innovation environment ............... 54 .....4.4
B. Readiness subindex .................................................48 ....5.03rd pillar: Infrastructure and digital content ........................ 68 .....4.04th pillar: Affordability ........................................................ 11 .....6.45th pillar: Skills ................................................................... 83 .....4.6
C. Usage subindex ........................................................77 ....3.56th pillar: Individual usage .................................................. 75 .....3.27th pillar: Business usage ................................................ 112 .....3.18th pillar: Government usage ............................................. 63 .....4.1
D. Impact subindex .......................................................76 ....3.49th pillar: Economic impacts .............................................. 97 .....2.910th pillar: Social impacts .................................................. 60 .....3.9
Georgia3: Country/Economy Profiles
186 | The Global Information Technology Report 2013
Note: Indicators followed by an asterisk (*) are measured on a 1-to-7 (best) scale. For further details and explanation, please refer to the section “How to Read the Country/Economy Profiles” on page 139.
Georgia Lower-middle-income group average
1. Political and regulatory environment
6. Individual usage
5. Skills7. Business usage
4. Affordability8. Governmentusage
3. Infrastructure anddigital content
9. Economicimpacts
2. Business and innovation environment
10. Socialimpacts
1
2
3
4
5
6
7
@ 2013 World Economic Forum

The Networked Readiness Index in detailINDICATOR RANK /144 VALUE
1st pillar: Political and regulatory environment1.01 Effectiveness of law-making bodies* ..................20 ......... 4.81.02 Laws relating to ICTs* ........................................27 ......... 5.01.03 Judicial independence* ........................................7 ......... 6.21.04 Efficiency of legal system in settling disputes* ....20 ......... 4.91.05 Efficiency of legal system in challenging regs* ....13 ......... 5.01.06 Intellectual property protection* ..........................10 ......... 5.61.07 Software piracy rate, % software installed ..........12 .......... 261.08 No. procedures to enforce a contract ................18 .......... 301.09 No. days to enforce a contract ..........................28 ........ 394
2nd pillar: Business and innovation environment2.01 Availability of latest technologies* .......................17 ......... 6.32.02 Venture capital availability* .................................34 ......... 3.22.03 Total tax rate, % profits ....................................106 ....... 46.82.04 No. days to start a business ..............................69 .......... 152.05 No. procedures to start a business ..................102 ............ 92.06 Intensity of local competition* ...............................8 ......... 5.82.07 Tertiary education gross enrollment rate, % .......n/a ......... n/a2.08 Quality of management schools* ........................32 ......... 4.92.09 Gov’t procurement of advanced tech* ...............21 ......... 4.3
3rd pillar: Infrastructure and digital content3.01 Electricity production, kWh/capita ......................27 .. 7,509.13.02 Mobile network coverage, % pop ......................51 ....... 99.03.03 Int’l Internet bandwidth, kb/s per user................22 ....... 74.83.04 Secure Internet servers/million pop ....................19 .. 1,023.43.05 Accessibility of digital content* ...........................22 ......... 6.1
4th pillar: Affordability 4.01 Mobile cellular tariffs, PPP $/min. .......................33 ....... 0.164.02 Fixed broadband Internet tariffs, PPP $/month ..88 ..... 37.394.03 Internet & telephony competition, 0–2 (best) ........1 ....... 2.00
5th pillar: Skills5.01 Quality of educational system* ...........................20 ......... 4.9
5.02 Quality of math & science education* .................29 ......... 4.7 5.03 Secondary education gross enrollment rate, % ..23 ..... 103.3 5.04 Adult literacy rate, % ..........................................15 ....... 99.0
INDICATOR RANK /144 VALUE
6th pillar: Individual usage 6.01 Mobile phone subscriptions/100 pop. ................28 ..... 132.3 6.02 Individuals using Internet, %...............................12 ....... 83.0 6.03 Households w/ personal computer, % ...............10 ....... 86.9 6.04 Households w/ Internet access, % ....................13 ....... 83.3 6.05 Broadband Internet subscriptions/100 pop. .........8 ....... 33.1 6.06 Mobile broadband subscriptions/100 pop. .........36 ....... 34.8 6.07 Use of virtual social networks* ...........................46 ......... 5.8
7th pillar: Business usage 7.01 Firm-level technology absorption* ......................16 ......... 5.9 7.02 Capacity for innovation* .......................................3 ......... 5.7 7.03 PCT patents, applications/million pop. ................5 ..... 209.1 7.04 Business-to-business Internet use* ....................14 ......... 5.9 7.05 Business-to-consumer Internet use* ..................14 ......... 5.7 7.06 Extent of staff training* .......................................13 ......... 5.0
8th pillar: Government usage 8.01 Importance of ICTs to gov’t vision* .....................40 ......... 4.4 8.02 Government Online Service Index, 0–1 (best) .....24 ....... 0.75 8.03 Gov’t success in ICT promotion* ........................23 ......... 5.1
9th pillar: Economic impacts 9.01 Impact of ICTs on new services and products* ..20 ......... 5.3 9.02 ICT PCT patents, applications/million pop. .......10 ....... 46.5 9.03 Impact of ICTs on new organizational models* ...18 ......... 5.0 9.04 Knowledge-intensive jobs, % workforce .............15 ....... 41.9
10th pillar: Social impacts 10.01 Impact of ICTs on access to basic services* ......25 ......... 5.4 10.02 Internet access in schools* ................................45 ......... 4.8 10.03 ICT use & gov’t efficiency* .................................44 ......... 4.6 10.04 E-Participation Index, 0–1 (best)...........................8 ....... 0.76
Rank Score (out of 144) (1–7)
Networked Readiness Index 2013 ..............13 ..5.4Networked Readiness Index 2012 (out of 142) ...................... 16 .....5.3
A. Environment subindex ..............................................20 ....5.01st pillar: Political and regulatory environment ................... 11 .....5.42nd pillar: Business and innovation environment ............... 36 .....4.7
B. Readiness subindex .................................................14 ....5.93rd pillar: Infrastructure and digital content ........................ 10 .....6.54th pillar: Affordability ........................................................ 53 .....5.55th pillar: Skills ................................................................... 19 .....5.6
C. Usage subindex ........................................................12 ....5.66th pillar: Individual usage .................................................. 14 .....5.97th pillar: Business usage .................................................... 5 .....5.88th pillar: Government usage ............................................. 26 .....5.0
D. Impact subindex .......................................................14 ....5.29th pillar: Economic impacts .............................................. 10 .....5.310th pillar: Social impacts .................................................. 22 .....5.1
Germany3: Country/Economy Profiles
The Global Information Technology Report 2013 | 187
Note: Indicators followed by an asterisk (*) are measured on a 1-to-7 (best) scale. For further details and explanation, please refer to the section “How to Read the Country/Economy Profiles” on page 139.
Germany High-income group average
1. Political and regulatory environment
6. Individual usage
5. Skills7. Business usage
4. Affordability8. Governmentusage
3. Infrastructure anddigital content
9. Economicimpacts
2. Business and innovation environment
10. Socialimpacts
1
2
3
4
5
6
7
@ 2013 World Economic Forum
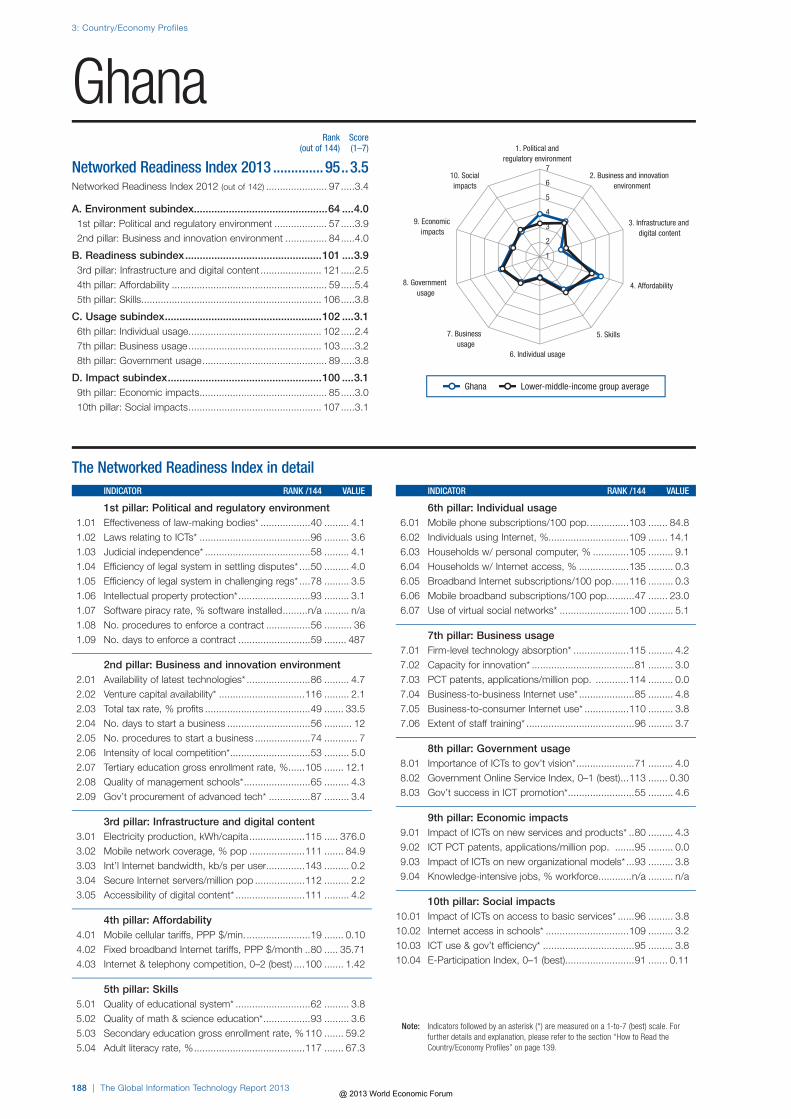
The Networked Readiness Index in detailINDICATOR RANK /144 VALUE
1st pillar: Political and regulatory environment1.01 Effectiveness of law-making bodies* ..................40 ......... 4.11.02 Laws relating to ICTs* ........................................96 ......... 3.61.03 Judicial independence* ......................................58 ......... 4.11.04 Efficiency of legal system in settling disputes* ....50 ......... 4.01.05 Efficiency of legal system in challenging regs* ....78 ......... 3.51.06 Intellectual property protection* ..........................93 ......... 3.11.07 Software piracy rate, % software installed .........n/a ......... n/a1.08 No. procedures to enforce a contract ................56 .......... 361.09 No. days to enforce a contract ..........................59 ........ 487
2nd pillar: Business and innovation environment2.01 Availability of latest technologies* .......................86 ......... 4.72.02 Venture capital availability* ...............................116 ......... 2.12.03 Total tax rate, % profits ......................................49 ....... 33.52.04 No. days to start a business ..............................56 .......... 122.05 No. procedures to start a business ....................74 ............ 72.06 Intensity of local competition* .............................53 ......... 5.02.07 Tertiary education gross enrollment rate, % ......105 ....... 12.12.08 Quality of management schools* ........................65 ......... 4.32.09 Gov’t procurement of advanced tech* ...............87 ......... 3.4
3rd pillar: Infrastructure and digital content3.01 Electricity production, kWh/capita ....................115 ..... 376.03.02 Mobile network coverage, % pop ....................111 ....... 84.93.03 Int’l Internet bandwidth, kb/s per user..............143 ......... 0.23.04 Secure Internet servers/million pop ..................112 ......... 2.23.05 Accessibility of digital content* .........................111 ......... 4.2
4th pillar: Affordability4.01 Mobile cellular tariffs, PPP $/min. .......................19 ....... 0.104.02 Fixed broadband Internet tariffs, PPP $/month ..80 ..... 35.714.03 Internet & telephony competition, 0–2 (best) ....100 ....... 1.42
5th pillar: Skills5.01 Quality of educational system* ...........................62 ......... 3.85.02 Quality of math & science education* .................93 ......... 3.65.03 Secondary education gross enrollment rate, % 110 ....... 59.25.04 Adult literacy rate, % ........................................117 ....... 67.3
INDICATOR RANK /144 VALUE
6th pillar: Individual usage 6.01 Mobile phone subscriptions/100 pop. ..............103 ....... 84.8 6.02 Individuals using Internet, %.............................109 ....... 14.1 6.03 Households w/ personal computer, % .............105 ......... 9.1 6.04 Households w/ Internet access, % ..................135 ......... 0.3 6.05 Broadband Internet subscriptions/100 pop. .....116 ......... 0.3 6.06 Mobile broadband subscriptions/100 pop. .........47 ....... 23.0 6.07 Use of virtual social networks* .........................100 ......... 5.1
7th pillar: Business usage 7.01 Firm-level technology absorption* ....................115 ......... 4.2 7.02 Capacity for innovation* .....................................81 ......... 3.0 7.03 PCT patents, applications/million pop. ............114 ......... 0.0 7.04 Business-to-business Internet use* ....................85 ......... 4.8 7.05 Business-to-consumer Internet use* ................110 ......... 3.8 7.06 Extent of staff training* .......................................96 ......... 3.7
8th pillar: Government usage 8.01 Importance of ICTs to gov’t vision* .....................71 ......... 4.0 8.02 Government Online Service Index, 0–1 (best) ...113 ....... 0.30 8.03 Gov’t success in ICT promotion* ........................55 ......... 4.6
9th pillar: Economic impacts 9.01 Impact of ICTs on new services and products* ..80 ......... 4.3 9.02 ICT PCT patents, applications/million pop. .......95 ......... 0.0 9.03 Impact of ICTs on new organizational models* ...93 ......... 3.8 9.04 Knowledge-intensive jobs, % workforce ............n/a ......... n/a
10th pillar: Social impacts 10.01 Impact of ICTs on access to basic services* ......96 ......... 3.8 10.02 Internet access in schools* ..............................109 ......... 3.2 10.03 ICT use & gov’t efficiency* .................................95 ......... 3.8 10.04 E-Participation Index, 0–1 (best).........................91 ....... 0.11
Rank Score (out of 144) (1–7)
Networked Readiness Index 2013 ..............95 ..3.5Networked Readiness Index 2012 (out of 142) ...................... 97 .....3.4
A. Environment subindex ..............................................64 ....4.01st pillar: Political and regulatory environment ................... 57 .....3.92nd pillar: Business and innovation environment ............... 84 .....4.0
B. Readiness subindex ...............................................101 ....3.93rd pillar: Infrastructure and digital content ...................... 121 .....2.54th pillar: Affordability ........................................................ 59 .....5.45th pillar: Skills ................................................................. 106 .....3.8
C. Usage subindex ......................................................102 ....3.16th pillar: Individual usage ................................................ 102 .....2.47th pillar: Business usage ................................................ 103 .....3.28th pillar: Government usage ............................................. 89 .....3.8
D. Impact subindex .....................................................100 ....3.19th pillar: Economic impacts .............................................. 85 .....3.010th pillar: Social impacts ................................................ 107 .....3.1
Ghana3: Country/Economy Profiles
188 | The Global Information Technology Report 2013
Note: Indicators followed by an asterisk (*) are measured on a 1-to-7 (best) scale. For further details and explanation, please refer to the section “How to Read the Country/Economy Profiles” on page 139.
Ghana Lower-middle-income group average
1. Political and regulatory environment
6. Individual usage
5. Skills7. Business usage
4. Affordability8. Governmentusage
3. Infrastructure anddigital content
9. Economicimpacts
2. Business and innovation environment
10. Socialimpacts
1
2
3
4
5
6
7
@ 2013 World Economic Forum

The Networked Readiness Index in detailINDICATOR RANK /144 VALUE
1st pillar: Political and regulatory environment1.01 Effectiveness of law-making bodies* ..................99 ......... 3.11.02 Laws relating to ICTs* ......................................103 ......... 3.41.03 Judicial independence* ......................................98 ......... 3.11.04 Efficiency of legal system in settling disputes* ..135 ......... 2.51.05 Efficiency of legal system in challenging regs* ..132 ......... 2.61.06 Intellectual property protection* ..........................64 ......... 3.71.07 Software piracy rate, % software installed ..........53 .......... 611.08 No. procedures to enforce a contract ................90 .......... 391.09 No. days to enforce a contract ........................119 ........ 819
2nd pillar: Business and innovation environment2.01 Availability of latest technologies* .......................58 ......... 5.22.02 Venture capital availability* ...............................134 ......... 1.82.03 Total tax rate, % profits ......................................99 ....... 44.62.04 No. days to start a business ..............................54 .......... 112.05 No. procedures to start a business ..................123 .......... 112.06 Intensity of local competition* .............................95 ......... 4.42.07 Tertiary education gross enrollment rate, % ..........5 ....... 89.42.08 Quality of management schools* ......................104 ......... 3.72.09 Gov’t procurement of advanced tech* .............130 ......... 2.7
3rd pillar: Infrastructure and digital content3.01 Electricity production, kWh/capita ......................41 .. 5,370.03.02 Mobile network coverage, % pop ......................28 ....... 99.93.03 Int’l Internet bandwidth, kb/s per user................51 ....... 26.03.04 Secure Internet servers/million pop ....................43 ..... 154.43.05 Accessibility of digital content* ...........................64 ......... 5.1
4th pillar: Affordability4.01 Mobile cellular tariffs, PPP $/min. .....................129 ....... 0.594.02 Fixed broadband Internet tariffs, PPP $/month ..26 ..... 20.684.03 Internet & telephony competition, 0–2 (best) ......80 ....... 1.80
5th pillar: Skills5.01 Quality of educational system* .........................115 ......... 3.05.02 Quality of math & science education* .................54 ......... 4.25.03 Secondary education gross enrollment rate, % ..13 ..... 109.55.04 Adult literacy rate, % ..........................................55 ....... 97.2
INDICATOR RANK /144 VALUE
6th pillar: Individual usage 6.01 Mobile phone subscriptions/100 pop. ................71 ..... 106.5 6.02 Individuals using Internet, %...............................51 ....... 53.0 6.03 Households w/ personal computer, % ...............49 ....... 57.2 6.04 Households w/ Internet access, % ....................49 ....... 50.2 6.05 Broadband Internet subscriptions/100 pop. .......33 ....... 21.6 6.06 Mobile broadband subscriptions/100 pop. .........28 ....... 39.9 6.07 Use of virtual social networks* ...........................87 ......... 5.2
7th pillar: Business usage 7.01 Firm-level technology absorption* ......................94 ......... 4.4 7.02 Capacity for innovation* ...................................104 ......... 2.7 7.03 PCT patents, applications/million pop. ..............37 ......... 8.6 7.04 Business-to-business Internet use* ....................90 ......... 4.7 7.05 Business-to-consumer Internet use* ..................86 ......... 4.3 7.06 Extent of staff training* .....................................115 ......... 3.3
8th pillar: Government usage 8.01 Importance of ICTs to gov’t vision* ...................138 ......... 2.7 8.02 Government Online Service Index, 0–1 (best) .....48 ....... 0.58 8.03 Gov’t success in ICT promotion* ......................136 ......... 2.9
9th pillar: Economic impacts 9.01 Impact of ICTs on new services and products* 117 ......... 3.7 9.02 ICT PCT patents, applications/million pop. .......37 ......... 1.5 9.03 Impact of ICTs on new organizational models* .127 ......... 3.3 9.04 Knowledge-intensive jobs, % workforce .............35 ....... 33.5
10th pillar: Social impacts 10.01 Impact of ICTs on access to basic services* ....107 ......... 3.7 10.02 Internet access in schools* ................................81 ......... 3.9 10.03 ICT use & gov’t efficiency* ...............................122 ......... 3.4 10.04 E-Participation Index, 0–1 (best).........................43 ....... 0.34
Rank Score (out of 144) (1–7)
Networked Readiness Index 2013 ..............64 ..3.9Networked Readiness Index 2012 (out of 142) ...................... 59 .....4.0
A. Environment subindex ..............................................87 ....3.71st pillar: Political and regulatory environment ................. 103 .....3.32nd pillar: Business and innovation environment ............... 68 .....4.2
B. Readiness subindex .................................................47 ....5.03rd pillar: Infrastructure and digital content ........................ 46 .....4.64th pillar: Affordability ........................................................ 73 .....5.15th pillar: Skills ................................................................... 41 .....5.2
C. Usage subindex ........................................................68 ....3.76th pillar: Individual usage .................................................. 43 .....4.57th pillar: Business usage ................................................ 107 .....3.18th pillar: Government usage ........................................... 118 .....3.3
D. Impact subindex .......................................................82 ....3.39th pillar: Economic impacts .............................................. 80 .....3.110th pillar: Social impacts .................................................. 83 .....3.5
Greece3: Country/Economy Profiles
The Global Information Technology Report 2013 | 189
Note: Indicators followed by an asterisk (*) are measured on a 1-to-7 (best) scale. For further details and explanation, please refer to the section “How to Read the Country/Economy Profiles” on page 139.
Greece High-income group average
1. Political and regulatory environment
6. Individual usage
5. Skills7. Business usage
4. Affordability8. Governmentusage
3. Infrastructure anddigital content
9. Economicimpacts
2. Business and innovation environment
10. Socialimpacts
1
2
3
4
5
6
7
@ 2013 World Economic Forum

The Networked Readiness Index in detailINDICATOR RANK /144 VALUE
1st pillar: Political and regulatory environment1.01 Effectiveness of law-making bodies* ................140 ......... 2.21.02 Laws relating to ICTs* ........................................75 ......... 3.91.03 Judicial independence* ....................................103 ......... 2.91.04 Efficiency of legal system in settling disputes* ..110 ......... 3.11.05 Efficiency of legal system in challenging regs* ....98 ......... 3.21.06 Intellectual property protection* ........................121 ......... 2.61.07 Software piracy rate, % software installed ..........82 .......... 791.08 No. procedures to enforce a contract ................26 .......... 311.09 No. days to enforce a contract ........................142 ..... 1,459
2nd pillar: Business and innovation environment2.01 Availability of latest technologies* .......................51 ......... 5.32.02 Venture capital availability* .................................64 ......... 2.72.03 Total tax rate, % profits ......................................83 ....... 40.92.04 No. days to start a business ............................123 .......... 402.05 No. procedures to start a business ..................126 .......... 122.06 Intensity of local competition* .............................46 ......... 5.12.07 Tertiary education gross enrollment rate, % ........97 ....... 17.82.08 Quality of management schools* ........................43 ......... 4.62.09 Gov’t procurement of advanced tech* .............119 ......... 3.0
3rd pillar: Infrastructure and digital content 3.01 Electricity production, kWh/capita ....................107 ..... 644.2 3.02 Mobile network coverage, % pop ....................120 ....... 76.03.03 Int’l Internet bandwidth, kb/s per user................96 ......... 6.9
3.04 Secure Internet servers/million pop ....................86 ....... 13.83.05 Accessibility of digital content* ...........................80 ......... 4.9
4th pillar: Affordability 4.01 Mobile cellular tariffs, PPP $/min. .......................38 ....... 0.174.02 Fixed broadband Internet tariffs, PPP $/month 101 ..... 44.124.03 Internet & telephony competition, 0–2 (best) ......74 ....... 1.85
5th pillar: Skills5.01 Quality of educational system* .........................130 ......... 2.6
5.02 Quality of math & science education* ...............137 ......... 2.4 5.03 Secondary education gross enrollment rate, % 106 ....... 64.55.04 Adult literacy rate, % ........................................107 ....... 75.2
INDICATOR RANK /144 VALUE
6th pillar: Individual usage 6.01 Mobile phone subscriptions/100 pop. ................23 ..... 140.4 6.02 Individuals using Internet, %.............................115 ....... 11.7 6.03 Households w/ personal computer, % ...............94 ....... 15.8 6.04 Households w/ Internet access, % ..................120 ......... 2.1 6.05 Broadband Internet subscriptions/100 pop. .......95 ......... 1.8 6.06 Mobile broadband subscriptions/100 pop. .........89 ......... 4.1 6.07 Use of virtual social networks* ...........................78 ......... 5.3
7th pillar: Business usage 7.01 Firm-level technology absorption* ......................45 ......... 5.2 7.02 Capacity for innovation* .....................................67 ......... 3.2 7.03 PCT patents, applications/million pop. ..............90 ......... 0.1 7.04 Business-to-business Internet use* ....................44 ......... 5.4 7.05 Business-to-consumer Internet use* ..................57 ......... 4.7 7.06 Extent of staff training* .......................................40 ......... 4.3
8th pillar: Government usage 8.01 Importance of ICTs to gov’t vision* ...................129 ......... 3.0 8.02 Government Online Service Index, 0–1 (best) .....76 ....... 0.46 8.03 Gov’t success in ICT promotion* ......................110 ......... 3.7
9th pillar: Economic impacts 9.01 Impact of ICTs on new services and products* ..60 ......... 4.6 9.02 ICT PCT patents, applications/million pop. .......81 ......... 0.0 9.03 Impact of ICTs on new organizational models* ...44 ......... 4.5 9.04 Knowledge-intensive jobs, % workforce ............n/a ......... n/a
10th pillar: Social impacts 10.01 Impact of ICTs on access to basic services* ......99 ......... 3.8 10.02 Internet access in schools* ..............................113 ......... 3.1 10.03 ICT use & gov’t efficiency* ...............................102 ......... 3.7 10.04 E-Participation Index, 0–1 (best).........................58 ....... 0.24
Rank Score (out of 144) (1–7)
Networked Readiness Index 2013 ............102 ..3.4Networked Readiness Index 2012 (out of 142) ...................... 98 .....3.4
A. Environment subindex ............................................118 ....3.41st pillar: Political and regulatory environment ................. 127 .....2.92nd pillar: Business and innovation environment ............... 97 .....3.9
B. Readiness subindex ...............................................108 ....3.73rd pillar: Infrastructure and digital content ...................... 116 .....2.74th pillar: Affordability ........................................................ 81 .....4.95th pillar: Skills ................................................................. 118 .....3.5
C. Usage subindex ........................................................93 ....3.36th pillar: Individual usage .................................................. 96 .....2.77th pillar: Business usage .................................................. 49 .....3.68th pillar: Government usage ........................................... 114 .....3.5
D. Impact subindex .......................................................84 ....3.39th pillar: Economic impacts .............................................. 57 .....3.410th pillar: Social impacts ................................................ 100 .....3.3
Guatemala3: Country/Economy Profiles
190 | The Global Information Technology Report 2013
Note: Indicators followed by an asterisk (*) are measured on a 1-to-7 (best) scale. For further details and explanation, please refer to the section “How to Read the Country/Economy Profiles” on page 139.
Guatemala Lower-middle-income group average
1. Political and regulatory environment
6. Individual usage
5. Skills7. Business usage
4. Affordability8. Governmentusage
3. Infrastructure anddigital content
9. Economicimpacts
2. Business and innovation environment
10. Socialimpacts
1
2
3
4
5
6
7
@ 2013 World Economic Forum

The Networked Readiness Index in detailINDICATOR RANK /144 VALUE
1st pillar: Political and regulatory environment1.01 Effectiveness of law-making bodies* ................135 ......... 2.31.02 Laws relating to ICTs* ......................................129 ......... 2.81.03 Judicial independence* ....................................119 ......... 2.61.04 Efficiency of legal system in settling disputes* ..128 ......... 2.71.05 Efficiency of legal system in challenging regs* ..122 ......... 2.81.06 Intellectual property protection* ........................137 ......... 2.21.07 Software piracy rate, % software installed .........n/a ......... n/a1.08 No. procedures to enforce a contract ..............137 .......... 491.09 No. days to enforce a contract ..........................10 ........ 276
2nd pillar: Business and innovation environment2.01 Availability of latest technologies* .....................135 ......... 3.62.02 Venture capital availability* ...............................142 ......... 1.62.03 Total tax rate, % profits ....................................138 ....... 73.22.04 No. days to start a business ............................116 .......... 352.05 No. procedures to start a business ....................48 ............ 62.06 Intensity of local competition* ...........................116 ......... 4.12.07 Tertiary education gross enrollment rate, % ......110 ....... 11.32.08 Quality of management schools* ......................139 ......... 2.72.09 Gov’t procurement of advanced tech* ...............77 ......... 3.5
3rd pillar: Infrastructure and digital content3.01 Electricity production, kWh/capita ....................130 ....... 97.83.02 Mobile network coverage, % pop ....................118 ....... 80.03.03 Int’l Internet bandwidth, kb/s per user..............128 ......... 1.73.04 Secure Internet servers/million pop ..................138 ......... 0.53.05 Accessibility of digital content* .........................143 ......... 2.6
4th pillar: Affordability4.01 Mobile cellular tariffs, PPP $/min. .......................25 ....... 0.144.02 Fixed broadband Internet tariffs, PPP $/month 139 2,067.854.03 Internet & telephony competition, 0–2 (best) ......89 ....... 1.67
5th pillar: Skills5.01 Quality of educational system* .........................128 ......... 2.75.02 Quality of math & science education* ...............106 ......... 3.45.03 Secondary education gross enrollment rate, % 127 ....... 41.75.04 Adult literacy rate, % ........................................137 ....... 41.0
INDICATOR RANK /144 VALUE
6th pillar: Individual usage 6.01 Mobile phone subscriptions/100 pop. ..............134 ....... 44.0 6.02 Individuals using Internet, %.............................140 ......... 1.3 6.03 Households w/ personal computer, % .............136 ......... 1.5 6.04 Households w/ Internet access, % ..................130 ......... 1.0 6.05 Broadband Internet subscriptions/100 pop. .....137 ......... 0.0 6.06 Mobile broadband subscriptions/100 pop. .......126 ......... 0.0 6.07 Use of virtual social networks* .........................124 ......... 4.5
7th pillar: Business usage 7.01 Firm-level technology absorption* ....................135 ......... 3.8 7.02 Capacity for innovation* ...................................127 ......... 2.4 7.03 PCT patents, applications/million pop. ............123 ......... 0.0 7.04 Business-to-business Internet use* ..................103 ......... 4.5 7.05 Business-to-consumer Internet use* ................128 ......... 3.3 7.06 Extent of staff training* .....................................114 ......... 3.3
8th pillar: Government usage 8.01 Importance of ICTs to gov’t vision* .....................72 ......... 4.0 8.02 Government Online Service Index, 0–1 (best) ...140 ....... 0.00 8.03 Gov’t success in ICT promotion* ........................88 ......... 4.1
9th pillar: Economic impacts 9.01 Impact of ICTs on new services and products* 133 ......... 3.3 9.02 ICT PCT patents, applications/million pop. .......95 ......... 0.0 9.03 Impact of ICTs on new organizational models* .133 ......... 2.9 9.04 Knowledge-intensive jobs, % workforce ............n/a ......... n/a
10th pillar: Social impacts 10.01 Impact of ICTs on access to basic services* ....135 ......... 3.1 10.02 Internet access in schools* ..............................139 ......... 1.7 10.03 ICT use & gov’t efficiency* ...............................129 ......... 3.2 10.04 E-Participation Index, 0–1 (best).......................124 ....... 0.00
Rank Score (out of 144) (1–7)
Networked Readiness Index 2013 ............140 ..2.6Networked Readiness Index 2012 (out of 142) ..................... n/a .....n/a
A. Environment subindex ............................................139 ....2.81st pillar: Political and regulatory environment ................. 132 .....2.82nd pillar: Business and innovation environment ............. 141 .....2.9
B. Readiness subindex ...............................................132 ....2.83rd pillar: Infrastructure and digital content ...................... 132 .....2.14th pillar: Affordability ...................................................... 108 .....3.65th pillar: Skills ................................................................. 135 .....2.7
C. Usage subindex ......................................................139 ....2.56th pillar: Individual usage ................................................ 138 .....1.57th pillar: Business usage ................................................ 128 .....2.98th pillar: Government usage ........................................... 133 .....3.0
D. Impact subindex .....................................................136 ....2.39th pillar: Economic impacts ............................................ 131 .....2.410th pillar: Social impacts ................................................ 140 .....2.3
Guinea3: Country/Economy Profiles
The Global Information Technology Report 2013 | 191
Note: Indicators followed by an asterisk (*) are measured on a 1-to-7 (best) scale. For further details and explanation, please refer to the section “How to Read the Country/Economy Profiles” on page 139.
Guinea Low-income group average
1. Political and regulatory environment
6. Individual usage
5. Skills7. Business usage
4. Affordability8. Governmentusage
3. Infrastructure anddigital content
9. Economicimpacts
2. Business and innovation environment
10. Socialimpacts
1
2
3
4
5
6
7
@ 2013 World Economic Forum

The Networked Readiness Index in detailINDICATOR RANK /144 VALUE
1st pillar: Political and regulatory environment1.01 Effectiveness of law-making bodies* ..................75 ......... 3.51.02 Laws relating to ICTs* ......................................114 ......... 3.21.03 Judicial independence* ......................................93 ......... 3.21.04 Efficiency of legal system in settling disputes* ....87 ......... 3.41.05 Efficiency of legal system in challenging regs* ....95 ......... 3.21.06 Intellectual property protection* ..........................78 ......... 3.41.07 Software piracy rate, % software installed .........n/a ......... n/a1.08 No. procedures to enforce a contract ................56 .......... 361.09 No. days to enforce a contract ..........................85 ........ 581
2nd pillar: Business and innovation environment2.01 Availability of latest technologies* .......................70 ......... 5.02.02 Venture capital availability* .................................52 ......... 2.82.03 Total tax rate, % profits ......................................67 ....... 36.12.04 No. days to start a business ..............................87 .......... 202.05 No. procedures to start a business ....................88 ............ 82.06 Intensity of local competition* .............................59 ......... 5.02.07 Tertiary education gross enrollment rate, % ......107 ....... 12.02.08 Quality of management schools* ........................64 ......... 4.32.09 Gov’t procurement of advanced tech* ...............78 ......... 3.5
3rd pillar: Infrastructure and digital content3.01 Electricity production, kWh/capita ......................95 .. 1,085.03.02 Mobile network coverage, % pop ......................81 ....... 97.03.03 Int’l Internet bandwidth, kb/s per user..............109 ......... 4.53.04 Secure Internet servers/million pop ....................92 ......... 9.33.05 Accessibility of digital content* ...........................76 ......... 4.9
4th pillar: Affordability4.01 Mobile cellular tariffs, PPP $/min. .......................52 ....... 0.214.02 Fixed broadband Internet tariffs, PPP $/month 109 ..... 53.034.03 Internet & telephony competition, 0–2 (best) ....135 ....... 0.50
5th pillar: Skills5.01 Quality of educational system* ...........................42 ......... 4.25.02 Quality of math & science education* .................70 ......... 4.05.03 Secondary education gross enrollment rate, % ..57 ....... 93.35.04 Adult literacy rate, % .........................................n/a ......... n/a
INDICATOR RANK /144 VALUE
6th pillar: Individual usage 6.01 Mobile phone subscriptions/100 pop. ..............118 ....... 69.9 6.02 Individuals using Internet, %...............................83 ....... 32.0 6.03 Households w/ personal computer, % .............110 ......... 7.2 6.04 Households w/ Internet access, % ..................102 ......... 6.1 6.05 Broadband Internet subscriptions/100 pop. .......89 ......... 2.6 6.06 Mobile broadband subscriptions/100 pop. .......126 ......... 0.0 6.07 Use of virtual social networks* ...........................50 ......... 5.7
7th pillar: Business usage 7.01 Firm-level technology absorption* ......................74 ......... 4.7 7.02 Capacity for innovation* .....................................35 ......... 3.7 7.03 PCT patents, applications/million pop. ............123 ......... 0.0 7.04 Business-to-business Internet use* ....................61 ......... 5.1 7.05 Business-to-consumer Internet use* ..................71 ......... 4.5 7.06 Extent of staff training* .......................................61 ......... 4.0
8th pillar: Government usage 8.01 Importance of ICTs to gov’t vision* .....................39 ......... 4.4 8.02 Government Online Service Index, 0–1 (best) ...120 ....... 0.25 8.03 Gov’t success in ICT promotion* ........................53 ......... 4.7
9th pillar: Economic impacts 9.01 Impact of ICTs on new services and products* ..95 ......... 4.1 9.02 ICT PCT patents, applications/million pop. .......95 ......... 0.0 9.03 Impact of ICTs on new organizational models* ...84 ......... 4.0 9.04 Knowledge-intensive jobs, % workforce .............94 ....... 12.7
10th pillar: Social impacts 10.01 Impact of ICTs on access to basic services* ......65 ......... 4.3 10.02 Internet access in schools* ................................91 ......... 3.6 10.03 ICT use & gov’t efficiency* .................................81 ......... 4.1 10.04 E-Participation Index, 0–1 (best).......................124 ....... 0.00
Rank Score (out of 144) (1–7)
Networked Readiness Index 2013 ............100 ..3.4Networked Readiness Index 2012 (out of 142) ...................... 90 .....3.6
A. Environment subindex ..............................................81 ....3.81st pillar: Political and regulatory environment ................... 84 .....3.62nd pillar: Business and innovation environment ............... 81 .....4.0
B. Readiness subindex ...............................................105 ....3.73rd pillar: Infrastructure and digital content ........................ 94 .....3.24th pillar: Affordability ...................................................... 110 .....3.55th pillar: Skills ................................................................... 82 .....4.6
C. Usage subindex ........................................................97 ....3.26th pillar: Individual usage ................................................ 106 .....2.27th pillar: Business usage .................................................. 54 .....3.68th pillar: Government usage ............................................. 85 .....3.9
D. Impact subindex .....................................................103 ....3.09th pillar: Economic impacts ............................................ 107 .....2.810th pillar: Social impacts ................................................ 102 .....3.2
Guyana3: Country/Economy Profiles
192 | The Global Information Technology Report 2013
Note: Indicators followed by an asterisk (*) are measured on a 1-to-7 (best) scale. For further details and explanation, please refer to the section “How to Read the Country/Economy Profiles” on page 139.
Guyana Lower-middle-income group average
1. Political and regulatory environment
6. Individual usage
5. Skills7. Business usage
4. Affordability8. Governmentusage
3. Infrastructure anddigital content
9. Economicimpacts
2. Business and innovation environment
10. Socialimpacts
1
2
3
4
5
6
7
@ 2013 World Economic Forum

The Networked Readiness Index in detailINDICATOR RANK /144 VALUE
1st pillar: Political and regulatory environment1.01 Effectiveness of law-making bodies* ................143 ......... 1.91.02 Laws relating to ICTs* ......................................143 ......... 2.11.03 Judicial independence* ....................................142 ......... 1.81.04 Efficiency of legal system in settling disputes* ..143 ......... 2.11.05 Efficiency of legal system in challenging regs* ..143 ......... 2.11.06 Intellectual property protection* ........................144 ......... 1.61.07 Software piracy rate, % software installed .........n/a ......... n/a1.08 No. procedures to enforce a contract ................48 .......... 351.09 No. days to enforce a contract ..........................73 ........ 530
2nd pillar: Business and innovation environment2.01 Availability of latest technologies* .....................130 ......... 3.82.02 Venture capital availability* ...............................144 ......... 1.52.03 Total tax rate, % profits ......................................82 ....... 40.82.04 No. days to start a business ............................140 ........ 1052.05 No. procedures to start a business ..................126 .......... 122.06 Intensity of local competition* ...........................134 ......... 3.72.07 Tertiary education gross enrollment rate, % .......n/a ......... n/a2.08 Quality of management schools* ......................140 ......... 2.72.09 Gov’t procurement of advanced tech* .............140 ......... 2.3
3rd pillar: Infrastructure and digital content3.01 Electricity production, kWh/capita ....................135 ....... 73.13.02 Mobile network coverage, % pop .....................n/a ......... n/a3.03 Int’l Internet bandwidth, kb/s per user..............142 ......... 0.23.04 Secure Internet servers/million pop ..................122 ......... 1.23.05 Accessibility of digital content* .........................138 ......... 3.1
4th pillar: Affordability4.01 Mobile cellular tariffs, PPP $/min. .......................48 ....... 0.204.02 Fixed broadband Internet tariffs, PPP $/month .n/a ......... n/a4.03 Internet & telephony competition, 0–2 (best) ........1 ....... 2.00
5th pillar: Skills5.01 Quality of educational system* .........................141 ......... 2.15.02 Quality of math & science education* ...............130 ......... 2.65.03 Secondary education gross enrollment rate, % .n/a ......... n/a5.04 Adult literacy rate, % ........................................134 ....... 48.7
INDICATOR RANK /144 VALUE
6th pillar: Individual usage 6.01 Mobile phone subscriptions/100 pop. ..............136 ....... 41.5 6.02 Individuals using Internet, %.............................122 ......... 8.4 6.03 Households w/ personal computer, % .............114 ......... 5.9 6.04 Households w/ Internet access, % ..................116 ......... 2.7 6.05 Broadband Internet subscriptions/100 pop. .....143 ......... 0.0 6.06 Mobile broadband subscriptions/100 pop. .......126 ......... 0.0 6.07 Use of virtual social networks* .........................111 ......... 4.8
7th pillar: Business usage 7.01 Firm-level technology absorption* ....................130 ......... 3.9 7.02 Capacity for innovation* ...................................138 ......... 2.3 7.03 PCT patents, applications/million pop. ............123 ......... 0.0 7.04 Business-to-business Internet use* ..................131 ......... 3.9 7.05 Business-to-consumer Internet use* ................122 ......... 3.5 7.06 Extent of staff training* .....................................144 ......... 2.3
8th pillar: Government usage 8.01 Importance of ICTs to gov’t vision* ...................142 ......... 2.4 8.02 Government Online Service Index, 0–1 (best) ...138 ....... 0.09 8.03 Gov’t success in ICT promotion* ......................133 ......... 3.1
9th pillar: Economic impacts 9.01 Impact of ICTs on new services and products* 135 ......... 3.3 9.02 ICT PCT patents, applications/million pop. .......95 ......... 0.0 9.03 Impact of ICTs on new organizational models* .137 ......... 2.8 9.04 Knowledge-intensive jobs, % workforce ............n/a ......... n/a
10th pillar: Social impacts 10.01 Impact of ICTs on access to basic services* ....140 ......... 2.8 10.02 Internet access in schools* ..............................137 ......... 1.9 10.03 ICT use & gov’t efficiency* ...............................142 ......... 2.5 10.04 E-Participation Index, 0–1 (best).......................124 ....... 0.00
Rank Score (out of 144) (1–7)
Networked Readiness Index 2013 ............141 ..2.6Networked Readiness Index 2012 (out of 142) .................... 142 .....2.3
A. Environment subindex ............................................141 ....2.61st pillar: Political and regulatory environment ................. 143 .....2.42nd pillar: Business and innovation environment ............. 142 .....2.9
B. Readiness subindex ...............................................113 ....3.33rd pillar: Infrastructure and digital content ...................... 144 .....1.54th pillar: Affordability ........................................................ 24 .....6.15th pillar: Skills ................................................................. 143 .....2.4
C. Usage subindex ......................................................143 ....2.26th pillar: Individual usage ................................................ 134 .....1.67th pillar: Business usage ................................................ 142 .....2.68th pillar: Government usage ........................................... 144 .....2.4
D. Impact subindex .....................................................141 ....2.29th pillar: Economic impacts ............................................ 134 .....2.410th pillar: Social impacts ................................................ 142 .....2.0
Haiti3: Country/Economy Profiles
The Global Information Technology Report 2013 | 193
Note: Indicators followed by an asterisk (*) are measured on a 1-to-7 (best) scale. For further details and explanation, please refer to the section “How to Read the Country/Economy Profiles” on page 139.
Haiti Low-income group average
1. Political and regulatory environment
6. Individual usage
5. Skills7. Business usage
4. Affordability8. Governmentusage
3. Infrastructure anddigital content
9. Economicimpacts
2. Business and innovation environment
10. Socialimpacts
1
2
3
4
5
6
7
@ 2013 World Economic Forum

The Networked Readiness Index in detailINDICATOR RANK /144 VALUE
1st pillar: Political and regulatory environment1.01 Effectiveness of law-making bodies* ..................94 ......... 3.11.02 Laws relating to ICTs* ......................................102 ......... 3.41.03 Judicial independence* ......................................69 ......... 3.81.04 Efficiency of legal system in settling disputes* ..102 ......... 3.21.05 Efficiency of legal system in challenging regs* ....77 ......... 3.51.06 Intellectual property protection* ..........................90 ......... 3.21.07 Software piracy rate, % software installed ..........75 .......... 731.08 No. procedures to enforce a contract ..............134 .......... 471.09 No. days to enforce a contract ........................127 ........ 920
2nd pillar: Business and innovation environment2.01 Availability of latest technologies* .......................78 ......... 4.82.02 Venture capital availability* .................................79 ......... 2.52.03 Total tax rate, % profits ......................................79 ....... 40.32.04 No. days to start a business ..............................67 .......... 142.05 No. procedures to start a business ..................132 .......... 132.06 Intensity of local competition* .............................89 ......... 4.62.07 Tertiary education gross enrollment rate, % ........89 ....... 20.62.08 Quality of management schools* ......................109 ......... 3.62.09 Gov’t procurement of advanced tech* .............104 ......... 3.1
3rd pillar: Infrastructure and digital content3.01 Electricity production, kWh/capita ......................99 ..... 883.13.02 Mobile network coverage, % pop ....................104 ....... 89.93.03 Int’l Internet bandwidth, kb/s per user..............107 ......... 4.93.04 Secure Internet servers/million pop ....................96 ......... 7.73.05 Accessibility of digital content* .........................104 ......... 4.3
4th pillar: Affordability4.01 Mobile cellular tariffs, PPP $/min. .......................95 ....... 0.374.02 Fixed broadband Internet tariffs, PPP $/month ..79 ..... 35.394.03 Internet & telephony competition, 0–2 (best) ........1 ....... 2.00
5th pillar: Skills5.01 Quality of educational system* .........................135 ......... 2.45.02 Quality of math & science education* ...............138 ......... 2.35.03 Secondary education gross enrollment rate, % ..99 ....... 74.35.04 Adult literacy rate, % ........................................102 ....... 84.8
INDICATOR RANK /144 VALUE
6th pillar: Individual usage 6.01 Mobile phone subscriptions/100 pop. ................77 ..... 104.0 6.02 Individuals using Internet, %.............................105 ....... 15.9 6.03 Households w/ personal computer, % ...............99 ....... 12.9 6.04 Households w/ Internet access, % ..................101 ......... 6.8 6.05 Broadband Internet subscriptions/100 pop. .....110 ......... 0.4 6.06 Mobile broadband subscriptions/100 pop. .........91 ......... 3.7 6.07 Use of virtual social networks* ...........................93 ......... 5.2
7th pillar: Business usage 7.01 Firm-level technology absorption* ......................60 ......... 4.9 7.02 Capacity for innovation* .....................................98 ......... 2.8 7.03 PCT patents, applications/million pop. ............123 ......... 0.0 7.04 Business-to-business Internet use* ....................65 ......... 5.0 7.05 Business-to-consumer Internet use* ..................81 ......... 4.4 7.06 Extent of staff training* .......................................63 ......... 4.0
8th pillar: Government usage 8.01 Importance of ICTs to gov’t vision* ...................128 ......... 3.0 8.02 Government Online Service Index, 0–1 (best) .....93 ....... 0.38 8.03 Gov’t success in ICT promotion* ......................131 ......... 3.2
9th pillar: Economic impacts 9.01 Impact of ICTs on new services and products* ..84 ......... 4.2 9.02 ICT PCT patents, applications/million pop. .......95 ......... 0.0 9.03 Impact of ICTs on new organizational models* ...67 ......... 4.2 9.04 Knowledge-intensive jobs, % workforce .............93 ....... 12.8
10th pillar: Social impacts 10.01 Impact of ICTs on access to basic services* ....113 ......... 3.6 10.02 Internet access in schools* ..............................115 ......... 3.0 10.03 ICT use & gov’t efficiency* ...............................109 ......... 3.6 10.04 E-Participation Index, 0–1 (best).........................81 ....... 0.13
Rank Score (out of 144) (1–7)
Networked Readiness Index 2013 ............109 ..3.3Networked Readiness Index 2012 (out of 142) ...................... 99 .....3.4
A. Environment subindex ............................................112 ....3.51st pillar: Political and regulatory environment ................. 111 .....3.22nd pillar: Business and innovation environment ............. 109 .....3.7
B. Readiness subindex ...............................................102 ....3.93rd pillar: Infrastructure and digital content ...................... 107 .....2.94th pillar: Affordability ........................................................ 78 .....5.05th pillar: Skills ................................................................. 108 .....3.7
C. Usage subindex ......................................................111 ....3.06th pillar: Individual usage ................................................ 101 .....2.57th pillar: Business usage .................................................. 75 .....3.48th pillar: Government usage ........................................... 127 .....3.2
D. Impact subindex .....................................................108 ....2.99th pillar: Economic impacts .............................................. 98 .....2.910th pillar: Social impacts ................................................ 114 .....3.0
Honduras3: Country/Economy Profiles
194 | The Global Information Technology Report 2013
Note: Indicators followed by an asterisk (*) are measured on a 1-to-7 (best) scale. For further details and explanation, please refer to the section “How to Read the Country/Economy Profiles” on page 139.
Honduras Lower-middle-income group average
1. Political and regulatory environment
6. Individual usage
5. Skills7. Business usage
4. Affordability8. Governmentusage
3. Infrastructure anddigital content
9. Economicimpacts
2. Business and innovation environment
10. Socialimpacts
1
2
3
4
5
6
7
@ 2013 World Economic Forum

The Networked Readiness Index in detailINDICATOR RANK /144 VALUE
1st pillar: Political and regulatory environment1.01 Effectiveness of law-making bodies* ..................51 ......... 3.91.02 Laws relating to ICTs* ........................................11 ......... 5.51.03 Judicial independence* ......................................12 ......... 6.01.04 Efficiency of legal system in settling disputes* ......6 ......... 5.61.05 Efficiency of legal system in challenging regs* ......7 ......... 5.41.06 Intellectual property protection* ..........................11 ......... 5.61.07 Software piracy rate, % software installed ..........30 .......... 431.08 No. procedures to enforce a contract ..................8 .......... 271.09 No. days to enforce a contract ..........................18 ........ 360
2nd pillar: Business and innovation environment2.01 Availability of latest technologies* .........................8 ......... 6.52.02 Venture capital availability* ...................................2 ......... 4.52.03 Total tax rate, % profits ......................................17 ....... 23.02.04 No. days to start a business ................................5 ............ 32.05 No. procedures to start a business ....................10 ............ 32.06 Intensity of local competition* ...............................9 ......... 5.82.07 Tertiary education gross enrollment rate, % ........35 ....... 60.42.08 Quality of management schools* ........................17 ......... 5.32.09 Gov’t procurement of advanced tech* ...............31 ......... 4.0
3rd pillar: Infrastructure and digital content3.01 Electricity production, kWh/capita ......................40 .. 5,530.23.02 Mobile network coverage, % pop ........................1 ..... 100.03.03 Int’l Internet bandwidth, kb/s per user..................1 .. 1,046.33.04 Secure Internet servers/million pop ....................24 ..... 570.53.05 Accessibility of digital content* ...........................18 ......... 6.2
4th pillar: Affordability4.01 Mobile cellular tariffs, PPP $/min. .........................3 ....... 0.024.02 Fixed broadband Internet tariffs, PPP $/month ..62 ..... 30.754.03 Internet & telephony competition, 0–2 (best) ........1 ....... 2.00
5th pillar: Skills5.01 Quality of educational system* ...........................23 ......... 4.8
5.02 Quality of math & science education* .................11 ......... 5.4 5.03 Secondary education gross enrollment rate, % ..92 ....... 80.15.04 Adult literacy rate, % .........................................n/a ......... n/a
INDICATOR RANK /144 VALUE
6th pillar: Individual usage 6.01 Mobile phone subscriptions/100 pop. ..................1 ..... 214.7 6.02 Individuals using Internet, %...............................24 ....... 74.5 6.03 Households w/ personal computer, % ...............26 ....... 77.9 6.04 Households w/ Internet access, % ....................22 ....... 76.4 6.05 Broadband Internet subscriptions/100 pop. .......14 ....... 31.6 6.06 Mobile broadband subscriptions/100 pop. .........15 ....... 55.2 6.07 Use of virtual social networks* ...........................12 ......... 6.2
7th pillar: Business usage 7.01 Firm-level technology absorption* ........................7 ......... 6.0 7.02 Capacity for innovation* .....................................37 ......... 3.6 7.03 PCT patents, applications/million pop. .............n/a ......... n/a 7.04 Business-to-business Internet use* ....................18 ......... 5.9 7.05 Business-to-consumer Internet use* ..................22 ......... 5.5 7.06 Extent of staff training* .......................................24 ......... 4.6
8th pillar: Government usage 8.01 Importance of ICTs to gov’t vision* .....................32 ......... 4.5 8.02 Government Online Service Index, 0–1 (best) ....n/a ......... n/a 8.03 Gov’t success in ICT promotion* ........................19 ......... 5.2
9th pillar: Economic impacts 9.01 Impact of ICTs on new services and products* ..19 ......... 5.3 9.02 ICT PCT patents, applications/million pop. ......n/a ......... n/a 9.03 Impact of ICTs on new organizational models* ...15 ......... 5.1 9.04 Knowledge-intensive jobs, % workforce .............31 ....... 36.0
10th pillar: Social impacts 10.01 Impact of ICTs on access to basic services* ......19 ......... 5.5 10.02 Internet access in schools* ................................16 ......... 6.0 10.03 ICT use & gov’t efficiency* .................................22 ......... 5.1 10.04 E-Participation Index, 0–1 (best)........................n/a ......... n/a
Rank Score (out of 144) (1–7)
Networked Readiness Index 2013 ..............14 ..5.4Networked Readiness Index 2012 (out of 142) ...................... 13 .....5.5
A. Environment subindex ................................................8 ....5.41st pillar: Political and regulatory environment ................... 15 .....5.32nd pillar: Business and innovation environment ................. 2 .....5.6
B. Readiness subindex .................................................19 ....5.73rd pillar: Infrastructure and digital content ........................ 27 .....5.84th pillar: Affordability ........................................................ 17 .....6.35th pillar: Skills ................................................................... 52 .....5.0
C. Usage subindex ........................................................20 ....5.26th pillar: Individual usage .................................................. 12 .....5.97th pillar: Business usage .................................................. 19 .....4.88th pillar: Government usage ............................................. 30 .....4.9
D. Impact subindex .......................................................12 ....5.39th pillar: Economic impacts .............................................. 15 .....5.010th pillar: Social impacts .................................................. 12 .....5.5
Hong Kong SAR3: Country/Economy Profiles
The Global Information Technology Report 2013 | 195
Note: Indicators followed by an asterisk (*) are measured on a 1-to-7 (best) scale. For further details and explanation, please refer to the section “How to Read the Country/Economy Profiles” on page 139.
Hong Kong SAR High-income group average
1. Political and regulatory environment
6. Individual usage
5. Skills7. Business usage
4. Affordability8. Governmentusage
3. Infrastructure anddigital content
9. Economicimpacts
2. Business and innovation environment
10. Socialimpacts
1
2
3
4
5
6
7
@ 2013 World Economic Forum

The Networked Readiness Index in detailINDICATOR RANK /144 VALUE
1st pillar: Political and regulatory environment1.01 Effectiveness of law-making bodies* ..................58 ......... 3.81.02 Laws relating to ICTs* ........................................48 ......... 4.41.03 Judicial independence* ......................................72 ......... 3.71.04 Efficiency of legal system in settling disputes* ..117 ......... 3.01.05 Efficiency of legal system in challenging regs* ..135 ......... 2.51.06 Intellectual property protection* ..........................48 ......... 4.01.07 Software piracy rate, % software installed ..........28 .......... 411.08 No. procedures to enforce a contract ................48 .......... 351.09 No. days to enforce a contract ..........................29 ........ 395
2nd pillar: Business and innovation environment2.01 Availability of latest technologies* .......................55 ......... 5.22.02 Venture capital availability* ...............................115 ......... 2.12.03 Total tax rate, % profits ....................................114 ....... 50.32.04 No. days to start a business ..............................10 ............ 52.05 No. procedures to start a business ....................20 ............ 42.06 Intensity of local competition* .............................38 ......... 5.32.07 Tertiary education gross enrollment rate, % ........34 ....... 60.72.08 Quality of management schools* ........................81 ......... 4.12.09 Gov’t procurement of advanced tech* .............110 ......... 3.1
3rd pillar: Infrastructure and digital content3.01 Electricity production, kWh/capita ......................59 .. 3,737.53.02 Mobile network coverage, % pop ......................51 ....... 99.03.03 Int’l Internet bandwidth, kb/s per user................79 ....... 12.23.04 Secure Internet servers/million pop ....................37 ..... 219.93.05 Accessibility of digital content* ...........................26 ......... 6.0
4th pillar: Affordability4.01 Mobile cellular tariffs, PPP $/min. .......................77 ....... 0.314.02 Fixed broadband Internet tariffs, PPP $/month ..77 ..... 34.824.03 Internet & telephony competition, 0–2 (best) ......67 ....... 1.88
5th pillar: Skills5.01 Quality of educational system* ...........................90 ......... 3.45.02 Quality of math & science education* .................39 ......... 4.55.03 Secondary education gross enrollment rate, % ..37 ..... 100.15.04 Adult literacy rate, % ..........................................14 ....... 99.0
INDICATOR RANK /144 VALUE
6th pillar: Individual usage 6.01 Mobile phone subscriptions/100 pop. ................49 ..... 117.3 6.02 Individuals using Internet, %...............................43 ....... 59.0 6.03 Households w/ personal computer, % ...............37 ....... 69.7 6.04 Households w/ Internet access, % ....................34 ....... 65.2 6.05 Broadband Internet subscriptions/100 pop. .......28 ....... 22.2 6.06 Mobile broadband subscriptions/100 pop. .........70 ....... 11.9 6.07 Use of virtual social networks* ...........................77 ......... 5.4
7th pillar: Business usage 7.01 Firm-level technology absorption* ......................64 ......... 4.8 7.02 Capacity for innovation* .....................................45 ......... 3.5 7.03 PCT patents, applications/million pop. ..............28 ....... 22.3 7.04 Business-to-business Internet use* ....................66 ......... 5.0 7.05 Business-to-consumer Internet use* ..................58 ......... 4.7 7.06 Extent of staff training* .....................................110 ......... 3.5
8th pillar: Government usage 8.01 Importance of ICTs to gov’t vision* ...................102 ......... 3.5 8.02 Government Online Service Index, 0–1 (best) .....31 ....... 0.69 8.03 Gov’t success in ICT promotion* ......................120 ......... 3.5
9th pillar: Economic impacts 9.01 Impact of ICTs on new services and products* ..73 ......... 4.4 9.02 ICT PCT patents, applications/million pop. .......28 ......... 5.4 9.03 Impact of ICTs on new organizational models* ...85 ......... 4.0 9.04 Knowledge-intensive jobs, % workforce .............28 ....... 36.7
10th pillar: Social impacts 10.01 Impact of ICTs on access to basic services* ......69 ......... 4.2 10.02 Internet access in schools* ................................30 ......... 5.4 10.03 ICT use & gov’t efficiency* .................................80 ......... 4.1 10.04 E-Participation Index, 0–1 (best).........................36 ....... 0.45
Rank Score (out of 144) (1–7)
Networked Readiness Index 2013 ..............44 ..4.3Networked Readiness Index 2012 (out of 142) ...................... 43 .....4.3
A. Environment subindex ..............................................47 ....4.21st pillar: Political and regulatory environment ................... 49 .....4.02nd pillar: Business and innovation environment ............... 51 .....4.4
B. Readiness subindex .................................................59 ....4.93rd pillar: Infrastructure and digital content ........................ 58 .....4.34th pillar: Affordability ........................................................ 74 .....5.15th pillar: Skills ................................................................... 42 .....5.2
C. Usage subindex ........................................................46 ....4.16th pillar: Individual usage .................................................. 42 .....4.77th pillar: Business usage .................................................. 61 .....3.58th pillar: Government usage ............................................. 69 .....4.0
D. Impact subindex .......................................................42 ....4.09th pillar: Economic impacts .............................................. 41 .....3.710th pillar: Social impacts .................................................. 40 .....4.3
Hungary3: Country/Economy Profiles
196 | The Global Information Technology Report 2013
Note: Indicators followed by an asterisk (*) are measured on a 1-to-7 (best) scale. For further details and explanation, please refer to the section “How to Read the Country/Economy Profiles” on page 139.
Hungary High-income group average
1. Political and regulatory environment
6. Individual usage
5. Skills7. Business usage
4. Affordability8. Governmentusage
3. Infrastructure anddigital content
9. Economicimpacts
2. Business and innovation environment
10. Socialimpacts
1
2
3
4
5
6
7
@ 2013 World Economic Forum

The Networked Readiness Index in detailINDICATOR RANK /144 VALUE
1st pillar: Political and regulatory environment1.01 Effectiveness of law-making bodies* ..................67 ......... 3.61.02 Laws relating to ICTs* ........................................26 ......... 5.01.03 Judicial independence* ......................................18 ......... 5.71.04 Efficiency of legal system in settling disputes* ....27 ......... 4.71.05 Efficiency of legal system in challenging regs* ....29 ......... 4.51.06 Intellectual property protection* ..........................26 ......... 5.21.07 Software piracy rate, % software installed ..........34 .......... 481.08 No. procedures to enforce a contract ..................8 .......... 271.09 No. days to enforce a contract ..........................41 ........ 417
2nd pillar: Business and innovation environment2.01 Availability of latest technologies* .........................7 ......... 6.52.02 Venture capital availability* .................................65 ......... 2.62.03 Total tax rate, % profits ......................................46 ....... 33.02.04 No. days to start a business ..............................10 ............ 52.05 No. procedures to start a business ....................30 ............ 52.06 Intensity of local competition* .............................84 ......... 4.6
2.07 Tertiary education gross enrollment rate, % ........11 ....... 78.62.08 Quality of management schools* ........................18 ......... 5.22.09 Gov’t procurement of advanced tech* ...............30 ......... 4.0
3rd pillar: Infrastructure and digital content3.01 Electricity production, kWh/capita ........................1 53,637.73.02 Mobile network coverage, % pop ......................51 ....... 99.03.03 Int’l Internet bandwidth, kb/s per user..................3 ..... 287.13.04 Secure Internet servers/million pop ......................1 .. 3,025.13.05 Accessibility of digital content* .............................3 ......... 6.5
4th pillar: Affordability4.01 Mobile cellular tariffs, PPP $/min. .......................23 ....... 0.134.02 Fixed broadband Internet tariffs, PPP $/month ..34 ..... 23.234.03 Internet & telephony competition, 0–2 (best) ........1 ....... 2.00
5th pillar: Skills5.01 Quality of educational system* .............................8 ......... 5.45.02 Quality of math & science education* .................22 ......... 5.05.03 Secondary education gross enrollment rate, % ..15 ..... 108.05.04 Adult literacy rate, % ..........................................15 ....... 99.0
INDICATOR RANK /144 VALUE
6th pillar: Individual usage 6.01 Mobile phone subscriptions/100 pop. ................72 ..... 106.1 6.02 Individuals using Internet, %.................................1 ....... 95.0 6.03 Households w/ personal computer, % .................1 ....... 94.7 6.04 Households w/ Internet access, % ......................3 ....... 92.6 6.05 Broadband Internet subscriptions/100 pop. .........7 ....... 33.9 6.06 Mobile broadband subscriptions/100 pop. .........14 ....... 57.0 6.07 Use of virtual social networks* .............................1 ......... 6.6
7th pillar: Business usage 7.01 Firm-level technology absorption* ........................2 ......... 6.3 7.02 Capacity for innovation* .....................................21 ......... 4.4 7.03 PCT patents, applications/million pop. ..............17 ....... 95.5 7.04 Business-to-business Internet use* ....................30 ......... 5.6 7.05 Business-to-consumer Internet use* ..................29 ......... 5.3 7.06 Extent of staff training* .......................................21 ......... 4.7
8th pillar: Government usage 8.01 Importance of ICTs to gov’t vision* .....................57 ......... 4.2 8.02 Government Online Service Index, 0–1 (best) .....53 ....... 0.54 8.03 Gov’t success in ICT promotion* ........................62 ......... 4.5
9th pillar: Economic impacts 9.01 Impact of ICTs on new services and products* ..32 ......... 5.0 9.02 ICT PCT patents, applications/million pop. .......22 ....... 14.7 9.03 Impact of ICTs on new organizational models* ...25 ......... 4.9 9.04 Knowledge-intensive jobs, % workforce ...............5 ....... 46.0
10th pillar: Social impacts 10.01 Impact of ICTs on access to basic services* ......15 ......... 5.6 10.02 Internet access in schools* ..................................1 ......... 6.5 10.03 ICT use & gov’t efficiency* .................................27 ......... 5.0 10.04 E-Participation Index, 0–1 (best).........................76 ....... 0.16
Rank Score (out of 144) (1–7)
Networked Readiness Index 2013 ..............17 ..5.3Networked Readiness Index 2012 (out of 142) ...................... 15 .....5.3
A. Environment subindex ..............................................21 ....5.01st pillar: Political and regulatory environment ................... 25 .....4.92nd pillar: Business and innovation environment ............... 22 .....5.2
B. Readiness subindex ...................................................2 ....6.43rd pillar: Infrastructure and digital content .......................... 1 .....6.94th pillar: Affordability .......................................................... 5 .....6.65th pillar: Skills ..................................................................... 9 .....5.9
C. Usage subindex ........................................................21 ....5.16th pillar: Individual usage .................................................... 8 .....6.47th pillar: Business usage .................................................. 20 .....4.88th pillar: Government usage ............................................. 50 .....4.3
D. Impact subindex .......................................................25 ....4.69th pillar: Economic impacts .............................................. 24 .....4.510th pillar: Social impacts .................................................. 33 .....4.8
Iceland3: Country/Economy Profiles
The Global Information Technology Report 2013 | 197
Note: Indicators followed by an asterisk (*) are measured on a 1-to-7 (best) scale. For further details and explanation, please refer to the section “How to Read the Country/Economy Profiles” on page 139.
Iceland High-income group average
1. Political and regulatory environment
6. Individual usage
5. Skills7. Business usage
4. Affordability8. Governmentusage
3. Infrastructure anddigital content
9. Economicimpacts
2. Business and innovation environment
10. Socialimpacts
1
2
3
4
5
6
7
@ 2013 World Economic Forum

The Networked Readiness Index in detailINDICATOR RANK /144 VALUE
1st pillar: Political and regulatory environment1.01 Effectiveness of law-making bodies* ..................53 ......... 3.91.02 Laws relating to ICTs* ........................................52 ......... 4.31.03 Judicial independence* ......................................45 ......... 4.51.04 Efficiency of legal system in settling disputes* ....59 ......... 3.81.05 Efficiency of legal system in challenging regs* ....52 ......... 3.91.06 Intellectual property protection* ..........................63 ......... 3.71.07 Software piracy rate, % software installed ..........58 .......... 631.08 No. procedures to enforce a contract ..............131 .......... 461.09 No. days to enforce a contract ........................140 ..... 1,420
2nd pillar: Business and innovation environment2.01 Availability of latest technologies* .......................47 ......... 5.32.02 Venture capital availability* .................................26 ......... 3.42.03 Total tax rate, % profits ....................................125 ....... 61.82.04 No. days to start a business ............................103 .......... 272.05 No. procedures to start a business ..................126 .......... 122.06 Intensity of local competition* .............................34 ......... 5.42.07 Tertiary education gross enrollment rate, % ........96 ....... 17.92.08 Quality of management schools* ........................33 ......... 4.92.09 Gov’t procurement of advanced tech* ...............83 ......... 3.4
3rd pillar: Infrastructure and digital content 3.01 Electricity production, kWh/capita ....................102 ..... 744.7 3.02 Mobile network coverage, % pop ....................113 ....... 83.03.03 Int’l Internet bandwidth, kb/s per user................99 ......... 6.3
3.04 Secure Internet servers/million pop ..................106 ......... 2.9 3.05 Accessibility of digital content* ...........................91 ......... 4.6
4th pillar: Affordability 4.01 Mobile cellular tariffs, PPP $/min. .........................6 ....... 0.044.02 Fixed broadband Internet tariffs, PPP $/month ....4 ..... 14.754.03 Internet & telephony competition, 0–2 (best) ........1 ....... 2.00
5th pillar: Skills5.01 Quality of educational system* ...........................34 ......... 4.4
5.02 Quality of math & science education* .................30 ......... 4.7 5.03 Secondary education gross enrollment rate, % 108 ....... 63.25.04 Adult literacy rate, % ........................................121 ....... 62.8
INDICATOR RANK /144 VALUE
6th pillar: Individual usage 6.01 Mobile phone subscriptions/100 pop. ..............117 ....... 72.0 6.02 Individuals using Internet, %.............................119 ....... 10.1 6.03 Households w/ personal computer, % .............112 ......... 6.1 6.04 Households w/ Internet access, % ..................108 ......... 4.2 6.05 Broadband Internet subscriptions/100 pop. .....102 ......... 1.1 6.06 Mobile broadband subscriptions/100 pop. .......102 ......... 1.9 6.07 Use of virtual social networks* ...........................96 ......... 5.1
7th pillar: Business usage 7.01 Firm-level technology absorption* ......................40 ......... 5.2 7.02 Capacity for innovation* .....................................42 ......... 3.5 7.03 PCT patents, applications/million pop. ..............62 ......... 1.3 7.04 Business-to-business Internet use* ....................59 ......... 5.1 7.05 Business-to-consumer Internet use* ..................76 ......... 4.4 7.06 Extent of staff training* .......................................54 ......... 4.1
8th pillar: Government usage 8.01 Importance of ICTs to gov’t vision* .....................45 ......... 4.3 8.02 Government Online Service Index, 0–1 (best) .....55 ....... 0.54 8.03 Gov’t success in ICT promotion* ........................24 ......... 5.1
9th pillar: Economic impacts 9.01 Impact of ICTs on new services and products* ..36 ......... 5.0 9.02 ICT PCT patents, applications/million pop. .......57 ......... 0.3 9.03 Impact of ICTs on new organizational models* ...27 ......... 4.9 9.04 Knowledge-intensive jobs, % workforce ............n/a ......... n/a
10th pillar: Social impacts 10.01 Impact of ICTs on access to basic services* ......64 ......... 4.3 10.02 Internet access in schools* ................................75 ......... 4.0 10.03 ICT use & gov’t efficiency* .................................54 ......... 4.4 10.04 E-Participation Index, 0–1 (best).........................70 ....... 0.18
Rank Score (out of 144) (1–7)
Networked Readiness Index 2013 ..............68 ..3.9Networked Readiness Index 2012 (out of 142) ...................... 69 .....3.9
A. Environment subindex ..............................................85 ....3.81st pillar: Political and regulatory environment ................... 75 .....3.72nd pillar: Business and innovation environment ............... 99 .....3.8
B. Readiness subindex .................................................68 ....4.73rd pillar: Infrastructure and digital content ...................... 111 .....2.84th pillar: Affordability .......................................................... 1 .....7.05th pillar: Skills ................................................................... 95 .....4.3
C. Usage subindex ........................................................81 ....3.46th pillar: Individual usage ................................................ 121 .....2.07th pillar: Business usage .................................................. 45 .....3.78th pillar: Government usage ............................................. 40 .....4.5
D. Impact subindex .......................................................56 ....3.79th pillar: Economic impacts .............................................. 43 .....3.610th pillar: Social impacts .................................................. 73 .....3.7
India3: Country/Economy Profiles
198 | The Global Information Technology Report 2013
Note: Indicators followed by an asterisk (*) are measured on a 1-to-7 (best) scale. For further details and explanation, please refer to the section “How to Read the Country/Economy Profiles” on page 139.
India Lower-middle-income group average
1. Political and regulatory environment
6. Individual usage
5. Skills7. Business usage
4. Affordability8. Governmentusage
3. Infrastructure anddigital content
9. Economicimpacts
2. Business and innovation environment
10. Socialimpacts
1
2
3
4
5
6
7
@ 2013 World Economic Forum

The Networked Readiness Index in detailINDICATOR RANK /144 VALUE
1st pillar: Political and regulatory environment1.01 Effectiveness of law-making bodies* ..................77 ......... 3.51.02 Laws relating to ICTs* ........................................58 ......... 4.21.03 Judicial independence* ......................................76 ......... 3.61.04 Efficiency of legal system in settling disputes* ....66 ......... 3.81.05 Efficiency of legal system in challenging regs* ....63 ......... 3.81.06 Intellectual property protection* ..........................60 ......... 3.71.07 Software piracy rate, % software installed ..........97 .......... 861.08 No. procedures to enforce a contract ................99 .......... 401.09 No. days to enforce a contract ..........................61 ........ 498
2nd pillar: Business and innovation environment2.01 Availability of latest technologies* .......................72 ......... 4.92.02 Venture capital availability* .................................21 ......... 3.62.03 Total tax rate, % profits ......................................54 ....... 34.52.04 No. days to start a business ............................127 .......... 472.05 No. procedures to start a business ..................102 ............ 92.06 Intensity of local competition* .............................96 ......... 4.4
2.07 Tertiary education gross enrollment rate, % ........86 ....... 23.12.08 Quality of management schools* ........................70 ......... 4.22.09 Gov’t procurement of advanced tech* ...............29 ......... 4.0
3rd pillar: Infrastructure and digital content3.01 Electricity production, kWh/capita ....................106 ..... 654.83.02 Mobile network coverage, % pop ........................1 ..... 100.03.03 Int’l Internet bandwidth, kb/s per user................94 ......... 7.23.04 Secure Internet servers/million pop ..................103 ......... 3.43.05 Accessibility of digital content* ...........................81 ......... 4.9
4th pillar: Affordability4.01 Mobile cellular tariffs, PPP $/min. .......................39 ....... 0.174.02 Fixed broadband Internet tariffs, PPP $/month ..57 ..... 29.704.03 Internet & telephony competition, 0–2 (best) ......81 ....... 1.79
5th pillar: Skills5.01 Quality of educational system* ...........................47 ......... 4.1
5.02 Quality of math & science education* .................45 ......... 4.4 5.03 Secondary education gross enrollment rate, % ..96 ....... 77.25.04 Adult literacy rate, % ..........................................74 ....... 92.6
INDICATOR RANK /144 VALUE
6th pillar: Individual usage 6.01 Mobile phone subscriptions/100 pop. ................79 ..... 103.1 6.02 Individuals using Internet, %.............................101 ....... 18.0 6.03 Households w/ personal computer, % .............101 ....... 12.0 6.04 Households w/ Internet access, % ..................100 ......... 7.0 6.05 Broadband Internet subscriptions/100 pop. .....100 ......... 1.1 6.06 Mobile broadband subscriptions/100 pop. .........48 ....... 22.2 6.07 Use of virtual social networks* ...........................51 ......... 5.7
7th pillar: Business usage 7.01 Firm-level technology absorption* ......................56 ......... 4.9 7.02 Capacity for innovation* .....................................30 ......... 3.9 7.03 PCT patents, applications/million pop. ............101 ......... 0.1 7.04 Business-to-business Internet use* ....................97 ......... 4.6 7.05 Business-to-consumer Internet use* ..................44 ......... 4.9 7.06 Extent of staff training* .......................................39 ......... 4.3
8th pillar: Government usage 8.01 Importance of ICTs to gov’t vision* .....................65 ......... 4.1 8.02 Government Online Service Index, 0–1 (best) .....67 ....... 0.50 8.03 Gov’t success in ICT promotion* ........................61 ......... 4.5
9th pillar: Economic impacts 9.01 Impact of ICTs on new services and products* ..66 ......... 4.5 9.02 ICT PCT patents, applications/million pop. .......92 ......... 0.0 9.03 Impact of ICTs on new organizational models* ...54 ......... 4.4 9.04 Knowledge-intensive jobs, % workforce .............98 ......... 7.4
10th pillar: Social impacts 10.01 Impact of ICTs on access to basic services* ......73 ......... 4.1 10.02 Internet access in schools* ................................56 ......... 4.5 10.03 ICT use & gov’t efficiency* .................................82 ......... 4.1 10.04 E-Participation Index, 0–1 (best).........................62 ....... 0.21
Rank Score (out of 144) (1–7)
Networked Readiness Index 2013 ..............76 ..3.8Networked Readiness Index 2012 (out of 142) ...................... 80 .....3.7
A. Environment subindex ..............................................78 ....3.81st pillar: Political and regulatory environment ................... 82 .....3.62nd pillar: Business and innovation environment ............... 73 .....4.1
B. Readiness subindex .................................................71 ....4.73rd pillar: Infrastructure and digital content ........................ 89 .....3.34th pillar: Affordability ........................................................ 39 .....5.85th pillar: Skills ................................................................... 63 .....4.9
C. Usage subindex ........................................................70 ....3.66th pillar: Individual usage .................................................. 92 .....2.77th pillar: Business usage .................................................. 40 .....3.88th pillar: Government usage ............................................. 58 .....4.2
D. Impact subindex .......................................................86 ....3.39th pillar: Economic impacts ............................................ 101 .....2.910th pillar: Social impacts .................................................. 72 .....3.7
Indonesia3: Country/Economy Profiles
The Global Information Technology Report 2013 | 199
Note: Indicators followed by an asterisk (*) are measured on a 1-to-7 (best) scale. For further details and explanation, please refer to the section “How to Read the Country/Economy Profiles” on page 139.
Indonesia Lower-middle-income group average
1. Political and regulatory environment
6. Individual usage
5. Skills7. Business usage
4. Affordability8. Governmentusage
3. Infrastructure anddigital content
9. Economicimpacts
2. Business and innovation environment
10. Socialimpacts
1
2
3
4
5
6
7
@ 2013 World Economic Forum

The Networked Readiness Index in detailINDICATOR RANK /144 VALUE
1st pillar: Political and regulatory environment1.01 Effectiveness of law-making bodies* ..................50 ......... 3.91.02 Laws relating to ICTs* ........................................99 ......... 3.51.03 Judicial independence* ......................................63 ......... 4.01.04 Efficiency of legal system in settling disputes* ....77 ......... 3.61.05 Efficiency of legal system in challenging regs* ..104 ......... 3.11.06 Intellectual property protection* ........................112 ......... 2.91.07 Software piracy rate, % software installed .........n/a ......... n/a1.08 No. procedures to enforce a contract ................90 .......... 391.09 No. days to enforce a contract ..........................62 ........ 505
2nd pillar: Business and innovation environment2.01 Availability of latest technologies* .....................114 ......... 4.22.02 Venture capital availability* ...............................129 ......... 1.92.03 Total tax rate, % profits ......................................96 ....... 44.12.04 No. days to start a business ..............................62 .......... 132.05 No. procedures to start a business ....................74 ............ 72.06 Intensity of local competition* ...........................106 ......... 4.32.07 Tertiary education gross enrollment rate, % ........53 ....... 48.62.08 Quality of management schools* ........................93 ......... 3.92.09 Gov’t procurement of advanced tech* ...............66 ......... 3.6
3rd pillar: Infrastructure and digital content3.01 Electricity production, kWh/capita ......................68 .. 2,778.23.02 Mobile network coverage, % pop ......................89 ....... 95.83.03 Int’l Internet bandwidth, kb/s per user..............116 ......... 3.53.04 Secure Internet servers/million pop ..................126 ......... 1.03.05 Accessibility of digital content* .........................114 ......... 4.0
4th pillar: Affordability4.01 Mobile cellular tariffs, PPP $/min. .......................57 ....... 0.244.02 Fixed broadband Internet tariffs, PPP $/month 118 ..... 76.884.03 Internet & telephony competition, 0–2 (best) ....105 ....... 1.33
5th pillar: Skills5.01 Quality of educational system* ...........................94 ......... 3.35.02 Quality of math & science education* .................32 ......... 4.65.03 Secondary education gross enrollment rate, % ..83 ....... 85.75.04 Adult literacy rate, % ........................................101 ....... 85.0
INDICATOR RANK /144 VALUE
6th pillar: Individual usage 6.01 Mobile phone subscriptions/100 pop. ..............113 ....... 74.9 6.02 Individuals using Internet, %...............................96 ....... 21.0 6.03 Households w/ personal computer, % ...............72 ....... 33.7 6.04 Households w/ Internet access, % ....................76 ....... 20.8 6.05 Broadband Internet subscriptions/100 pop. .......90 ......... 2.4 6.06 Mobile broadband subscriptions/100 pop. .......126 ......... 0.0 6.07 Use of virtual social networks* .........................144 ......... 3.1
7th pillar: Business usage 7.01 Firm-level technology absorption* ....................119 ......... 4.1 7.02 Capacity for innovation* .....................................59 ......... 3.3 7.03 PCT patents, applications/million pop. ............104 ......... 0.1 7.04 Business-to-business Internet use* ..................133 ......... 3.9 7.05 Business-to-consumer Internet use* ................116 ......... 3.6 7.06 Extent of staff training* .....................................134 ......... 3.0
8th pillar: Government usage 8.01 Importance of ICTs to gov’t vision* .....................81 ......... 3.9 8.02 Government Online Service Index, 0–1 (best) .....70 ....... 0.49 8.03 Gov’t success in ICT promotion* ........................82 ......... 4.2
9th pillar: Economic impacts 9.01 Impact of ICTs on new services and products* ..91 ......... 4.1 9.02 ICT PCT patents, applications/million pop. .......83 ......... 0.0 9.03 Impact of ICTs on new organizational models* ...96 ......... 3.8 9.04 Knowledge-intensive jobs, % workforce .............89 ....... 15.0
10th pillar: Social impacts 10.01 Impact of ICTs on access to basic services* ......78 ......... 4.1 10.02 Internet access in schools* ..............................117 ......... 2.9 10.03 ICT use & gov’t efficiency* .................................61 ......... 4.3 10.04 E-Participation Index, 0–1 (best).........................70 ....... 0.18
Rank Score (out of 144) (1–7)
Networked Readiness Index 2013 ............101 ..3.4Networked Readiness Index 2012 (out of 142) .................... 104 .....3.4
A. Environment subindex ..............................................72 ....3.91st pillar: Political and regulatory environment ................... 67 .....3.72nd pillar: Business and innovation environment ............... 80 .....4.0
B. Readiness subindex ...............................................109 ....3.73rd pillar: Infrastructure and digital content ........................ 97 .....3.14th pillar: Affordability ...................................................... 115 .....3.15th pillar: Skills ................................................................... 69 .....4.8
C. Usage subindex ......................................................106 ....3.16th pillar: Individual usage ................................................ 108 .....2.27th pillar: Business usage ................................................ 119 .....3.08th pillar: Government usage ............................................. 71 .....4.0
D. Impact subindex .......................................................99 ....3.19th pillar: Economic impacts ............................................ 106 .....2.810th pillar: Social impacts .................................................. 94 .....3.4
Iran, Islamic Rep.3: Country/Economy Profiles
200 | The Global Information Technology Report 2013
Note: Indicators followed by an asterisk (*) are measured on a 1-to-7 (best) scale. For further details and explanation, please refer to the section “How to Read the Country/Economy Profiles” on page 139.
Iran, Islamic Rep. Upper-middle-income group average
1. Political and regulatory environment
6. Individual usage
5. Skills7. Business usage
4. Affordability8. Governmentusage
3. Infrastructure anddigital content
9. Economicimpacts
2. Business and innovation environment
10. Socialimpacts
1
2
3
4
5
6
7
@ 2013 World Economic Forum

The Networked Readiness Index in detailINDICATOR RANK /144 VALUE
1st pillar: Political and regulatory environment1.01 Effectiveness of law-making bodies* ..................32 ......... 4.31.02 Laws relating to ICTs* ........................................28 ......... 5.01.03 Judicial independence* ........................................4 ......... 6.31.04 Efficiency of legal system in settling disputes* ....29 ......... 4.61.05 Efficiency of legal system in challenging regs* ....31 ......... 4.51.06 Intellectual property protection* ..........................15 ......... 5.51.07 Software piracy rate, % software installed ..........19 .......... 341.08 No. procedures to enforce a contract ..................1 .......... 211.09 No. days to enforce a contract ........................103 ........ 650
2nd pillar: Business and innovation environment2.01 Availability of latest technologies* .......................29 ......... 6.02.02 Venture capital availability* .................................88 ......... 2.42.03 Total tax rate, % profits ......................................24 ....... 26.42.04 No. days to start a business ..............................49 .......... 102.05 No. procedures to start a business ....................20 ............ 42.06 Intensity of local competition* .............................40 ......... 5.2
2.07 Tertiary education gross enrollment rate, % ........24 ....... 66.22.08 Quality of management schools* ........................23 ......... 5.12.09 Gov’t procurement of advanced tech* ...............80 ......... 3.5
3rd pillar: Infrastructure and digital content3.01 Electricity production, kWh/capita ......................35 .. 6,315.53.02 Mobile network coverage, % pop ......................51 ....... 99.03.03 Int’l Internet bandwidth, kb/s per user................25 ....... 69.03.04 Secure Internet servers/million pop ....................17 .. 1,154.43.05 Accessibility of digital content* ...........................41 ......... 5.5
4th pillar: Affordability 4.01 Mobile cellular tariffs, PPP $/min. .......................89 ....... 0.364.02 Fixed broadband Internet tariffs, PPP $/month ..60 ..... 29.824.03 Internet & telephony competition, 0–2 (best) ........1 ....... 2.00
5th pillar: Skills5.01 Quality of educational system* .............................9 ......... 5.35.02 Quality of math & science education* .................31 ......... 4.75.03 Secondary education gross enrollment rate, % ....4 ..... 121.05.04 Adult literacy rate, % ..........................................15 ....... 99.0
INDICATOR RANK /144 VALUE
6th pillar: Individual usage 6.01 Mobile phone subscriptions/100 pop. ................66 ..... 108.4 6.02 Individuals using Internet, %...............................22 ....... 76.8 6.03 Households w/ personal computer, % ...............20 ....... 80.6 6.04 Households w/ Internet access, % ....................19 ....... 78.1 6.05 Broadband Internet subscriptions/100 pop. .......32 ....... 22.0 6.06 Mobile broadband subscriptions/100 pop. .........13 ....... 59.4 6.07 Use of virtual social networks* ...........................32 ......... 6.0
7th pillar: Business usage 7.01 Firm-level technology absorption* ......................33 ......... 5.5 7.02 Capacity for innovation* .....................................26 ......... 4.0 7.03 PCT patents, applications/million pop. ..............21 ....... 76.5 7.04 Business-to-business Internet use* ....................32 ......... 5.6 7.05 Business-to-consumer Internet use* ..................27 ......... 5.3 7.06 Extent of staff training* .......................................16 ......... 4.9
8th pillar: Government usage 8.01 Importance of ICTs to gov’t vision* .....................44 ......... 4.4 8.02 Government Online Service Index, 0–1 (best) .....55 ....... 0.54 8.03 Gov’t success in ICT promotion* ........................43 ......... 4.8
9th pillar: Economic impacts 9.01 Impact of ICTs on new services and products* ..24 ......... 5.2 9.02 ICT PCT patents, applications/million pop. .......16 ....... 29.2 9.03 Impact of ICTs on new organizational models* ...20 ......... 5.0 9.04 Knowledge-intensive jobs, % workforce .............23 ....... 38.8
10th pillar: Social impacts 10.01 Impact of ICTs on access to basic services* ......46 ......... 4.8 10.02 Internet access in schools* ................................51 ......... 4.6 10.03 ICT use & gov’t efficiency* .................................43 ......... 4.7 10.04 E-Participation Index, 0–1 (best).........................81 ....... 0.13
Rank Score (out of 144) (1–7)
Networked Readiness Index 2013 ..............27 ..5.1Networked Readiness Index 2012 (out of 142) ...................... 25 .....5.0
A. Environment subindex ..............................................15 ....5.21st pillar: Political and regulatory environment ................... 16 .....5.22nd pillar: Business and innovation environment ............... 24 .....5.1
B. Readiness subindex .................................................16 ....5.83rd pillar: Infrastructure and digital content ........................ 16 .....6.24th pillar: Affordability ........................................................ 61 .....5.45th pillar: Skills ................................................................... 12 .....5.8
C. Usage subindex ........................................................28 ....4.96th pillar: Individual usage .................................................. 21 .....5.67th pillar: Business usage .................................................. 22 .....4.68th pillar: Government usage ............................................. 43 .....4.4
D. Impact subindex .......................................................33 ....4.49th pillar: Economic impacts .............................................. 18 .....4.810th pillar: Social impacts .................................................. 56 .....4.0
Ireland3: Country/Economy Profiles
The Global Information Technology Report 2013 | 201
Note: Indicators followed by an asterisk (*) are measured on a 1-to-7 (best) scale. For further details and explanation, please refer to the section “How to Read the Country/Economy Profiles” on page 139.
Ireland High-income group average
1. Political and regulatory environment
6. Individual usage
5. Skills7. Business usage
4. Affordability8. Governmentusage
3. Infrastructure anddigital content
9. Economicimpacts
2. Business and innovation environment
10. Socialimpacts
1
2
3
4
5
6
7
@ 2013 World Economic Forum

The Networked Readiness Index in detailINDICATOR RANK /144 VALUE
1st pillar: Political and regulatory environment1.01 Effectiveness of law-making bodies* ..................55 ......... 3.91.02 Laws relating to ICTs* ........................................30 ......... 5.01.03 Judicial independence* ......................................15 ......... 5.91.04 Efficiency of legal system in settling disputes* ....46 ......... 4.11.05 Efficiency of legal system in challenging regs* ....57 ......... 3.91.06 Intellectual property protection* ..........................33 ......... 4.81.07 Software piracy rate, % software installed ..........17 .......... 311.08 No. procedures to enforce a contract ................48 .......... 351.09 No. days to enforce a contract ........................124 ........ 890
2nd pillar: Business and innovation environment2.01 Availability of latest technologies* .......................22 ......... 6.22.02 Venture capital availability* ...................................3 ......... 4.52.03 Total tax rate, % profits ......................................39 ....... 30.52.04 No. days to start a business ..............................90 .......... 212.05 No. procedures to start a business ....................30 ............ 52.06 Intensity of local competition* .............................66 ......... 4.92.07 Tertiary education gross enrollment rate, % ........32 ....... 62.52.08 Quality of management schools* ........................40 ......... 4.72.09 Gov’t procurement of advanced tech* .................6 ......... 4.6
3rd pillar: Infrastructure and digital content3.01 Electricity production, kWh/capita ......................28 .. 7,507.73.02 Mobile network coverage, % pop ......................51 ....... 99.03.03 Int’l Internet bandwidth, kb/s per user................39 ....... 37.83.04 Secure Internet servers/million pop ....................27 ..... 470.13.05 Accessibility of digital content* ...........................33 ......... 5.8
4th pillar: Affordability4.01 Mobile cellular tariffs, PPP $/min. .......................74 ....... 0.304.02 Fixed broadband Internet tariffs, PPP $/month ....1 ....... 8.114.03 Internet & telephony competition, 0–2 (best) ....111 ....... 1.27
5th pillar: Skills5.01 Quality of educational system* ...........................53 ......... 4.05.02 Quality of math & science education* .................89 ......... 3.75.03 Secondary education gross enrollment rate, % ..26 ..... 102.15.04 Adult literacy rate, % ..........................................15 ....... 99.0
INDICATOR RANK /144 VALUE
6th pillar: Individual usage 6.01 Mobile phone subscriptions/100 pop. ................45 ..... 121.7 6.02 Individuals using Internet, %...............................34 ....... 70.0 6.03 Households w/ personal computer, % ...............22 ....... 79.0 6.04 Households w/ Internet access, % ....................28 ....... 71.0 6.05 Broadband Internet subscriptions/100 pop. .......22 ....... 24.8 6.06 Mobile broadband subscriptions/100 pop. .........26 ....... 40.6 6.07 Use of virtual social networks* ...........................34 ......... 6.0
7th pillar: Business usage 7.01 Firm-level technology absorption* ........................5 ......... 6.2 7.02 Capacity for innovation* .......................................6 ......... 5.4 7.03 PCT patents, applications/million pop. ................6 ..... 209.1 7.04 Business-to-business Internet use* ....................42 ......... 5.4 7.05 Business-to-consumer Internet use* ..................23 ......... 5.5 7.06 Extent of staff training* .......................................27 ......... 4.6
8th pillar: Government usage 8.01 Importance of ICTs to gov’t vision* .....................41 ......... 4.4 8.02 Government Online Service Index, 0–1 (best) .....15 ....... 0.85 8.03 Gov’t success in ICT promotion* ........................18 ......... 5.2
9th pillar: Economic impacts 9.01 Impact of ICTs on new services and products* ..21 ......... 5.3 9.02 ICT PCT patents, applications/million pop. .........4 ....... 81.3 9.03 Impact of ICTs on new organizational models* ...21 ......... 5.0 9.04 Knowledge-intensive jobs, % workforce .............16 ....... 41.3
10th pillar: Social impacts 10.01 Impact of ICTs on access to basic services* ......21 ......... 5.4 10.02 Internet access in schools* ................................39 ......... 5.1 10.03 ICT use & gov’t efficiency* .................................30 ......... 4.9 10.04 E-Participation Index, 0–1 (best)...........................7 ....... 0.89
Rank Score (out of 144) (1–7)
Networked Readiness Index 2013 ..............15 ..5.4Networked Readiness Index 2012 (out of 142) ...................... 20 .....5.2
A. Environment subindex ..............................................23 ....5.01st pillar: Political and regulatory environment ................... 28 .....4.72nd pillar: Business and innovation environment ............... 15 .....5.3
B. Readiness subindex .................................................22 ....5.63rd pillar: Infrastructure and digital content ........................ 29 .....5.74th pillar: Affordability ........................................................ 44 .....5.75th pillar: Skills ................................................................... 32 .....5.4
C. Usage subindex ........................................................14 ....5.46th pillar: Individual usage .................................................. 28 .....5.47th pillar: Business usage .................................................... 6 .....5.78th pillar: Government usage ............................................. 20 .....5.2
D. Impact subindex .........................................................7 ....5.59th pillar: Economic impacts ................................................ 6 .....5.610th pillar: Social impacts .................................................. 14 .....5.4
Israel3: Country/Economy Profiles
202 | The Global Information Technology Report 2013
Note: Indicators followed by an asterisk (*) are measured on a 1-to-7 (best) scale. For further details and explanation, please refer to the section “How to Read the Country/Economy Profiles” on page 139.
Israel High-income group average
1. Political and regulatory environment
6. Individual usage
5. Skills7. Business usage
4. Affordability8. Governmentusage
3. Infrastructure anddigital content
9. Economicimpacts
2. Business and innovation environment
10. Socialimpacts
1
2
3
4
5
6
7
@ 2013 World Economic Forum

The Networked Readiness Index in detailINDICATOR RANK /144 VALUE
1st pillar: Political and regulatory environment1.01 Effectiveness of law-making bodies* ................116 ......... 2.81.02 Laws relating to ICTs* ........................................77 ......... 3.91.03 Judicial independence* ......................................68 ......... 3.81.04 Efficiency of legal system in settling disputes* ..139 ......... 2.51.05 Efficiency of legal system in challenging regs* ..131 ......... 2.61.06 Intellectual property protection* ..........................62 ......... 3.71.07 Software piracy rate, % software installed ..........34 .......... 481.08 No. procedures to enforce a contract ..............110 .......... 411.09 No. days to enforce a contract ........................132 ..... 1,210
2nd pillar: Business and innovation environment2.01 Availability of latest technologies* .......................69 ......... 5.02.02 Venture capital availability* ...............................121 ......... 2.02.03 Total tax rate, % profits ....................................134 ....... 68.32.04 No. days to start a business ..............................16 ............ 62.05 No. procedures to start a business ....................48 ............ 62.06 Intensity of local competition* .............................67 ......... 4.9
2.07 Tertiary education gross enrollment rate, % ........28 ....... 65.02.08 Quality of management schools* ........................35 ......... 4.82.09 Gov’t procurement of advanced tech* .............121 ......... 2.9
3rd pillar: Infrastructure and digital content3.01 Electricity production, kWh/capita ......................48 .. 4,877.73.02 Mobile network coverage, % pop ......................51 ....... 99.03.03 Int’l Internet bandwidth, kb/s per user................28 ....... 60.83.04 Secure Internet servers/million pop ....................39 ..... 190.93.05 Accessibility of digital content* ...........................87 ......... 4.8
4th pillar: Affordability4.01 Mobile cellular tariffs, PPP $/min. .......................71 ....... 0.294.02 Fixed broadband Internet tariffs, PPP $/month ..40 ..... 25.514.03 Internet & telephony competition, 0–2 (best) ......92 ....... 1.62
5th pillar: Skills5.01 Quality of educational system* ...........................87 ......... 3.4
5.02 Quality of math & science education* .................65 ......... 4.1 5.03 Secondary education gross enrollment rate, % ..35 ..... 100.4 5.04 Adult literacy rate, % ..........................................38 ....... 98.9
INDICATOR RANK /144 VALUE
6th pillar: Individual usage 6.01 Mobile phone subscriptions/100 pop. ................10 ..... 157.9 6.02 Individuals using Internet, %...............................45 ....... 56.8 6.03 Households w/ personal computer, % ...............39 ....... 66.2 6.04 Households w/ Internet access, % ....................40 ....... 61.6 6.05 Broadband Internet subscriptions/100 pop. .......31 ....... 22.1 6.06 Mobile broadband subscriptions/100 pop. .........38 ....... 33.3 6.07 Use of virtual social networks* ...........................61 ......... 5.6
7th pillar: Business usage 7.01 Firm-level technology absorption* ....................104 ......... 4.3 7.02 Capacity for innovation* .....................................28 ......... 4.0 7.03 PCT patents, applications/million pop. ..............24 ....... 51.0 7.04 Business-to-business Internet use* ..................101 ......... 4.5 7.05 Business-to-consumer Internet use* ..................83 ......... 4.4 7.06 Extent of staff training* .....................................123 ......... 3.2
8th pillar: Government usage 8.01 Importance of ICTs to gov’t vision* ...................118 ......... 3.2 8.02 Government Online Service Index, 0–1 (best) .....48 ....... 0.58 8.03 Gov’t success in ICT promotion* ......................130 ......... 3.2
9th pillar: Economic impacts 9.01 Impact of ICTs on new services and products* ..90 ......... 4.1 9.02 ICT PCT patents, applications/million pop. .......24 ......... 8.7 9.03 Impact of ICTs on new organizational models* .100 ......... 3.7 9.04 Knowledge-intensive jobs, % workforce .............22 ....... 39.6
10th pillar: Social impacts 10.01 Impact of ICTs on access to basic services* ......83 ......... 4.0 10.02 Internet access in schools* ................................86 ......... 3.8 10.03 ICT use & gov’t efficiency* .................................92 ......... 3.9 10.04 E-Participation Index, 0–1 (best).........................54 ....... 0.26
Rank Score (out of 144) (1–7)
Networked Readiness Index 2013 ..............50 ..4.2Networked Readiness Index 2012 (out of 142) ...................... 48 .....4.2
A. Environment subindex ..............................................83 ....3.81st pillar: Political and regulatory environment ................... 95 .....3.42nd pillar: Business and innovation environment ............... 69 .....4.2
B. Readiness subindex .................................................38 ....5.23rd pillar: Infrastructure and digital content ........................ 40 .....4.94th pillar: Affordability ........................................................ 49 .....5.65th pillar: Skills ................................................................... 45 .....5.2
C. Usage subindex ........................................................45 ....4.16th pillar: Individual usage .................................................. 34 .....4.97th pillar: Business usage .................................................. 46 .....3.78th pillar: Government usage ........................................... 108 .....3.6
D. Impact subindex .......................................................60 ....3.69th pillar: Economic impacts .............................................. 37 .....3.710th pillar: Social impacts .................................................. 80 .....3.6
Italy3: Country/Economy Profiles
The Global Information Technology Report 2013 | 203
Note: Indicators followed by an asterisk (*) are measured on a 1-to-7 (best) scale. For further details and explanation, please refer to the section “How to Read the Country/Economy Profiles” on page 139.
Italy High-income group average
1. Political and regulatory environment
6. Individual usage
5. Skills7. Business usage
4. Affordability8. Governmentusage
3. Infrastructure anddigital content
9. Economicimpacts
2. Business and innovation environment
10. Socialimpacts
1
2
3
4
5
6
7
@ 2013 World Economic Forum

The Networked Readiness Index in detailINDICATOR RANK /144 VALUE
1st pillar: Political and regulatory environment1.01 Effectiveness of law-making bodies* ..................71 ......... 3.51.02 Laws relating to ICTs* ........................................82 ......... 3.71.03 Judicial independence* ......................................46 ......... 4.41.04 Efficiency of legal system in settling disputes* ....79 ......... 3.61.05 Efficiency of legal system in challenging regs* ....90 ......... 3.31.06 Intellectual property protection* ..........................79 ......... 3.41.07 Software piracy rate, % software installed .........n/a ......... n/a1.08 No. procedures to enforce a contract ................48 .......... 351.09 No. days to enforce a contract ........................104 ........ 655
2nd pillar: Business and innovation environment2.01 Availability of latest technologies* .......................44 ......... 5.52.02 Venture capital availability* ...............................130 ......... 1.92.03 Total tax rate, % profits ....................................102 ....... 45.62.04 No. days to start a business ..............................25 ............ 72.05 No. procedures to start a business ....................48 ............ 62.06 Intensity of local competition* .............................65 ......... 4.92.07 Tertiary education gross enrollment rate, % ........81 ....... 26.02.08 Quality of management schools* ........................77 ......... 4.12.09 Gov’t procurement of advanced tech* .............120 ......... 3.0
3rd pillar: Infrastructure and digital content3.01 Electricity production, kWh/capita ......................81 .. 2,052.63.02 Mobile network coverage, % pop ......................90 ....... 95.03.03 Int’l Internet bandwidth, kb/s per user................46 ....... 29.53.04 Secure Internet servers/million pop ....................61 ....... 48.43.05 Accessibility of digital content* ...........................59 ......... 5.2
4th pillar: Affordability4.01 Mobile cellular tariffs, PPP $/min. .......................61 ....... 0.264.02 Fixed broadband Internet tariffs, PPP $/month ..98 ..... 42.654.03 Internet & telephony competition, 0–2 (best) ......59 ....... 1.93
5th pillar: Skills5.01 Quality of educational system* ...........................76 ......... 3.65.02 Quality of math & science education* ...............116 ......... 3.05.03 Secondary education gross enrollment rate, % ..58 ....... 92.75.04 Adult literacy rate, % ..........................................99 ....... 86.6
INDICATOR RANK /144 VALUE
6th pillar: Individual usage 6.01 Mobile phone subscriptions/100 pop. ................68 ..... 108.1 6.02 Individuals using Internet, %...............................87 ....... 31.5 6.03 Households w/ personal computer, % ...............84 ....... 22.7 6.04 Households w/ Internet access, % ....................84 ....... 14.0 6.05 Broadband Internet subscriptions/100 pop. .......84 ......... 3.9 6.06 Mobile broadband subscriptions/100 pop. .......104 ......... 1.5 6.07 Use of virtual social networks* ...........................55 ......... 5.7
7th pillar: Business usage 7.01 Firm-level technology absorption* ......................67 ......... 4.8 7.02 Capacity for innovation* .....................................85 ......... 2.9 7.03 PCT patents, applications/million pop. ..............73 ......... 0.6 7.04 Business-to-business Internet use* ....................77 ......... 4.9 7.05 Business-to-consumer Internet use* ................104 ......... 3.9 7.06 Extent of staff training* .......................................58 ......... 4.1
8th pillar: Government usage 8.01 Importance of ICTs to gov’t vision* .....................74 ......... 3.9 8.02 Government Online Service Index, 0–1 (best) ...112 ....... 0.31 8.03 Gov’t success in ICT promotion* ........................66 ......... 4.5
9th pillar: Economic impacts 9.01 Impact of ICTs on new services and products* ..83 ......... 4.2 9.02 ICT PCT patents, applications/million pop. .......95 ......... 0.0 9.03 Impact of ICTs on new organizational models* ...64 ......... 4.2 9.04 Knowledge-intensive jobs, % workforce .............71 ....... 20.1
10th pillar: Social impacts 10.01 Impact of ICTs on access to basic services* ......76 ......... 4.1 10.02 Internet access in schools* ................................74 ......... 4.1 10.03 ICT use & gov’t efficiency* .................................66 ......... 4.3 10.04 E-Participation Index, 0–1 (best).......................124 ....... 0.00
Rank Score (out of 144) (1–7)
Networked Readiness Index 2013 ..............85 ..3.7Networked Readiness Index 2012 (out of 142) ...................... 74 .....3.9
A. Environment subindex ..............................................67 ....3.91st pillar: Political and regulatory environment ................... 59 .....3.92nd pillar: Business and innovation environment ............... 82 .....4.0
B. Readiness subindex .................................................77 ....4.53rd pillar: Infrastructure and digital content ........................ 65 .....4.14th pillar: Affordability ........................................................ 87 .....4.85th pillar: Skills ................................................................... 88 .....4.5
C. Usage subindex ........................................................89 ....3.36th pillar: Individual usage .................................................. 86 .....2.97th pillar: Business usage .................................................. 86 .....3.38th pillar: Government usage ............................................. 97 .....3.8
D. Impact subindex .......................................................91 ....3.29th pillar: Economic impacts .............................................. 81 .....3.110th pillar: Social impacts .................................................. 92 .....3.4
Jamaica3: Country/Economy Profiles
204 | The Global Information Technology Report 2013
Note: Indicators followed by an asterisk (*) are measured on a 1-to-7 (best) scale. For further details and explanation, please refer to the section “How to Read the Country/Economy Profiles” on page 139.
Jamaica Upper-middle-income group average
1. Political and regulatory environment
6. Individual usage
5. Skills7. Business usage
4. Affordability8. Governmentusage
3. Infrastructure anddigital content
9. Economicimpacts
2. Business and innovation environment
10. Socialimpacts
1
2
3
4
5
6
7
@ 2013 World Economic Forum

The Networked Readiness Index in detailINDICATOR RANK /144 VALUE
1st pillar: Political and regulatory environment1.01 Effectiveness of law-making bodies* ..................54 ......... 3.91.02 Laws relating to ICTs* ........................................42 ......... 4.51.03 Judicial independence* ......................................17 ......... 5.81.04 Efficiency of legal system in settling disputes* ....36 ......... 4.51.05 Efficiency of legal system in challenging regs* ....48 ......... 4.01.06 Intellectual property protection* ..........................18 ......... 5.41.07 Software piracy rate, % software installed ............3 .......... 211.08 No. procedures to enforce a contract ................18 .......... 301.09 No. days to enforce a contract ..........................18 ........ 360
2nd pillar: Business and innovation environment2.01 Availability of latest technologies* .......................11 ......... 6.32.02 Venture capital availability* .................................42 ......... 3.02.03 Total tax rate, % profits ....................................112 ....... 50.02.04 No. days to start a business ..............................94 .......... 232.05 No. procedures to start a business ....................88 ............ 82.06 Intensity of local competition* ...............................2 ......... 6.02.07 Tertiary education gross enrollment rate, % ........39 ....... 59.72.08 Quality of management schools* ........................80 ......... 4.12.09 Gov’t procurement of advanced tech* ...............48 ......... 3.8
3rd pillar: Infrastructure and digital content3.01 Electricity production, kWh/capita ......................21 .. 8,405.83.02 Mobile network coverage, % pop ......................28 ....... 99.93.03 Int’l Internet bandwidth, kb/s per user................56 ....... 23.13.04 Secure Internet servers/million pop ....................21 ..... 743.93.05 Accessibility of digital content* ...........................13 ......... 6.3
4th pillar: Affordability4.01 Mobile cellular tariffs, PPP $/min. .....................136 ....... 0.844.02 Fixed broadband Internet tariffs, PPP $/month ..21 ..... 19.864.03 Internet & telephony competition, 0–2 (best) ........1 ....... 2.00
5th pillar: Skills5.01 Quality of educational system* ...........................43 ......... 4.2
5.02 Quality of math & science education* .................27 ......... 4.8 5.03 Secondary education gross enrollment rate, % ..25 ..... 102.2 5.04 Adult literacy rate, % ..........................................15 ....... 99.0
INDICATOR RANK /144 VALUE
6th pillar: Individual usage 6.01 Mobile phone subscriptions/100 pop. ................74 ..... 105.0 6.02 Individuals using Internet, %...............................17 ....... 79.5 6.03 Households w/ personal computer, % ...............17 ....... 83.4 6.04 Households w/ Internet access, % ....................15 ....... 81.3 6.05 Broadband Internet subscriptions/100 pop. .......17 ....... 27.6 6.06 Mobile broadband subscriptions/100 pop. ...........3 ..... 101.3 6.07 Use of virtual social networks* ...........................74 ......... 5.4
7th pillar: Business usage 7.01 Firm-level technology absorption* ........................4 ......... 6.2 7.02 Capacity for innovation* .......................................1 ......... 5.9 7.03 PCT patents, applications/million pop. ................4 ..... 251.1 7.04 Business-to-business Internet use* ......................7 ......... 6.0 7.05 Business-to-consumer Internet use* ....................7 ......... 5.9 7.06 Extent of staff training* .........................................5 ......... 5.3
8th pillar: Government usage 8.01 Importance of ICTs to gov’t vision* .....................46 ......... 4.3 8.02 Government Online Service Index, 0–1 (best) .......9 ....... 0.86 8.03 Gov’t success in ICT promotion* ........................68 ......... 4.4
9th pillar: Economic impacts 9.01 Impact of ICTs on new services and products* ..27 ......... 5.1 9.02 ICT PCT patents, applications/million pop. .........2 ..... 106.7 9.03 Impact of ICTs on new organizational models* ...50 ......... 4.4 9.04 Knowledge-intensive jobs, % workforce .............26 ....... 37.8
10th pillar: Social impacts 10.01 Impact of ICTs on access to basic services* ......42 ......... 4.8 10.02 Internet access in schools* ................................43 ......... 4.9 10.03 ICT use & gov’t efficiency* .................................58 ......... 4.4 10.04 E-Participation Index, 0–1 (best).........................11 ....... 0.74
Rank Score (out of 144) (1–7)
Networked Readiness Index 2013 ..............21 ..5.2Networked Readiness Index 2012 (out of 142) ...................... 18 .....5.3
A. Environment subindex ..............................................26 ....4.91st pillar: Political and regulatory environment ................... 19 .....5.02nd pillar: Business and innovation environment ............... 37 .....4.7
B. Readiness subindex .................................................28 ....5.43rd pillar: Infrastructure and digital content ........................ 24 .....5.84th pillar: Affordability ........................................................ 92 .....4.55th pillar: Skills ................................................................... 13 .....5.7
C. Usage subindex ..........................................................9 ....5.66th pillar: Individual usage .................................................. 13 .....5.97th pillar: Business usage .................................................... 2 .....6.08th pillar: Government usage ............................................. 27 .....5.0
D. Impact subindex .......................................................17 ....5.19th pillar: Economic impacts ................................................ 8 .....5.410th pillar: Social impacts .................................................. 31 .....4.9
Japan3: Country/Economy Profiles
The Global Information Technology Report 2013 | 205
Note: Indicators followed by an asterisk (*) are measured on a 1-to-7 (best) scale. For further details and explanation, please refer to the section “How to Read the Country/Economy Profiles” on page 139.
Japan High-income group average
1. Political and regulatory environment
6. Individual usage
5. Skills7. Business usage
4. Affordability8. Governmentusage
3. Infrastructure anddigital content
9. Economicimpacts
2. Business and innovation environment
10. Socialimpacts
1
2
3
4
5
6
7
@ 2013 World Economic Forum

The Networked Readiness Index in detailINDICATOR RANK /144 VALUE
1st pillar: Political and regulatory environment1.01 Effectiveness of law-making bodies* ..................84 ......... 3.31.02 Laws relating to ICTs* ........................................53 ......... 4.31.03 Judicial independence* ......................................48 ......... 4.41.04 Efficiency of legal system in settling disputes* ....43 ......... 4.21.05 Efficiency of legal system in challenging regs* ....44 ......... 4.01.06 Intellectual property protection* ..........................39 ......... 4.51.07 Software piracy rate, % software installed ..........50 .......... 581.08 No. procedures to enforce a contract ................78 .......... 381.09 No. days to enforce a contract ........................107 ........ 689
2nd pillar: Business and innovation environment2.01 Availability of latest technologies* .......................38 ......... 5.72.02 Venture capital availability* .................................48 ......... 2.92.03 Total tax rate, % profits ......................................30 ....... 28.12.04 No. days to start a business ..............................56 .......... 122.05 No. procedures to start a business ....................74 ............ 72.06 Intensity of local competition* .............................31 ......... 5.42.07 Tertiary education gross enrollment rate, % ........69 ....... 37.72.08 Quality of management schools* ........................55 ......... 4.32.09 Gov’t procurement of advanced tech* ...............69 ......... 3.6
3rd pillar: Infrastructure and digital content3.01 Electricity production, kWh/capita ......................74 .. 2,412.83.02 Mobile network coverage, % pop ......................51 ....... 99.03.03 Int’l Internet bandwidth, kb/s per user................97 ......... 6.33.04 Secure Internet servers/million pop ....................71 ....... 25.23.05 Accessibility of digital content* ...........................48 ......... 5.4
4th pillar: Affordability4.01 Mobile cellular tariffs, PPP $/min. .......................29 ....... 0.154.02 Fixed broadband Internet tariffs, PPP $/month ..53 ..... 29.184.03 Internet & telephony competition, 0–2 (best) ......58 ....... 1.94
5th pillar: Skills5.01 Quality of educational system* ...........................31 ......... 4.45.02 Quality of math & science education* .................28 ......... 4.75.03 Secondary education gross enrollment rate, % ..81 ....... 86.95.04 Adult literacy rate, % ..........................................75 ....... 92.6
INDICATOR RANK /144 VALUE
6th pillar: Individual usage 6.01 Mobile phone subscriptions/100 pop. ................47 ..... 118.2 6.02 Individuals using Internet, %...............................82 ....... 34.9 6.03 Households w/ personal computer, % ...............57 ....... 50.8 6.04 Households w/ Internet access, % ....................61 ....... 35.4 6.05 Broadband Internet subscriptions/100 pop. .......87 ......... 3.2 6.06 Mobile broadband subscriptions/100 pop. .........84 ......... 4.9 6.07 Use of virtual social networks* ...........................36 ......... 5.9
7th pillar: Business usage 7.01 Firm-level technology absorption* ......................28 ......... 5.6 7.02 Capacity for innovation* .....................................57 ......... 3.3 7.03 PCT patents, applications/million pop. ..............84 ......... 0.2 7.04 Business-to-business Internet use* ....................50 ......... 5.3 7.05 Business-to-consumer Internet use* ..................42 ......... 4.9 7.06 Extent of staff training* .......................................88 ......... 3.8
8th pillar: Government usage 8.01 Importance of ICTs to gov’t vision* .....................43 ......... 4.4 8.02 Government Online Service Index, 0–1 (best) .....92 ....... 0.39 8.03 Gov’t success in ICT promotion* ........................34 ......... 4.9
9th pillar: Economic impacts 9.01 Impact of ICTs on new services and products* ..47 ......... 4.8 9.02 ICT PCT patents, applications/million pop. .......68 ......... 0.2 9.03 Impact of ICTs on new organizational models* ...46 ......... 4.5 9.04 Knowledge-intensive jobs, % workforce ............n/a ......... n/a
10th pillar: Social impacts 10.01 Impact of ICTs on access to basic services* ......48 ......... 4.7 10.02 Internet access in schools* ................................44 ......... 4.9 10.03 ICT use & gov’t efficiency* .................................37 ......... 4.7 10.04 E-Participation Index, 0–1 (best).........................91 ....... 0.11
Rank Score (out of 144) (1–7)
Networked Readiness Index 2013 ..............47 ..4.2Networked Readiness Index 2012 (out of 142) ...................... 47 .....4.2
A. Environment subindex ..............................................42 ....4.31st pillar: Political and regulatory environment ................... 48 .....4.02nd pillar: Business and innovation environment ............... 40 .....4.6
B. Readiness subindex .................................................55 ....5.03rd pillar: Infrastructure and digital content ........................ 81 .....3.64th pillar: Affordability ........................................................ 27 .....6.05th pillar: Skills ................................................................... 34 .....5.3
C. Usage subindex ........................................................60 ....3.86th pillar: Individual usage .................................................. 66 .....3.67th pillar: Business usage .................................................. 55 .....3.68th pillar: Government usage ............................................. 56 .....4.2
D. Impact subindex .......................................................54 ....3.79th pillar: Economic impacts .............................................. 49 .....3.410th pillar: Social impacts .................................................. 54 .....4.0
Jordan3: Country/Economy Profiles
206 | The Global Information Technology Report 2013
Note: Indicators followed by an asterisk (*) are measured on a 1-to-7 (best) scale. For further details and explanation, please refer to the section “How to Read the Country/Economy Profiles” on page 139.
Jordan Upper-middle-income group average
1. Political and regulatory environment
6. Individual usage
5. Skills7. Business usage
4. Affordability8. Governmentusage
3. Infrastructure anddigital content
9. Economicimpacts
2. Business and innovation environment
10. Socialimpacts
1
2
3
4
5
6
7
@ 2013 World Economic Forum

The Networked Readiness Index in detailINDICATOR RANK /144 VALUE
1st pillar: Political and regulatory environment1.01 Effectiveness of law-making bodies* ..................44 ......... 4.01.02 Laws relating to ICTs* ........................................69 ......... 4.01.03 Judicial independence* ......................................94 ......... 3.21.04 Efficiency of legal system in settling disputes* ....67 ......... 3.81.05 Efficiency of legal system in challenging regs* ....76 ......... 3.51.06 Intellectual property protection* ..........................92 ......... 3.21.07 Software piracy rate, % software installed ..........77 .......... 761.08 No. procedures to enforce a contract ................68 .......... 371.09 No. days to enforce a contract ..........................20 ........ 370
2nd pillar: Business and innovation environment2.01 Availability of latest technologies* .......................90 ......... 4.62.02 Venture capital availability* ...............................105 ......... 2.22.03 Total tax rate, % profits ......................................33 ....... 28.62.04 No. days to start a business ..............................81 .......... 192.05 No. procedures to start a business ....................48 ............ 62.06 Intensity of local competition* ...........................113 ......... 4.12.07 Tertiary education gross enrollment rate, % ........58 ....... 43.22.08 Quality of management schools* ......................103 ......... 3.72.09 Gov’t procurement of advanced tech* ...............71 ......... 3.6
3rd pillar: Infrastructure and digital content3.01 Electricity production, kWh/capita ......................47 .. 4,890.83.02 Mobile network coverage, % pop ......................90 ....... 95.03.03 Int’l Internet bandwidth, kb/s per user................60 ....... 21.93.04 Secure Internet servers/million pop ....................98 ......... 6.33.05 Accessibility of digital content* ...........................67 ......... 5.1
4th pillar: Affordability4.01 Mobile cellular tariffs, PPP $/min. .......................42 ....... 0.194.02 Fixed broadband Internet tariffs, PPP $/month ..47 ..... 28.004.03 Internet & telephony competition, 0–2 (best) ......79 ....... 1.81
5th pillar: Skills5.01 Quality of educational system* .........................101 ......... 3.25.02 Quality of math & science education* .................81 ......... 3.85.03 Secondary education gross enrollment rate, % ..27 ..... 101.95.04 Adult literacy rate, % ............................................7 ....... 99.7
INDICATOR RANK /144 VALUE
6th pillar: Individual usage 6.01 Mobile phone subscriptions/100 pop. ................11 ..... 155.7 6.02 Individuals using Internet, %...............................62 ....... 45.0 6.03 Households w/ personal computer, % ...............63 ....... 46.0 6.04 Households w/ Internet access, % ....................55 ....... 44.0 6.05 Broadband Internet subscriptions/100 pop. .......68 ......... 7.4 6.06 Mobile broadband subscriptions/100 pop. .........29 ....... 38.4 6.07 Use of virtual social networks* .........................115 ......... 4.8
7th pillar: Business usage 7.01 Firm-level technology absorption* ......................91 ......... 4.5 7.02 Capacity for innovation* .....................................92 ......... 2.9 7.03 PCT patents, applications/million pop. ..............65 ......... 1.2 7.04 Business-to-business Internet use* ....................63 ......... 5.0 7.05 Business-to-consumer Internet use* ..................62 ......... 4.7 7.06 Extent of staff training* .......................................72 ......... 3.9
8th pillar: Government usage 8.01 Importance of ICTs to gov’t vision* .....................35 ......... 4.5 8.02 Government Online Service Index, 0–1 (best) .....21 ....... 0.78 8.03 Gov’t success in ICT promotion* ........................17 ......... 5.2
9th pillar: Economic impacts 9.01 Impact of ICTs on new services and products* ..92 ......... 4.1 9.02 ICT PCT patents, applications/million pop. .......59 ......... 0.3 9.03 Impact of ICTs on new organizational models* ...70 ......... 4.2 9.04 Knowledge-intensive jobs, % workforce .............48 ....... 28.3
10th pillar: Social impacts 10.01 Impact of ICTs on access to basic services* ......52 ......... 4.6 10.02 Internet access in schools* ................................67 ......... 4.3 10.03 ICT use & gov’t efficiency* .................................35 ......... 4.8 10.04 E-Participation Index, 0–1 (best)...........................3 ....... 0.95
Rank Score (out of 144) (1–7)
Networked Readiness Index 2013 ..............43 ..4.3Networked Readiness Index 2012 (out of 142) ...................... 55 .....4.0
A. Environment subindex ..............................................66 ....3.91st pillar: Political and regulatory environment ................... 77 .....3.62nd pillar: Business and innovation environment ............... 64 .....4.2
B. Readiness subindex .................................................50 ....5.03rd pillar: Infrastructure and digital content ........................ 63 .....4.14th pillar: Affordability ........................................................ 36 .....5.95th pillar: Skills ................................................................... 62 .....4.9
C. Usage subindex ........................................................42 ....4.26th pillar: Individual usage .................................................. 54 .....4.17th pillar: Business usage .................................................. 85 .....3.38th pillar: Government usage ............................................. 23 .....5.1
D. Impact subindex .......................................................37 ....4.29th pillar: Economic impacts .............................................. 66 .....3.310th pillar: Social impacts .................................................. 23 .....5.1
Kazakhstan3: Country/Economy Profiles
The Global Information Technology Report 2013 | 207
Note: Indicators followed by an asterisk (*) are measured on a 1-to-7 (best) scale. For further details and explanation, please refer to the section “How to Read the Country/Economy Profiles” on page 139.
Kazakhstan Upper-middle-income group average
1. Political and regulatory environment
6. Individual usage
5. Skills7. Business usage
4. Affordability8. Governmentusage
3. Infrastructure anddigital content
9. Economicimpacts
2. Business and innovation environment
10. Socialimpacts
1
2
3
4
5
6
7
@ 2013 World Economic Forum

The Networked Readiness Index in detailINDICATOR RANK /144 VALUE
1st pillar: Political and regulatory environment1.01 Effectiveness of law-making bodies* ..................61 ......... 3.71.02 Laws relating to ICTs* ........................................60 ......... 4.11.03 Judicial independence* ......................................85 ......... 3.41.04 Efficiency of legal system in settling disputes* ....72 ......... 3.71.05 Efficiency of legal system in challenging regs* ....69 ......... 3.61.06 Intellectual property protection* ..........................96 ......... 3.11.07 Software piracy rate, % software installed ..........80 .......... 781.08 No. procedures to enforce a contract ..............124 .......... 441.09 No. days to enforce a contract ..........................55 ........ 465
2nd pillar: Business and innovation environment2.01 Availability of latest technologies* .......................74 ......... 4.92.02 Venture capital availability* .................................32 ......... 3.22.03 Total tax rate, % profits ......................................98 ....... 44.42.04 No. days to start a business ............................108 .......... 322.05 No. procedures to start a business ..................114 .......... 102.06 Intensity of local competition* .............................63 ......... 4.92.07 Tertiary education gross enrollment rate, % ......131 ......... 4.02.08 Quality of management schools* ........................56 ......... 4.32.09 Gov’t procurement of advanced tech* ...............76 ......... 3.5
3rd pillar: Infrastructure and digital content3.01 Electricity production, kWh/capita ....................122 ..... 174.23.02 Mobile network coverage, % pop ....................105 ....... 89.13.03 Int’l Internet bandwidth, kb/s per user..............110 ......... 4.53.04 Secure Internet servers/million pop ..................104 ......... 3.23.05 Accessibility of digital content* ...........................88 ......... 4.7
4th pillar: Affordability4.01 Mobile cellular tariffs, PPP $/min. .......................20 ....... 0.114.02 Fixed broadband Internet tariffs, PPP $/month 116 ..... 71.604.03 Internet & telephony competition, 0–2 (best) ........1 ....... 2.00
5th pillar: Skills5.01 Quality of educational system* ...........................37 ......... 4.35.02 Quality of math & science education* .................76 ......... 3.95.03 Secondary education gross enrollment rate, % 109 ....... 60.25.04 Adult literacy rate, % ..........................................97 ....... 87.4
INDICATOR RANK /144 VALUE
6th pillar: Individual usage 6.01 Mobile phone subscriptions/100 pop. ..............120 ....... 67.5 6.02 Individuals using Internet, %...............................93 ....... 28.0 6.03 Households w/ personal computer, % .............122 ......... 4.1 6.04 Households w/ Internet access, % ..................119 ......... 2.2 6.05 Broadband Internet subscriptions/100 pop. .....123 ......... 0.1 6.06 Mobile broadband subscriptions/100 pop. .......116 ......... 0.3 6.07 Use of virtual social networks* ...........................89 ......... 5.2
7th pillar: Business usage 7.01 Firm-level technology absorption* ......................58 ......... 4.9 7.02 Capacity for innovation* .....................................46 ......... 3.5 7.03 PCT patents, applications/million pop. ..............93 ......... 0.1 7.04 Business-to-business Internet use* ....................76 ......... 4.9 7.05 Business-to-consumer Internet use* ..................72 ......... 4.5 7.06 Extent of staff training* .......................................70 ......... 3.9
8th pillar: Government usage 8.01 Importance of ICTs to gov’t vision* .....................28 ......... 4.7 8.02 Government Online Service Index, 0–1 (best) .....85 ....... 0.43 8.03 Gov’t success in ICT promotion* ........................30 ......... 5.0
9th pillar: Economic impacts 9.01 Impact of ICTs on new services and products* ..46 ......... 4.8 9.02 ICT PCT patents, applications/million pop. .......89 ......... 0.0 9.03 Impact of ICTs on new organizational models* ...38 ......... 4.6 9.04 Knowledge-intensive jobs, % workforce ............n/a ......... n/a
10th pillar: Social impacts 10.01 Impact of ICTs on access to basic services* ......59 ......... 4.4 10.02 Internet access in schools* ................................85 ......... 3.8 10.03 ICT use & gov’t efficiency* .................................55 ......... 4.4 10.04 E-Participation Index, 0–1 (best).......................106 ....... 0.05
Rank Score (out of 144) (1–7)
Networked Readiness Index 2013 ..............92 ..3.5Networked Readiness Index 2012 (out of 142) ...................... 93 .....3.5
A. Environment subindex ..............................................98 ....3.61st pillar: Political and regulatory environment ................... 87 .....3.52nd pillar: Business and innovation environment ............. 106 .....3.8
B. Readiness subindex ...............................................110 ....3.73rd pillar: Infrastructure and digital content ...................... 110 .....2.84th pillar: Affordability ...................................................... 105 .....3.85th pillar: Skills ................................................................... 93 .....4.4
C. Usage subindex ........................................................84 ....3.46th pillar: Individual usage ................................................ 115 .....2.17th pillar: Business usage .................................................. 53 .....3.68th pillar: Government usage ............................................. 44 .....4.4
D. Impact subindex .......................................................71 ....3.59th pillar: Economic impacts .............................................. 47 .....3.510th pillar: Social impacts .................................................. 84 .....3.5
Kenya3: Country/Economy Profiles
208 | The Global Information Technology Report 2013
Note: Indicators followed by an asterisk (*) are measured on a 1-to-7 (best) scale. For further details and explanation, please refer to the section “How to Read the Country/Economy Profiles” on page 139.
Kenya Low-income group average
1. Political and regulatory environment
6. Individual usage
5. Skills7. Business usage
4. Affordability8. Governmentusage
3. Infrastructure anddigital content
9. Economicimpacts
2. Business and innovation environment
10. Socialimpacts
1
2
3
4
5
6
7
@ 2013 World Economic Forum

The Networked Readiness Index in detailINDICATOR RANK /144 VALUE
1st pillar: Political and regulatory environment1.01 Effectiveness of law-making bodies* ................118 ......... 2.81.02 Laws relating to ICTs* ........................................15 ......... 5.41.03 Judicial independence* ......................................74 ......... 3.71.04 Efficiency of legal system in settling disputes* ....80 ......... 3.61.05 Efficiency of legal system in challenging regs* ....96 ......... 3.21.06 Intellectual property protection* ..........................40 ......... 4.31.07 Software piracy rate, % software installed ..........25 .......... 401.08 No. procedures to enforce a contract ................36 .......... 331.09 No. days to enforce a contract ............................3 ........ 230
2nd pillar: Business and innovation environment2.01 Availability of latest technologies* .......................26 ......... 6.12.02 Venture capital availability* ...............................110 ......... 2.22.03 Total tax rate, % profits ......................................36 ....... 29.82.04 No. days to start a business ..............................25 ............ 72.05 No. procedures to start a business ....................30 ............ 52.06 Intensity of local competition* .............................11 ......... 5.7
2.07 Tertiary education gross enrollment rate, % ..........1 ..... 103.1 2.08 Quality of management schools* ........................42 ......... 4.72.09 Gov’t procurement of advanced tech* ...............33 ......... 4.0
3rd pillar: Infrastructure and digital content3.01 Electricity production, kWh/capita ......................13 .. 9,675.03.02 Mobile network coverage, % pop ......................28 ....... 99.93.03 Int’l Internet bandwidth, kb/s per user................70 ....... 17.23.04 Secure Internet servers/million pop ......................3 .. 2,496.13.05 Accessibility of digital content* ...........................10 ......... 6.3
4th pillar: Affordability 4.01 Mobile cellular tariffs, PPP $/min. .......................82 ....... 0.334.02 Fixed broadband Internet tariffs, PPP $/month ..81 ..... 36.524.03 Internet & telephony competition, 0–2 (best) ......85 ....... 1.76
5th pillar: Skills5.01 Quality of educational system* ...........................44 ......... 4.1
5.02 Quality of math & science education* ...................8 ......... 5.5 5.03 Secondary education gross enrollment rate, % ..46 ....... 97.15.04 Adult literacy rate, % ..........................................15 ....... 99.0
INDICATOR RANK /144 VALUE
6th pillar: Individual usage 6.01 Mobile phone subscriptions/100 pop. ................65 ..... 108.5 6.02 Individuals using Internet, %...............................11 ....... 83.8 6.03 Households w/ personal computer, % ...............19 ....... 81.9 6.04 Households w/ Internet access, % ......................1 ....... 97.2 6.05 Broadband Internet subscriptions/100 pop. .........4 ....... 36.9 6.06 Mobile broadband subscriptions/100 pop. ...........2 ..... 105.1 6.07 Use of virtual social networks* ...........................33 ......... 6.0
7th pillar: Business usage 7.01 Firm-level technology absorption* ......................11 ......... 6.0 7.02 Capacity for innovation* .....................................19 ......... 4.5 7.03 PCT patents, applications/million pop. ................9 ..... 172.1 7.04 Business-to-business Internet use* ....................19 ......... 5.9 7.05 Business-to-consumer Internet use* ....................2 ......... 6.3 7.06 Extent of staff training* .......................................42 ......... 4.3
8th pillar: Government usage 8.01 Importance of ICTs to gov’t vision* .....................13 ......... 5.2 8.02 Government Online Service Index, 0–1 (best) .......1 ....... 1.00 8.03 Gov’t success in ICT promotion* ........................11 ......... 5.5
9th pillar: Economic impacts 9.01 Impact of ICTs on new services and products* ....3 ......... 5.8 9.02 ICT PCT patents, applications/million pop. .........5 ....... 73.5 9.03 Impact of ICTs on new organizational models* ...23 ......... 5.0 9.04 Knowledge-intensive jobs, % workforce .............61 ....... 22.4
10th pillar: Social impacts 10.01 Impact of ICTs on access to basic services* ........7 ......... 5.9 10.02 Internet access in schools* ..................................7 ......... 6.2 10.03 ICT use & gov’t efficiency* ...................................5 ......... 5.7 10.04 E-Participation Index, 0–1 (best)...........................1 ....... 1.00
Rank Score (out of 144) (1–7)
Networked Readiness Index 2013 ..............11 ..5.5Networked Readiness Index 2012 (out of 142) ...................... 12 .....5.5
A. Environment subindex ..............................................32 ....4.71st pillar: Political and regulatory environment ................... 42 .....4.32nd pillar: Business and innovation environment ............... 23 .....5.1
B. Readiness subindex .................................................23 ....5.63rd pillar: Infrastructure and digital content ........................ 20 .....6.14th pillar: Affordability ........................................................ 83 .....4.95th pillar: Skills ................................................................... 14 .....5.7
C. Usage subindex ..........................................................4 ....5.96th pillar: Individual usage .................................................... 7 .....6.47th pillar: Business usage .................................................. 11 .....5.38th pillar: Government usage ............................................... 3 .....5.9
D. Impact subindex .........................................................5 ....5.79th pillar: Economic impacts .............................................. 12 .....5.210th pillar: Social impacts .................................................... 2 .....6.2
Korea, Rep.3: Country/Economy Profiles
The Global Information Technology Report 2013 | 209
Note: Indicators followed by an asterisk (*) are measured on a 1-to-7 (best) scale. For further details and explanation, please refer to the section “How to Read the Country/Economy Profiles” on page 139.
Korea, Rep. High-income group average
1. Political and regulatory environment
6. Individual usage
5. Skills7. Business usage
4. Affordability8. Governmentusage
3. Infrastructure anddigital content
9. Economicimpacts
2. Business and innovation environment
10. Socialimpacts
1
2
3
4
5
6
7
@ 2013 World Economic Forum

The Networked Readiness Index in detailINDICATOR RANK /144 VALUE
1st pillar: Political and regulatory environment1.01 Effectiveness of law-making bodies* ..................83 ......... 3.31.02 Laws relating to ICTs* ......................................128 ......... 2.91.03 Judicial independence* ......................................36 ......... 4.91.04 Efficiency of legal system in settling disputes* ....57 ......... 4.01.05 Efficiency of legal system in challenging regs* ....67 ......... 3.71.06 Intellectual property protection* ..........................46 ......... 4.01.07 Software piracy rate, % software installed ..........52 .......... 591.08 No. procedures to enforce a contract ..............141 .......... 501.09 No. days to enforce a contract ..........................80 ........ 566
2nd pillar: Business and innovation environment2.01 Availability of latest technologies* .......................66 ......... 5.02.02 Venture capital availability* .................................41 ......... 3.02.03 Total tax rate, % profits ........................................2 ....... 10.72.04 No. days to start a business ............................108 .......... 322.05 No. procedures to start a business ..................126 .......... 122.06 Intensity of local competition* .............................81 ......... 4.72.07 Tertiary education gross enrollment rate, % ........88 ....... 21.92.08 Quality of management schools* ......................102 ......... 3.72.09 Gov’t procurement of advanced tech* .............123 ......... 2.9
3rd pillar: Infrastructure and digital content3.01 Electricity production, kWh/capita ........................3 20,109.73.02 Mobile network coverage, % pop ........................1 ..... 100.03.03 Int’l Internet bandwidth, kb/s per user..............102 ......... 6.03.04 Secure Internet servers/million pop ....................41 ..... 179.23.05 Accessibility of digital content* ...........................54 ......... 5.3
4th pillar: Affordability4.01 Mobile cellular tariffs, PPP $/min. .......................24 ....... 0.144.02 Fixed broadband Internet tariffs, PPP $/month ..28 ..... 21.334.03 Internet & telephony competition, 0–2 (best) ....138 ....... 0.23
5th pillar: Skills5.01 Quality of educational system* .........................104 ......... 3.15.02 Quality of math & science education* ...............104 ......... 3.45.03 Secondary education gross enrollment rate, % ..32 ..... 101.05.04 Adult literacy rate, % ..........................................67 ....... 93.9
INDICATOR RANK /144 VALUE
6th pillar: Individual usage 6.01 Mobile phone subscriptions/100 pop. ..................7 ..... 175.1 6.02 Individuals using Internet, %...............................26 ....... 74.2 6.03 Households w/ personal computer, % ...............38 ....... 69.0 6.04 Households w/ Internet access, % ....................44 ....... 57.7 6.05 Broadband Internet subscriptions/100 pop. .......98 ......... 1.7 6.06 Mobile broadband subscriptions/100 pop. ........n/a ......... n/a 6.07 Use of virtual social networks* ...........................54 ......... 5.7
7th pillar: Business usage 7.01 Firm-level technology absorption* ......................41 ......... 5.2 7.02 Capacity for innovation* ...................................113 ......... 2.6 7.03 PCT patents, applications/million pop. ..............83 ......... 0.2 7.04 Business-to-business Internet use* ....................72 ......... 4.9 7.05 Business-to-consumer Internet use* ..................54 ......... 4.8 7.06 Extent of staff training* .......................................92 ......... 3.7
8th pillar: Government usage 8.01 Importance of ICTs to gov’t vision* ...................119 ......... 3.2 8.02 Government Online Service Index, 0–1 (best) .....47 ....... 0.58 8.03 Gov’t success in ICT promotion* ......................129 ......... 3.2
9th pillar: Economic impacts 9.01 Impact of ICTs on new services and products* 128 ......... 3.5 9.02 ICT PCT patents, applications/million pop. .......73 ......... 0.1 9.03 Impact of ICTs on new organizational models* .129 ......... 3.1 9.04 Knowledge-intensive jobs, % workforce .............77 ....... 18.7
10th pillar: Social impacts 10.01 Impact of ICTs on access to basic services* ......84 ......... 4.0 10.02 Internet access in schools* ................................69 ......... 4.2 10.03 ICT use & gov’t efficiency* ...............................115 ......... 3.5 10.04 E-Participation Index, 0–1 (best).........................70 ....... 0.18
Rank Score (out of 144) (1–7)
Networked Readiness Index 2013 ..............62 ..3.9Networked Readiness Index 2012 (out of 142) ...................... 62 .....3.9
A. Environment subindex ..............................................69 ....3.91st pillar: Political and regulatory environment ................... 71 .....3.72nd pillar: Business and innovation environment ............... 71 .....4.1
B. Readiness subindex .................................................58 ....4.93rd pillar: Infrastructure and digital content ........................ 45 .....4.64th pillar: Affordability ........................................................ 71 .....5.25th pillar: Skills ................................................................... 71 .....4.8
C. Usage subindex ........................................................55 ....3.96th pillar: Individual usage .................................................. 40 .....4.87th pillar: Business usage .................................................. 83 .....3.48th pillar: Government usage ........................................... 105 .....3.6
D. Impact subindex .....................................................101 ....3.09th pillar: Economic impacts ............................................ 125 .....2.610th pillar: Social impacts .................................................. 85 .....3.5
Kuwait3: Country/Economy Profiles
210 | The Global Information Technology Report 2013
Note: Indicators followed by an asterisk (*) are measured on a 1-to-7 (best) scale. For further details and explanation, please refer to the section “How to Read the Country/Economy Profiles” on page 139.
Kuwait High-income group average
1. Political and regulatory environment
6. Individual usage
5. Skills7. Business usage
4. Affordability8. Governmentusage
3. Infrastructure anddigital content
9. Economicimpacts
2. Business and innovation environment
10. Socialimpacts
1
2
3
4
5
6
7
@ 2013 World Economic Forum

The Networked Readiness Index in detailINDICATOR RANK /144 VALUE
1st pillar: Political and regulatory environment1.01 Effectiveness of law-making bodies* ................131 ......... 2.31.02 Laws relating to ICTs* ......................................135 ......... 2.51.03 Judicial independence* ....................................140 ......... 1.91.04 Efficiency of legal system in settling disputes* ..136 ......... 2.51.05 Efficiency of legal system in challenging regs* ..136 ......... 2.51.06 Intellectual property protection* ........................140 ......... 2.01.07 Software piracy rate, % software installed .........n/a ......... n/a1.08 No. procedures to enforce a contract ................78 .......... 381.09 No. days to enforce a contract ............................6 ........ 260
2nd pillar: Business and innovation environment2.01 Availability of latest technologies* .....................136 ......... 3.62.02 Venture capital availability* ...............................133 ......... 1.82.03 Total tax rate, % profits ....................................135 ....... 68.92.04 No. days to start a business ..............................49 .......... 102.05 No. procedures to start a business ......................3 ............ 22.06 Intensity of local competition* ...........................123 ......... 4.02.07 Tertiary education gross enrollment rate, % ........62 ....... 41.32.08 Quality of management schools* ......................141 ......... 2.72.09 Gov’t procurement of advanced tech* .............138 ......... 2.4
3rd pillar: Infrastructure and digital content3.01 Electricity production, kWh/capita ......................80 .. 2,061.93.02 Mobile network coverage, % pop ......................81 ....... 97.03.03 Int’l Internet bandwidth, kb/s per user..............129 ......... 1.73.04 Secure Internet servers/million pop ..................109 ......... 2.53.05 Accessibility of digital content* ...........................58 ......... 5.2
4th pillar: Affordability4.01 Mobile cellular tariffs, PPP $/min. .......................31 ....... 0.164.02 Fixed broadband Internet tariffs, PPP $/month 131 ... 122.194.03 Internet & telephony competition, 0–2 (best) ........1 ....... 2.00
5th pillar: Skills5.01 Quality of educational system* .........................123 ......... 2.85.02 Quality of math & science education* ...............114 ......... 3.15.03 Secondary education gross enrollment rate, % ..78 ....... 88.25.04 Adult literacy rate, % ..........................................13 ....... 99.2
INDICATOR RANK /144 VALUE
6th pillar: Individual usage 6.01 Mobile phone subscriptions/100 pop. ................51 ..... 116.4 6.02 Individuals using Internet, %...............................98 ....... 20.0 6.03 Households w/ personal computer, % .............125 ......... 4.0 6.04 Households w/ Internet access, % ..................111 ......... 3.6 6.05 Broadband Internet subscriptions/100 pop. .....107 ......... 0.7 6.06 Mobile broadband subscriptions/100 pop. ........n/a ......... n/a 6.07 Use of virtual social networks* .........................104 ......... 4.9
7th pillar: Business usage 7.01 Firm-level technology absorption* ....................136 ......... 3.7 7.02 Capacity for innovation* ...................................140 ......... 2.1 7.03 PCT patents, applications/million pop. ..............91 ......... 0.1 7.04 Business-to-business Internet use* ..................129 ......... 4.0 7.05 Business-to-consumer Internet use* ..................99 ......... 4.0 7.06 Extent of staff training* .....................................128 ......... 3.1
8th pillar: Government usage 8.01 Importance of ICTs to gov’t vision* ...................141 ......... 2.5 8.02 Government Online Service Index, 0–1 (best) .....87 ....... 0.42 8.03 Gov’t success in ICT promotion* ......................127 ......... 3.2
9th pillar: Economic impacts 9.01 Impact of ICTs on new services and products* 136 ......... 3.2 9.02 ICT PCT patents, applications/million pop. .......95 ......... 0.0 9.03 Impact of ICTs on new organizational models* .126 ......... 3.3 9.04 Knowledge-intensive jobs, % workforce .............80 ....... 18.3
10th pillar: Social impacts 10.01 Impact of ICTs on access to basic services* ....133 ......... 3.1 10.02 Internet access in schools* ..............................114 ......... 3.1 10.03 ICT use & gov’t efficiency* ...............................136 ......... 2.8 10.04 E-Participation Index, 0–1 (best).........................51 ....... 0.29
Rank Score (out of 144) (1–7)
Networked Readiness Index 2013 ............118 ..3.1Networked Readiness Index 2012 (out of 142) .................... 115 .....3.1
A. Environment subindex ............................................137 ....3.01st pillar: Political and regulatory environment ................. 136 .....2.72nd pillar: Business and innovation environment ............. 132 .....3.3
B. Readiness subindex ...............................................103 ....3.83rd pillar: Infrastructure and digital content ........................ 90 .....3.34th pillar: Affordability ...................................................... 107 .....3.75th pillar: Skills ................................................................... 92 .....4.4
C. Usage subindex ......................................................123 ....2.86th pillar: Individual usage .................................................. 94 .....2.77th pillar: Business usage ................................................ 138 .....2.68th pillar: Government usage ........................................... 130 .....3.1
D. Impact subindex .....................................................123 ....2.79th pillar: Economic impacts ............................................ 126 .....2.610th pillar: Social impacts ................................................ 115 .....2.9
Kyrgyz Republic3: Country/Economy Profiles
The Global Information Technology Report 2013 | 211
Note: Indicators followed by an asterisk (*) are measured on a 1-to-7 (best) scale. For further details and explanation, please refer to the section “How to Read the Country/Economy Profiles” on page 139.
Kyrgyz Republic Low-income group average
1. Political and regulatory environment
6. Individual usage
5. Skills7. Business usage
4. Affordability8. Governmentusage
3. Infrastructure anddigital content
9. Economicimpacts
2. Business and innovation environment
10. Socialimpacts
1
2
3
4
5
6
7
@ 2013 World Economic Forum

The Networked Readiness Index in detailINDICATOR RANK /144 VALUE
1st pillar: Political and regulatory environment1.01 Effectiveness of law-making bodies* ..................87 ......... 3.31.02 Laws relating to ICTs* ........................................54 ......... 4.21.03 Judicial independence* ......................................61 ......... 4.01.04 Efficiency of legal system in settling disputes* ..106 ......... 3.21.05 Efficiency of legal system in challenging regs* ....92 ......... 3.31.06 Intellectual property protection* ..........................57 ......... 3.81.07 Software piracy rate, % software installed ..........44 .......... 541.08 No. procedures to enforce a contract ..................8 .......... 271.09 No. days to enforce a contract ..........................56 ........ 469
2nd pillar: Business and innovation environment2.01 Availability of latest technologies* .......................64 ......... 5.12.02 Venture capital availability* .................................43 ......... 2.92.03 Total tax rate, % profits ......................................68 ....... 36.62.04 No. days to start a business ..............................72 .......... 162.05 No. procedures to start a business ....................20 ............ 42.06 Intensity of local competition* .............................69 ......... 4.92.07 Tertiary education gross enrollment rate, % ........36 ....... 60.12.08 Quality of management schools* ........................67 ......... 4.22.09 Gov’t procurement of advanced tech* ...............85 ......... 3.4
3rd pillar: Infrastructure and digital content3.01 Electricity production, kWh/capita ......................72 .. 2,469.83.02 Mobile network coverage, % pop ......................73 ....... 98.83.03 Int’l Internet bandwidth, kb/s per user................35 ....... 44.83.04 Secure Internet servers/million pop ....................38 ..... 205.93.05 Accessibility of digital content* ...........................39 ......... 5.6
4th pillar: Affordability4.01 Mobile cellular tariffs, PPP $/min. .......................54 ....... 0.224.02 Fixed broadband Internet tariffs, PPP $/month ..20 ..... 19.284.03 Internet & telephony competition, 0–2 (best) ......83 ....... 1.77
5th pillar: Skills5.01 Quality of educational system* ...........................74 ......... 3.65.02 Quality of math & science education* .................48 ......... 4.35.03 Secondary education gross enrollment rate, % ..53 ....... 95.25.04 Adult literacy rate, % ............................................2 ....... 99.8
INDICATOR RANK /144 VALUE
6th pillar: Individual usage 6.01 Mobile phone subscriptions/100 pop. ................80 ..... 102.9 6.02 Individuals using Internet, %...............................31 ....... 71.7 6.03 Households w/ personal computer, % ...............40 ....... 64.3 6.04 Households w/ Internet access, % ....................37 ....... 63.6 6.05 Broadband Internet subscriptions/100 pop. .......35 ....... 20.4 6.06 Mobile broadband subscriptions/100 pop. .........32 ....... 37.6 6.07 Use of virtual social networks* ...........................67 ......... 5.5
7th pillar: Business usage 7.01 Firm-level technology absorption* ......................90 ......... 4.5 7.02 Capacity for innovation* .....................................49 ......... 3.4 7.03 PCT patents, applications/million pop. ..............33 ....... 10.0 7.04 Business-to-business Internet use* ....................45 ......... 5.4 7.05 Business-to-consumer Internet use* ..................24 ......... 5.4 7.06 Extent of staff training* .......................................53 ......... 4.1
8th pillar: Government usage 8.01 Importance of ICTs to gov’t vision* ...................103 ......... 3.5 8.02 Government Online Service Index, 0–1 (best) .....45 ....... 0.59 8.03 Gov’t success in ICT promotion* ........................98 ......... 4.0
9th pillar: Economic impacts 9.01 Impact of ICTs on new services and products* ..78 ......... 4.3 9.02 ICT PCT patents, applications/million pop. .......35 ......... 1.6 9.03 Impact of ICTs on new organizational models* ...71 ......... 4.1 9.04 Knowledge-intensive jobs, % workforce .............20 ....... 40.2
10th pillar: Social impacts 10.01 Impact of ICTs on access to basic services* ......56 ......... 4.5 10.02 Internet access in schools* ................................32 ......... 5.4 10.03 ICT use & gov’t efficiency* .................................85 ......... 4.0 10.04 E-Participation Index, 0–1 (best).........................62 ....... 0.21
Rank Score (out of 144) (1–7)
Networked Readiness Index 2013 ..............41 ..4.4Networked Readiness Index 2012 (out of 142) ...................... 41 .....4.3
A. Environment subindex ..............................................43 ....4.31st pillar: Political and regulatory environment ................... 52 .....4.02nd pillar: Business and innovation environment ............... 42 .....4.6
B. Readiness subindex .................................................27 ....5.43rd pillar: Infrastructure and digital content ........................ 41 .....4.84th pillar: Affordability ........................................................ 16 .....6.35th pillar: Skills ................................................................... 54 .....5.0
C. Usage subindex ........................................................43 ....4.26th pillar: Individual usage .................................................. 38 .....4.87th pillar: Business usage .................................................. 51 .....3.68th pillar: Government usage ............................................. 75 .....4.0
D. Impact subindex .......................................................45 ....3.99th pillar: Economic impacts .............................................. 38 .....3.710th pillar: Social impacts .................................................. 51 .....4.1
Latvia3: Country/Economy Profiles
212 | The Global Information Technology Report 2013
Note: Indicators followed by an asterisk (*) are measured on a 1-to-7 (best) scale. For further details and explanation, please refer to the section “How to Read the Country/Economy Profiles” on page 139.
Latvia Upper-middle-income group average
1. Political and regulatory environment
6. Individual usage
5. Skills7. Business usage
4. Affordability8. Governmentusage
3. Infrastructure anddigital content
9. Economicimpacts
2. Business and innovation environment
10. Socialimpacts
1
2
3
4
5
6
7
@ 2013 World Economic Forum

The Networked Readiness Index in detailINDICATOR RANK /144 VALUE
1st pillar: Political and regulatory environment1.01 Effectiveness of law-making bodies* ................134 ......... 2.31.02 Laws relating to ICTs* ......................................142 ......... 2.11.03 Judicial independence* ....................................131 ......... 2.41.04 Efficiency of legal system in settling disputes* ..114 ......... 3.11.05 Efficiency of legal system in challenging regs* ..126 ......... 2.71.06 Intellectual property protection* ........................124 ......... 2.61.07 Software piracy rate, % software installed ..........71 .......... 711.08 No. procedures to enforce a contract ................68 .......... 371.09 No. days to enforce a contract ........................108 ........ 721
2nd pillar: Business and innovation environment2.01 Availability of latest technologies* .......................76 ......... 4.92.02 Venture capital availability* .................................63 ......... 2.72.03 Total tax rate, % profits ......................................37 ....... 30.22.04 No. days to start a business ..............................43 ............ 92.05 No. procedures to start a business ....................30 ............ 52.06 Intensity of local competition* .............................35 ......... 5.42.07 Tertiary education gross enrollment rate, % ........41 ....... 57.72.08 Quality of management schools* ........................13 ......... 5.42.09 Gov’t procurement of advanced tech* .............141 ......... 2.3
3rd pillar: Infrastructure and digital content3.01 Electricity production, kWh/capita ......................62 .. 3,281.23.02 Mobile network coverage, % pop ......................81 ....... 97.03.03 Int’l Internet bandwidth, kb/s per user..............123 ......... 2.33.04 Secure Internet servers/million pop ....................62 ....... 41.13.05 Accessibility of digital content* .........................110 ......... 4.2
4th pillar: Affordability4.01 Mobile cellular tariffs, PPP $/min. .....................123 ....... 0.544.02 Fixed broadband Internet tariffs, PPP $/month ..42 ..... 26.374.03 Internet & telephony competition, 0–2 (best) ....134 ....... 0.55
5th pillar: Skills5.01 Quality of educational system* ...........................10 ......... 5.35.02 Quality of math & science education* ...................4 ......... 5.95.03 Secondary education gross enrollment rate, % ..87 ....... 83.35.04 Adult literacy rate, % ..........................................88 ....... 89.6
INDICATOR RANK /144 VALUE
6th pillar: Individual usage 6.01 Mobile phone subscriptions/100 pop. ..............112 ....... 78.6 6.02 Individuals using Internet, %...............................52 ....... 52.0 6.03 Households w/ personal computer, % ...............33 ....... 71.5 6.04 Households w/ Internet access, % ....................39 ....... 61.8 6.05 Broadband Internet subscriptions/100 pop. .......74 ......... 5.2 6.06 Mobile broadband subscriptions/100 pop. .......123 ......... 0.0 6.07 Use of virtual social networks* ...........................62 ......... 5.6
7th pillar: Business usage 7.01 Firm-level technology absorption* ......................70 ......... 4.8 7.02 Capacity for innovation* ...................................114 ......... 2.6 7.03 PCT patents, applications/million pop. ..............64 ......... 1.3 7.04 Business-to-business Internet use* ..................128 ......... 4.0 7.05 Business-to-consumer Internet use* ................132 ......... 3.1 7.06 Extent of staff training* .....................................102 ......... 3.6
8th pillar: Government usage 8.01 Importance of ICTs to gov’t vision* ...................144 ......... 2.1 8.02 Government Online Service Index, 0–1 (best) .....74 ....... 0.48 8.03 Gov’t success in ICT promotion* ......................139 ......... 2.7
9th pillar: Economic impacts 9.01 Impact of ICTs on new services and products* 134 ......... 3.3 9.02 ICT PCT patents, applications/million pop. .......53 ......... 0.4 9.03 Impact of ICTs on new organizational models* .135 ......... 2.9 9.04 Knowledge-intensive jobs, % workforce .............40 ....... 31.9
10th pillar: Social impacts 10.01 Impact of ICTs on access to basic services* ....141 ......... 2.7 10.02 Internet access in schools* ................................97 ......... 3.5 10.03 ICT use & gov’t efficiency* ...............................143 ......... 2.3 10.04 E-Participation Index, 0–1 (best).........................46 ....... 0.32
Rank Score (out of 144) (1–7)
Networked Readiness Index 2013 ..............94 ..3.5Networked Readiness Index 2012 (out of 142) ...................... 95 .....3.5
A. Environment subindex ..............................................86 ....3.71st pillar: Political and regulatory environment ................. 133 .....2.82nd pillar: Business and innovation environment ............... 35 .....4.7
B. Readiness subindex .................................................86 ....4.33rd pillar: Infrastructure and digital content ........................ 88 .....3.34th pillar: Affordability ........................................................ 95 .....4.15th pillar: Skills ................................................................... 28 .....5.5
C. Usage subindex ........................................................98 ....3.26th pillar: Individual usage .................................................. 63 .....3.77th pillar: Business usage ................................................ 116 .....3.08th pillar: Government usage ........................................... 134 .....2.9
D. Impact subindex .....................................................116 ....2.99th pillar: Economic impacts ............................................ 102 .....2.910th pillar: Social impacts ................................................ 120 .....2.9
Lebanon3: Country/Economy Profiles
The Global Information Technology Report 2013 | 213
Note: Indicators followed by an asterisk (*) are measured on a 1-to-7 (best) scale. For further details and explanation, please refer to the section “How to Read the Country/Economy Profiles” on page 139.
Lebanon Upper-middle-income group average
1. Political and regulatory environment
6. Individual usage
5. Skills7. Business usage
4. Affordability8. Governmentusage
3. Infrastructure anddigital content
9. Economicimpacts
2. Business and innovation environment
10. Socialimpacts
1
2
3
4
5
6
7
@ 2013 World Economic Forum

The Networked Readiness Index in detailINDICATOR RANK /144 VALUE
1st pillar: Political and regulatory environment1.01 Effectiveness of law-making bodies* ................108 ......... 3.01.02 Laws relating to ICTs* ......................................138 ......... 2.41.03 Judicial independence* ....................................100 ......... 3.01.04 Efficiency of legal system in settling disputes* ....99 ......... 3.31.05 Efficiency of legal system in challenging regs* ..111 ......... 3.01.06 Intellectual property protection* ........................104 ......... 3.01.07 Software piracy rate, % software installed .........n/a ......... n/a1.08 No. procedures to enforce a contract ..............110 .......... 411.09 No. days to enforce a contract ..........................94 ........ 615
2nd pillar: Business and innovation environment2.01 Availability of latest technologies* .....................126 ......... 3.9
2.02 Venture capital availability* ...............................131 ......... 1.9 2.03 Total tax rate, % profits ........................................9 ....... 16.0 2.04 No. days to start a business ..............................95 .......... 24 2.05 No. procedures to start a business ....................74 ............ 7 2.06 Intensity of local competition* ...........................118 ......... 4.1 2.07 Tertiary education gross enrollment rate, % ......133 ......... 3.5 2.08 Quality of management schools* ......................134 ......... 2.8 2.09 Gov’t procurement of advanced tech* .............133 ......... 2.6
3rd pillar: Infrastructure and digital content 3.01 Electricity production, kWh/capita ....................131 ....... 93.1 3.02 Mobile network coverage, % pop ....................121 ....... 75.0 3.03 Int’l Internet bandwidth, kb/s per user..............119 ......... 2.8 3.04 Secure Internet servers/million pop ..................139 ......... 0.5 3.05 Accessibility of digital content* .........................135 ......... 3.4
4th pillar: Affordability 4.01 Mobile cellular tariffs, PPP $/min. .....................125 ....... 0.57 4.02 Fixed broadband Internet tariffs, PPP $/month 123 ..... 82.21 4.03 Internet & telephony competition, 0–2 (best) ........1 ....... 2.00
5th pillar: Skills 5.01 Quality of educational system* .........................102 ......... 3.2 5.02 Quality of math & science education* ...............119 ......... 3.0 5.03 Secondary education gross enrollment rate, % 120 ....... 46.4 5.04 Adult literacy rate, % ..........................................87 ....... 89.6
INDICATOR RANK /144 VALUE
6th pillar: Individual usage 6.01 Mobile phone subscriptions/100 pop. ..............125 ....... 56.2 6.02 Individuals using Internet, %.............................130 ......... 4.2 6.03 Households w/ personal computer, % .............118 ......... 5.0 6.04 Households w/ Internet access, % ..................126 ......... 1.3 6.05 Broadband Internet subscriptions/100 pop. .....128 ......... 0.1 6.06 Mobile broadband subscriptions/100 pop. .......103 ......... 1.7 6.07 Use of virtual social networks* .........................131 ......... 4.3
7th pillar: Business usage 7.01 Firm-level technology absorption* ....................127 ......... 4.0 7.02 Capacity for innovation* ...................................119 ......... 2.5 7.03 PCT patents, applications/million pop. ............123 ......... 0.0 7.04 Business-to-business Internet use* ..................134 ......... 3.8 7.05 Business-to-consumer Internet use* ................133 ......... 3.1 7.06 Extent of staff training* .....................................117 ......... 3.3
8th pillar: Government usage 8.01 Importance of ICTs to gov’t vision* ...................127 ......... 3.1 8.02 Government Online Service Index, 0–1 (best) ...113 ....... 0.30 8.03 Gov’t success in ICT promotion* ......................119 ......... 3.5
9th pillar: Economic impacts 9.01 Impact of ICTs on new services and products* 142 ......... 2.8 9.02 ICT PCT patents, applications/million pop. .......95 ......... 0.0 9.03 Impact of ICTs on new organizational models* .134 ......... 2.9 9.04 Knowledge-intensive jobs, % workforce ...........104 ......... 6.0
10th pillar: Social impacts 10.01 Impact of ICTs on access to basic services* ....138 ......... 3.1 10.02 Internet access in schools* ..............................129 ......... 2.4 10.03 ICT use & gov’t efficiency* ...............................134 ......... 3.0 10.04 E-Participation Index, 0–1 (best).......................111 ....... 0.03
Rank Score (out of 144) (1–7)
Networked Readiness Index 2013 ............138 ..2.7Networked Readiness Index 2012 (out of 142) .................... 133 .....2.8
A. Environment subindex ............................................121 ....3.31st pillar: Political and regulatory environment ................. 116 .....3.12nd pillar: Business and innovation environment ............. 118 .....3.6
B. Readiness subindex ...............................................136 ....2.73rd pillar: Infrastructure and digital content ...................... 130 .....2.24th pillar: Affordability ...................................................... 134 .....2.45th pillar: Skills ................................................................. 119 .....3.5
C. Usage subindex ......................................................135 ....2.56th pillar: Individual usage ................................................ 129 .....1.77th pillar: Business usage ................................................ 133 .....2.88th pillar: Government usage ........................................... 128 .....3.1
D. Impact subindex .....................................................140 ....2.29th pillar: Economic impacts ............................................ 144 .....2.010th pillar: Social impacts ................................................ 135 .....2.4
Lesotho3: Country/Economy Profiles
214 | The Global Information Technology Report 2013
Note: Indicators followed by an asterisk (*) are measured on a 1-to-7 (best) scale. For further details and explanation, please refer to the section “How to Read the Country/Economy Profiles” on page 139.
Lesotho Lower-middle-income group average
1. Political and regulatory environment
6. Individual usage
5. Skills7. Business usage
4. Affordability8. Governmentusage
3. Infrastructure anddigital content
9. Economicimpacts
2. Business and innovation environment
10. Socialimpacts
1
2
3
4
5
6
7
@ 2013 World Economic Forum
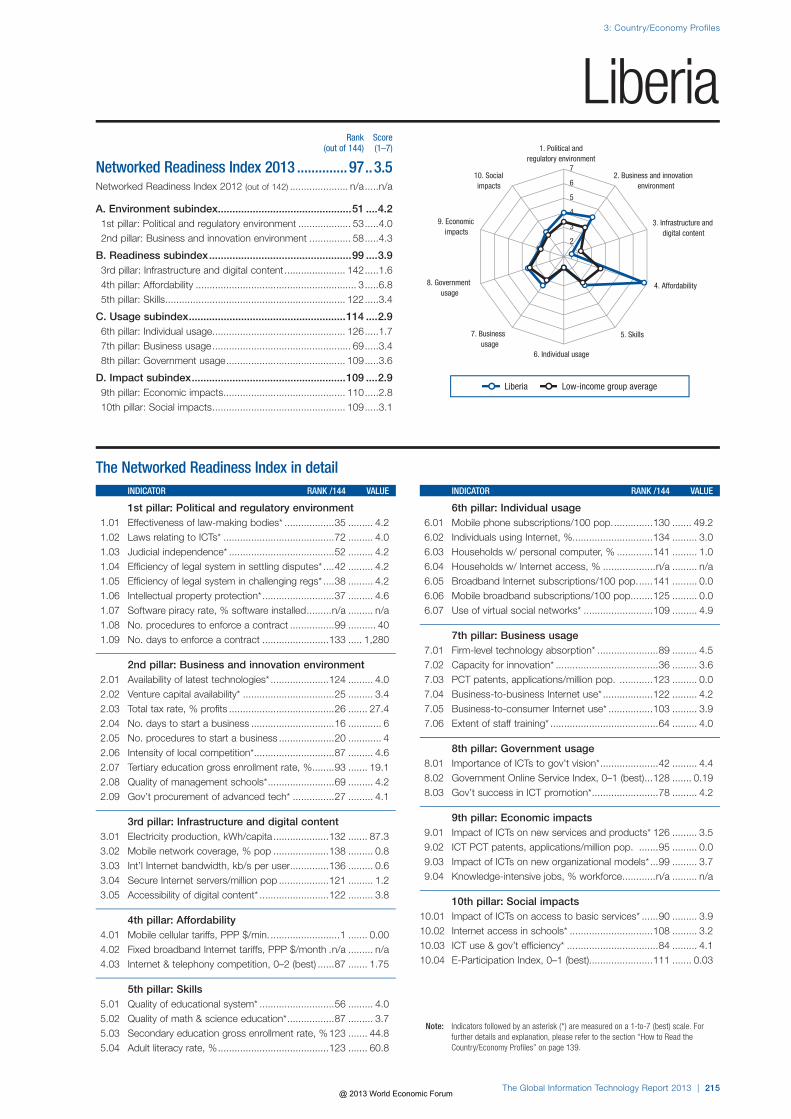
The Networked Readiness Index in detailINDICATOR RANK /144 VALUE
1st pillar: Political and regulatory environment1.01 Effectiveness of law-making bodies* ..................35 ......... 4.21.02 Laws relating to ICTs* ........................................72 ......... 4.01.03 Judicial independence* ......................................52 ......... 4.21.04 Efficiency of legal system in settling disputes* ....42 ......... 4.21.05 Efficiency of legal system in challenging regs* ....38 ......... 4.21.06 Intellectual property protection* ..........................37 ......... 4.61.07 Software piracy rate, % software installed .........n/a ......... n/a1.08 No. procedures to enforce a contract ................99 .......... 401.09 No. days to enforce a contract ........................133 ..... 1,280
2nd pillar: Business and innovation environment2.01 Availability of latest technologies* .....................124 ......... 4.02.02 Venture capital availability* .................................25 ......... 3.42.03 Total tax rate, % profits ......................................26 ....... 27.42.04 No. days to start a business ..............................16 ............ 62.05 No. procedures to start a business ....................20 ............ 42.06 Intensity of local competition* .............................87 ......... 4.6
2.07 Tertiary education gross enrollment rate, % ........93 ....... 19.12.08 Quality of management schools* ........................69 ......... 4.22.09 Gov’t procurement of advanced tech* ...............27 ......... 4.1
3rd pillar: Infrastructure and digital content3.01 Electricity production, kWh/capita ....................132 ....... 87.33.02 Mobile network coverage, % pop ....................138 ......... 0.83.03 Int’l Internet bandwidth, kb/s per user..............136 ......... 0.63.04 Secure Internet servers/million pop ..................121 ......... 1.23.05 Accessibility of digital content* .........................122 ......... 3.8
4th pillar: Affordability4.01 Mobile cellular tariffs, PPP $/min. .........................1 ....... 0.004.02 Fixed broadband Internet tariffs, PPP $/month .n/a ......... n/a4.03 Internet & telephony competition, 0–2 (best) ......87 ....... 1.75
5th pillar: Skills5.01 Quality of educational system* ...........................56 ......... 4.0
5.02 Quality of math & science education* .................87 ......... 3.7 5.03 Secondary education gross enrollment rate, % 123 ....... 44.85.04 Adult literacy rate, % ........................................123 ....... 60.8
INDICATOR RANK /144 VALUE
6th pillar: Individual usage 6.01 Mobile phone subscriptions/100 pop. ..............130 ....... 49.2 6.02 Individuals using Internet, %.............................134 ......... 3.0 6.03 Households w/ personal computer, % .............141 ......... 1.0 6.04 Households w/ Internet access, % ...................n/a ......... n/a 6.05 Broadband Internet subscriptions/100 pop. .....141 ......... 0.0 6.06 Mobile broadband subscriptions/100 pop. .......125 ......... 0.0 6.07 Use of virtual social networks* .........................109 ......... 4.9
7th pillar: Business usage 7.01 Firm-level technology absorption* ......................89 ......... 4.5 7.02 Capacity for innovation* .....................................36 ......... 3.6 7.03 PCT patents, applications/million pop. ............123 ......... 0.0 7.04 Business-to-business Internet use* ..................122 ......... 4.2 7.05 Business-to-consumer Internet use* ................103 ......... 3.9 7.06 Extent of staff training* .......................................64 ......... 4.0
8th pillar: Government usage 8.01 Importance of ICTs to gov’t vision* .....................42 ......... 4.4 8.02 Government Online Service Index, 0–1 (best) ...128 ....... 0.19 8.03 Gov’t success in ICT promotion* ........................78 ......... 4.2
9th pillar: Economic impacts 9.01 Impact of ICTs on new services and products* 126 ......... 3.5 9.02 ICT PCT patents, applications/million pop. .......95 ......... 0.0 9.03 Impact of ICTs on new organizational models* ...99 ......... 3.7 9.04 Knowledge-intensive jobs, % workforce ............n/a ......... n/a
10th pillar: Social impacts 10.01 Impact of ICTs on access to basic services* ......90 ......... 3.9 10.02 Internet access in schools* ..............................108 ......... 3.2 10.03 ICT use & gov’t efficiency* .................................84 ......... 4.1 10.04 E-Participation Index, 0–1 (best).......................111 ....... 0.03
Rank Score (out of 144) (1–7)
Networked Readiness Index 2013 ..............97 ..3.5Networked Readiness Index 2012 (out of 142) ..................... n/a .....n/a
A. Environment subindex ..............................................51 ....4.21st pillar: Political and regulatory environment ................... 53 .....4.02nd pillar: Business and innovation environment ............... 58 .....4.3
B. Readiness subindex .................................................99 ....3.93rd pillar: Infrastructure and digital content ...................... 142 .....1.64th pillar: Affordability .......................................................... 3 .....6.85th pillar: Skills ................................................................. 122 .....3.4
C. Usage subindex ......................................................114 ....2.96th pillar: Individual usage ................................................ 126 .....1.77th pillar: Business usage .................................................. 69 .....3.48th pillar: Government usage ........................................... 109 .....3.6
D. Impact subindex .....................................................109 ....2.99th pillar: Economic impacts ............................................ 110 .....2.810th pillar: Social impacts ................................................ 109 .....3.1
Liberia3: Country/Economy Profiles
The Global Information Technology Report 2013 | 215
Note: Indicators followed by an asterisk (*) are measured on a 1-to-7 (best) scale. For further details and explanation, please refer to the section “How to Read the Country/Economy Profiles” on page 139.
Liberia Low-income group average
1. Political and regulatory environment
6. Individual usage
5. Skills7. Business usage
4. Affordability8. Governmentusage
3. Infrastructure anddigital content
9. Economicimpacts
2. Business and innovation environment
10. Socialimpacts
1
2
3
4
5
6
7
@ 2013 World Economic Forum

The Networked Readiness Index in detailINDICATOR RANK /144 VALUE
1st pillar: Political and regulatory environment1.01 Effectiveness of law-making bodies* ..................85 ......... 3.31.02 Laws relating to ICTs* ......................................136 ......... 2.51.03 Judicial independence* ......................................84 ......... 3.41.04 Efficiency of legal system in settling disputes* ..103 ......... 3.21.05 Efficiency of legal system in challenging regs* ....88 ......... 3.31.06 Intellectual property protection* ........................111 ......... 2.91.07 Software piracy rate, % software installed ........103 .......... 901.08 No. procedures to enforce a contract ...............n/a ......... n/a1.09 No. days to enforce a contract .........................n/a ......... n/a
2nd pillar: Business and innovation environment2.01 Availability of latest technologies* .....................125 ......... 3.92.02 Venture capital availability* .................................93 ......... 2.32.03 Total tax rate, % profits .....................................n/a ......... n/a2.04 No. days to start a business .............................n/a ......... n/a2.05 No. procedures to start a business ...................n/a ......... n/a2.06 Intensity of local competition* ...........................115 ......... 4.12.07 Tertiary education gross enrollment rate, % ........49 ....... 54.42.08 Quality of management schools* ......................144 ......... 2.32.09 Gov’t procurement of advanced tech* .............118 ......... 3.0
3rd pillar: Infrastructure and digital content3.01 Electricity production, kWh/capita ......................49 .. 4,858.33.02 Mobile network coverage, % pop ......................74 ....... 98.03.03 Int’l Internet bandwidth, kb/s per user................81 ....... 11.03.04 Secure Internet servers/million pop ..................119 ......... 1.43.05 Accessibility of digital content* .........................131 ......... 3.5
4th pillar: Affordability4.01 Mobile cellular tariffs, PPP $/min. ......................n/a ......... n/a4.02 Fixed broadband Internet tariffs, PPP $/month 113 ..... 67.494.03 Internet & telephony competition, 0–2 (best) ....140 ....... 0.00
5th pillar: Skills5.01 Quality of educational system* .........................142 ......... 2.05.02 Quality of math & science education* ...............135 ......... 2.45.03 Secondary education gross enrollment rate, % ..12 ..... 110.35.04 Adult literacy rate, % ..........................................91 ....... 89.2
INDICATOR RANK /144 VALUE
6th pillar: Individual usage 6.01 Mobile phone subscriptions/100 pop. ................12 ..... 155.7 6.02 Individuals using Internet, %.............................104 ....... 17.0 6.03 Households w/ personal computer, % .............109 ......... 7.6 6.04 Households w/ Internet access, % ....................96 ......... 9.2 6.05 Broadband Internet subscriptions/100 pop. .....101 ......... 1.1 6.06 Mobile broadband subscriptions/100 pop. ........n/a ......... n/a 6.07 Use of virtual social networks* .........................117 ......... 4.7
7th pillar: Business usage 7.01 Firm-level technology absorption* ....................108 ......... 4.3 7.02 Capacity for innovation* ...................................123 ......... 2.5 7.03 PCT patents, applications/million pop. ..............79 ......... 0.4 7.04 Business-to-business Internet use* ..................136 ......... 3.6 7.05 Business-to-consumer Internet use* ................131 ......... 3.1 7.06 Extent of staff training* .....................................140 ......... 2.9
8th pillar: Government usage 8.01 Importance of ICTs to gov’t vision* ...................132 ......... 2.8 8.02 Government Online Service Index, 0–1 (best) ...140 ....... 0.00 8.03 Gov’t success in ICT promotion* ......................116 ......... 3.5
9th pillar: Economic impacts 9.01 Impact of ICTs on new services and products* 141 ......... 2.9 9.02 ICT PCT patents, applications/million pop. .......75 ......... 0.1 9.03 Impact of ICTs on new organizational models* .130 ......... 3.1 9.04 Knowledge-intensive jobs, % workforce ............n/a ......... n/a
10th pillar: Social impacts 10.01 Impact of ICTs on access to basic services* ....130 ......... 3.2 10.02 Internet access in schools* ..............................134 ......... 2.2 10.03 ICT use & gov’t efficiency* ...............................135 ......... 2.8 10.04 E-Participation Index, 0–1 (best).......................124 ....... 0.00
Rank Score (out of 144) (1–7)
Networked Readiness Index 2013 ............132 ..2.8Networked Readiness Index 2012 (out of 142) ..................... n/a .....n/a
A. Environment subindex ............................................130 ....3.21st pillar: Political and regulatory environment ................. 130 .....2.82nd pillar: Business and innovation environment ............. 120 .....3.5
B. Readiness subindex ...............................................126 ....2.93rd pillar: Infrastructure and digital content ........................ 80 .....3.64th pillar: Affordability ...................................................... 141 .....1.05th pillar: Skills ................................................................... 97 .....4.2
C. Usage subindex ......................................................129 ....2.66th pillar: Individual usage .................................................. 89 .....2.87th pillar: Business usage ................................................ 136 .....2.78th pillar: Government usage ........................................... 143 .....2.4
D. Impact subindex .....................................................138 ....2.39th pillar: Economic impacts ............................................ 137 .....2.310th pillar: Social impacts ................................................ 138 .....2.3
Libya3: Country/Economy Profiles
216 | The Global Information Technology Report 2013
Note: Indicators followed by an asterisk (*) are measured on a 1-to-7 (best) scale. For further details and explanation, please refer to the section “How to Read the Country/Economy Profiles” on page 139.
Libya Upper-middle-income group average
1. Political and regulatory environment
6. Individual usage
5. Skills7. Business usage
4. Affordability8. Governmentusage
3. Infrastructure anddigital content
9. Economicimpacts
2. Business and innovation environment
10. Socialimpacts
1
2
3
4
5
6
7
@ 2013 World Economic Forum

The Networked Readiness Index in detailINDICATOR RANK /144 VALUE
1st pillar: Political and regulatory environment1.01 Effectiveness of law-making bodies* ..................98 ......... 3.11.02 Laws relating to ICTs* ........................................40 ......... 4.61.03 Judicial independence* ......................................82 ......... 3.51.04 Efficiency of legal system in settling disputes* ....90 ......... 3.31.05 Efficiency of legal system in challenging regs* ....45 ......... 4.01.06 Intellectual property protection* ..........................66 ......... 3.71.07 Software piracy rate, % software installed ..........44 .......... 541.08 No. procedures to enforce a contract ................18 .......... 301.09 No. days to enforce a contract ............................9 ........ 275
2nd pillar: Business and innovation environment2.01 Availability of latest technologies* .......................37 ......... 5.72.02 Venture capital availability* .................................86 ......... 2.42.03 Total tax rate, % profits ......................................94 ....... 43.72.04 No. days to start a business ..............................87 .......... 202.05 No. procedures to start a business ....................74 ............ 72.06 Intensity of local competition* .............................48 ......... 5.1
2.07 Tertiary education gross enrollment rate, % ........17 ....... 74.02.08 Quality of management schools* ........................57 ......... 4.32.09 Gov’t procurement of advanced tech* ...............96 ......... 3.2
3rd pillar: Infrastructure and digital content3.01 Electricity production, kWh/capita ......................51 .. 4,384.83.02 Mobile network coverage, % pop ........................1 ..... 100.03.03 Int’l Internet bandwidth, kb/s per user................29 ....... 57.63.04 Secure Internet servers/million pop ....................34 ..... 242.03.05 Accessibility of digital content* ...........................24 ......... 6.1
4th pillar: Affordability4.01 Mobile cellular tariffs, PPP $/min. .......................60 ....... 0.254.02 Fixed broadband Internet tariffs, PPP $/month ..10 ..... 16.564.03 Internet & telephony competition, 0–2 (best) ......61 ....... 1.92
5th pillar: Skills5.01 Quality of educational system* ...........................54 ......... 4.0
5.02 Quality of math & science education* .................16 ......... 5.2 5.03 Secondary education gross enrollment rate, % ..42 ....... 98.75.04 Adult literacy rate, % ............................................6 ....... 99.7
INDICATOR RANK /144 VALUE
6th pillar: Individual usage 6.01 Mobile phone subscriptions/100 pop. ................14 ..... 151.3 6.02 Individuals using Internet, %...............................39 ....... 65.1 6.03 Households w/ personal computer, % ...............44 ....... 61.8 6.04 Households w/ Internet access, % ....................38 ....... 61.8 6.05 Broadband Internet subscriptions/100 pop. .......30 ....... 22.1 6.06 Mobile broadband subscriptions/100 pop. .........61 ....... 17.2 6.07 Use of virtual social networks* ...........................28 ......... 6.0
7th pillar: Business usage 7.01 Firm-level technology absorption* ......................53 ......... 5.0 7.02 Capacity for innovation* .....................................47 ......... 3.4 7.03 PCT patents, applications/million pop. ..............45 ......... 4.6 7.04 Business-to-business Internet use* ....................20 ......... 5.8 7.05 Business-to-consumer Internet use* ..................10 ......... 5.8 7.06 Extent of staff training* .......................................66 ......... 4.0
8th pillar: Government usage 8.01 Importance of ICTs to gov’t vision* .....................73 ......... 4.0 8.02 Government Online Service Index, 0–1 (best) .....29 ....... 0.70 8.03 Gov’t success in ICT promotion* ........................54 ......... 4.6
9th pillar: Economic impacts 9.01 Impact of ICTs on new services and products* ..29 ......... 5.1 9.02 ICT PCT patents, applications/million pop. .......55 ......... 0.4 9.03 Impact of ICTs on new organizational models* ...26 ......... 4.9 9.04 Knowledge-intensive jobs, % workforce .............21 ....... 39.6
10th pillar: Social impacts 10.01 Impact of ICTs on access to basic services* ......36 ......... 5.0 10.02 Internet access in schools* ................................23 ......... 5.8 10.03 ICT use & gov’t efficiency* .................................33 ......... 4.9 10.04 E-Participation Index, 0–1 (best).........................30 ....... 0.53
Rank Score (out of 144) (1–7)
Networked Readiness Index 2013 ..............32 ..4.7Networked Readiness Index 2012 (out of 142) ...................... 31 .....4.7
A. Environment subindex ..............................................45 ....4.31st pillar: Political and regulatory environment ................... 51 .....4.02nd pillar: Business and innovation environment ............... 44 .....4.6
B. Readiness subindex .................................................20 ....5.73rd pillar: Infrastructure and digital content ........................ 33 .....5.24th pillar: Affordability ........................................................ 14 .....6.35th pillar: Skills ................................................................... 29 .....5.5
C. Usage subindex ........................................................36 ....4.46th pillar: Individual usage .................................................. 37 .....4.97th pillar: Business usage .................................................. 42 .....3.88th pillar: Government usage ............................................. 36 .....4.6
D. Impact subindex .......................................................30 ....4.59th pillar: Economic impacts .............................................. 30 .....4.010th pillar: Social impacts .................................................. 28 .....5.0
Lithuania3: Country/Economy Profiles
The Global Information Technology Report 2013 | 217
Note: Indicators followed by an asterisk (*) are measured on a 1-to-7 (best) scale. For further details and explanation, please refer to the section “How to Read the Country/Economy Profiles” on page 139.
Lithuania Upper-middle-income group average
1. Political and regulatory environment
6. Individual usage
5. Skills7. Business usage
4. Affordability8. Governmentusage
3. Infrastructure anddigital content
9. Economicimpacts
2. Business and innovation environment
10. Socialimpacts
1
2
3
4
5
6
7
@ 2013 World Economic Forum

The Networked Readiness Index in detailINDICATOR RANK /144 VALUE
1st pillar: Political and regulatory environment1.01 Effectiveness of law-making bodies* ....................4 ......... 5.51.02 Laws relating to ICTs* ..........................................1 ......... 6.01.03 Judicial independence* ......................................16 ......... 5.81.04 Efficiency of legal system in settling disputes* ....12 ......... 5.21.05 Efficiency of legal system in challenging regs* ......8 ......... 5.31.06 Intellectual property protection* ............................7 ......... 5.91.07 Software piracy rate, % software installed ............2 .......... 201.08 No. procedures to enforce a contract ..................5 .......... 261.09 No. days to enforce a contract ..........................15 ........ 321
2nd pillar: Business and innovation environment2.01 Availability of latest technologies* .......................10 ......... 6.4
2.02 Venture capital availability* .................................12 ......... 3.9 2.03 Total tax rate, % profits ......................................12 ....... 21.0 2.04 No. days to start a business ..............................81 .......... 19 2.05 No. procedures to start a business ....................48 ............ 6 2.06 Intensity of local competition* .............................58 ......... 5.0 2.07 Tertiary education gross enrollment rate, % ......112 ....... 10.5 2.08 Quality of management schools* ........................60 ......... 4.3 2.09 Gov’t procurement of advanced tech* .................8 ......... 4.6
3rd pillar: Infrastructure and digital content 3.01 Electricity production, kWh/capita ......................34 .. 6,377.3 3.02 Mobile network coverage, % pop ......................28 ....... 99.9 3.03 Int’l Internet bandwidth, kb/s per user................17 ....... 89.6 3.04 Secure Internet servers/million pop ......................7 .. 1,874.3 3.05 Accessibility of digital content* .............................6 ......... 6.4
4th pillar: Affordability 4.01 Mobile cellular tariffs, PPP $/min. .......................59 ....... 0.25 4.02 Fixed broadband Internet tariffs, PPP $/month ..64 ..... 31.55 4.03 Internet & telephony competition, 0–2 (best) ........1 ....... 2.00
5th pillar: Skills 5.01 Quality of educational system* ...........................36 ......... 4.4 5.02 Quality of math & science education* .................46 ......... 4.3 5.03 Secondary education gross enrollment rate, % ..31 ..... 101.2 5.04 Adult literacy rate, % ..........................................15 ....... 99.0
INDICATOR RANK /144 VALUE
6th pillar: Individual usage 6.01 Mobile phone subscriptions/100 pop. ................17 ..... 148.3 6.02 Individuals using Internet, %.................................5 ....... 90.9 6.03 Households w/ personal computer, % .................3 ....... 91.7 6.04 Households w/ Internet access, % ......................6 ....... 90.6 6.05 Broadband Internet subscriptions/100 pop. .......10 ....... 32.9 6.06 Mobile broadband subscriptions/100 pop. .........12 ....... 66.7 6.07 Use of virtual social networks* ...........................23 ......... 6.1
7th pillar: Business usage 7.01 Firm-level technology absorption* ......................24 ......... 5.6 7.02 Capacity for innovation* .....................................16 ......... 4.6 7.03 PCT patents, applications/million pop. ..............16 ..... 100.1 7.04 Business-to-business Internet use* ....................16 ......... 5.9 7.05 Business-to-consumer Internet use* ..................36 ......... 5.1 7.06 Extent of staff training* .........................................4 ......... 5.3
8th pillar: Government usage 8.01 Importance of ICTs to gov’t vision* .......................5 ......... 5.5 8.02 Government Online Service Index, 0–1 (best) .....29 ....... 0.70 8.03 Gov’t success in ICT promotion* ..........................9 ......... 5.6
9th pillar: Economic impacts 9.01 Impact of ICTs on new services and products* ....9 ......... 5.5 9.02 ICT PCT patents, applications/million pop. .......20 ....... 18.8 9.03 Impact of ICTs on new organizational models* ...17 ......... 5.0 9.04 Knowledge-intensive jobs, % workforce ............n/a ......... n/a
10th pillar: Social impacts 10.01 Impact of ICTs on access to basic services* ........3 ......... 6.0 10.02 Internet access in schools* ................................14 ......... 6.0 10.03 ICT use & gov’t efficiency* .................................16 ......... 5.2 10.04 E-Participation Index, 0–1 (best).........................38 ....... 0.39
Rank Score (out of 144) (1–7)
Networked Readiness Index 2013 ..............16 ..5.4Networked Readiness Index 2012 (out of 142) ...................... 21 .....5.2
A. Environment subindex ..............................................13 ....5.31st pillar: Political and regulatory environment ..................... 4 .....5.82nd pillar: Business and innovation environment ............... 34 .....4.7
B. Readiness subindex .................................................18 ....5.83rd pillar: Infrastructure and digital content ........................ 12 .....6.44th pillar: Affordability ........................................................ 48 .....5.65th pillar: Skills ................................................................... 33 .....5.3
C. Usage subindex ........................................................10 ....5.66th pillar: Individual usage .................................................... 4 .....6.57th pillar: Business usage .................................................. 16 .....5.08th pillar: Government usage ............................................. 13 .....5.4
D. Impact subindex .......................................................21 ....4.89th pillar: Economic impacts .............................................. 25 .....4.510th pillar: Social impacts .................................................. 20 .....5.2
Luxembourg3: Country/Economy Profiles
218 | The Global Information Technology Report 2013
Note: Indicators followed by an asterisk (*) are measured on a 1-to-7 (best) scale. For further details and explanation, please refer to the section “How to Read the Country/Economy Profiles” on page 139.
Luxembourg High-income group average
1. Political and regulatory environment
6. Individual usage
5. Skills7. Business usage
4. Affordability8. Governmentusage
3. Infrastructure anddigital content
9. Economicimpacts
2. Business and innovation environment
10. Socialimpacts
1
2
3
4
5
6
7
@ 2013 World Economic Forum

The Networked Readiness Index in detailINDICATOR RANK /144 VALUE
1st pillar: Political and regulatory environment1.01 Effectiveness of law-making bodies* ..................68 ......... 3.61.02 Laws relating to ICTs* ........................................62 ......... 4.11.03 Judicial independence* ....................................105 ......... 2.81.04 Efficiency of legal system in settling disputes* ..108 ......... 3.21.05 Efficiency of legal system in challenging regs* ..107 ......... 3.11.06 Intellectual property protection* ..........................73 ......... 3.51.07 Software piracy rate, % software installed ..........62 .......... 661.08 No. procedures to enforce a contract ................68 .......... 371.09 No. days to enforce a contract ..........................20 ........ 370
2nd pillar: Business and innovation environment2.01 Availability of latest technologies* .......................96 ......... 4.62.02 Venture capital availability* .................................91 ......... 2.32.03 Total tax rate, % profits ........................................1 ......... 9.42.04 No. days to start a business ................................2 ............ 22.05 No. procedures to start a business ......................3 ............ 22.06 Intensity of local competition* ...........................119 ......... 4.12.07 Tertiary education gross enrollment rate, % ........67 ....... 38.62.08 Quality of management schools* ......................106 ......... 3.72.09 Gov’t procurement of advanced tech* .............102 ......... 3.2
3rd pillar: Infrastructure and digital content3.01 Electricity production, kWh/capita ......................61 .. 3,319.83.02 Mobile network coverage, % pop ......................28 ....... 99.93.03 Int’l Internet bandwidth, kb/s per user................68 ....... 17.93.04 Secure Internet servers/million pop ....................66 ....... 28.63.05 Accessibility of digital content* ...........................60 ......... 5.1
4th pillar: Affordability 4.01 Mobile cellular tariffs, PPP $/min. .....................106 ....... 0.424.02 Fixed broadband Internet tariffs, PPP $/month ..67 ..... 32.084.03 Internet & telephony competition, 0–2 (best) ....123 ....... 1.00
5th pillar: Skills5.01 Quality of educational system* ...........................88 ......... 3.4
5.02 Quality of math & science education* .................67 ......... 4.1 5.03 Secondary education gross enrollment rate, % ..85 ....... 83.75.04 Adult literacy rate, % ..........................................54 ....... 97.3
INDICATOR RANK /144 VALUE
6th pillar: Individual usage 6.01 Mobile phone subscriptions/100 pop. ................69 ..... 107.2 6.02 Individuals using Internet, %...............................46 ....... 56.7 6.03 Households w/ personal computer, % ...............52 ....... 53.6 6.04 Households w/ Internet access, % ....................52 ....... 46.1 6.05 Broadband Internet subscriptions/100 pop. .......47 ....... 12.6 6.06 Mobile broadband subscriptions/100 pop. .........57 ....... 18.1 6.07 Use of virtual social networks* ...........................42 ......... 5.8
7th pillar: Business usage 7.01 Firm-level technology absorption* ....................133 ......... 3.8 7.02 Capacity for innovation* .....................................99 ......... 2.8 7.03 PCT patents, applications/million pop. ..............70 ......... 0.7 7.04 Business-to-business Internet use* ....................71 ......... 4.9 7.05 Business-to-consumer Internet use* ................105 ......... 3.9 7.06 Extent of staff training* .....................................126 ......... 3.1
8th pillar: Government usage 8.01 Importance of ICTs to gov’t vision* .....................61 ......... 4.1 8.02 Government Online Service Index, 0–1 (best) .....82 ....... 0.45 8.03 Gov’t success in ICT promotion* ........................33 ......... 5.0
9th pillar: Economic impacts 9.01 Impact of ICTs on new services and products* 110 ......... 3.8 9.02 ICT PCT patents, applications/million pop. .......62 ......... 0.2 9.03 Impact of ICTs on new organizational models* .115 ......... 3.5 9.04 Knowledge-intensive jobs, % workforce .............52 ....... 25.5
10th pillar: Social impacts 10.01 Impact of ICTs on access to basic services* ......71 ......... 4.2 10.02 Internet access in schools* ................................46 ......... 4.8 10.03 ICT use & gov’t efficiency* .................................63 ......... 4.3 10.04 E-Participation Index, 0–1 (best).........................81 ....... 0.13
Rank Score (out of 144) (1–7)
Networked Readiness Index 2013 ..............67 ..3.9Networked Readiness Index 2012 (out of 142) ...................... 66 .....3.9
A. Environment subindex ..............................................59 ....4.01st pillar: Political and regulatory environment ................... 80 .....3.62nd pillar: Business and innovation environment ............... 49 .....4.5
B. Readiness subindex .................................................84 ....4.43rd pillar: Infrastructure and digital content ........................ 69 .....4.04th pillar: Affordability ........................................................ 94 .....4.45th pillar: Skills ................................................................... 77 .....4.7
C. Usage subindex ........................................................61 ....3.86th pillar: Individual usage .................................................. 52 .....4.17th pillar: Business usage ................................................ 123 .....2.98th pillar: Government usage ............................................. 54 .....4.3
D. Impact subindex .......................................................78 ....3.49th pillar: Economic impacts .............................................. 92 .....3.010th pillar: Social impacts .................................................. 70 .....3.8
Macedonia, FYR3: Country/Economy Profiles
The Global Information Technology Report 2013 | 219
Note: Indicators followed by an asterisk (*) are measured on a 1-to-7 (best) scale. For further details and explanation, please refer to the section “How to Read the Country/Economy Profiles” on page 139.
Macedonia, FYR Upper-middle-income group average
1. Political and regulatory environment
6. Individual usage
5. Skills7. Business usage
4. Affordability8. Governmentusage
3. Infrastructure anddigital content
9. Economicimpacts
2. Business and innovation environment
10. Socialimpacts
1
2
3
4
5
6
7
@ 2013 World Economic Forum

The Networked Readiness Index in detailINDICATOR RANK /144 VALUE
1st pillar: Political and regulatory environment1.01 Effectiveness of law-making bodies* ................129 ......... 2.41.02 Laws relating to ICTs* ......................................132 ......... 2.71.03 Judicial independence* ....................................135 ......... 2.21.04 Efficiency of legal system in settling disputes* ..125 ......... 2.71.05 Efficiency of legal system in challenging regs* ..123 ......... 2.81.06 Intellectual property protection* ........................135 ......... 2.41.07 Software piracy rate, % software installed .........n/a ......... n/a1.08 No. procedures to enforce a contract ................78 .......... 381.09 No. days to enforce a contract ........................123 ........ 871
2nd pillar: Business and innovation environment2.01 Availability of latest technologies* .....................128 ......... 3.9
2.02 Venture capital availability* .................................71 ......... 2.5 2.03 Total tax rate, % profits ......................................66 ....... 36.0 2.04 No. days to start a business ..............................34 ............ 8 2.05 No. procedures to start a business ......................3 ............ 2 2.06 Intensity of local competition* ...........................100 ......... 4.4 2.07 Tertiary education gross enrollment rate, % ......130 ......... 4.1 2.08 Quality of management schools* ........................90 ......... 3.9 2.09 Gov’t procurement of advanced tech* .............111 ......... 3.1
3rd pillar: Infrastructure and digital content 3.01 Electricity production, kWh/capita ....................136 ....... 67.1 3.02 Mobile network coverage, % pop ....................135 ....... 23.0 3.03 Int’l Internet bandwidth, kb/s per user..............137 ......... 0.6 3.04 Secure Internet servers/million pop ..................136 ......... 0.5 3.05 Accessibility of digital content* .........................123 ......... 3.7
4th pillar: Affordability 4.01 Mobile cellular tariffs, PPP $/min. .....................103 ....... 0.40 4.02 Fixed broadband Internet tariffs, PPP $/month 121 ..... 81.28 4.03 Internet & telephony competition, 0–2 (best) ........1 ....... 2.00
5th pillar: Skills 5.01 Quality of educational system* .........................117 ......... 3.0 5.02 Quality of math & science education* .................82 ......... 3.8 5.03 Secondary education gross enrollment rate, % 134 ....... 31.1 5.04 Adult literacy rate, % ........................................119 ....... 64.5
INDICATOR RANK /144 VALUE
6th pillar: Individual usage 6.01 Mobile phone subscriptions/100 pop. ..............137 ....... 40.7 6.02 Individuals using Internet, %.............................138 ......... 1.9 6.03 Households w/ personal computer, % .............138 ......... 1.4 6.04 Households w/ Internet access, % ..................134 ......... 0.7 6.05 Broadband Internet subscriptions/100 pop. .....133 ......... 0.0 6.06 Mobile broadband subscriptions/100 pop. .......122 ......... 0.1 6.07 Use of virtual social networks* ...........................91 ......... 5.2
7th pillar: Business usage 7.01 Firm-level technology absorption* ....................132 ......... 3.8 7.02 Capacity for innovation* .....................................97 ......... 2.8 7.03 PCT patents, applications/million pop. ............112 ......... 0.0 7.04 Business-to-business Internet use* ..................110 ......... 4.4 7.05 Business-to-consumer Internet use* ................113 ......... 3.7 7.06 Extent of staff training* .....................................113 ......... 3.4
8th pillar: Government usage 8.01 Importance of ICTs to gov’t vision* ...................134 ......... 2.7 8.02 Government Online Service Index, 0–1 (best) ...107 ....... 0.32 8.03 Gov’t success in ICT promotion* ......................118 ......... 3.5
9th pillar: Economic impacts 9.01 Impact of ICTs on new services and products* 125 ......... 3.6 9.02 ICT PCT patents, applications/million pop. .......95 ......... 0.0 9.03 Impact of ICTs on new organizational models* .121 ......... 3.4 9.04 Knowledge-intensive jobs, % workforce ...........109 ......... 2.4
10th pillar: Social impacts 10.01 Impact of ICTs on access to basic services* ....120 ......... 3.4 10.02 Internet access in schools* ..............................133 ......... 2.2 10.03 ICT use & gov’t efficiency* ...............................128 ......... 3.2 10.04 E-Participation Index, 0–1 (best).......................111 ....... 0.03
Rank Score (out of 144) (1–7)
Networked Readiness Index 2013 ............137 ..2.7Networked Readiness Index 2012 (out of 142) .................... 134 .....2.7
A. Environment subindex ............................................125 ....3.31st pillar: Political and regulatory environment ................. 134 .....2.72nd pillar: Business and innovation environment ............. 104 .....3.8
B. Readiness subindex ...............................................137 ....2.63rd pillar: Infrastructure and digital content ...................... 143 .....1.64th pillar: Affordability ...................................................... 121 .....2.95th pillar: Skills ................................................................. 127 .....3.3
C. Usage subindex ......................................................133 ....2.66th pillar: Individual usage ................................................ 132 .....1.67th pillar: Business usage ................................................ 118 .....3.08th pillar: Government usage ........................................... 131 .....3.1
D. Impact subindex .....................................................135 ....2.49th pillar: Economic impacts ............................................ 139 .....2.310th pillar: Social impacts ................................................ 130 .....2.5
Madagascar3: Country/Economy Profiles
220 | The Global Information Technology Report 2013
Note: Indicators followed by an asterisk (*) are measured on a 1-to-7 (best) scale. For further details and explanation, please refer to the section “How to Read the Country/Economy Profiles” on page 139.
Madagascar Low-income group average
1. Political and regulatory environment
6. Individual usage
5. Skills7. Business usage
4. Affordability8. Governmentusage
3. Infrastructure anddigital content
9. Economicimpacts
2. Business and innovation environment
10. Socialimpacts
1
2
3
4
5
6
7
@ 2013 World Economic Forum

The Networked Readiness Index in detailINDICATOR RANK /144 VALUE
1st pillar: Political and regulatory environment1.01 Effectiveness of law-making bodies* ..................76 ......... 3.51.02 Laws relating to ICTs* ......................................108 ......... 3.21.03 Judicial independence* ......................................54 ......... 4.11.04 Efficiency of legal system in settling disputes* ....52 ......... 4.01.05 Efficiency of legal system in challenging regs* ....51 ......... 3.91.06 Intellectual property protection* ..........................72 ......... 3.61.07 Software piracy rate, % software installed .........n/a ......... n/a1.08 No. procedures to enforce a contract ..............116 .......... 421.09 No. days to enforce a contract ..........................48 ........ 432
2nd pillar: Business and innovation environment2.01 Availability of latest technologies* .....................120 ......... 4.12.02 Venture capital availability* ...............................125 ......... 2.02.03 Total tax rate, % profits ......................................57 ....... 34.72.04 No. days to start a business ............................120 .......... 392.05 No. procedures to start a business ..................114 .......... 102.06 Intensity of local competition* ...........................126 ......... 3.92.07 Tertiary education gross enrollment rate, % ......139 ......... 0.82.08 Quality of management schools* ......................100 ......... 3.72.09 Gov’t procurement of advanced tech* ...............91 ......... 3.3
3rd pillar: Infrastructure and digital content3.01 Electricity production, kWh/capita ....................126 ..... 120.23.02 Mobile network coverage, % pop ....................108 ....... 85.03.03 Int’l Internet bandwidth, kb/s per user..............115 ......... 3.83.04 Secure Internet servers/million pop ..................141 ......... 0.43.05 Accessibility of digital content* .........................113 ......... 4.1
4th pillar: Affordability4.01 Mobile cellular tariffs, PPP $/min. .....................138 ....... 0.904.02 Fixed broadband Internet tariffs, PPP $/month 138 1,463.324.03 Internet & telephony competition, 0–2 (best) ....118 ....... 1.13
5th pillar: Skills5.01 Quality of educational system* ...........................65 ......... 3.85.02 Quality of math & science education* .................96 ......... 3.65.03 Secondary education gross enrollment rate, % 133 ....... 34.25.04 Adult literacy rate, % ........................................108 ....... 74.8
INDICATOR RANK /144 VALUE
6th pillar: Individual usage 6.01 Mobile phone subscriptions/100 pop. ..............142 ....... 25.7 6.02 Individuals using Internet, %.............................132 ......... 3.3 6.03 Households w/ personal computer, % .............119 ......... 4.5 6.04 Households w/ Internet access, % ..................114 ......... 2.9 6.05 Broadband Internet subscriptions/100 pop. .....127 ......... 0.1 6.06 Mobile broadband subscriptions/100 pop. .........95 ......... 3.1 6.07 Use of virtual social networks* .........................120 ......... 4.7
7th pillar: Business usage 7.01 Firm-level technology absorption* ....................134 ......... 3.8 7.02 Capacity for innovation* ...................................100 ......... 2.8 7.03 PCT patents, applications/million pop. ............119 ......... 0.0 7.04 Business-to-business Internet use* ..................106 ......... 4.5 7.05 Business-to-consumer Internet use* ................124 ......... 3.4 7.06 Extent of staff training* .......................................94 ......... 3.7
8th pillar: Government usage 8.01 Importance of ICTs to gov’t vision* ...................100 ......... 3.5 8.02 Government Online Service Index, 0–1 (best) ...125 ....... 0.22 8.03 Gov’t success in ICT promotion* ........................93 ......... 4.0
9th pillar: Economic impacts 9.01 Impact of ICTs on new services and products* 116 ......... 3.7 9.02 ICT PCT patents, applications/million pop. .......95 ......... 0.0 9.03 Impact of ICTs on new organizational models* .114 ......... 3.5 9.04 Knowledge-intensive jobs, % workforce ............n/a ......... n/a
10th pillar: Social impacts 10.01 Impact of ICTs on access to basic services* ......94 ......... 3.9 10.02 Internet access in schools* ..............................124 ......... 2.6 10.03 ICT use & gov’t efficiency* ...............................120 ......... 3.4 10.04 E-Participation Index, 0–1 (best).......................124 ....... 0.00
Rank Score (out of 144) (1–7)
Networked Readiness Index 2013 ............129 ..2.8Networked Readiness Index 2012 (out of 142) .................... 116 .....3.1
A. Environment subindex ............................................103 ....3.61st pillar: Political and regulatory environment ................... 63 .....3.82nd pillar: Business and innovation environment ............. 131 .....3.4
B. Readiness subindex ...............................................139 ....2.43rd pillar: Infrastructure and digital content ...................... 120 .....2.64th pillar: Affordability ...................................................... 140 .....1.25th pillar: Skills ................................................................. 121 .....3.5
C. Usage subindex ......................................................131 ....2.66th pillar: Individual usage ................................................ 136 .....1.67th pillar: Business usage ................................................ 121 .....3.08th pillar: Government usage ........................................... 122 .....3.3
D. Impact subindex .....................................................124 ....2.79th pillar: Economic impacts ............................................ 112 .....2.710th pillar: Social impacts ................................................ 127 .....2.7
Malawi3: Country/Economy Profiles
The Global Information Technology Report 2013 | 221
Note: Indicators followed by an asterisk (*) are measured on a 1-to-7 (best) scale. For further details and explanation, please refer to the section “How to Read the Country/Economy Profiles” on page 139.
Malawi Low-income group average
1. Political and regulatory environment
6. Individual usage
5. Skills7. Business usage
4. Affordability8. Governmentusage
3. Infrastructure anddigital content
9. Economicimpacts
2. Business and innovation environment
10. Socialimpacts
1
2
3
4
5
6
7
@ 2013 World Economic Forum

The Networked Readiness Index in detailINDICATOR RANK /144 VALUE
1st pillar: Political and regulatory environment1.01 Effectiveness of law-making bodies* ..................12 ......... 5.11.02 Laws relating to ICTs* ........................................23 ......... 5.21.03 Judicial independence* ......................................43 ......... 4.61.04 Efficiency of legal system in settling disputes* ....14 ......... 5.11.05 Efficiency of legal system in challenging regs* ....10 ......... 5.11.06 Intellectual property protection* ..........................31 ......... 4.91.07 Software piracy rate, % software installed ..........47 .......... 551.08 No. procedures to enforce a contract ................15 .......... 291.09 No. days to enforce a contract ..........................43 ........ 425
2nd pillar: Business and innovation environment2.01 Availability of latest technologies* .......................35 ......... 5.82.02 Venture capital availability* .................................11 ......... 4.02.03 Total tax rate, % profits ......................................20 ....... 24.52.04 No. days to start a business ..............................16 ............ 62.05 No. procedures to start a business ....................10 ............ 32.06 Intensity of local competition* .............................36 ......... 5.42.07 Tertiary education gross enrollment rate, % ........63 ....... 40.22.08 Quality of management schools* ........................26 ......... 5.02.09 Gov’t procurement of advanced tech* .................4 ......... 4.9
3rd pillar: Infrastructure and digital content3.01 Electricity production, kWh/capita ......................58 .. 3,759.73.02 Mobile network coverage, % pop ......................86 ....... 96.23.03 Int’l Internet bandwidth, kb/s per user................82 ....... 10.73.04 Secure Internet servers/million pop ....................57 ....... 54.43.05 Accessibility of digital content* ...........................40 ......... 5.6
4th pillar: Affordability4.01 Mobile cellular tariffs, PPP $/min. .......................43 ....... 0.194.02 Fixed broadband Internet tariffs, PPP $/month ..76 ..... 34.824.03 Internet & telephony competition, 0–2 (best) ........1 ....... 2.00
5th pillar: Skills5.01 Quality of educational system* ...........................14 ......... 5.15.02 Quality of math & science education* .................20 ......... 5.05.03 Secondary education gross enrollment rate, % 103 ....... 68.35.04 Adult literacy rate, % ..........................................72 ....... 93.1
INDICATOR RANK /144 VALUE
6th pillar: Individual usage 6.01 Mobile phone subscriptions/100 pop. ................35 ..... 127.0 6.02 Individuals using Internet, %...............................41 ....... 61.0 6.03 Households w/ personal computer, % ...............41 ....... 64.1 6.04 Households w/ Internet access, % ....................42 ....... 61.4 6.05 Broadband Internet subscriptions/100 pop. .......67 ......... 7.4 6.06 Mobile broadband subscriptions/100 pop. .........69 ....... 12.3 6.07 Use of virtual social networks* ...........................30 ......... 6.0
7th pillar: Business usage 7.01 Firm-level technology absorption* ......................29 ......... 5.6 7.02 Capacity for innovation* .....................................17 ......... 4.6 7.03 PCT patents, applications/million pop. ..............31 ....... 12.0 7.04 Business-to-business Internet use* ....................33 ......... 5.6 7.05 Business-to-consumer Internet use* ..................26 ......... 5.4 7.06 Extent of staff training* .........................................7 ......... 5.2
8th pillar: Government usage 8.01 Importance of ICTs to gov’t vision* .......................6 ......... 5.4 8.02 Government Online Service Index, 0–1 (best) .....20 ....... 0.79 8.03 Gov’t success in ICT promotion* ........................10 ......... 5.5
9th pillar: Economic impacts 9.01 Impact of ICTs on new services and products* ..13 ......... 5.5 9.02 ICT PCT patents, applications/million pop. .......27 ......... 6.1 9.03 Impact of ICTs on new organizational models* .....9 ......... 5.3 9.04 Knowledge-intensive jobs, % workforce .............51 ....... 26.8
10th pillar: Social impacts 10.01 Impact of ICTs on access to basic services* ......26 ......... 5.4 10.02 Internet access in schools* ................................38 ......... 5.1 10.03 ICT use & gov’t efficiency* ...................................8 ......... 5.6 10.04 E-Participation Index, 0–1 (best).........................31 ....... 0.50
Rank Score (out of 144) (1–7)
Networked Readiness Index 2013 ..............30 ..4.8Networked Readiness Index 2012 (out of 142) ...................... 29 .....4.8
A. Environment subindex ..............................................18 ....5.11st pillar: Political and regulatory environment ................... 24 .....4.92nd pillar: Business and innovation environment ............... 16 .....5.3
B. Readiness subindex .................................................57 ....4.93rd pillar: Infrastructure and digital content ........................ 73 .....3.84th pillar: Affordability ........................................................ 50 .....5.65th pillar: Skills ................................................................... 43 .....5.2
C. Usage subindex ........................................................29 ....4.86th pillar: Individual usage .................................................. 46 .....4.47th pillar: Business usage .................................................. 26 .....4.58th pillar: Government usage ............................................... 7 .....5.6
D. Impact subindex .......................................................27 ....4.59th pillar: Economic impacts .............................................. 29 .....4.010th pillar: Social impacts .................................................. 25 .....5.0
Malaysia3: Country/Economy Profiles
222 | The Global Information Technology Report 2013
Note: Indicators followed by an asterisk (*) are measured on a 1-to-7 (best) scale. For further details and explanation, please refer to the section “How to Read the Country/Economy Profiles” on page 139.
Malaysia Upper-middle-income group average
1. Political and regulatory environment
6. Individual usage
5. Skills7. Business usage
4. Affordability8. Governmentusage
3. Infrastructure anddigital content
9. Economicimpacts
2. Business and innovation environment
10. Socialimpacts
1
2
3
4
5
6
7
@ 2013 World Economic Forum

The Networked Readiness Index in detailINDICATOR RANK /144 VALUE
1st pillar: Political and regulatory environment1.01 Effectiveness of law-making bodies* ..................80 ......... 3.41.02 Laws relating to ICTs* ......................................125 ......... 2.91.03 Judicial independence* ....................................111 ......... 2.81.04 Efficiency of legal system in settling disputes* ....85 ......... 3.51.05 Efficiency of legal system in challenging regs* ....82 ......... 3.51.06 Intellectual property protection* ........................109 ......... 2.91.07 Software piracy rate, % software installed .........n/a ......... n/a1.08 No. procedures to enforce a contract ................56 .......... 361.09 No. days to enforce a contract ..........................95 ........ 620
2nd pillar: Business and innovation environment2.01 Availability of latest technologies* .......................99 ......... 4.52.02 Venture capital availability* .................................92 ......... 2.32.03 Total tax rate, % profits ....................................116 ....... 51.72.04 No. days to start a business ..............................34 ............ 82.05 No. procedures to start a business ....................20 ............ 42.06 Intensity of local competition* ...........................110 ......... 4.22.07 Tertiary education gross enrollment rate, % ......124 ......... 6.12.08 Quality of management schools* ......................122 ......... 3.32.09 Gov’t procurement of advanced tech* ...............54 ......... 3.7
3rd pillar: Infrastructure and digital content3.01 Electricity production, kWh/capita ....................139 ....... 34.93.02 Mobile network coverage, % pop ....................136 ....... 20.03.03 Int’l Internet bandwidth, kb/s per user..............106 ......... 4.93.04 Secure Internet servers/million pop ..................127 ......... 0.93.05 Accessibility of digital content* .........................130 ......... 3.5
4th pillar: Affordability4.01 Mobile cellular tariffs, PPP $/min. .......................96 ....... 0.384.02 Fixed broadband Internet tariffs, PPP $/month 122 ..... 82.184.03 Internet & telephony competition, 0–2 (best) ....117 ....... 1.19
5th pillar: Skills5.01 Quality of educational system* .........................118 ......... 2.95.02 Quality of math & science education* ...............121 ......... 2.85.03 Secondary education gross enrollment rate, % 129 ....... 39.55.04 Adult literacy rate, % ........................................140 ....... 31.1
INDICATOR RANK /144 VALUE
6th pillar: Individual usage 6.01 Mobile phone subscriptions/100 pop. ..............119 ....... 68.3 6.02 Individuals using Internet, %.............................137 ......... 2.0 6.03 Households w/ personal computer, % .............128 ......... 3.0 6.04 Households w/ Internet access, % ..................128 ......... 1.2 6.05 Broadband Internet subscriptions/100 pop. .....135 ......... 0.0 6.06 Mobile broadband subscriptions/100 pop. .......115 ......... 0.3 6.07 Use of virtual social networks* .........................129 ......... 4.3
7th pillar: Business usage 7.01 Firm-level technology absorption* ......................87 ......... 4.5 7.02 Capacity for innovation* ...................................111 ......... 2.7 7.03 PCT patents, applications/million pop. ............123 ......... 0.0 7.04 Business-to-business Internet use* ....................75 ......... 4.9 7.05 Business-to-consumer Internet use* ................106 ......... 3.8 7.06 Extent of staff training* .....................................131 ......... 3.1
8th pillar: Government usage 8.01 Importance of ICTs to gov’t vision* .....................63 ......... 4.1 8.02 Government Online Service Index, 0–1 (best) ...107 ....... 0.32 8.03 Gov’t success in ICT promotion* ........................40 ......... 4.8
9th pillar: Economic impacts 9.01 Impact of ICTs on new services and products* ..74 ......... 4.4 9.02 ICT PCT patents, applications/million pop. .......95 ......... 0.0 9.03 Impact of ICTs on new organizational models* ...58 ......... 4.3 9.04 Knowledge-intensive jobs, % workforce ............n/a ......... n/a
10th pillar: Social impacts 10.01 Impact of ICTs on access to basic services* ......81 ......... 4.1 10.02 Internet access in schools* ..............................106 ......... 3.3 10.03 ICT use & gov’t efficiency* .................................75 ......... 4.1 10.04 E-Participation Index, 0–1 (best).......................124 ....... 0.00
Rank Score (out of 144) (1–7)
Networked Readiness Index 2013 ............122 ..3.0Networked Readiness Index 2012 (out of 142) .................... 126 .....2.9
A. Environment subindex ............................................111 ....3.51st pillar: Political and regulatory environment ................... 99 .....3.32nd pillar: Business and innovation environment ............. 114 .....3.6
B. Readiness subindex ...............................................141 ....2.33rd pillar: Infrastructure and digital content ...................... 139 .....1.74th pillar: Affordability ...................................................... 128 .....2.75th pillar: Skills ................................................................. 136 .....2.6
C. Usage subindex ......................................................115 ....2.96th pillar: Individual usage ................................................ 125 .....1.87th pillar: Business usage ................................................ 114 .....3.18th pillar: Government usage ............................................. 77 .....4.0
D. Impact subindex .......................................................93 ....3.29th pillar: Economic impacts .............................................. 71 .....3.210th pillar: Social impacts ................................................ 108 .....3.1
Mali3: Country/Economy Profiles
The Global Information Technology Report 2013 | 223
Note: Indicators followed by an asterisk (*) are measured on a 1-to-7 (best) scale. For further details and explanation, please refer to the section “How to Read the Country/Economy Profiles” on page 139.
Mali Low-income group average
1. Political and regulatory environment
6. Individual usage
5. Skills7. Business usage
4. Affordability8. Governmentusage
3. Infrastructure anddigital content
9. Economicimpacts
2. Business and innovation environment
10. Socialimpacts
1
2
3
4
5
6
7
@ 2013 World Economic Forum

The Networked Readiness Index in detailINDICATOR RANK /144 VALUE
1st pillar: Political and regulatory environment1.01 Effectiveness of law-making bodies* ..................29 ......... 4.41.02 Laws relating to ICTs* ........................................16 ......... 5.31.03 Judicial independence* ......................................35 ......... 5.01.04 Efficiency of legal system in settling disputes* ....58 ......... 3.91.05 Efficiency of legal system in challenging regs* ....68 ......... 3.71.06 Intellectual property protection* ..........................35 ......... 4.71.07 Software piracy rate, % software installed ..........30 .......... 431.08 No. procedures to enforce a contract ................99 .......... 401.09 No. days to enforce a contract ..........................62 ........ 505
2nd pillar: Business and innovation environment2.01 Availability of latest technologies* .......................21 ......... 6.22.02 Venture capital availability* .................................36 ......... 3.12.03 Total tax rate, % profits ......................................85 ....... 41.62.04 No. days to start a business ............................123 .......... 402.05 No. procedures to start a business ..................123 .......... 112.06 Intensity of local competition* .............................10 ......... 5.82.07 Tertiary education gross enrollment rate, % ........71 ....... 35.32.08 Quality of management schools* ........................28 ......... 5.02.09 Gov’t procurement of advanced tech* ...............44 ......... 3.9
3rd pillar: Infrastructure and digital content3.01 Electricity production, kWh/capita ......................42 .. 5,234.43.02 Mobile network coverage, % pop ........................1 ..... 100.03.03 Int’l Internet bandwidth, kb/s per user................33 ....... 47.83.04 Secure Internet servers/million pop ......................9 .. 1,661.13.05 Accessibility of digital content* ...........................19 ......... 6.2
4th pillar: Affordability4.01 Mobile cellular tariffs, PPP $/min. .....................122 ....... 0.544.02 Fixed broadband Internet tariffs, PPP $/month ..38 ..... 24.814.03 Internet & telephony competition, 0–2 (best) ........1 ....... 2.00
5th pillar: Skills5.01 Quality of educational system* ...........................16 ......... 5.05.02 Quality of math & science education* .................15 ......... 5.25.03 Secondary education gross enrollment rate, % ..33 ..... 100.95.04 Adult literacy rate, % ..........................................76 ....... 92.4
INDICATOR RANK /144 VALUE
6th pillar: Individual usage 6.01 Mobile phone subscriptions/100 pop. ................39 ..... 124.9 6.02 Individuals using Internet, %...............................36 ....... 69.2 6.03 Households w/ personal computer, % ...............27 ....... 76.4 6.04 Households w/ Internet access, % ....................25 ....... 75.3 6.05 Broadband Internet subscriptions/100 pop. .......15 ....... 30.9 6.06 Mobile broadband subscriptions/100 pop. .........39 ....... 32.6 6.07 Use of virtual social networks* .............................4 ......... 6.4
7th pillar: Business usage 7.01 Firm-level technology absorption* ......................32 ......... 5.5 7.02 Capacity for innovation* .....................................70 ......... 3.2 7.03 PCT patents, applications/million pop. ..............36 ......... 8.7 7.04 Business-to-business Internet use* ......................5 ......... 6.1 7.05 Business-to-consumer Internet use* ..................46 ......... 4.9 7.06 Extent of staff training* .......................................50 ......... 4.1
8th pillar: Government usage 8.01 Importance of ICTs to gov’t vision* .......................4 ......... 5.6 8.02 Government Online Service Index, 0–1 (best) .....41 ....... 0.61 8.03 Gov’t success in ICT promotion* ..........................5 ......... 5.8
9th pillar: Economic impacts 9.01 Impact of ICTs on new services and products* ..15 ......... 5.4 9.02 ICT PCT patents, applications/million pop. .......46 ......... 0.8 9.03 Impact of ICTs on new organizational models* ...29 ......... 4.8 9.04 Knowledge-intensive jobs, % workforce .............33 ....... 35.9
10th pillar: Social impacts 10.01 Impact of ICTs on access to basic services* ......14 ......... 5.8 10.02 Internet access in schools* ................................18 ......... 5.9 10.03 ICT use & gov’t efficiency* ...................................4 ......... 5.8 10.04 E-Participation Index, 0–1 (best).........................54 ....... 0.26
Rank Score (out of 144) (1–7)
Networked Readiness Index 2013 ..............28 ..4.9Networked Readiness Index 2012 (out of 142) ...................... 26 .....4.9
A. Environment subindex ..............................................39 ....4.51st pillar: Political and regulatory environment ................... 31 .....4.62nd pillar: Business and innovation environment ............... 50 .....4.5
B. Readiness subindex .................................................21 ....5.63rd pillar: Infrastructure and digital content ........................ 15 .....6.34th pillar: Affordability ........................................................ 72 .....5.15th pillar: Skills ................................................................... 26 .....5.5
C. Usage subindex ........................................................27 ....4.96th pillar: Individual usage .................................................. 22 .....5.67th pillar: Business usage .................................................. 38 .....3.88th pillar: Government usage ............................................. 16 .....5.4
D. Impact subindex .......................................................29 ....4.59th pillar: Economic impacts .............................................. 31 .....4.010th pillar: Social impacts .................................................. 26 .....5.0
Malta3: Country/Economy Profiles
224 | The Global Information Technology Report 2013
Note: Indicators followed by an asterisk (*) are measured on a 1-to-7 (best) scale. For further details and explanation, please refer to the section “How to Read the Country/Economy Profiles” on page 139.
Malta High-income group average
1. Political and regulatory environment
6. Individual usage
5. Skills7. Business usage
4. Affordability8. Governmentusage
3. Infrastructure anddigital content
9. Economicimpacts
2. Business and innovation environment
10. Socialimpacts
1
2
3
4
5
6
7
@ 2013 World Economic Forum

The Networked Readiness Index in detailINDICATOR RANK /144 VALUE
1st pillar: Political and regulatory environment1.01 Effectiveness of law-making bodies* ................104 ......... 3.01.02 Laws relating to ICTs* ......................................130 ......... 2.81.03 Judicial independence* ....................................108 ......... 2.81.04 Efficiency of legal system in settling disputes* ....92 ......... 3.31.05 Efficiency of legal system in challenging regs* ....72 ......... 3.61.06 Intellectual property protection* ........................107 ......... 2.91.07 Software piracy rate, % software installed .........n/a ......... n/a1.08 No. procedures to enforce a contract ..............131 .......... 461.09 No. days to enforce a contract ..........................20 ........ 370
2nd pillar: Business and innovation environment2.01 Availability of latest technologies* .....................116 ......... 4.22.02 Venture capital availability* ...............................119 ......... 2.12.03 Total tax rate, % profits ....................................133 ....... 68.22.04 No. days to start a business ..............................81 .......... 192.05 No. procedures to start a business ..................102 ............ 92.06 Intensity of local competition* ...........................125 ......... 3.92.07 Tertiary education gross enrollment rate, % ......128 ......... 4.42.08 Quality of management schools* ......................138 ......... 2.72.09 Gov’t procurement of advanced tech* ...............82 ......... 3.4
3rd pillar: Infrastructure and digital content3.01 Electricity production, kWh/capita ....................124 ..... 140.33.02 Mobile network coverage, % pop ....................129 ....... 62.03.03 Int’l Internet bandwidth, kb/s per user..............113 ......... 3.93.04 Secure Internet servers/million pop ..................113 ......... 2.03.05 Accessibility of digital content* .........................124 ......... 3.7
4th pillar: Affordability4.01 Mobile cellular tariffs, PPP $/min. .......................86 ....... 0.354.02 Fixed broadband Internet tariffs, PPP $/month 106 ..... 51.644.03 Internet & telephony competition, 0–2 (best) ........1 ....... 2.00
5th pillar: Skills5.01 Quality of educational system* .........................138 ......... 2.35.02 Quality of math & science education* ...............126 ......... 2.75.03 Secondary education gross enrollment rate, % 142 ....... 24.45.04 Adult literacy rate, % ........................................126 ....... 58.0
INDICATOR RANK /144 VALUE
6th pillar: Individual usage 6.01 Mobile phone subscriptions/100 pop. ................94 ....... 93.6 6.02 Individuals using Internet, %.............................128 ......... 4.5 6.03 Households w/ personal computer, % .............129 ......... 3.0 6.04 Households w/ Internet access, % ..................130 ......... 1.0 6.05 Broadband Internet subscriptions/100 pop. .....119 ......... 0.2 6.06 Mobile broadband subscriptions/100 pop. .........85 ......... 4.9 6.07 Use of virtual social networks* .........................127 ......... 4.4
7th pillar: Business usage 7.01 Firm-level technology absorption* ....................107 ......... 4.3 7.02 Capacity for innovation* ...................................108 ......... 2.7 7.03 PCT patents, applications/million pop. ............123 ......... 0.0 7.04 Business-to-business Internet use* ..................114 ......... 4.3 7.05 Business-to-consumer Internet use* ................119 ......... 3.6 7.06 Extent of staff training* .....................................141 ......... 2.7
8th pillar: Government usage 8.01 Importance of ICTs to gov’t vision* ...................120 ......... 3.2 8.02 Government Online Service Index, 0–1 (best) ...139 ....... 0.08 8.03 Gov’t success in ICT promotion* ......................109 ......... 3.7
9th pillar: Economic impacts 9.01 Impact of ICTs on new services and products* 131 ......... 3.4 9.02 ICT PCT patents, applications/million pop. .......95 ......... 0.0 9.03 Impact of ICTs on new organizational models* .136 ......... 2.9 9.04 Knowledge-intensive jobs, % workforce ............n/a ......... n/a
10th pillar: Social impacts 10.01 Impact of ICTs on access to basic services* ....139 ......... 3.0 10.02 Internet access in schools* ..............................135 ......... 2.1 10.03 ICT use & gov’t efficiency* ...............................124 ......... 3.4 10.04 E-Participation Index, 0–1 (best).......................124 ....... 0.00
Rank Score (out of 144) (1–7)
Networked Readiness Index 2013 ............135 ..2.7Networked Readiness Index 2012 (out of 142) .................... 139 .....2.5
A. Environment subindex ............................................136 ....3.11st pillar: Political and regulatory environment ................. 113 .....3.22nd pillar: Business and innovation environment ............. 140 .....3.0
B. Readiness subindex ...............................................133 ....2.83rd pillar: Infrastructure and digital content ...................... 134 .....2.04th pillar: Affordability ...................................................... 101 .....3.95th pillar: Skills ................................................................. 139 .....2.5
C. Usage subindex ......................................................132 ....2.66th pillar: Individual usage ................................................ 116 .....2.17th pillar: Business usage ................................................ 126 .....2.98th pillar: Government usage ........................................... 137 .....2.8
D. Impact subindex .....................................................134 ....2.49th pillar: Economic impacts ............................................ 130 .....2.410th pillar: Social impacts ................................................ 136 .....2.4
Mauritania3: Country/Economy Profiles
The Global Information Technology Report 2013 | 225
Note: Indicators followed by an asterisk (*) are measured on a 1-to-7 (best) scale. For further details and explanation, please refer to the section “How to Read the Country/Economy Profiles” on page 139.
Mauritania Low-income group average
1. Political and regulatory environment
6. Individual usage
5. Skills7. Business usage
4. Affordability8. Governmentusage
3. Infrastructure anddigital content
9. Economicimpacts
2. Business and innovation environment
10. Socialimpacts
1
2
3
4
5
6
7
@ 2013 World Economic Forum

The Networked Readiness Index in detailINDICATOR RANK /144 VALUE
1st pillar: Political and regulatory environment1.01 Effectiveness of law-making bodies* ..................19 ......... 4.81.02 Laws relating to ICTs* ........................................43 ......... 4.51.03 Judicial independence* ......................................34 ......... 5.11.04 Efficiency of legal system in settling disputes* ....26 ......... 4.71.05 Efficiency of legal system in challenging regs* ....30 ......... 4.51.06 Intellectual property protection* ..........................54 ......... 3.81.07 Software piracy rate, % software installed ..........48 .......... 571.08 No. procedures to enforce a contract ................56 .......... 361.09 No. days to enforce a contract ........................102 ........ 645
2nd pillar: Business and innovation environment2.01 Availability of latest technologies* .......................48 ......... 5.32.02 Venture capital availability* .................................56 ......... 2.82.03 Total tax rate, % profits ......................................32 ....... 28.52.04 No. days to start a business ..............................16 ............ 62.05 No. procedures to start a business ....................30 ............ 52.06 Intensity of local competition* .............................42 ......... 5.22.07 Tertiary education gross enrollment rate, % ........74 ....... 32.42.08 Quality of management schools* ........................76 ......... 4.12.09 Gov’t procurement of advanced tech* ...............74 ......... 3.5
3rd pillar: Infrastructure and digital content3.01 Electricity production, kWh/capita ......................77 .. 2,265.83.02 Mobile network coverage, % pop ......................51 ....... 99.03.03 Int’l Internet bandwidth, kb/s per user................76 ....... 12.73.04 Secure Internet servers/million pop ....................49 ..... 116.63.05 Accessibility of digital content* ...........................83 ......... 4.8
4th pillar: Affordability4.01 Mobile cellular tariffs, PPP $/min. .......................47 ....... 0.194.02 Fixed broadband Internet tariffs, PPP $/month ..33 ..... 22.954.03 Internet & telephony competition, 0–2 (best) ........1 ....... 2.00
5th pillar: Skills5.01 Quality of educational system* ...........................46 ......... 4.15.02 Quality of math & science education* .................49 ......... 4.35.03 Secondary education gross enrollment rate, % ..64 ....... 90.95.04 Adult literacy rate, % ..........................................94 ....... 88.5
INDICATOR RANK /144 VALUE
6th pillar: Individual usage 6.01 Mobile phone subscriptions/100 pop. ................85 ....... 99.0 6.02 Individuals using Internet, %...............................81 ....... 35.0 6.03 Households w/ personal computer, % ...............68 ....... 38.2 6.04 Households w/ Internet access, % ....................60 ....... 36.4 6.05 Broadband Internet subscriptions/100 pop. .......60 ......... 8.9 6.06 Mobile broadband subscriptions/100 pop. .........68 ....... 12.5 6.07 Use of virtual social networks* ...........................76 ......... 5.4
7th pillar: Business usage 7.01 Firm-level technology absorption* ......................55 ......... 4.9 7.02 Capacity for innovation* ...................................112 ......... 2.7 7.03 PCT patents, applications/million pop. ............103 ......... 0.1 7.04 Business-to-business Internet use* ....................48 ......... 5.3 7.05 Business-to-consumer Internet use* ..................92 ......... 4.1 7.06 Extent of staff training* .......................................37 ......... 4.3
8th pillar: Government usage 8.01 Importance of ICTs to gov’t vision* .....................48 ......... 4.3 8.02 Government Online Service Index, 0–1 (best) .....85 ....... 0.43 8.03 Gov’t success in ICT promotion* ........................22 ......... 5.1
9th pillar: Economic impacts 9.01 Impact of ICTs on new services and products* ..56 ......... 4.7 9.02 ICT PCT patents, applications/million pop. .......77 ......... 0.1 9.03 Impact of ICTs on new organizational models* ...62 ......... 4.3 9.04 Knowledge-intensive jobs, % workforce .............88 ....... 15.8
10th pillar: Social impacts 10.01 Impact of ICTs on access to basic services* ......63 ......... 4.3 10.02 Internet access in schools* ................................72 ......... 4.1 10.03 ICT use & gov’t efficiency* .................................56 ......... 4.4 10.04 E-Participation Index, 0–1 (best).........................96 ....... 0.08
Rank Score (out of 144) (1–7)
Networked Readiness Index 2013 ..............55 ..4.1Networked Readiness Index 2012 (out of 142) ...................... 53 .....4.1
A. Environment subindex ..............................................41 ....4.51st pillar: Political and regulatory environment ................... 36 .....4.42nd pillar: Business and innovation environment ............... 46 .....4.5
B. Readiness subindex .................................................54 ....5.03rd pillar: Infrastructure and digital content ........................ 77 .....3.74th pillar: Affordability ........................................................ 12 .....6.45th pillar: Skills ................................................................... 67 .....4.8
C. Usage subindex ........................................................65 ....3.76th pillar: Individual usage .................................................. 70 .....3.47th pillar: Business usage .................................................. 73 .....3.48th pillar: Government usage ............................................. 49 .....4.3
D. Impact subindex .......................................................80 ....3.39th pillar: Economic impacts .............................................. 82 .....3.110th pillar: Social impacts .................................................. 78 .....3.6
Mauritius3: Country/Economy Profiles
226 | The Global Information Technology Report 2013
Note: Indicators followed by an asterisk (*) are measured on a 1-to-7 (best) scale. For further details and explanation, please refer to the section “How to Read the Country/Economy Profiles” on page 139.
Mauritius Upper-middle-income group average
1. Political and regulatory environment
6. Individual usage
5. Skills7. Business usage
4. Affordability8. Governmentusage
3. Infrastructure anddigital content
9. Economicimpacts
2. Business and innovation environment
10. Socialimpacts
1
2
3
4
5
6
7
@ 2013 World Economic Forum

The Networked Readiness Index in detailINDICATOR RANK /144 VALUE
1st pillar: Political and regulatory environment1.01 Effectiveness of law-making bodies* ................128 ......... 2.41.02 Laws relating to ICTs* ........................................55 ......... 4.21.03 Judicial independence* ......................................88 ......... 3.41.04 Efficiency of legal system in settling disputes* ..100 ......... 3.31.05 Efficiency of legal system in challenging regs* ....85 ......... 3.41.06 Intellectual property protection* ..........................77 ......... 3.51.07 Software piracy rate, % software installed ..........48 .......... 571.08 No. procedures to enforce a contract ................78 .......... 381.09 No. days to enforce a contract ..........................40 ........ 415
2nd pillar: Business and innovation environment2.01 Availability of latest technologies* .......................52 ......... 5.32.02 Venture capital availability* .................................67 ......... 2.62.03 Total tax rate, % profits ....................................117 ....... 52.52.04 No. days to start a business ..............................43 ............ 92.05 No. procedures to start a business ....................48 ............ 62.06 Intensity of local competition* .............................75 ......... 4.8
2.07 Tertiary education gross enrollment rate, % ........80 ....... 28.02.08 Quality of management schools* ........................51 ......... 4.42.09 Gov’t procurement of advanced tech* ...............67 ......... 3.6
3rd pillar: Infrastructure and digital content3.01 Electricity production, kWh/capita ......................76 .. 2,366.73.02 Mobile network coverage, % pop ......................28 ....... 99.93.03 Int’l Internet bandwidth, kb/s per user................89 ......... 8.73.04 Secure Internet servers/million pop ....................69 ....... 26.83.05 Accessibility of digital content* ...........................84 ......... 4.8
4th pillar: Affordability 4.01 Mobile cellular tariffs, PPP $/min. .....................102 ....... 0.404.02 Fixed broadband Internet tariffs, PPP $/month ..49 ..... 28.054.03 Internet & telephony competition, 0–2 (best) ........1 ....... 2.00
5th pillar: Skills5.01 Quality of educational system* .........................100 ......... 3.25.02 Quality of math & science education* ...............124 ......... 2.85.03 Secondary education gross enrollment rate, % ..73 ....... 88.85.04 Adult literacy rate, % ..........................................73 ....... 93.1
INDICATOR RANK /144 VALUE
6th pillar: Individual usage 6.01 Mobile phone subscriptions/100 pop. ..............107 ....... 82.4 6.02 Individuals using Internet, %...............................78 ....... 36.2 6.03 Households w/ personal computer, % ...............75 ....... 30.0 6.04 Households w/ Internet access, % ....................73 ....... 23.3 6.05 Broadband Internet subscriptions/100 pop. .......57 ....... 10.2 6.06 Mobile broadband subscriptions/100 pop. .........82 ......... 6.5 6.07 Use of virtual social networks* ...........................79 ......... 5.3
7th pillar: Business usage 7.01 Firm-level technology absorption* ......................63 ......... 4.8 7.02 Capacity for innovation* .....................................75 ......... 3.1 7.03 PCT patents, applications/million pop. ..............59 ......... 1.6 7.04 Business-to-business Internet use* ....................57 ......... 5.1 7.05 Business-to-consumer Internet use* ..................69 ......... 4.6 7.06 Extent of staff training* .......................................67 ......... 4.0
8th pillar: Government usage 8.01 Importance of ICTs to gov’t vision* .....................76 ......... 3.9 8.02 Government Online Service Index, 0–1 (best) .....28 ....... 0.73 8.03 Gov’t success in ICT promotion* ........................75 ......... 4.3
9th pillar: Economic impacts 9.01 Impact of ICTs on new services and products* ..54 ......... 4.7 9.02 ICT PCT patents, applications/million pop. .......65 ......... 0.2 9.03 Impact of ICTs on new organizational models* ...45 ......... 4.5 9.04 Knowledge-intensive jobs, % workforce .............79 ....... 18.4
10th pillar: Social impacts 10.01 Impact of ICTs on access to basic services* ......70 ......... 4.2 10.02 Internet access in schools* ................................82 ......... 3.8 10.03 ICT use & gov’t efficiency* .................................57 ......... 4.4 10.04 E-Participation Index, 0–1 (best).........................25 ....... 0.58
Rank Score (out of 144) (1–7)
Networked Readiness Index 2013 ..............63 ..3.9Networked Readiness Index 2012 (out of 142) ...................... 76 .....3.8
A. Environment subindex ..............................................75 ....3.81st pillar: Political and regulatory environment ................... 79 .....3.62nd pillar: Business and innovation environment ............... 74 .....4.1
B. Readiness subindex .................................................76 ....4.53rd pillar: Infrastructure and digital content ........................ 82 .....3.54th pillar: Affordability ........................................................ 63 .....5.45th pillar: Skills ................................................................... 87 .....4.5
C. Usage subindex ........................................................66 ....3.76th pillar: Individual usage .................................................. 82 .....3.07th pillar: Business usage .................................................. 62 .....3.58th pillar: Government usage ............................................. 39 .....4.6
D. Impact subindex .......................................................52 ....3.79th pillar: Economic impacts .............................................. 72 .....3.210th pillar: Social impacts .................................................. 47 .....4.2
Mexico3: Country/Economy Profiles
The Global Information Technology Report 2013 | 227
Note: Indicators followed by an asterisk (*) are measured on a 1-to-7 (best) scale. For further details and explanation, please refer to the section “How to Read the Country/Economy Profiles” on page 139.
Mexico Upper-middle-income group average
1. Political and regulatory environment
6. Individual usage
5. Skills7. Business usage
4. Affordability8. Governmentusage
3. Infrastructure anddigital content
9. Economicimpacts
2. Business and innovation environment
10. Socialimpacts
1
2
3
4
5
6
7
@ 2013 World Economic Forum

The Networked Readiness Index in detailINDICATOR RANK /144 VALUE
1st pillar: Political and regulatory environment1.01 Effectiveness of law-making bodies* ................103 ......... 3.01.02 Laws relating to ICTs* ........................................98 ......... 3.51.03 Judicial independence* ....................................138 ......... 2.11.04 Efficiency of legal system in settling disputes* ..120 ......... 2.91.05 Efficiency of legal system in challenging regs* ..112 ......... 3.01.06 Intellectual property protection* ........................117 ......... 2.81.07 Software piracy rate, % software installed ........103 .......... 901.08 No. procedures to enforce a contract ................26 .......... 311.09 No. days to enforce a contract ..........................16 ........ 327
2nd pillar: Business and innovation environment2.01 Availability of latest technologies* .....................118 ......... 4.12.02 Venture capital availability* ...............................117 ......... 2.12.03 Total tax rate, % profits ......................................40 ....... 31.22.04 No. days to start a business ..............................43 ............ 92.05 No. procedures to start a business ....................74 ............ 72.06 Intensity of local competition* ...........................108 ......... 4.22.07 Tertiary education gross enrollment rate, % ........65 ....... 39.42.08 Quality of management schools* ......................121 ......... 3.32.09 Gov’t procurement of advanced tech* .............136 ......... 2.6
3rd pillar: Infrastructure and digital content3.01 Electricity production, kWh/capita ......................96 .. 1,009.63.02 Mobile network coverage, % pop ......................79 ....... 98.03.03 Int’l Internet bandwidth, kb/s per user................15 ....... 91.13.04 Secure Internet servers/million pop ....................78 ....... 19.73.05 Accessibility of digital content* ...........................66 ......... 5.1
4th pillar: Affordability4.01 Mobile cellular tariffs, PPP $/min. .......................76 ....... 0.314.02 Fixed broadband Internet tariffs, PPP $/month ..29 ..... 22.034.03 Internet & telephony competition, 0–2 (best) ........1 ....... 2.00
5th pillar: Skills5.01 Quality of educational system* .........................103 ......... 3.25.02 Quality of math & science education* .................64 ......... 4.15.03 Secondary education gross enrollment rate, % ..80 ....... 87.75.04 Adult literacy rate, % ..........................................42 ....... 98.5
INDICATOR RANK /144 VALUE
6th pillar: Individual usage 6.01 Mobile phone subscriptions/100 pop. ................75 ..... 104.8 6.02 Individuals using Internet, %...............................75 ....... 38.0 6.03 Households w/ personal computer, % ...............69 ....... 36.9 6.04 Households w/ Internet access, % ....................65 ....... 34.7 6.05 Broadband Internet subscriptions/100 pop. .......58 ....... 10.0 6.06 Mobile broadband subscriptions/100 pop. .........93 ......... 3.5 6.07 Use of virtual social networks* ...........................83 ......... 5.3
7th pillar: Business usage 7.01 Firm-level technology absorption* ....................128 ......... 4.0 7.02 Capacity for innovation* ...................................122 ......... 2.5 7.03 PCT patents, applications/million pop. ..............78 ......... 0.4 7.04 Business-to-business Internet use* ....................92 ......... 4.7 7.05 Business-to-consumer Internet use* ..................95 ......... 4.0 7.06 Extent of staff training* .....................................122 ......... 3.2
8th pillar: Government usage 8.01 Importance of ICTs to gov’t vision* .....................96 ......... 3.6 8.02 Government Online Service Index, 0–1 (best) .....61 ....... 0.52 8.03 Gov’t success in ICT promotion* ........................79 ......... 4.2
9th pillar: Economic impacts 9.01 Impact of ICTs on new services and products* 114 ......... 3.7 9.02 ICT PCT patents, applications/million pop. .......95 ......... 0.0 9.03 Impact of ICTs on new organizational models* .102 ......... 3.6 9.04 Knowledge-intensive jobs, % workforce .............49 ....... 28.2
10th pillar: Social impacts 10.01 Impact of ICTs on access to basic services* ....105 ......... 3.7 10.02 Internet access in schools* ................................61 ......... 4.4 10.03 ICT use & gov’t efficiency* ...............................100 ......... 3.7 10.04 E-Participation Index, 0–1 (best).........................38 ....... 0.39
Rank Score (out of 144) (1–7)
Networked Readiness Index 2013 ..............77 ..3.8Networked Readiness Index 2012 (out of 142) ...................... 78 .....3.8
A. Environment subindex ............................................109 ....3.51st pillar: Political and regulatory environment ................. 117 .....3.12nd pillar: Business and innovation environment ............... 88 .....3.9
B. Readiness subindex .................................................46 ....5.03rd pillar: Infrastructure and digital content ........................ 55 .....4.34th pillar: Affordability ........................................................ 25 .....6.15th pillar: Skills ................................................................... 78 .....4.7
C. Usage subindex ........................................................82 ....3.46th pillar: Individual usage .................................................. 72 .....3.47th pillar: Business usage ................................................ 129 .....2.98th pillar: Government usage ............................................. 76 .....4.0
D. Impact subindex .......................................................74 ....3.49th pillar: Economic impacts .............................................. 84 .....3.010th pillar: Social impacts .................................................. 65 .....3.8
Moldova3: Country/Economy Profiles
228 | The Global Information Technology Report 2013
Note: Indicators followed by an asterisk (*) are measured on a 1-to-7 (best) scale. For further details and explanation, please refer to the section “How to Read the Country/Economy Profiles” on page 139.
Moldova Lower-middle-income group average
1. Political and regulatory environment
6. Individual usage
5. Skills7. Business usage
4. Affordability8. Governmentusage
3. Infrastructure anddigital content
9. Economicimpacts
2. Business and innovation environment
10. Socialimpacts
1
2
3
4
5
6
7
@ 2013 World Economic Forum

The Networked Readiness Index in detailINDICATOR RANK /144 VALUE
1st pillar: Political and regulatory environment1.01 Effectiveness of law-making bodies* ..................89 ......... 3.21.02 Laws relating to ICTs* ......................................105 ......... 3.41.03 Judicial independence* ....................................112 ......... 2.81.04 Efficiency of legal system in settling disputes* ....94 ......... 3.31.05 Efficiency of legal system in challenging regs* ..113 ......... 3.01.06 Intellectual property protection* ........................132 ......... 2.41.07 Software piracy rate, % software installed .........n/a ......... n/a1.08 No. procedures to enforce a contract ................28 .......... 321.09 No. days to enforce a contract ..........................13 ........ 314
2nd pillar: Business and innovation environment2.01 Availability of latest technologies* .....................108 ......... 4.32.02 Venture capital availability* ...............................139 ......... 1.72.03 Total tax rate, % profits ......................................21 ....... 24.62.04 No. days to start a business ..............................56 .......... 122.05 No. procedures to start a business ....................74 ............ 72.06 Intensity of local competition* .............................86 ......... 4.62.07 Tertiary education gross enrollment rate, % ........42 ....... 57.22.08 Quality of management schools* ......................132 ......... 3.02.09 Gov’t procurement of advanced tech* .............100 ......... 3.2
3rd pillar: Infrastructure and digital content3.01 Electricity production, kWh/capita ......................88 .. 1,541.53.02 Mobile network coverage, % pop ....................106 ....... 87.93.03 Int’l Internet bandwidth, kb/s per user................30 ....... 53.63.04 Secure Internet servers/million pop ....................88 ....... 13.63.05 Accessibility of digital content* ...........................50 ......... 5.3
4th pillar: Affordability4.01 Mobile cellular tariffs, PPP $/min. .......................21 ....... 0.114.02 Fixed broadband Internet tariffs, PPP $/month ....5 ..... 14.784.03 Internet & telephony competition, 0–2 (best) ......94 ....... 1.56
5th pillar: Skills5.01 Quality of educational system* .........................136 ......... 2.45.02 Quality of math & science education* .................63 ......... 4.15.03 Secondary education gross enrollment rate, % ..59 ....... 92.65.04 Adult literacy rate, % ..........................................53 ....... 97.4
INDICATOR RANK /144 VALUE
6th pillar: Individual usage 6.01 Mobile phone subscriptions/100 pop. ................73 ..... 105.1 6.02 Individuals using Internet, %...............................98 ....... 20.0 6.03 Households w/ personal computer, % ...............85 ....... 22.3 6.04 Households w/ Internet access, % ....................99 ......... 7.7 6.05 Broadband Internet subscriptions/100 pop. .......86 ......... 3.2 6.06 Mobile broadband subscriptions/100 pop. .........60 ....... 17.3 6.07 Use of virtual social networks* ...........................85 ......... 5.3
7th pillar: Business usage 7.01 Firm-level technology absorption* ......................81 ......... 4.6 7.02 Capacity for innovation* .....................................73 ......... 3.1 7.03 PCT patents, applications/million pop. ............105 ......... 0.1 7.04 Business-to-business Internet use* ....................83 ......... 4.8 7.05 Business-to-consumer Internet use* ..................79 ......... 4.4 7.06 Extent of staff training* .......................................60 ......... 4.0
8th pillar: Government usage 8.01 Importance of ICTs to gov’t vision* .....................93 ......... 3.6 8.02 Government Online Service Index, 0–1 (best) .....45 ....... 0.59 8.03 Gov’t success in ICT promotion* ........................94 ......... 4.0
9th pillar: Economic impacts 9.01 Impact of ICTs on new services and products* ..72 ......... 4.4 9.02 ICT PCT patents, applications/million pop. .......95 ......... 0.0 9.03 Impact of ICTs on new organizational models* ...98 ......... 3.7 9.04 Knowledge-intensive jobs, % workforce .............70 ....... 20.2
10th pillar: Social impacts 10.01 Impact of ICTs on access to basic services* ......57 ......... 4.4 10.02 Internet access in schools* ................................80 ......... 3.9 10.03 ICT use & gov’t efficiency* .................................68 ......... 4.2 10.04 E-Participation Index, 0–1 (best).........................24 ....... 0.61
Rank Score (out of 144) (1–7)
Networked Readiness Index 2013 ..............59 ..4.0Networked Readiness Index 2012 (out of 142) ...................... 63 .....3.9
A. Environment subindex ..............................................76 ....3.81st pillar: Political and regulatory environment ................... 93 .....3.42nd pillar: Business and innovation environment ............... 62 .....4.3
B. Readiness subindex .................................................42 ....5.13rd pillar: Infrastructure and digital content ........................ 60 .....4.24th pillar: Affordability ........................................................ 10 .....6.45th pillar: Skills ................................................................... 72 .....4.8
C. Usage subindex ........................................................80 ....3.46th pillar: Individual usage .................................................. 90 .....2.87th pillar: Business usage .................................................. 78 .....3.48th pillar: Government usage ............................................. 66 .....4.1
D. Impact subindex .......................................................58 ....3.79th pillar: Economic impacts .............................................. 86 .....3.010th pillar: Social impacts .................................................. 43 .....4.3
Mongolia3: Country/Economy Profiles
The Global Information Technology Report 2013 | 229
Note: Indicators followed by an asterisk (*) are measured on a 1-to-7 (best) scale. For further details and explanation, please refer to the section “How to Read the Country/Economy Profiles” on page 139.
Mongolia Lower-middle-income group average
1. Political and regulatory environment
6. Individual usage
5. Skills7. Business usage
4. Affordability8. Governmentusage
3. Infrastructure anddigital content
9. Economicimpacts
2. Business and innovation environment
10. Socialimpacts
1
2
3
4
5
6
7
@ 2013 World Economic Forum

The Networked Readiness Index in detailINDICATOR RANK /144 VALUE
1st pillar: Political and regulatory environment1.01 Effectiveness of law-making bodies* ..................42 ......... 4.11.02 Laws relating to ICTs* ........................................45 ......... 4.41.03 Judicial independence* ......................................65 ......... 3.91.04 Efficiency of legal system in settling disputes* ....51 ......... 4.01.05 Efficiency of legal system in challenging regs* ....54 ......... 3.91.06 Intellectual property protection* ..........................70 ......... 3.61.07 Software piracy rate, % software installed ..........82 .......... 791.08 No. procedures to enforce a contract ..............137 .......... 491.09 No. days to enforce a contract ..........................76 ........ 545
2nd pillar: Business and innovation environment2.01 Availability of latest technologies* .......................97 ......... 4.62.02 Venture capital availability* .................................29 ......... 3.32.03 Total tax rate, % profits ......................................14 ....... 22.32.04 No. days to start a business ..............................49 .......... 102.05 No. procedures to start a business ....................48 ............ 62.06 Intensity of local competition* ...........................114 ......... 4.12.07 Tertiary education gross enrollment rate, % ........55 ....... 47.62.08 Quality of management schools* ........................59 ......... 4.32.09 Gov’t procurement of advanced tech* ...............40 ......... 3.9
3rd pillar: Infrastructure and digital content3.01 Electricity production, kWh/capita ......................54 .. 4,157.43.02 Mobile network coverage, % pop ........................1 ..... 100.03.03 Int’l Internet bandwidth, kb/s per user................18 ....... 84.63.04 Secure Internet servers/million pop ....................70 ....... 25.33.05 Accessibility of digital content* ...........................52 ......... 5.3
4th pillar: Affordability4.01 Mobile cellular tariffs, PPP $/min. .....................118 ....... 0.514.02 Fixed broadband Internet tariffs, PPP $/month ..84 ..... 36.804.03 Internet & telephony competition, 0–2 (best) ........1 ....... 2.00
5th pillar: Skills5.01 Quality of educational system* ...........................38 ......... 4.25.02 Quality of math & science education* .................44 ......... 4.45.03 Secondary education gross enrollment rate, % ..49 ....... 96.85.04 Adult literacy rate, % ..........................................43 ....... 98.4
INDICATOR RANK /144 VALUE
6th pillar: Individual usage 6.01 Mobile phone subscriptions/100 pop. ..................4 ..... 185.3 6.02 Individuals using Internet, %...............................72 ....... 40.0 6.03 Households w/ personal computer, % ...............62 ....... 46.6 6.04 Households w/ Internet access, % ....................47 ....... 51.4 6.05 Broadband Internet subscriptions/100 pop. .......64 ......... 8.3 6.06 Mobile broadband subscriptions/100 pop. .........63 ....... 15.3 6.07 Use of virtual social networks* ...........................40 ......... 5.9
7th pillar: Business usage 7.01 Firm-level technology absorption* ....................100 ......... 4.4 7.02 Capacity for innovation* .....................................53 ......... 3.3 7.03 PCT patents, applications/million pop. ............123 ......... 0.0 7.04 Business-to-business Internet use* ....................81 ......... 4.8 7.05 Business-to-consumer Internet use* ..................78 ......... 4.4 7.06 Extent of staff training* .......................................51 ......... 4.1
8th pillar: Government usage 8.01 Importance of ICTs to gov’t vision* .....................31 ......... 4.6 8.02 Government Online Service Index, 0–1 (best) .....64 ....... 0.51 8.03 Gov’t success in ICT promotion* ........................59 ......... 4.5
9th pillar: Economic impacts 9.01 Impact of ICTs on new services and products* ..59 ......... 4.6 9.02 ICT PCT patents, applications/million pop. .......95 ......... 0.0 9.03 Impact of ICTs on new organizational models* ...52 ......... 4.4 9.04 Knowledge-intensive jobs, % workforce .............32 ....... 35.9
10th pillar: Social impacts 10.01 Impact of ICTs on access to basic services* ......61 ......... 4.3 10.02 Internet access in schools* ................................60 ......... 4.4 10.03 ICT use & gov’t efficiency* .................................40 ......... 4.7 10.04 E-Participation Index, 0–1 (best).........................46 ....... 0.32
Rank Score (out of 144) (1–7)
Networked Readiness Index 2013 ..............48 ..4.2Networked Readiness Index 2012 (out of 142) ...................... 46 .....4.2
A. Environment subindex ..............................................52 ....4.21st pillar: Political and regulatory environment ................... 72 .....3.72nd pillar: Business and innovation environment ............... 41 .....4.6
B. Readiness subindex .................................................62 ....4.83rd pillar: Infrastructure and digital content ........................ 42 .....4.84th pillar: Affordability ........................................................ 93 .....4.45th pillar: Skills ................................................................... 40 .....5.3
C. Usage subindex ........................................................53 ....3.96th pillar: Individual usage .................................................. 56 .....4.07th pillar: Business usage .................................................. 71 .....3.48th pillar: Government usage ............................................. 47 .....4.4
D. Impact subindex .......................................................44 ....3.99th pillar: Economic impacts .............................................. 39 .....3.710th pillar: Social impacts .................................................. 49 .....4.1
Montenegro3: Country/Economy Profiles
230 | The Global Information Technology Report 2013
Note: Indicators followed by an asterisk (*) are measured on a 1-to-7 (best) scale. For further details and explanation, please refer to the section “How to Read the Country/Economy Profiles” on page 139.
Montenegro Upper-middle-income group average
1. Political and regulatory environment
6. Individual usage
5. Skills7. Business usage
4. Affordability8. Governmentusage
3. Infrastructure anddigital content
9. Economicimpacts
2. Business and innovation environment
10. Socialimpacts
1
2
3
4
5
6
7
@ 2013 World Economic Forum

The Networked Readiness Index in detailINDICATOR RANK /144 VALUE
1st pillar: Political and regulatory environment1.01 Effectiveness of law-making bodies* ..................64 ......... 3.61.02 Laws relating to ICTs* ........................................85 ......... 3.71.03 Judicial independence* ......................................81 ......... 3.51.04 Efficiency of legal system in settling disputes* ....54 ......... 4.01.05 Efficiency of legal system in challenging regs* ....60 ......... 3.81.06 Intellectual property protection* ..........................82 ......... 3.41.07 Software piracy rate, % software installed ..........62 .......... 661.08 No. procedures to enforce a contract ................99 .......... 401.09 No. days to enforce a contract ..........................65 ........ 510
2nd pillar: Business and innovation environment2.01 Availability of latest technologies* .......................53 ......... 5.32.02 Venture capital availability* .................................38 ......... 3.02.03 Total tax rate, % profits ....................................111 ....... 49.62.04 No. days to start a business ..............................56 .......... 122.05 No. procedures to start a business ....................48 ............ 62.06 Intensity of local competition* .............................57 ......... 5.0
2.07 Tertiary education gross enrollment rate, % ......103 ....... 13.22.08 Quality of management schools* ........................47 ......... 4.52.09 Gov’t procurement of advanced tech* ...............72 ......... 3.6
3rd pillar: Infrastructure and digital content3.01 Electricity production, kWh/capita ....................104 ..... 676.53.02 Mobile network coverage, % pop ......................51 ....... 99.03.03 Int’l Internet bandwidth, kb/s per user................93 ......... 7.63.04 Secure Internet servers/million pop ..................102 ......... 4.33.05 Accessibility of digital content* ...........................96 ......... 4.5
4th pillar: Affordability4.01 Mobile cellular tariffs, PPP $/min. .......................90 ....... 0.364.02 Fixed broadband Internet tariffs, PPP $/month ..23 ..... 19.984.03 Internet & telephony competition, 0–2 (best) ........1 ....... 2.00
5th pillar: Skills5.01 Quality of educational system* .........................105 ......... 3.15.02 Quality of math & science education* .................53 ......... 4.35.03 Secondary education gross enrollment rate, % 113 ....... 56.15.04 Adult literacy rate, % ........................................130 ....... 56.1
INDICATOR RANK /144 VALUE
6th pillar: Individual usage 6.01 Mobile phone subscriptions/100 pop. ................56 ..... 113.3 6.02 Individuals using Internet, %...............................54 ....... 51.0 6.03 Households w/ personal computer, % ...............67 ....... 39.0 6.04 Households w/ Internet access, % ....................62 ....... 35.3 6.05 Broadband Internet subscriptions/100 pop. .......94 ......... 1.8 6.06 Mobile broadband subscriptions/100 pop. .........80 ......... 8.0 6.07 Use of virtual social networks* ...........................45 ......... 5.8
7th pillar: Business usage 7.01 Firm-level technology absorption* ......................75 ......... 4.7 7.02 Capacity for innovation* ...................................115 ......... 2.6 7.03 PCT patents, applications/million pop. ..............76 ......... 0.5 7.04 Business-to-business Internet use* ....................82 ......... 4.8 7.05 Business-to-consumer Internet use* ..................91 ......... 4.2 7.06 Extent of staff training* .......................................75 ......... 3.9
8th pillar: Government usage 8.01 Importance of ICTs to gov’t vision* .....................38 ......... 4.4 8.02 Government Online Service Index, 0–1 (best) ...122 ....... 0.25 8.03 Gov’t success in ICT promotion* ........................42 ......... 4.8
9th pillar: Economic impacts 9.01 Impact of ICTs on new services and products* ..87 ......... 4.2 9.02 ICT PCT patents, applications/million pop. .......72 ......... 0.1 9.03 Impact of ICTs on new organizational models* ...89 ......... 3.9 9.04 Knowledge-intensive jobs, % workforce ...........102 ......... 6.8
10th pillar: Social impacts 10.01 Impact of ICTs on access to basic services* ......92 ......... 3.9 10.02 Internet access in schools* ................................95 ......... 3.5 10.03 ICT use & gov’t efficiency* .................................77 ......... 4.1 10.04 E-Participation Index, 0–1 (best).......................124 ....... 0.00
Rank Score (out of 144) (1–7)
Networked Readiness Index 2013 ..............89 ..3.6Networked Readiness Index 2012 (out of 142) ...................... 91 .....3.6
A. Environment subindex ..............................................74 ....3.81st pillar: Political and regulatory environment ................... 73 .....3.72nd pillar: Business and innovation environment ............... 79 .....4.0
B. Readiness subindex .................................................88 ....4.33rd pillar: Infrastructure and digital content ........................ 95 .....3.24th pillar: Affordability ........................................................ 30 .....6.05th pillar: Skills ................................................................. 114 .....3.6
C. Usage subindex ........................................................71 ....3.66th pillar: Individual usage .................................................. 67 .....3.57th pillar: Business usage .................................................. 99 .....3.28th pillar: Government usage ............................................. 81 .....3.9
D. Impact subindex .....................................................111 ....2.99th pillar: Economic impacts ............................................ 122 .....2.610th pillar: Social impacts ................................................ 105 .....3.1
Morocco3: Country/Economy Profiles
The Global Information Technology Report 2013 | 231
Note: Indicators followed by an asterisk (*) are measured on a 1-to-7 (best) scale. For further details and explanation, please refer to the section “How to Read the Country/Economy Profiles” on page 139.
Morocco Lower-middle-income group average
1. Political and regulatory environment
6. Individual usage
5. Skills7. Business usage
4. Affordability8. Governmentusage
3. Infrastructure anddigital content
9. Economicimpacts
2. Business and innovation environment
10. Socialimpacts
1
2
3
4
5
6
7
@ 2013 World Economic Forum
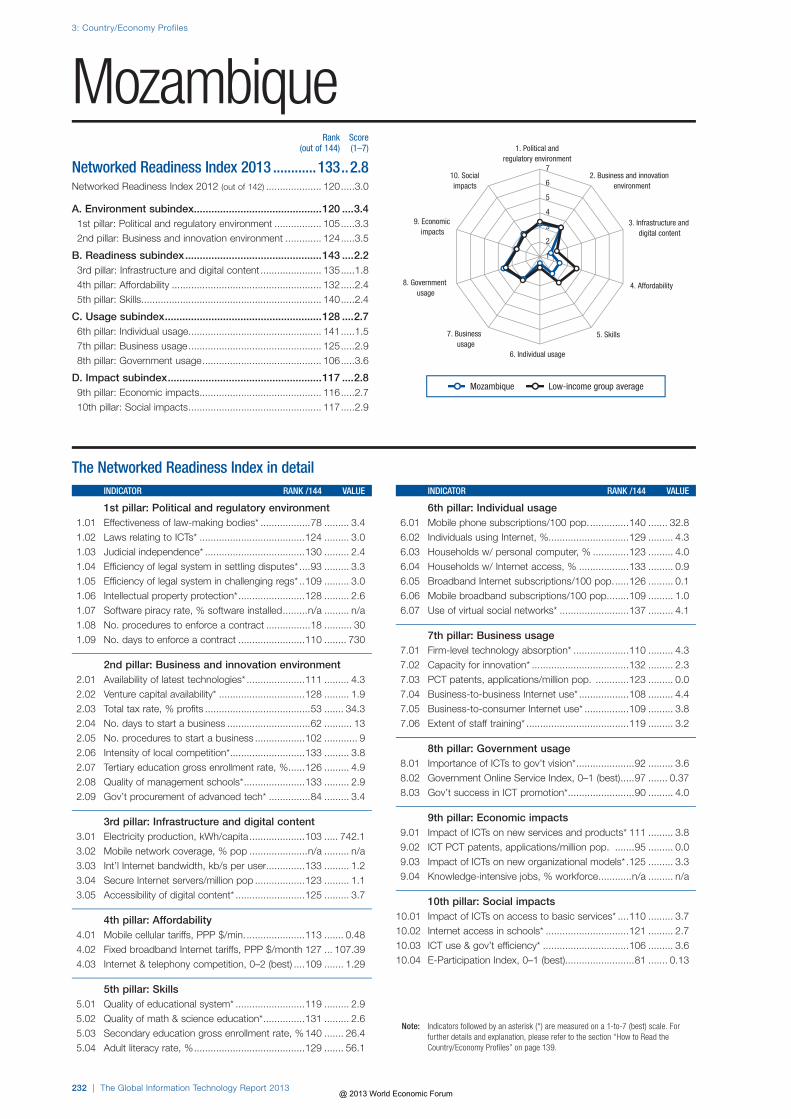
The Networked Readiness Index in detailINDICATOR RANK /144 VALUE
1st pillar: Political and regulatory environment1.01 Effectiveness of law-making bodies* ..................78 ......... 3.41.02 Laws relating to ICTs* ......................................124 ......... 3.01.03 Judicial independence* ....................................130 ......... 2.41.04 Efficiency of legal system in settling disputes* ....93 ......... 3.31.05 Efficiency of legal system in challenging regs* ..109 ......... 3.01.06 Intellectual property protection* ........................128 ......... 2.61.07 Software piracy rate, % software installed .........n/a ......... n/a1.08 No. procedures to enforce a contract ................18 .......... 301.09 No. days to enforce a contract ........................110 ........ 730
2nd pillar: Business and innovation environment2.01 Availability of latest technologies* .....................111 ......... 4.3
2.02 Venture capital availability* ...............................128 ......... 1.9 2.03 Total tax rate, % profits ......................................53 ....... 34.3 2.04 No. days to start a business ..............................62 .......... 13 2.05 No. procedures to start a business ..................102 ............ 9 2.06 Intensity of local competition* ...........................133 ......... 3.8 2.07 Tertiary education gross enrollment rate, % ......126 ......... 4.9 2.08 Quality of management schools* ......................133 ......... 2.9 2.09 Gov’t procurement of advanced tech* ...............84 ......... 3.4
3rd pillar: Infrastructure and digital content 3.01 Electricity production, kWh/capita ....................103 ..... 742.1 3.02 Mobile network coverage, % pop .....................n/a ......... n/a 3.03 Int’l Internet bandwidth, kb/s per user..............133 ......... 1.2 3.04 Secure Internet servers/million pop ..................123 ......... 1.1 3.05 Accessibility of digital content* .........................125 ......... 3.7
4th pillar: Affordability 4.01 Mobile cellular tariffs, PPP $/min. .....................113 ....... 0.48 4.02 Fixed broadband Internet tariffs, PPP $/month 127 ... 107.39 4.03 Internet & telephony competition, 0–2 (best) ....109 ....... 1.29
5th pillar: Skills 5.01 Quality of educational system* .........................119 ......... 2.9 5.02 Quality of math & science education* ...............131 ......... 2.6 5.03 Secondary education gross enrollment rate, % 140 ....... 26.4 5.04 Adult literacy rate, % ........................................129 ....... 56.1
INDICATOR RANK /144 VALUE
6th pillar: Individual usage 6.01 Mobile phone subscriptions/100 pop. ..............140 ....... 32.8 6.02 Individuals using Internet, %.............................129 ......... 4.3 6.03 Households w/ personal computer, % .............123 ......... 4.0 6.04 Households w/ Internet access, % ..................133 ......... 0.9 6.05 Broadband Internet subscriptions/100 pop. .....126 ......... 0.1 6.06 Mobile broadband subscriptions/100 pop. .......109 ......... 1.0 6.07 Use of virtual social networks* .........................137 ......... 4.1
7th pillar: Business usage 7.01 Firm-level technology absorption* ....................110 ......... 4.3 7.02 Capacity for innovation* ...................................132 ......... 2.3 7.03 PCT patents, applications/million pop. ............123 ......... 0.0 7.04 Business-to-business Internet use* ..................108 ......... 4.4 7.05 Business-to-consumer Internet use* ................109 ......... 3.8 7.06 Extent of staff training* .....................................119 ......... 3.2
8th pillar: Government usage 8.01 Importance of ICTs to gov’t vision* .....................92 ......... 3.6 8.02 Government Online Service Index, 0–1 (best) .....97 ....... 0.37 8.03 Gov’t success in ICT promotion* ........................90 ......... 4.0
9th pillar: Economic impacts 9.01 Impact of ICTs on new services and products* 111 ......... 3.8 9.02 ICT PCT patents, applications/million pop. .......95 ......... 0.0 9.03 Impact of ICTs on new organizational models* .125 ......... 3.3 9.04 Knowledge-intensive jobs, % workforce ............n/a ......... n/a
10th pillar: Social impacts 10.01 Impact of ICTs on access to basic services* ....110 ......... 3.7 10.02 Internet access in schools* ..............................121 ......... 2.7 10.03 ICT use & gov’t efficiency* ...............................106 ......... 3.6 10.04 E-Participation Index, 0–1 (best).........................81 ....... 0.13
Rank Score (out of 144) (1–7)
Networked Readiness Index 2013 ............133 ..2.8Networked Readiness Index 2012 (out of 142) .................... 120 .....3.0
A. Environment subindex ............................................120 ....3.41st pillar: Political and regulatory environment ................. 105 .....3.32nd pillar: Business and innovation environment ............. 124 .....3.5
B. Readiness subindex ...............................................143 ....2.23rd pillar: Infrastructure and digital content ...................... 135 .....1.84th pillar: Affordability ...................................................... 132 .....2.45th pillar: Skills ................................................................. 140 .....2.4
C. Usage subindex ......................................................128 ....2.76th pillar: Individual usage ................................................ 141 .....1.57th pillar: Business usage ................................................ 125 .....2.98th pillar: Government usage ........................................... 106 .....3.6
D. Impact subindex .....................................................117 ....2.89th pillar: Economic impacts ............................................ 116 .....2.710th pillar: Social impacts ................................................ 117 .....2.9
Mozambique3: Country/Economy Profiles
232 | The Global Information Technology Report 2013
Note: Indicators followed by an asterisk (*) are measured on a 1-to-7 (best) scale. For further details and explanation, please refer to the section “How to Read the Country/Economy Profiles” on page 139.
Mozambique Low-income group average
1. Political and regulatory environment
6. Individual usage
5. Skills7. Business usage
4. Affordability8. Governmentusage
3. Infrastructure anddigital content
9. Economicimpacts
2. Business and innovation environment
10. Socialimpacts
1
2
3
4
5
6
7
@ 2013 World Economic Forum

The Networked Readiness Index in detailINDICATOR RANK /144 VALUE
1st pillar: Political and regulatory environment1.01 Effectiveness of law-making bodies* ..................38 ......... 4.11.02 Laws relating to ICTs* ........................................94 ......... 3.61.03 Judicial independence* ......................................44 ......... 4.61.04 Efficiency of legal system in settling disputes* ....38 ......... 4.41.05 Efficiency of legal system in challenging regs* ....42 ......... 4.11.06 Intellectual property protection* ..........................43 ......... 4.31.07 Software piracy rate, % software installed .........n/a ......... n/a1.08 No. procedures to enforce a contract ................36 .......... 331.09 No. days to enforce a contract ............................7 ........ 270
2nd pillar: Business and innovation environment2.01 Availability of latest technologies* .......................61 ......... 5.22.02 Venture capital availability* .................................82 ......... 2.42.03 Total tax rate, % profits ......................................16 ....... 22.72.04 No. days to start a business ............................135 .......... 662.05 No. procedures to start a business ..................114 .......... 102.06 Intensity of local competition* .............................91 ......... 4.52.07 Tertiary education gross enrollment rate, % ......116 ......... 9.02.08 Quality of management schools* ......................129 ......... 3.12.09 Gov’t procurement of advanced tech* ...............90 ......... 3.3
3rd pillar: Infrastructure and digital content3.01 Electricity production, kWh/capita ....................101 ..... 777.03.02 Mobile network coverage, % pop ........................1 ..... 100.03.03 Int’l Internet bandwidth, kb/s per user..............121 ......... 2.33.04 Secure Internet servers/million pop ....................76 ....... 19.83.05 Accessibility of digital content* .........................105 ......... 4.3
4th pillar: Affordability4.01 Mobile cellular tariffs, PPP $/min. .......................65 ....... 0.274.02 Fixed broadband Internet tariffs, PPP $/month 132 ... 152.984.03 Internet & telephony competition, 0–2 (best) ......98 ....... 1.43
5th pillar: Skills5.01 Quality of educational system* .........................126 ......... 2.75.02 Quality of math & science education* ...............127 ......... 2.75.03 Secondary education gross enrollment rate, % 107 ....... 64.05.04 Adult literacy rate, % ..........................................92 ....... 88.8
INDICATOR RANK /144 VALUE
6th pillar: Individual usage 6.01 Mobile phone subscriptions/100 pop. ................91 ....... 96.4 6.02 Individuals using Internet, %.............................113 ....... 12.0 6.03 Households w/ personal computer, % ...............98 ....... 13.0 6.04 Households w/ Internet access, % ....................93 ....... 10.0 6.05 Broadband Internet subscriptions/100 pop. .....104 ......... 0.8 6.06 Mobile broadband subscriptions/100 pop. .........54 ....... 20.9 6.07 Use of virtual social networks* .........................105 ......... 4.9
7th pillar: Business usage 7.01 Firm-level technology absorption* ......................65 ......... 4.8 7.02 Capacity for innovation* .....................................90 ......... 2.9 7.03 PCT patents, applications/million pop. ............102 ......... 0.1 7.04 Business-to-business Internet use* ....................58 ......... 5.1 7.05 Business-to-consumer Internet use* ..................90 ......... 4.2 7.06 Extent of staff training* .......................................55 ......... 4.1
8th pillar: Government usage 8.01 Importance of ICTs to gov’t vision* .....................97 ......... 3.6 8.02 Government Online Service Index, 0–1 (best) ...113 ....... 0.30 8.03 Gov’t success in ICT promotion* ........................99 ......... 3.9
9th pillar: Economic impacts 9.01 Impact of ICTs on new services and products* 115 ......... 3.7 9.02 ICT PCT patents, applications/million pop. .......95 ......... 0.0 9.03 Impact of ICTs on new organizational models* .118 ......... 3.5 9.04 Knowledge-intensive jobs, % workforce .............86 ....... 16.9
10th pillar: Social impacts 10.01 Impact of ICTs on access to basic services* ....103 ......... 3.8 10.02 Internet access in schools* ..............................110 ......... 3.1 10.03 ICT use & gov’t efficiency* ...............................132 ......... 3.1 10.04 E-Participation Index, 0–1 (best).......................111 ....... 0.03
Rank Score (out of 144) (1–7)
Networked Readiness Index 2013 ............111 ..3.3Networked Readiness Index 2012 (out of 142) .................... 105 .....3.3
A. Environment subindex ..............................................58 ....4.01st pillar: Political and regulatory environment ................... 37 .....4.42nd pillar: Business and innovation environment ............. 112 .....3.7
B. Readiness subindex ...............................................115 ....3.33rd pillar: Infrastructure and digital content ...................... 102 .....3.04th pillar: Affordability ...................................................... 117 .....3.15th pillar: Skills ................................................................. 111 .....3.7
C. Usage subindex ......................................................101 ....3.16th pillar: Individual usage .................................................. 99 .....2.57th pillar: Business usage .................................................. 76 .....3.48th pillar: Government usage ........................................... 116 .....3.4
D. Impact subindex .....................................................122 ....2.79th pillar: Economic impacts ............................................ 117 .....2.710th pillar: Social impacts ................................................ 121 .....2.8
Namibia3: Country/Economy Profiles
The Global Information Technology Report 2013 | 233
Note: Indicators followed by an asterisk (*) are measured on a 1-to-7 (best) scale. For further details and explanation, please refer to the section “How to Read the Country/Economy Profiles” on page 139.
Namibia Upper-middle-income group average
1. Political and regulatory environment
6. Individual usage
5. Skills7. Business usage
4. Affordability8. Governmentusage
3. Infrastructure anddigital content
9. Economicimpacts
2. Business and innovation environment
10. Socialimpacts
1
2
3
4
5
6
7
@ 2013 World Economic Forum

The Networked Readiness Index in detailINDICATOR RANK /144 VALUE
1st pillar: Political and regulatory environment1.01 Effectiveness of law-making bodies* ................125 ......... 2.61.02 Laws relating to ICTs* ......................................131 ......... 2.71.03 Judicial independence* ......................................89 ......... 3.31.04 Efficiency of legal system in settling disputes* ..113 ......... 3.11.05 Efficiency of legal system in challenging regs* ....86 ......... 3.41.06 Intellectual property protection* ........................118 ......... 2.81.07 Software piracy rate, % software installed .........n/a ......... n/a1.08 No. procedures to enforce a contract ................90 .......... 391.09 No. days to enforce a contract ........................125 ........ 910
2nd pillar: Business and innovation environment2.01 Availability of latest technologies* .....................112 ......... 4.3
2.02 Venture capital availability* .................................83 ......... 2.4 2.03 Total tax rate, % profits ......................................42 ....... 31.5 2.04 No. days to start a business ............................106 .......... 29 2.05 No. procedures to start a business ....................74 ............ 7 2.06 Intensity of local competition* ...........................112 ......... 4.2 2.07 Tertiary education gross enrollment rate, % ......122 ......... 7.3 2.08 Quality of management schools* ......................113 ......... 3.5 2.09 Gov’t procurement of advanced tech* .............132 ......... 2.6
3rd pillar: Infrastructure and digital content 3.01 Electricity production, kWh/capita ....................129 ..... 106.0 3.02 Mobile network coverage, % pop ....................134 ....... 35.1 3.03 Int’l Internet bandwidth, kb/s per user..............131 ......... 1.5 3.04 Secure Internet servers/million pop ..................114 ......... 1.9 3.05 Accessibility of digital content* .........................119 ......... 3.8
4th pillar: Affordability 4.01 Mobile cellular tariffs, PPP $/min. .......................11 ....... 0.07 4.02 Fixed broadband Internet tariffs, PPP $/month 102 ..... 46.44 4.03 Internet & telephony competition, 0–2 (best) ........1 ....... 2.00
5th pillar: Skills 5.01 Quality of educational system* ...........................92 ......... 3.4 5.02 Quality of math & science education* .................95 ......... 3.6 5.03 Secondary education gross enrollment rate, % 125 ....... 43.5 5.04 Adult literacy rate, % ........................................124 ....... 60.3
INDICATOR RANK /144 VALUE
6th pillar: Individual usage 6.01 Mobile phone subscriptions/100 pop. ..............135 ....... 43.8 6.02 Individuals using Internet, %.............................120 ......... 9.0 6.03 Households w/ personal computer, % .............121 ......... 4.2 6.04 Households w/ Internet access, % ..................132 ......... 1.0 6.05 Broadband Internet subscriptions/100 pop. .....113 ......... 0.3 6.06 Mobile broadband subscriptions/100 pop. .......121 ......... 0.1 6.07 Use of virtual social networks* .........................126 ......... 4.4
7th pillar: Business usage 7.01 Firm-level technology absorption* ....................120 ......... 4.1 7.02 Capacity for innovation* ...................................126 ......... 2.4 7.03 PCT patents, applications/million pop. ............120 ......... 0.0 7.04 Business-to-business Internet use* ..................112 ......... 4.4 7.05 Business-to-consumer Internet use* ................111 ......... 3.8 7.06 Extent of staff training* .....................................132 ......... 3.1
8th pillar: Government usage 8.01 Importance of ICTs to gov’t vision* ...................121 ......... 3.2 8.02 Government Online Service Index, 0–1 (best) ...119 ....... 0.29 8.03 Gov’t success in ICT promotion* ......................106 ......... 3.7
9th pillar: Economic impacts 9.01 Impact of ICTs on new services and products* 122 ......... 3.6 9.02 ICT PCT patents, applications/million pop. .......95 ......... 0.0 9.03 Impact of ICTs on new organizational models* .109 ......... 3.6 9.04 Knowledge-intensive jobs, % workforce ...........105 ......... 4.8
10th pillar: Social impacts 10.01 Impact of ICTs on access to basic services* ....128 ......... 3.2 10.02 Internet access in schools* ..............................104 ......... 3.3 10.03 ICT use & gov’t efficiency* ...............................127 ......... 3.2 10.04 E-Participation Index, 0–1 (best).......................111 ....... 0.03
Rank Score (out of 144) (1–7)
Networked Readiness Index 2013 ............126 ..2.9Networked Readiness Index 2012 (out of 142) .................... 128 .....2.9
A. Environment subindex ............................................122 ....3.31st pillar: Political and regulatory environment ................. 119 .....3.12nd pillar: Business and innovation environment ............. 117 .....3.6
B. Readiness subindex ...............................................112 ....3.33rd pillar: Infrastructure and digital content ...................... 140 .....1.64th pillar: Affordability ........................................................ 69 .....5.25th pillar: Skills ................................................................. 131 .....3.2
C. Usage subindex ......................................................134 ....2.56th pillar: Individual usage ................................................ 137 .....1.57th pillar: Business usage ................................................ 127 .....2.98th pillar: Government usage ........................................... 124 .....3.2
D. Impact subindex .....................................................129 ....2.59th pillar: Economic impacts ............................................ 135 .....2.410th pillar: Social impacts ................................................ 125 .....2.7
Nepal3: Country/Economy Profiles
234 | The Global Information Technology Report 2013
Note: Indicators followed by an asterisk (*) are measured on a 1-to-7 (best) scale. For further details and explanation, please refer to the section “How to Read the Country/Economy Profiles” on page 139.
Nepal Low-income group average
1. Political and regulatory environment
6. Individual usage
5. Skills7. Business usage
4. Affordability8. Governmentusage
3. Infrastructure anddigital content
9. Economicimpacts
2. Business and innovation environment
10. Socialimpacts
1
2
3
4
5
6
7
@ 2013 World Economic Forum

The Networked Readiness Index in detailINDICATOR RANK /144 VALUE
1st pillar: Political and regulatory environment1.01 Effectiveness of law-making bodies* ..................11 ......... 5.11.02 Laws relating to ICTs* ........................................10 ......... 5.51.03 Judicial independence* ........................................3 ......... 6.41.04 Efficiency of legal system in settling disputes* ......8 ......... 5.61.05 Efficiency of legal system in challenging regs* ......3 ......... 5.61.06 Intellectual property protection* ............................5 ......... 5.91.07 Software piracy rate, % software installed ..........14 .......... 271.08 No. procedures to enforce a contract ..................5 .......... 261.09 No. days to enforce a contract ..........................70 ........ 514
2nd pillar: Business and innovation environment2.01 Availability of latest technologies* .........................4 ......... 6.52.02 Venture capital availability* .................................15 ......... 3.82.03 Total tax rate, % profits ......................................78 ....... 40.12.04 No. days to start a business ..............................10 ............ 52.05 No. procedures to start a business ....................30 ............ 52.06 Intensity of local competition* ...............................1 ......... 6.12.07 Tertiary education gross enrollment rate, % ........27 ....... 65.42.08 Quality of management schools* ..........................9 ......... 5.62.09 Gov’t procurement of advanced tech* ...............23 ......... 4.2
3rd pillar: Infrastructure and digital content3.01 Electricity production, kWh/capita ......................31 .. 6,905.33.02 Mobile network coverage, % pop ......................74 ....... 98.03.03 Int’l Internet bandwidth, kb/s per user..................7 ..... 162.53.04 Secure Internet servers/million pop ......................2 .. 2,749.83.05 Accessibility of digital content* .............................2 ......... 6.5
4th pillar: Affordability4.01 Mobile cellular tariffs, PPP $/min. .......................87 ....... 0.364.02 Fixed broadband Internet tariffs, PPP $/month ..58 ..... 29.744.03 Internet & telephony competition, 0–2 (best) ........1 ....... 2.00
5th pillar: Skills5.01 Quality of educational system* ...........................13 ......... 5.35.02 Quality of math & science education* .................12 ......... 5.45.03 Secondary education gross enrollment rate, % ....3 ..... 121.55.04 Adult literacy rate, % ..........................................15 ....... 99.0
INDICATOR RANK /144 VALUE
6th pillar: Individual usage 6.01 Mobile phone subscriptions/100 pop. ................54 ..... 115.4 6.02 Individuals using Internet, %.................................3 ....... 92.3 6.03 Households w/ personal computer, % .................2 ....... 94.2 6.04 Households w/ Internet access, % ......................2 ....... 93.6 6.05 Broadband Internet subscriptions/100 pop. .........2 ....... 38.7 6.06 Mobile broadband subscriptions/100 pop. .........19 ....... 49.2 6.07 Use of virtual social networks* .............................3 ......... 6.4
7th pillar: Business usage 7.01 Firm-level technology absorption* ......................22 ......... 5.8 7.02 Capacity for innovation* .......................................8 ......... 5.1 7.03 PCT patents, applications/million pop. ................8 ..... 180.9 7.04 Business-to-business Internet use* ....................12 ......... 6.0 7.05 Business-to-consumer Internet use* ....................4 ......... 6.0 7.06 Extent of staff training* .........................................8 ......... 5.2
8th pillar: Government usage 8.01 Importance of ICTs to gov’t vision* .....................47 ......... 4.3 8.02 Government Online Service Index, 0–1 (best) .......5 ....... 0.96 8.03 Gov’t success in ICT promotion* ........................26 ......... 5.1
9th pillar: Economic impacts 9.01 Impact of ICTs on new services and products* ....8 ......... 5.5 9.02 ICT PCT patents, applications/million pop. .........7 ....... 59.3 9.03 Impact of ICTs on new organizational models* .....5 ......... 5.4 9.04 Knowledge-intensive jobs, % workforce ...............3 ....... 47.2
10th pillar: Social impacts 10.01 Impact of ICTs on access to basic services* ........5 ......... 5.9 10.02 Internet access in schools* ..................................4 ......... 6.3 10.03 ICT use & gov’t efficiency* .................................23 ......... 5.1 10.04 E-Participation Index, 0–1 (best)...........................1 ....... 1.00
Rank Score (out of 144) (1–7)
Networked Readiness Index 2013 ................ 4 ..5.8Networked Readiness Index 2012 (out of 142) ........................ 6 .....5.6
A. Environment subindex ................................................4 ....5.51st pillar: Political and regulatory environment ..................... 6 .....5.72nd pillar: Business and innovation environment ................. 5 .....5.4
B. Readiness subindex .................................................13 ....5.93rd pillar: Infrastructure and digital content ........................ 11 .....6.54th pillar: Affordability ........................................................ 60 .....5.45th pillar: Skills ..................................................................... 8 .....5.9
C. Usage subindex ..........................................................5 ....5.86th pillar: Individual usage .................................................... 5 .....6.47th pillar: Business usage .................................................... 8 .....5.58th pillar: Government usage ............................................. 15 .....5.4
D. Impact subindex .........................................................2 ....6.09th pillar: Economic impacts ................................................ 4 .....5.910th pillar: Social impacts .................................................... 3 .....6.1
Netherlands3: Country/Economy Profiles
The Global Information Technology Report 2013 | 235
Note: Indicators followed by an asterisk (*) are measured on a 1-to-7 (best) scale. For further details and explanation, please refer to the section “How to Read the Country/Economy Profiles” on page 139.
Netherlands High-income group average
1. Political and regulatory environment
6. Individual usage
5. Skills7. Business usage
4. Affordability8. Governmentusage
3. Infrastructure anddigital content
9. Economicimpacts
2. Business and innovation environment
10. Socialimpacts
1
2
3
4
5
6
7
@ 2013 World Economic Forum

The Networked Readiness Index in detailINDICATOR RANK /144 VALUE
1st pillar: Political and regulatory environment1.01 Effectiveness of law-making bodies* ....................2 ......... 5.81.02 Laws relating to ICTs* ..........................................6 ......... 5.61.03 Judicial independence* ........................................1 ......... 6.71.04 Efficiency of legal system in settling disputes* ......3 ......... 5.91.05 Efficiency of legal system in challenging regs* ......4 ......... 5.51.06 Intellectual property protection* ............................3 ......... 6.11.07 Software piracy rate, % software installed ............4 .......... 221.08 No. procedures to enforce a contract ................18 .......... 301.09 No. days to enforce a contract ............................2 ........ 216
2nd pillar: Business and innovation environment2.01 Availability of latest technologies* .......................27 ......... 6.1
2.02 Venture capital availability* .................................24 ......... 3.5 2.03 Total tax rate, % profits ......................................49 ....... 33.5 2.04 No. days to start a business ................................1 ............ 1 2.05 No. procedures to start a business ......................1 ............ 1 2.06 Intensity of local competition* .............................24 ......... 5.5 2.07 Tertiary education gross enrollment rate, % ..........8 ....... 82.6 2.08 Quality of management schools* ........................20 ......... 5.2 2.09 Gov’t procurement of advanced tech* ...............57 ......... 3.7
3rd pillar: Infrastructure and digital content 3.01 Electricity production, kWh/capita ......................12 10,261.5 3.02 Mobile network coverage, % pop ......................81 ....... 97.0 3.03 Int’l Internet bandwidth, kb/s per user................55 ....... 23.7 3.04 Secure Internet servers/million pop ....................10 .. 1,597.4 3.05 Accessibility of digital content* ...........................32 ......... 5.9
4th pillar: Affordability 4.01 Mobile cellular tariffs, PPP $/min. .....................128 ....... 0.58 4.02 Fixed broadband Internet tariffs, PPP $/month ..82 ..... 36.72 4.03 Internet & telephony competition, 0–2 (best) ......96 ....... 1.53
5th pillar: Skills 5.01 Quality of educational system* ...........................11 ......... 5.3 5.02 Quality of math & science education* .................10 ......... 5.5 5.03 Secondary education gross enrollment rate, % ....6 ..... 119.1 5.04 Adult literacy rate, % ..........................................15 ....... 99.0
INDICATOR RANK /144 VALUE
6th pillar: Individual usage 6.01 Mobile phone subscriptions/100 pop. ................61 ..... 109.2 6.02 Individuals using Internet, %.................................9 ....... 86.0 6.03 Households w/ personal computer, % ...............16 ....... 83.9 6.04 Households w/ Internet access, % ....................16 ....... 79.0 6.05 Broadband Internet subscriptions/100 pop. .......19 ....... 25.8 6.06 Mobile broadband subscriptions/100 pop. .........16 ....... 53.1 6.07 Use of virtual social networks* ...........................13 ......... 6.2
7th pillar: Business usage 7.01 Firm-level technology absorption* ......................17 ......... 5.9 7.02 Capacity for innovation* .....................................24 ......... 4.1 7.03 PCT patents, applications/million pop. ..............22 ....... 71.9 7.04 Business-to-business Internet use* ....................11 ......... 6.0 7.05 Business-to-consumer Internet use* ..................18 ......... 5.6 7.06 Extent of staff training* .......................................18 ......... 4.8
8th pillar: Government usage 8.01 Importance of ICTs to gov’t vision* .....................16 ......... 5.1 8.02 Government Online Service Index, 0–1 (best) .....21 ....... 0.78 8.03 Gov’t success in ICT promotion* ........................25 ......... 5.1
9th pillar: Economic impacts 9.01 Impact of ICTs on new services and products* ..25 ......... 5.2 9.02 ICT PCT patents, applications/million pop. .......23 ....... 13.7 9.03 Impact of ICTs on new organizational models* ...24 ......... 4.9 9.04 Knowledge-intensive jobs, % workforce .............11 ....... 42.9
10th pillar: Social impacts 10.01 Impact of ICTs on access to basic services* ......27 ......... 5.4 10.02 Internet access in schools* ................................27 ......... 5.7 10.03 ICT use & gov’t efficiency* .................................24 ......... 5.1 10.04 E-Participation Index, 0–1 (best).........................25 ....... 0.58
Rank Score (out of 144) (1–7)
Networked Readiness Index 2013 ..............20 ..5.2Networked Readiness Index 2012 (out of 142) ...................... 14 .....5.4
A. Environment subindex ................................................2 ....5.61st pillar: Political and regulatory environment ..................... 2 .....5.92nd pillar: Business and innovation environment ................. 6 .....5.4
B. Readiness subindex .................................................30 ....5.33rd pillar: Infrastructure and digital content ........................ 17 .....6.24th pillar: Affordability ...................................................... 100 .....4.05th pillar: Skills ................................................................... 11 .....5.8
C. Usage subindex ........................................................19 ....5.26th pillar: Individual usage .................................................. 17 .....5.87th pillar: Business usage .................................................. 23 .....4.58th pillar: Government usage ............................................. 18 .....5.3
D. Impact subindex .......................................................22 ....4.89th pillar: Economic impacts .............................................. 26 .....4.510th pillar: Social impacts .................................................. 21 .....5.1
New Zealand3: Country/Economy Profiles
236 | The Global Information Technology Report 2013
Note: Indicators followed by an asterisk (*) are measured on a 1-to-7 (best) scale. For further details and explanation, please refer to the section “How to Read the Country/Economy Profiles” on page 139.
New Zealand High-income group average
1. Political and regulatory environment
6. Individual usage
5. Skills7. Business usage
4. Affordability8. Governmentusage
3. Infrastructure anddigital content
9. Economicimpacts
2. Business and innovation environment
10. Socialimpacts
1
2
3
4
5
6
7
@ 2013 World Economic Forum

The Networked Readiness Index in detailINDICATOR RANK /144 VALUE
1st pillar: Political and regulatory environment1.01 Effectiveness of law-making bodies* ................121 ......... 2.71.02 Laws relating to ICTs* ......................................115 ......... 3.21.03 Judicial independence* ....................................134 ......... 2.21.04 Efficiency of legal system in settling disputes* ..112 ......... 3.11.05 Efficiency of legal system in challenging regs* ..125 ......... 2.71.06 Intellectual property protection* ..........................98 ......... 3.11.07 Software piracy rate, % software installed ..........82 .......... 791.08 No. procedures to enforce a contract ................68 .......... 371.09 No. days to enforce a contract ..........................37 ........ 409
2nd pillar: Business and innovation environment2.01 Availability of latest technologies* .....................133 ......... 3.82.02 Venture capital availability* .................................61 ......... 2.72.03 Total tax rate, % profits ....................................128 ....... 65.02.04 No. days to start a business ............................120 .......... 392.05 No. procedures to start a business ....................88 ............ 82.06 Intensity of local competition* ...........................129 ......... 3.92.07 Tertiary education gross enrollment rate, % ........95 ....... 18.02.08 Quality of management schools* ........................98 ......... 3.82.09 Gov’t procurement of advanced tech* .............116 ......... 3.1
3rd pillar: Infrastructure and digital content3.01 Electricity production, kWh/capita ....................110 ..... 604.73.02 Mobile network coverage, % pop ........................1 ..... 100.03.03 Int’l Internet bandwidth, kb/s per user................75 ....... 12.93.04 Secure Internet servers/million pop ....................89 ....... 10.13.05 Accessibility of digital content* .........................116 ......... 4.0
4th pillar: Affordability4.01 Mobile cellular tariffs, PPP $/min. .....................139 ....... 0.964.02 Fixed broadband Internet tariffs, PPP $/month 103 ..... 46.664.03 Internet & telephony competition, 0–2 (best) ......65 ....... 1.88
5th pillar: Skills5.01 Quality of educational system* .........................121 ......... 2.85.02 Quality of math & science education* ...............128 ......... 2.75.03 Secondary education gross enrollment rate, % 102 ....... 69.45.04 Adult literacy rate, % ........................................106 ....... 78.0
INDICATOR RANK /144 VALUE
6th pillar: Individual usage 6.01 Mobile phone subscriptions/100 pop. ..............108 ....... 82.2 6.02 Individuals using Internet, %.............................118 ....... 10.6 6.03 Households w/ personal computer, % .............106 ......... 8.2 6.04 Households w/ Internet access, % ..................125 ......... 2.0 6.05 Broadband Internet subscriptions/100 pop. .......99 ......... 1.4 6.06 Mobile broadband subscriptions/100 pop. .......111 ......... 0.8 6.07 Use of virtual social networks* .........................125 ......... 4.4
7th pillar: Business usage 7.01 Firm-level technology absorption* ....................122 ......... 4.0 7.02 Capacity for innovation* .....................................87 ......... 2.9 7.03 PCT patents, applications/million pop. ............123 ......... 0.0 7.04 Business-to-business Internet use* ..................124 ......... 4.2 7.05 Business-to-consumer Internet use* ................102 ......... 3.9 7.06 Extent of staff training* .......................................97 ......... 3.6
8th pillar: Government usage 8.01 Importance of ICTs to gov’t vision* ...................125 ......... 3.1 8.02 Government Online Service Index, 0–1 (best) ...110 ....... 0.31 8.03 Gov’t success in ICT promotion* ......................112 ......... 3.7
9th pillar: Economic impacts 9.01 Impact of ICTs on new services and products* 113 ......... 3.7 9.02 ICT PCT patents, applications/million pop. .......95 ......... 0.0 9.03 Impact of ICTs on new organizational models* .111 ......... 3.6 9.04 Knowledge-intensive jobs, % workforce .............90 ....... 14.8
10th pillar: Social impacts 10.01 Impact of ICTs on access to basic services* ....114 ......... 3.5 10.02 Internet access in schools* ..............................112 ......... 3.1 10.03 ICT use & gov’t efficiency* ...............................125 ......... 3.3 10.04 E-Participation Index, 0–1 (best).........................81 ....... 0.13
Rank Score (out of 144) (1–7)
Networked Readiness Index 2013 ............125 ..2.9Networked Readiness Index 2012 (out of 142) .................... 131 .....2.8
A. Environment subindex ............................................134 ....3.11st pillar: Political and regulatory environment ................. 122 .....3.02nd pillar: Business and innovation environment ............. 136 .....3.2
B. Readiness subindex ...............................................121 ....3.13rd pillar: Infrastructure and digital content ........................ 91 .....3.34th pillar: Affordability ...................................................... 136 .....2.35th pillar: Skills ................................................................. 112 .....3.6
C. Usage subindex ......................................................124 ....2.86th pillar: Individual usage ................................................ 120 .....2.07th pillar: Business usage ................................................ 111 .....3.18th pillar: Government usage ........................................... 125 .....3.2
D. Impact subindex .....................................................118 ....2.89th pillar: Economic impacts ............................................ 120 .....2.710th pillar: Social impacts ................................................ 116 .....2.9
Nicaragua3: Country/Economy Profiles
The Global Information Technology Report 2013 | 237
Note: Indicators followed by an asterisk (*) are measured on a 1-to-7 (best) scale. For further details and explanation, please refer to the section “How to Read the Country/Economy Profiles” on page 139.
Nicaragua Lower-middle-income group average
1. Political and regulatory environment
6. Individual usage
5. Skills7. Business usage
4. Affordability8. Governmentusage
3. Infrastructure anddigital content
9. Economicimpacts
2. Business and innovation environment
10. Socialimpacts
1
2
3
4
5
6
7
@ 2013 World Economic Forum

The Networked Readiness Index in detailINDICATOR RANK /144 VALUE
1st pillar: Political and regulatory environment1.01 Effectiveness of law-making bodies* ..................66 ......... 3.61.02 Laws relating to ICTs* ........................................93 ......... 3.71.03 Judicial independence* ......................................73 ......... 3.71.04 Efficiency of legal system in settling disputes* ....48 ......... 4.11.05 Efficiency of legal system in challenging regs* ....65 ......... 3.71.06 Intellectual property protection* ........................110 ......... 2.91.07 Software piracy rate, % software installed ..........90 .......... 821.08 No. procedures to enforce a contract ................99 .......... 401.09 No. days to enforce a contract ..........................52 ........ 457
2nd pillar: Business and innovation environment2.01 Availability of latest technologies* .......................85 ......... 4.72.02 Venture capital availability* .................................72 ......... 2.52.03 Total tax rate, % profits ......................................51 ....... 33.82.04 No. days to start a business ............................114 .......... 342.05 No. procedures to start a business ....................88 ............ 82.06 Intensity of local competition* .............................92 ......... 4.52.07 Tertiary education gross enrollment rate, % ......113 ....... 10.32.08 Quality of management schools* ........................86 ......... 3.92.09 Gov’t procurement of advanced tech* ...............64 ......... 3.6
3rd pillar: Infrastructure and digital content3.01 Electricity production, kWh/capita ....................125 ..... 128.03.02 Mobile network coverage, % pop ....................101 ....... 90.03.03 Int’l Internet bandwidth, kb/s per user..............139 ......... 0.43.04 Secure Internet servers/million pop ..................115 ......... 1.73.05 Accessibility of digital content* ...........................93 ......... 4.6
4th pillar: Affordability4.01 Mobile cellular tariffs, PPP $/min. .......................97 ....... 0.384.02 Fixed broadband Internet tariffs, PPP $/month 126 ... 101.974.03 Internet & telephony competition, 0–2 (best) ........1 ....... 2.00
5th pillar: Skills5.01 Quality of educational system* ...........................83 ......... 3.55.02 Quality of math & science education* .................92 ......... 3.65.03 Secondary education gross enrollment rate, % 124 ....... 44.05.04 Adult literacy rate, % ........................................122 ....... 61.3
INDICATOR RANK /144 VALUE
6th pillar: Individual usage 6.01 Mobile phone subscriptions/100 pop. ..............124 ....... 58.6 6.02 Individuals using Internet, %...............................92 ....... 28.4 6.03 Households w/ personal computer, % .............104 ......... 9.3 6.04 Households w/ Internet access, % ..................105 ......... 4.6 6.05 Broadband Internet subscriptions/100 pop. .....121 ......... 0.1 6.06 Mobile broadband subscriptions/100 pop. .........74 ....... 10.0 6.07 Use of virtual social networks* ...........................80 ......... 5.3
7th pillar: Business usage 7.01 Firm-level technology absorption* ......................72 ......... 4.7 7.02 Capacity for innovation* .....................................63 ......... 3.2 7.03 PCT patents, applications/million pop. ............118 ......... 0.0 7.04 Business-to-business Internet use* ....................99 ......... 4.6 7.05 Business-to-consumer Internet use* ..................70 ......... 4.5 7.06 Extent of staff training* .......................................57 ......... 4.1
8th pillar: Government usage 8.01 Importance of ICTs to gov’t vision* .....................58 ......... 4.2 8.02 Government Online Service Index, 0–1 (best) ...124 ....... 0.22 8.03 Gov’t success in ICT promotion* ........................89 ......... 4.1
9th pillar: Economic impacts 9.01 Impact of ICTs on new services and products* ..52 ......... 4.7 9.02 ICT PCT patents, applications/million pop. .......94 ......... 0.0 9.03 Impact of ICTs on new organizational models* ...68 ......... 4.2 9.04 Knowledge-intensive jobs, % workforce ............n/a ......... n/a
10th pillar: Social impacts 10.01 Impact of ICTs on access to basic services* ......72 ......... 4.1 10.02 Internet access in schools* ................................99 ......... 3.5 10.03 ICT use & gov’t efficiency* .................................89 ......... 3.9 10.04 E-Participation Index, 0–1 (best).........................70 ....... 0.18
Rank Score (out of 144) (1–7)
Networked Readiness Index 2013 ............113 ..3.3Networked Readiness Index 2012 (out of 142) .................... 112 .....3.2
A. Environment subindex ..............................................94 ....3.71st pillar: Political and regulatory environment ................... 89 .....3.52nd pillar: Business and innovation environment ............. 101 .....3.8
B. Readiness subindex ...............................................123 ....3.03rd pillar: Infrastructure and digital content ...................... 115 .....2.74th pillar: Affordability ...................................................... 120 .....3.05th pillar: Skills ................................................................. 123 .....3.4
C. Usage subindex ......................................................108 ....3.06th pillar: Individual usage ................................................ 111 .....2.27th pillar: Business usage .................................................. 68 .....3.58th pillar: Government usage ........................................... 113 .....3.5
D. Impact subindex .......................................................79 ....3.39th pillar: Economic impacts .............................................. 65 .....3.310th pillar: Social impacts .................................................. 88 .....3.4
Nigeria3: Country/Economy Profiles
238 | The Global Information Technology Report 2013
Note: Indicators followed by an asterisk (*) are measured on a 1-to-7 (best) scale. For further details and explanation, please refer to the section “How to Read the Country/Economy Profiles” on page 139.
Nigeria Lower-middle-income group average
1. Political and regulatory environment
6. Individual usage
5. Skills7. Business usage
4. Affordability8. Governmentusage
3. Infrastructure anddigital content
9. Economicimpacts
2. Business and innovation environment
10. Socialimpacts
1
2
3
4
5
6
7
@ 2013 World Economic Forum

The Networked Readiness Index in detailINDICATOR RANK /144 VALUE
1st pillar: Political and regulatory environment1.01 Effectiveness of law-making bodies* ....................7 ......... 5.31.02 Laws relating to ICTs* ........................................14 ......... 5.41.03 Judicial independence* ........................................8 ......... 6.21.04 Efficiency of legal system in settling disputes* ......7 ......... 5.61.05 Efficiency of legal system in challenging regs* ......9 ......... 5.31.06 Intellectual property protection* ..........................14 ......... 5.51.07 Software piracy rate, % software installed ..........14 .......... 271.08 No. procedures to enforce a contract ................43 .......... 341.09 No. days to enforce a contract ..........................11 ........ 280
2nd pillar: Business and innovation environment2.01 Availability of latest technologies* .........................5 ......... 6.52.02 Venture capital availability* ...................................6 ......... 4.32.03 Total tax rate, % profits ......................................85 ....... 41.62.04 No. days to start a business ..............................25 ............ 72.05 No. procedures to start a business ....................30 ............ 52.06 Intensity of local competition* .............................32 ......... 5.4
2.07 Tertiary education gross enrollment rate, % ........16 ....... 74.42.08 Quality of management schools* ........................24 ......... 5.12.09 Gov’t procurement of advanced tech* ...............28 ......... 4.1
3rd pillar: Infrastructure and digital content3.01 Electricity production, kWh/capita ........................2 25,372.83.02 Mobile network coverage, % pop .....................n/a ......... n/a3.03 Int’l Internet bandwidth, kb/s per user..................9 ..... 151.33.04 Secure Internet servers/million pop ......................8 .. 1,810.63.05 Accessibility of digital content* .............................8 ......... 6.4
4th pillar: Affordability4.01 Mobile cellular tariffs, PPP $/min. .........................7 ....... 0.044.02 Fixed broadband Internet tariffs, PPP $/month ..73 ..... 33.654.03 Internet & telephony competition, 0–2 (best) ........1 ....... 2.00
5th pillar: Skills5.01 Quality of educational system* ...........................18 ......... 5.0
5.02 Quality of math & science education* .................57 ......... 4.2 5.03 Secondary education gross enrollment rate, % ..10 ..... 111.0 5.04 Adult literacy rate, % ..........................................15 ....... 99.0
INDICATOR RANK /144 VALUE
6th pillar: Individual usage 6.01 Mobile phone subscriptions/100 pop. ................53 ..... 115.6 6.02 Individuals using Internet, %.................................2 ....... 94.0 6.03 Households w/ personal computer, % .................5 ....... 91.0 6.04 Households w/ Internet access, % ......................4 ....... 92.2 6.05 Broadband Internet subscriptions/100 pop. .........6 ....... 35.4 6.06 Mobile broadband subscriptions/100 pop. ...........8 ....... 76.5 6.07 Use of virtual social networks* .............................6 ......... 6.4
7th pillar: Business usage 7.01 Firm-level technology absorption* ......................10 ......... 6.0 7.02 Capacity for innovation* .....................................14 ......... 4.7 7.03 PCT patents, applications/million pop. ..............11 ..... 144.4 7.04 Business-to-business Internet use* ......................8 ......... 6.0 7.05 Business-to-consumer Internet use* ..................13 ......... 5.7 7.06 Extent of staff training* .........................................9 ......... 5.2
8th pillar: Government usage 8.01 Importance of ICTs to gov’t vision* .....................19 ......... 4.9 8.02 Government Online Service Index, 0–1 (best) .....13 ....... 0.86 8.03 Gov’t success in ICT promotion* ........................21 ......... 5.1
9th pillar: Economic impacts 9.01 Impact of ICTs on new services and products* ..14 ......... 5.5 9.02 ICT PCT patents, applications/million pop. .......12 ....... 33.9 9.03 Impact of ICTs on new organizational models* .....8 ......... 5.4 9.04 Knowledge-intensive jobs, % workforce ...............9 ....... 43.5
10th pillar: Social impacts 10.01 Impact of ICTs on access to basic services* ......12 ......... 5.8 10.02 Internet access in schools* ................................17 ......... 5.9 10.03 ICT use & gov’t efficiency* .................................25 ......... 5.1 10.04 E-Participation Index, 0–1 (best).........................15 ....... 0.68
Rank Score (out of 144) (1–7)
Networked Readiness Index 2013 ................ 5 ..5.7Networked Readiness Index 2012 (out of 142) ........................ 7 .....5.6
A. Environment subindex ................................................9 ....5.41st pillar: Political and regulatory environment ..................... 9 .....5.52nd pillar: Business and innovation environment ............... 10 .....5.3
B. Readiness subindex ...................................................6 ....6.13rd pillar: Infrastructure and digital content .......................... 3 .....6.84th pillar: Affordability ........................................................ 23 .....6.15th pillar: Skills ................................................................... 27 .....5.5
C. Usage subindex ..........................................................7 ....5.76th pillar: Individual usage .................................................... 2 .....6.67th pillar: Business usage .................................................. 12 .....5.28th pillar: Government usage ............................................. 14 .....5.4
D. Impact subindex .......................................................11 ....5.39th pillar: Economic impacts .............................................. 13 .....5.210th pillar: Social impacts .................................................. 13 .....5.5
Norway3: Country/Economy Profiles
The Global Information Technology Report 2013 | 239
Note: Indicators followed by an asterisk (*) are measured on a 1-to-7 (best) scale. For further details and explanation, please refer to the section “How to Read the Country/Economy Profiles” on page 139.
Norway High-income group average
1. Political and regulatory environment
6. Individual usage
5. Skills7. Business usage
4. Affordability8. Governmentusage
3. Infrastructure anddigital content
9. Economicimpacts
2. Business and innovation environment
10. Socialimpacts
1
2
3
4
5
6
7
@ 2013 World Economic Forum

The Networked Readiness Index in detailINDICATOR RANK /144 VALUE
1st pillar: Political and regulatory environment1.01 Effectiveness of law-making bodies* ..................14 ......... 5.01.02 Laws relating to ICTs* ........................................36 ......... 4.81.03 Judicial independence* ......................................31 ......... 5.11.04 Efficiency of legal system in settling disputes* ....19 ......... 5.01.05 Efficiency of legal system in challenging regs* ....33 ......... 4.51.06 Intellectual property protection* ..........................25 ......... 5.21.07 Software piracy rate, % software installed ..........53 .......... 611.08 No. procedures to enforce a contract ..............142 .......... 511.09 No. days to enforce a contract ..........................91 ........ 598
2nd pillar: Business and innovation environment2.01 Availability of latest technologies* .......................46 ......... 5.42.02 Venture capital availability* .................................14 ......... 3.82.03 Total tax rate, % profits ......................................13 ....... 22.02.04 No. days to start a business ..............................34 ............ 82.05 No. procedures to start a business ....................30 ............ 52.06 Intensity of local competition* .............................47 ......... 5.12.07 Tertiary education gross enrollment rate, % ........78 ....... 28.72.08 Quality of management schools* ......................107 ......... 3.62.09 Gov’t procurement of advanced tech* ...............17 ......... 4.4
3rd pillar: Infrastructure and digital content3.01 Electricity production, kWh/capita ......................32 .. 6,571.63.02 Mobile network coverage, % pop ......................74 ....... 98.03.03 Int’l Internet bandwidth, kb/s per user................98 ......... 6.33.04 Secure Internet servers/million pop ....................60 ....... 53.43.05 Accessibility of digital content* ...........................53 ......... 5.3
4th pillar: Affordability4.01 Mobile cellular tariffs, PPP $/min. .......................34 ....... 0.164.02 Fixed broadband Internet tariffs, PPP $/month ..59 ..... 29.744.03 Internet & telephony competition, 0–2 (best) ......68 ....... 1.87
5th pillar: Skills5.01 Quality of educational system* ...........................60 ......... 3.95.02 Quality of math & science education* .................86 ......... 3.75.03 Secondary education gross enrollment rate, % ..21 ..... 104.15.04 Adult literacy rate, % ..........................................98 ....... 86.6
INDICATOR RANK /144 VALUE
6th pillar: Individual usage 6.01 Mobile phone subscriptions/100 pop. ..................8 ..... 169.0 6.02 Individuals using Internet, %...............................37 ....... 68.0 6.03 Households w/ personal computer, % ...............47 ....... 58.0 6.04 Households w/ Internet access, % ....................58 ....... 38.9 6.05 Broadband Internet subscriptions/100 pop. .......93 ......... 1.8 6.06 Mobile broadband subscriptions/100 pop. .........31 ....... 37.8 6.07 Use of virtual social networks* ...........................81 ......... 5.3
7th pillar: Business usage 7.01 Firm-level technology absorption* ......................52 ......... 5.0 7.02 Capacity for innovation* .....................................50 ......... 3.4 7.03 PCT patents, applications/million pop. ..............63 ......... 1.3 7.04 Business-to-business Internet use* ....................73 ......... 4.9 7.05 Business-to-consumer Internet use* ..................89 ......... 4.2 7.06 Extent of staff training* .......................................34 ......... 4.4
8th pillar: Government usage 8.01 Importance of ICTs to gov’t vision* .....................15 ......... 5.1 8.02 Government Online Service Index, 0–1 (best) .....35 ....... 0.67 8.03 Gov’t success in ICT promotion* ........................15 ......... 5.3
9th pillar: Economic impacts 9.01 Impact of ICTs on new services and products* ..55 ......... 4.7 9.02 ICT PCT patents, applications/million pop. .......66 ......... 0.2 9.03 Impact of ICTs on new organizational models* ...60 ......... 4.3 9.04 Knowledge-intensive jobs, % workforce .............54 ....... 24.3
10th pillar: Social impacts 10.01 Impact of ICTs on access to basic services* ......31 ......... 5.1 10.02 Internet access in schools* ................................40 ......... 5.0 10.03 ICT use & gov’t efficiency* .................................20 ......... 5.1 10.04 E-Participation Index, 0–1 (best).........................36 ....... 0.45
Rank Score (out of 144) (1–7)
Networked Readiness Index 2013 ..............40 ..4.5Networked Readiness Index 2012 (out of 142) ...................... 40 .....4.4
A. Environment subindex ..............................................37 ....4.61st pillar: Political and regulatory environment ................... 34 .....4.52nd pillar: Business and innovation environment ............... 33 .....4.7
B. Readiness subindex .................................................56 ....4.93rd pillar: Infrastructure and digital content ........................ 66 .....4.04th pillar: Affordability ........................................................ 34 .....5.95th pillar: Skills ................................................................... 68 .....4.8
C. Usage subindex ........................................................37 ....4.46th pillar: Individual usage .................................................. 50 .....4.37th pillar: Business usage .................................................. 52 .....3.68th pillar: Government usage ............................................. 21 .....5.1
D. Impact subindex .......................................................41 ....4.09th pillar: Economic impacts .............................................. 61 .....3.310th pillar: Social impacts .................................................. 34 .....4.7
Oman3: Country/Economy Profiles
240 | The Global Information Technology Report 2013
Note: Indicators followed by an asterisk (*) are measured on a 1-to-7 (best) scale. For further details and explanation, please refer to the section “How to Read the Country/Economy Profiles” on page 139.
Oman High-income group average
1. Political and regulatory environment
6. Individual usage
5. Skills7. Business usage
4. Affordability8. Governmentusage
3. Infrastructure anddigital content
9. Economicimpacts
2. Business and innovation environment
10. Socialimpacts
1
2
3
4
5
6
7
@ 2013 World Economic Forum

The Networked Readiness Index in detailINDICATOR RANK /144 VALUE
1st pillar: Political and regulatory environment1.01 Effectiveness of law-making bodies* ................102 ......... 3.01.02 Laws relating to ICTs* ......................................113 ......... 3.21.03 Judicial independence* ......................................57 ......... 4.11.04 Efficiency of legal system in settling disputes* ..109 ......... 3.11.05 Efficiency of legal system in challenging regs* ....97 ......... 3.21.06 Intellectual property protection* ........................106 ......... 3.01.07 Software piracy rate, % software installed ..........97 .......... 861.08 No. procedures to enforce a contract ..............131 .......... 461.09 No. days to enforce a contract ........................129 ........ 976
2nd pillar: Business and innovation environment2.01 Availability of latest technologies* .......................83 ......... 4.72.02 Venture capital availability* .................................55 ......... 2.82.03 Total tax rate, % profits ......................................63 ....... 35.32.04 No. days to start a business ..............................90 .......... 212.05 No. procedures to start a business ..................114 .......... 102.06 Intensity of local competition* .............................85 ......... 4.62.07 Tertiary education gross enrollment rate, % ......117 ......... 8.32.08 Quality of management schools* ........................71 ......... 4.22.09 Gov’t procurement of advanced tech* .............109 ......... 3.1
3rd pillar: Infrastructure and digital content3.01 Electricity production, kWh/capita ....................112 ..... 559.53.02 Mobile network coverage, % pop ......................99 ....... 92.03.03 Int’l Internet bandwidth, kb/s per user................91 ......... 8.23.04 Secure Internet servers/million pop ..................124 ......... 1.13.05 Accessibility of digital content* ...........................97 ......... 4.4
4th pillar: Affordability4.01 Mobile cellular tariffs, PPP $/min. .......................12 ....... 0.074.02 Fixed broadband Internet tariffs, PPP $/month ..68 ..... 32.134.03 Internet & telephony competition, 0–2 (best) ........1 ....... 2.00
5th pillar: Skills5.01 Quality of educational system* ...........................75 ......... 3.65.02 Quality of math & science education* .................88 ......... 3.75.03 Secondary education gross enrollment rate, % 132 ....... 35.05.04 Adult literacy rate, % ........................................131 ....... 54.9
INDICATOR RANK /144 VALUE
6th pillar: Individual usage 6.01 Mobile phone subscriptions/100 pop. ..............122 ....... 61.6 6.02 Individuals using Internet, %.............................120 ......... 9.0 6.03 Households w/ personal computer, % .............107 ......... 8.1 6.04 Households w/ Internet access, % ....................98 ......... 8.0 6.05 Broadband Internet subscriptions/100 pop. .....111 ......... 0.4 6.06 Mobile broadband subscriptions/100 pop. .......118 ......... 0.2 6.07 Use of virtual social networks* .........................114 ......... 4.8
7th pillar: Business usage 7.01 Firm-level technology absorption* ......................85 ......... 4.6 7.02 Capacity for innovation* .....................................60 ......... 3.3 7.03 PCT patents, applications/million pop. ............115 ......... 0.0 7.04 Business-to-business Internet use* ..................116 ......... 4.3 7.05 Business-to-consumer Internet use* ................112 ......... 3.8 7.06 Extent of staff training* .....................................112 ......... 3.4
8th pillar: Government usage 8.01 Importance of ICTs to gov’t vision* ...................117 ......... 3.2 8.02 Government Online Service Index, 0–1 (best) .....97 ....... 0.37 8.03 Gov’t success in ICT promotion* ........................77 ......... 4.3
9th pillar: Economic impacts 9.01 Impact of ICTs on new services and products* 106 ......... 3.9 9.02 ICT PCT patents, applications/million pop. .......93 ......... 0.0 9.03 Impact of ICTs on new organizational models* ...91 ......... 3.8 9.04 Knowledge-intensive jobs, % workforce .............74 ....... 19.5
10th pillar: Social impacts 10.01 Impact of ICTs on access to basic services* ....121 ......... 3.4 10.02 Internet access in schools* ................................93 ......... 3.6 10.03 ICT use & gov’t efficiency* ...............................121 ......... 3.4 10.04 E-Participation Index, 0–1 (best).........................81 ....... 0.13
Rank Score (out of 144) (1–7)
Networked Readiness Index 2013 ............105 ..3.3Networked Readiness Index 2012 (out of 142) .................... 102 .....3.4
A. Environment subindex ............................................116 ....3.41st pillar: Political and regulatory environment ................. 123 .....3.02nd pillar: Business and innovation environment ............. 102 .....3.8
B. Readiness subindex .................................................93 ....4.13rd pillar: Infrastructure and digital content ...................... 104 .....3.04th pillar: Affordability ........................................................ 21 .....6.15th pillar: Skills ................................................................. 129 .....3.2
C. Usage subindex ......................................................118 ....2.96th pillar: Individual usage ................................................ 123 .....1.87th pillar: Business usage .................................................. 91 .....3.38th pillar: Government usage ........................................... 110 .....3.6
D. Impact subindex .....................................................106 ....3.09th pillar: Economic impacts .............................................. 99 .....2.910th pillar: Social impacts ................................................ 113 .....3.1
Pakistan3: Country/Economy Profiles
The Global Information Technology Report 2013 | 241
Note: Indicators followed by an asterisk (*) are measured on a 1-to-7 (best) scale. For further details and explanation, please refer to the section “How to Read the Country/Economy Profiles” on page 139.
Pakistan Lower-middle-income group average
1. Political and regulatory environment
6. Individual usage
5. Skills7. Business usage
4. Affordability8. Governmentusage
3. Infrastructure anddigital content
9. Economicimpacts
2. Business and innovation environment
10. Socialimpacts
1
2
3
4
5
6
7
@ 2013 World Economic Forum

The Networked Readiness Index in detailINDICATOR RANK /144 VALUE
1st pillar: Political and regulatory environment1.01 Effectiveness of law-making bodies* ................113 ......... 2.81.02 Laws relating to ICTs* ........................................37 ......... 4.81.03 Judicial independence* ....................................132 ......... 2.31.04 Efficiency of legal system in settling disputes* ....47 ......... 4.11.05 Efficiency of legal system in challenging regs* ....80 ......... 3.51.06 Intellectual property protection* ..........................38 ......... 4.61.07 Software piracy rate, % software installed ..........72 .......... 721.08 No. procedures to enforce a contract ................28 .......... 321.09 No. days to enforce a contract ........................106 ........ 686
2nd pillar: Business and innovation environment2.01 Availability of latest technologies* .......................30 ......... 6.02.02 Venture capital availability* .................................17 ......... 3.72.03 Total tax rate, % profits ......................................87 ....... 42.02.04 No. days to start a business ..............................25 ............ 72.05 No. procedures to start a business ....................48 ............ 62.06 Intensity of local competition* .............................55 ......... 5.02.07 Tertiary education gross enrollment rate, % ........56 ....... 45.72.08 Quality of management schools* ........................82 ......... 4.12.09 Gov’t procurement of advanced tech* ...............11 ......... 4.5
3rd pillar: Infrastructure and digital content3.01 Electricity production, kWh/capita ......................83 .. 2,006.73.02 Mobile network coverage, % pop ......................99 ....... 92.03.03 Int’l Internet bandwidth, kb/s per user................36 ....... 44.13.04 Secure Internet servers/million pop ....................44 ..... 143.13.05 Accessibility of digital content* ...........................69 ......... 5.0
4th pillar: Affordability4.01 Mobile cellular tariffs, PPP $/min. .......................55 ....... 0.224.02 Fixed broadband Internet tariffs, PPP $/month ..45 ..... 27.324.03 Internet & telephony competition, 0–2 (best) ........1 ....... 2.00
5th pillar: Skills5.01 Quality of educational system* .........................112 ......... 3.05.02 Quality of math & science education* ...............125 ......... 2.85.03 Secondary education gross enrollment rate, % 100 ....... 73.65.04 Adult literacy rate, % ..........................................66 ....... 94.1
INDICATOR RANK /144 VALUE
6th pillar: Individual usage 6.01 Mobile phone subscriptions/100 pop. ..................3 ..... 188.6 6.02 Individuals using Internet, %...............................66 ....... 42.7 6.03 Households w/ personal computer, % ...............77 ....... 29.0 6.04 Households w/ Internet access, % ....................77 ....... 20.7 6.05 Broadband Internet subscriptions/100 pop. .......65 ......... 7.9 6.06 Mobile broadband subscriptions/100 pop. .........66 ....... 14.5 6.07 Use of virtual social networks* ...........................25 ......... 6.1
7th pillar: Business usage 7.01 Firm-level technology absorption* ......................25 ......... 5.6 7.02 Capacity for innovation* .....................................94 ......... 2.9 7.03 PCT patents, applications/million pop. ..............75 ......... 0.5 7.04 Business-to-business Internet use* ....................39 ......... 5.5 7.05 Business-to-consumer Internet use* ..................19 ......... 5.5 7.06 Extent of staff training* .......................................43 ......... 4.2
8th pillar: Government usage 8.01 Importance of ICTs to gov’t vision* .....................20 ......... 4.8 8.02 Government Online Service Index, 0–1 (best) .....76 ....... 0.46 8.03 Gov’t success in ICT promotion* ........................20 ......... 5.2
9th pillar: Economic impacts 9.01 Impact of ICTs on new services and products* ..51 ......... 4.7 9.02 ICT PCT patents, applications/million pop. .......60 ......... 0.3 9.03 Impact of ICTs on new organizational models* ...47 ......... 4.5 9.04 Knowledge-intensive jobs, % workforce .............83 ....... 17.7
10th pillar: Social impacts 10.01 Impact of ICTs on access to basic services* ......45 ......... 4.8 10.02 Internet access in schools* ................................37 ......... 5.2 10.03 ICT use & gov’t efficiency* .................................38 ......... 4.7 10.04 E-Participation Index, 0–1 (best).........................46 ....... 0.32
Rank Score (out of 144) (1–7)
Networked Readiness Index 2013 ..............46 ..4.2Networked Readiness Index 2012 (out of 142) ...................... 57 .....4.0
A. Environment subindex ..............................................48 ....4.21st pillar: Political and regulatory environment ................... 69 .....3.72nd pillar: Business and innovation environment ............... 32 .....4.8
B. Readiness subindex .................................................60 ....4.93rd pillar: Infrastructure and digital content ........................ 51 .....4.44th pillar: Affordability ........................................................ 32 .....6.05th pillar: Skills ................................................................... 99 .....4.2
C. Usage subindex ........................................................51 ....4.06th pillar: Individual usage .................................................. 65 .....3.67th pillar: Business usage .................................................. 39 .....3.88th pillar: Government usage ............................................. 37 .....4.6
D. Impact subindex .......................................................48 ....3.89th pillar: Economic impacts .............................................. 73 .....3.210th pillar: Social impacts .................................................. 39 .....4.4
Panama3: Country/Economy Profiles
242 | The Global Information Technology Report 2013
Note: Indicators followed by an asterisk (*) are measured on a 1-to-7 (best) scale. For further details and explanation, please refer to the section “How to Read the Country/Economy Profiles” on page 139.
Panama Upper-middle-income group average
1. Political and regulatory environment
6. Individual usage
5. Skills7. Business usage
4. Affordability8. Governmentusage
3. Infrastructure anddigital content
9. Economicimpacts
2. Business and innovation environment
10. Socialimpacts
1
2
3
4
5
6
7
@ 2013 World Economic Forum

The Networked Readiness Index in detailINDICATOR RANK /144 VALUE
1st pillar: Political and regulatory environment1.01 Effectiveness of law-making bodies* ................138 ......... 2.21.02 Laws relating to ICTs* ......................................123 ......... 3.01.03 Judicial independence* ....................................141 ......... 1.91.04 Efficiency of legal system in settling disputes* ..127 ......... 2.71.05 Efficiency of legal system in challenging regs* ..124 ......... 2.71.06 Intellectual property protection* ........................136 ......... 2.21.07 Software piracy rate, % software installed ..........92 .......... 831.08 No. procedures to enforce a contract ................78 .......... 381.09 No. days to enforce a contract ..........................88 ........ 591
2nd pillar: Business and innovation environment2.01 Availability of latest technologies* .....................100 ......... 4.52.02 Venture capital availability* .................................70 ......... 2.62.03 Total tax rate, % profits ......................................60 ....... 35.02.04 No. days to start a business ............................116 .......... 352.05 No. procedures to start a business ....................74 ............ 72.06 Intensity of local competition* .............................73 ......... 4.82.07 Tertiary education gross enrollment rate, % ........72 ....... 34.62.08 Quality of management schools* ......................124 ......... 3.32.09 Gov’t procurement of advanced tech* .............125 ......... 2.9
3rd pillar: Infrastructure and digital content3.01 Electricity production, kWh/capita ......................19 .. 8,666.03.02 Mobile network coverage, % pop ......................97 ....... 94.03.03 Int’l Internet bandwidth, kb/s per user................86 ......... 9.53.04 Secure Internet servers/million pop ....................90 ......... 9.73.05 Accessibility of digital content* .........................106 ......... 4.3
4th pillar: Affordability4.01 Mobile cellular tariffs, PPP $/min. .......................62 ....... 0.264.02 Fixed broadband Internet tariffs, PPP $/month ..69 ..... 32.434.03 Internet & telephony competition, 0–2 (best) ........1 ....... 2.00
5th pillar: Skills5.01 Quality of educational system* .........................133 ......... 2.55.02 Quality of math & science education* ...............140 ......... 2.25.03 Secondary education gross enrollment rate, % 104 ....... 67.95.04 Adult literacy rate, % ..........................................68 ....... 93.9
INDICATOR RANK /144 VALUE
6th pillar: Individual usage 6.01 Mobile phone subscriptions/100 pop. ................83 ....... 99.4 6.02 Individuals using Internet, %...............................94 ....... 23.9 6.03 Households w/ personal computer, % ...............83 ....... 22.7 6.04 Households w/ Internet access, % ....................78 ....... 19.3 6.05 Broadband Internet subscriptions/100 pop. .....103 ......... 0.9 6.06 Mobile broadband subscriptions/100 pop. .........88 ......... 4.4 6.07 Use of virtual social networks* .........................106 ......... 4.9
7th pillar: Business usage 7.01 Firm-level technology absorption* ....................102 ......... 4.3 7.02 Capacity for innovation* ...................................109 ......... 2.7 7.03 PCT patents, applications/million pop. ..............92 ......... 0.1 7.04 Business-to-business Internet use* ..................113 ......... 4.4 7.05 Business-to-consumer Internet use* ..................87 ......... 4.2 7.06 Extent of staff training* .....................................107 ......... 3.5
8th pillar: Government usage 8.01 Importance of ICTs to gov’t vision* ...................133 ......... 2.7 8.02 Government Online Service Index, 0–1 (best) .....79 ....... 0.46 8.03 Gov’t success in ICT promotion* ......................126 ......... 3.3
9th pillar: Economic impacts 9.01 Impact of ICTs on new services and products* ..99 ......... 4.0 9.02 ICT PCT patents, applications/million pop. .......80 ......... 0.0 9.03 Impact of ICTs on new organizational models* ...97 ......... 3.8 9.04 Knowledge-intensive jobs, % workforce .............92 ....... 14.0
10th pillar: Social impacts 10.01 Impact of ICTs on access to basic services* ....125 ......... 3.3 10.02 Internet access in schools* ..............................131 ......... 2.4 10.03 ICT use & gov’t efficiency* ...............................119 ......... 3.4 10.04 E-Participation Index, 0–1 (best).........................76 ....... 0.16
Rank Score (out of 144) (1–7)
Networked Readiness Index 2013 ............104 ..3.4Networked Readiness Index 2012 (out of 142) .................... 111 .....3.3
A. Environment subindex ............................................124 ....3.31st pillar: Political and regulatory environment ................. 138 .....2.72nd pillar: Business and innovation environment ............... 89 .....3.9
B. Readiness subindex .................................................78 ....4.43rd pillar: Infrastructure and digital content ........................ 67 .....4.04th pillar: Affordability ........................................................ 52 .....5.55th pillar: Skills ................................................................. 107 .....3.7
C. Usage subindex ......................................................110 ....3.06th pillar: Individual usage .................................................. 97 .....2.77th pillar: Business usage ................................................ 110 .....3.18th pillar: Government usage ........................................... 123 .....3.3
D. Impact subindex .....................................................121 ....2.89th pillar: Economic impacts ............................................ 109 .....2.810th pillar: Social impacts ................................................ 122 .....2.8
Paraguay3: Country/Economy Profiles
The Global Information Technology Report 2013 | 243
Note: Indicators followed by an asterisk (*) are measured on a 1-to-7 (best) scale. For further details and explanation, please refer to the section “How to Read the Country/Economy Profiles” on page 139.
Paraguay Lower-middle-income group average
1. Political and regulatory environment
6. Individual usage
5. Skills7. Business usage
4. Affordability8. Governmentusage
3. Infrastructure anddigital content
9. Economicimpacts
2. Business and innovation environment
10. Socialimpacts
1
2
3
4
5
6
7
@ 2013 World Economic Forum

The Networked Readiness Index in detailINDICATOR RANK /144 VALUE
1st pillar: Political and regulatory environment1.01 Effectiveness of law-making bodies* ................142 ......... 2.01.02 Laws relating to ICTs* ........................................84 ......... 3.71.03 Judicial independence* ....................................125 ......... 2.51.04 Efficiency of legal system in settling disputes* ..118 ......... 3.01.05 Efficiency of legal system in challenging regs* ..105 ......... 3.11.06 Intellectual property protection* ........................127 ......... 2.61.07 Software piracy rate, % software installed ..........65 .......... 671.08 No. procedures to enforce a contract ..............110 .......... 411.09 No. days to enforce a contract ..........................46 ........ 428
2nd pillar: Business and innovation environment2.01 Availability of latest technologies* .......................75 ......... 4.92.02 Venture capital availability* .................................46 ......... 2.92.03 Total tax rate, % profits ......................................80 ....... 40.52.04 No. days to start a business ..............................99 .......... 262.05 No. procedures to start a business ....................30 ............ 52.06 Intensity of local competition* .............................49 ......... 5.12.07 Tertiary education gross enrollment rate, % ........59 ....... 43.02.08 Quality of management schools* ........................49 ......... 4.52.09 Gov’t procurement of advanced tech* ...............99 ......... 3.2
3rd pillar: Infrastructure and digital content3.01 Electricity production, kWh/capita ......................91 .. 1,229.13.02 Mobile network coverage, % pop ........................1 ..... 100.03.03 Int’l Internet bandwidth, kb/s per user................87 ......... 9.33.04 Secure Internet servers/million pop ....................80 ....... 18.63.05 Accessibility of digital content* .........................102 ......... 4.4
4th pillar: Affordability4.01 Mobile cellular tariffs, PPP $/min. .....................140 ....... 1.234.02 Fixed broadband Internet tariffs, PPP $/month 107 ..... 52.114.03 Internet & telephony competition, 0–2 (best) ........1 ....... 2.00
5th pillar: Skills5.01 Quality of educational system* .........................132 ......... 2.55.02 Quality of math & science education* ...............141 ......... 2.15.03 Secondary education gross enrollment rate, % ..62 ....... 91.25.04 Adult literacy rate, % ..........................................89 ....... 89.6
INDICATOR RANK /144 VALUE
6th pillar: Individual usage 6.01 Mobile phone subscriptions/100 pop. ................59 ..... 110.4 6.02 Individuals using Internet, %...............................77 ....... 36.5 6.03 Households w/ personal computer, % ...............82 ....... 23.0 6.04 Households w/ Internet access, % ....................83 ....... 14.0 6.05 Broadband Internet subscriptions/100 pop. .......81 ......... 4.0 6.06 Mobile broadband subscriptions/100 pop. .......106 ......... 1.4 6.07 Use of virtual social networks* ...........................98 ......... 5.1
7th pillar: Business usage 7.01 Firm-level technology absorption* ......................79 ......... 4.7 7.02 Capacity for innovation* ...................................103 ......... 2.8 7.03 PCT patents, applications/million pop. ..............82 ......... 0.2 7.04 Business-to-business Internet use* ....................79 ......... 4.8 7.05 Business-to-consumer Internet use* ..................67 ......... 4.6 7.06 Extent of staff training* .......................................84 ......... 3.8
8th pillar: Government usage 8.01 Importance of ICTs to gov’t vision* ...................112 ......... 3.4 8.02 Government Online Service Index, 0–1 (best) .....61 ....... 0.52 8.03 Gov’t success in ICT promotion* ........................96 ......... 4.0
9th pillar: Economic impacts 9.01 Impact of ICTs on new services and products* ..62 ......... 4.6 9.02 ICT PCT patents, applications/million pop. .......85 ......... 0.0 9.03 Impact of ICTs on new organizational models* ...48 ......... 4.5 9.04 Knowledge-intensive jobs, % workforce .............78 ....... 18.5
10th pillar: Social impacts 10.01 Impact of ICTs on access to basic services* ......85 ......... 4.0 10.02 Internet access in schools* ................................89 ......... 3.7 10.03 ICT use & gov’t efficiency* .................................99 ......... 3.8 10.04 E-Participation Index, 0–1 (best).........................38 ....... 0.39
Rank Score (out of 144) (1–7)
Networked Readiness Index 2013 ............103 ..3.4Networked Readiness Index 2012 (out of 142) .................... 106 .....3.3
A. Environment subindex ..............................................91 ....3.71st pillar: Political and regulatory environment ................. 121 .....3.02nd pillar: Business and innovation environment ............... 57 .....4.3
B. Readiness subindex ...............................................119 ....3.13rd pillar: Infrastructure and digital content ........................ 86 .....3.34th pillar: Affordability ...................................................... 138 .....1.95th pillar: Skills ................................................................. 100 .....4.1
C. Usage subindex ........................................................91 ....3.36th pillar: Individual usage .................................................. 87 .....2.97th pillar: Business usage .................................................. 93 .....3.38th pillar: Government usage ............................................. 90 .....3.8
D. Impact subindex .......................................................72 ....3.49th pillar: Economic impacts .............................................. 77 .....3.210th pillar: Social impacts .................................................. 74 .....3.7
Peru3: Country/Economy Profiles
244 | The Global Information Technology Report 2013
Note: Indicators followed by an asterisk (*) are measured on a 1-to-7 (best) scale. For further details and explanation, please refer to the section “How to Read the Country/Economy Profiles” on page 139.
Peru Upper-middle-income group average
1. Political and regulatory environment
6. Individual usage
5. Skills7. Business usage
4. Affordability8. Governmentusage
3. Infrastructure anddigital content
9. Economicimpacts
2. Business and innovation environment
10. Socialimpacts
1
2
3
4
5
6
7
@ 2013 World Economic Forum

The Networked Readiness Index in detailINDICATOR RANK /144 VALUE
1st pillar: Political and regulatory environment1.01 Effectiveness of law-making bodies* ..................93 ......... 3.21.02 Laws relating to ICTs* ........................................66 ......... 4.11.03 Judicial independence* ......................................99 ......... 3.01.04 Efficiency of legal system in settling disputes* ..107 ......... 3.21.05 Efficiency of legal system in challenging regs* ..102 ......... 3.21.06 Intellectual property protection* ..........................87 ......... 3.21.07 Software piracy rate, % software installed ..........70 .......... 701.08 No. procedures to enforce a contract ................68 .......... 371.09 No. days to enforce a contract ........................121 ........ 842
2nd pillar: Business and innovation environment2.01 Availability of latest technologies* .......................56 ......... 5.22.02 Venture capital availability* .................................62 ......... 2.72.03 Total tax rate, % profits ....................................104 ....... 46.62.04 No. days to start a business ............................118 .......... 362.05 No. procedures to start a business ..................142 .......... 162.06 Intensity of local competition* .............................50 ......... 5.12.07 Tertiary education gross enrollment rate, % ........79 ....... 28.22.08 Quality of management schools* ........................39 ......... 4.72.09 Gov’t procurement of advanced tech* .............107 ......... 3.1
3rd pillar: Infrastructure and digital content3.01 Electricity production, kWh/capita ....................105 ..... 675.23.02 Mobile network coverage, % pop ......................51 ....... 99.03.03 Int’l Internet bandwidth, kb/s per user................77 ....... 12.43.04 Secure Internet servers/million pop ....................97 ......... 7.53.05 Accessibility of digital content* ...........................74 ......... 4.9
4th pillar: Affordability4.01 Mobile cellular tariffs, PPP $/min. .......................73 ....... 0.294.02 Fixed broadband Internet tariffs, PPP $/month ..95 ..... 40.304.03 Internet & telephony competition, 0–2 (best) ........1 ....... 2.00
5th pillar: Skills5.01 Quality of educational system* ...........................45 ......... 4.1
5.02 Quality of math & science education* .................98 ......... 3.6 5.03 Secondary education gross enrollment rate, % ..84 ....... 84.85.04 Adult literacy rate, % ..........................................61 ....... 95.4
INDICATOR RANK /144 VALUE
6th pillar: Individual usage 6.01 Mobile phone subscriptions/100 pop. ................84 ....... 99.3 6.02 Individuals using Internet, %...............................91 ....... 29.0 6.03 Households w/ personal computer, % ...............97 ....... 13.1 6.04 Households w/ Internet access, % ....................91 ....... 10.1 6.05 Broadband Internet subscriptions/100 pop. .......92 ......... 1.9 6.06 Mobile broadband subscriptions/100 pop. .........94 ......... 3.4 6.07 Use of virtual social networks* ...........................27 ......... 6.0
7th pillar: Business usage 7.01 Firm-level technology absorption* ......................46 ......... 5.2 7.02 Capacity for innovation* .....................................86 ......... 2.9 7.03 PCT patents, applications/million pop. ..............80 ......... 0.3 7.04 Business-to-business Internet use* ....................51 ......... 5.2 7.05 Business-to-consumer Internet use* ..................51 ......... 4.8 7.06 Extent of staff training* .......................................32 ......... 4.6
8th pillar: Government usage 8.01 Importance of ICTs to gov’t vision* .....................85 ......... 3.7 8.02 Government Online Service Index, 0–1 (best) .....67 ....... 0.50 8.03 Gov’t success in ICT promotion* ........................71 ......... 4.4
9th pillar: Economic impacts 9.01 Impact of ICTs on new services and products* ..43 ......... 4.8 9.02 ICT PCT patents, applications/million pop. .......74 ......... 0.1 9.03 Impact of ICTs on new organizational models* ...33 ......... 4.8 9.04 Knowledge-intensive jobs, % workforce .............72 ....... 19.7
10th pillar: Social impacts 10.01 Impact of ICTs on access to basic services* ......79 ......... 4.1 10.02 Internet access in schools* ................................73 ......... 4.1 10.03 ICT use & gov’t efficiency* .................................83 ......... 4.1 10.04 E-Participation Index, 0–1 (best).........................62 ....... 0.21
Rank Score (out of 144) (1–7)
Networked Readiness Index 2013 ..............86 ..3.7Networked Readiness Index 2012 (out of 142) ...................... 86 .....3.6
A. Environment subindex ............................................100 ....3.61st pillar: Political and regulatory environment ................... 98 .....3.42nd pillar: Business and innovation environment ............. 100 .....3.8
B. Readiness subindex .................................................85 ....4.43rd pillar: Infrastructure and digital content ........................ 84 .....3.44th pillar: Affordability ........................................................ 82 .....4.95th pillar: Skills ................................................................... 73 .....4.8
C. Usage subindex ........................................................76 ....3.56th pillar: Individual usage .................................................. 95 .....2.77th pillar: Business usage .................................................. 47 .....3.78th pillar: Government usage ............................................. 67 .....4.0
D. Impact subindex .......................................................68 ....3.59th pillar: Economic impacts .............................................. 56 .....3.410th pillar: Social impacts .................................................. 76 .....3.6
Philippines3: Country/Economy Profiles
The Global Information Technology Report 2013 | 245
Note: Indicators followed by an asterisk (*) are measured on a 1-to-7 (best) scale. For further details and explanation, please refer to the section “How to Read the Country/Economy Profiles” on page 139.
Philippines Lower-middle-income group average
1. Political and regulatory environment
6. Individual usage
5. Skills7. Business usage
4. Affordability8. Governmentusage
3. Infrastructure anddigital content
9. Economicimpacts
2. Business and innovation environment
10. Socialimpacts
1
2
3
4
5
6
7
@ 2013 World Economic Forum

The Networked Readiness Index in detailINDICATOR RANK /144 VALUE
1st pillar: Political and regulatory environment1.01 Effectiveness of law-making bodies* ..................82 ......... 3.31.02 Laws relating to ICTs* ........................................91 ......... 3.71.03 Judicial independence* ......................................50 ......... 4.21.04 Efficiency of legal system in settling disputes* ..111 ......... 3.11.05 Efficiency of legal system in challenging regs* ..103 ......... 3.21.06 Intellectual property protection* ..........................67 ......... 3.61.07 Software piracy rate, % software installed ..........40 .......... 531.08 No. procedures to enforce a contract ................36 .......... 331.09 No. days to enforce a contract ........................105 ........ 685
2nd pillar: Business and innovation environment2.01 Availability of latest technologies* .......................95 ......... 4.62.02 Venture capital availability* .................................90 ......... 2.42.03 Total tax rate, % profits ......................................95 ....... 43.82.04 No. days to start a business ............................108 .......... 322.05 No. procedures to start a business ....................48 ............ 62.06 Intensity of local competition* .............................30 ......... 5.42.07 Tertiary education gross enrollment rate, % ........19 ....... 72.42.08 Quality of management schools* ........................85 ......... 4.02.09 Gov’t procurement of advanced tech* .............101 ......... 3.2
3rd pillar: Infrastructure and digital content3.01 Electricity production, kWh/capita ......................55 .. 4,111.03.02 Mobile network coverage, % pop ......................46 ....... 99.53.03 Int’l Internet bandwidth, kb/s per user................37 ....... 40.23.04 Secure Internet servers/million pop ....................33 ..... 269.73.05 Accessibility of digital content* ...........................73 ......... 5.0
4th pillar: Affordability4.01 Mobile cellular tariffs, PPP $/min. .......................45 ....... 0.194.02 Fixed broadband Internet tariffs, PPP $/month ..63 ..... 31.524.03 Internet & telephony competition, 0–2 (best) ......83 ....... 1.77
5th pillar: Skills5.01 Quality of educational system* ...........................68 ......... 3.75.02 Quality of math & science education* .................59 ......... 4.15.03 Secondary education gross enrollment rate, % ..47 ....... 97.05.04 Adult literacy rate, % ..........................................12 ....... 99.5
INDICATOR RANK /144 VALUE
6th pillar: Individual usage 6.01 Mobile phone subscriptions/100 pop. ................30 ..... 131.0 6.02 Individuals using Internet, %...............................40 ....... 64.9 6.03 Households w/ personal computer, % ...............35 ....... 71.3 6.04 Households w/ Internet access, % ....................32 ....... 66.6 6.05 Broadband Internet subscriptions/100 pop. .......42 ....... 14.7 6.06 Mobile broadband subscriptions/100 pop. .........18 ....... 49.6 6.07 Use of virtual social networks* .........................118 ......... 4.7
7th pillar: Business usage 7.01 Firm-level technology absorption* ....................112 ......... 4.2 7.02 Capacity for innovation* .....................................54 ......... 3.3 7.03 PCT patents, applications/million pop. ..............40 ......... 6.7 7.04 Business-to-business Internet use* ....................95 ......... 4.7 7.05 Business-to-consumer Internet use* ..................43 ......... 4.9 7.06 Extent of staff training* .......................................59 ......... 4.0
8th pillar: Government usage 8.01 Importance of ICTs to gov’t vision* ...................123 ......... 3.1 8.02 Government Online Service Index, 0–1 (best) .....55 ....... 0.54 8.03 Gov’t success in ICT promotion* ......................117 ......... 3.5
9th pillar: Economic impacts 9.01 Impact of ICTs on new services and products* ..97 ......... 4.0 9.02 ICT PCT patents, applications/million pop. .......36 ......... 1.6 9.03 Impact of ICTs on new organizational models* ...95 ......... 3.8 9.04 Knowledge-intensive jobs, % workforce .............36 ....... 32.8
10th pillar: Social impacts 10.01 Impact of ICTs on access to basic services* ....108 ......... 3.7 10.02 Internet access in schools* ................................53 ......... 4.5 10.03 ICT use & gov’t efficiency* ...............................114 ......... 3.5 10.04 E-Participation Index, 0–1 (best).........................70 ....... 0.18
Rank Score (out of 144) (1–7)
Networked Readiness Index 2013 ..............49 ..4.2Networked Readiness Index 2012 (out of 142) ...................... 49 .....4.2
A. Environment subindex ..............................................55 ....4.11st pillar: Political and regulatory environment ................... 62 .....3.82nd pillar: Business and innovation environment ............... 53 .....4.4
B. Readiness subindex .................................................37 ....5.33rd pillar: Infrastructure and digital content ........................ 38 .....5.04th pillar: Affordability ........................................................ 47 .....5.65th pillar: Skills ................................................................... 47 .....5.2
C. Usage subindex ........................................................50 ....4.06th pillar: Individual usage .................................................. 33 .....5.07th pillar: Business usage .................................................. 74 .....3.48th pillar: Government usage ........................................... 107 .....3.6
D. Impact subindex .......................................................77 ....3.49th pillar: Economic impacts .............................................. 64 .....3.310th pillar: Social impacts .................................................. 86 .....3.5
Poland3: Country/Economy Profiles
246 | The Global Information Technology Report 2013
Note: Indicators followed by an asterisk (*) are measured on a 1-to-7 (best) scale. For further details and explanation, please refer to the section “How to Read the Country/Economy Profiles” on page 139.
Poland High-income group average
1. Political and regulatory environment
6. Individual usage
5. Skills7. Business usage
4. Affordability8. Governmentusage
3. Infrastructure anddigital content
9. Economicimpacts
2. Business and innovation environment
10. Socialimpacts
1
2
3
4
5
6
7
@ 2013 World Economic Forum

The Networked Readiness Index in detailINDICATOR RANK /144 VALUE
1st pillar: Political and regulatory environment1.01 Effectiveness of law-making bodies* ..................74 ......... 3.51.02 Laws relating to ICTs* ........................................19 ......... 5.21.03 Judicial independence* ......................................67 ......... 3.91.04 Efficiency of legal system in settling disputes* ..121 ......... 2.91.05 Efficiency of legal system in challenging regs* ..101 ......... 3.21.06 Intellectual property protection* ..........................42 ......... 4.31.07 Software piracy rate, % software installed ..........25 .......... 401.08 No. procedures to enforce a contract ................28 .......... 321.09 No. days to enforce a contract ..........................78 ........ 547
2nd pillar: Business and innovation environment2.01 Availability of latest technologies* .......................15 ......... 6.32.02 Venture capital availability* .................................97 ......... 2.32.03 Total tax rate, % profits ......................................90 ....... 42.62.04 No. days to start a business ..............................10 ............ 52.05 No. procedures to start a business ....................30 ............ 52.06 Intensity of local competition* .............................62 ......... 4.9
2.07 Tertiary education gross enrollment rate, % ........26 ....... 65.52.08 Quality of management schools* ........................22 ......... 5.12.09 Gov’t procurement of advanced tech* ...............36 ......... 4.0
3rd pillar: Infrastructure and digital content3.01 Electricity production, kWh/capita ......................46 .. 4,952.83.02 Mobile network coverage, % pop ......................51 ....... 99.03.03 Int’l Internet bandwidth, kb/s per user................11 ..... 135.33.04 Secure Internet servers/million pop ....................36 ..... 223.73.05 Accessibility of digital content* ...........................29 ......... 6.0
4th pillar: Affordability4.01 Mobile cellular tariffs, PPP $/min. .......................67 ....... 0.274.02 Fixed broadband Internet tariffs, PPP $/month ..72 ..... 33.194.03 Internet & telephony competition, 0–2 (best) ........1 ....... 2.00
5th pillar: Skills5.01 Quality of educational system* ...........................61 ......... 3.8
5.02 Quality of math & science education* .................94 ......... 3.6 5.03 Secondary education gross enrollment rate, % ..14 ..... 109.1 5.04 Adult literacy rate, % ..........................................63 ....... 95.2
INDICATOR RANK /144 VALUE
6th pillar: Individual usage 6.01 Mobile phone subscriptions/100 pop. ................55 ..... 115.4 6.02 Individuals using Internet, %...............................48 ....... 55.3 6.03 Households w/ personal computer, % ...............43 ....... 63.7 6.04 Households w/ Internet access, % ....................43 ....... 58.0 6.05 Broadband Internet subscriptions/100 pop. .......34 ....... 21.0 6.06 Mobile broadband subscriptions/100 pop. .........44 ....... 27.4 6.07 Use of virtual social networks* ...........................39 ......... 5.9
7th pillar: Business usage 7.01 Firm-level technology absorption* ......................27 ......... 5.6 7.02 Capacity for innovation* .....................................40 ......... 3.5 7.03 PCT patents, applications/million pop. ..............30 ....... 12.2 7.04 Business-to-business Internet use* ....................37 ......... 5.6 7.05 Business-to-consumer Internet use* ..................35 ......... 5.1 7.06 Extent of staff training* .......................................73 ......... 3.9
8th pillar: Government usage 8.01 Importance of ICTs to gov’t vision* .....................21 ......... 4.8 8.02 Government Online Service Index, 0–1 (best) .....38 ....... 0.65 8.03 Gov’t success in ICT promotion* ........................29 ......... 5.0
9th pillar: Economic impacts 9.01 Impact of ICTs on new services and products* ..22 ......... 5.3 9.02 ICT PCT patents, applications/million pop. .......30 ......... 3.1 9.03 Impact of ICTs on new organizational models* ...31 ......... 4.8 9.04 Knowledge-intensive jobs, % workforce .............53 ....... 24.4
10th pillar: Social impacts 10.01 Impact of ICTs on access to basic services* ......24 ......... 5.4 10.02 Internet access in schools* ................................26 ......... 5.7 10.03 ICT use & gov’t efficiency* .................................12 ......... 5.4 10.04 E-Participation Index, 0–1 (best).........................41 ....... 0.37
Rank Score (out of 144) (1–7)
Networked Readiness Index 2013 ..............33 ..4.7Networked Readiness Index 2012 (out of 142) ...................... 33 .....4.6
A. Environment subindex ..............................................38 ....4.61st pillar: Political and regulatory environment ................... 43 .....4.22nd pillar: Business and innovation environment ............... 27 .....4.9
B. Readiness subindex .................................................34 ....5.33rd pillar: Infrastructure and digital content ........................ 34 .....5.24th pillar: Affordability ........................................................ 57 .....5.45th pillar: Skills ................................................................... 48 .....5.1
C. Usage subindex ........................................................32 ....4.56th pillar: Individual usage .................................................. 41 .....4.77th pillar: Business usage .................................................. 36 .....3.98th pillar: Government usage ............................................. 28 .....4.9
D. Impact subindex .......................................................35 ....4.39th pillar: Economic impacts .............................................. 36 .....3.710th pillar: Social impacts .................................................. 30 .....4.9
Portugal3: Country/Economy Profiles
The Global Information Technology Report 2013 | 247
Note: Indicators followed by an asterisk (*) are measured on a 1-to-7 (best) scale. For further details and explanation, please refer to the section “How to Read the Country/Economy Profiles” on page 139.
Portugal High-income group average
1. Political and regulatory environment
6. Individual usage
5. Skills7. Business usage
4. Affordability8. Governmentusage
3. Infrastructure anddigital content
9. Economicimpacts
2. Business and innovation environment
10. Socialimpacts
1
2
3
4
5
6
7
@ 2013 World Economic Forum

The Networked Readiness Index in detailINDICATOR RANK /144 VALUE
1st pillar: Political and regulatory environment1.01 Effectiveness of law-making bodies* ................115 ......... 2.81.02 Laws relating to ICTs* ........................................38 ......... 4.81.03 Judicial independence* ......................................41 ......... 4.61.04 Efficiency of legal system in settling disputes* ....24 ......... 4.81.05 Efficiency of legal system in challenging regs* ....23 ......... 4.61.06 Intellectual property protection* ..........................13 ......... 5.61.07 Software piracy rate, % software installed ..........29 .......... 421.08 No. procedures to enforce a contract ................90 .......... 391.09 No. days to enforce a contract ..........................95 ........ 620
2nd pillar: Business and innovation environment2.01 Availability of latest technologies* .......................31 ......... 6.02.02 Venture capital availability* .................................54 ......... 2.82.03 Total tax rate, % profits ....................................115 ....... 50.72.04 No. days to start a business ..............................16 ............ 62.05 No. procedures to start a business ....................48 ............ 62.06 Intensity of local competition* .............................17 ......... 5.72.07 Tertiary education gross enrollment rate, % ..........6 ....... 86.22.08 Quality of management schools* ........................44 ......... 4.62.09 Gov’t procurement of advanced tech* ...............56 ......... 3.7
3rd pillar: Infrastructure and digital content3.01 Electricity production, kWh/capita ......................39 .. 5,536.83.02 Mobile network coverage, % pop ....................128 ....... 68.43.03 Int’l Internet bandwidth, kb/s per user................10 ..... 135.43.04 Secure Internet servers/million pop ....................52 ..... 105.53.05 Accessibility of digital content* ...........................30 ......... 5.9
4th pillar: Affordability4.01 Mobile cellular tariffs, PPP $/min. ......................n/a ......... n/a4.02 Fixed broadband Internet tariffs, PPP $/month .n/a ......... n/a4.03 Internet & telephony competition, 0–2 (best) .....n/a ......... n/a
5th pillar: Skills5.01 Quality of educational system* ...........................51 ......... 4.05.02 Quality of math & science education* .................84 ......... 3.85.03 Secondary education gross enrollment rate, % ..95 ....... 77.25.04 Adult literacy rate, % ..........................................84 ....... 90.4
INDICATOR RANK /144 VALUE
6th pillar: Individual usage 6.01 Mobile phone subscriptions/100 pop. ..............105 ....... 83.0 6.02 Individuals using Internet, %...............................59 ....... 48.0 6.03 Households w/ personal computer, % ...............51 ....... 55.0 6.04 Households w/ Internet access, % ....................50 ....... 50.0 6.05 Broadband Internet subscriptions/100 pop. .......41 ....... 14.9 6.06 Mobile broadband subscriptions/100 pop. .........65 ....... 14.7 6.07 Use of virtual social networks* .............................9 ......... 6.3
7th pillar: Business usage 7.01 Firm-level technology absorption* ......................26 ......... 5.6 7.02 Capacity for innovation* .....................................38 ......... 3.6 7.03 PCT patents, applications/million pop. .............n/a ......... n/a 7.04 Business-to-business Internet use* ....................41 ......... 5.5 7.05 Business-to-consumer Internet use* ..................32 ......... 5.2 7.06 Extent of staff training* .......................................19 ......... 4.8
8th pillar: Government usage 8.01 Importance of ICTs to gov’t vision* .....................64 ......... 4.1 8.02 Government Online Service Index, 0–1 (best) ....n/a ......... n/a 8.03 Gov’t success in ICT promotion* ........................49 ......... 4.7
9th pillar: Economic impacts 9.01 Impact of ICTs on new services and products* ..50 ......... 4.7 9.02 ICT PCT patents, applications/million pop. ......n/a ......... n/a 9.03 Impact of ICTs on new organizational models* ...32 ......... 4.8 9.04 Knowledge-intensive jobs, % workforce .............39 ....... 31.9
10th pillar: Social impacts 10.01 Impact of ICTs on access to basic services* ......51 ......... 4.7 10.02 Internet access in schools* ................................57 ......... 4.5 10.03 ICT use & gov’t efficiency* .................................52 ......... 4.5 10.04 E-Participation Index, 0–1 (best)........................n/a ......... n/a
Rank Score (out of 144) (1–7)
Networked Readiness Index 2013 ..............36 ..4.6Networked Readiness Index 2012 (out of 142) ...................... 36 .....4.6
A. Environment subindex ..............................................35 ....4.61st pillar: Political and regulatory environment ................... 35 .....4.52nd pillar: Business and innovation environment ............... 30 .....4.8
B. Readiness subindex .................................................69 ....4.73rd pillar: Infrastructure and digital content ........................ 52 .....4.44th pillar: Affordability ....................................................... n/a .....n/a5th pillar: Skills ................................................................... 55 .....5.0
C. Usage subindex ........................................................39 ....4.36th pillar: Individual usage .................................................. 59 .....3.97th pillar: Business usage .................................................. 21 .....4.68th pillar: Government usage ............................................. 46 .....4.4
D. Impact subindex .......................................................26 ....4.69th pillar: Economic impacts .............................................. 21 .....4.610th pillar: Social impacts .................................................. 37 .....4.5
Puerto Rico3: Country/Economy Profiles
248 | The Global Information Technology Report 2013
Note: Indicators followed by an asterisk (*) are measured on a 1-to-7 (best) scale. For further details and explanation, please refer to the section “How to Read the Country/Economy Profiles” on page 139.
Puerto Rico High-income group average
1. Political and regulatory environment
6. Individual usage
5. Skills7. Business usage
4. Affordability8. Governmentusage
3. Infrastructure anddigital content
9. Economicimpacts
2. Business and innovation environment
10. Socialimpacts
1
2
3
4
5
6
7
@ 2013 World Economic Forum

The Networked Readiness Index in detailINDICATOR RANK /144 VALUE
1st pillar: Political and regulatory environment1.01 Effectiveness of law-making bodies* ..................13 ......... 5.01.02 Laws relating to ICTs* ..........................................7 ......... 5.51.03 Judicial independence* ......................................10 ......... 6.21.04 Efficiency of legal system in settling disputes* ....10 ......... 5.41.05 Efficiency of legal system in challenging regs* ....14 ......... 4.91.06 Intellectual property protection* ............................8 ......... 5.81.07 Software piracy rate, % software installed ..........38 .......... 501.08 No. procedures to enforce a contract ..............121 .......... 431.09 No. days to enforce a contract ..........................82 ........ 570
2nd pillar: Business and innovation environment2.01 Availability of latest technologies* .......................25 ......... 6.12.02 Venture capital availability* ...................................1 ......... 4.72.03 Total tax rate, % profits ........................................3 ....... 11.32.04 No. days to start a business ..............................43 ............ 92.05 No. procedures to start a business ....................88 ............ 82.06 Intensity of local competition* .............................12 ......... 5.72.07 Tertiary education gross enrollment rate, % ......108 ....... 11.62.08 Quality of management schools* ..........................7 ......... 5.72.09 Gov’t procurement of advanced tech* .................1 ......... 5.8
3rd pillar: Infrastructure and digital content3.01 Electricity production, kWh/capita ........................6 15,519.23.02 Mobile network coverage, % pop ........................1 ..... 100.03.03 Int’l Internet bandwidth, kb/s per user................57 ....... 22.33.04 Secure Internet servers/million pop ....................47 ..... 126.23.05 Accessibility of digital content* ...........................27 ......... 6.0
4th pillar: Affordability4.01 Mobile cellular tariffs, PPP $/min. .......................26 ....... 0.154.02 Fixed broadband Internet tariffs, PPP $/month 108 ..... 52.824.03 Internet & telephony competition, 0–2 (best) ....127 ....... 0.93
5th pillar: Skills5.01 Quality of educational system* .............................4 ......... 5.75.02 Quality of math & science education* ...................9 ......... 5.55.03 Secondary education gross enrollment rate, % ..28 ..... 101.75.04 Adult literacy rate, % ..........................................56 ....... 96.3
INDICATOR RANK /144 VALUE
6th pillar: Individual usage 6.01 Mobile phone subscriptions/100 pop. ................43 ..... 123.1 6.02 Individuals using Internet, %.................................8 ....... 86.2 6.03 Households w/ personal computer, % .................8 ....... 88.3 6.04 Households w/ Internet access, % ....................12 ....... 83.6 6.05 Broadband Internet subscriptions/100 pop. .......62 ......... 8.7 6.06 Mobile broadband subscriptions/100 pop. .........11 ....... 70.3 6.07 Use of virtual social networks* ...........................11 ......... 6.3
7th pillar: Business usage 7.01 Firm-level technology absorption* ........................9 ......... 6.0 7.02 Capacity for innovation* .....................................18 ......... 4.6 7.03 PCT patents, applications/million pop. ..............56 ......... 1.8 7.04 Business-to-business Internet use* ....................13 ......... 6.0 7.05 Business-to-consumer Internet use* ..................33 ......... 5.2 7.06 Extent of staff training* .......................................11 ......... 5.0
8th pillar: Government usage 8.01 Importance of ICTs to gov’t vision* .......................2 ......... 5.8 8.02 Government Online Service Index, 0–1 (best) .....27 ....... 0.74 8.03 Gov’t success in ICT promotion* ..........................2 ......... 6.0
9th pillar: Economic impacts 9.01 Impact of ICTs on new services and products* ..12 ......... 5.5 9.02 ICT PCT patents, applications/million pop. .......58 ......... 0.3 9.03 Impact of ICTs on new organizational models* .....3 ......... 5.5 9.04 Knowledge-intensive jobs, % workforce .............55 ....... 24.2
10th pillar: Social impacts 10.01 Impact of ICTs on access to basic services* ........1 ......... 6.1 10.02 Internet access in schools* ................................10 ......... 6.1 10.03 ICT use & gov’t efficiency* ...................................2 ......... 6.0 10.04 E-Participation Index, 0–1 (best).........................22 ....... 0.63
Rank Score (out of 144) (1–7)
Networked Readiness Index 2013 ..............23 ..5.1Networked Readiness Index 2012 (out of 142) ...................... 28 .....4.8
A. Environment subindex ..............................................14 ....5.21st pillar: Political and regulatory environment ................... 18 .....5.12nd pillar: Business and innovation environment ............... 12 .....5.3
B. Readiness subindex .................................................44 ....5.13rd pillar: Infrastructure and digital content ........................ 35 .....5.24th pillar: Affordability ...................................................... 103 .....3.95th pillar: Skills ..................................................................... 5 .....6.0
C. Usage subindex ........................................................16 ....5.36th pillar: Individual usage .................................................. 16 .....5.87th pillar: Business usage .................................................. 27 .....4.58th pillar: Government usage ............................................... 5 .....5.8
D. Impact subindex .......................................................23 ....4.89th pillar: Economic impacts .............................................. 33 .....3.910th pillar: Social impacts .................................................... 8 .....5.8
Qatar3: Country/Economy Profiles
The Global Information Technology Report 2013 | 249
Note: Indicators followed by an asterisk (*) are measured on a 1-to-7 (best) scale. For further details and explanation, please refer to the section “How to Read the Country/Economy Profiles” on page 139.
Qatar High-income group average
1. Political and regulatory environment
6. Individual usage
5. Skills7. Business usage
4. Affordability8. Governmentusage
3. Infrastructure anddigital content
9. Economicimpacts
2. Business and innovation environment
10. Socialimpacts
1
2
3
4
5
6
7
@ 2013 World Economic Forum

The Networked Readiness Index in detailINDICATOR RANK /144 VALUE
1st pillar: Political and regulatory environment1.01 Effectiveness of law-making bodies* ................127 ......... 2.51.02 Laws relating to ICTs* ........................................88 ......... 3.71.03 Judicial independence* ....................................114 ......... 2.71.04 Efficiency of legal system in settling disputes* ..133 ......... 2.61.05 Efficiency of legal system in challenging regs* ..128 ......... 2.71.06 Intellectual property protection* ........................114 ......... 2.91.07 Software piracy rate, % software installed ..........58 .......... 631.08 No. procedures to enforce a contract ................28 .......... 321.09 No. days to enforce a contract ..........................69 ........ 512
2nd pillar: Business and innovation environment2.01 Availability of latest technologies* .....................117 ......... 4.22.02 Venture capital availability* .................................76 ......... 2.52.03 Total tax rate, % profits ......................................97 ....... 44.22.04 No. days to start a business ..............................49 .......... 102.05 No. procedures to start a business ....................48 ............ 62.06 Intensity of local competition* ...........................102 ......... 4.32.07 Tertiary education gross enrollment rate, % ........40 ....... 58.82.08 Quality of management schools* ......................112 ......... 3.52.09 Gov’t procurement of advanced tech* .............114 ......... 3.1
3rd pillar: Infrastructure and digital content3.01 Electricity production, kWh/capita ......................70 .. 2,688.13.02 Mobile network coverage, % pop ......................28 ....... 99.93.03 Int’l Internet bandwidth, kb/s per user................13 ..... 126.13.04 Secure Internet servers/million pop ....................59 ....... 53.73.05 Accessibility of digital content* ...........................57 ......... 5.2
4th pillar: Affordability4.01 Mobile cellular tariffs, PPP $/min. .....................124 ....... 0.574.02 Fixed broadband Internet tariffs, PPP $/month ..12 ..... 17.164.03 Internet & telephony competition, 0–2 (best) ........1 ....... 2.00
5th pillar: Skills5.01 Quality of educational system* .........................108 ......... 3.15.02 Quality of math & science education* .................55 ......... 4.25.03 Secondary education gross enrollment rate, % ..45 ....... 97.25.04 Adult literacy rate, % ..........................................52 ....... 97.7
INDICATOR RANK /144 VALUE
6th pillar: Individual usage 6.01 Mobile phone subscriptions/100 pop. ................63 ..... 109.2 6.02 Individuals using Internet, %...............................64 ....... 44.0 6.03 Households w/ personal computer, % ...............55 ....... 51.2 6.04 Households w/ Internet access, % ....................51 ....... 47.4 6.05 Broadband Internet subscriptions/100 pop. .......40 ....... 15.2 6.06 Mobile broadband subscriptions/100 pop. .........67 ....... 14.1 6.07 Use of virtual social networks* ...........................73 ......... 5.4
7th pillar: Business usage 7.01 Firm-level technology absorption* ....................116 ......... 4.1 7.02 Capacity for innovation* .....................................77 ......... 3.1 7.03 PCT patents, applications/million pop. ..............55 ......... 1.8 7.04 Business-to-business Internet use* ....................86 ......... 4.7 7.05 Business-to-consumer Internet use* ..................41 ......... 5.0 7.06 Extent of staff training* .....................................111 ......... 3.4
8th pillar: Government usage 8.01 Importance of ICTs to gov’t vision* ...................106 ......... 3.4 8.02 Government Online Service Index, 0–1 (best) .....61 ....... 0.52 8.03 Gov’t success in ICT promotion* ......................107 ......... 3.7
9th pillar: Economic impacts 9.01 Impact of ICTs on new services and products* 105 ......... 3.9 9.02 ICT PCT patents, applications/million pop. .......48 ......... 0.7 9.03 Impact of ICTs on new organizational models* .103 ......... 3.6 9.04 Knowledge-intensive jobs, % workforce .............64 ....... 21.8
10th pillar: Social impacts 10.01 Impact of ICTs on access to basic services* ......95 ......... 3.9 10.02 Internet access in schools* ................................64 ......... 4.3 10.03 ICT use & gov’t efficiency* ...............................107 ......... 3.6 10.04 E-Participation Index, 0–1 (best).........................96 ....... 0.08
Rank Score (out of 144) (1–7)
Networked Readiness Index 2013 ..............75 ..3.9Networked Readiness Index 2012 (out of 142) ...................... 67 .....3.9
A. Environment subindex ..............................................89 ....3.71st pillar: Political and regulatory environment ................. 106 .....3.32nd pillar: Business and innovation environment ............... 70 .....4.1
B. Readiness subindex .................................................52 ....5.03rd pillar: Infrastructure and digital content ........................ 47 .....4.64th pillar: Affordability ........................................................ 62 .....5.45th pillar: Skills ................................................................... 58 .....4.9
C. Usage subindex ........................................................69 ....3.76th pillar: Individual usage .................................................. 57 .....4.07th pillar: Business usage .................................................. 94 .....3.28th pillar: Government usage ............................................. 96 .....3.8
D. Impact subindex .......................................................97 ....3.19th pillar: Economic impacts .............................................. 94 .....2.910th pillar: Social impacts .................................................. 97 .....3.3
Romania3: Country/Economy Profiles
250 | The Global Information Technology Report 2013
Note: Indicators followed by an asterisk (*) are measured on a 1-to-7 (best) scale. For further details and explanation, please refer to the section “How to Read the Country/Economy Profiles” on page 139.
Romania Upper-middle-income group average
1. Political and regulatory environment
6. Individual usage
5. Skills7. Business usage
4. Affordability8. Governmentusage
3. Infrastructure anddigital content
9. Economicimpacts
2. Business and innovation environment
10. Socialimpacts
1
2
3
4
5
6
7
@ 2013 World Economic Forum

The Networked Readiness Index in detailINDICATOR RANK /144 VALUE
1st pillar: Political and regulatory environment1.01 Effectiveness of law-making bodies* ................107 ......... 3.01.02 Laws relating to ICTs* ......................................106 ......... 3.31.03 Judicial independence* ....................................122 ......... 2.61.04 Efficiency of legal system in settling disputes* ..124 ......... 2.81.05 Efficiency of legal system in challenging regs* ..127 ......... 2.71.06 Intellectual property protection* ........................125 ......... 2.61.07 Software piracy rate, % software installed ..........58 .......... 631.08 No. procedures to enforce a contract ................56 .......... 361.09 No. days to enforce a contract ............................7 ........ 270
2nd pillar: Business and innovation environment2.01 Availability of latest technologies* .....................129 ......... 3.92.02 Venture capital availability* .................................85 ......... 2.42.03 Total tax rate, % profits ....................................121 ....... 54.12.04 No. days to start a business ..............................77 .......... 182.05 No. procedures to start a business ....................88 ............ 82.06 Intensity of local competition* ...........................124 ......... 4.02.07 Tertiary education gross enrollment rate, % ........14 ....... 75.92.08 Quality of management schools* ......................115 ......... 3.52.09 Gov’t procurement of advanced tech* .............124 ......... 2.9
3rd pillar: Infrastructure and digital content3.01 Electricity production, kWh/capita ......................29 .. 6,976.63.02 Mobile network coverage, % pop ......................90 ....... 95.03.03 Int’l Internet bandwidth, kb/s per user................45 ....... 31.73.04 Secure Internet servers/million pop ....................68 ....... 27.13.05 Accessibility of digital content* ...........................63 ......... 5.1
4th pillar: Affordability4.01 Mobile cellular tariffs, PPP $/min. .......................46 ....... 0.194.02 Fixed broadband Internet tariffs, PPP $/month ....9 ..... 16.524.03 Internet & telephony competition, 0–2 (best) ......93 ....... 1.60
5th pillar: Skills5.01 Quality of educational system* ...........................86 ......... 3.45.02 Quality of math & science education* .................52 ......... 4.35.03 Secondary education gross enrollment rate, % ..75 ....... 88.65.04 Adult literacy rate, % ..........................................10 ....... 99.6
INDICATOR RANK /144 VALUE
6th pillar: Individual usage 6.01 Mobile phone subscriptions/100 pop. ..................5 ..... 179.3 6.02 Individuals using Internet, %...............................57 ....... 49.0 6.03 Households w/ personal computer, % ...............50 ....... 57.1 6.04 Households w/ Internet access, % ....................53 ....... 46.0 6.05 Broadband Internet subscriptions/100 pop. .......46 ....... 13.1 6.06 Mobile broadband subscriptions/100 pop. .........20 ....... 47.9 6.07 Use of virtual social networks* ...........................99 ......... 5.1
7th pillar: Business usage 7.01 Firm-level technology absorption* ....................141 ......... 3.6 7.02 Capacity for innovation* .....................................56 ......... 3.3 7.03 PCT patents, applications/million pop. ..............43 ......... 6.0 7.04 Business-to-business Internet use* ..................107 ......... 4.4 7.05 Business-to-consumer Internet use* ..................63 ......... 4.6 7.06 Extent of staff training* .......................................89 ......... 3.7
8th pillar: Government usage 8.01 Importance of ICTs to gov’t vision* ...................116 ......... 3.3 8.02 Government Online Service Index, 0–1 (best) .....37 ....... 0.66 8.03 Gov’t success in ICT promotion* ......................108 ......... 3.7
9th pillar: Economic impacts 9.01 Impact of ICTs on new services and products* 123 ......... 3.6 9.02 ICT PCT patents, applications/million pop. .......38 ......... 1.4 9.03 Impact of ICTs on new organizational models* .106 ......... 3.6 9.04 Knowledge-intensive jobs, % workforce .............18 ....... 40.7
10th pillar: Social impacts 10.01 Impact of ICTs on access to basic services* ....116 ......... 3.5 10.02 Internet access in schools* ................................70 ......... 4.2 10.03 ICT use & gov’t efficiency* ...............................110 ......... 3.6 10.04 E-Participation Index, 0–1 (best).........................19 ....... 0.66
Rank Score (out of 144) (1–7)
Networked Readiness Index 2013 ..............54 ..4.1Networked Readiness Index 2012 (out of 142) ...................... 56 .....4.0
A. Environment subindex ............................................102 ....3.61st pillar: Political and regulatory environment ................. 108 .....3.22nd pillar: Business and innovation environment ............... 90 .....3.9
B. Readiness subindex .................................................32 ....5.33rd pillar: Infrastructure and digital content ........................ 43 .....4.74th pillar: Affordability ........................................................ 18 .....6.25th pillar: Skills ................................................................... 61 .....4.9
C. Usage subindex ........................................................56 ....3.96th pillar: Individual usage .................................................. 45 .....4.57th pillar: Business usage .................................................. 95 .....3.28th pillar: Government usage ............................................. 74 .....4.0
D. Impact subindex .......................................................53 ....3.79th pillar: Economic impacts .............................................. 54 .....3.410th pillar: Social impacts .................................................. 50 .....4.1
Russian Federation3: Country/Economy Profiles
The Global Information Technology Report 2013 | 251
Note: Indicators followed by an asterisk (*) are measured on a 1-to-7 (best) scale. For further details and explanation, please refer to the section “How to Read the Country/Economy Profiles” on page 139.
Russian Federation Upper-middle-income group average
1. Political and regulatory environment
6. Individual usage
5. Skills7. Business usage
4. Affordability8. Governmentusage
3. Infrastructure anddigital content
9. Economicimpacts
2. Business and innovation environment
10. Socialimpacts
1
2
3
4
5
6
7
@ 2013 World Economic Forum

The Networked Readiness Index in detailINDICATOR RANK /144 VALUE
1st pillar: Political and regulatory environment1.01 Effectiveness of law-making bodies* ....................9 ......... 5.21.02 Laws relating to ICTs* ........................................34 ......... 4.91.03 Judicial independence* ......................................25 ......... 5.31.04 Efficiency of legal system in settling disputes* ....15 ......... 5.11.05 Efficiency of legal system in challenging regs* ....17 ......... 4.81.06 Intellectual property protection* ..........................32 ......... 4.81.07 Software piracy rate, % software installed .........n/a ......... n/a1.08 No. procedures to enforce a contract ..................3 .......... 231.09 No. days to enforce a contract ............................3 ........ 230
2nd pillar: Business and innovation environment2.01 Availability of latest technologies* .......................87 ......... 4.72.02 Venture capital availability* .................................27 ......... 3.42.03 Total tax rate, % profits ......................................41 ....... 31.32.04 No. days to start a business ................................5 ............ 32.05 No. procedures to start a business ......................3 ............ 22.06 Intensity of local competition* .............................98 ......... 4.42.07 Tertiary education gross enrollment rate, % ......123 ......... 6.62.08 Quality of management schools* ........................73 ......... 4.22.09 Gov’t procurement of advanced tech* ...............10 ......... 4.5
3rd pillar: Infrastructure and digital content3.01 Electricity production, kWh/capita ....................140 ....... 23.33.02 Mobile network coverage, % pop ......................80 ....... 97.33.03 Int’l Internet bandwidth, kb/s per user..............111 ......... 4.43.04 Secure Internet servers/million pop ..................130 ......... 0.93.05 Accessibility of digital content* ...........................95 ......... 4.6
4th pillar: Affordability4.01 Mobile cellular tariffs, PPP $/min. .......................81 ....... 0.324.02 Fixed broadband Internet tariffs, PPP $/month 134 ... 232.094.03 Internet & telephony competition, 0–2 (best) ......59 ....... 1.93
5th pillar: Skills5.01 Quality of educational system* ...........................50 ......... 4.15.02 Quality of math & science education* .................62 ......... 4.15.03 Secondary education gross enrollment rate, % 131 ....... 35.85.04 Adult literacy rate, % ........................................115 ....... 71.1
INDICATOR RANK /144 VALUE
6th pillar: Individual usage 6.01 Mobile phone subscriptions/100 pop. ..............138 ....... 40.6 6.02 Individuals using Internet, %.............................124 ......... 7.0 6.03 Households w/ personal computer, % .............139 ......... 1.3 6.04 Households w/ Internet access, % ..................112 ......... 3.2 6.05 Broadband Internet subscriptions/100 pop. .....132 ......... 0.0 6.06 Mobile broadband subscriptions/100 pop. .......110 ......... 1.0 6.07 Use of virtual social networks* .........................128 ......... 4.4
7th pillar: Business usage 7.01 Firm-level technology absorption* ......................84 ......... 4.6 7.02 Capacity for innovation* .....................................55 ......... 3.3 7.03 PCT patents, applications/million pop. ............123 ......... 0.0 7.04 Business-to-business Internet use* ...................n/a ......... n/a 7.05 Business-to-consumer Internet use* .................n/a ......... n/a 7.06 Extent of staff training* .......................................69 ......... 3.9
8th pillar: Government usage 8.01 Importance of ICTs to gov’t vision* .....................10 ......... 5.4 8.02 Government Online Service Index, 0–1 (best) ...103 ....... 0.34 8.03 Gov’t success in ICT promotion* .......................n/a ......... n/a
9th pillar: Economic impacts 9.01 Impact of ICTs on new services and products* ..45 ......... 4.8 9.02 ICT PCT patents, applications/million pop. .......95 ......... 0.0 9.03 Impact of ICTs on new organizational models* ...61 ......... 4.3 9.04 Knowledge-intensive jobs, % workforce ............n/a ......... n/a
10th pillar: Social impacts 10.01 Impact of ICTs on access to basic services* ......50 ......... 4.7 10.02 Internet access in schools* ................................66 ......... 4.3 10.03 ICT use & gov’t efficiency* .................................13 ......... 5.4 10.04 E-Participation Index, 0–1 (best).......................111 ....... 0.03
Rank Score (out of 144) (1–7)
Networked Readiness Index 2013 ..............88 ..3.7Networked Readiness Index 2012 (out of 142) ...................... 82 .....3.7
A. Environment subindex ..............................................29 ....4.81st pillar: Political and regulatory environment ................... 13 .....5.32nd pillar: Business and innovation environment ............... 59 .....4.3
B. Readiness subindex ...............................................116 ....3.23rd pillar: Infrastructure and digital content ...................... 105 .....3.04th pillar: Affordability ...................................................... 116 .....3.15th pillar: Skills ................................................................. 113 .....3.6
C. Usage subindex ......................................................107 ....3.16th pillar: Individual usage ................................................ 139 .....1.57th pillar: Business usage .................................................. 67 .....3.58th pillar: Government usage ............................................. 59 .....4.2
D. Impact subindex .......................................................61 ....3.69th pillar: Economic impacts .............................................. 58 .....3.410th pillar: Social impacts .................................................. 61 .....3.9
Rwanda3: Country/Economy Profiles
252 | The Global Information Technology Report 2013
Note: Indicators followed by an asterisk (*) are measured on a 1-to-7 (best) scale. For further details and explanation, please refer to the section “How to Read the Country/Economy Profiles” on page 139.
Rwanda Low-income group average
1. Political and regulatory environment
6. Individual usage
5. Skills7. Business usage
4. Affordability8. Governmentusage
3. Infrastructure anddigital content
9. Economicimpacts
2. Business and innovation environment
10. Socialimpacts
1
2
3
4
5
6
7
@ 2013 World Economic Forum

The Networked Readiness Index in detailINDICATOR RANK /144 VALUE
1st pillar: Political and regulatory environment1.01 Effectiveness of law-making bodies* ..................26 ......... 4.61.02 Laws relating to ICTs* ........................................25 ......... 5.01.03 Judicial independence* ......................................26 ......... 5.31.04 Efficiency of legal system in settling disputes* ....31 ......... 4.61.05 Efficiency of legal system in challenging regs* ....24 ......... 4.61.06 Intellectual property protection* ..........................27 ......... 5.11.07 Software piracy rate, % software installed ..........39 .......... 511.08 No. procedures to enforce a contract ................99 .......... 401.09 No. days to enforce a contract ..........................99 ........ 635
2nd pillar: Business and innovation environment2.01 Availability of latest technologies* .......................34 ......... 5.92.02 Venture capital availability* .................................18 ......... 3.72.03 Total tax rate, % profits ........................................5 ....... 14.52.04 No. days to start a business ..............................90 .......... 212.05 No. procedures to start a business ..................102 ............ 92.06 Intensity of local competition* .............................14 ......... 5.7
2.07 Tertiary education gross enrollment rate, % ........70 ....... 36.82.08 Quality of management schools* ........................45 ......... 4.62.09 Gov’t procurement of advanced tech* .................5 ......... 4.8
3rd pillar: Infrastructure and digital content3.01 Electricity production, kWh/capita ......................24 .. 8,097.33.02 Mobile network coverage, % pop ......................49 ....... 99.33.03 Int’l Internet bandwidth, kb/s per user................43 ....... 33.03.04 Secure Internet servers/million pop ....................72 ....... 21.53.05 Accessibility of digital content* ...........................43 ......... 5.5
4th pillar: Affordability 4.01 Mobile cellular tariffs, PPP $/min. .......................40 ....... 0.174.02 Fixed broadband Internet tariffs, PPP $/month ..65 ..... 31.724.03 Internet & telephony competition, 0–2 (best) ....105 ....... 1.33
5th pillar: Skills5.01 Quality of educational system* ...........................32 ......... 4.4
5.02 Quality of math & science education* .................37 ......... 4.5 5.03 Secondary education gross enrollment rate, % ..34 ..... 100.6 5.04 Adult literacy rate, % ........................................100 ....... 86.6
INDICATOR RANK /144 VALUE
6th pillar: Individual usage 6.01 Mobile phone subscriptions/100 pop. ..................2 ..... 191.2 6.02 Individuals using Internet, %...............................61 ....... 47.5 6.03 Households w/ personal computer, % ...............48 ....... 57.3 6.04 Households w/ Internet access, % ....................46 ....... 54.4 6.05 Broadband Internet subscriptions/100 pop. .......73 ......... 5.6 6.06 Mobile broadband subscriptions/100 pop. .........27 ....... 40.4 6.07 Use of virtual social networks* ...........................64 ......... 5.5
7th pillar: Business usage 7.01 Firm-level technology absorption* ......................20 ......... 5.8 7.02 Capacity for innovation* .....................................29 ......... 3.9 7.03 PCT patents, applications/million pop. ..............48 ......... 3.2 7.04 Business-to-business Internet use* ....................28 ......... 5.7 7.05 Business-to-consumer Internet use* ..................50 ......... 4.8 7.06 Extent of staff training* .......................................35 ......... 4.4
8th pillar: Government usage 8.01 Importance of ICTs to gov’t vision* .......................7 ......... 5.4 8.02 Government Online Service Index, 0–1 (best) .....19 ....... 0.80 8.03 Gov’t success in ICT promotion* ..........................3 ......... 6.0
9th pillar: Economic impacts 9.01 Impact of ICTs on new services and products* ..26 ......... 5.2 9.02 ICT PCT patents, applications/million pop. .......44 ......... 0.9 9.03 Impact of ICTs on new organizational models* ...16 ......... 5.1 9.04 Knowledge-intensive jobs, % workforce .............59 ....... 22.9
10th pillar: Social impacts 10.01 Impact of ICTs on access to basic services* ......16 ......... 5.6 10.02 Internet access in schools* ................................42 ......... 4.9 10.03 ICT use & gov’t efficiency* ...................................7 ......... 5.6 10.04 E-Participation Index, 0–1 (best).........................22 ....... 0.63
Rank Score (out of 144) (1–7)
Networked Readiness Index 2013 ..............31 ..4.8Networked Readiness Index 2012 (out of 142) ...................... 34 .....4.6
A. Environment subindex ..............................................25 ....4.91st pillar: Political and regulatory environment ................... 29 .....4.72nd pillar: Business and innovation environment ............... 25 .....5.1
B. Readiness subindex .................................................39 ....5.23rd pillar: Infrastructure and digital content ........................ 36 .....5.14th pillar: Affordability ........................................................ 65 .....5.35th pillar: Skills ................................................................... 37 .....5.3
C. Usage subindex ........................................................31 ....4.76th pillar: Individual usage .................................................. 47 .....4.47th pillar: Business usage .................................................. 30 .....4.18th pillar: Government usage ............................................... 6 .....5.7
D. Impact subindex .......................................................31 ....4.49th pillar: Economic impacts .............................................. 42 .....3.610th pillar: Social impacts .................................................. 18 .....5.2
Saudi Arabia3: Country/Economy Profiles
The Global Information Technology Report 2013 | 253
Note: Indicators followed by an asterisk (*) are measured on a 1-to-7 (best) scale. For further details and explanation, please refer to the section “How to Read the Country/Economy Profiles” on page 139.
Saudi Arabia High-income group average
1. Political and regulatory environment
6. Individual usage
5. Skills7. Business usage
4. Affordability8. Governmentusage
3. Infrastructure anddigital content
9. Economicimpacts
2. Business and innovation environment
10. Socialimpacts
1
2
3
4
5
6
7
@ 2013 World Economic Forum

The Networked Readiness Index in detailINDICATOR RANK /144 VALUE
1st pillar: Political and regulatory environment1.01 Effectiveness of law-making bodies* ................112 ......... 2.81.02 Laws relating to ICTs* ........................................83 ......... 3.71.03 Judicial independence* ....................................118 ......... 2.61.04 Efficiency of legal system in settling disputes* ....71 ......... 3.71.05 Efficiency of legal system in challenging regs* ....84 ......... 3.41.06 Intellectual property protection* ..........................95 ......... 3.11.07 Software piracy rate, % software installed ..........80 .......... 781.08 No. procedures to enforce a contract ..............121 .......... 431.09 No. days to enforce a contract ........................115 ........ 780
2nd pillar: Business and innovation environment2.01 Availability of latest technologies* .......................49 ......... 5.32.02 Venture capital availability* ...............................114 ......... 2.12.03 Total tax rate, % profits ....................................103 ....... 46.02.04 No. days to start a business ..............................10 ............ 52.05 No. procedures to start a business ....................10 ............ 32.06 Intensity of local competition* .............................52 ......... 5.12.07 Tertiary education gross enrollment rate, % ......119 ......... 7.92.08 Quality of management schools* ........................41 ......... 4.72.09 Gov’t procurement of advanced tech* ...............51 ......... 3.8
3rd pillar: Infrastructure and digital content3.01 Electricity production, kWh/capita ....................120 ..... 236.13.02 Mobile network coverage, % pop ....................101 ....... 90.03.03 Int’l Internet bandwidth, kb/s per user..............118 ......... 2.93.04 Secure Internet servers/million pop ..................118 ......... 1.43.05 Accessibility of digital content* ...........................77 ......... 4.9
4th pillar: Affordability4.01 Mobile cellular tariffs, PPP $/min. .......................79 ....... 0.324.02 Fixed broadband Internet tariffs, PPP $/month 114 ..... 67.504.03 Internet & telephony competition, 0–2 (best) ......85 ....... 1.76
5th pillar: Skills5.01 Quality of educational system* ...........................73 ......... 3.65.02 Quality of math & science education* .................79 ......... 3.85.03 Secondary education gross enrollment rate, % 126 ....... 42.15.04 Adult literacy rate, % ........................................133 ....... 49.7
INDICATOR RANK /144 VALUE
6th pillar: Individual usage 6.01 Mobile phone subscriptions/100 pop. ..............114 ....... 73.3 6.02 Individuals using Internet, %.............................103 ....... 17.5 6.03 Households w/ personal computer, % .............116 ......... 5.7 6.04 Households w/ Internet access, % ..................106 ......... 4.5 6.05 Broadband Internet subscriptions/100 pop. .....106 ......... 0.7 6.06 Mobile broadband subscriptions/100 pop. .......105 ......... 1.5 6.07 Use of virtual social networks* ...........................70 ......... 5.4
7th pillar: Business usage 7.01 Firm-level technology absorption* ......................36 ......... 5.5 7.02 Capacity for innovation* .....................................69 ......... 3.2 7.03 PCT patents, applications/million pop. ............109 ......... 0.0 7.04 Business-to-business Internet use* ....................56 ......... 5.1 7.05 Business-to-consumer Internet use* ..................73 ......... 4.5 7.06 Extent of staff training* .....................................135 ......... 3.0
8th pillar: Government usage 8.01 Importance of ICTs to gov’t vision* .....................79 ......... 3.9 8.02 Government Online Service Index, 0–1 (best) ...102 ....... 0.35 8.03 Gov’t success in ICT promotion* ........................44 ......... 4.8
9th pillar: Economic impacts 9.01 Impact of ICTs on new services and products* ..39 ......... 4.9 9.02 ICT PCT patents, applications/million pop. .......84 ......... 0.0 9.03 Impact of ICTs on new organizational models* ...72 ......... 4.1 9.04 Knowledge-intensive jobs, % workforce ............n/a ......... n/a
10th pillar: Social impacts 10.01 Impact of ICTs on access to basic services* ......75 ......... 4.1 10.02 Internet access in schools* ................................84 ......... 3.8 10.03 ICT use & gov’t efficiency* .................................51 ......... 4.5 10.04 E-Participation Index, 0–1 (best).........................62 ....... 0.21
Rank Score (out of 144) (1–7)
Networked Readiness Index 2013 ............107 ..3.3Networked Readiness Index 2012 (out of 142) .................... 100 .....3.4
A. Environment subindex ............................................101 ....3.61st pillar: Political and regulatory environment ................. 114 .....3.12nd pillar: Business and innovation environment ............... 76 .....4.1
B. Readiness subindex ...............................................120 ....3.13rd pillar: Infrastructure and digital content ...................... 108 .....2.94th pillar: Affordability ...................................................... 118 .....3.15th pillar: Skills ................................................................. 126 .....3.3
C. Usage subindex ......................................................100 ....3.26th pillar: Individual usage ................................................ 113 .....2.17th pillar: Business usage .................................................. 66 .....3.58th pillar: Government usage ............................................. 82 .....3.9
D. Impact subindex .......................................................67 ....3.59th pillar: Economic impacts .............................................. 60 .....3.310th pillar: Social impacts .................................................. 75 .....3.7
Senegal3: Country/Economy Profiles
254 | The Global Information Technology Report 2013
Note: Indicators followed by an asterisk (*) are measured on a 1-to-7 (best) scale. For further details and explanation, please refer to the section “How to Read the Country/Economy Profiles” on page 139.
Senegal Lower-middle-income group average
1. Political and regulatory environment
6. Individual usage
5. Skills7. Business usage
4. Affordability8. Governmentusage
3. Infrastructure anddigital content
9. Economicimpacts
2. Business and innovation environment
10. Socialimpacts
1
2
3
4
5
6
7
@ 2013 World Economic Forum

The Networked Readiness Index in detailINDICATOR RANK /144 VALUE
1st pillar: Political and regulatory environment1.01 Effectiveness of law-making bodies* ..................92 ......... 3.21.02 Laws relating to ICTs* ......................................100 ......... 3.51.03 Judicial independence* ....................................129 ......... 2.41.04 Efficiency of legal system in settling disputes* ..138 ......... 2.51.05 Efficiency of legal system in challenging regs* ..133 ......... 2.61.06 Intellectual property protection* ........................116 ......... 2.81.07 Software piracy rate, % software installed ..........72 .......... 721.08 No. procedures to enforce a contract ................56 .......... 361.09 No. days to enforce a contract ..........................99 ........ 635
2nd pillar: Business and innovation environment2.01 Availability of latest technologies* .....................127 ......... 3.92.02 Venture capital availability* ...............................126 ......... 1.92.03 Total tax rate, % profits ......................................52 ....... 34.02.04 No. days to start a business ..............................56 .......... 122.05 No. procedures to start a business ....................48 ............ 62.06 Intensity of local competition* ...........................137 ......... 3.62.07 Tertiary education gross enrollment rate, % ........51 ....... 50.42.08 Quality of management schools* ......................116 ......... 3.52.09 Gov’t procurement of advanced tech* .............115 ......... 3.1
3rd pillar: Infrastructure and digital content3.01 Electricity production, kWh/capita ......................43 .. 5,111.33.02 Mobile network coverage, % pop ....................107 ....... 87.43.03 Int’l Internet bandwidth, kb/s per user................21 ....... 76.83.04 Secure Internet servers/million pop ....................65 ....... 28.93.05 Accessibility of digital content* .........................107 ......... 4.2
4th pillar: Affordability4.01 Mobile cellular tariffs, PPP $/min. .......................41 ....... 0.184.02 Fixed broadband Internet tariffs, PPP $/month ..93 ..... 40.164.03 Internet & telephony competition, 0–2 (best) ......98 ....... 1.43
5th pillar: Skills5.01 Quality of educational system* .........................111 ......... 3.15.02 Quality of math & science education* .................60 ......... 4.15.03 Secondary education gross enrollment rate, % ..61 ....... 91.55.04 Adult literacy rate, % ..........................................48 ....... 97.9
INDICATOR RANK /144 VALUE
6th pillar: Individual usage 6.01 Mobile phone subscriptions/100 pop. ................38 ..... 125.4 6.02 Individuals using Internet, %...............................67 ....... 42.2 6.03 Households w/ personal computer, % ...............56 ....... 50.9 6.04 Households w/ Internet access, % ....................57 ....... 40.2 6.05 Broadband Internet subscriptions/100 pop. .......51 ....... 11.3 6.06 Mobile broadband subscriptions/100 pop. .........37 ....... 34.5 6.07 Use of virtual social networks* .........................134 ......... 4.2
7th pillar: Business usage 7.01 Firm-level technology absorption* ....................142 ......... 3.6 7.02 Capacity for innovation* ...................................120 ......... 2.5 7.03 PCT patents, applications/million pop. ..............52 ......... 2.8 7.04 Business-to-business Internet use* ..................118 ......... 4.2 7.05 Business-to-consumer Internet use* ................123 ......... 3.5 7.06 Extent of staff training* .....................................138 ......... 2.9
8th pillar: Government usage 8.01 Importance of ICTs to gov’t vision* ...................124 ......... 3.1 8.02 Government Online Service Index, 0–1 (best) .....48 ....... 0.58 8.03 Gov’t success in ICT promotion* ......................125 ......... 3.4
9th pillar: Economic impacts 9.01 Impact of ICTs on new services and products* 130 ......... 3.4 9.02 ICT PCT patents, applications/million pop. .......47 ......... 0.7 9.03 Impact of ICTs on new organizational models* .132 ......... 3.0 9.04 Knowledge-intensive jobs, % workforce .............45 ....... 28.7
10th pillar: Social impacts 10.01 Impact of ICTs on access to basic services* ......93 ......... 3.9 10.02 Internet access in schools* ................................92 ......... 3.6 10.03 ICT use & gov’t efficiency* ...............................111 ......... 3.6 10.04 E-Participation Index, 0–1 (best).........................58 ....... 0.24
Rank Score (out of 144) (1–7)
Networked Readiness Index 2013 ..............87 ..3.7Networked Readiness Index 2012 (out of 142) ...................... 85 .....3.6
A. Environment subindex ............................................106 ....3.51st pillar: Political and regulatory environment ................. 115 .....3.12nd pillar: Business and innovation environment ............... 85 .....4.0
B. Readiness subindex .................................................67 ....4.73rd pillar: Infrastructure and digital content ........................ 54 .....4.44th pillar: Affordability ........................................................ 84 .....4.95th pillar: Skills ................................................................... 65 .....4.9
C. Usage subindex ........................................................78 ....3.56th pillar: Individual usage .................................................. 55 .....4.07th pillar: Business usage ................................................ 135 .....2.78th pillar: Government usage ........................................... 104 .....3.6
D. Impact subindex .......................................................98 ....3.19th pillar: Economic impacts ............................................ 105 .....2.810th pillar: Social impacts .................................................. 93 .....3.4
Serbia3: Country/Economy Profiles
The Global Information Technology Report 2013 | 255
Note: Indicators followed by an asterisk (*) are measured on a 1-to-7 (best) scale. For further details and explanation, please refer to the section “How to Read the Country/Economy Profiles” on page 139.
Serbia Upper-middle-income group average
1. Political and regulatory environment
6. Individual usage
5. Skills7. Business usage
4. Affordability8. Governmentusage
3. Infrastructure anddigital content
9. Economicimpacts
2. Business and innovation environment
10. Socialimpacts
1
2
3
4
5
6
7
@ 2013 World Economic Forum

The Networked Readiness Index in detailINDICATOR RANK /144 VALUE
1st pillar: Political and regulatory environment1.01 Effectiveness of law-making bodies* ..................36 ......... 4.21.02 Laws relating to ICTs* ........................................64 ......... 4.11.03 Judicial independence* ......................................62 ......... 4.01.04 Efficiency of legal system in settling disputes* ....55 ......... 4.01.05 Efficiency of legal system in challenging regs* ....35 ......... 4.21.06 Intellectual property protection* ..........................52 ......... 3.91.07 Software piracy rate, % software installed .........n/a ......... n/a1.08 No. procedures to enforce a contract ................68 .......... 371.09 No. days to enforce a contract ........................126 ........ 915
2nd pillar: Business and innovation environment2.01 Availability of latest technologies* .......................67 ......... 5.02.02 Venture capital availability* .................................81 ......... 2.42.03 Total tax rate, % profits ......................................23 ....... 25.72.04 No. days to start a business ............................120 .......... 392.05 No. procedures to start a business ..................114 .......... 102.06 Intensity of local competition* .............................90 ......... 4.52.07 Tertiary education gross enrollment rate, % .......n/a ......... n/a2.08 Quality of management schools* ........................84 ......... 4.02.09 Gov’t procurement of advanced tech* ...............38 ......... 3.9
3rd pillar: Infrastructure and digital content3.01 Electricity production, kWh/capita ......................67 .. 2,806.53.02 Mobile network coverage, % pop ......................74 ....... 98.03.03 Int’l Internet bandwidth, kb/s per user..............103 ......... 5.93.04 Secure Internet servers/million pop ....................16 .. 1,348.83.05 Accessibility of digital content* ...........................65 ......... 5.1
4th pillar: Affordability4.01 Mobile cellular tariffs, PPP $/min. .....................131 ....... 0.744.02 Fixed broadband Internet tariffs, PPP $/month 125 ..... 90.194.03 Internet & telephony competition, 0–2 (best) ....122 ....... 1.08
5th pillar: Skills5.01 Quality of educational system* ...........................48 ......... 4.15.02 Quality of math & science education* .................72 ......... 4.05.03 Secondary education gross enrollment rate, % ....5 ..... 119.25.04 Adult literacy rate, % ..........................................80 ....... 91.8
INDICATOR RANK /144 VALUE
6th pillar: Individual usage 6.01 Mobile phone subscriptions/100 pop. ................18 ..... 145.7 6.02 Individuals using Internet, %...............................65 ....... 43.2 6.03 Households w/ personal computer, % ...............66 ....... 45.0 6.04 Households w/ Internet access, % ....................66 ....... 34.0 6.05 Broadband Internet subscriptions/100 pop. .......55 ....... 10.4 6.06 Mobile broadband subscriptions/100 pop. .........86 ......... 4.7 6.07 Use of virtual social networks* ...........................52 ......... 5.7
7th pillar: Business usage 7.01 Firm-level technology absorption* ......................51 ......... 5.1 7.02 Capacity for innovation* .....................................84 ......... 3.0 7.03 PCT patents, applications/million pop. ..............27 ....... 26.0 7.04 Business-to-business Internet use* ....................68 ......... 5.0 7.05 Business-to-consumer Internet use* ................114 ......... 3.7 7.06 Extent of staff training* .......................................62 ......... 4.0
8th pillar: Government usage 8.01 Importance of ICTs to gov’t vision* .....................17 ......... 5.0 8.02 Government Online Service Index, 0–1 (best) ...104 ....... 0.33 8.03 Gov’t success in ICT promotion* ........................35 ......... 4.9
9th pillar: Economic impacts 9.01 Impact of ICTs on new services and products* ..57 ......... 4.7 9.02 ICT PCT patents, applications/million pop. .......95 ......... 0.0 9.03 Impact of ICTs on new organizational models* ...87 ......... 3.9 9.04 Knowledge-intensive jobs, % workforce ............n/a ......... n/a
10th pillar: Social impacts 10.01 Impact of ICTs on access to basic services* ......43 ......... 4.8 10.02 Internet access in schools* ................................52 ......... 4.6 10.03 ICT use & gov’t efficiency* .................................67 ......... 4.3 10.04 E-Participation Index, 0–1 (best).........................96 ....... 0.08
Rank Score (out of 144) (1–7)
Networked Readiness Index 2013 ..............79 ..3.8Networked Readiness Index 2012 (out of 142) ..................... n/a .....n/a
A. Environment subindex ..............................................53 ....4.11st pillar: Political and regulatory environment ................... 50 .....4.02nd pillar: Business and innovation environment ............... 63 .....4.2
B. Readiness subindex ...............................................106 ....3.73rd pillar: Infrastructure and digital content ........................ 44 .....4.74th pillar: Affordability ...................................................... 139 .....1.65th pillar: Skills ................................................................... 60 .....4.9
C. Usage subindex ........................................................57 ....3.96th pillar: Individual usage .................................................. 62 .....3.87th pillar: Business usage .................................................. 64 .....3.58th pillar: Government usage ............................................. 51 .....4.3
D. Impact subindex .......................................................69 ....3.59th pillar: Economic impacts .............................................. 78 .....3.210th pillar: Social impacts .................................................. 69 .....3.8
Seychelles3: Country/Economy Profiles
256 | The Global Information Technology Report 2013
Note: Indicators followed by an asterisk (*) are measured on a 1-to-7 (best) scale. For further details and explanation, please refer to the section “How to Read the Country/Economy Profiles” on page 139.
Seychelles Upper-middle-income group average
1. Political and regulatory environment
6. Individual usage
5. Skills7. Business usage
4. Affordability8. Governmentusage
3. Infrastructure anddigital content
9. Economicimpacts
2. Business and innovation environment
10. Socialimpacts
1
2
3
4
5
6
7
@ 2013 World Economic Forum

The Networked Readiness Index in detailINDICATOR RANK /144 VALUE
1st pillar: Political and regulatory environment1.01 Effectiveness of law-making bodies* ..................46 ......... 4.01.02 Laws relating to ICTs* ......................................107 ......... 3.21.03 Judicial independence* ....................................107 ......... 2.81.04 Efficiency of legal system in settling disputes* ....64 ......... 3.81.05 Efficiency of legal system in challenging regs* ..110 ......... 3.01.06 Intellectual property protection* ........................102 ......... 3.11.07 Software piracy rate, % software installed .........n/a ......... n/a1.08 No. procedures to enforce a contract ................90 .......... 391.09 No. days to enforce a contract ..........................71 ........ 515
2nd pillar: Business and innovation environment2.01 Availability of latest technologies* .....................140 ......... 3.52.02 Venture capital availability* ...............................141 ......... 1.62.03 Total tax rate, % profits ......................................43 ....... 32.12.04 No. days to start a business ..............................56 .......... 122.05 No. procedures to start a business ....................48 ............ 62.06 Intensity of local competition* ...........................136 ......... 3.72.07 Tertiary education gross enrollment rate, % ......138 ......... 2.12.08 Quality of management schools* ......................126 ......... 3.22.09 Gov’t procurement of advanced tech* .............103 ......... 3.2
3rd pillar: Infrastructure and digital content3.01 Electricity production, kWh/capita ....................141 ....... 20.93.02 Mobile network coverage, % pop ....................124 ....... 70.03.03 Int’l Internet bandwidth, kb/s per user...............n/a ......... n/a3.04 Secure Internet servers/million pop ..................132 ......... 0.73.05 Accessibility of digital content* .........................139 ......... 3.0
4th pillar: Affordability4.01 Mobile cellular tariffs, PPP $/min. ......................n/a ......... n/a4.02 Fixed broadband Internet tariffs, PPP $/month 117 ..... 71.764.03 Internet & telephony competition, 0–2 (best) ....127 ....... 0.93
5th pillar: Skills5.01 Quality of educational system* .........................125 ......... 2.85.02 Quality of math & science education* ...............134 ......... 2.55.03 Secondary education gross enrollment rate, % 138 ....... 27.65.04 Adult literacy rate, % ........................................136 ....... 42.1
INDICATOR RANK /144 VALUE
6th pillar: Individual usage 6.01 Mobile phone subscriptions/100 pop. ..............139 ....... 35.6 6.02 Individuals using Internet, %.............................144 ......... 0.3 6.03 Households w/ personal computer, % .............142 ......... 0.8 6.04 Households w/ Internet access, % ...................n/a ......... n/a 6.05 Broadband Internet subscriptions/100 pop. .....143 ......... 0.0 6.06 Mobile broadband subscriptions/100 pop. ........n/a ......... n/a 6.07 Use of virtual social networks* .........................139 ......... 3.9
7th pillar: Business usage 7.01 Firm-level technology absorption* ....................131 ......... 3.9 7.02 Capacity for innovation* ...................................136 ......... 2.3 7.03 PCT patents, applications/million pop. ..............94 ......... 0.1 7.04 Business-to-business Internet use* ..................127 ......... 4.0 7.05 Business-to-consumer Internet use* ................138 ......... 2.6 7.06 Extent of staff training* .....................................125 ......... 3.1
8th pillar: Government usage 8.01 Importance of ICTs to gov’t vision* .....................89 ......... 3.7 8.02 Government Online Service Index, 0–1 (best) ...132 ....... 0.17 8.03 Gov’t success in ICT promotion* ........................76 ......... 4.3
9th pillar: Economic impacts 9.01 Impact of ICTs on new services and products* 132 ......... 3.4 9.02 ICT PCT patents, applications/million pop. .......95 ......... 0.0 9.03 Impact of ICTs on new organizational models* .140 ......... 2.7 9.04 Knowledge-intensive jobs, % workforce ............n/a ......... n/a
10th pillar: Social impacts 10.01 Impact of ICTs on access to basic services* ....136 ......... 3.1 10.02 Internet access in schools* ..............................136 ......... 1.9 10.03 ICT use & gov’t efficiency* ...............................118 ......... 3.5 10.04 E-Participation Index, 0–1 (best).......................106 ....... 0.05
Rank Score (out of 144) (1–7)
Networked Readiness Index 2013 ............143 ..2.5Networked Readiness Index 2012 (out of 142) ..................... n/a .....n/a
A. Environment subindex ............................................114 ....3.41st pillar: Political and regulatory environment ................... 86 .....3.52nd pillar: Business and innovation environment ............. 127 .....3.4
B. Readiness subindex ...............................................144 ....1.73rd pillar: Infrastructure and digital content ...................... 131 .....2.14th pillar: Affordability ...................................................... 141 .....1.05th pillar: Skills ................................................................. 144 .....2.1
C. Usage subindex ......................................................137 ....2.56th pillar: Individual usage ................................................ 133 .....1.67th pillar: Business usage ................................................ 141 .....2.68th pillar: Government usage ........................................... 119 .....3.3
D. Impact subindex .....................................................133 ....2.49th pillar: Economic impacts ............................................ 133 .....2.410th pillar: Social impacts ................................................ 131 .....2.5
Sierra Leone3: Country/Economy Profiles
The Global Information Technology Report 2013 | 257
Note: Indicators followed by an asterisk (*) are measured on a 1-to-7 (best) scale. For further details and explanation, please refer to the section “How to Read the Country/Economy Profiles” on page 139.
Sierra Leone Low-income group average
1. Political and regulatory environment
6. Individual usage
5. Skills7. Business usage
4. Affordability8. Governmentusage
3. Infrastructure anddigital content
9. Economicimpacts
2. Business and innovation environment
10. Socialimpacts
1
2
3
4
5
6
7
@ 2013 World Economic Forum

The Networked Readiness Index in detailINDICATOR RANK /144 VALUE
1st pillar: Political and regulatory environment1.01 Effectiveness of law-making bodies* ....................1 ......... 6.41.02 Laws relating to ICTs* ..........................................2 ......... 5.81.03 Judicial independence* ......................................20 ......... 5.71.04 Efficiency of legal system in settling disputes* ......1 ......... 6.21.05 Efficiency of legal system in challenging regs* ......6 ......... 5.51.06 Intellectual property protection* ............................2 ......... 6.11.07 Software piracy rate, % software installed ..........18 .......... 331.08 No. procedures to enforce a contract ..................1 .......... 211.09 No. days to enforce a contract ............................1 ........ 150
2nd pillar: Business and innovation environment2.01 Availability of latest technologies* .......................12 ......... 6.3
2.02 Venture capital availability* ...................................4 ......... 4.4 2.03 Total tax rate, % profits ......................................27 ....... 27.6 2.04 No. days to start a business ................................5 ............ 3 2.05 No. procedures to start a business ....................10 ............ 3 2.06 Intensity of local competition* .............................21 ......... 5.5 2.07 Tertiary education gross enrollment rate, % ........20 ....... 72.0 2.08 Quality of management schools* ..........................6 ......... 5.7 2.09 Gov’t procurement of advanced tech* .................2 ......... 5.3
3rd pillar: Infrastructure and digital content 3.01 Electricity production, kWh/capita ......................22 .. 8,381.0 3.02 Mobile network coverage, % pop ......................37 ....... 99.9 3.03 Int’l Internet bandwidth, kb/s per user..................2 ..... 343.7 3.04 Secure Internet servers/million pop ....................22 ..... 607.3 3.05 Accessibility of digital content* .............................7 ......... 6.4
4th pillar: Affordability 4.01 Mobile cellular tariffs, PPP $/min. .......................37 ....... 0.17 4.02 Fixed broadband Internet tariffs, PPP $/month ..86 ..... 37.09 4.03 Internet & telephony competition, 0–2 (best) ........1 ....... 2.00
5th pillar: Skills 5.01 Quality of educational system* .............................3 ......... 5.8 5.02 Quality of math & science education* ...................1 ......... 6.3 5.03 Secondary education gross enrollment rate, % ..17 ..... 107.0 5.04 Adult literacy rate, % ..........................................59 ....... 95.9
INDICATOR RANK /144 VALUE
6th pillar: Individual usage 6.01 Mobile phone subscriptions/100 pop. ................15 ..... 150.2 6.02 Individuals using Internet, %...............................32 ....... 71.0 6.03 Households w/ personal computer, % ...............12 ....... 86.1 6.04 Households w/ Internet access, % ....................10 ....... 84.8 6.05 Broadband Internet subscriptions/100 pop. .......20 ....... 25.6 6.06 Mobile broadband subscriptions/100 pop. ...........1 ..... 114.1 6.07 Use of virtual social networks* ...........................18 ......... 6.2
7th pillar: Business usage 7.01 Firm-level technology absorption* ........................8 ......... 6.0 7.02 Capacity for innovation* .....................................20 ......... 4.4 7.03 PCT patents, applications/million pop. ..............13 ..... 120.4 7.04 Business-to-business Internet use* ....................10 ......... 6.0 7.05 Business-to-consumer Internet use* ..................30 ......... 5.3 7.06 Extent of staff training* .........................................3 ......... 5.3
8th pillar: Government usage 8.01 Importance of ICTs to gov’t vision* .......................1 ......... 5.9 8.02 Government Online Service Index, 0–1 (best) .......1 ....... 1.00 8.03 Gov’t success in ICT promotion* ..........................4 ......... 6.0
9th pillar: Economic impacts 9.01 Impact of ICTs on new services and products* ....6 ......... 5.6 9.02 ICT PCT patents, applications/million pop. .........8 ....... 56.5 9.03 Impact of ICTs on new organizational models* .....7 ......... 5.4 9.04 Knowledge-intensive jobs, % workforce ...............2 ....... 51.0
10th pillar: Social impacts 10.01 Impact of ICTs on access to basic services* ........2 ......... 6.1 10.02 Internet access in schools* ..................................5 ......... 6.3 10.03 ICT use & gov’t efficiency* ...................................1 ......... 6.1 10.04 E-Participation Index, 0–1 (best)...........................3 ....... 0.95
Rank Score (out of 144) (1–7)
Networked Readiness Index 2013 ................ 2 ..6.0Networked Readiness Index 2012 (out of 142) ........................ 2 .....5.9
A. Environment subindex ................................................1 ....5.91st pillar: Political and regulatory environment ..................... 1 .....6.02nd pillar: Business and innovation environment ................. 1 .....5.8
B. Readiness subindex .................................................11 ....6.03rd pillar: Infrastructure and digital content ........................ 19 .....6.24th pillar: Affordability ........................................................ 55 .....5.55th pillar: Skills ..................................................................... 2 .....6.2
C. Usage subindex ..........................................................3 ....5.96th pillar: Individual usage .................................................. 11 .....6.17th pillar: Business usage .................................................. 14 .....5.28th pillar: Government usage ............................................... 1 .....6.3
D. Impact subindex .........................................................1 ....6.19th pillar: Economic impacts ................................................ 2 .....6.010th pillar: Social impacts .................................................... 1 .....6.3
Singapore3: Country/Economy Profiles
258 | The Global Information Technology Report 2013
Note: Indicators followed by an asterisk (*) are measured on a 1-to-7 (best) scale. For further details and explanation, please refer to the section “How to Read the Country/Economy Profiles” on page 139.
Singapore High-income group average
1. Political and regulatory environment
6. Individual usage
5. Skills7. Business usage
4. Affordability8. Governmentusage
3. Infrastructure anddigital content
9. Economicimpacts
2. Business and innovation environment
10. Socialimpacts
1
2
3
4
5
6
7
@ 2013 World Economic Forum
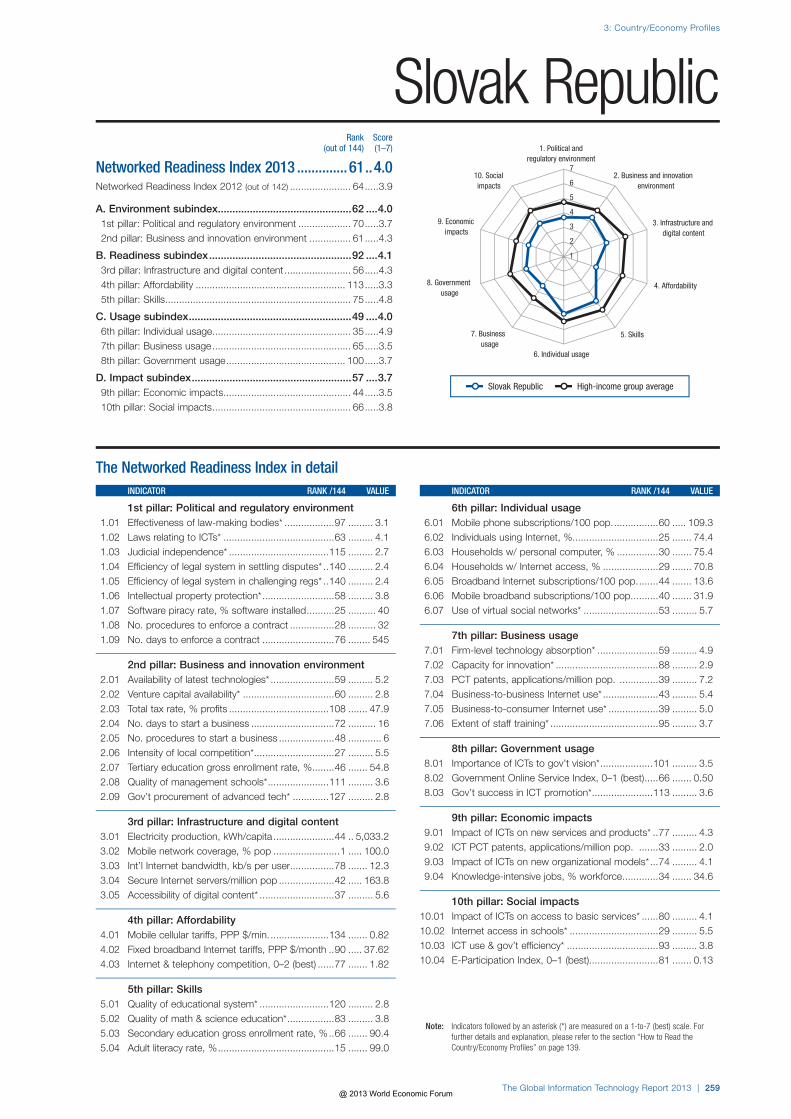
The Networked Readiness Index in detailINDICATOR RANK /144 VALUE
1st pillar: Political and regulatory environment1.01 Effectiveness of law-making bodies* ..................97 ......... 3.11.02 Laws relating to ICTs* ........................................63 ......... 4.11.03 Judicial independence* ....................................115 ......... 2.71.04 Efficiency of legal system in settling disputes* ..140 ......... 2.41.05 Efficiency of legal system in challenging regs* ..140 ......... 2.41.06 Intellectual property protection* ..........................58 ......... 3.81.07 Software piracy rate, % software installed ..........25 .......... 401.08 No. procedures to enforce a contract ................28 .......... 321.09 No. days to enforce a contract ..........................76 ........ 545
2nd pillar: Business and innovation environment2.01 Availability of latest technologies* .......................59 ......... 5.22.02 Venture capital availability* .................................60 ......... 2.82.03 Total tax rate, % profits ....................................108 ....... 47.92.04 No. days to start a business ..............................72 .......... 162.05 No. procedures to start a business ....................48 ............ 62.06 Intensity of local competition* .............................27 ......... 5.5
2.07 Tertiary education gross enrollment rate, % ........46 ....... 54.82.08 Quality of management schools* ......................111 ......... 3.62.09 Gov’t procurement of advanced tech* .............127 ......... 2.8
3rd pillar: Infrastructure and digital content3.01 Electricity production, kWh/capita ......................44 .. 5,033.23.02 Mobile network coverage, % pop ........................1 ..... 100.03.03 Int’l Internet bandwidth, kb/s per user................78 ....... 12.33.04 Secure Internet servers/million pop ....................42 ..... 163.83.05 Accessibility of digital content* ...........................37 ......... 5.6
4th pillar: Affordability4.01 Mobile cellular tariffs, PPP $/min. .....................134 ....... 0.824.02 Fixed broadband Internet tariffs, PPP $/month ..90 ..... 37.624.03 Internet & telephony competition, 0–2 (best) ......77 ....... 1.82
5th pillar: Skills5.01 Quality of educational system* .........................120 ......... 2.85.02 Quality of math & science education* .................83 ......... 3.85.03 Secondary education gross enrollment rate, % ..66 ....... 90.45.04 Adult literacy rate, % ..........................................15 ....... 99.0
INDICATOR RANK /144 VALUE
6th pillar: Individual usage 6.01 Mobile phone subscriptions/100 pop. ................60 ..... 109.3 6.02 Individuals using Internet, %...............................25 ....... 74.4 6.03 Households w/ personal computer, % ...............30 ....... 75.4 6.04 Households w/ Internet access, % ....................29 ....... 70.8 6.05 Broadband Internet subscriptions/100 pop. .......44 ....... 13.6 6.06 Mobile broadband subscriptions/100 pop. .........40 ....... 31.9 6.07 Use of virtual social networks* ...........................53 ......... 5.7
7th pillar: Business usage 7.01 Firm-level technology absorption* ......................59 ......... 4.9 7.02 Capacity for innovation* .....................................88 ......... 2.9 7.03 PCT patents, applications/million pop. ..............39 ......... 7.2 7.04 Business-to-business Internet use* ....................43 ......... 5.4 7.05 Business-to-consumer Internet use* ..................39 ......... 5.0 7.06 Extent of staff training* .......................................95 ......... 3.7
8th pillar: Government usage 8.01 Importance of ICTs to gov’t vision* ...................101 ......... 3.5 8.02 Government Online Service Index, 0–1 (best) .....66 ....... 0.50 8.03 Gov’t success in ICT promotion* ......................113 ......... 3.6
9th pillar: Economic impacts 9.01 Impact of ICTs on new services and products* ..77 ......... 4.3 9.02 ICT PCT patents, applications/million pop. .......33 ......... 2.0 9.03 Impact of ICTs on new organizational models* ...74 ......... 4.1 9.04 Knowledge-intensive jobs, % workforce .............34 ....... 34.6
10th pillar: Social impacts 10.01 Impact of ICTs on access to basic services* ......80 ......... 4.1 10.02 Internet access in schools* ................................29 ......... 5.5 10.03 ICT use & gov’t efficiency* .................................93 ......... 3.8 10.04 E-Participation Index, 0–1 (best).........................81 ....... 0.13
Rank Score (out of 144) (1–7)
Networked Readiness Index 2013 ..............61 ..4.0Networked Readiness Index 2012 (out of 142) ...................... 64 .....3.9
A. Environment subindex ..............................................62 ....4.01st pillar: Political and regulatory environment ................... 70 .....3.72nd pillar: Business and innovation environment ............... 61 .....4.3
B. Readiness subindex .................................................92 ....4.13rd pillar: Infrastructure and digital content ........................ 56 .....4.34th pillar: Affordability ...................................................... 113 .....3.35th pillar: Skills ................................................................... 75 .....4.8
C. Usage subindex ........................................................49 ....4.06th pillar: Individual usage .................................................. 35 .....4.97th pillar: Business usage .................................................. 65 .....3.58th pillar: Government usage ........................................... 100 .....3.7
D. Impact subindex .......................................................57 ....3.79th pillar: Economic impacts .............................................. 44 .....3.510th pillar: Social impacts .................................................. 66 .....3.8
Slovak Republic3: Country/Economy Profiles
The Global Information Technology Report 2013 | 259
Note: Indicators followed by an asterisk (*) are measured on a 1-to-7 (best) scale. For further details and explanation, please refer to the section “How to Read the Country/Economy Profiles” on page 139.
Slovak Republic High-income group average
1. Political and regulatory environment
6. Individual usage
5. Skills7. Business usage
4. Affordability8. Governmentusage
3. Infrastructure anddigital content
9. Economicimpacts
2. Business and innovation environment
10. Socialimpacts
1
2
3
4
5
6
7
@ 2013 World Economic Forum

The Networked Readiness Index in detailINDICATOR RANK /144 VALUE
1st pillar: Political and regulatory environment1.01 Effectiveness of law-making bodies* ................109 ......... 3.01.02 Laws relating to ICTs* ........................................35 ......... 4.81.03 Judicial independence* ......................................70 ......... 3.81.04 Efficiency of legal system in settling disputes* ..126 ......... 2.71.05 Efficiency of legal system in challenging regs* ..116 ......... 2.91.06 Intellectual property protection* ..........................41 ......... 4.31.07 Software piracy rate, % software installed ..........33 .......... 461.08 No. procedures to enforce a contract ................28 .......... 321.09 No. days to enforce a contract ........................135 ..... 1,290
2nd pillar: Business and innovation environment2.01 Availability of latest technologies* .......................41 ......... 5.62.02 Venture capital availability* ...............................113 ......... 2.1
2.03 Total tax rate, % profits ......................................57 ....... 34.72.04 No. days to start a business ..............................16 ............ 62.05 No. procedures to start a business ......................3 ............ 22.06 Intensity of local competition* .............................41 ......... 5.2
2.07 Tertiary education gross enrollment rate, % ..........4 ....... 89.62.08 Quality of management schools* ........................66 ......... 4.32.09 Gov’t procurement of advanced tech* .............106 ......... 3.1
3rd pillar: Infrastructure and digital content 3.01 Electricity production, kWh/capita ......................26 .. 7,931.3 3.02 Mobile network coverage, % pop ......................41 ....... 99.73.03 Int’l Internet bandwidth, kb/s per user................26 ....... 68.23.04 Secure Internet servers/million pop ....................28 ..... 433.23.05 Accessibility of digital content* ...........................34 ......... 5.8
4th pillar: Affordability 4.01 Mobile cellular tariffs, PPP $/min. .......................70 ....... 0.284.02 Fixed broadband Internet tariffs, PPP $/month ..96 ..... 41.064.03 Internet & telephony competition, 0–2 (best) ........1 ....... 2.00
5th pillar: Skills5.01 Quality of educational system* ...........................63 ......... 3.8
5.02 Quality of math & science education* .................18 ......... 5.1 5.03 Secondary education gross enrollment rate, % ..44 ....... 97.35.04 Adult literacy rate, % ............................................9 ....... 99.7
INDICATOR RANK /144 VALUE
6th pillar: Individual usage 6.01 Mobile phone subscriptions/100 pop. ................70 ..... 106.6 6.02 Individuals using Internet, %...............................28 ....... 72.0 6.03 Households w/ personal computer, % ...............31 ....... 74.4 6.04 Households w/ Internet access, % ....................26 ....... 72.6 6.05 Broadband Internet subscriptions/100 pop. .......24 ....... 24.3 6.06 Mobile broadband subscriptions/100 pop. .........43 ....... 29.3 6.07 Use of virtual social networks* ...........................69 ......... 5.4
7th pillar: Business usage 7.01 Firm-level technology absorption* ......................78 ......... 4.7 7.02 Capacity for innovation* .....................................31 ......... 3.9 7.03 PCT patents, applications/million pop. ..............23 ....... 60.7 7.04 Business-to-business Internet use* ....................26 ......... 5.7 7.05 Business-to-consumer Internet use* ..................55 ......... 4.8 7.06 Extent of staff training* .......................................91 ......... 3.7
8th pillar: Government usage 8.01 Importance of ICTs to gov’t vision* .....................99 ......... 3.5 8.02 Government Online Service Index, 0–1 (best) .....35 ....... 0.67 8.03 Gov’t success in ICT promotion* ........................74 ......... 4.4
9th pillar: Economic impacts 9.01 Impact of ICTs on new services and products* ..69 ......... 4.5 9.02 ICT PCT patents, applications/million pop. .......25 ......... 8.6 9.03 Impact of ICTs on new organizational models* ...79 ......... 4.1 9.04 Knowledge-intensive jobs, % workforce .............25 ....... 38.0
10th pillar: Social impacts 10.01 Impact of ICTs on access to basic services* ......44 ......... 4.8 10.02 Internet access in schools* ................................20 ......... 5.8 10.03 ICT use & gov’t efficiency* .................................71 ......... 4.2 10.04 E-Participation Index, 0–1 (best).........................62 ....... 0.21
Rank Score (out of 144) (1–7)
Networked Readiness Index 2013 ..............37 ..4.5Networked Readiness Index 2012 (out of 142) ...................... 37 .....4.6
A. Environment subindex ..............................................44 ....4.31st pillar: Political and regulatory environment ................... 61 .....3.82nd pillar: Business and innovation environment ............... 28 .....4.9
B. Readiness subindex .................................................31 ....5.33rd pillar: Infrastructure and digital content ........................ 25 .....5.84th pillar: Affordability ........................................................ 85 .....4.95th pillar: Skills ................................................................... 36 .....5.3
C. Usage subindex ........................................................35 ....4.46th pillar: Individual usage .................................................. 32 .....5.17th pillar: Business usage .................................................. 32 .....3.98th pillar: Government usage ............................................. 52 .....4.3
D. Impact subindex .......................................................40 ....4.09th pillar: Economic impacts .............................................. 34 .....3.810th pillar: Social impacts .................................................. 46 .....4.3
Slovenia3: Country/Economy Profiles
260 | The Global Information Technology Report 2013
Note: Indicators followed by an asterisk (*) are measured on a 1-to-7 (best) scale. For further details and explanation, please refer to the section “How to Read the Country/Economy Profiles” on page 139.
Slovenia High-income group average
1. Political and regulatory environment
6. Individual usage
5. Skills7. Business usage
4. Affordability8. Governmentusage
3. Infrastructure anddigital content
9. Economicimpacts
2. Business and innovation environment
10. Socialimpacts
1
2
3
4
5
6
7
@ 2013 World Economic Forum

The Networked Readiness Index in detailINDICATOR RANK /144 VALUE
1st pillar: Political and regulatory environment1.01 Effectiveness of law-making bodies* ..................31 ......... 4.31.02 Laws relating to ICTs* ........................................29 ......... 5.01.03 Judicial independence* ......................................27 ......... 5.31.04 Efficiency of legal system in settling disputes* ....17 ......... 5.01.05 Efficiency of legal system in challenging regs* ....16 ......... 4.81.06 Intellectual property protection* ..........................20 ......... 5.31.07 Software piracy rate, % software installed ..........20 .......... 351.08 No. procedures to enforce a contract ................15 .......... 291.09 No. days to enforce a contract ..........................92 ........ 600
2nd pillar: Business and innovation environment2.01 Availability of latest technologies* .......................39 ......... 5.72.02 Venture capital availability* .................................37 ......... 3.12.03 Total tax rate, % profits ......................................47 ....... 33.32.04 No. days to start a business ..............................81 .......... 192.05 No. procedures to start a business ....................30 ............ 52.06 Intensity of local competition* .............................51 ......... 5.1
2.07 Tertiary education gross enrollment rate, % ......100 ....... 15.42.08 Quality of management schools* ........................15 ......... 5.32.09 Gov’t procurement of advanced tech* .............105 ......... 3.1
3rd pillar: Infrastructure and digital content3.01 Electricity production, kWh/capita ......................45 .. 5,004.33.02 Mobile network coverage, % pop ......................40 ....... 99.83.03 Int’l Internet bandwidth, kb/s per user................66 ....... 18.93.04 Secure Internet servers/million pop ....................54 ....... 73.93.05 Accessibility of digital content* ...........................85 ......... 4.8
4th pillar: Affordability 4.01 Mobile cellular tariffs, PPP $/min. .....................117 ....... 0.514.02 Fixed broadband Internet tariffs, PPP $/month ..89 ..... 37.484.03 Internet & telephony competition, 0–2 (best) ....118 ....... 1.13
5th pillar: Skills5.01 Quality of educational system* .........................140 ......... 2.25.02 Quality of math & science education* ...............143 ......... 2.05.03 Secondary education gross enrollment rate, % ..56 ....... 93.85.04 Adult literacy rate, % ..........................................93 ....... 88.7
INDICATOR RANK /144 VALUE
6th pillar: Individual usage 6.01 Mobile phone subscriptions/100 pop. ................37 ..... 126.8 6.02 Individuals using Internet, %...............................96 ....... 21.0 6.03 Households w/ personal computer, % ...............90 ....... 18.3 6.04 Households w/ Internet access, % ....................94 ......... 9.8 6.05 Broadband Internet subscriptions/100 pop. .......96 ......... 1.8 6.06 Mobile broadband subscriptions/100 pop. .........55 ....... 19.8 6.07 Use of virtual social networks* ...........................86 ......... 5.3
7th pillar: Business usage 7.01 Firm-level technology absorption* ......................38 ......... 5.4 7.02 Capacity for innovation* .....................................41 ......... 3.5 7.03 PCT patents, applications/million pop. ..............42 ......... 6.0 7.04 Business-to-business Internet use* ....................36 ......... 5.6 7.05 Business-to-consumer Internet use* ..................52 ......... 4.8 7.06 Extent of staff training* .......................................26 ......... 4.6
8th pillar: Government usage 8.01 Importance of ICTs to gov’t vision* ...................105 ......... 3.4 8.02 Government Online Service Index, 0–1 (best) .....79 ....... 0.46 8.03 Gov’t success in ICT promotion* ......................100 ......... 3.9
9th pillar: Economic impacts 9.01 Impact of ICTs on new services and products* ..44 ......... 4.8 9.02 ICT PCT patents, applications/million pop. .......42 ......... 1.0 9.03 Impact of ICTs on new organizational models* ...53 ......... 4.4 9.04 Knowledge-intensive jobs, % workforce .............58 ....... 23.7
10th pillar: Social impacts 10.01 Impact of ICTs on access to basic services* ....123 ......... 3.4 10.02 Internet access in schools* ..............................111 ......... 3.1 10.03 ICT use & gov’t efficiency* .................................97 ......... 3.8 10.04 E-Participation Index, 0–1 (best).........................76 ....... 0.16
Rank Score (out of 144) (1–7)
Networked Readiness Index 2013 ..............70 ..3.9Networked Readiness Index 2012 (out of 142) ...................... 72 .....3.9
A. Environment subindex ..............................................33 ....4.71st pillar: Political and regulatory environment ................... 21 .....5.02nd pillar: Business and innovation environment ............... 55 .....4.4
B. Readiness subindex .................................................95 ....4.03rd pillar: Infrastructure and digital content ........................ 59 .....4.24th pillar: Affordability ...................................................... 104 .....3.95th pillar: Skills ................................................................. 102 .....4.0
C. Usage subindex ........................................................72 ....3.56th pillar: Individual usage .................................................. 81 .....3.07th pillar: Business usage .................................................. 33 .....3.98th pillar: Government usage ........................................... 102 .....3.7
D. Impact subindex .......................................................92 ....3.29th pillar: Economic impacts .............................................. 51 .....3.410th pillar: Social impacts ................................................ 112 .....3.1
South Africa3: Country/Economy Profiles
The Global Information Technology Report 2013 | 261
Note: Indicators followed by an asterisk (*) are measured on a 1-to-7 (best) scale. For further details and explanation, please refer to the section “How to Read the Country/Economy Profiles” on page 139.
South Africa Upper-middle-income group average
1. Political and regulatory environment
6. Individual usage
5. Skills7. Business usage
4. Affordability8. Governmentusage
3. Infrastructure anddigital content
9. Economicimpacts
2. Business and innovation environment
10. Socialimpacts
1
2
3
4
5
6
7
@ 2013 World Economic Forum

The Networked Readiness Index in detailINDICATOR RANK /144 VALUE
1st pillar: Political and regulatory environment1.01 Effectiveness of law-making bodies* ..................60 ......... 3.71.02 Laws relating to ICTs* ........................................39 ......... 4.71.03 Judicial independence* ......................................60 ......... 4.01.04 Efficiency of legal system in settling disputes* ....69 ......... 3.71.05 Efficiency of legal system in challenging regs* ....62 ......... 3.81.06 Intellectual property protection* ..........................50 ......... 4.01.07 Software piracy rate, % software installed ..........32 .......... 441.08 No. procedures to enforce a contract ................99 .......... 401.09 No. days to enforce a contract ..........................65 ........ 510
2nd pillar: Business and innovation environment2.01 Availability of latest technologies* .......................33 ......... 5.92.02 Venture capital availability* .................................75 ......... 2.52.03 Total tax rate, % profits ......................................73 ....... 38.72.04 No. days to start a business ............................105 .......... 282.05 No. procedures to start a business ..................114 .......... 102.06 Intensity of local competition* .............................23 ......... 5.52.07 Tertiary education gross enrollment rate, % ........12 ....... 78.12.08 Quality of management schools* ..........................4 ......... 5.82.09 Gov’t procurement of advanced tech* ...............89 ......... 3.3
3rd pillar: Infrastructure and digital content3.01 Electricity production, kWh/capita ......................33 .. 6,409.73.02 Mobile network coverage, % pop ......................38 ....... 99.83.03 Int’l Internet bandwidth, kb/s per user................27 ....... 64.13.04 Secure Internet servers/million pop ....................32 ..... 284.73.05 Accessibility of digital content* ...........................36 ......... 5.6
4th pillar: Affordability4.01 Mobile cellular tariffs, PPP $/min. .....................132 ....... 0.754.02 Fixed broadband Internet tariffs, PPP $/month ..71 ..... 32.844.03 Internet & telephony competition, 0–2 (best) ........1 ....... 2.00
5th pillar: Skills5.01 Quality of educational system* ...........................81 ......... 3.55.02 Quality of math & science education* .................97 ......... 3.65.03 Secondary education gross enrollment rate, % ....2 ..... 124.75.04 Adult literacy rate, % ..........................................51 ....... 97.7
INDICATOR RANK /144 VALUE
6th pillar: Individual usage 6.01 Mobile phone subscriptions/100 pop. ................57 ..... 113.2 6.02 Individuals using Internet, %...............................38 ....... 67.6 6.03 Households w/ personal computer, % ...............32 ....... 71.5 6.04 Households w/ Internet access, % ....................36 ....... 63.9 6.05 Broadband Internet subscriptions/100 pop. .......26 ....... 23.8 6.06 Mobile broadband subscriptions/100 pop. .........25 ....... 41.6 6.07 Use of virtual social networks* ...........................59 ......... 5.6
7th pillar: Business usage 7.01 Firm-level technology absorption* ......................48 ......... 5.1 7.02 Capacity for innovation* .....................................44 ......... 3.5 7.03 PCT patents, applications/million pop. ..............25 ....... 38.0 7.04 Business-to-business Internet use* ....................46 ......... 5.4 7.05 Business-to-consumer Internet use* ..................40 ......... 5.0 7.06 Extent of staff training* .....................................105 ......... 3.6
8th pillar: Government usage 8.01 Importance of ICTs to gov’t vision* .....................84 ......... 3.8 8.02 Government Online Service Index, 0–1 (best) .....23 ....... 0.76 8.03 Gov’t success in ICT promotion* ........................87 ......... 4.1
9th pillar: Economic impacts 9.01 Impact of ICTs on new services and products* ..38 ......... 4.9 9.02 ICT PCT patents, applications/million pop. .......26 ......... 8.4 9.03 Impact of ICTs on new organizational models* ...51 ......... 4.4 9.04 Knowledge-intensive jobs, % workforce .............37 ....... 32.4
10th pillar: Social impacts 10.01 Impact of ICTs on access to basic services* ......34 ......... 5.1 10.02 Internet access in schools* ................................47 ......... 4.8 10.03 ICT use & gov’t efficiency* .................................48 ......... 4.5 10.04 E-Participation Index, 0–1 (best).........................31 ....... 0.50
Rank Score (out of 144) (1–7)
Networked Readiness Index 2013 ..............38 ..4.5Networked Readiness Index 2012 (out of 142) ...................... 38 .....4.5
A. Environment subindex ..............................................40 ....4.51st pillar: Political and regulatory environment ................... 44 .....4.12nd pillar: Business and innovation environment ............... 29 .....4.8
B. Readiness subindex .................................................61 ....4.83rd pillar: Infrastructure and digital content ........................ 31 .....5.44th pillar: Affordability ...................................................... 102 .....3.95th pillar: Skills ................................................................... 46 .....5.2
C. Usage subindex ........................................................33 ....4.56th pillar: Individual usage .................................................. 31 .....5.17th pillar: Business usage .................................................. 41 .....3.88th pillar: Government usage ............................................. 42 .....4.5
D. Impact subindex .......................................................36 ....4.29th pillar: Economic impacts .............................................. 32 .....3.910th pillar: Social impacts .................................................. 36 .....4.6
Spain3: Country/Economy Profiles
262 | The Global Information Technology Report 2013
Note: Indicators followed by an asterisk (*) are measured on a 1-to-7 (best) scale. For further details and explanation, please refer to the section “How to Read the Country/Economy Profiles” on page 139.
Spain High-income group average
1. Political and regulatory environment
6. Individual usage
5. Skills7. Business usage
4. Affordability8. Governmentusage
3. Infrastructure anddigital content
9. Economicimpacts
2. Business and innovation environment
10. Socialimpacts
1
2
3
4
5
6
7
@ 2013 World Economic Forum

The Networked Readiness Index in detailINDICATOR RANK /144 VALUE
1st pillar: Political and regulatory environment1.01 Effectiveness of law-making bodies* ..................25 ......... 4.71.02 Laws relating to ICTs* ........................................67 ......... 4.01.03 Judicial independence* ......................................56 ......... 4.11.04 Efficiency of legal system in settling disputes* ....33 ......... 4.51.05 Efficiency of legal system in challenging regs* ....34 ......... 4.41.06 Intellectual property protection* ..........................55 ......... 3.81.07 Software piracy rate, % software installed ..........94 .......... 841.08 No. procedures to enforce a contract ................99 .......... 401.09 No. days to enforce a contract ........................136 ..... 1,318
2nd pillar: Business and innovation environment2.01 Availability of latest technologies* .......................62 ......... 5.12.02 Venture capital availability* ...............................107 ......... 2.22.03 Total tax rate, % profits ....................................113 ....... 50.12.04 No. days to start a business ..............................25 ............ 72.05 No. procedures to start a business ....................30 ............ 52.06 Intensity of local competition* .............................26 ......... 5.5
2.07 Tertiary education gross enrollment rate, % ........99 ....... 15.52.08 Quality of management schools* ........................38 ......... 4.82.09 Gov’t procurement of advanced tech* .................7 ......... 4.6
3rd pillar: Infrastructure and digital content3.01 Electricity production, kWh/capita ....................113 ..... 483.33.02 Mobile network coverage, % pop ......................74 ....... 98.03.03 Int’l Internet bandwidth, kb/s per user..............105 ......... 5.23.04 Secure Internet servers/million pop ....................99 ......... 6.03.05 Accessibility of digital content* ...........................99 ......... 4.4
4th pillar: Affordability4.01 Mobile cellular tariffs, PPP $/min. .........................5 ....... 0.044.02 Fixed broadband Internet tariffs, PPP $/month ....2 ..... 10.984.03 Internet & telephony competition, 0–2 (best) ....129 ....... 0.88
5th pillar: Skills5.01 Quality of educational system* ...........................33 ......... 4.4
5.02 Quality of math & science education* .................69 ......... 4.0 5.03 Secondary education gross enrollment rate, % ..36 ..... 100.2 5.04 Adult literacy rate, % ..........................................81 ....... 91.2
INDICATOR RANK /144 VALUE
6th pillar: Individual usage 6.01 Mobile phone subscriptions/100 pop. ..............100 ....... 87.0 6.02 Individuals using Internet, %.............................107 ....... 15.0 6.03 Households w/ personal computer, % .............100 ....... 12.3 6.04 Households w/ Internet access, % ..................104 ......... 5.9 6.05 Broadband Internet subscriptions/100 pop. .......97 ......... 1.7 6.06 Mobile broadband subscriptions/100 pop. .........99 ......... 2.3 6.07 Use of virtual social networks* .........................112 ......... 4.8
7th pillar: Business usage 7.01 Firm-level technology absorption* ......................42 ......... 5.2 7.02 Capacity for innovation* .....................................93 ......... 2.9 7.03 PCT patents, applications/million pop. ..............74 ......... 0.5 7.04 Business-to-business Internet use* ...................n/a ......... n/a 7.05 Business-to-consumer Internet use* .................n/a ......... n/a 7.06 Extent of staff training* .......................................80 ......... 3.8
8th pillar: Government usage 8.01 Importance of ICTs to gov’t vision* .....................14 ......... 5.1 8.02 Government Online Service Index, 0–1 (best) .....93 ....... 0.38 8.03 Gov’t success in ICT promotion* .......................n/a ......... n/a
9th pillar: Economic impacts 9.01 Impact of ICTs on new services and products* ..40 ......... 4.9 9.02 ICT PCT patents, applications/million pop. .......78 ......... 0.1 9.03 Impact of ICTs on new organizational models* ...42 ......... 4.5 9.04 Knowledge-intensive jobs, % workforce .............73 ....... 19.7
10th pillar: Social impacts 10.01 Impact of ICTs on access to basic services* ......41 ......... 4.8 10.02 Internet access in schools* ..............................105 ......... 3.3 10.03 ICT use & gov’t efficiency* .................................31 ......... 4.9 10.04 E-Participation Index, 0–1 (best).........................96 ....... 0.08
Rank Score (out of 144) (1–7)
Networked Readiness Index 2013 ..............69 ..3.9Networked Readiness Index 2012 (out of 142) ...................... 71 .....3.9
A. Environment subindex ..............................................63 ....4.01st pillar: Political and regulatory environment ................... 68 .....3.72nd pillar: Business and innovation environment ............... 67 .....4.2
B. Readiness subindex .................................................64 ....4.83rd pillar: Infrastructure and digital content ...................... 101 .....3.14th pillar: Affordability ........................................................ 29 .....6.05th pillar: Skills ................................................................... 38 .....5.3
C. Usage subindex ........................................................90 ....3.36th pillar: Individual usage ................................................ 110 .....2.27th pillar: Business usage .................................................. 57 .....3.68th pillar: Government usage ............................................. 57 .....4.2
D. Impact subindex .......................................................70 ....3.59th pillar: Economic impacts .............................................. 62 .....3.310th pillar: Social impacts .................................................. 77 .....3.6
Sri Lanka3: Country/Economy Profiles
The Global Information Technology Report 2013 | 263
Note: Indicators followed by an asterisk (*) are measured on a 1-to-7 (best) scale. For further details and explanation, please refer to the section “How to Read the Country/Economy Profiles” on page 139.
Sri Lanka Lower-middle-income group average
1. Political and regulatory environment
6. Individual usage
5. Skills7. Business usage
4. Affordability8. Governmentusage
3. Infrastructure anddigital content
9. Economicimpacts
2. Business and innovation environment
10. Socialimpacts
1
2
3
4
5
6
7
@ 2013 World Economic Forum

The Networked Readiness Index in detailINDICATOR RANK /144 VALUE
1st pillar: Political and regulatory environment1.01 Effectiveness of law-making bodies* ................119 ......... 2.71.02 Laws relating to ICTs* ......................................139 ......... 2.31.03 Judicial independence* ......................................55 ......... 4.11.04 Efficiency of legal system in settling disputes* ..116 ......... 3.01.05 Efficiency of legal system in challenging regs* ..115 ......... 2.91.06 Intellectual property protection* ........................129 ......... 2.51.07 Software piracy rate, % software installed .........n/a ......... n/a1.08 No. procedures to enforce a contract ..............124 .......... 441.09 No. days to enforce a contract ........................143 ..... 1,715
2nd pillar: Business and innovation environment2.01 Availability of latest technologies* .....................110 ......... 4.32.02 Venture capital availability* ...............................123 ......... 2.02.03 Total tax rate, % profits ......................................29 ....... 27.92.04 No. days to start a business ............................143 ........ 6942.05 No. procedures to start a business ..................132 .......... 132.06 Intensity of local competition* .............................76 ......... 4.72.07 Tertiary education gross enrollment rate, % ......106 ....... 12.12.08 Quality of management schools* ........................63 ......... 4.32.09 Gov’t procurement of advanced tech* .............126 ......... 2.8
3rd pillar: Infrastructure and digital content3.01 Electricity production, kWh/capita ......................63 .. 3,083.53.02 Mobile network coverage, % pop .....................n/a ......... n/a3.03 Int’l Internet bandwidth, kb/s per user................83 ....... 10.03.04 Secure Internet servers/million pop ....................63 ....... 34.03.05 Accessibility of digital content* .........................112 ......... 4.1
4th pillar: Affordability4.01 Mobile cellular tariffs, PPP $/min. .......................44 ....... 0.194.02 Fixed broadband Internet tariffs, PPP $/month ..92 ..... 40.084.03 Internet & telephony competition, 0–2 (best) ....121 ....... 1.10
5th pillar: Skills5.01 Quality of educational system* ...........................84 ......... 3.45.02 Quality of math & science education* .................85 ......... 3.85.03 Secondary education gross enrollment rate, % ..98 ....... 74.85.04 Adult literacy rate, % ..........................................64 ....... 94.7
INDICATOR RANK /144 VALUE
6th pillar: Individual usage 6.01 Mobile phone subscriptions/100 pop. ..................6 ..... 178.9 6.02 Individuals using Internet, %...............................83 ....... 32.0 6.03 Households w/ personal computer, % ...............74 ....... 32.3 6.04 Households w/ Internet access, % ....................80 ....... 17.5 6.05 Broadband Internet subscriptions/100 pop. .......77 ......... 4.6 6.06 Mobile broadband subscriptions/100 pop. .......126 ......... 0.0 6.07 Use of virtual social networks* .........................110 ......... 4.9
7th pillar: Business usage 7.01 Firm-level technology absorption* ....................121 ......... 4.1 7.02 Capacity for innovation* ...................................106 ......... 2.7 7.03 PCT patents, applications/million pop. ..............71 ......... 0.7 7.04 Business-to-business Internet use* ..................125 ......... 4.2 7.05 Business-to-consumer Internet use* ................125 ......... 3.4 7.06 Extent of staff training* .......................................47 ......... 4.2
8th pillar: Government usage 8.01 Importance of ICTs to gov’t vision* ...................137 ......... 2.7 8.02 Government Online Service Index, 0–1 (best) ...133 ....... 0.16 8.03 Gov’t success in ICT promotion* ......................111 ......... 3.7
9th pillar: Economic impacts 9.01 Impact of ICTs on new services and products* 127 ......... 3.5 9.02 ICT PCT patents, applications/million pop. .......95 ......... 0.0 9.03 Impact of ICTs on new organizational models* .124 ......... 3.3 9.04 Knowledge-intensive jobs, % workforce .............65 ....... 21.6
10th pillar: Social impacts 10.01 Impact of ICTs on access to basic services* ....129 ......... 3.2 10.02 Internet access in schools* ..............................125 ......... 2.5 10.03 ICT use & gov’t efficiency* ...............................141 ......... 2.6 10.04 E-Participation Index, 0–1 (best).......................124 ....... 0.00
Rank Score (out of 144) (1–7)
Networked Readiness Index 2013 ............117 ..3.1Networked Readiness Index 2012 (out of 142) .................... 121 .....3.0
A. Environment subindex ............................................135 ....3.11st pillar: Political and regulatory environment ................. 135 .....2.72nd pillar: Business and innovation environment ............. 125 .....3.4
B. Readiness subindex ...............................................100 ....3.93rd pillar: Infrastructure and digital content ...................... 118 .....2.74th pillar: Affordability ........................................................ 90 .....4.65th pillar: Skills ................................................................... 89 .....4.5
C. Usage subindex ......................................................112 ....3.06th pillar: Individual usage .................................................. 79 .....3.17th pillar: Business usage ................................................ 113 .....3.18th pillar: Government usage ........................................... 138 .....2.8
D. Impact subindex .....................................................130 ....2.59th pillar: Economic impacts ............................................ 113 .....2.710th pillar: Social impacts ................................................ 137 .....2.3
Suriname3: Country/Economy Profiles
264 | The Global Information Technology Report 2013
Note: Indicators followed by an asterisk (*) are measured on a 1-to-7 (best) scale. For further details and explanation, please refer to the section “How to Read the Country/Economy Profiles” on page 139.
Suriname Upper-middle-income group average
1. Political and regulatory environment
6. Individual usage
5. Skills7. Business usage
4. Affordability8. Governmentusage
3. Infrastructure anddigital content
9. Economicimpacts
2. Business and innovation environment
10. Socialimpacts
1
2
3
4
5
6
7
@ 2013 World Economic Forum

The Networked Readiness Index in detailINDICATOR RANK /144 VALUE
1st pillar: Political and regulatory environment1.01 Effectiveness of law-making bodies* ................110 ......... 2.91.02 Laws relating to ICTs* ......................................133 ......... 2.61.03 Judicial independence* ......................................90 ......... 3.31.04 Efficiency of legal system in settling disputes* ....81 ......... 3.51.05 Efficiency of legal system in challenging regs* ..108 ......... 3.01.06 Intellectual property protection* ..........................69 ......... 3.61.07 Software piracy rate, % software installed .........n/a ......... n/a1.08 No. procedures to enforce a contract ................99 .......... 401.09 No. days to enforce a contract ........................128 ........ 956
2nd pillar: Business and innovation environment2.01 Availability of latest technologies* .....................131 ......... 3.82.02 Venture capital availability* ...............................120 ......... 2.12.03 Total tax rate, % profits ......................................69 ....... 36.82.04 No. days to start a business ............................129 .......... 562.05 No. procedures to start a business ..................126 .......... 122.06 Intensity of local competition* ...........................111 ......... 4.22.07 Tertiary education gross enrollment rate, % ......127 ......... 4.42.08 Quality of management schools* ......................135 ......... 2.82.09 Gov’t procurement of advanced tech* .............137 ......... 2.5
3rd pillar: Infrastructure and digital content3.01 Electricity production, kWh/capita ....................114 ..... 431.23.02 Mobile network coverage, % pop ......................94 ....... 94.93.03 Int’l Internet bandwidth, kb/s per user..............122 ......... 2.33.04 Secure Internet servers/million pop ....................85 ....... 15.03.05 Accessibility of digital content* .........................117 ......... 3.9
4th pillar: Affordability4.01 Mobile cellular tariffs, PPP $/min. .....................112 ....... 0.474.02 Fixed broadband Internet tariffs, PPP $/month 137 1,431.454.03 Internet & telephony competition, 0–2 (best) ....139 ....... 0.08
5th pillar: Skills5.01 Quality of educational system* .........................110 ......... 3.15.02 Quality of math & science education* ...............110 ......... 3.25.03 Secondary education gross enrollment rate, % 111 ....... 58.15.04 Adult literacy rate, % ..........................................96 ....... 87.4
INDICATOR RANK /144 VALUE
6th pillar: Individual usage 6.01 Mobile phone subscriptions/100 pop. ..............121 ....... 63.7 6.02 Individuals using Internet, %.............................100 ....... 18.1 6.03 Households w/ personal computer, % .............103 ....... 10.7 6.04 Households w/ Internet access, % ..................110 ......... 3.6 6.05 Broadband Internet subscriptions/100 pop. .....118 ......... 0.2 6.06 Mobile broadband subscriptions/100 pop. .......112 ......... 0.7 6.07 Use of virtual social networks* .........................101 ......... 5.1
7th pillar: Business usage 7.01 Firm-level technology absorption* ....................124 ......... 4.0 7.02 Capacity for innovation* ...................................130 ......... 2.4 7.03 PCT patents, applications/million pop. ..............95 ......... 0.1 7.04 Business-to-business Internet use* ....................98 ......... 4.6 7.05 Business-to-consumer Internet use* ................127 ......... 3.3 7.06 Extent of staff training* .......................................87 ......... 3.8
8th pillar: Government usage 8.01 Importance of ICTs to gov’t vision* ...................131 ......... 2.8 8.02 Government Online Service Index, 0–1 (best) ...135 ....... 0.14 8.03 Gov’t success in ICT promotion* ......................135 ......... 3.1
9th pillar: Economic impacts 9.01 Impact of ICTs on new services and products* 140 ......... 2.9 9.02 ICT PCT patents, applications/million pop. .......95 ......... 0.0 9.03 Impact of ICTs on new organizational models* .139 ......... 2.8 9.04 Knowledge-intensive jobs, % workforce ............n/a ......... n/a
10th pillar: Social impacts 10.01 Impact of ICTs on access to basic services* ....137 ......... 3.1 10.02 Internet access in schools* ..............................126 ......... 2.5 10.03 ICT use & gov’t efficiency* ...............................139 ......... 2.7 10.04 E-Participation Index, 0–1 (best).......................106 ....... 0.05
Rank Score (out of 144) (1–7)
Networked Readiness Index 2013 ............136 ..2.7Networked Readiness Index 2012 (out of 142) .................... 136 .....2.7
A. Environment subindex ............................................133 ....3.11st pillar: Political and regulatory environment ................. 112 .....3.22nd pillar: Business and innovation environment ............. 138 .....3.0
B. Readiness subindex ...............................................130 ....2.83rd pillar: Infrastructure and digital content ...................... 112 .....2.84th pillar: Affordability ...................................................... 137 .....2.05th pillar: Skills ................................................................. 110 .....3.7
C. Usage subindex ......................................................138 ....2.56th pillar: Individual usage ................................................ 119 .....2.07th pillar: Business usage ................................................ 124 .....2.98th pillar: Government usage ........................................... 140 .....2.6
D. Impact subindex .....................................................137 ....2.39th pillar: Economic impacts ............................................ 140 .....2.210th pillar: Social impacts ................................................ 134 .....2.4
Swaziland3: Country/Economy Profiles
The Global Information Technology Report 2013 | 265
Note: Indicators followed by an asterisk (*) are measured on a 1-to-7 (best) scale. For further details and explanation, please refer to the section “How to Read the Country/Economy Profiles” on page 139.
Swaziland Lower-middle-income group average
1. Political and regulatory environment
6. Individual usage
5. Skills7. Business usage
4. Affordability8. Governmentusage
3. Infrastructure anddigital content
9. Economicimpacts
2. Business and innovation environment
10. Socialimpacts
1
2
3
4
5
6
7
@ 2013 World Economic Forum

The Networked Readiness Index in detailINDICATOR RANK /144 VALUE
1st pillar: Political and regulatory environment1.01 Effectiveness of law-making bodies* ....................5 ......... 5.51.02 Laws relating to ICTs* ..........................................8 ......... 5.51.03 Judicial independence* ........................................9 ......... 6.21.04 Efficiency of legal system in settling disputes* ......5 ......... 5.61.05 Efficiency of legal system in challenging regs* ......5 ......... 5.51.06 Intellectual property protection* ..........................12 ......... 5.61.07 Software piracy rate, % software installed ............7 .......... 241.08 No. procedures to enforce a contract ................18 .......... 301.09 No. days to enforce a contract ..........................13 ........ 314
2nd pillar: Business and innovation environment2.01 Availability of latest technologies* .........................1 ......... 6.72.02 Venture capital availability* ...................................5 ......... 4.42.03 Total tax rate, % profits ....................................118 ....... 53.02.04 No. days to start a business ..............................72 .......... 162.05 No. procedures to start a business ....................10 ............ 32.06 Intensity of local competition* .............................22 ......... 5.52.07 Tertiary education gross enrollment rate, % ........18 ....... 73.82.08 Quality of management schools* ........................11 ......... 5.42.09 Gov’t procurement of advanced tech* ...............12 ......... 4.5
3rd pillar: Infrastructure and digital content3.01 Electricity production, kWh/capita ........................5 16,291.63.02 Mobile network coverage, % pop ......................51 ....... 99.03.03 Int’l Internet bandwidth, kb/s per user..................4 ..... 244.43.04 Secure Internet servers/million pop ....................14 .. 1,451.43.05 Accessibility of digital content* ...........................14 ......... 6.3
4th pillar: Affordability4.01 Mobile cellular tariffs, PPP $/min. .......................14 ....... 0.084.02 Fixed broadband Internet tariffs, PPP $/month ..44 ..... 26.704.03 Internet & telephony competition, 0–2 (best) ........1 ....... 2.00
5th pillar: Skills5.01 Quality of educational system* ...........................12 ......... 5.35.02 Quality of math & science education* .................36 ......... 4.65.03 Secondary education gross enrollment rate, % ..39 ....... 99.25.04 Adult literacy rate, % ..........................................15 ....... 99.0
INDICATOR RANK /144 VALUE
6th pillar: Individual usage 6.01 Mobile phone subscriptions/100 pop. ................46 ..... 118.6 6.02 Individuals using Internet, %.................................4 ....... 91.0 6.03 Households w/ personal computer, % .................4 ....... 91.6 6.04 Households w/ Internet access, % ......................5 ....... 90.6 6.05 Broadband Internet subscriptions/100 pop. .......13 ....... 31.8 6.06 Mobile broadband subscriptions/100 pop. ...........4 ....... 91.5 6.07 Use of virtual social networks* .............................5 ......... 6.4
7th pillar: Business usage 7.01 Firm-level technology absorption* ........................1 ......... 6.3 7.02 Capacity for innovation* .......................................5 ......... 5.5 7.03 PCT patents, applications/million pop. ................1 ..... 297.1 7.04 Business-to-business Internet use* ......................6 ......... 6.1 7.05 Business-to-consumer Internet use* ..................11 ......... 5.8 7.06 Extent of staff training* .........................................6 ......... 5.2
8th pillar: Government usage 8.01 Importance of ICTs to gov’t vision* .....................12 ......... 5.2 8.02 Government Online Service Index, 0–1 (best) .....16 ....... 0.84 8.03 Gov’t success in ICT promotion* ........................13 ......... 5.4
9th pillar: Economic impacts 9.01 Impact of ICTs on new services and products* ....4 ......... 5.7 9.02 ICT PCT patents, applications/million pop. .........3 ..... 105.0 9.03 Impact of ICTs on new organizational models* .....4 ......... 5.4 9.04 Knowledge-intensive jobs, % workforce ...............7 ....... 44.5
10th pillar: Social impacts 10.01 Impact of ICTs on access to basic services* ......10 ......... 5.8 10.02 Internet access in schools* ................................11 ......... 6.1 10.03 ICT use & gov’t efficiency* .................................11 ......... 5.5 10.04 E-Participation Index, 0–1 (best).........................15 ....... 0.68
Rank Score (out of 144) (1–7)
Networked Readiness Index 2013 ................ 3 ..5.9Networked Readiness Index 2012 (out of 142) ........................ 1 .....5.9
A. Environment subindex ................................................5 ....5.51st pillar: Political and regulatory environment ..................... 5 .....5.72nd pillar: Business and innovation environment ............... 11 .....5.3
B. Readiness subindex ...................................................3 ....6.43rd pillar: Infrastructure and digital content .......................... 4 .....6.84th pillar: Affordability .......................................................... 7 .....6.55th pillar: Skills ................................................................... 10 .....5.8
C. Usage subindex ..........................................................1 ....6.06th pillar: Individual usage .................................................... 3 .....6.57th pillar: Business usage .................................................... 4 .....5.98th pillar: Government usage ............................................... 8 .....5.6
D. Impact subindex .........................................................4 ....5.89th pillar: Economic impacts ................................................ 3 .....5.910th pillar: Social impacts .................................................. 10 .....5.6
Sweden3: Country/Economy Profiles
266 | The Global Information Technology Report 2013
Note: Indicators followed by an asterisk (*) are measured on a 1-to-7 (best) scale. For further details and explanation, please refer to the section “How to Read the Country/Economy Profiles” on page 139.
Sweden High-income group average
1. Political and regulatory environment
6. Individual usage
5. Skills7. Business usage
4. Affordability8. Governmentusage
3. Infrastructure anddigital content
9. Economicimpacts
2. Business and innovation environment
10. Socialimpacts
1
2
3
4
5
6
7
@ 2013 World Economic Forum

The Networked Readiness Index in detailINDICATOR RANK /144 VALUE
1st pillar: Political and regulatory environment1.01 Effectiveness of law-making bodies* ..................16 ......... 4.91.02 Laws relating to ICTs* ........................................13 ......... 5.41.03 Judicial independence* ........................................6 ......... 6.31.04 Efficiency of legal system in settling disputes* ......4 ......... 5.71.05 Efficiency of legal system in challenging regs* ......2 ......... 5.61.06 Intellectual property protection* ............................4 ......... 6.01.07 Software piracy rate, % software installed ..........10 .......... 251.08 No. procedures to enforce a contract ................28 .......... 321.09 No. days to enforce a contract ..........................25 ........ 390
2nd pillar: Business and innovation environment2.01 Availability of latest technologies* .........................2 ......... 6.62.02 Venture capital availability* .................................19 ......... 3.62.03 Total tax rate, % profits ......................................37 ....... 30.22.04 No. days to start a business ..............................77 .......... 182.05 No. procedures to start a business ....................48 ............ 62.06 Intensity of local competition* .............................20 ......... 5.62.07 Tertiary education gross enrollment rate, % ........47 ....... 54.82.08 Quality of management schools* ..........................3 ......... 6.02.09 Gov’t procurement of advanced tech* ...............22 ......... 4.3
3rd pillar: Infrastructure and digital content3.01 Electricity production, kWh/capita ......................20 .. 8,504.33.02 Mobile network coverage, % pop ........................1 ..... 100.03.03 Int’l Internet bandwidth, kb/s per user..................5 ..... 167.63.04 Secure Internet servers/million pop ......................5 .. 2,137.53.05 Accessibility of digital content* .............................4 ......... 6.4
4th pillar: Affordability4.01 Mobile cellular tariffs, PPP $/min. .....................120 ....... 0.534.02 Fixed broadband Internet tariffs, PPP $/month ..36 ..... 23.414.03 Internet & telephony competition, 0–2 (best) ........1 ....... 2.00
5th pillar: Skills5.01 Quality of educational system* .............................1 ......... 6.05.02 Quality of math & science education* ...................5 ......... 5.85.03 Secondary education gross enrollment rate, % ..52 ....... 95.45.04 Adult literacy rate, % ..........................................15 ....... 99.0
INDICATOR RANK /144 VALUE
6th pillar: Individual usage 6.01 Mobile phone subscriptions/100 pop. ................29 ..... 131.4 6.02 Individuals using Internet, %...............................10 ....... 85.2 6.03 Households w/ personal computer, % ...............11 ....... 86.9 6.04 Households w/ Internet access, % ......................9 ....... 85.0 6.05 Broadband Internet subscriptions/100 pop. .........1 ....... 40.0 6.06 Mobile broadband subscriptions/100 pop. .........34 ....... 35.6 6.07 Use of virtual social networks* ...........................14 ......... 6.2
7th pillar: Business usage 7.01 Firm-level technology absorption* ........................3 ......... 6.2 7.02 Capacity for innovation* .......................................2 ......... 5.8 7.03 PCT patents, applications/million pop. ................2 ..... 284.7 7.04 Business-to-business Internet use* ......................2 ......... 6.3 7.05 Business-to-consumer Internet use* ..................12 ......... 5.8 7.06 Extent of staff training* .........................................1 ......... 5.6
8th pillar: Government usage 8.01 Importance of ICTs to gov’t vision* .....................37 ......... 4.5 8.02 Government Online Service Index, 0–1 (best) .....32 ....... 0.67 8.03 Gov’t success in ICT promotion* ........................27 ......... 5.1
9th pillar: Economic impacts 9.01 Impact of ICTs on new services and products* ..18 ......... 5.3 9.02 ICT PCT patents, applications/million pop. .........6 ....... 62.9 9.03 Impact of ICTs on new organizational models* ...19 ......... 5.0 9.04 Knowledge-intensive jobs, % workforce ...............4 ....... 47.1
10th pillar: Social impacts 10.01 Impact of ICTs on access to basic services* ........4 ......... 5.9 10.02 Internet access in schools* ..................................6 ......... 6.2 10.03 ICT use & gov’t efficiency* .................................21 ......... 5.1 10.04 E-Participation Index, 0–1 (best).........................43 ....... 0.34
Rank Score (out of 144) (1–7)
Networked Readiness Index 2013 ................ 6 ..5.7Networked Readiness Index 2012 (out of 142) ........................ 5 .....5.6
A. Environment subindex ................................................7 ....5.51st pillar: Political and regulatory environment ..................... 8 .....5.62nd pillar: Business and innovation environment ................. 9 .....5.3
B. Readiness subindex ...................................................8 ....6.03rd pillar: Infrastructure and digital content .......................... 8 .....6.74th pillar: Affordability ........................................................ 68 .....5.35th pillar: Skills ..................................................................... 4 .....6.1
C. Usage subindex ..........................................................8 ....5.76th pillar: Individual usage .................................................. 10 .....6.17th pillar: Business usage .................................................... 1 .....6.18th pillar: Government usage ............................................. 31 .....4.9
D. Impact subindex .........................................................9 ....5.49th pillar: Economic impacts ................................................ 5 .....5.810th pillar: Social impacts .................................................. 24 .....5.1
Switzerland3: Country/Economy Profiles
The Global Information Technology Report 2013 | 267
Note: Indicators followed by an asterisk (*) are measured on a 1-to-7 (best) scale. For further details and explanation, please refer to the section “How to Read the Country/Economy Profiles” on page 139.
Switzerland High-income group average
1. Political and regulatory environment
6. Individual usage
5. Skills7. Business usage
4. Affordability8. Governmentusage
3. Infrastructure anddigital content
9. Economicimpacts
2. Business and innovation environment
10. Socialimpacts
1
2
3
4
5
6
7
@ 2013 World Economic Forum

The Networked Readiness Index in detailINDICATOR RANK /144 VALUE
1st pillar: Political and regulatory environment1.01 Effectiveness of law-making bodies* ..................72 ......... 3.51.02 Laws relating to ICTs* ........................................18 ......... 5.21.03 Judicial independence* ......................................42 ......... 4.61.04 Efficiency of legal system in settling disputes* ....40 ......... 4.31.05 Efficiency of legal system in challenging regs* ....36 ......... 4.21.06 Intellectual property protection* ..........................22 ......... 5.21.07 Software piracy rate, % software installed ..........22 .......... 371.08 No. procedures to enforce a contract ..............129 .......... 451.09 No. days to enforce a contract ..........................65 ........ 510
2nd pillar: Business and innovation environment2.01 Availability of latest technologies* .......................40 ......... 5.62.02 Venture capital availability* ...................................9 ......... 4.12.03 Total tax rate, % profits ......................................59 ....... 34.82.04 No. days to start a business ..............................49 .......... 102.05 No. procedures to start a business ....................10 ............ 32.06 Intensity of local competition* ...............................3 ......... 6.02.07 Tertiary education gross enrollment rate, % ..........7 ....... 83.42.08 Quality of management schools* ........................29 ......... 5.02.09 Gov’t procurement of advanced tech* .................9 ......... 4.6
3rd pillar: Infrastructure and digital content3.01 Electricity production, kWh/capita ......................15 .. 9,221.53.02 Mobile network coverage, % pop ........................1 ..... 100.03.03 Int’l Internet bandwidth, kb/s per user................41 ....... 34.63.04 Secure Internet servers/million pop ....................26 ..... 492.73.05 Accessibility of digital content* ...........................12 ......... 6.3
4th pillar: Affordability4.01 Mobile cellular tariffs, PPP $/min. .....................119 ....... 0.534.02 Fixed broadband Internet tariffs, PPP $/month ..14 ..... 18.034.03 Internet & telephony competition, 0–2 (best) ........1 ....... 2.00
5th pillar: Skills5.01 Quality of educational system* ...........................24 ......... 4.85.02 Quality of math & science education* ...................6 ......... 5.65.03 Secondary education gross enrollment rate, % ..38 ..... 100.05.04 Adult literacy rate, % ..........................................47 ....... 98.0
INDICATOR RANK /144 VALUE
6th pillar: Individual usage 6.01 Mobile phone subscriptions/100 pop. ................41 ..... 124.1 6.02 Individuals using Internet, %...............................28 ....... 72.0 6.03 Households w/ personal computer, % .................9 ....... 87.5 6.04 Households w/ Internet access, % ....................14 ....... 82.5 6.05 Broadband Internet subscriptions/100 pop. .......27 ....... 23.7 6.06 Mobile broadband subscriptions/100 pop. .........22 ....... 42.7 6.07 Use of virtual social networks* ...........................37 ......... 5.9
7th pillar: Business usage 7.01 Firm-level technology absorption* ......................19 ......... 5.8 7.02 Capacity for innovation* .....................................15 ......... 4.7 7.03 PCT patents, applications/million pop. .............n/a ......... n/a 7.04 Business-to-business Internet use* ......................9 ......... 6.0 7.05 Business-to-consumer Internet use* ....................5 ......... 6.0 7.06 Extent of staff training* .......................................31 ......... 4.6
8th pillar: Government usage 8.01 Importance of ICTs to gov’t vision* .....................11 ......... 5.3 8.02 Government Online Service Index, 0–1 (best) ....n/a ......... n/a 8.03 Gov’t success in ICT promotion* ..........................7 ......... 5.6
9th pillar: Economic impacts 9.01 Impact of ICTs on new services and products* ....5 ......... 5.7 9.02 ICT PCT patents, applications/million pop. ......n/a ......... n/a 9.03 Impact of ICTs on new organizational models* ...10 ......... 5.3 9.04 Knowledge-intensive jobs, % workforce ............n/a ......... n/a
10th pillar: Social impacts 10.01 Impact of ICTs on access to basic services* ........9 ......... 5.8 10.02 Internet access in schools* ..................................9 ......... 6.1 10.03 ICT use & gov’t efficiency* ...................................9 ......... 5.5 10.04 E-Participation Index, 0–1 (best)........................n/a ......... n/a
Rank Score (out of 144) (1–7)
Networked Readiness Index 2013 ..............10 ..5.5Networked Readiness Index 2012 (out of 142) ...................... 11 .....5.5
A. Environment subindex ..............................................24 ....5.01st pillar: Political and regulatory environment ................... 33 .....4.52nd pillar: Business and innovation environment ................. 4 .....5.4
B. Readiness subindex .................................................17 ....5.83rd pillar: Infrastructure and digital content ........................ 22 .....6.04th pillar: Affordability ........................................................ 54 .....5.55th pillar: Skills ..................................................................... 7 .....5.9
C. Usage subindex ........................................................15 ....5.46th pillar: Individual usage .................................................. 20 .....5.77th pillar: Business usage .................................................. 13 .....5.28th pillar: Government usage ............................................. 12 .....5.5
D. Impact subindex .........................................................6 ....5.79th pillar: Economic impacts ................................................ 7 .....5.510th pillar: Social impacts .................................................... 6 .....5.8
Taiwan, China3: Country/Economy Profiles
268 | The Global Information Technology Report 2013
Note: Indicators followed by an asterisk (*) are measured on a 1-to-7 (best) scale. For further details and explanation, please refer to the section “How to Read the Country/Economy Profiles” on page 139.
Taiwan, China High-income group average
1. Political and regulatory environment
6. Individual usage
5. Skills7. Business usage
4. Affordability8. Governmentusage
3. Infrastructure anddigital content
9. Economicimpacts
2. Business and innovation environment
10. Socialimpacts
1
2
3
4
5
6
7
@ 2013 World Economic Forum

The Networked Readiness Index in detailINDICATOR RANK /144 VALUE
1st pillar: Political and regulatory environment1.01 Effectiveness of law-making bodies* ..................39 ......... 4.11.02 Laws relating to ICTs* ........................................86 ......... 3.71.03 Judicial independence* ......................................64 ......... 3.91.04 Efficiency of legal system in settling disputes* ....53 ......... 4.01.05 Efficiency of legal system in challenging regs* ....43 ......... 4.11.06 Intellectual property protection* ..........................74 ......... 3.51.07 Software piracy rate, % software installed .........n/a ......... n/a1.08 No. procedures to enforce a contract ................48 .......... 351.09 No. days to enforce a contract ..........................47 ........ 430
2nd pillar: Business and innovation environment2.01 Availability of latest technologies* .......................84 ......... 4.72.02 Venture capital availability* .................................50 ......... 2.92.03 Total tax rate, % profits ....................................141 ....... 84.52.04 No. days to start a business ..............................95 .......... 242.05 No. procedures to start a business ....................30 ............ 52.06 Intensity of local competition* ...........................107 ......... 4.22.07 Tertiary education gross enrollment rate, % ........94 ....... 18.72.08 Quality of management schools* ......................119 ......... 3.42.09 Gov’t procurement of advanced tech* ...............26 ......... 4.1
3rd pillar: Infrastructure and digital content3.01 Electricity production, kWh/capita ......................75 .. 2,377.43.02 Mobile network coverage, % pop .....................n/a ......... n/a3.03 Int’l Internet bandwidth, kb/s per user..............138 ......... 0.53.04 Secure Internet servers/million pop ..................135 ......... 0.63.05 Accessibility of digital content* ...........................89 ......... 4.7
4th pillar: Affordability4.01 Mobile cellular tariffs, PPP $/min. .......................66 ....... 0.274.02 Fixed broadband Internet tariffs, PPP $/month 135 ... 868.844.03 Internet & telephony competition, 0–2 (best) ....140 ....... 0.00
5th pillar: Skills5.01 Quality of educational system* ...........................67 ......... 3.7
5.02 Quality of math & science education* .................91 ......... 3.7 5.03 Secondary education gross enrollment rate, % ..77 ....... 88.55.04 Adult literacy rate, % ............................................8 ....... 99.7
INDICATOR RANK /144 VALUE
6th pillar: Individual usage 6.01 Mobile phone subscriptions/100 pop. ................97 ....... 90.6 6.02 Individuals using Internet, %.............................111 ....... 13.0 6.03 Households w/ personal computer, % .............130 ......... 2.9 6.04 Households w/ Internet access, % ..................137 ......... 0.2 6.05 Broadband Internet subscriptions/100 pop. .....125 ......... 0.1 6.06 Mobile broadband subscriptions/100 pop. ........n/a ......... n/a 6.07 Use of virtual social networks* .........................132 ......... 4.3
7th pillar: Business usage 7.01 Firm-level technology absorption* ......................95 ......... 4.4 7.02 Capacity for innovation* .....................................51 ......... 3.4 7.03 PCT patents, applications/million pop. ............123 ......... 0.0 7.04 Business-to-business Internet use* ..................119 ......... 4.2 7.05 Business-to-consumer Internet use* ..................96 ......... 4.0 7.06 Extent of staff training* .......................................79 ......... 3.8
8th pillar: Government usage 8.01 Importance of ICTs to gov’t vision* .....................49 ......... 4.3 8.02 Government Online Service Index, 0–1 (best) ...123 ....... 0.24 8.03 Gov’t success in ICT promotion* ........................45 ......... 4.7
9th pillar: Economic impacts 9.01 Impact of ICTs on new services and products* 109 ......... 3.8 9.02 ICT PCT patents, applications/million pop. .......95 ......... 0.0 9.03 Impact of ICTs on new organizational models* .122 ......... 3.4 9.04 Knowledge-intensive jobs, % workforce ............n/a ......... n/a
10th pillar: Social impacts 10.01 Impact of ICTs on access to basic services* ......62 ......... 4.3 10.02 Internet access in schools* ................................94 ......... 3.6 10.03 ICT use & gov’t efficiency* .................................59 ......... 4.4 10.04 E-Participation Index, 0–1 (best).......................124 ....... 0.00
Rank Score (out of 144) (1–7)
Networked Readiness Index 2013 ............112 ..3.3Networked Readiness Index 2012 (out of 142) .................... 114 .....3.2
A. Environment subindex ..............................................80 ....3.81st pillar: Political and regulatory environment ................... 47 .....4.12nd pillar: Business and innovation environment ............. 121 .....3.5
B. Readiness subindex ...............................................118 ....3.23rd pillar: Infrastructure and digital content ...................... 126 .....2.34th pillar: Affordability ...................................................... 131 .....2.55th pillar: Skills ................................................................... 64 .....4.9
C. Usage subindex ......................................................103 ....3.16th pillar: Individual usage ................................................ 107 .....2.27th pillar: Business usage .................................................. 87 .....3.38th pillar: Government usage ............................................. 87 .....3.8
D. Impact subindex .....................................................102 ....3.09th pillar: Economic impacts ............................................ 111 .....2.710th pillar: Social impacts .................................................. 98 .....3.3
Tajikistan3: Country/Economy Profiles
The Global Information Technology Report 2013 | 269
Note: Indicators followed by an asterisk (*) are measured on a 1-to-7 (best) scale. For further details and explanation, please refer to the section “How to Read the Country/Economy Profiles” on page 139.
Tajikistan Low-income group average
1. Political and regulatory environment
6. Individual usage
5. Skills7. Business usage
4. Affordability8. Governmentusage
3. Infrastructure anddigital content
9. Economicimpacts
2. Business and innovation environment
10. Socialimpacts
1
2
3
4
5
6
7
@ 2013 World Economic Forum

The Networked Readiness Index in detailINDICATOR RANK /144 VALUE
1st pillar: Political and regulatory environment1.01 Effectiveness of law-making bodies* ..................65 ......... 3.61.02 Laws relating to ICTs* ......................................109 ......... 3.21.03 Judicial independence* ......................................77 ......... 3.51.04 Efficiency of legal system in settling disputes* ....68 ......... 3.71.05 Efficiency of legal system in challenging regs* ....70 ......... 3.61.06 Intellectual property protection* ..........................97 ......... 3.11.07 Software piracy rate, % software installed .........n/a ......... n/a1.08 No. procedures to enforce a contract ................78 .......... 381.09 No. days to enforce a contract ..........................54 ........ 462
2nd pillar: Business and innovation environment2.01 Availability of latest technologies* .....................122 ......... 4.12.02 Venture capital availability* .................................80 ......... 2.42.03 Total tax rate, % profits ....................................100 ....... 45.32.04 No. days to start a business ..............................99 .......... 262.05 No. procedures to start a business ..................102 ............ 92.06 Intensity of local competition* ...........................109 ......... 4.22.07 Tertiary education gross enrollment rate, % ......137 ......... 2.12.08 Quality of management schools* ......................118 ......... 3.42.09 Gov’t procurement of advanced tech* ...............73 ......... 3.5
3rd pillar: Infrastructure and digital content3.01 Electricity production, kWh/capita ....................128 ..... 106.33.02 Mobile network coverage, % pop ....................108 ....... 85.03.03 Int’l Internet bandwidth, kb/s per user..............135 ......... 0.93.04 Secure Internet servers/million pop ..................137 ......... 0.53.05 Accessibility of digital content* .........................133 ......... 3.4
4th pillar: Affordability4.01 Mobile cellular tariffs, PPP $/min. .......................98 ....... 0.394.02 Fixed broadband Internet tariffs, PPP $/month 124 ..... 82.374.03 Internet & telephony competition, 0–2 (best) ....123 ....... 1.00
5th pillar: Skills5.01 Quality of educational system* ...........................80 ......... 3.55.02 Quality of math & science education* ...............122 ......... 2.85.03 Secondary education gross enrollment rate, % 135 ....... 29.95.04 Adult literacy rate, % ........................................111 ....... 73.2
INDICATOR RANK /144 VALUE
6th pillar: Individual usage 6.01 Mobile phone subscriptions/100 pop. ..............127 ....... 55.5 6.02 Individuals using Internet, %.............................113 ....... 12.0 6.03 Households w/ personal computer, % .............123 ......... 4.0 6.04 Households w/ Internet access, % ..................106 ......... 4.5 6.05 Broadband Internet subscriptions/100 pop. .....136 ......... 0.0 6.06 Mobile broadband subscriptions/100 pop. .......107 ......... 1.2 6.07 Use of virtual social networks* .........................133 ......... 4.2
7th pillar: Business usage 7.01 Firm-level technology absorption* ....................129 ......... 3.9 7.02 Capacity for innovation* .....................................71 ......... 3.1 7.03 PCT patents, applications/million pop. ............116 ......... 0.0 7.04 Business-to-business Internet use* ..................121 ......... 4.2 7.05 Business-to-consumer Internet use* ................126 ......... 3.4 7.06 Extent of staff training* .......................................77 ......... 3.8
8th pillar: Government usage 8.01 Importance of ICTs to gov’t vision* .....................88 ......... 3.7 8.02 Government Online Service Index, 0–1 (best) ...101 ....... 0.35 8.03 Gov’t success in ICT promotion* ........................73 ......... 4.4
9th pillar: Economic impacts 9.01 Impact of ICTs on new services and products* 112 ......... 3.8 9.02 ICT PCT patents, applications/million pop. .......86 ......... 0.0 9.03 Impact of ICTs on new organizational models* .113 ......... 3.5 9.04 Knowledge-intensive jobs, % workforce ...........107 ......... 2.6
10th pillar: Social impacts 10.01 Impact of ICTs on access to basic services* ....112 ......... 3.6 10.02 Internet access in schools* ..............................120 ......... 2.8 10.03 ICT use & gov’t efficiency* ...............................103 ......... 3.7 10.04 E-Participation Index, 0–1 (best).........................96 ....... 0.08
Rank Score (out of 144) (1–7)
Networked Readiness Index 2013 ............127 ..2.9Networked Readiness Index 2012 (out of 142) .................... 123 .....2.9
A. Environment subindex ............................................108 ....3.51st pillar: Political and regulatory environment ................... 76 .....3.62nd pillar: Business and innovation environment ............. 128 .....3.4
B. Readiness subindex ...............................................135 ....2.73rd pillar: Infrastructure and digital content ...................... 124 .....2.44th pillar: Affordability ...................................................... 130 .....2.65th pillar: Skills ................................................................. 132 .....3.2
C. Usage subindex ......................................................120 ....2.96th pillar: Individual usage ................................................ 127 .....1.77th pillar: Business usage ................................................ 102 .....3.28th pillar: Government usage ............................................. 99 .....3.7
D. Impact subindex .....................................................127 ....2.69th pillar: Economic impacts ............................................ 136 .....2.310th pillar: Social impacts ................................................ 119 .....2.9
Tanzania3: Country/Economy Profiles
270 | The Global Information Technology Report 2013
Note: Indicators followed by an asterisk (*) are measured on a 1-to-7 (best) scale. For further details and explanation, please refer to the section “How to Read the Country/Economy Profiles” on page 139.
Tanzania Low-income group average
1. Political and regulatory environment
6. Individual usage
5. Skills7. Business usage
4. Affordability8. Governmentusage
3. Infrastructure anddigital content
9. Economicimpacts
2. Business and innovation environment
10. Socialimpacts
1
2
3
4
5
6
7
@ 2013 World Economic Forum

The Networked Readiness Index in detailINDICATOR RANK /144 VALUE
1st pillar: Political and regulatory environment1.01 Effectiveness of law-making bodies* ................105 ......... 3.01.02 Laws relating to ICTs* ........................................80 ......... 3.81.03 Judicial independence* ......................................59 ......... 4.01.04 Efficiency of legal system in settling disputes* ....65 ......... 3.81.05 Efficiency of legal system in challenging regs* ....73 ......... 3.61.06 Intellectual property protection* ........................101 ......... 3.11.07 Software piracy rate, % software installed ..........72 .......... 721.08 No. procedures to enforce a contract ................56 .......... 361.09 No. days to enforce a contract ..........................49 ........ 440
2nd pillar: Business and innovation environment2.01 Availability of latest technologies* .......................73 ......... 4.92.02 Venture capital availability* .................................49 ......... 2.92.03 Total tax rate, % profits ......................................72 ....... 37.62.04 No. days to start a business ............................106 .......... 292.05 No. procedures to start a business ....................20 ............ 42.06 Intensity of local competition* .............................54 ......... 5.02.07 Tertiary education gross enrollment rate, % ........54 ....... 47.72.08 Quality of management schools* ........................62 ......... 4.32.09 Gov’t procurement of advanced tech* ...............98 ......... 3.2
3rd pillar: Infrastructure and digital content3.01 Electricity production, kWh/capita ......................78 .. 2,159.83.02 Mobile network coverage, % pop ........................1 ..... 100.03.03 Int’l Internet bandwidth, kb/s per user................53 ....... 24.63.04 Secure Internet servers/million pop ....................83 ....... 16.63.05 Accessibility of digital content* ...........................90 ......... 4.7
4th pillar: Affordability4.01 Mobile cellular tariffs, PPP $/min. .......................16 ....... 0.094.02 Fixed broadband Internet tariffs, PPP $/month ..83 ..... 36.794.03 Internet & telephony competition, 0–2 (best) ......78 ....... 1.82
5th pillar: Skills5.01 Quality of educational system* ...........................78 ......... 3.55.02 Quality of math & science education* .................61 ......... 4.15.03 Secondary education gross enrollment rate, % ..93 ....... 79.25.04 Adult literacy rate, % ..........................................69 ....... 93.5
INDICATOR RANK /144 VALUE
6th pillar: Individual usage 6.01 Mobile phone subscriptions/100 pop. ................58 ..... 111.6 6.02 Individuals using Internet, %...............................95 ....... 23.7 6.03 Households w/ personal computer, % ...............81 ....... 24.7 6.04 Households w/ Internet access, % ....................87 ....... 13.4 6.05 Broadband Internet subscriptions/100 pop. .......75 ......... 5.0 6.06 Mobile broadband subscriptions/100 pop. .......119 ......... 0.1 6.07 Use of virtual social networks* ...........................72 ......... 5.4
7th pillar: Business usage 7.01 Firm-level technology absorption* ......................54 ......... 5.0 7.02 Capacity for innovation* .....................................79 ......... 3.0 7.03 PCT patents, applications/million pop. ..............69 ......... 1.0 7.04 Business-to-business Internet use* ....................93 ......... 4.7 7.05 Business-to-consumer Internet use* ..................53 ......... 4.8 7.06 Extent of staff training* .......................................49 ......... 4.2
8th pillar: Government usage 8.01 Importance of ICTs to gov’t vision* ...................104 ......... 3.5 8.02 Government Online Service Index, 0–1 (best) .....64 ....... 0.51 8.03 Gov’t success in ICT promotion* ........................95 ......... 4.0
9th pillar: Economic impacts 9.01 Impact of ICTs on new services and products* ..85 ......... 4.2 9.02 ICT PCT patents, applications/million pop. .......64 ......... 0.2 9.03 Impact of ICTs on new organizational models* ...88 ......... 3.9 9.04 Knowledge-intensive jobs, % workforce .............97 ....... 10.8
10th pillar: Social impacts 10.01 Impact of ICTs on access to basic services* ....101 ......... 3.8 10.02 Internet access in schools* ................................63 ......... 4.3 10.03 ICT use & gov’t efficiency* .................................74 ......... 4.1 10.04 E-Participation Index, 0–1 (best).........................46 ....... 0.32
Rank Score (out of 144) (1–7)
Networked Readiness Index 2013 ..............74 ..3.9Networked Readiness Index 2012 (out of 142) ...................... 77 .....3.8
A. Environment subindex ..............................................60 ....4.01st pillar: Political and regulatory environment ................... 81 .....3.62nd pillar: Business and innovation environment ............... 52 .....4.4
B. Readiness subindex .................................................63 ....4.83rd pillar: Infrastructure and digital content ........................ 71 .....3.94th pillar: Affordability ........................................................ 45 .....5.65th pillar: Skills ................................................................... 76 .....4.7
C. Usage subindex ........................................................83 ....3.46th pillar: Individual usage .................................................. 88 .....2.87th pillar: Business usage .................................................. 63 .....3.58th pillar: Government usage ............................................. 86 .....3.8
D. Impact subindex .......................................................88 ....3.39th pillar: Economic impacts ............................................ 108 .....2.810th pillar: Social impacts .................................................. 67 .....3.8
Thailand3: Country/Economy Profiles
The Global Information Technology Report 2013 | 271
Note: Indicators followed by an asterisk (*) are measured on a 1-to-7 (best) scale. For further details and explanation, please refer to the section “How to Read the Country/Economy Profiles” on page 139.
Thailand Upper-middle-income group average
1. Political and regulatory environment
6. Individual usage
5. Skills7. Business usage
4. Affordability8. Governmentusage
3. Infrastructure anddigital content
9. Economicimpacts
2. Business and innovation environment
10. Socialimpacts
1
2
3
4
5
6
7
@ 2013 World Economic Forum

The Networked Readiness Index in detailINDICATOR RANK /144 VALUE
1st pillar: Political and regulatory environment1.01 Effectiveness of law-making bodies* ..................57 ......... 3.81.02 Laws relating to ICTs* ......................................127 ......... 2.91.03 Judicial independence* ......................................92 ......... 3.21.04 Efficiency of legal system in settling disputes* ....96 ......... 3.31.05 Efficiency of legal system in challenging regs* ....83 ......... 3.41.06 Intellectual property protection* ........................108 ......... 2.91.07 Software piracy rate, % software installed .........n/a ......... n/a1.08 No. procedures to enforce a contract ..............142 .......... 511.09 No. days to enforce a contract ........................134 ..... 1,285
2nd pillar: Business and innovation environment2.01 Availability of latest technologies* .....................139 ......... 3.52.02 Venture capital availability* ...............................103 ......... 2.22.03 Total tax rate, % profits ........................................7 ....... 15.12.04 No. days to start a business ............................138 .......... 942.05 No. procedures to start a business ....................88 ............ 82.06 Intensity of local competition* ...........................141 ......... 3.42.07 Tertiary education gross enrollment rate, % ........98 ....... 16.72.08 Quality of management schools* ......................143 ......... 2.32.09 Gov’t procurement of advanced tech* ...............92 ......... 3.3
3rd pillar: Infrastructure and digital content3.01 Electricity production, kWh/capita ....................127 ..... 112.03.02 Mobile network coverage, % pop ....................127 ....... 69.03.03 Int’l Internet bandwidth, kb/s per user................71 ....... 17.13.04 Secure Internet servers/million pop ..................108 ......... 2.63.05 Accessibility of digital content* .........................132 ......... 3.5
4th pillar: Affordability4.01 Mobile cellular tariffs, PPP $/min. .....................107 ....... 0.434.02 Fixed broadband Internet tariffs, PPP $/month 133 ... 175.444.03 Internet & telephony competition, 0–2 (best) .....n/a ......... n/a
5th pillar: Skills5.01 Quality of educational system* .........................129 ......... 2.75.02 Quality of math & science education* ...............136 ......... 2.45.03 Secondary education gross enrollment rate, % 112 ....... 56.35.04 Adult literacy rate, % ........................................125 ....... 58.3
INDICATOR RANK /144 VALUE
6th pillar: Individual usage 6.01 Mobile phone subscriptions/100 pop. ..............128 ....... 53.2 6.02 Individuals using Internet, %.............................143 ......... 0.9 6.03 Households w/ personal computer, % ..............n/a ......... n/a 6.04 Households w/ Internet access, % ...................n/a ......... n/a 6.05 Broadband Internet subscriptions/100 pop. .....130 ......... 0.0 6.06 Mobile broadband subscriptions/100 pop. .......126 ......... 0.0 6.07 Use of virtual social networks* .........................136 ......... 4.1
7th pillar: Business usage 7.01 Firm-level technology absorption* ....................140 ......... 3.7 7.02 Capacity for innovation* ...................................125 ......... 2.4 7.03 PCT patents, applications/million pop. ............123 ......... 0.0 7.04 Business-to-business Internet use* ..................135 ......... 3.7 7.05 Business-to-consumer Internet use* ................135 ......... 3.0 7.06 Extent of staff training* .....................................127 ......... 3.1
8th pillar: Government usage 8.01 Importance of ICTs to gov’t vision* ...................107 ......... 3.4 8.02 Government Online Service Index, 0–1 (best) ...125 ....... 0.22 8.03 Gov’t success in ICT promotion* ......................114 ......... 3.6
9th pillar: Economic impacts 9.01 Impact of ICTs on new services and products* 138 ......... 3.2 9.02 ICT PCT patents, applications/million pop. .......95 ......... 0.0 9.03 Impact of ICTs on new organizational models* .131 ......... 3.0 9.04 Knowledge-intensive jobs, % workforce ............n/a ......... n/a
10th pillar: Social impacts 10.01 Impact of ICTs on access to basic services* ....122 ......... 3.4 10.02 Internet access in schools* ..............................128 ......... 2.4 10.03 ICT use & gov’t efficiency* ...............................105 ......... 3.6 10.04 E-Participation Index, 0–1 (best).......................124 ....... 0.00
Rank Score (out of 144) (1–7)
Networked Readiness Index 2013 ............134 ..2.7Networked Readiness Index 2012 (out of 142) .................... 132 .....2.8
A. Environment subindex ............................................131 ....3.21st pillar: Political and regulatory environment ................. 125 .....3.02nd pillar: Business and innovation environment ............. 130 .....3.4
B. Readiness subindex ...............................................134 ....2.73rd pillar: Infrastructure and digital content ...................... 122 .....2.54th pillar: Affordability ...................................................... 123 .....2.85th pillar: Skills ................................................................. 133 .....2.8
C. Usage subindex ......................................................136 ....2.56th pillar: Individual usage ................................................ 124 .....1.87th pillar: Business usage ................................................ 139 .....2.68th pillar: Government usage ........................................... 129 .....3.1
D. Impact subindex .....................................................131 ....2.59th pillar: Economic impacts ............................................ 132 .....2.410th pillar: Social impacts ................................................ 128 .....2.6
Timor-Leste3: Country/Economy Profiles
272 | The Global Information Technology Report 2013
Note: Indicators followed by an asterisk (*) are measured on a 1-to-7 (best) scale. For further details and explanation, please refer to the section “How to Read the Country/Economy Profiles” on page 139.
Timor-Leste Lower-middle-income group average
1. Political and regulatory environment
6. Individual usage
5. Skills7. Business usage
4. Affordability8. Governmentusage
3. Infrastructure anddigital content
9. Economicimpacts
2. Business and innovation environment
10. Socialimpacts
1
2
3
4
5
6
7
@ 2013 World Economic Forum

The Networked Readiness Index in detailINDICATOR RANK /144 VALUE
1st pillar: Political and regulatory environment1.01 Effectiveness of law-making bodies* ..................73 ......... 3.51.02 Laws relating to ICTs* ......................................112 ......... 3.21.03 Judicial independence* ......................................47 ......... 4.41.04 Efficiency of legal system in settling disputes* ....83 ......... 3.51.05 Efficiency of legal system in challenging regs* ....94 ......... 3.31.06 Intellectual property protection* ..........................81 ......... 3.41.07 Software piracy rate, % software installed .........n/a ......... n/a1.08 No. procedures to enforce a contract ..............116 .......... 421.09 No. days to enforce a contract ........................137 ..... 1,340
2nd pillar: Business and innovation environment2.01 Availability of latest technologies* .......................63 ......... 5.12.02 Venture capital availability* .................................87 ......... 2.42.03 Total tax rate, % profits ......................................35 ....... 29.12.04 No. days to start a business ............................126 .......... 412.05 No. procedures to start a business ....................88 ............ 82.06 Intensity of local competition* .............................88 ......... 4.62.07 Tertiary education gross enrollment rate, % ......109 ....... 11.52.08 Quality of management schools* ........................36 ......... 4.82.09 Gov’t procurement of advanced tech* .............128 ......... 2.8
3rd pillar: Infrastructure and digital content3.01 Electricity production, kWh/capita ......................37 .. 5,788.23.02 Mobile network coverage, % pop ........................1 ..... 100.03.03 Int’l Internet bandwidth, kb/s per user................63 ....... 19.83.04 Secure Internet servers/million pop ....................53 ....... 85.43.05 Accessibility of digital content* ...........................61 ......... 5.1
4th pillar: Affordability4.01 Mobile cellular tariffs, PPP $/min. .......................78 ....... 0.324.02 Fixed broadband Internet tariffs, PPP $/month ..19 ..... 19.164.03 Internet & telephony competition, 0–2 (best) ....123 ....... 1.00
5th pillar: Skills5.01 Quality of educational system* ...........................40 ......... 4.25.02 Quality of math & science education* .................35 ......... 4.65.03 Secondary education gross enrollment rate, % ..68 ....... 89.95.04 Adult literacy rate, % ..........................................40 ....... 98.8
INDICATOR RANK /144 VALUE
6th pillar: Individual usage 6.01 Mobile phone subscriptions/100 pop. ................25 ..... 135.6 6.02 Individuals using Internet, %...............................49 ....... 55.2 6.03 Households w/ personal computer, % ...............53 ....... 53.1 6.04 Households w/ Internet access, % ....................79 ....... 18.6 6.05 Broadband Internet subscriptions/100 pop. .......50 ....... 11.5 6.06 Mobile broadband subscriptions/100 pop. .......108 ......... 1.2 6.07 Use of virtual social networks* ...........................65 ......... 5.5
7th pillar: Business usage 7.01 Firm-level technology absorption* ......................82 ......... 4.6 7.02 Capacity for innovation* ...................................124 ......... 2.4 7.03 PCT patents, applications/million pop. ..............61 ......... 1.4 7.04 Business-to-business Internet use* ....................67 ......... 5.0 7.05 Business-to-consumer Internet use* ..................93 ......... 4.1 7.06 Extent of staff training* .......................................71 ......... 3.9
8th pillar: Government usage 8.01 Importance of ICTs to gov’t vision* .....................87 ......... 3.7 8.02 Government Online Service Index, 0–1 (best) .....72 ....... 0.48 8.03 Gov’t success in ICT promotion* ........................70 ......... 4.4
9th pillar: Economic impacts 9.01 Impact of ICTs on new services and products* 119 ......... 3.6 9.02 ICT PCT patents, applications/million pop. .......54 ......... 0.4 9.03 Impact of ICTs on new organizational models* .107 ......... 3.6 9.04 Knowledge-intensive jobs, % workforce .............60 ....... 22.8
10th pillar: Social impacts 10.01 Impact of ICTs on access to basic services* ....102 ......... 3.8 10.02 Internet access in schools* ................................55 ......... 4.5 10.03 ICT use & gov’t efficiency* ...............................101 ......... 3.7 10.04 E-Participation Index, 0–1 (best).........................96 ....... 0.08
Rank Score (out of 144) (1–7)
Networked Readiness Index 2013 ..............72 ..3.9Networked Readiness Index 2012 (out of 142) ...................... 60 .....4.0
A. Environment subindex ..............................................93 ....3.71st pillar: Political and regulatory environment ................... 91 .....3.42nd pillar: Business and innovation environment ............... 93 .....3.9
B. Readiness subindex .................................................45 ....5.03rd pillar: Infrastructure and digital content ........................ 53 .....4.44th pillar: Affordability ........................................................ 58 .....5.45th pillar: Skills ................................................................... 39 .....5.3
C. Usage subindex ........................................................67 ....3.76th pillar: Individual usage .................................................. 61 .....3.87th pillar: Business usage .................................................. 97 .....3.28th pillar: Government usage ............................................. 70 .....4.0
D. Impact subindex .......................................................95 ....3.19th pillar: Economic impacts ............................................ 100 .....2.910th pillar: Social impacts .................................................. 91 .....3.4
Trinidad and Tobago3: Country/Economy Profiles
The Global Information Technology Report 2013 | 273
Note: Indicators followed by an asterisk (*) are measured on a 1-to-7 (best) scale. For further details and explanation, please refer to the section “How to Read the Country/Economy Profiles” on page 139.
Trinidad and Tobago High-income group average
1. Political and regulatory environment
6. Individual usage
5. Skills7. Business usage
4. Affordability8. Governmentusage
3. Infrastructure anddigital content
9. Economicimpacts
2. Business and innovation environment
10. Socialimpacts
1
2
3
4
5
6
7
@ 2013 World Economic Forum

The Networked Readiness Index in detailINDICATOR RANK /144 VALUE
1st pillar: Political and regulatory environment1.01 Effectiveness of law-making bodies* ..................22 ......... 4.81.02 Laws relating to ICTs* ........................................59 ......... 4.21.03 Judicial independence* ......................................83 ......... 3.51.04 Efficiency of legal system in settling disputes* ....61 ......... 3.81.05 Efficiency of legal system in challenging regs* ....56 ......... 3.91.06 Intellectual property protection* ..........................86 ......... 3.31.07 Software piracy rate, % software installed ..........57 .......... 621.08 No. procedures to enforce a contract ................56 .......... 361.09 No. days to enforce a contract ..........................42 ........ 420
2nd pillar: Business and innovation environment2.01 Availability of latest technologies* .......................45 ......... 5.42.02 Venture capital availability* .................................73 ......... 2.52.03 Total tax rate, % profits ......................................84 ....... 41.22.04 No. days to start a business ..............................16 ............ 62.05 No. procedures to start a business ....................48 ............ 62.06 Intensity of local competition* .............................16 ......... 5.72.07 Tertiary education gross enrollment rate, % ........45 ....... 55.42.08 Quality of management schools* ........................97 ......... 3.82.09 Gov’t procurement of advanced tech* ...............32 ......... 4.0
3rd pillar: Infrastructure and digital content3.01 Electricity production, kWh/capita ......................65 .. 2,903.13.02 Mobile network coverage, % pop ........................1 ..... 100.03.03 Int’l Internet bandwidth, kb/s per user................42 ....... 33.93.04 Secure Internet servers/million pop ....................45 ..... 142.53.05 Accessibility of digital content* ...........................62 ......... 5.1
4th pillar: Affordability4.01 Mobile cellular tariffs, PPP $/min. .......................36 ....... 0.174.02 Fixed broadband Internet tariffs, PPP $/month ..27 ..... 20.804.03 Internet & telephony competition, 0–2 (best) ........1 ....... 2.00
5th pillar: Skills5.01 Quality of educational system* ...........................82 ......... 3.55.02 Quality of math & science education* ...............100 ......... 3.55.03 Secondary education gross enrollment rate, % ..88 ....... 82.15.04 Adult literacy rate, % ..........................................83 ....... 90.8
INDICATOR RANK /144 VALUE
6th pillar: Individual usage 6.01 Mobile phone subscriptions/100 pop. ................98 ....... 88.7 6.02 Individuals using Internet, %...............................69 ....... 42.1 6.03 Households w/ personal computer, % ...............58 ....... 48.5 6.04 Households w/ Internet access, % ....................56 ....... 42.9 6.05 Broadband Internet subscriptions/100 pop. .......56 ....... 10.3 6.06 Mobile broadband subscriptions/100 pop. .........79 ......... 8.8 6.07 Use of virtual social networks* ...........................71 ......... 5.4
7th pillar: Business usage 7.01 Firm-level technology absorption* ......................39 ......... 5.3 7.02 Capacity for innovation* .....................................48 ......... 3.4 7.03 PCT patents, applications/million pop. ..............41 ......... 6.5 7.04 Business-to-business Internet use* ....................74 ......... 4.9 7.05 Business-to-consumer Internet use* ..................56 ......... 4.7 7.06 Extent of staff training* .......................................65 ......... 4.0
8th pillar: Government usage 8.01 Importance of ICTs to gov’t vision* .....................53 ......... 4.2 8.02 Government Online Service Index, 0–1 (best) .....76 ....... 0.46 8.03 Gov’t success in ICT promotion* ........................64 ......... 4.5
9th pillar: Economic impacts 9.01 Impact of ICTs on new services and products* ..61 ......... 4.6 9.02 ICT PCT patents, applications/million pop. .......45 ......... 0.9 9.03 Impact of ICTs on new organizational models* ...65 ......... 4.2 9.04 Knowledge-intensive jobs, % workforce .............63 ....... 22.1
10th pillar: Social impacts 10.01 Impact of ICTs on access to basic services* ......40 ......... 4.8 10.02 Internet access in schools* ................................68 ......... 4.3 10.03 ICT use & gov’t efficiency* .................................34 ......... 4.9 10.04 E-Participation Index, 0–1 (best).......................106 ....... 0.05
Rank Score (out of 144) (1–7)
Networked Readiness Index 2013 ..............45 ..4.2Networked Readiness Index 2012 (out of 142) ...................... 52 .....4.1
A. Environment subindex ..............................................46 ....4.31st pillar: Political and regulatory environment ................... 54 .....4.02nd pillar: Business and innovation environment ............... 43 .....4.6
B. Readiness subindex .................................................36 ....5.33rd pillar: Infrastructure and digital content ........................ 48 .....4.64th pillar: Affordability .......................................................... 4 .....6.65th pillar: Skills ................................................................... 81 .....4.7
C. Usage subindex ........................................................62 ....3.86th pillar: Individual usage .................................................. 68 .....3.57th pillar: Business usage .................................................. 48 .....3.78th pillar: Government usage ............................................. 60 .....4.2
D. Impact subindex .......................................................64 ....3.59th pillar: Economic impacts .............................................. 68 .....3.310th pillar: Social impacts .................................................. 63 .....3.8
Turkey3: Country/Economy Profiles
274 | The Global Information Technology Report 2013
Note: Indicators followed by an asterisk (*) are measured on a 1-to-7 (best) scale. For further details and explanation, please refer to the section “How to Read the Country/Economy Profiles” on page 139.
Turkey Upper-middle-income group average
1. Political and regulatory environment
6. Individual usage
5. Skills7. Business usage
4. Affordability8. Governmentusage
3. Infrastructure anddigital content
9. Economicimpacts
2. Business and innovation environment
10. Socialimpacts
1
2
3
4
5
6
7
@ 2013 World Economic Forum

The Networked Readiness Index in detailINDICATOR RANK /144 VALUE
1st pillar: Political and regulatory environment1.01 Effectiveness of law-making bodies* ..................45 ......... 4.01.02 Laws relating to ICTs* ........................................97 ......... 3.61.03 Judicial independence* ......................................80 ......... 3.51.04 Efficiency of legal system in settling disputes* ....49 ......... 4.11.05 Efficiency of legal system in challenging regs* ....59 ......... 3.91.06 Intellectual property protection* ..........................84 ......... 3.31.07 Software piracy rate, % software installed .........n/a ......... n/a1.08 No. procedures to enforce a contract ................78 .......... 381.09 No. days to enforce a contract ..........................60 ........ 490
2nd pillar: Business and innovation environment2.01 Availability of latest technologies* .....................104 ......... 4.52.02 Venture capital availability* .................................74 ......... 2.52.03 Total tax rate, % profits ......................................70 ....... 37.12.04 No. days to start a business ............................112 .......... 332.05 No. procedures to start a business ..................139 .......... 152.06 Intensity of local competition* .............................77 ......... 4.72.07 Tertiary education gross enrollment rate, % ......115 ......... 9.12.08 Quality of management schools* ........................89 ......... 3.92.09 Gov’t procurement of advanced tech* ...............68 ......... 3.6
3rd pillar: Infrastructure and digital content3.01 Electricity production, kWh/capita ....................134 ....... 75.53.02 Mobile network coverage, % pop ........................1 ..... 100.03.03 Int’l Internet bandwidth, kb/s per user..............112 ......... 4.23.04 Secure Internet servers/million pop ..................117 ......... 1.53.05 Accessibility of digital content* .........................120 ......... 3.8
4th pillar: Affordability4.01 Mobile cellular tariffs, PPP $/min. .......................64 ....... 0.264.02 Fixed broadband Internet tariffs, PPP $/month ..91 ..... 38.884.03 Internet & telephony competition, 0–2 (best) ........1 ....... 2.00
5th pillar: Skills5.01 Quality of educational system* ...........................69 ......... 3.7
5.02 Quality of math & science education* ...............109 ......... 3.4 5.03 Secondary education gross enrollment rate, % 136 ....... 28.15.04 Adult literacy rate, % ........................................110 ....... 73.2
INDICATOR RANK /144 VALUE
6th pillar: Individual usage 6.01 Mobile phone subscriptions/100 pop. ..............131 ....... 48.4 6.02 Individuals using Internet, %.............................112 ....... 13.0 6.03 Households w/ personal computer, % .............140 ......... 1.2 6.04 Households w/ Internet access, % ..................138 ......... 0.2 6.05 Broadband Internet subscriptions/100 pop. .....122 ......... 0.1 6.06 Mobile broadband subscriptions/100 pop. .........97 ......... 2.8 6.07 Use of virtual social networks* .........................130 ......... 4.3
7th pillar: Business usage 7.01 Firm-level technology absorption* ....................103 ......... 4.3 7.02 Capacity for innovation* ...................................102 ......... 2.8 7.03 PCT patents, applications/million pop. ............121 ......... 0.0 7.04 Business-to-business Internet use* ....................94 ......... 4.7 7.05 Business-to-consumer Internet use* ................115 ......... 3.7 7.06 Extent of staff training* .....................................100 ......... 3.6
8th pillar: Government usage 8.01 Importance of ICTs to gov’t vision* .....................52 ......... 4.2 8.02 Government Online Service Index, 0–1 (best) ...117 ....... 0.29 8.03 Gov’t success in ICT promotion* ........................50 ......... 4.7
9th pillar: Economic impacts 9.01 Impact of ICTs on new services and products* ..75 ......... 4.4 9.02 ICT PCT patents, applications/million pop. .......95 ......... 0.0 9.03 Impact of ICTs on new organizational models* ...81 ......... 4.0 9.04 Knowledge-intensive jobs, % workforce ...........106 ......... 4.3
10th pillar: Social impacts 10.01 Impact of ICTs on access to basic services* ....109 ......... 3.7 10.02 Internet access in schools* ..............................118 ......... 2.9 10.03 ICT use & gov’t efficiency* .................................69 ......... 4.2 10.04 E-Participation Index, 0–1 (best).........................96 ....... 0.08
Rank Score (out of 144) (1–7)
Networked Readiness Index 2013 ............110 ..3.3Networked Readiness Index 2012 (out of 142) .................... 110 .....3.3
A. Environment subindex ..............................................88 ....3.71st pillar: Political and regulatory environment ................... 60 .....3.82nd pillar: Business and innovation environment ............. 115 .....3.6
B. Readiness subindex ...............................................104 ....3.83rd pillar: Infrastructure and digital content ...................... 106 .....2.94th pillar: Affordability ........................................................ 75 .....5.15th pillar: Skills ................................................................. 125 .....3.3
C. Usage subindex ......................................................117 ....2.96th pillar: Individual usage ................................................ 131 .....1.67th pillar: Business usage ................................................ 106 .....3.18th pillar: Government usage ............................................. 84 .....3.9
D. Impact subindex .....................................................115 ....2.99th pillar: Economic impacts ............................................ 121 .....2.610th pillar: Social impacts ................................................ 111 .....3.1
Uganda3: Country/Economy Profiles
The Global Information Technology Report 2013 | 275
Note: Indicators followed by an asterisk (*) are measured on a 1-to-7 (best) scale. For further details and explanation, please refer to the section “How to Read the Country/Economy Profiles” on page 139.
Uganda Low-income group average
1. Political and regulatory environment
6. Individual usage
5. Skills7. Business usage
4. Affordability8. Governmentusage
3. Infrastructure anddigital content
9. Economicimpacts
2. Business and innovation environment
10. Socialimpacts
1
2
3
4
5
6
7
@ 2013 World Economic Forum

The Networked Readiness Index in detailINDICATOR RANK /144 VALUE
1st pillar: Political and regulatory environment1.01 Effectiveness of law-making bodies* ................132 ......... 2.31.02 Laws relating to ICTs* ......................................101 ......... 3.51.03 Judicial independence* ....................................124 ......... 2.51.04 Efficiency of legal system in settling disputes* ..141 ......... 2.41.05 Efficiency of legal system in challenging regs* ..139 ......... 2.41.06 Intellectual property protection* ........................120 ......... 2.71.07 Software piracy rate, % software installed ..........94 .......... 841.08 No. procedures to enforce a contract ................18 .......... 301.09 No. days to enforce a contract ..........................17 ........ 343
2nd pillar: Business and innovation environment2.01 Availability of latest technologies* .......................80 ......... 4.8
2.02 Venture capital availability* ...............................106 ......... 2.2 2.03 Total tax rate, % profits ....................................123 ....... 55.4 2.04 No. days to start a business ..............................93 .......... 22 2.05 No. procedures to start a business ....................74 ............ 7 2.06 Intensity of local competition* ...........................104 ......... 4.3 2.07 Tertiary education gross enrollment rate, % ..........9 ....... 81.7 2.08 Quality of management schools* ......................117 ......... 3.4 2.09 Gov’t procurement of advanced tech* ...............97 ......... 3.2
3rd pillar: Infrastructure and digital content 3.01 Electricity production, kWh/capita ......................57 .. 3,767.0 3.02 Mobile network coverage, % pop ......................28 ....... 99.9 3.03 Int’l Internet bandwidth, kb/s per user................85 ......... 9.8 3.04 Secure Internet servers/million pop ....................81 ....... 17.7 3.05 Accessibility of digital content* ...........................44 ......... 5.4
4th pillar: Affordability 4.01 Mobile cellular tariffs, PPP $/min. .........................2 ....... 0.01 4.02 Fixed broadband Internet tariffs, PPP $/month ....6 ..... 15.10 4.03 Internet & telephony competition, 0–2 (best) ......71 ....... 1.86
5th pillar: Skills 5.01 Quality of educational system* ...........................70 ......... 3.6 5.02 Quality of math & science education* .................34 ......... 4.6 5.03 Secondary education gross enrollment rate, % ..55 ....... 94.0 5.04 Adult literacy rate, % ............................................5 ....... 99.7
INDICATOR RANK /144 VALUE
6th pillar: Individual usage 6.01 Mobile phone subscriptions/100 pop. ................44 ..... 123.0 6.02 Individuals using Internet, %...............................89 ....... 30.6 6.03 Households w/ personal computer, % ...............80 ....... 25.2 6.04 Households w/ Internet access, % ....................75 ....... 22.2 6.05 Broadband Internet subscriptions/100 pop. .......69 ......... 7.0 6.06 Mobile broadband subscriptions/100 pop. .........87 ......... 4.4 6.07 Use of virtual social networks* ...........................92 ......... 5.2
7th pillar: Business usage 7.01 Firm-level technology absorption* ......................69 ......... 4.8 7.02 Capacity for innovation* .....................................58 ......... 3.3 7.03 PCT patents, applications/million pop. ..............51 ......... 2.8 7.04 Business-to-business Internet use* ....................80 ......... 4.8 7.05 Business-to-consumer Internet use* ..................68 ......... 4.6 7.06 Extent of staff training* .....................................106 ......... 3.6
8th pillar: Government usage 8.01 Importance of ICTs to gov’t vision* ...................130 ......... 2.9 8.02 Government Online Service Index, 0–1 (best) .....87 ....... 0.42 8.03 Gov’t success in ICT promotion* ......................122 ......... 3.4
9th pillar: Economic impacts 9.01 Impact of ICTs on new services and products* 103 ......... 3.9 9.02 ICT PCT patents, applications/million pop. .......49 ......... 0.6 9.03 Impact of ICTs on new organizational models* .104 ......... 3.6 9.04 Knowledge-intensive jobs, % workforce .............38 ....... 32.1
10th pillar: Social impacts 10.01 Impact of ICTs on access to basic services* ......91 ......... 3.9 10.02 Internet access in schools* ................................62 ......... 4.4 10.03 ICT use & gov’t efficiency* ...............................116 ......... 3.5 10.04 E-Participation Index, 0–1 (best).........................76 ....... 0.16
Rank Score (out of 144) (1–7)
Networked Readiness Index 2013 ..............73 ..3.9Networked Readiness Index 2012 (out of 142) ...................... 75 .....3.8
A. Environment subindex ............................................105 ....3.51st pillar: Political and regulatory environment ................. 124 .....3.02nd pillar: Business and innovation environment ............... 78 .....4.1
B. Readiness subindex .................................................29 ....5.33rd pillar: Infrastructure and digital content ........................ 74 .....3.84th pillar: Affordability .......................................................... 2 .....6.95th pillar: Skills ................................................................... 35 .....5.3
C. Usage subindex ........................................................95 ....3.36th pillar: Individual usage .................................................. 74 .....3.27th pillar: Business usage .................................................. 84 .....3.38th pillar: Government usage ........................................... 121 .....3.3
D. Impact subindex .......................................................81 ....3.39th pillar: Economic impacts .............................................. 74 .....3.210th pillar: Social impacts .................................................. 87 .....3.4
Ukraine3: Country/Economy Profiles
276 | The Global Information Technology Report 2013
Note: Indicators followed by an asterisk (*) are measured on a 1-to-7 (best) scale. For further details and explanation, please refer to the section “How to Read the Country/Economy Profiles” on page 139.
Ukraine Lower-middle-income group average
1. Political and regulatory environment
6. Individual usage
5. Skills7. Business usage
4. Affordability8. Governmentusage
3. Infrastructure anddigital content
9. Economicimpacts
2. Business and innovation environment
10. Socialimpacts
1
2
3
4
5
6
7
@ 2013 World Economic Forum

The Networked Readiness Index in detailINDICATOR RANK /144 VALUE
1st pillar: Political and regulatory environment1.01 Effectiveness of law-making bodies* ..................21 ......... 4.81.02 Laws relating to ICTs* ..........................................9 ......... 5.51.03 Judicial independence* ......................................23 ......... 5.41.04 Efficiency of legal system in settling disputes* ....22 ......... 4.81.05 Efficiency of legal system in challenging regs* ....25 ......... 4.51.06 Intellectual property protection* ..........................23 ......... 5.21.07 Software piracy rate, % software installed ..........22 .......... 371.08 No. procedures to enforce a contract ..............137 .......... 491.09 No. days to enforce a contract ..........................72 ........ 524
2nd pillar: Business and innovation environment2.01 Availability of latest technologies* .......................23 ......... 6.22.02 Venture capital availability* ...................................8 ......... 4.12.03 Total tax rate, % profits ........................................6 ....... 14.92.04 No. days to start a business ..............................34 ............ 82.05 No. procedures to start a business ....................48 ............ 62.06 Intensity of local competition* .............................15 ......... 5.72.07 Tertiary education gross enrollment rate, % ........84 ....... 25.22.08 Quality of management schools* ........................27 ......... 5.02.09 Gov’t procurement of advanced tech* .................3 ......... 5.0
3rd pillar: Infrastructure and digital content3.01 Electricity production, kWh/capita ........................9 13,053.13.02 Mobile network coverage, % pop ........................1 ..... 100.03.03 Int’l Internet bandwidth, kb/s per user................49 ....... 27.63.04 Secure Internet servers/million pop ....................40 ..... 180.33.05 Accessibility of digital content* ...........................23 ......... 6.1
4th pillar: Affordability4.01 Mobile cellular tariffs, PPP $/min. .......................17 ....... 0.094.02 Fixed broadband Internet tariffs, PPP $/month ..99 ..... 42.854.03 Internet & telephony competition, 0–2 (best) ....123 ....... 1.00
5th pillar: Skills5.01 Quality of educational system* ...........................17 ......... 5.05.02 Quality of math & science education* .................17 ......... 5.25.03 Secondary education gross enrollment rate, % ..60 ....... 92.35.04 Adult literacy rate, % ..........................................86 ....... 90.0
INDICATOR RANK /144 VALUE
6th pillar: Individual usage 6.01 Mobile phone subscriptions/100 pop. ................16 ..... 148.6 6.02 Individuals using Internet, %...............................34 ....... 70.0 6.03 Households w/ personal computer, % ...............28 ....... 76.0 6.04 Households w/ Internet access, % ....................31 ....... 67.0 6.05 Broadband Internet subscriptions/100 pop. .......52 ....... 11.0 6.06 Mobile broadband subscriptions/100 pop. .........49 ....... 21.7 6.07 Use of virtual social networks* ...........................21 ......... 6.2
7th pillar: Business usage 7.01 Firm-level technology absorption* ......................12 ......... 6.0 7.02 Capacity for innovation* .....................................27 ......... 4.0 7.03 PCT patents, applications/million pop. ..............46 ......... 4.2 7.04 Business-to-business Internet use* ....................17 ......... 5.9 7.05 Business-to-consumer Internet use* ..................21 ......... 5.5 7.06 Extent of staff training* .......................................17 ......... 4.9
8th pillar: Government usage 8.01 Importance of ICTs to gov’t vision* .......................3 ......... 5.7 8.02 Government Online Service Index, 0–1 (best) .......9 ....... 0.86 8.03 Gov’t success in ICT promotion* ..........................1 ......... 6.1
9th pillar: Economic impacts 9.01 Impact of ICTs on new services and products* ..11 ......... 5.5 9.02 ICT PCT patents, applications/million pop. .......41 ......... 1.1 9.03 Impact of ICTs on new organizational models* ...11 ......... 5.3 9.04 Knowledge-intensive jobs, % workforce .............30 ....... 36.1
10th pillar: Social impacts 10.01 Impact of ICTs on access to basic services* ........6 ......... 5.9 10.02 Internet access in schools* ................................22 ......... 5.8 10.03 ICT use & gov’t efficiency* ...................................3 ......... 5.9 10.04 E-Participation Index, 0–1 (best).........................11 ....... 0.74
Rank Score (out of 144) (1–7)
Networked Readiness Index 2013 ..............25 ..5.1Networked Readiness Index 2012 (out of 142) ...................... 30 .....4.8
A. Environment subindex ..............................................19 ....5.01st pillar: Political and regulatory environment ................... 26 .....4.82nd pillar: Business and innovation environment ............... 17 .....5.2
B. Readiness subindex .................................................40 ....5.23rd pillar: Infrastructure and digital content ........................ 30 .....5.54th pillar: Affordability ........................................................ 89 .....4.75th pillar: Skills ................................................................... 25 .....5.5
C. Usage subindex ........................................................23 ....5.16th pillar: Individual usage .................................................. 36 .....4.97th pillar: Business usage .................................................. 28 .....4.38th pillar: Government usage ............................................... 2 .....6.0
D. Impact subindex .......................................................19 ....4.99th pillar: Economic impacts .............................................. 28 .....4.110th pillar: Social impacts .................................................... 7 .....5.8
United Arab Emirates3: Country/Economy Profiles
The Global Information Technology Report 2013 | 277
Note: Indicators followed by an asterisk (*) are measured on a 1-to-7 (best) scale. For further details and explanation, please refer to the section “How to Read the Country/Economy Profiles” on page 139.
United Arab Emirates High-income group average
1. Political and regulatory environment
6. Individual usage
5. Skills7. Business usage
4. Affordability8. Governmentusage
3. Infrastructure anddigital content
9. Economicimpacts
2. Business and innovation environment
10. Socialimpacts
1
2
3
4
5
6
7
@ 2013 World Economic Forum

The Networked Readiness Index in detailINDICATOR RANK /144 VALUE
1st pillar: Political and regulatory environment1.01 Effectiveness of law-making bodies* ....................8 ......... 5.21.02 Laws relating to ICTs* ..........................................5 ......... 5.61.03 Judicial independence* ......................................11 ......... 6.21.04 Efficiency of legal system in settling disputes* ....11 ......... 5.41.05 Efficiency of legal system in challenging regs* ....11 ......... 5.11.06 Intellectual property protection* ............................6 ......... 5.91.07 Software piracy rate, % software installed ..........12 .......... 261.08 No. procedures to enforce a contract ................12 .......... 281.09 No. days to enforce a contract ..........................32 ........ 399
2nd pillar: Business and innovation environment2.01 Availability of latest technologies* .........................6 ......... 6.52.02 Venture capital availability* .................................16 ......... 3.8
2.03 Total tax rate, % profits ......................................64 ....... 35.5 2.04 No. days to start a business ..............................62 .......... 13 2.05 No. procedures to start a business ....................48 ............ 6 2.06 Intensity of local competition* ...............................5 ......... 6.0 2.07 Tertiary education gross enrollment rate, % ........38 ....... 59.7 2.08 Quality of management schools* ..........................1 ......... 6.1 2.09 Gov’t procurement of advanced tech* ...............45 ......... 3.9
3rd pillar: Infrastructure and digital content 3.01 Electricity production, kWh/capita ......................36 .. 6,075.7 3.02 Mobile network coverage, % pop ......................41 ....... 99.7 3.03 Int’l Internet bandwidth, kb/s per user..................6 ..... 166.1 3.04 Secure Internet servers/million pop ....................11 .. 1,592.5 3.05 Accessibility of digital content* .............................1 ......... 6.5
4th pillar: Affordability 4.01 Mobile cellular tariffs, PPP $/min. .......................91 ....... 0.37 4.02 Fixed broadband Internet tariffs, PPP $/month ..18 ..... 19.05 4.03 Internet & telephony competition, 0–2 (best) ......71 ....... 1.86
5th pillar: Skills 5.01 Quality of educational system* ...........................27 ......... 4.7 5.02 Quality of math & science education* .................42 ......... 4.5 5.03 Secondary education gross enrollment rate, % ..20 ..... 105.3 5.04 Adult literacy rate, % ..........................................15 ....... 99.0
INDICATOR RANK /144 VALUE
6th pillar: Individual usage 6.01 Mobile phone subscriptions/100 pop. ................31 ..... 130.8 6.02 Individuals using Internet, %...............................14 ....... 82.0 6.03 Households w/ personal computer, % ...............14 ....... 84.6 6.04 Households w/ Internet access, % ......................8 ....... 85.1 6.05 Broadband Internet subscriptions/100 pop. .......11 ....... 32.7 6.06 Mobile broadband subscriptions/100 pop. .........17 ....... 52.6 6.07 Use of virtual social networks* .............................2 ......... 6.6
7th pillar: Business usage 7.01 Firm-level technology absorption* ......................23 ......... 5.7 7.02 Capacity for innovation* .....................................12 ......... 5.0 7.03 PCT patents, applications/million pop. ..............18 ....... 87.3 7.04 Business-to-business Internet use* ......................4 ......... 6.1 7.05 Business-to-consumer Internet use* ....................1 ......... 6.3 7.06 Extent of staff training* .......................................14 ......... 5.0
8th pillar: Government usage 8.01 Importance of ICTs to gov’t vision* .....................25 ......... 4.8 8.02 Government Online Service Index, 0–1 (best) .......4 ....... 0.97 8.03 Gov’t success in ICT promotion* ........................28 ......... 5.1
9th pillar: Economic impacts 9.01 Impact of ICTs on new services and products* ....2 ......... 5.9 9.02 ICT PCT patents, applications/million pop. .......17 ....... 25.7 9.03 Impact of ICTs on new organizational models* .....1 ......... 5.6 9.04 Knowledge-intensive jobs, % workforce .............13 ....... 42.5
10th pillar: Social impacts 10.01 Impact of ICTs on access to basic services* ......17 ......... 5.6 10.02 Internet access in schools* ..................................8 ......... 6.2 10.03 ICT use & gov’t efficiency* .................................17 ......... 5.2 10.04 E-Participation Index, 0–1 (best)...........................5 ....... 0.92
Rank Score (out of 144) (1–7)
Networked Readiness Index 2013 ................ 7 ..5.6Networked Readiness Index 2012 (out of 142) ...................... 10 .....5.5
A. Environment subindex ................................................6 ....5.51st pillar: Political and regulatory environment ..................... 7 .....5.62nd pillar: Business and innovation environment ................. 8 .....5.3
B. Readiness subindex .................................................10 ....6.03rd pillar: Infrastructure and digital content ........................ 13 .....6.44th pillar: Affordability ........................................................ 35 .....5.95th pillar: Skills ................................................................... 15 .....5.7
C. Usage subindex ........................................................11 ....5.66th pillar: Individual usage .................................................... 9 .....6.27th pillar: Business usage .................................................. 15 .....5.18th pillar: Government usage ............................................... 9 .....5.6
D. Impact subindex .........................................................8 ....5.59th pillar: Economic impacts .............................................. 14 .....5.110th pillar: Social impacts .................................................... 4 .....5.9
United Kingdom3: Country/Economy Profiles
278 | The Global Information Technology Report 2013
Note: Indicators followed by an asterisk (*) are measured on a 1-to-7 (best) scale. For further details and explanation, please refer to the section “How to Read the Country/Economy Profiles” on page 139.
United Kingdom High-income group average
1. Political and regulatory environment
6. Individual usage
5. Skills7. Business usage
4. Affordability8. Governmentusage
3. Infrastructure anddigital content
9. Economicimpacts
2. Business and innovation environment
10. Socialimpacts
1
2
3
4
5
6
7
@ 2013 World Economic Forum

The Networked Readiness Index in detailINDICATOR RANK /144 VALUE
1st pillar: Political and regulatory environment1.01 Effectiveness of law-making bodies* ..................56 ......... 3.81.02 Laws relating to ICTs* ........................................20 ......... 5.21.03 Judicial independence* ......................................38 ......... 4.91.04 Efficiency of legal system in settling disputes* ....35 ......... 4.51.05 Efficiency of legal system in challenging regs* ....37 ......... 4.21.06 Intellectual property protection* ..........................29 ......... 5.01.07 Software piracy rate, % software installed ............1 .......... 191.08 No. procedures to enforce a contract ................28 .......... 321.09 No. days to enforce a contract ..........................20 ........ 370
2nd pillar: Business and innovation environment2.01 Availability of latest technologies* .......................14 ......... 6.32.02 Venture capital availability* .................................10 ......... 4.12.03 Total tax rate, % profits ....................................105 ....... 46.72.04 No. days to start a business ..............................16 ............ 62.05 No. procedures to start a business ....................48 ............ 62.06 Intensity of local competition* .............................18 ......... 5.6
2.07 Tertiary education gross enrollment rate, % ..........2 ....... 94.82.08 Quality of management schools* ........................12 ......... 5.42.09 Gov’t procurement of advanced tech* ...............15 ......... 4.4
3rd pillar: Infrastructure and digital content3.01 Electricity production, kWh/capita ........................8 14,020.03.02 Mobile network coverage, % pop ......................38 ....... 99.83.03 Int’l Internet bandwidth, kb/s per user................34 ....... 47.23.04 Secure Internet servers/million pop ....................12 .. 1,563.23.05 Accessibility of digital content* ...........................25 ......... 6.0
4th pillar: Affordability 4.01 Mobile cellular tariffs, PPP $/min. .......................68 ....... 0.274.02 Fixed broadband Internet tariffs, PPP $/month ..22 ..... 19.954.03 Internet & telephony competition, 0–2 (best) ........1 ....... 2.00
5th pillar: Skills5.01 Quality of educational system* ...........................28 ......... 4.7
5.02 Quality of math & science education* .................47 ......... 4.3 5.03 Secondary education gross enrollment rate, % ..50 ....... 96.05.04 Adult literacy rate, % ..........................................15 ....... 99.0
INDICATOR RANK /144 VALUE
6th pillar: Individual usage 6.01 Mobile phone subscriptions/100 pop. ................95 ....... 92.7 6.02 Individuals using Internet, %...............................20 ....... 77.9 6.03 Households w/ personal computer, % ...............29 ....... 75.5 6.04 Households w/ Internet access, % ....................27 ....... 71.6 6.05 Broadband Internet subscriptions/100 pop. .......18 ....... 27.4 6.06 Mobile broadband subscriptions/100 pop. ...........9 ....... 74.5 6.07 Use of virtual social networks* ...........................16 ......... 6.2
7th pillar: Business usage 7.01 Firm-level technology absorption* ......................14 ......... 5.9 7.02 Capacity for innovation* .......................................7 ......... 5.2 7.03 PCT patents, applications/million pop. ..............12 ..... 134.4 7.04 Business-to-business Internet use* ....................35 ......... 5.6 7.05 Business-to-consumer Internet use* ....................3 ......... 6.0 7.06 Extent of staff training* .......................................15 ......... 5.0
8th pillar: Government usage 8.01 Importance of ICTs to gov’t vision* .....................34 ......... 4.5 8.02 Government Online Service Index, 0–1 (best) .......1 ....... 1.00 8.03 Gov’t success in ICT promotion* ........................32 ......... 5.0
9th pillar: Economic impacts 9.01 Impact of ICTs on new services and products* ..16 ......... 5.4 9.02 ICT PCT patents, applications/million pop. .........9 ....... 48.0 9.03 Impact of ICTs on new organizational models* .....6 ......... 5.4 9.04 Knowledge-intensive jobs, % workforce .............29 ....... 36.3
10th pillar: Social impacts 10.01 Impact of ICTs on access to basic services* ......30 ......... 5.2 10.02 Internet access in schools* ................................24 ......... 5.7 10.03 ICT use & gov’t efficiency* .................................41 ......... 4.7 10.04 E-Participation Index, 0–1 (best)...........................5 ....... 0.92
Rank Score (out of 144) (1–7)
Networked Readiness Index 2013 ................ 9 ..5.6Networked Readiness Index 2012 (out of 142) ........................ 8 .....5.6
A. Environment subindex ..............................................16 ....5.11st pillar: Political and regulatory environment ................... 22 .....4.92nd pillar: Business and innovation environment ............... 13 .....5.3
B. Readiness subindex ...................................................4 ....6.23rd pillar: Infrastructure and digital content .......................... 7 .....6.84th pillar: Affordability ........................................................ 15 .....6.35th pillar: Skills ................................................................... 20 .....5.6
C. Usage subindex ........................................................13 ....5.56th pillar: Individual usage .................................................. 18 .....5.77th pillar: Business usage .................................................. 10 .....5.48th pillar: Government usage ............................................. 11 .....5.5
D. Impact subindex .......................................................10 ....5.49th pillar: Economic impacts .............................................. 11 .....5.310th pillar: Social impacts .................................................. 11 .....5.5
United States3: Country/Economy Profiles
The Global Information Technology Report 2013 | 279
Note: Indicators followed by an asterisk (*) are measured on a 1-to-7 (best) scale. For further details and explanation, please refer to the section “How to Read the Country/Economy Profiles” on page 139.
United States High-income group average
1. Political and regulatory environment
6. Individual usage
5. Skills7. Business usage
4. Affordability8. Governmentusage
3. Infrastructure anddigital content
9. Economicimpacts
2. Business and innovation environment
10. Socialimpacts
1
2
3
4
5
6
7
@ 2013 World Economic Forum
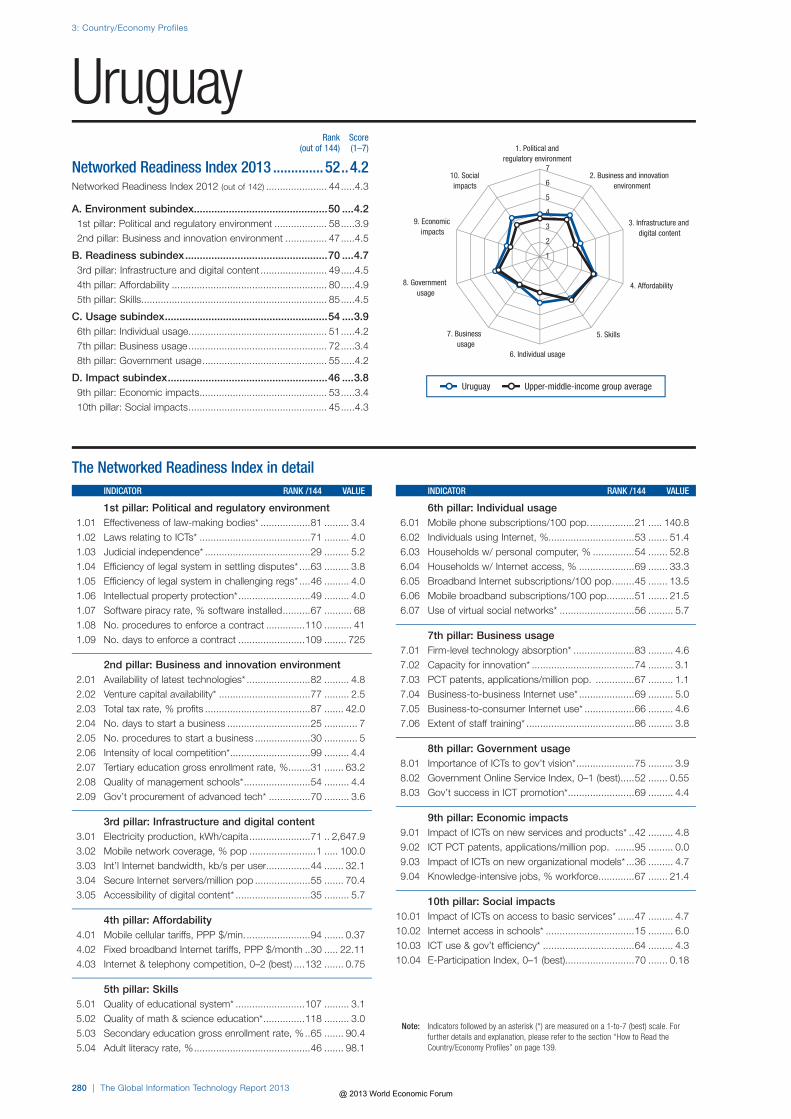
The Networked Readiness Index in detailINDICATOR RANK /144 VALUE
1st pillar: Political and regulatory environment1.01 Effectiveness of law-making bodies* ..................81 ......... 3.41.02 Laws relating to ICTs* ........................................71 ......... 4.01.03 Judicial independence* ......................................29 ......... 5.21.04 Efficiency of legal system in settling disputes* ....63 ......... 3.81.05 Efficiency of legal system in challenging regs* ....46 ......... 4.01.06 Intellectual property protection* ..........................49 ......... 4.01.07 Software piracy rate, % software installed ..........67 .......... 681.08 No. procedures to enforce a contract ..............110 .......... 411.09 No. days to enforce a contract ........................109 ........ 725
2nd pillar: Business and innovation environment2.01 Availability of latest technologies* .......................82 ......... 4.82.02 Venture capital availability* .................................77 ......... 2.52.03 Total tax rate, % profits ......................................87 ....... 42.02.04 No. days to start a business ..............................25 ............ 72.05 No. procedures to start a business ....................30 ............ 52.06 Intensity of local competition* .............................99 ......... 4.42.07 Tertiary education gross enrollment rate, % ........31 ....... 63.22.08 Quality of management schools* ........................54 ......... 4.42.09 Gov’t procurement of advanced tech* ...............70 ......... 3.6
3rd pillar: Infrastructure and digital content3.01 Electricity production, kWh/capita ......................71 .. 2,647.93.02 Mobile network coverage, % pop ........................1 ..... 100.03.03 Int’l Internet bandwidth, kb/s per user................44 ....... 32.13.04 Secure Internet servers/million pop ....................55 ....... 70.43.05 Accessibility of digital content* ...........................35 ......... 5.7
4th pillar: Affordability4.01 Mobile cellular tariffs, PPP $/min. .......................94 ....... 0.374.02 Fixed broadband Internet tariffs, PPP $/month ..30 ..... 22.114.03 Internet & telephony competition, 0–2 (best) ....132 ....... 0.75
5th pillar: Skills5.01 Quality of educational system* .........................107 ......... 3.15.02 Quality of math & science education* ...............118 ......... 3.05.03 Secondary education gross enrollment rate, % ..65 ....... 90.45.04 Adult literacy rate, % ..........................................46 ....... 98.1
INDICATOR RANK /144 VALUE
6th pillar: Individual usage 6.01 Mobile phone subscriptions/100 pop. ................21 ..... 140.8 6.02 Individuals using Internet, %...............................53 ....... 51.4 6.03 Households w/ personal computer, % ...............54 ....... 52.8 6.04 Households w/ Internet access, % ....................69 ....... 33.3 6.05 Broadband Internet subscriptions/100 pop. .......45 ....... 13.5 6.06 Mobile broadband subscriptions/100 pop. .........51 ....... 21.5 6.07 Use of virtual social networks* ...........................56 ......... 5.7
7th pillar: Business usage 7.01 Firm-level technology absorption* ......................83 ......... 4.6 7.02 Capacity for innovation* .....................................74 ......... 3.1 7.03 PCT patents, applications/million pop. ..............67 ......... 1.1 7.04 Business-to-business Internet use* ....................69 ......... 5.0 7.05 Business-to-consumer Internet use* ..................66 ......... 4.6 7.06 Extent of staff training* .......................................86 ......... 3.8
8th pillar: Government usage 8.01 Importance of ICTs to gov’t vision* .....................75 ......... 3.9 8.02 Government Online Service Index, 0–1 (best) .....52 ....... 0.55 8.03 Gov’t success in ICT promotion* ........................69 ......... 4.4
9th pillar: Economic impacts 9.01 Impact of ICTs on new services and products* ..42 ......... 4.8 9.02 ICT PCT patents, applications/million pop. .......95 ......... 0.0 9.03 Impact of ICTs on new organizational models* ...36 ......... 4.7 9.04 Knowledge-intensive jobs, % workforce .............67 ....... 21.4
10th pillar: Social impacts 10.01 Impact of ICTs on access to basic services* ......47 ......... 4.7 10.02 Internet access in schools* ................................15 ......... 6.0 10.03 ICT use & gov’t efficiency* .................................64 ......... 4.3 10.04 E-Participation Index, 0–1 (best).........................70 ....... 0.18
Rank Score (out of 144) (1–7)
Networked Readiness Index 2013 ..............52 ..4.2Networked Readiness Index 2012 (out of 142) ...................... 44 .....4.3
A. Environment subindex ..............................................50 ....4.21st pillar: Political and regulatory environment ................... 58 .....3.92nd pillar: Business and innovation environment ............... 47 .....4.5
B. Readiness subindex .................................................70 ....4.73rd pillar: Infrastructure and digital content ........................ 49 .....4.54th pillar: Affordability ........................................................ 80 .....4.95th pillar: Skills ................................................................... 85 .....4.5
C. Usage subindex ........................................................54 ....3.96th pillar: Individual usage .................................................. 51 .....4.27th pillar: Business usage .................................................. 72 .....3.48th pillar: Government usage ............................................. 55 .....4.2
D. Impact subindex .......................................................46 ....3.89th pillar: Economic impacts .............................................. 53 .....3.410th pillar: Social impacts .................................................. 45 .....4.3
Uruguay3: Country/Economy Profiles
280 | The Global Information Technology Report 2013
Note: Indicators followed by an asterisk (*) are measured on a 1-to-7 (best) scale. For further details and explanation, please refer to the section “How to Read the Country/Economy Profiles” on page 139.
Uruguay Upper-middle-income group average
1. Political and regulatory environment
6. Individual usage
5. Skills7. Business usage
4. Affordability8. Governmentusage
3. Infrastructure anddigital content
9. Economicimpacts
2. Business and innovation environment
10. Socialimpacts
1
2
3
4
5
6
7
@ 2013 World Economic Forum

The Networked Readiness Index in detailINDICATOR RANK /144 VALUE
1st pillar: Political and regulatory environment1.01 Effectiveness of law-making bodies* ................144 ......... 1.71.02 Laws relating to ICTs* ......................................104 ......... 3.41.03 Judicial independence* ....................................144 ......... 1.31.04 Efficiency of legal system in settling disputes* ..144 ......... 1.91.05 Efficiency of legal system in challenging regs* ..144 ......... 1.71.06 Intellectual property protection* ........................143 ......... 1.71.07 Software piracy rate, % software installed ........100 .......... 881.08 No. procedures to enforce a contract ................18 .......... 301.09 No. days to enforce a contract ..........................65 ........ 510
2nd pillar: Business and innovation environment2.01 Availability of latest technologies* .....................103 ......... 4.52.02 Venture capital availability* ...............................109 ......... 2.22.03 Total tax rate, % profits ....................................126 ....... 62.72.04 No. days to start a business ............................142 ........ 1442.05 No. procedures to start a business ..................143 .......... 172.06 Intensity of local competition* ...........................143 ......... 3.32.07 Tertiary education gross enrollment rate, % ........13 ....... 78.12.08 Quality of management schools* ........................72 ......... 4.22.09 Gov’t procurement of advanced tech* .............144 ......... 2.0
3rd pillar: Infrastructure and digital content3.01 Electricity production, kWh/capita ......................52 .. 4,349.23.02 Mobile network coverage, % pop ....................101 ....... 90.03.03 Int’l Internet bandwidth, kb/s per user................92 ......... 8.13.04 Secure Internet servers/million pop ....................95 ......... 8.13.05 Accessibility of digital content* ...........................98 ......... 4.4
4th pillar: Affordability4.01 Mobile cellular tariffs, PPP $/min. .....................115 ....... 0.514.02 Fixed broadband Internet tariffs, PPP $/month ..15 ..... 18.274.03 Internet & telephony competition, 0–2 (best) ........1 ....... 2.00
5th pillar: Skills5.01 Quality of educational system* .........................122 ......... 2.85.02 Quality of math & science education* ...............120 ......... 2.95.03 Secondary education gross enrollment rate, % ..86 ....... 83.55.04 Adult literacy rate, % ..........................................60 ....... 95.5
INDICATOR RANK /144 VALUE
6th pillar: Individual usage 6.01 Mobile phone subscriptions/100 pop. ................88 ....... 97.8 6.02 Individuals using Internet, %...............................71 ....... 40.2 6.03 Households w/ personal computer, % ...............92 ....... 17.3 6.04 Households w/ Internet access, % ....................90 ....... 11.0 6.05 Broadband Internet subscriptions/100 pop. .......71 ......... 6.2 6.06 Mobile broadband subscriptions/100 pop. .........62 ....... 16.1 6.07 Use of virtual social networks* ...........................44 ......... 5.8
7th pillar: Business usage 7.01 Firm-level technology absorption* ....................117 ......... 4.1 7.02 Capacity for innovation* ...................................134 ......... 2.3 7.03 PCT patents, applications/million pop. ..............86 ......... 0.2 7.04 Business-to-business Internet use* ..................109 ......... 4.4 7.05 Business-to-consumer Internet use* ..................85 ......... 4.3 7.06 Extent of staff training* .....................................104 ......... 3.6
8th pillar: Government usage 8.01 Importance of ICTs to gov’t vision* ...................136 ......... 2.7 8.02 Government Online Service Index, 0–1 (best) .....72 ....... 0.48 8.03 Gov’t success in ICT promotion* ......................134 ......... 3.1
9th pillar: Economic impacts 9.01 Impact of ICTs on new services and products* 118 ......... 3.7 9.02 ICT PCT patents, applications/million pop. .......90 ......... 0.0 9.03 Impact of ICTs on new organizational models* .105 ......... 3.6 9.04 Knowledge-intensive jobs, % workforce .............57 ....... 23.9
10th pillar: Social impacts 10.01 Impact of ICTs on access to basic services* ....118 ......... 3.5 10.02 Internet access in schools* ..............................101 ......... 3.4 10.03 ICT use & gov’t efficiency* ...............................133 ......... 3.0 10.04 E-Participation Index, 0–1 (best).........................54 ....... 0.26
Rank Score (out of 144) (1–7)
Networked Readiness Index 2013 ............108 ..3.3Networked Readiness Index 2012 (out of 142) .................... 107 .....3.3
A. Environment subindex ............................................140 ....2.81st pillar: Political and regulatory environment ................. 142 .....2.42nd pillar: Business and innovation environment ............. 134 .....3.2
B. Readiness subindex .................................................81 ....4.43rd pillar: Infrastructure and digital content ........................ 85 .....3.44th pillar: Affordability ........................................................ 51 .....5.65th pillar: Skills ................................................................... 96 .....4.3
C. Usage subindex ......................................................105 ....3.16th pillar: Individual usage .................................................. 80 .....3.07th pillar: Business usage ................................................ 120 .....3.08th pillar: Government usage ........................................... 126 .....3.2
D. Impact subindex .....................................................104 ....3.09th pillar: Economic impacts .............................................. 95 .....2.910th pillar: Social impacts ................................................ 106 .....3.1
Venezuela3: Country/Economy Profiles
The Global Information Technology Report 2013 | 281
Note: Indicators followed by an asterisk (*) are measured on a 1-to-7 (best) scale. For further details and explanation, please refer to the section “How to Read the Country/Economy Profiles” on page 139.
Venezuela Upper-middle-income group average
1. Political and regulatory environment
6. Individual usage
5. Skills7. Business usage
4. Affordability8. Governmentusage
3. Infrastructure anddigital content
9. Economicimpacts
2. Business and innovation environment
10. Socialimpacts
1
2
3
4
5
6
7
@ 2013 World Economic Forum

The Networked Readiness Index in detailINDICATOR RANK /144 VALUE
1st pillar: Political and regulatory environment1.01 Effectiveness of law-making bodies* ..................49 ......... 3.91.02 Laws relating to ICTs* ........................................92 ......... 3.71.03 Judicial independence* ......................................87 ......... 3.41.04 Efficiency of legal system in settling disputes* ....74 ......... 3.61.05 Efficiency of legal system in challenging regs* ....74 ......... 3.61.06 Intellectual property protection* ........................123 ......... 2.61.07 Software piracy rate, % software installed ..........88 .......... 811.08 No. procedures to enforce a contract ................43 .......... 341.09 No. days to enforce a contract ..........................33 ........ 400
2nd pillar: Business and innovation environment2.01 Availability of latest technologies* .....................137 ......... 3.62.02 Venture capital availability* .................................96 ......... 2.32.03 Total tax rate, % profits ......................................54 ....... 34.52.04 No. days to start a business ............................114 .......... 342.05 No. procedures to start a business ..................114 .......... 102.06 Intensity of local competition* .............................44 ......... 5.12.07 Tertiary education gross enrollment rate, % ........87 ....... 22.32.08 Quality of management schools* ......................125 ......... 3.22.09 Gov’t procurement of advanced tech* ...............39 ......... 3.9
3rd pillar: Infrastructure and digital content3.01 Electricity production, kWh/capita ......................97 ..... 967.13.02 Mobile network coverage, % pop ....................124 ....... 70.03.03 Int’l Internet bandwidth, kb/s per user................84 ....... 10.03.04 Secure Internet servers/million pop ..................101 ......... 4.73.05 Accessibility of digital content* ...........................49 ......... 5.3
4th pillar: Affordability4.01 Mobile cellular tariffs, PPP $/min. .......................53 ....... 0.214.02 Fixed broadband Internet tariffs, PPP $/month ..48 ..... 28.014.03 Internet & telephony competition, 0–2 (best) ......68 ....... 1.87
5th pillar: Skills5.01 Quality of educational system* ...........................72 ......... 3.65.02 Quality of math & science education* .................58 ......... 4.15.03 Secondary education gross enrollment rate, % ..94 ....... 77.25.04 Adult literacy rate, % ..........................................71 ....... 93.2
INDICATOR RANK /144 VALUE
6th pillar: Individual usage 6.01 Mobile phone subscriptions/100 pop. ................19 ..... 143.4 6.02 Individuals using Internet, %...............................80 ....... 35.1 6.03 Households w/ personal computer, % ...............93 ....... 16.0 6.04 Households w/ Internet access, % ....................88 ....... 12.5 6.05 Broadband Internet subscriptions/100 pop. .......79 ......... 4.3 6.06 Mobile broadband subscriptions/100 pop. .........58 ....... 18.0 6.07 Use of virtual social networks* .........................116 ......... 4.7
7th pillar: Business usage 7.01 Firm-level technology absorption* ....................126 ......... 4.0 7.02 Capacity for innovation* .....................................78 ......... 3.0 7.03 PCT patents, applications/million pop. ..............89 ......... 0.1 7.04 Business-to-business Internet use* ....................24 ......... 5.7 7.05 Business-to-consumer Internet use* ..................34 ......... 5.2 7.06 Extent of staff training* .....................................116 ......... 3.3
8th pillar: Government usage 8.01 Importance of ICTs to gov’t vision* .....................66 ......... 4.1 8.02 Government Online Service Index, 0–1 (best) .....87 ....... 0.42 8.03 Gov’t success in ICT promotion* ........................41 ......... 4.8
9th pillar: Economic impacts 9.01 Impact of ICTs on new services and products* ..37 ......... 5.0 9.02 ICT PCT patents, applications/million pop. .......88 ......... 0.0 9.03 Impact of ICTs on new organizational models* ...56 ......... 4.4 9.04 Knowledge-intensive jobs, % workforce .............99 ......... 7.4
10th pillar: Social impacts 10.01 Impact of ICTs on access to basic services* ......55 ......... 4.6 10.02 Internet access in schools* ................................41 ......... 5.0 10.03 ICT use & gov’t efficiency* .................................86 ......... 4.0 10.04 E-Participation Index, 0–1 (best).........................91 ....... 0.11
Rank Score (out of 144) (1–7)
Networked Readiness Index 2013 ..............84 ..3.7Networked Readiness Index 2012 (out of 142) ...................... 83 .....3.7
A. Environment subindex ..............................................97 ....3.61st pillar: Political and regulatory environment ................... 85 .....3.52nd pillar: Business and innovation environment ............. 108 .....3.7
B. Readiness subindex .................................................79 ....4.43rd pillar: Infrastructure and digital content ...................... 114 .....2.84th pillar: Affordability ........................................................ 38 .....5.95th pillar: Skills ................................................................... 79 .....4.7
C. Usage subindex ........................................................73 ....3.56th pillar: Individual usage .................................................. 78 .....3.17th pillar: Business usage .................................................. 88 .....3.38th pillar: Government usage ............................................. 62 .....4.2
D. Impact subindex .......................................................75 ....3.49th pillar: Economic impacts .............................................. 89 .....3.010th pillar: Social impacts .................................................. 64 .....3.8
Vietnam3: Country/Economy Profiles
282 | The Global Information Technology Report 2013
Note: Indicators followed by an asterisk (*) are measured on a 1-to-7 (best) scale. For further details and explanation, please refer to the section “How to Read the Country/Economy Profiles” on page 139.
Vietnam Lower-middle-income group average
1. Political and regulatory environment
6. Individual usage
5. Skills7. Business usage
4. Affordability8. Governmentusage
3. Infrastructure anddigital content
9. Economicimpacts
2. Business and innovation environment
10. Socialimpacts
1
2
3
4
5
6
7
@ 2013 World Economic Forum
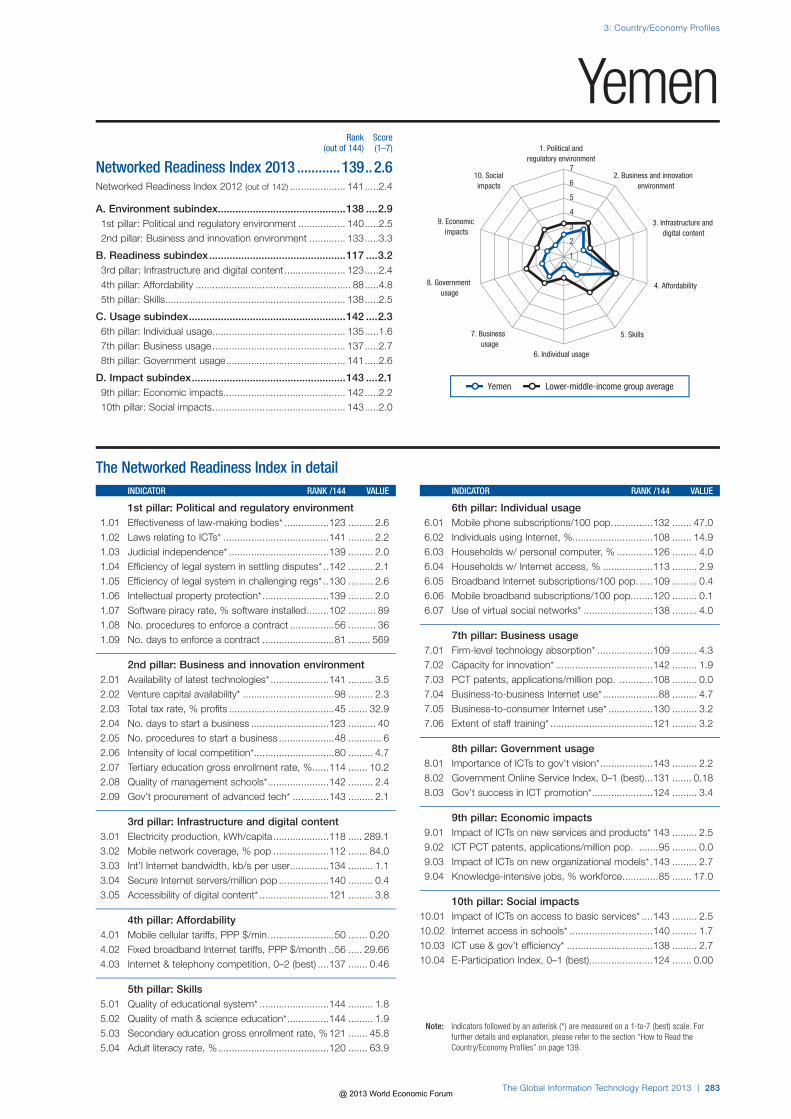
The Networked Readiness Index in detailINDICATOR RANK /144 VALUE
1st pillar: Political and regulatory environment1.01 Effectiveness of law-making bodies* ................123 ......... 2.61.02 Laws relating to ICTs* ......................................141 ......... 2.21.03 Judicial independence* ....................................139 ......... 2.01.04 Efficiency of legal system in settling disputes* ..142 ......... 2.11.05 Efficiency of legal system in challenging regs* ..130 ......... 2.61.06 Intellectual property protection* ........................139 ......... 2.01.07 Software piracy rate, % software installed ........102 .......... 891.08 No. procedures to enforce a contract ................56 .......... 361.09 No. days to enforce a contract ..........................81 ........ 569
2nd pillar: Business and innovation environment2.01 Availability of latest technologies* .....................141 ......... 3.52.02 Venture capital availability* .................................98 ......... 2.32.03 Total tax rate, % profits ......................................45 ....... 32.92.04 No. days to start a business ............................123 .......... 402.05 No. procedures to start a business ....................48 ............ 62.06 Intensity of local competition* .............................80 ......... 4.72.07 Tertiary education gross enrollment rate, % ......114 ....... 10.22.08 Quality of management schools* ......................142 ......... 2.42.09 Gov’t procurement of advanced tech* .............143 ......... 2.1
3rd pillar: Infrastructure and digital content3.01 Electricity production, kWh/capita ....................118 ..... 289.13.02 Mobile network coverage, % pop ....................112 ....... 84.03.03 Int’l Internet bandwidth, kb/s per user..............134 ......... 1.13.04 Secure Internet servers/million pop ..................140 ......... 0.43.05 Accessibility of digital content* .........................121 ......... 3.8
4th pillar: Affordability4.01 Mobile cellular tariffs, PPP $/min. .......................50 ....... 0.204.02 Fixed broadband Internet tariffs, PPP $/month ..56 ..... 29.664.03 Internet & telephony competition, 0–2 (best) ....137 ....... 0.46
5th pillar: Skills5.01 Quality of educational system* .........................144 ......... 1.85.02 Quality of math & science education* ...............144 ......... 1.95.03 Secondary education gross enrollment rate, % 121 ....... 45.85.04 Adult literacy rate, % ........................................120 ....... 63.9
INDICATOR RANK /144 VALUE
6th pillar: Individual usage 6.01 Mobile phone subscriptions/100 pop. ..............132 ....... 47.0 6.02 Individuals using Internet, %.............................108 ....... 14.9 6.03 Households w/ personal computer, % .............126 ......... 4.0 6.04 Households w/ Internet access, % ..................113 ......... 2.9 6.05 Broadband Internet subscriptions/100 pop. .....109 ......... 0.4 6.06 Mobile broadband subscriptions/100 pop. .......120 ......... 0.1 6.07 Use of virtual social networks* .........................138 ......... 4.0
7th pillar: Business usage 7.01 Firm-level technology absorption* ....................109 ......... 4.3 7.02 Capacity for innovation* ...................................142 ......... 1.9 7.03 PCT patents, applications/million pop. ............108 ......... 0.0 7.04 Business-to-business Internet use* ....................88 ......... 4.7 7.05 Business-to-consumer Internet use* ................130 ......... 3.2 7.06 Extent of staff training* .....................................121 ......... 3.2
8th pillar: Government usage 8.01 Importance of ICTs to gov’t vision* ...................143 ......... 2.2 8.02 Government Online Service Index, 0–1 (best) ...131 ....... 0.18 8.03 Gov’t success in ICT promotion* ......................124 ......... 3.4
9th pillar: Economic impacts 9.01 Impact of ICTs on new services and products* 143 ......... 2.5 9.02 ICT PCT patents, applications/million pop. .......95 ......... 0.0 9.03 Impact of ICTs on new organizational models* .143 ......... 2.7 9.04 Knowledge-intensive jobs, % workforce .............85 ....... 17.0
10th pillar: Social impacts 10.01 Impact of ICTs on access to basic services* ....143 ......... 2.5 10.02 Internet access in schools* ..............................140 ......... 1.7 10.03 ICT use & gov’t efficiency* ...............................138 ......... 2.7 10.04 E-Participation Index, 0–1 (best).......................124 ....... 0.00
Rank Score (out of 144) (1–7)
Networked Readiness Index 2013 ............139 ..2.6Networked Readiness Index 2012 (out of 142) .................... 141 .....2.4
A. Environment subindex ............................................138 ....2.91st pillar: Political and regulatory environment ................. 140 .....2.52nd pillar: Business and innovation environment ............. 133 .....3.3
B. Readiness subindex ...............................................117 ....3.23rd pillar: Infrastructure and digital content ...................... 123 .....2.44th pillar: Affordability ........................................................ 88 .....4.85th pillar: Skills ................................................................. 138 .....2.5
C. Usage subindex ......................................................142 ....2.36th pillar: Individual usage ................................................ 135 .....1.67th pillar: Business usage ................................................ 137 .....2.78th pillar: Government usage ........................................... 141 .....2.6
D. Impact subindex .....................................................143 ....2.19th pillar: Economic impacts ............................................ 142 .....2.210th pillar: Social impacts ................................................ 143 .....2.0
Yemen3: Country/Economy Profiles
The Global Information Technology Report 2013 | 283
Note: Indicators followed by an asterisk (*) are measured on a 1-to-7 (best) scale. For further details and explanation, please refer to the section “How to Read the Country/Economy Profiles” on page 139.
Yemen Lower-middle-income group average
1. Political and regulatory environment
6. Individual usage
5. Skills7. Business usage
4. Affordability8. Governmentusage
3. Infrastructure anddigital content
9. Economicimpacts
2. Business and innovation environment
10. Socialimpacts
1
2
3
4
5
6
7
@ 2013 World Economic Forum

The Networked Readiness Index in detailINDICATOR RANK /144 VALUE
1st pillar: Political and regulatory environment1.01 Effectiveness of law-making bodies* ..................43 ......... 4.01.02 Laws relating to ICTs* ........................................76 ......... 3.91.03 Judicial independence* ......................................79 ......... 3.51.04 Efficiency of legal system in settling disputes* ....39 ......... 4.41.05 Efficiency of legal system in challenging regs* ....55 ......... 3.91.06 Intellectual property protection* ..........................59 ......... 3.81.07 Software piracy rate, % software installed ..........90 .......... 821.08 No. procedures to enforce a contract ................48 .......... 351.09 No. days to enforce a contract ..........................57 ........ 471
2nd pillar: Business and innovation environment2.01 Availability of latest technologies* .......................92 ......... 4.62.02 Venture capital availability* .................................78 ......... 2.52.03 Total tax rate, % profits ........................................8 ....... 15.22.04 No. days to start a business ..............................75 .......... 172.05 No. procedures to start a business ....................48 ............ 62.06 Intensity of local competition* .............................61 ......... 5.02.07 Tertiary education gross enrollment rate, % ......135 ......... 2.42.08 Quality of management schools* ........................75 ......... 4.12.09 Gov’t procurement of advanced tech* ...............41 ......... 3.9
3rd pillar: Infrastructure and digital content3.01 Electricity production, kWh/capita ....................100 ..... 810.13.02 Mobile network coverage, % pop ....................129 ....... 62.03.03 Int’l Internet bandwidth, kb/s per user..............126 ......... 1.93.04 Secure Internet servers/million pop ..................116 ......... 1.63.05 Accessibility of digital content* .........................118 ......... 3.9
4th pillar: Affordability4.01 Mobile cellular tariffs, PPP $/min. .....................108 ....... 0.434.02 Fixed broadband Internet tariffs, PPP $/month 112 ..... 64.614.03 Internet & telephony competition, 0–2 (best) ......90 ....... 1.64
5th pillar: Skills5.01 Quality of educational system* ...........................39 ......... 4.25.02 Quality of math & science education* .................77 ......... 3.95.03 Secondary education gross enrollment rate, % 122 ....... 45.65.04 Adult literacy rate, % ........................................114 ....... 71.2
INDICATOR RANK /144 VALUE
6th pillar: Individual usage 6.01 Mobile phone subscriptions/100 pop. ..............123 ....... 60.6 6.02 Individuals using Internet, %.............................116 ....... 11.5 6.03 Households w/ personal computer, % .............133 ......... 2.4 6.04 Households w/ Internet access, % ..................121 ......... 2.0 6.05 Broadband Internet subscriptions/100 pop. .....129 ......... 0.1 6.06 Mobile broadband subscriptions/100 pop. .......117 ......... 0.2 6.07 Use of virtual social networks* ...........................95 ......... 5.2
7th pillar: Business usage 7.01 Firm-level technology absorption* ......................88 ......... 4.5 7.02 Capacity for innovation* .....................................76 ......... 3.1 7.03 PCT patents, applications/million pop. ............123 ......... 0.0 7.04 Business-to-business Internet use* ....................60 ......... 5.1 7.05 Business-to-consumer Internet use* ..................98 ......... 4.0 7.06 Extent of staff training* .....................................108 ......... 3.5
8th pillar: Government usage 8.01 Importance of ICTs to gov’t vision* .....................54 ......... 4.2 8.02 Government Online Service Index, 0–1 (best) ...110 ....... 0.31 8.03 Gov’t success in ICT promotion* ........................51 ......... 4.7
9th pillar: Economic impacts 9.01 Impact of ICTs on new services and products* ..81 ......... 4.3 9.02 ICT PCT patents, applications/million pop. .......95 ......... 0.0 9.03 Impact of ICTs on new organizational models* ...69 ......... 4.2 9.04 Knowledge-intensive jobs, % workforce ...........103 ......... 6.0
10th pillar: Social impacts 10.01 Impact of ICTs on access to basic services* ......97 ......... 3.8 10.02 Internet access in schools* ..............................107 ......... 3.2 10.03 ICT use & gov’t efficiency* .................................78 ......... 4.1 10.04 E-Participation Index, 0–1 (best).......................111 ....... 0.03
Rank Score (out of 144) (1–7)
Networked Readiness Index 2013 ............115 ..3.2Networked Readiness Index 2012 (out of 142) .................... 109 .....3.3
A. Environment subindex ..............................................61 ....4.01st pillar: Political and regulatory environment ................... 64 .....3.82nd pillar: Business and innovation environment ............... 65 .....4.2
B. Readiness subindex ...............................................129 ....2.93rd pillar: Infrastructure and digital content ...................... 133 .....2.04th pillar: Affordability ...................................................... 127 .....2.75th pillar: Skills ................................................................. 104 .....3.8
C. Usage subindex ......................................................109 ....3.06th pillar: Individual usage ................................................ 122 .....1.87th pillar: Business usage .................................................. 80 .....3.48th pillar: Government usage ............................................. 79 .....3.9
D. Impact subindex .....................................................112 ....2.99th pillar: Economic impacts ............................................ 115 .....2.710th pillar: Social impacts ................................................ 110 .....3.1
Zambia3: Country/Economy Profiles
284 | The Global Information Technology Report 2013
Note: Indicators followed by an asterisk (*) are measured on a 1-to-7 (best) scale. For further details and explanation, please refer to the section “How to Read the Country/Economy Profiles” on page 139.
Zambia Lower-middle-income group average
1. Political and regulatory environment
6. Individual usage
5. Skills7. Business usage
4. Affordability8. Governmentusage
3. Infrastructure anddigital content
9. Economicimpacts
2. Business and innovation environment
10. Socialimpacts
1
2
3
4
5
6
7
@ 2013 World Economic Forum

The Networked Readiness Index in detailINDICATOR RANK /144 VALUE
1st pillar: Political and regulatory environment1.01 Effectiveness of law-making bodies* ..................96 ......... 3.11.02 Laws relating to ICTs* ......................................122 ......... 3.01.03 Judicial independence* ....................................113 ......... 2.71.04 Efficiency of legal system in settling disputes* ....82 ......... 3.51.05 Efficiency of legal system in challenging regs* ..134 ......... 2.61.06 Intellectual property protection* ..........................94 ......... 3.11.07 Software piracy rate, % software installed ........107 .......... 921.08 No. procedures to enforce a contract ................78 .......... 381.09 No. days to enforce a contract ..........................38 ........ 410
2nd pillar: Business and innovation environment2.01 Availability of latest technologies* .....................119 ......... 4.12.02 Venture capital availability* ...............................137 ......... 1.82.03 Total tax rate, % profits ......................................65 ....... 35.82.04 No. days to start a business ............................137 .......... 902.05 No. procedures to start a business ..................102 ............ 92.06 Intensity of local competition* .............................94 ......... 4.42.07 Tertiary education gross enrollment rate, % ......125 ......... 6.02.08 Quality of management schools* ........................78 ......... 4.12.09 Gov’t procurement of advanced tech* .............135 ......... 2.6
3rd pillar: Infrastructure and digital content3.01 Electricity production, kWh/capita ....................108 ..... 631.63.02 Mobile network coverage, % pop ....................123 ....... 72.43.03 Int’l Internet bandwidth, kb/s per user..............127 ......... 1.73.04 Secure Internet servers/million pop ..................120 ......... 1.33.05 Accessibility of digital content* .........................126 ......... 3.6
4th pillar: Affordability4.01 Mobile cellular tariffs, PPP $/min. .......................30 ....... 0.154.02 Fixed broadband Internet tariffs, PPP $/month ..25 ..... 20.534.03 Internet & telephony competition, 0–2 (best) ......82 ....... 1.79
5th pillar: Skills5.01 Quality of educational system* ...........................30 ......... 4.55.02 Quality of math & science education* .................50 ......... 4.35.03 Secondary education gross enrollment rate, % 128 ....... 41.05.04 Adult literacy rate, % ..........................................77 ....... 92.2
INDICATOR RANK /144 VALUE
6th pillar: Individual usage 6.01 Mobile phone subscriptions/100 pop. ..............116 ....... 72.1 6.02 Individuals using Internet, %.............................106 ....... 15.7 6.03 Households w/ personal computer, % .............113 ......... 5.9 6.04 Households w/ Internet access, % ..................109 ......... 4.0 6.05 Broadband Internet subscriptions/100 pop. .....115 ......... 0.3 6.06 Mobile broadband subscriptions/100 pop. .........64 ....... 14.9 6.07 Use of virtual social networks* .........................122 ......... 4.6
7th pillar: Business usage 7.01 Firm-level technology absorption* ......................99 ......... 4.4 7.02 Capacity for innovation* ...................................129 ......... 2.4 7.03 PCT patents, applications/million pop. ..............96 ......... 0.1 7.04 Business-to-business Internet use* ..................100 ......... 4.6 7.05 Business-to-consumer Internet use* ................121 ......... 3.5 7.06 Extent of staff training* .......................................82 ......... 3.8
8th pillar: Government usage 8.01 Importance of ICTs to gov’t vision* ...................109 ......... 3.4 8.02 Government Online Service Index, 0–1 (best) ...136 ....... 0.13 8.03 Gov’t success in ICT promotion* ........................97 ......... 4.0
9th pillar: Economic impacts 9.01 Impact of ICTs on new services and products* 120 ......... 3.6 9.02 ICT PCT patents, applications/million pop. .......91 ......... 0.0 9.03 Impact of ICTs on new organizational models* .123 ......... 3.4 9.04 Knowledge-intensive jobs, % workforce ............n/a ......... n/a
10th pillar: Social impacts 10.01 Impact of ICTs on access to basic services* ....132 ......... 3.2 10.02 Internet access in schools* ..............................123 ......... 2.6 10.03 ICT use & gov’t efficiency* ...............................137 ......... 2.7 10.04 E-Participation Index, 0–1 (best).......................111 ....... 0.03
Rank Score (out of 144) (1–7)
Networked Readiness Index 2013 ............116 ..3.2Networked Readiness Index 2012 (out of 142) .................... 124 .....2.9
A. Environment subindex ............................................132 ....3.11st pillar: Political and regulatory environment ................. 120 .....3.02nd pillar: Business and innovation environment ............. 135 .....3.2
B. Readiness subindex .................................................87 ....4.33rd pillar: Infrastructure and digital content ...................... 129 .....2.24th pillar: Affordability .......................................................... 9 .....6.55th pillar: Skills ................................................................... 98 .....4.2
C. Usage subindex ......................................................125 ....2.76th pillar: Individual usage ................................................ 114 .....2.17th pillar: Business usage ................................................ 115 .....3.08th pillar: Government usage ........................................... 132 .....3.1
D. Impact subindex .....................................................128 ....2.69th pillar: Economic impacts ............................................ 119 .....2.710th pillar: Social impacts ................................................ 132 .....2.4
Zimbabwe3: Country/Economy Profiles
The Global Information Technology Report 2013 | 285
Note: Indicators followed by an asterisk (*) are measured on a 1-to-7 (best) scale. For further details and explanation, please refer to the section “How to Read the Country/Economy Profiles” on page 139.
Zimbabwe Low-income group average
1. Political and regulatory environment
6. Individual usage
5. Skills7. Business usage
4. Affordability8. Governmentusage
3. Infrastructure anddigital content
9. Economicimpacts
2. Business and innovation environment
10. Socialimpacts
1
2
3
4
5
6
7
@ 2013 World Economic Forum

@ 2013 World Economic Forum

Part 4Data Tables
@ 2013 World Economic Forum

@ 2013 World Economic Forum

How to Read the Data Tables
The Global Information Technology Report 2013 | 289
The following pages provide detailed data for all 144 economies included in The Global Information Technology Report 2013. The data tables are organized into 10 sections, which correspond to the 10 pillars of the Networked Readiness Index (NRI).
Environment subindex1st pillar: Political and regulatory environment2nd pillar: Business and innovation environment
Readiness subindex3rd pillar: Infrastructure and digital content4th pillar: Affordability5th pillar: Skills
Usage subindex6th pillar: Individual usage7th pillar: Business usage8th pillar: Government usage
Impact subindex9th pillar: Economic impacts10th pillar: Social impacts
EXECUTIVE OPINION SURVEY INDICATORS In the tables, indicators derived from the World Economic Forum’s Executive Opinion Survey (the Survey) have scores represented by blue-colored bar graphs. Survey questions asked for responses on a scale of 1 to 7, where an answer of 1 and 7 always corresponds to the worst and best possible outcomes, respectively. In the tables, the Survey question and the two extreme answers are shown above the rankings. Scores are reported with a precision of one decimal point, although exact figures are used to determine rankings. The sample mean is represented by a dotted line running across the bar graphs. For more information on the Executive Opinion Survey and a detailed explanation of how scores are computed, please refer to Chapter 1.3 of The Global Competitiveness Report 2012–2013, available for free on the World Economic Forum website at www.weforum.org/gcr.
OTHER INDICATORSIndicators not derived from the Executive Opinion Survey are presented in black bar graphs. For each indicator, a short description appears at the top of the page. The base period (i.e., the period to which the majority of the data corresponds) follows the description. When the period differs from the base period for a particular economy, this is indicated in a footnote. A detailed description for each indicator can be found in the “Technical Notes and Sources” section at the end of the Report. When data are not available or are too outdated, “n/a” is used in lieu of the rank and the value.
Because of the nature of data, ties between two or more countries are possible. In such cases, shared rankings are indicated accordingly. For example, it takes the same number of procedures—26—in Belgium as in Luxembourg and the Netherlands to enforce a contract. As a result, in Table 1.08, all three countries are ranked 5th and listed alphabetically.
ONLINE DATA PORTALComplementing the analysis presented in this Report, an online data portal can be accessed via www.weforum.org/gitr. The platform offers a number of analytical tools and visualizations, including sortable rankings, scatter plots, bar charts, and maps, as well as the possibility of downloading portions of the NRI dataset.
294 | The Global Information Technology Report 2013
4: Data Tables
RANK COUNTRY/ECONOMY VALUE 1 MEAN: 3.6 7
1 Singapore .................................. 6.4 2 New Zealand ............................. 5.8 3 Finland ....................................... 5.6 4 Luxembourg .............................. 5.5 5 Sweden ..................................... 5.5 6 Canada ...................................... 5.3 7 Norway ...................................... 5.3 8 United Kingdom ......................... 5.2 9 Rwanda ..................................... 5.2 10 Barbados ................................... 5.1 11 Netherlands ............................... 5.1 12 Malaysia ..................................... 5.1 13 Qatar ......................................... 5.0 14 Oman ........................................ 5.0 15 Botswana .................................. 5.0 16 Switzerland ................................ 4.9 17 Denmark .................................... 4.9 18 Australia ..................................... 4.9 19 Mauritius .................................... 4.8 20 Germany .................................... 4.8 21 United Arab Emirates ................. 4.8 22 Turkey ........................................ 4.8 23 Gambia, The .............................. 4.8 24 Brunei Darussalam ..................... 4.7 25 Sri Lanka ................................... 4.7 26 Saudi Arabia .............................. 4.6 27 Cyprus ....................................... 4.6 28 France ....................................... 4.5 29 Malta ......................................... 4.4 30 Estonia ....................................... 4.4 31 South Africa ............................... 4.3 32 Ireland ........................................ 4.3 33 China ......................................... 4.3 34 Cape Verde ............................... 4.3 35 Liberia ........................................ 4.2 36 Seychelles .................................. 4.2 37 Austria ....................................... 4.2 38 Namibia ..................................... 4.1 39 Tajikistan .................................... 4.1 40 Ghana ........................................ 4.1 41 Benin ......................................... 4.1 42 Montenegro ............................... 4.1 43 Zambia ...................................... 4.0 44 Kazakhstan ................................ 4.0 45 Uganda ...................................... 4.0 46 Sierra Leone .............................. 4.0 47 Bahrain ...................................... 4.0 48 Cambodia .................................. 4.0 49 Vietnam ..................................... 3.9 50 Iran, Islamic Rep. ....................... 3.9 51 Hong Kong SAR ........................ 3.9 52 Chile .......................................... 3.9 53 India ........................................... 3.9 54 Japan ........................................ 3.9 55 Israel .......................................... 3.9 56 United States ............................. 3.8 57 Timor-Leste ............................... 3.8 58 Hungary ..................................... 3.8 59 Azerbaijan .................................. 3.8 60 Spain ......................................... 3.7 61 Kenya ........................................ 3.7 62 Gabon ....................................... 3.7 63 Belgium ..................................... 3.7 64 Morocco .................................... 3.6 65 Tanzania .................................... 3.6 66 Nigeria ....................................... 3.6 67 Iceland ....................................... 3.6 68 Macedonia, FYR ........................ 3.6 69 Georgia ...................................... 3.6 70 Ethiopia ...................................... 3.5 71 Jamaica ..................................... 3.5 72 Taiwan, China ............................ 3.5
RANK COUNTRY/ECONOMY VALUE 1 MEAN: 3.6 7
73 Trinidad and Tobago .................. 3.5 74 Portugal ..................................... 3.5 75 Guyana ...................................... 3.5 76 Malawi ....................................... 3.5 77 Indonesia ................................... 3.5 78 Mozambique .............................. 3.4 79 Armenia ..................................... 3.4 80 Mali ............................................ 3.4 81 Uruguay ..................................... 3.4 82 Poland ....................................... 3.3 83 Kuwait ....................................... 3.3 84 Jordan ....................................... 3.3 85 Libya .......................................... 3.3 86 Burkina Faso .............................. 3.3 87 Latvia ......................................... 3.3 88 Albania ....................................... 3.3 89 Mongolia .................................... 3.2 90 Croatia ....................................... 3.2 91 Bolivia ........................................ 3.2 92 Serbia ........................................ 3.2 93 Philippines ................................. 3.2 94 Honduras ................................... 3.1 95 Cameroon .................................. 3.1 96 Zimbabwe .................................. 3.1 97 Slovak Republic ......................... 3.1 98 Lithuania .................................... 3.1 99 Greece ....................................... 3.1 100 Bosnia and Herzegovina ............ 3.1 101 Bangladesh ................................ 3.1 102 Pakistan ..................................... 3.0 103 Moldova ..................................... 3.0 104 Mauritania .................................. 3.0 105 Thailand ..................................... 3.0 106 Czech Republic ......................... 3.0 107 Russian Federation .................... 3.0 108 Lesotho ..................................... 3.0 109 Slovenia ..................................... 3.0 110 Swaziland .................................. 2.9 111 Bulgaria ..................................... 2.9 112 Senegal ..................................... 2.8 113 Panama ..................................... 2.8 114 Côte d’Ivoire .............................. 2.8 115 Puerto Rico ................................ 2.8 116 Italy ............................................ 2.8 117 Colombia ................................... 2.8 118 Korea, Rep. ............................... 2.8 119 Suriname ................................... 2.7 120 Brazil .......................................... 2.7 121 Nicaragua .................................. 2.7 122 Egypt ......................................... 2.6 123 Yemen ....................................... 2.6 124 Dominican Republic ................... 2.6 125 Nepal ......................................... 2.6 126 Ecuador ..................................... 2.5 127 Romania .................................... 2.5 128 Mexico ....................................... 2.4 129 Madagascar ............................... 2.4 130 Algeria ....................................... 2.4 131 Kyrgyz Republic ......................... 2.3 132 Ukraine ...................................... 2.3 133 Burundi ...................................... 2.3 134 Lebanon .................................... 2.3 135 Guinea ....................................... 2.3 136 Chad .......................................... 2.3 137 El Salvador................................. 2.2 138 Paraguay ................................... 2.2 139 Costa Rica ................................. 2.2 140 Guatemala ................................. 2.2 141 Argentina ................................... 2.0 142 Peru ........................................... 2.0 143 Haiti ........................................... 1.9 144 Venezuela .................................. 1.7
1.01 Effectiveness of law-making bodies*How effective is your national parliament/congress as a law-making institution? [1 = very ineffective; 7 = very effective—among the best in the world] | 2011–2012 weighted average
SOURCE: World Economic Forum, Executive Opinion Survey, 2011 and 2012 editions
@ 2013 World Economic Forum

@ 2013 World Economic Forum

The Global Information Technology Report 2013 | 291
Index of Data Tables
Environment subindex1st pillar: Political and regulatory environment ..................293
1.01 Effectiveness of law-making bodies ............................. 2941.02 Laws relating to ICTs .................................................... 2951.03 Judicial independence .................................................. 2961.04 Efficiency of legal framework in settling disputes ..........2971.05 Efficiency of legal framework in challenging regulations 2981.06 Intellectual property protection ..................................... 2991.07 Software piracy rate ..................................................... 3001.08 Number of procedures to enforce a contract ............... 3011.09 Time to enforce a contract ........................................... 302
2nd pillar: Business and innovation environment ..............3032.01 Availability of latest technologies .................................. 3042.02 Venture capital availability ............................................. 3052.03 Total tax rate ................................................................. 3062.04 Time required to start a business ................................. 3072.05 Number of procedures required to start a business .... 3082.06 Intensity of local competition ........................................ 3092.07 Tertiary education enrollment rate .................................3102.08 Quality of management schools ....................................3112.09 Government procurement of advanced technology
products ........................................................................312
Readiness subindex3rd pillar: Infrastructure and digital content .......................313
3.01 Electricity production .....................................................3143.02 Mobile network coverage rate .......................................3153.03 International Internet bandwidth ....................................3163.04 Secure Internet servers .................................................3173.05 Accessibility of digital content .......................................318
4th pillar: Affordability ..........................................................3194.01 Mobile cellular tariffs ..................................................... 3204.02 Fixed broadband Internet tariffs ....................................3214.03 Internet and telephony sectors competition index ........ 322
5th pillar: Skills .....................................................................3235.01 Quality of the educational system ..................................3245.02 Quality of math and science education .........................3255.03 Secondary enrollment rate ........................................... 3265.04 Adult literacy rate ...........................................................327
Usage subindex6th pillar: Individual usage ...................................................329 6.01 Mobile telephone subscriptions .................................... 330 6.02 Internet users .................................................................331 6.03 Households with a personal computer ......................... 332 6.04 Households with Internet access ................................. 333 6.05 Fixed broadband Internet subscriptions ....................... 334 6.06 Mobile broadband Internet subscriptions ..................... 335 6.07 Use of virtual social networks ....................................... 336
7th pillar: Business usage ....................................................337 7.01 Firm-level technology absorption.................................. 338 7.02 Capacity for innovation ................................................. 339 7.03 PCT patents applications .............................................. 340 7.04 Business-to-business Internet use ................................341 7.05 Business-to-consumer Internet use ............................. 342 7.06 Extent of staff training ................................................... 343
8th pillar: Government usage ..............................................345 8.01 Importance of ICTs to government vision of the future . 346 8.02 Government Online Service Index .................................347 8.03 Government success in ICT promotion ........................ 348
Impact subindex9th pillar: Economic impacts ...............................................349 9.01 Impact of ICTs on new services and products ............. 350 9.02 PCT ICT patent applications ..........................................351 9.03 Impact of ICTs on new organizational models .............. 352 9.04 Employment in knowledge-intensive activities ............. 353
10th pillar: Social impacts ...................................................355 10.01 Impact of ICTs on access to basic services ................. 356 10.02 Internet access in schools ............................................ 357 10.03 ICT use and government efficiency .............................. 358 10.04 E-Participation Index..................................................... 359
@ 2013 World Economic Forum

@ 2013 World Economic Forum

Data Tables
1st pillar Political and regulatory environment
@ 2013 World Economic Forum

294 | The Global Information Technology Report 2013
4: Data Tables
RANK COUNTRY/ECONOMY VALUE 1 MEAN: 3.6 7
1 Singapore .................................. 6.42 New Zealand ............................. 5.83 Finland ....................................... 5.64 Luxembourg .............................. 5.55 Sweden ..................................... 5.56 Canada ...................................... 5.37 Norway ...................................... 5.38 United Kingdom ......................... 5.29 Rwanda ..................................... 5.2
10 Barbados ................................... 5.111 Netherlands ............................... 5.112 Malaysia ..................................... 5.113 Qatar ......................................... 5.014 Oman ........................................ 5.015 Botswana .................................. 5.016 Switzerland ................................ 4.917 Denmark .................................... 4.918 Australia ..................................... 4.919 Mauritius .................................... 4.820 Germany .................................... 4.821 United Arab Emirates ................. 4.822 Turkey ........................................ 4.823 Gambia, The .............................. 4.824 Brunei Darussalam ..................... 4.725 Sri Lanka ................................... 4.726 Saudi Arabia .............................. 4.627 Cyprus ....................................... 4.628 France ....................................... 4.529 Malta ......................................... 4.430 Estonia ....................................... 4.431 South Africa ............................... 4.332 Ireland ........................................ 4.333 China ......................................... 4.334 Cape Verde ............................... 4.335 Liberia ........................................ 4.236 Seychelles .................................. 4.237 Austria ....................................... 4.238 Namibia ..................................... 4.139 Tajikistan .................................... 4.140 Ghana ........................................ 4.141 Benin ......................................... 4.142 Montenegro ............................... 4.143 Zambia ...................................... 4.044 Kazakhstan ................................ 4.045 Uganda ...................................... 4.046 Sierra Leone .............................. 4.047 Bahrain ...................................... 4.048 Cambodia .................................. 4.049 Vietnam ..................................... 3.950 Iran, Islamic Rep. ....................... 3.951 Hong Kong SAR ........................ 3.952 Chile .......................................... 3.953 India ........................................... 3.954 Japan ........................................ 3.955 Israel .......................................... 3.956 United States ............................. 3.857 Timor-Leste ............................... 3.858 Hungary ..................................... 3.859 Azerbaijan .................................. 3.860 Spain ......................................... 3.761 Kenya ........................................ 3.762 Gabon ....................................... 3.763 Belgium ..................................... 3.764 Morocco .................................... 3.665 Tanzania .................................... 3.666 Nigeria ....................................... 3.667 Iceland ....................................... 3.668 Macedonia, FYR ........................ 3.669 Georgia ...................................... 3.670 Ethiopia ...................................... 3.571 Jamaica ..................................... 3.572 Taiwan, China ............................ 3.5
RANK COUNTRY/ECONOMY VALUE 1 MEAN: 3.6 7
73 Trinidad and Tobago .................. 3.5 74 Portugal ..................................... 3.5 75 Guyana ...................................... 3.5 76 Malawi ....................................... 3.5 77 Indonesia ................................... 3.5 78 Mozambique .............................. 3.4 79 Armenia ..................................... 3.4 80 Mali ............................................ 3.4 81 Uruguay ..................................... 3.4 82 Poland ....................................... 3.3 83 Kuwait ....................................... 3.3 84 Jordan ....................................... 3.3 85 Libya .......................................... 3.3 86 Burkina Faso .............................. 3.3 87 Latvia ......................................... 3.3 88 Albania ....................................... 3.3 89 Mongolia .................................... 3.2 90 Croatia ....................................... 3.2 91 Bolivia ........................................ 3.2 92 Serbia ........................................ 3.2 93 Philippines ................................. 3.2 94 Honduras ................................... 3.1 95 Cameroon .................................. 3.1 96 Zimbabwe .................................. 3.1 97 Slovak Republic ......................... 3.1 98 Lithuania .................................... 3.1 99 Greece ....................................... 3.1 100 Bosnia and Herzegovina ............ 3.1 101 Bangladesh ................................ 3.1 102 Pakistan ..................................... 3.0 103 Moldova ..................................... 3.0 104 Mauritania .................................. 3.0 105 Thailand ..................................... 3.0 106 Czech Republic ......................... 3.0 107 Russian Federation .................... 3.0 108 Lesotho ..................................... 3.0 109 Slovenia ..................................... 3.0 110 Swaziland .................................. 2.9 111 Bulgaria ..................................... 2.9 112 Senegal ..................................... 2.8 113 Panama ..................................... 2.8 114 Côte d’Ivoire .............................. 2.8 115 Puerto Rico ................................ 2.8 116 Italy ............................................ 2.8 117 Colombia ................................... 2.8 118 Korea, Rep. ............................... 2.8 119 Suriname ................................... 2.7 120 Brazil .......................................... 2.7 121 Nicaragua .................................. 2.7 122 Egypt ......................................... 2.6 123 Yemen ....................................... 2.6 124 Dominican Republic ................... 2.6 125 Nepal ......................................... 2.6 126 Ecuador ..................................... 2.5 127 Romania .................................... 2.5 128 Mexico ....................................... 2.4 129 Madagascar ............................... 2.4 130 Algeria ....................................... 2.4 131 Kyrgyz Republic ......................... 2.3 132 Ukraine ...................................... 2.3 133 Burundi ...................................... 2.3 134 Lebanon .................................... 2.3 135 Guinea ....................................... 2.3 136 Chad .......................................... 2.3 137 El Salvador................................. 2.2 138 Paraguay ................................... 2.2 139 Costa Rica ................................. 2.2 140 Guatemala ................................. 2.2 141 Argentina ................................... 2.0 142 Peru ........................................... 2.0 143 Haiti ........................................... 1.9 144 Venezuela .................................. 1.7
1.01 Effectiveness of law-making bodiesHow effective is your national parliament/congress as a law-making institution? [1 = very ineffective; 7 = very effective—among the best in the world] | 2011–2012 weighted average
SOURCE: World Economic Forum, Executive Opinion Survey, 2011 and 2012 editions
@ 2013 World Economic Forum

The Global Information Technology Report 2013 | 295
4: Data Tables
RANK COUNTRY/ECONOMY VALUE 1 MEAN: 4.0 7
1 Luxembourg .............................. 6.0 2 Singapore .................................. 5.8 3 Estonia ....................................... 5.8 4 Finland ....................................... 5.7 5 United Kingdom ......................... 5.6 6 New Zealand ............................. 5.6 7 Qatar ......................................... 5.5 8 Sweden ..................................... 5.5 9 United Arab Emirates ................. 5.5 10 Netherlands ............................... 5.5 11 Hong Kong SAR ........................ 5.5 12 Denmark .................................... 5.4 13 Switzerland ................................ 5.4 14 Norway ...................................... 5.4 15 Korea, Rep. ............................... 5.4 16 Malta ......................................... 5.3 17 Australia ..................................... 5.3 18 Taiwan, China ............................ 5.2 19 Portugal ..................................... 5.2 20 United States ............................. 5.2 21 Austria ....................................... 5.2 22 Canada ...................................... 5.2 23 Malaysia ..................................... 5.2 24 France ....................................... 5.1 25 Saudi Arabia .............................. 5.0 26 Iceland ....................................... 5.0 27 Germany .................................... 5.0 28 Ireland ........................................ 5.0 29 South Africa ............................... 5.0 30 Israel .......................................... 5.0 31 Chile .......................................... 4.9 32 Bahrain ...................................... 4.9 33 Belgium ..................................... 4.9 34 Rwanda ..................................... 4.9 35 Slovenia ..................................... 4.8 36 Oman ........................................ 4.8 37 Panama ..................................... 4.8 38 Puerto Rico ................................ 4.8 39 Spain ......................................... 4.7 40 Lithuania .................................... 4.6 41 Czech Republic ......................... 4.6 42 Japan ........................................ 4.5 43 Mauritius .................................... 4.5 44 Cyprus ....................................... 4.4 45 Montenegro ............................... 4.4 46 Azerbaijan .................................. 4.4 47 Brazil .......................................... 4.4 48 Hungary ..................................... 4.4 49 Gambia, The .............................. 4.3 50 Armenia ..................................... 4.3 51 China ......................................... 4.3 52 India ........................................... 4.3 53 Jordan ....................................... 4.3 54 Latvia ......................................... 4.2 55 Mexico ....................................... 4.2 56 Barbados ................................... 4.2 57 Colombia ................................... 4.2 58 Indonesia ................................... 4.2 59 Turkey ........................................ 4.2 60 Kenya ........................................ 4.1 61 Brunei Darussalam ..................... 4.1 62 Macedonia, FYR ........................ 4.1 63 Slovak Republic ......................... 4.1 64 Seychelles .................................. 4.1 65 Costa Rica ................................. 4.1 66 Philippines ................................. 4.1 67 Sri Lanka ................................... 4.0 68 Dominican Republic ................... 4.0 69 Kazakhstan ................................ 4.0 70 Bulgaria ..................................... 4.0 71 Uruguay ..................................... 4.0 72 Liberia ........................................ 4.0
RANK COUNTRY/ECONOMY VALUE 1 MEAN: 4.0 7
73 Croatia ....................................... 3.9 74 Cape Verde ............................... 3.9 75 Guatemala ................................. 3.9 76 Zambia ...................................... 3.9 77 Italy ............................................ 3.9 78 Ecuador ..................................... 3.8 79 Georgia ...................................... 3.8 80 Thailand ..................................... 3.8 81 Albania ....................................... 3.7 82 Jamaica ..................................... 3.7 83 Senegal ..................................... 3.7 84 Peru ........................................... 3.7 85 Morocco .................................... 3.7 86 Tajikistan .................................... 3.7 87 Egypt ......................................... 3.7 88 Romania .................................... 3.7 89 Cambodia .................................. 3.7 90 Botswana .................................. 3.7 91 Poland ....................................... 3.7 92 Vietnam ..................................... 3.7 93 Nigeria ....................................... 3.7 94 Namibia ..................................... 3.6 95 Bosnia and Herzegovina ............ 3.6 96 Ghana ........................................ 3.6 97 Uganda ...................................... 3.6 98 Moldova ..................................... 3.5 99 Iran, Islamic Rep. ....................... 3.5 100 Serbia ........................................ 3.5 101 Ukraine ...................................... 3.5 102 Honduras ................................... 3.4 103 Greece ....................................... 3.4 104 Venezuela .................................. 3.4 105 Mongolia .................................... 3.4 106 Russian Federation .................... 3.3 107 Sierra Leone .............................. 3.2 108 Malawi ....................................... 3.2 109 Tanzania .................................... 3.2 110 Bolivia ........................................ 3.2 111 Burkina Faso .............................. 3.2 112 Trinidad and Tobago .................. 3.2 113 Pakistan ..................................... 3.2 114 Guyana ...................................... 3.2 115 Nicaragua .................................. 3.2 116 El Salvador................................. 3.2 117 Argentina ................................... 3.2 118 Bangladesh ................................ 3.1 119 Cameroon .................................. 3.1 120 Benin ......................................... 3.1 121 Ethiopia ...................................... 3.1 122 Zimbabwe .................................. 3.0 123 Paraguay ................................... 3.0 124 Mozambique .............................. 3.0 125 Mali ............................................ 2.9 126 Côte d’Ivoire .............................. 2.9 127 Timor-Leste ............................... 2.9 128 Kuwait ....................................... 2.9 129 Guinea ....................................... 2.8 130 Mauritania .................................. 2.8 131 Nepal ......................................... 2.7 132 Madagascar ............................... 2.7 133 Swaziland .................................. 2.6 134 Gabon ....................................... 2.6 135 Kyrgyz Republic ......................... 2.5 136 Libya .......................................... 2.5 137 Chad .......................................... 2.4 138 Lesotho ..................................... 2.4 139 Suriname ................................... 2.3 140 Algeria ....................................... 2.3 141 Yemen ....................................... 2.2 142 Lebanon .................................... 2.1 143 Haiti ........................................... 2.1 144 Burundi ...................................... 2.0
1.02 Laws relating to ICTsHow would you assess your country’s laws relating to the use of ICT (e.g., electronic commerce, digital signatures, consumer protection)? [1 = highly undeveloped; 7 = well-developed] | 2011–2012 weighted average
SOURCE: World Economic Forum, Executive Opinion Survey, 2011 and 2012 editions
@ 2013 World Economic Forum

296 | The Global Information Technology Report 2013
4: Data Tables
RANK COUNTRY/ECONOMY VALUE 1 MEAN: 3.9 7
1 New Zealand ............................. 6.72 Finland ....................................... 6.53 Netherlands ............................... 6.44 Ireland ........................................ 6.35 Canada ...................................... 6.36 Switzerland ................................ 6.37 Germany .................................... 6.28 Norway ...................................... 6.29 Sweden ..................................... 6.2
10 Qatar ......................................... 6.211 United Kingdom ......................... 6.212 Hong Kong SAR ........................ 6.013 Denmark .................................... 6.014 Australia ..................................... 6.015 Israel .......................................... 5.916 Luxembourg .............................. 5.817 Japan ........................................ 5.818 Iceland ....................................... 5.719 Barbados ................................... 5.720 Singapore .................................. 5.721 Estonia ....................................... 5.522 Botswana .................................. 5.523 United Arab Emirates ................. 5.424 Chile .......................................... 5.325 Rwanda ..................................... 5.326 Saudi Arabia .............................. 5.327 South Africa ............................... 5.328 Belgium ..................................... 5.229 Uruguay ..................................... 5.230 Austria ....................................... 5.231 Oman ........................................ 5.132 Bahrain ...................................... 5.133 Brunei Darussalam ..................... 5.134 Mauritius .................................... 5.135 Malta ......................................... 5.036 Kuwait ....................................... 4.937 France ....................................... 4.938 United States ............................. 4.939 Cyprus ....................................... 4.840 Costa Rica ................................. 4.741 Puerto Rico ................................ 4.642 Taiwan, China ............................ 4.643 Malaysia ..................................... 4.644 Namibia ..................................... 4.645 India ........................................... 4.546 Jamaica ..................................... 4.447 Trinidad and Tobago .................. 4.448 Jordan ....................................... 4.449 Gambia, The .............................. 4.350 Poland ....................................... 4.251 Cape Verde ............................... 4.252 Liberia ........................................ 4.253 Egypt ......................................... 4.154 Malawi ....................................... 4.155 Suriname ................................... 4.156 Sri Lanka ................................... 4.157 Pakistan ..................................... 4.158 Ghana ........................................ 4.159 Thailand ..................................... 4.060 Spain ......................................... 4.061 Latvia ......................................... 4.062 Seychelles .................................. 4.063 Iran, Islamic Rep. ....................... 4.064 Tajikistan .................................... 3.965 Montenegro ............................... 3.966 China ......................................... 3.967 Portugal ..................................... 3.968 Italy ............................................ 3.869 Honduras ................................... 3.870 Slovenia ..................................... 3.871 Brazil .......................................... 3.872 Hungary ..................................... 3.7
RANK COUNTRY/ECONOMY VALUE 1 MEAN: 3.9 7
73 Nigeria ....................................... 3.7 74 Korea, Rep. ............................... 3.7 75 Czech Republic ......................... 3.7 76 Indonesia ................................... 3.6 77 Tanzania .................................... 3.5 78 Bosnia and Herzegovina ............ 3.5 79 Zambia ...................................... 3.5 80 Uganda ...................................... 3.5 81 Morocco .................................... 3.5 82 Lithuania .................................... 3.5 83 Turkey ........................................ 3.5 84 Libya .......................................... 3.4 85 Kenya ........................................ 3.4 86 Azerbaijan .................................. 3.4 87 Vietnam ..................................... 3.4 88 Mexico ....................................... 3.4 89 Nepal ......................................... 3.3 90 Swaziland .................................. 3.3 91 Cambodia .................................. 3.3 92 Timor-Leste ............................... 3.2 93 Guyana ...................................... 3.2 94 Kazakhstan ................................ 3.2 95 Georgia ...................................... 3.2 96 Colombia ................................... 3.2 97 Bolivia ........................................ 3.1 98 Greece ....................................... 3.1 99 Philippines ................................. 3.0 100 Lesotho ..................................... 3.0 101 Benin ......................................... 2.9 102 Bulgaria ..................................... 2.9 103 Guatemala ................................. 2.9 104 Bangladesh ................................ 2.8 105 Macedonia, FYR ........................ 2.8 106 Croatia ....................................... 2.8 107 Sierra Leone .............................. 2.8 108 Mauritania .................................. 2.8 109 Ethiopia ...................................... 2.8 110 Armenia ..................................... 2.8 111 Mali ............................................ 2.8 112 Mongolia .................................... 2.8 113 Zimbabwe .................................. 2.7 114 Romania .................................... 2.7 115 Slovak Republic ......................... 2.7 116 El Salvador................................. 2.7 117 Gabon ....................................... 2.6 118 Senegal ..................................... 2.6 119 Guinea ....................................... 2.6 120 Dominican Republic ................... 2.6 121 Albania ....................................... 2.6 122 Russian Federation .................... 2.6 123 Algeria ....................................... 2.5 124 Ukraine ...................................... 2.5 125 Peru ........................................... 2.5 126 Burkina Faso .............................. 2.5 127 Cameroon .................................. 2.5 128 Ecuador ..................................... 2.5 129 Serbia ........................................ 2.4 130 Mozambique .............................. 2.4 131 Lebanon .................................... 2.4 132 Panama ..................................... 2.3 133 Argentina ................................... 2.3 134 Nicaragua .................................. 2.2 135 Madagascar ............................... 2.2 136 Chad .......................................... 2.2 137 Côte d’Ivoire .............................. 2.1 138 Moldova ..................................... 2.1 139 Yemen ....................................... 2.0 140 Kyrgyz Republic ......................... 1.9 141 Paraguay ................................... 1.9 142 Haiti ........................................... 1.8 143 Burundi ...................................... 1.7 144 Venezuela .................................. 1.3
1.03 Judicial independenceTo what extent is the judiciary in your country independent from influences of members of government, citizens or firms? [1 = heavily influenced; 7 = entirely independent] | 2011–2012 weighted average
SOURCE: World Economic Forum, Executive Opinion Survey, 2011 and 2012 editions
@ 2013 World Economic Forum

The Global Information Technology Report 2013 | 297
4: Data Tables
RANK COUNTRY/ECONOMY VALUE 1 MEAN: 3.8 7
1 Singapore .................................. 6.2 2 Finland ....................................... 6.0 3 New Zealand ............................. 5.9 4 Switzerland ................................ 5.7 5 Sweden ..................................... 5.6 6 Hong Kong SAR ........................ 5.6 7 Norway ...................................... 5.6 8 Netherlands ............................... 5.6 9 Canada ...................................... 5.4 10 Qatar ......................................... 5.4 11 United Kingdom ......................... 5.4 12 Luxembourg .............................. 5.2 13 Denmark .................................... 5.1 14 Malaysia ..................................... 5.1 15 Rwanda ..................................... 5.1 16 Botswana .................................. 5.0 17 South Africa ............................... 5.0 18 Australia ..................................... 5.0 19 Oman ........................................ 5.0 20 Germany .................................... 4.9 21 Gambia, The .............................. 4.9 22 United Arab Emirates ................. 4.8 23 Chile .......................................... 4.8 24 Puerto Rico ................................ 4.8 25 Austria ....................................... 4.8 26 Mauritius .................................... 4.7 27 Iceland ....................................... 4.7 28 Barbados ................................... 4.7 29 Ireland ........................................ 4.6 30 Bahrain ...................................... 4.6 31 Saudi Arabia .............................. 4.6 32 Cyprus ....................................... 4.6 33 Sri Lanka ................................... 4.5 34 Brunei Darussalam ..................... 4.5 35 United States ............................. 4.5 36 Japan ........................................ 4.5 37 France ....................................... 4.4 38 Namibia ..................................... 4.4 39 Zambia ...................................... 4.4 40 Taiwan, China ............................ 4.3 41 Estonia ....................................... 4.3 42 Liberia ........................................ 4.2 43 Jordan ....................................... 4.2 44 China ......................................... 4.2 45 Belgium ..................................... 4.2 46 Israel .......................................... 4.1 47 Panama ..................................... 4.1 48 Nigeria ....................................... 4.1 49 Uganda ...................................... 4.1 50 Ghana ........................................ 4.0 51 Montenegro ............................... 4.0 52 Malawi ....................................... 4.0 53 Tajikistan .................................... 4.0 54 Morocco .................................... 4.0 55 Seychelles .................................. 4.0 56 Cambodia .................................. 4.0 57 Kuwait ....................................... 4.0 58 Malta ......................................... 3.9 59 India ........................................... 3.8 60 Gabon ....................................... 3.8 61 Turkey ........................................ 3.8 62 Ethiopia ...................................... 3.8 63 Uruguay ..................................... 3.8 64 Sierra Leone .............................. 3.8 65 Thailand ..................................... 3.8 66 Indonesia ................................... 3.8 67 Kazakhstan ................................ 3.8 68 Tanzania .................................... 3.7 69 Spain ......................................... 3.7 70 Cape Verde ............................... 3.7 71 Senegal ..................................... 3.7 72 Kenya ........................................ 3.7
RANK COUNTRY/ECONOMY VALUE 1 MEAN: 3.8 7
73 Costa Rica ................................. 3.6 74 Vietnam ..................................... 3.6 75 Armenia ..................................... 3.6 76 Azerbaijan .................................. 3.6 77 Iran, Islamic Rep. ....................... 3.6 78 Burkina Faso .............................. 3.6 79 Jamaica ..................................... 3.6 80 Korea, Rep. ............................... 3.6 81 Swaziland .................................. 3.5 82 Zimbabwe .................................. 3.5 83 Trinidad and Tobago .................. 3.5 84 Brazil .......................................... 3.5 85 Mali ............................................ 3.5 86 Egypt ......................................... 3.4 87 Guyana ...................................... 3.4 88 Cameroon .................................. 3.4 89 Georgia ...................................... 3.4 90 Lithuania .................................... 3.3 91 Benin ......................................... 3.3 92 Mauritania .................................. 3.3 93 Mozambique .............................. 3.3 94 Mongolia .................................... 3.3 95 Dominican Republic ................... 3.3 96 Timor-Leste ............................... 3.3 97 Colombia ................................... 3.3 98 Albania ....................................... 3.3 99 Lesotho ..................................... 3.3 100 Mexico ....................................... 3.3 101 Bangladesh ................................ 3.3 102 Honduras ................................... 3.2 103 Libya .......................................... 3.2 104 Bolivia ........................................ 3.2 105 Bosnia and Herzegovina ............ 3.2 106 Latvia ......................................... 3.2 107 Philippines ................................. 3.2 108 Macedonia, FYR ........................ 3.2 109 Pakistan ..................................... 3.1 110 Guatemala ................................. 3.1 111 Poland ....................................... 3.1 112 Nicaragua .................................. 3.1 113 Nepal ......................................... 3.1 114 Lebanon .................................... 3.1 115 Czech Republic ......................... 3.0 116 Suriname ................................... 3.0 117 Hungary ..................................... 3.0 118 Peru ........................................... 3.0 119 Côte d’Ivoire .............................. 2.9 120 Moldova ..................................... 2.9 121 Portugal ..................................... 2.9 122 Bulgaria ..................................... 2.8 123 El Salvador................................. 2.8 124 Russian Federation .................... 2.8 125 Madagascar ............................... 2.7 126 Slovenia ..................................... 2.7 127 Paraguay ................................... 2.7 128 Guinea ....................................... 2.7 129 Argentina ................................... 2.7 130 Ecuador ..................................... 2.7 131 Chad .......................................... 2.7 132 Algeria ....................................... 2.6 133 Romania .................................... 2.6 134 Burundi ...................................... 2.6 135 Greece ....................................... 2.5 136 Kyrgyz Republic ......................... 2.5 137 Croatia ....................................... 2.5 138 Serbia ........................................ 2.5 139 Italy ............................................ 2.5 140 Slovak Republic ......................... 2.4 141 Ukraine ...................................... 2.4 142 Yemen ....................................... 2.1 143 Haiti ........................................... 2.1 144 Venezuela .................................. 1.9
1.04 Efficiency of legal framework in settling disputesHow efficient is the legal framework in your country for private businesses in settling disputes? [1 = extremely inefficient; 7 = highly efficient] | 2011–2012 weighted average
SOURCE: World Economic Forum, Executive Opinion Survey, 2011 and 2012 editions
@ 2013 World Economic Forum

298 | The Global Information Technology Report 2013
4: Data Tables
RANK COUNTRY/ECONOMY VALUE 1 MEAN: 3.7 7
1 Finland ....................................... 5.92 Switzerland ................................ 5.63 Netherlands ............................... 5.64 New Zealand ............................. 5.55 Sweden ..................................... 5.56 Singapore .................................. 5.57 Hong Kong SAR ........................ 5.48 Luxembourg .............................. 5.39 Norway ...................................... 5.3
10 Malaysia ..................................... 5.111 United Kingdom ......................... 5.112 Canada ...................................... 5.113 Germany .................................... 5.014 Qatar ......................................... 4.915 Botswana .................................. 4.916 South Africa ............................... 4.817 Rwanda ..................................... 4.818 Cyprus ....................................... 4.719 Australia ..................................... 4.720 Denmark .................................... 4.621 Chile .......................................... 4.622 Austria ....................................... 4.623 Puerto Rico ................................ 4.624 Saudi Arabia .............................. 4.625 United Arab Emirates ................. 4.526 Gambia, The .............................. 4.527 France ....................................... 4.528 Bahrain ...................................... 4.529 Iceland ....................................... 4.530 Mauritius .................................... 4.531 Ireland ........................................ 4.532 Barbados ................................... 4.533 Oman ........................................ 4.534 Sri Lanka ................................... 4.435 Seychelles .................................. 4.236 Taiwan, China ............................ 4.237 United States ............................. 4.238 Liberia ........................................ 4.239 Estonia ....................................... 4.240 Cambodia .................................. 4.241 Belgium ..................................... 4.242 Namibia ..................................... 4.143 Tajikistan .................................... 4.144 Jordan ....................................... 4.045 Lithuania .................................... 4.046 Uruguay ..................................... 4.047 Costa Rica ................................. 4.048 Japan ........................................ 4.049 Brunei Darussalam ..................... 4.050 Gabon ....................................... 4.051 Malawi ....................................... 3.952 India ........................................... 3.953 China ......................................... 3.954 Montenegro ............................... 3.955 Zambia ...................................... 3.956 Turkey ........................................ 3.957 Israel .......................................... 3.958 Azerbaijan .................................. 3.959 Uganda ...................................... 3.960 Morocco .................................... 3.861 Brazil .......................................... 3.862 Spain ......................................... 3.863 Indonesia ................................... 3.864 Cape Verde ............................... 3.765 Nigeria ....................................... 3.766 Benin ......................................... 3.767 Kuwait ....................................... 3.768 Malta ......................................... 3.769 Kenya ........................................ 3.670 Tanzania .................................... 3.671 Bangladesh ................................ 3.672 Mauritania .................................. 3.6
RANK COUNTRY/ECONOMY VALUE 1 MEAN: 3.7 7
73 Thailand ..................................... 3.6 74 Vietnam ..................................... 3.6 75 Ethiopia ...................................... 3.5 76 Kazakhstan ................................ 3.5 77 Honduras ................................... 3.5 78 Ghana ........................................ 3.5 79 Armenia ..................................... 3.5 80 Panama ..................................... 3.5 81 Burkina Faso .............................. 3.5 82 Mali ............................................ 3.5 83 Timor-Leste ............................... 3.4 84 Senegal ..................................... 3.4 85 Mexico ....................................... 3.4 86 Nepal ......................................... 3.4 87 Bosnia and Herzegovina ............ 3.3 88 Libya .......................................... 3.3 89 Colombia ................................... 3.3 90 Jamaica ..................................... 3.3 91 Cameroon .................................. 3.3 92 Latvia ......................................... 3.3 93 Albania ....................................... 3.3 94 Trinidad and Tobago .................. 3.3 95 Guyana ...................................... 3.2 96 Korea, Rep. ............................... 3.2 97 Pakistan ..................................... 3.2 98 Guatemala ................................. 3.2 99 Bolivia ........................................ 3.2 100 Egypt ......................................... 3.2 101 Portugal ..................................... 3.2 102 Philippines ................................. 3.2 103 Poland ....................................... 3.2 104 Iran, Islamic Rep. ....................... 3.1 105 Peru ........................................... 3.1 106 Georgia ...................................... 3.1 107 Macedonia, FYR ........................ 3.1 108 Swaziland .................................. 3.0 109 Mozambique .............................. 3.0 110 Sierra Leone .............................. 3.0 111 Lesotho ..................................... 3.0 112 Moldova ..................................... 3.0 113 Mongolia .................................... 3.0 114 Bulgaria ..................................... 2.9 115 Suriname ................................... 2.9 116 Slovenia ..................................... 2.9 117 El Salvador................................. 2.9 118 Czech Republic ......................... 2.9 119 Dominican Republic ................... 2.9 120 Côte d’Ivoire .............................. 2.8 121 Chad .......................................... 2.8 122 Guinea ....................................... 2.8 123 Madagascar ............................... 2.8 124 Paraguay ................................... 2.7 125 Nicaragua .................................. 2.7 126 Lebanon .................................... 2.7 127 Russian Federation .................... 2.7 128 Romania .................................... 2.7 129 Croatia ....................................... 2.7 130 Yemen ....................................... 2.6 131 Italy ............................................ 2.6 132 Greece ....................................... 2.6 133 Serbia ........................................ 2.6 134 Zimbabwe .................................. 2.6 135 Hungary ..................................... 2.5 136 Kyrgyz Republic ......................... 2.5 137 Algeria ....................................... 2.5 138 Ecuador ..................................... 2.5 139 Ukraine ...................................... 2.4 140 Slovak Republic ......................... 2.4 141 Burundi ...................................... 2.4 142 Argentina ................................... 2.1 143 Haiti ........................................... 2.1 144 Venezuela .................................. 1.7
1.05 Efficiency of legal framework in challenging regulationsHow efficient is the legal framework in your country for private businesses in challenging the legality of government actions and/or regulations? [1 = extremely inefficient; 7 = highly efficient] | 2011–2012 weighted average
SOURCE: World Economic Forum, Executive Opinion Survey, 2011 and 2012 editions
@ 2013 World Economic Forum

The Global Information Technology Report 2013 | 299
4: Data Tables
RANK COUNTRY/ECONOMY VALUE 1 MEAN: 3.8 7
1 Finland ....................................... 6.3 2 Singapore .................................. 6.1 3 New Zealand ............................. 6.1 4 Switzerland ................................ 6.0 5 Netherlands ............................... 5.9 6 United Kingdom ......................... 5.9 7 Luxembourg .............................. 5.9 8 Qatar ......................................... 5.8 9 France ....................................... 5.6 10 Germany .................................... 5.6 11 Hong Kong SAR ........................ 5.6 12 Sweden ..................................... 5.6 13 Puerto Rico ................................ 5.6 14 Norway ...................................... 5.5 15 Ireland ........................................ 5.5 16 Austria ....................................... 5.5 17 Canada ...................................... 5.4 18 Japan ........................................ 5.4 19 Australia ..................................... 5.3 20 South Africa ............................... 5.3 21 Denmark .................................... 5.3 22 Taiwan, China ............................ 5.2 23 United Arab Emirates ................. 5.2 24 Belgium ..................................... 5.2 25 Oman ........................................ 5.2 26 Iceland ....................................... 5.2 27 Saudi Arabia .............................. 5.1 28 Bahrain ...................................... 5.1 29 United States ............................. 5.0 30 Barbados ................................... 4.9 31 Malaysia ..................................... 4.9 32 Rwanda ..................................... 4.8 33 Israel .......................................... 4.8 34 Estonia ....................................... 4.7 35 Malta ......................................... 4.7 36 Gambia, The .............................. 4.7 37 Liberia ........................................ 4.6 38 Panama ..................................... 4.6 39 Jordan ....................................... 4.5 40 Korea, Rep. ............................... 4.3 41 Slovenia ..................................... 4.3 42 Portugal ..................................... 4.3 43 Namibia ..................................... 4.3 44 Cyprus ....................................... 4.2 45 Botswana .................................. 4.1 46 Kuwait ....................................... 4.0 47 Brunei Darussalam ..................... 4.0 48 Hungary ..................................... 4.0 49 Uruguay ..................................... 4.0 50 Spain ......................................... 4.0 51 China ......................................... 3.9 52 Seychelles .................................. 3.9 53 Azerbaijan .................................. 3.9 54 Mauritius .................................... 3.8 55 Sri Lanka ................................... 3.8 56 Czech Republic ......................... 3.8 57 Latvia ......................................... 3.8 58 Slovak Republic ......................... 3.8 59 Zambia ...................................... 3.8 60 Indonesia ................................... 3.7 61 Chile .......................................... 3.7 62 Italy ............................................ 3.7 63 India ........................................... 3.7 64 Greece ....................................... 3.7 65 Ethiopia ...................................... 3.7 66 Lithuania .................................... 3.7 67 Poland ....................................... 3.6 68 Costa Rica ................................. 3.6 69 Swaziland .................................. 3.6 70 Montenegro ............................... 3.6 71 Burkina Faso .............................. 3.6 72 Malawi ....................................... 3.6
RANK COUNTRY/ECONOMY VALUE 1 MEAN: 3.8 7
73 Macedonia, FYR ........................ 3.5 74 Tajikistan .................................... 3.5 75 Brazil .......................................... 3.5 76 Croatia ....................................... 3.5 77 Mexico ....................................... 3.5 78 Guyana ...................................... 3.4 79 Jamaica ..................................... 3.4 80 Armenia ..................................... 3.4 81 Trinidad and Tobago .................. 3.4 82 Morocco .................................... 3.4 83 Egypt ......................................... 3.3 84 Uganda ...................................... 3.3 85 Cambodia .................................. 3.3 86 Turkey ........................................ 3.3 87 Philippines ................................. 3.2 88 Bolivia ........................................ 3.2 89 Colombia ................................... 3.2 90 Honduras ................................... 3.2 91 Benin ......................................... 3.2 92 Kazakhstan ................................ 3.2 93 Ghana ........................................ 3.1 94 Zimbabwe .................................. 3.1 95 Senegal ..................................... 3.1 96 Kenya ........................................ 3.1 97 Tanzania .................................... 3.1 98 Nicaragua .................................. 3.1 99 Gabon ....................................... 3.1 100 Cameroon .................................. 3.1 101 Thailand ..................................... 3.1 102 Sierra Leone .............................. 3.1 103 Albania ....................................... 3.0 104 Lesotho ..................................... 3.0 105 Bulgaria ..................................... 3.0 106 Pakistan ..................................... 3.0 107 Mauritania .................................. 2.9 108 Timor-Leste ............................... 2.9 109 Mali ............................................ 2.9 110 Nigeria ....................................... 2.9 111 Libya .......................................... 2.9 112 Iran, Islamic Rep. ....................... 2.9 113 Cape Verde ............................... 2.9 114 Romania .................................... 2.9 115 Ecuador ..................................... 2.8 116 Serbia ........................................ 2.8 117 Moldova ..................................... 2.8 118 Nepal ......................................... 2.8 119 Dominican Republic ................... 2.7 120 Ukraine ...................................... 2.7 121 Guatemala ................................. 2.6 122 Côte d’Ivoire .............................. 2.6 123 Vietnam ..................................... 2.6 124 Lebanon .................................... 2.6 125 Russian Federation .................... 2.6 126 Georgia ...................................... 2.6 127 Peru ........................................... 2.6 128 Mozambique .............................. 2.6 129 Suriname ................................... 2.5 130 Bosnia and Herzegovina ............ 2.5 131 Bangladesh ................................ 2.4 132 Mongolia .................................... 2.4 133 El Salvador................................. 2.4 134 Argentina ................................... 2.4 135 Madagascar ............................... 2.4 136 Paraguay ................................... 2.2 137 Guinea ....................................... 2.2 138 Chad .......................................... 2.1 139 Yemen ....................................... 2.0 140 Kyrgyz Republic ......................... 2.0 141 Burundi ...................................... 1.9 142 Algeria ....................................... 1.8 143 Venezuela .................................. 1.7 144 Haiti ........................................... 1.6
1.06 Intellectual property protectionHow would you rate intellectual property protection, including anti-counterfeiting measures, in your country? [1 = very weak; 7 = very strong] | 2011–2012 weighted average
SOURCE: World Economic Forum, Executive Opinion Survey, 2011 and 2012 editions
@ 2013 World Economic Forum

300 | The Global Information Technology Report 2013
4: Data Tables
RANK COUNTRY/ECONOMY VALUE
1 United States ..................................192 Luxembourg ...................................203 Japan .............................................214 New Zealand ..................................225 Australia ..........................................235 Austria ............................................237 Belgium ..........................................247 Denmark .........................................247 Sweden ..........................................24
10 Finland ............................................2510 Switzerland .....................................2512 Germany .........................................2612 United Kingdom ..............................2614 Canada ...........................................2714 Netherlands ....................................2714 Norway ...........................................2717 Israel ...............................................3118 Singapore .......................................3319 Ireland .............................................3420 Czech Republic ..............................3520 South Africa ....................................3522 France ............................................3722 Taiwan, China .................................3722 United Arab Emirates ......................3725 Korea, Rep. ....................................4025 Portugal ..........................................4025 Slovak Republic ..............................4028 Hungary ..........................................4129 Puerto Rico .....................................4230 Hong Kong SAR .............................4330 Malta ..............................................4332 Spain ..............................................4433 Slovenia ..........................................4634 Cyprus ............................................4834 Estonia ............................................4834 Iceland ............................................4834 Italy .................................................4838 Qatar ..............................................5039 Saudi Arabia ...................................5140 Brazil ...............................................5340 Colombia ........................................5340 Croatia ............................................5340 Poland ............................................5344 Bahrain ...........................................5444 Latvia ..............................................5444 Lithuania .........................................5447 Malaysia ..........................................5548 Mauritius .........................................5748 Mexico ............................................5750 Costa Rica ......................................5850 Jordan ............................................5852 Kuwait ............................................5953 Chile ...............................................6153 Egypt ..............................................6153 Greece ............................................6153 Oman .............................................6157 Turkey .............................................6258 India ................................................6358 Romania .........................................6358 Russian Federation .........................6361 Bulgaria ..........................................6462 Bosnia and Herzegovina .................6662 Macedonia, FYR .............................6662 Morocco .........................................6665 Brunei Darussalam ..........................6765 Peru ................................................6767 Ecuador ..........................................6867 Uruguay ..........................................6869 Argentina ........................................6970 Philippines ......................................7071 Lebanon .........................................7172 Panama ..........................................72
RANK COUNTRY/ECONOMY VALUE
72 Serbia .............................................72 72 Thailand ..........................................72 75 Honduras ........................................73 76 Albania ............................................75 77 Dominican Republic ........................76 77 Kazakhstan .....................................76 79 China ..............................................77 80 Kenya .............................................78 80 Senegal ..........................................78 82 Bolivia .............................................79 82 Guatemala ......................................79 82 Montenegro ....................................79 82 Nicaragua .......................................79 86 Botswana .......................................80 86 El Salvador......................................80 88 Côte d’Ivoire ...................................81 88 Vietnam ..........................................81 90 Nigeria ............................................82 90 Zambia ...........................................82 92 Cameroon .......................................83 92 Paraguay ........................................83 94 Algeria ............................................84 94 Sri Lanka ........................................84 94 Ukraine ...........................................84 97 Indonesia ........................................86 97 Pakistan ..........................................86 99 Azerbaijan .......................................87 100 Armenia ..........................................88 100 Venezuela .......................................88 102 Yemen ............................................89 103 Bangladesh .....................................90 103 Libya ...............................................90 103 Moldova ..........................................90 106 Georgia ...........................................91 107 Zimbabwe .......................................92 n/a Barbados .......................................n/a n/a Benin .............................................n/a n/a Burkina Faso ..................................n/a n/a Burundi ..........................................n/a n/a Cambodia ......................................n/a n/a Cape Verde ...................................n/a n/a Chad ..............................................n/a n/a Ethiopia ..........................................n/a n/a Gabon ...........................................n/a n/a Gambia, The ..................................n/a n/a Ghana ............................................n/a n/a Guinea ...........................................n/a n/a Guyana ..........................................n/a n/a Haiti ...............................................n/a n/a Iran, Islamic Rep. ...........................n/a n/a Jamaica .........................................n/a n/a Kyrgyz Republic .............................n/a n/a Lesotho .........................................n/a n/a Liberia ............................................n/a n/a Madagascar ...................................n/a n/a Malawi ...........................................n/a n/a Mali ................................................n/a n/a Mauritania ......................................n/a n/a Mongolia ........................................n/a n/a Mozambique ..................................n/a n/a Namibia .........................................n/a n/a Nepal .............................................n/a n/a Rwanda .........................................n/a n/a Seychelles ......................................n/a n/a Sierra Leone ..................................n/a n/a Suriname .......................................n/a n/a Swaziland ......................................n/a n/a Tajikistan ........................................n/a n/a Tanzania ........................................n/a n/a Timor-Leste ...................................n/a n/a Trinidad and Tobago ......................n/a n/a Uganda ..........................................n/a
1.07 Software piracy rateUnlicensed software units as a percentage of total software units installed | 2011
SOURCE: Business Software Alliance, Shadow Market: 2011 BSA Global Software Piracy Study (Ninth edition)
@ 2013 World Economic Forum

The Global Information Technology Report 2013 | 301
4: Data Tables
RANK COUNTRY/ECONOMY VALUE
1 Ireland .............................................21 1 Singapore .......................................21 3 Rwanda ..........................................23 4 Austria ............................................25 5 Belgium ..........................................26 5 Luxembourg ...................................26 5 Netherlands ....................................26 8 Czech Republic ..............................27 8 Hong Kong SAR .............................27 8 Iceland ............................................27 8 Latvia ..............................................27 12 Australia ..........................................28 12 Botswana .......................................28 12 United Kingdom ..............................28 15 France ............................................29 15 Malaysia ..........................................29 15 South Africa ....................................29 18 Germany .........................................30 18 Japan .............................................30 18 Lithuania .........................................30 18 Mozambique ...................................30 18 New Zealand ..................................30 18 Sweden ..........................................30 18 Ukraine ...........................................30 18 Venezuela .......................................30 26 Guatemala ......................................31 26 Moldova ..........................................31 28 Mongolia .........................................32 28 Panama ..........................................32 28 Portugal ..........................................32 28 Romania .........................................32 28 Slovak Republic ..............................32 28 Slovenia ..........................................32 28 Switzerland .....................................32 28 United States ..................................32 36 Côte d’Ivoire ...................................33 36 Finland ............................................33 36 Gambia, The ...................................33 36 Georgia ...........................................33 36 Korea, Rep. ....................................33 36 Namibia ..........................................33 36 Poland ............................................33 43 Colombia ........................................34 43 Dominican Republic ........................34 43 El Salvador......................................34 43 Norway ...........................................34 43 Vietnam ..........................................34 48 Denmark .........................................35 48 Estonia ............................................35 48 Haiti ................................................35 48 Hungary ..........................................35 48 Israel ...............................................35 48 Jamaica ..........................................35 48 Tajikistan .........................................35 48 Zambia ...........................................35 56 Argentina ........................................36 56 Canada ...........................................36 56 Chile ...............................................36 56 Ghana .............................................36 56 Guyana ...........................................36 56 Mali .................................................36 56 Mauritius .........................................36 56 Russian Federation .........................36 56 Serbia .............................................36 56 Thailand ..........................................36 56 Turkey .............................................36 56 Yemen ............................................36 68 Bosnia and Herzegovina .................37 68 Burkina Faso ...................................37 68 Cape Verde ....................................37 68 China ..............................................37 68 Kazakhstan .....................................37
RANK COUNTRY/ECONOMY VALUE
68 Lebanon .........................................37 68 Macedonia, FYR .............................37 68 Nicaragua .......................................37 68 Philippines ......................................37 68 Seychelles .......................................37 78 Barbados ........................................38 78 Croatia ............................................38 78 Ethiopia ...........................................38 78 Gabon ............................................38 78 Jordan ............................................38 78 Kyrgyz Republic ..............................38 78 Madagascar ....................................38 78 Mexico ............................................38 78 Paraguay ........................................38 78 Tanzania .........................................38 78 Uganda ...........................................38 78 Zimbabwe .......................................38 90 Albania ............................................39 90 Azerbaijan .......................................39 90 Bulgaria ..........................................39 90 Ecuador ..........................................39 90 Greece ............................................39 90 Iran, Islamic Rep. ............................39 90 Nepal ..............................................39 90 Puerto Rico .....................................39 90 Sierra Leone ...................................39 99 Bolivia .............................................40 99 Costa Rica ......................................40 99 Indonesia ........................................40 99 Liberia .............................................40 99 Malta ..............................................40 99 Morocco .........................................40 99 Nigeria ............................................40 99 Saudi Arabia ...................................40 99 Spain ..............................................40 99 Sri Lanka ........................................40 99 Swaziland .......................................40 110 Bangladesh .....................................41 110 Chad ...............................................41 110 Italy .................................................41 110 Lesotho ..........................................41 110 Peru ................................................41 110 Uruguay ..........................................41 116 Benin ..............................................42 116 Cameroon .......................................42 116 Egypt ..............................................42 116 Malawi ............................................42 116 Trinidad and Tobago .......................42 121 Cyprus ............................................43 121 Qatar ..............................................43 121 Senegal ..........................................43 124 Brazil ...............................................44 124 Burundi ...........................................44 124 Cambodia .......................................44 124 Kenya .............................................44 124 Suriname ........................................44 129 Algeria ............................................45 129 Taiwan, China .................................45 131 India ................................................46 131 Mauritania .......................................46 131 Pakistan ..........................................46 134 Brunei Darussalam ..........................47 134 Honduras ........................................47 136 Bahrain ...........................................48 137 Armenia ..........................................49 137 Guinea ............................................49 137 Montenegro ....................................49 137 United Arab Emirates ......................49 141 Kuwait ............................................50 142 Oman .............................................51 142 Timor-Leste ....................................51 n/a Libya ..............................................n/a
1.08 Number of procedures to enforce a contractNumber of procedures to resolve a dispute, counted from the moment the plaintiff files a lawsuit in court until payment | 2012
SOURCE: World Bank/International Finance Corporation, Doing Business 2013: Smarter Regulations for Small and Medium-Size Enterprises
@ 2013 World Economic Forum
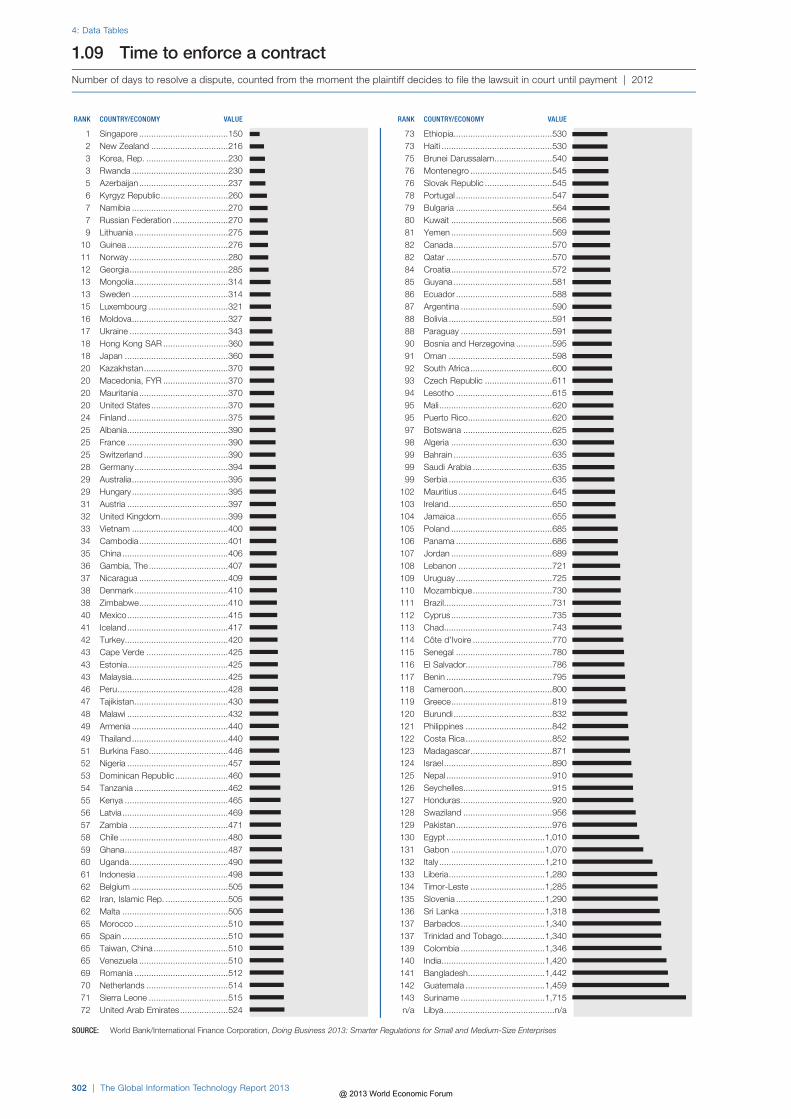
302 | The Global Information Technology Report 2013
4: Data Tables
RANK COUNTRY/ECONOMY VALUE
1 Singapore .....................................1502 New Zealand ................................2163 Korea, Rep. ..................................2303 Rwanda ........................................2305 Azerbaijan .....................................2376 Kyrgyz Republic ............................2607 Namibia ........................................2707 Russian Federation .......................2709 Lithuania .......................................275
10 Guinea ..........................................27611 Norway .........................................28012 Georgia .........................................28513 Mongolia .......................................31413 Sweden ........................................31415 Luxembourg .................................32116 Moldova ........................................32717 Ukraine .........................................34318 Hong Kong SAR ...........................36018 Japan ...........................................36020 Kazakhstan ...................................37020 Macedonia, FYR ...........................37020 Mauritania .....................................37020 United States ................................37024 Finland ..........................................37525 Albania ..........................................39025 France ..........................................39025 Switzerland ...................................39028 Germany .......................................39429 Australia ........................................39529 Hungary ........................................39531 Austria ..........................................39732 United Kingdom ............................39933 Vietnam ........................................40034 Cambodia .....................................40135 China ............................................40636 Gambia, The .................................40737 Nicaragua .....................................40938 Denmark .......................................41038 Zimbabwe .....................................41040 Mexico ..........................................41541 Iceland ..........................................41742 Turkey ...........................................42043 Cape Verde ..................................42543 Estonia ..........................................42543 Malaysia ........................................42546 Peru ..............................................42847 Tajikistan .......................................43048 Malawi ..........................................43249 Armenia ........................................44049 Thailand ........................................44051 Burkina Faso .................................44652 Nigeria ..........................................45753 Dominican Republic ......................46054 Tanzania .......................................46255 Kenya ...........................................46556 Latvia ............................................46957 Zambia .........................................47158 Chile .............................................48059 Ghana ...........................................48760 Uganda .........................................49061 Indonesia ......................................49862 Belgium ........................................50562 Iran, Islamic Rep. ..........................50562 Malta ............................................50565 Morocco .......................................51065 Spain ............................................51065 Taiwan, China ...............................51065 Venezuela .....................................51069 Romania .......................................51270 Netherlands ..................................51471 Sierra Leone .................................51572 United Arab Emirates ....................524
RANK COUNTRY/ECONOMY VALUE
73 Ethiopia .........................................530 73 Haiti ..............................................530 75 Brunei Darussalam ........................540 76 Montenegro ..................................545 76 Slovak Republic ............................545 78 Portugal ........................................547 79 Bulgaria ........................................564 80 Kuwait ..........................................566 81 Yemen ..........................................569 82 Canada .........................................570 82 Qatar ............................................570 84 Croatia ..........................................572 85 Guyana .........................................581 86 Ecuador ........................................588 87 Argentina ......................................590 88 Bolivia ...........................................591 88 Paraguay ......................................591 90 Bosnia and Herzegovina ...............595 91 Oman ...........................................598 92 South Africa ..................................600 93 Czech Republic ............................611 94 Lesotho ........................................615 95 Mali ...............................................620 95 Puerto Rico ...................................620 97 Botswana .....................................625 98 Algeria ..........................................630 99 Bahrain .........................................635 99 Saudi Arabia .................................635 99 Serbia ...........................................635 102 Mauritius .......................................645 103 Ireland ...........................................650 104 Jamaica ........................................655 105 Poland ..........................................685 106 Panama ........................................686 107 Jordan ..........................................689 108 Lebanon .......................................721 109 Uruguay ........................................725 110 Mozambique .................................730 111 Brazil .............................................731 112 Cyprus ..........................................735 113 Chad .............................................743 114 Côte d’Ivoire .................................770 115 Senegal ........................................780 116 El Salvador....................................786 117 Benin ............................................795 118 Cameroon .....................................800 119 Greece ..........................................819 120 Burundi .........................................832 121 Philippines ....................................842 122 Costa Rica ....................................852 123 Madagascar ..................................871 124 Israel .............................................890 125 Nepal ............................................910 126 Seychelles .....................................915 127 Honduras ......................................920 128 Swaziland .....................................956 129 Pakistan ........................................976 130 Egypt .........................................1,010 131 Gabon .......................................1,070 132 Italy ............................................1,210 133 Liberia ........................................1,280 134 Timor-Leste ...............................1,285 135 Slovenia .....................................1,290 136 Sri Lanka ...................................1,318 137 Barbados ...................................1,340 137 Trinidad and Tobago ..................1,340 139 Colombia ...................................1,346 140 India ...........................................1,420 141 Bangladesh ................................1,442 142 Guatemala .................................1,459 143 Suriname ...................................1,715 n/a Libya ..............................................n/a
1.09 Time to enforce a contractNumber of days to resolve a dispute, counted from the moment the plaintiff decides to file the lawsuit in court until payment | 2012
SOURCE: World Bank/International Finance Corporation, Doing Business 2013: Smarter Regulations for Small and Medium-Size Enterprises
@ 2013 World Economic Forum

Data Tables
2nd pillar Business and innovation environment
@ 2013 World Economic Forum

304 | The Global Information Technology Report 2013
4: Data Tables
RANK COUNTRY/ECONOMY VALUE 1 MEAN: 5.0 7
1 Sweden ..................................... 6.7 2 Switzerland ................................ 6.6 3 Finland ....................................... 6.6 4 Netherlands ............................... 6.5 5 Norway ...................................... 6.5 6 United Kingdom ......................... 6.5 7 Iceland ....................................... 6.5 8 Hong Kong SAR ........................ 6.5 9 Belgium ..................................... 6.5 10 Luxembourg .............................. 6.4 11 Japan ........................................ 6.3 12 Singapore .................................. 6.3 13 Austria ....................................... 6.3 14 United States ............................. 6.3 15 Portugal ..................................... 6.3 16 France ....................................... 6.3 17 Germany .................................... 6.3 18 Canada ...................................... 6.3 19 Australia ..................................... 6.2 20 Denmark .................................... 6.2 21 Malta ......................................... 6.2 22 Israel .......................................... 6.2 23 United Arab Emirates ................. 6.2 24 Bahrain ...................................... 6.2 25 Qatar ......................................... 6.1 26 Korea, Rep. ............................... 6.1 27 New Zealand ............................. 6.1 28 Barbados ................................... 6.0 29 Ireland ........................................ 6.0 30 Panama ..................................... 6.0 31 Puerto Rico ................................ 6.0 32 Chile .......................................... 5.9 33 Spain ......................................... 5.9 34 Saudi Arabia .............................. 5.9 35 Malaysia ..................................... 5.8 36 Estonia ....................................... 5.8 37 Lithuania .................................... 5.7 38 Jordan ....................................... 5.7 39 South Africa ............................... 5.7 40 Taiwan, China ............................ 5.6 41 Slovenia ..................................... 5.6 42 Cyprus ....................................... 5.5 43 Czech Republic ......................... 5.5 44 Jamaica ..................................... 5.5 45 Turkey ........................................ 5.4 46 Oman ........................................ 5.4 47 India ........................................... 5.3 48 Mauritius .................................... 5.3 49 Senegal ..................................... 5.3 50 Brazil .......................................... 5.3 51 Guatemala ................................. 5.3 52 Mexico ....................................... 5.3 53 Morocco .................................... 5.3 54 Croatia ....................................... 5.2 55 Hungary ..................................... 5.2 56 Philippines ................................. 5.2 57 Costa Rica ................................. 5.2 58 Greece ....................................... 5.2 59 Slovak Republic ......................... 5.2 60 Dominican Republic ................... 5.2 61 Namibia ..................................... 5.2 62 Sri Lanka ................................... 5.1 63 Trinidad and Tobago .................. 5.1 64 Latvia ......................................... 5.1 65 Brunei Darussalam ..................... 5.0 66 Kuwait ....................................... 5.0 67 Seychelles .................................. 5.0 68 Cape Verde ............................... 5.0 69 Italy ............................................ 5.0 70 Guyana ...................................... 5.0 71 Gambia, The .............................. 4.9 72 Indonesia ................................... 4.9
RANK COUNTRY/ECONOMY VALUE 1 MEAN: 5.0 7
73 Thailand ..................................... 4.9 74 Kenya ........................................ 4.9 75 Peru ........................................... 4.9 76 Lebanon .................................... 4.9 77 Côte d’Ivoire .............................. 4.8 78 Honduras ................................... 4.8 79 Cambodia .................................. 4.8 80 Ukraine ...................................... 4.8 81 Azerbaijan .................................. 4.8 82 Uruguay ..................................... 4.8 83 Pakistan ..................................... 4.7 84 Tajikistan .................................... 4.7 85 Nigeria ....................................... 4.7 86 Ghana ........................................ 4.7 87 Rwanda ..................................... 4.7 88 El Salvador................................. 4.7 89 Bosnia and Herzegovina ............ 4.6 90 Kazakhstan ................................ 4.6 91 Colombia ................................... 4.6 92 Zambia ...................................... 4.6 93 Botswana .................................. 4.6 94 Georgia ...................................... 4.6 95 Poland ....................................... 4.6 96 Macedonia, FYR ........................ 4.6 97 Montenegro ............................... 4.6 98 Bulgaria ..................................... 4.5 99 Mali ............................................ 4.5 100 Paraguay ................................... 4.5 101 Armenia ..................................... 4.5 102 Ecuador ..................................... 4.5 103 Venezuela .................................. 4.5 104 Uganda ...................................... 4.5 105 Bangladesh ................................ 4.4 106 Albania ....................................... 4.4 107 China ......................................... 4.4 108 Mongolia .................................... 4.3 109 Argentina ................................... 4.3 110 Suriname ................................... 4.3 111 Mozambique .............................. 4.3 112 Nepal ......................................... 4.3 113 Benin ......................................... 4.2 114 Iran, Islamic Rep. ....................... 4.2 115 Egypt ......................................... 4.2 116 Mauritania .................................. 4.2 117 Romania .................................... 4.2 118 Moldova ..................................... 4.1 119 Zimbabwe .................................. 4.1 120 Malawi ....................................... 4.1 121 Gabon ....................................... 4.1 122 Tanzania .................................... 4.1 123 Cameroon .................................. 4.0 124 Liberia ........................................ 4.0 125 Libya .......................................... 3.9 126 Lesotho ..................................... 3.9 127 Serbia ........................................ 3.9 128 Madagascar ............................... 3.9 129 Russian Federation .................... 3.9 130 Haiti ........................................... 3.8 131 Swaziland .................................. 3.8 132 Ethiopia ...................................... 3.8 133 Nicaragua .................................. 3.8 134 Bolivia ........................................ 3.6 135 Guinea ....................................... 3.6 136 Kyrgyz Republic ......................... 3.6 137 Vietnam ..................................... 3.6 138 Burkina Faso .............................. 3.6 139 Timor-Leste ............................... 3.5 140 Sierra Leone .............................. 3.5 141 Yemen ....................................... 3.5 142 Algeria ....................................... 3.4 143 Chad .......................................... 3.3 144 Burundi ...................................... 3.2
2.01 Availability of latest technologiesTo what extent are the latest technologies available in your country? [1 = not available; 7 = widely available] | 2011–2012 weighted average
SOURCE: World Economic Forum, Executive Opinion Survey, 2011 and 2012 editions
@ 2013 World Economic Forum
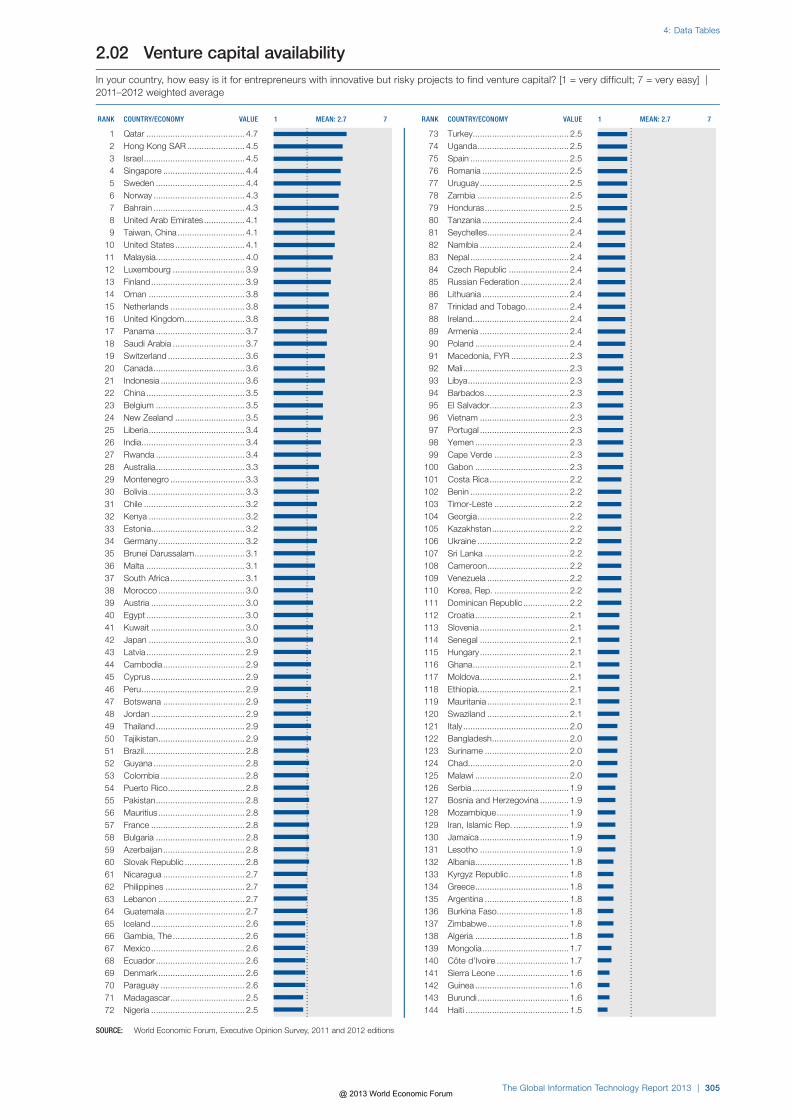
The Global Information Technology Report 2013 | 305
4: Data Tables
RANK COUNTRY/ECONOMY VALUE 1 MEAN: 2.7 7
1 Qatar ......................................... 4.72 Hong Kong SAR ........................ 4.53 Israel .......................................... 4.54 Singapore .................................. 4.45 Sweden ..................................... 4.46 Norway ...................................... 4.37 Bahrain ...................................... 4.38 United Arab Emirates ................. 4.19 Taiwan, China ............................ 4.1
10 United States ............................. 4.111 Malaysia ..................................... 4.012 Luxembourg .............................. 3.913 Finland ....................................... 3.914 Oman ........................................ 3.815 Netherlands ............................... 3.816 United Kingdom ......................... 3.817 Panama ..................................... 3.718 Saudi Arabia .............................. 3.719 Switzerland ................................ 3.620 Canada ...................................... 3.621 Indonesia ................................... 3.622 China ......................................... 3.523 Belgium ..................................... 3.524 New Zealand ............................. 3.525 Liberia ........................................ 3.426 India ........................................... 3.427 Rwanda ..................................... 3.428 Australia ..................................... 3.329 Montenegro ............................... 3.330 Bolivia ........................................ 3.331 Chile .......................................... 3.232 Kenya ........................................ 3.233 Estonia ....................................... 3.234 Germany .................................... 3.235 Brunei Darussalam ..................... 3.136 Malta ......................................... 3.137 South Africa ............................... 3.138 Morocco .................................... 3.039 Austria ....................................... 3.040 Egypt ......................................... 3.041 Kuwait ....................................... 3.042 Japan ........................................ 3.043 Latvia ......................................... 2.944 Cambodia .................................. 2.945 Cyprus ....................................... 2.946 Peru ........................................... 2.947 Botswana .................................. 2.948 Jordan ....................................... 2.949 Thailand ..................................... 2.950 Tajikistan .................................... 2.951 Brazil .......................................... 2.852 Guyana ...................................... 2.853 Colombia ................................... 2.854 Puerto Rico ................................ 2.855 Pakistan ..................................... 2.856 Mauritius .................................... 2.857 France ....................................... 2.858 Bulgaria ..................................... 2.859 Azerbaijan .................................. 2.860 Slovak Republic ......................... 2.861 Nicaragua .................................. 2.762 Philippines ................................. 2.763 Lebanon .................................... 2.764 Guatemala ................................. 2.765 Iceland ....................................... 2.666 Gambia, The .............................. 2.667 Mexico ....................................... 2.668 Ecuador ..................................... 2.669 Denmark .................................... 2.670 Paraguay ................................... 2.671 Madagascar ............................... 2.572 Nigeria ....................................... 2.5
RANK COUNTRY/ECONOMY VALUE 1 MEAN: 2.7 7
73 Turkey ........................................ 2.5 74 Uganda ...................................... 2.5 75 Spain ......................................... 2.5 76 Romania .................................... 2.5 77 Uruguay ..................................... 2.5 78 Zambia ...................................... 2.5 79 Honduras ................................... 2.5 80 Tanzania .................................... 2.4 81 Seychelles .................................. 2.4 82 Namibia ..................................... 2.4 83 Nepal ......................................... 2.4 84 Czech Republic ......................... 2.4 85 Russian Federation .................... 2.4 86 Lithuania .................................... 2.4 87 Trinidad and Tobago .................. 2.4 88 Ireland ........................................ 2.4 89 Armenia ..................................... 2.4 90 Poland ....................................... 2.4 91 Macedonia, FYR ........................ 2.3 92 Mali ............................................ 2.3 93 Libya .......................................... 2.3 94 Barbados ................................... 2.3 95 El Salvador................................. 2.3 96 Vietnam ..................................... 2.3 97 Portugal ..................................... 2.3 98 Yemen ....................................... 2.3 99 Cape Verde ............................... 2.3 100 Gabon ....................................... 2.3 101 Costa Rica ................................. 2.2 102 Benin ......................................... 2.2 103 Timor-Leste ............................... 2.2 104 Georgia ...................................... 2.2 105 Kazakhstan ................................ 2.2 106 Ukraine ...................................... 2.2 107 Sri Lanka ................................... 2.2 108 Cameroon .................................. 2.2 109 Venezuela .................................. 2.2 110 Korea, Rep. ............................... 2.2 111 Dominican Republic ................... 2.2 112 Croatia ....................................... 2.1 113 Slovenia ..................................... 2.1 114 Senegal ..................................... 2.1 115 Hungary ..................................... 2.1 116 Ghana ........................................ 2.1 117 Moldova ..................................... 2.1 118 Ethiopia ...................................... 2.1 119 Mauritania .................................. 2.1 120 Swaziland .................................. 2.1 121 Italy ............................................ 2.0 122 Bangladesh ................................ 2.0 123 Suriname ................................... 2.0 124 Chad .......................................... 2.0 125 Malawi ....................................... 2.0 126 Serbia ........................................ 1.9 127 Bosnia and Herzegovina ............ 1.9 128 Mozambique .............................. 1.9 129 Iran, Islamic Rep. ....................... 1.9 130 Jamaica ..................................... 1.9 131 Lesotho ..................................... 1.9 132 Albania ....................................... 1.8 133 Kyrgyz Republic ......................... 1.8 134 Greece ....................................... 1.8 135 Argentina ................................... 1.8 136 Burkina Faso .............................. 1.8 137 Zimbabwe .................................. 1.8 138 Algeria ....................................... 1.8 139 Mongolia .................................... 1.7 140 Côte d’Ivoire .............................. 1.7 141 Sierra Leone .............................. 1.6 142 Guinea ....................................... 1.6 143 Burundi ...................................... 1.6 144 Haiti ........................................... 1.5
2.02 Venture capital availabilityIn your country, how easy is it for entrepreneurs with innovative but risky projects to find venture capital? [1 = very difficult; 7 = very easy] | 2011–2012 weighted average
SOURCE: World Economic Forum, Executive Opinion Survey, 2011 and 2012 editions
@ 2013 World Economic Forum

306 | The Global Information Technology Report 2013
4: Data Tables
RANK COUNTRY/ECONOMY VALUE
1 Macedonia, FYR ............................9.4 2 Kuwait .........................................10.7 3 Qatar ...........................................11.3 4 Bahrain ........................................13.9 5 Saudi Arabia ................................14.5 6 United Arab Emirates ...................14.9 7 Timor-Leste .................................15.1 8 Zambia ........................................15.2 9 Lesotho .......................................16.0 10 Georgia ........................................16.5 11 Brunei Darussalam .......................16.8 12 Luxembourg ................................21.0 13 Oman ..........................................22.0 14 Montenegro .................................22.3 15 Cambodia ....................................22.5 16 Namibia .......................................22.7 17 Cyprus .........................................23.0 17 Hong Kong SAR ..........................23.0 19 Bosnia and Herzegovina ..............24.1 20 Malaysia .......................................24.5 21 Mongolia ......................................24.6 22 Botswana ....................................25.3 23 Seychelles ....................................25.7 24 Ireland ..........................................26.4 25 Canada ........................................26.9 26 Liberia ..........................................27.4 27 Singapore ....................................27.6 28 Denmark ......................................27.7 29 Suriname .....................................27.9 30 Chile ............................................28.1 30 Jordan .........................................28.1 32 Mauritius ......................................28.5 33 Kazakhstan ..................................28.6 34 Bulgaria .......................................28.7 35 Trinidad and Tobago ....................29.1 36 Korea, Rep. .................................29.8 37 Lebanon ......................................30.2 37 Switzerland ..................................30.2 39 Israel ............................................30.5 40 Moldova .......................................31.2 41 Rwanda .......................................31.3 42 Nepal ...........................................31.5 43 Sierra Leone ................................32.1 44 Croatia .........................................32.8 45 Yemen .........................................32.9 46 Iceland .........................................33.0 47 Ethiopia ........................................33.3 47 South Africa .................................33.3 49 Ghana ..........................................33.5 49 New Zealand ...............................33.5 51 Nigeria .........................................33.8 52 Serbia ..........................................34.0 53 Mozambique ................................34.3 54 Indonesia .....................................34.5 54 Vietnam .......................................34.5 56 Ecuador .......................................34.6 57 Malawi .........................................34.7 57 Slovenia .......................................34.7 59 Taiwan, China ..............................34.8 60 Bangladesh ..................................35.0 60 El Salvador...................................35.0 60 Paraguay .....................................35.0 63 Pakistan .......................................35.3 64 United Kingdom ...........................35.5 65 Zimbabwe ....................................35.8 66 Madagascar .................................36.0 67 Guyana ........................................36.1 68 Latvia ...........................................36.6 69 Swaziland ....................................36.8 70 Uganda ........................................37.1 71 Cape Verde .................................37.2 72 Thailand .......................................37.6
RANK COUNTRY/ECONOMY VALUE
73 Albania .........................................38.7 73 Spain ...........................................38.7 75 Armenia .......................................38.8 76 Côte d’Ivoire ................................39.5 77 Azerbaijan ....................................40.0 78 Netherlands .................................40.1 79 Honduras .....................................40.3 80 Peru .............................................40.5 81 Finland .........................................40.6 82 Haiti .............................................40.8 83 Guatemala ...................................40.9 84 Turkey ..........................................41.2 85 Malta ...........................................41.6 85 Norway ........................................41.6 87 Panama .......................................42.0 87 Uruguay .......................................42.0 89 Dominican Republic .....................42.5 90 Egypt ...........................................42.6 90 Portugal .......................................42.6 92 Gabon .........................................43.5 93 Burkina Faso ................................43.6 94 Lithuania ......................................43.7 95 Poland .........................................43.8 96 Iran, Islamic Rep. .........................44.1 97 Romania ......................................44.2 98 Kenya ..........................................44.4 99 Greece .........................................44.6 100 Tanzania ......................................45.3 101 Barbados .....................................45.4 102 Jamaica .......................................45.6 103 Senegal .......................................46.0 104 Philippines ...................................46.6 105 United States ...............................46.7 106 Germany ......................................46.8 107 Australia .......................................47.5 108 Slovak Republic ...........................47.9 109 Cameroon ....................................49.1 110 Czech Republic ...........................49.2 111 Morocco ......................................49.6 112 Japan ..........................................50.0 113 Sri Lanka .....................................50.1 114 Hungary .......................................50.3 115 Puerto Rico ..................................50.7 116 Mali ..............................................51.7 117 Mexico .........................................52.5 118 Burundi ........................................53.0 118 Sweden .......................................53.0 120 Austria .........................................53.1 121 Russian Federation ......................54.1 122 Costa Rica ...................................55.0 123 Ukraine ........................................55.4 124 Belgium .......................................57.7 125 India .............................................61.8 126 Venezuela ....................................62.7 127 China ...........................................63.7 128 Nicaragua ....................................65.0 129 Chad ............................................65.4 130 France .........................................65.7 131 Benin ...........................................65.9 132 Estonia .........................................67.3 133 Mauritania ....................................68.2 134 Italy ..............................................68.3 135 Kyrgyz Republic ...........................68.9 136 Brazil ............................................69.3 137 Algeria .........................................72.0 138 Guinea .........................................73.2 139 Colombia .....................................74.4 140 Bolivia ..........................................83.4 141 Tajikistan ......................................84.5 142 Argentina ...................................108.3 143 Gambia, The ..............................283.5 n/a Libya ..............................................n/a
2.03 Total tax rateSum of profit tax, labor tax and social contributions, property taxes, turnover taxes, and other taxes, as a share (%) of commercial profits | 2012
SOURCE: World Bank/International Finance Corporation, Doing Business 2013: Smarter Regulations for Small and Medium-Size Enterprises
@ 2013 World Economic Forum

The Global Information Technology Report 2013 | 307
4: Data Tables
RANK COUNTRY/ECONOMY VALUE
1 New Zealand ....................................12 Australia ............................................22 Georgia .............................................22 Macedonia, FYR ...............................25 Hong Kong SAR ...............................35 Rwanda ............................................35 Singapore .........................................38 Albania ..............................................48 Belgium ............................................4
10 Canada .............................................510 Hungary ............................................510 Iceland ..............................................510 Netherlands ......................................510 Portugal ............................................510 Senegal ............................................516 Denmark ...........................................616 Italy ...................................................616 Liberia ...............................................616 Malaysia ............................................616 Mauritius ...........................................616 Puerto Rico .......................................616 Slovenia ............................................616 Turkey ...............................................616 United States ....................................625 Egypt ................................................725 Estonia ..............................................725 France ..............................................725 Jamaica ............................................725 Korea, Rep. ......................................725 Norway .............................................725 Panama ............................................725 Sri Lanka ..........................................725 Uruguay ............................................734 Armenia ............................................834 Azerbaijan .........................................834 Burundi .............................................834 Chile .................................................834 Cyprus ..............................................834 Madagascar ......................................834 Mali ...................................................834 Oman ...............................................834 United Arab Emirates ........................843 Bahrain .............................................943 Croatia ..............................................943 Lebanon ...........................................943 Mexico ..............................................943 Moldova ............................................943 Qatar ................................................949 Ireland .............................................1049 Kyrgyz Republic ..............................1049 Montenegro ....................................1049 Romania .........................................1049 Taiwan, China .................................1054 Cape Verde ....................................1154 Greece ............................................1156 Ghana .............................................1256 Jordan ............................................1256 Mongolia .........................................1256 Morocco .........................................1256 Serbia .............................................1256 Sierra Leone ...................................1262 Burkina Faso ...................................1362 Colombia ........................................1362 Iran, Islamic Rep. ............................1362 Mozambique ...................................1362 United Kingdom ..............................1367 Finland ............................................1467 Honduras ........................................1469 Cameroon .......................................1569 Ethiopia ...........................................1569 Germany .........................................1572 Latvia ..............................................16
RANK COUNTRY/ECONOMY VALUE
72 Slovak Republic ..............................16 72 Sweden ..........................................16 75 El Salvador......................................17 75 Zambia ...........................................17 77 Barbados ........................................18 77 Bulgaria ..........................................18 77 Russian Federation .........................18 77 Switzerland .....................................18 81 Bangladesh .....................................19 81 Dominican Republic ........................19 81 Kazakhstan .....................................19 81 Luxembourg ...................................19 81 Mauritania .......................................19 81 South Africa ....................................19 87 Czech Republic ..............................20 87 Guyana ...........................................20 87 Lithuania .........................................20 90 Israel ...............................................21 90 Pakistan ..........................................21 90 Saudi Arabia ...................................21 93 Ukraine ...........................................22 94 Japan .............................................23 95 Lesotho ..........................................24 95 Tajikistan .........................................24 97 Algeria ............................................25 97 Austria ............................................25 99 Argentina ........................................26 99 Benin ..............................................26 99 Peru ................................................26 99 Tanzania .........................................26 103 Gambia, The ...................................27 103 India ................................................27 105 Spain ..............................................28 106 Nepal ..............................................29 106 Thailand ..........................................29 108 Côte d’Ivoire ...................................32 108 Kenya .............................................32 108 Kuwait ............................................32 108 Poland ............................................32 112 China ..............................................33 112 Uganda ...........................................33 114 Nigeria ............................................34 114 Vietnam ..........................................34 116 Guinea ............................................35 116 Paraguay ........................................35 118 Philippines ......................................36 119 Bosnia and Herzegovina .................37 120 Malawi ............................................39 120 Nicaragua .......................................39 120 Seychelles .......................................39 123 Guatemala ......................................40 123 Malta ..............................................40 123 Yemen ............................................40 126 Trinidad and Tobago .......................41 127 Indonesia ........................................47 128 Bolivia .............................................50 129 Ecuador ..........................................56 129 Swaziland .......................................56 131 Gabon ............................................58 132 Costa Rica ......................................60 133 Botswana .......................................61 134 Chad ...............................................62 135 Namibia ..........................................66 136 Cambodia .......................................85 137 Zimbabwe .......................................90 138 Timor-Leste ....................................94 139 Brunei Darussalam ........................101 140 Haiti ..............................................105 141 Brazil .............................................119 142 Venezuela .....................................144 143 Suriname ......................................694 n/a Libya ..............................................n/a
2.04 Time required to start a businessNumber of days required to start a business | 2012
SOURCE: World Bank/International Finance Corporation, Doing Business 2013: Smarter Regulations for Small and Medium-Size Enterprises
@ 2013 World Economic Forum

308 | The Global Information Technology Report 2013
4: Data Tables
RANK COUNTRY/ECONOMY VALUE
1 Canada .............................................1 1 New Zealand ....................................1 3 Australia ............................................2 3 Georgia .............................................2 3 Kyrgyz Republic ................................2 3 Macedonia, FYR ...............................2 3 Madagascar ......................................2 3 Rwanda ............................................2 3 Slovenia ............................................2 10 Armenia ............................................3 10 Belgium ............................................3 10 Burkina Faso .....................................3 10 Finland ..............................................3 10 Hong Kong SAR ...............................3 10 Malaysia ............................................3 10 Senegal ............................................3 10 Singapore .........................................3 10 Sweden ............................................3 10 Taiwan, China ...................................3 20 Albania ..............................................4 20 Bulgaria ............................................4 20 Burundi .............................................4 20 Denmark ...........................................4 20 Hungary ............................................4 20 Ireland ...............................................4 20 Latvia ................................................4 20 Liberia ...............................................4 20 Mali ...................................................4 20 Thailand ............................................4 30 Benin ................................................5 30 Cameroon .........................................5 30 Estonia ..............................................5 30 France ..............................................5 30 Iceland ..............................................5 30 Israel .................................................5 30 Korea, Rep. ......................................5 30 Lebanon ...........................................5 30 Mauritius ...........................................5 30 Netherlands ......................................5 30 Norway .............................................5 30 Oman ...............................................5 30 Peru ..................................................5 30 Portugal ............................................5 30 South Africa ......................................5 30 Sri Lanka ..........................................5 30 Tajikistan ...........................................5 30 Uruguay ............................................5 48 Azerbaijan .........................................6 48 Croatia ..............................................6 48 Cyprus ..............................................6 48 Egypt ................................................6 48 Guinea ..............................................6 48 Italy ...................................................6 48 Jamaica ............................................6 48 Kazakhstan .......................................6 48 Luxembourg .....................................6 48 Mexico ..............................................6 48 Montenegro ......................................6 48 Morocco ...........................................6 48 Panama ............................................6 48 Poland ..............................................6 48 Puerto Rico .......................................6 48 Romania ...........................................6 48 Serbia ...............................................6 48 Sierra Leone .....................................6 48 Slovak Republic ................................6 48 Switzerland .......................................6 48 Turkey ...............................................6 48 United Arab Emirates ........................6 48 United Kingdom ................................6 48 United States ....................................6 48 Yemen ..............................................6
RANK COUNTRY/ECONOMY VALUE
48 Zambia .............................................6 74 Bahrain .............................................7 74 Bangladesh .......................................7 74 Chile .................................................7 74 Dominican Republic ..........................7 74 Ghana ...............................................7 74 Iran, Islamic Rep. ..............................7 74 Jordan ..............................................7 74 Lesotho ............................................7 74 Lithuania ...........................................7 74 Moldova ............................................7 74 Mongolia ...........................................7 74 Nepal ................................................7 74 Paraguay ..........................................7 74 Ukraine .............................................7 88 Austria ..............................................8 88 Barbados ..........................................8 88 Cape Verde ......................................8 88 Colombia ..........................................8 88 El Salvador........................................8 88 Gambia, The .....................................8 88 Guyana .............................................8 88 Japan ...............................................8 88 Nicaragua .........................................8 88 Nigeria ..............................................8 88 Qatar ................................................8 88 Russian Federation ...........................8 88 Timor-Leste ......................................8 88 Trinidad and Tobago .........................8 102 Cambodia .........................................9 102 Chad .................................................9 102 Czech Republic ................................9 102 Ethiopia .............................................9 102 Gabon ..............................................9 102 Germany ...........................................9 102 Indonesia ..........................................9 102 Mauritania .........................................9 102 Mozambique .....................................9 102 Saudi Arabia .....................................9 102 Tanzania ...........................................9 102 Zimbabwe .........................................9 114 Botswana .......................................10 114 Côte d’Ivoire ...................................10 114 Kenya .............................................10 114 Malawi ............................................10 114 Namibia ..........................................10 114 Pakistan ..........................................10 114 Seychelles .......................................10 114 Spain ..............................................10 114 Vietnam ..........................................10 123 Bosnia and Herzegovina .................11 123 Greece ............................................11 123 Malta ..............................................11 126 Costa Rica ......................................12 126 Guatemala ......................................12 126 Haiti ................................................12 126 India ................................................12 126 Kuwait ............................................12 126 Swaziland .......................................12 132 Brazil ...............................................13 132 China ..............................................13 132 Ecuador ..........................................13 132 Honduras ........................................13 132 Suriname ........................................13 137 Algeria ............................................14 137 Argentina ........................................14 139 Bolivia .............................................15 139 Brunei Darussalam ..........................15 139 Uganda ...........................................15 142 Philippines ......................................16 143 Venezuela .......................................17 n/a Libya ..............................................n/a
2.05 Number of procedures required to start a businessNumber of procedures required to start a business | 2012
SOURCE: World Bank/International Finance Corporation, Doing Business 2013: Smarter Regulations for Small and Medium-Size Enterprises
@ 2013 World Economic Forum

The Global Information Technology Report 2013 | 309
4: Data Tables
RANK COUNTRY/ECONOMY VALUE 1 MEAN: 4.8 7
1 Netherlands ............................... 6.12 Japan ........................................ 6.03 Taiwan, China ............................ 6.04 Belgium ..................................... 6.05 United Kingdom ......................... 6.06 Australia ..................................... 5.97 Austria ....................................... 5.88 Germany .................................... 5.89 Hong Kong SAR ........................ 5.8
10 Malta ......................................... 5.811 Korea, Rep. ............................... 5.712 Qatar ......................................... 5.713 Czech Republic ......................... 5.714 Saudi Arabia .............................. 5.715 United Arab Emirates ................. 5.716 Turkey ........................................ 5.717 Puerto Rico ................................ 5.718 United States ............................. 5.619 Canada ...................................... 5.620 Switzerland ................................ 5.621 Singapore .................................. 5.522 Sweden ..................................... 5.523 Spain ......................................... 5.524 New Zealand ............................. 5.525 Estonia ....................................... 5.526 Sri Lanka ................................... 5.527 Slovak Republic ......................... 5.528 France ....................................... 5.529 Denmark .................................... 5.430 Poland ....................................... 5.431 Jordan ....................................... 5.432 Norway ...................................... 5.433 Bahrain ...................................... 5.434 India ........................................... 5.435 Lebanon .................................... 5.436 Malaysia ..................................... 5.437 China ......................................... 5.338 Hungary ..................................... 5.339 Chile .......................................... 5.340 Ireland ........................................ 5.241 Slovenia ..................................... 5.242 Mauritius .................................... 5.243 Cyprus ....................................... 5.144 Vietnam ..................................... 5.145 Brazil .......................................... 5.146 Guatemala ................................. 5.147 Oman ........................................ 5.148 Lithuania .................................... 5.149 Peru ........................................... 5.150 Philippines ................................. 5.151 South Africa ............................... 5.152 Senegal ..................................... 5.153 Ghana ........................................ 5.054 Thailand ..................................... 5.055 Panama ..................................... 5.056 Dominican Republic ................... 5.057 Morocco .................................... 5.058 Luxembourg .............................. 5.059 Guyana ...................................... 5.060 Costa Rica ................................. 5.061 Zambia ...................................... 5.062 Portugal ..................................... 4.963 Kenya ........................................ 4.964 El Salvador................................. 4.965 Jamaica ..................................... 4.966 Israel .......................................... 4.967 Italy ............................................ 4.968 Finland ....................................... 4.969 Latvia ......................................... 4.970 Barbados ................................... 4.971 Brunei Darussalam ..................... 4.872 Cambodia .................................. 4.8
RANK COUNTRY/ECONOMY VALUE 1 MEAN: 4.8 7
73 Paraguay ................................... 4.8 74 Botswana .................................. 4.8 75 Mexico ....................................... 4.8 76 Suriname ................................... 4.7 77 Uganda ...................................... 4.7 78 Côte d’Ivoire .............................. 4.7 79 Colombia ................................... 4.7 80 Yemen ....................................... 4.7 81 Kuwait ....................................... 4.7 82 Gambia, The .............................. 4.7 83 Bangladesh ................................ 4.7 84 Iceland ....................................... 4.6 85 Pakistan ..................................... 4.6 86 Mongolia .................................... 4.6 87 Liberia ........................................ 4.6 88 Trinidad and Tobago .................. 4.6 89 Honduras ................................... 4.6 90 Seychelles .................................. 4.5 91 Namibia ..................................... 4.5 92 Nigeria ....................................... 4.5 93 Benin ......................................... 4.5 94 Zimbabwe .................................. 4.4 95 Greece ....................................... 4.4 96 Indonesia ................................... 4.4 97 Cameroon .................................. 4.4 98 Rwanda ..................................... 4.4 99 Uruguay ..................................... 4.4 100 Madagascar ............................... 4.4 101 Bulgaria ..................................... 4.3 102 Romania .................................... 4.3 103 Ecuador ..................................... 4.3 104 Ukraine ...................................... 4.3 105 Burkina Faso .............................. 4.3 106 Iran, Islamic Rep. ....................... 4.3 107 Tajikistan .................................... 4.2 108 Moldova ..................................... 4.2 109 Tanzania .................................... 4.2 110 Mali ............................................ 4.2 111 Swaziland .................................. 4.2 112 Nepal ......................................... 4.2 113 Kazakhstan ................................ 4.1 114 Montenegro ............................... 4.1 115 Libya .......................................... 4.1 116 Guinea ....................................... 4.1 117 Argentina ................................... 4.1 118 Lesotho ..................................... 4.1 119 Macedonia, FYR ........................ 4.1 120 Croatia ....................................... 4.0 121 Egypt ......................................... 4.0 122 Cape Verde ............................... 4.0 123 Kyrgyz Republic ......................... 4.0 124 Russian Federation .................... 4.0 125 Mauritania .................................. 3.9 126 Malawi ....................................... 3.9 127 Georgia ...................................... 3.9 128 Albania ....................................... 3.9 129 Nicaragua .................................. 3.9 130 Armenia ..................................... 3.8 131 Azerbaijan .................................. 3.8 132 Gabon ....................................... 3.8 133 Mozambique .............................. 3.8 134 Haiti ........................................... 3.7 135 Bolivia ........................................ 3.7 136 Sierra Leone .............................. 3.7 137 Serbia ........................................ 3.6 138 Bosnia and Herzegovina ............ 3.6 139 Ethiopia ...................................... 3.6 140 Burundi ...................................... 3.5 141 Timor-Leste ............................... 3.4 142 Chad .......................................... 3.3 143 Venezuela .................................. 3.3 144 Algeria ....................................... 3.1
2.06 Intensity of local competitionHow would you assess the intensity of competition in the local markets in your country? [1 = limited in most industries; 7 = intense in most industries] | 2011–2012 weighted average
SOURCE: World Economic Forum, Executive Opinion Survey, 2011 and 2012 editions
@ 2013 World Economic Forum

310 | The Global Information Technology Report 2013
4: Data Tables
RANK COUNTRY/ECONOMY VALUE
1 Korea, Rep. ...............................103.1 2 United States ...............................94.8 3 Finland .........................................93.7 4 Slovenia .......................................89.6 5 Greece7 .......................................89.4 6 Puerto Rico10 ..............................86.2 7 Taiwan, China10 ..........................83.4 8 New Zealand ...............................82.6 9 Ukraine10.....................................81.7 10 Australia .......................................79.9 11 Iceland .........................................78.6 12 Spain ...........................................78.1 13 Venezuela9 ..................................78.1 14 Russian Federation9 ....................75.9 15 Denmark9 ....................................74.4 16 Norway ........................................74.4 17 Lithuania ......................................74.0 18 Sweden .......................................73.8 19 Poland .........................................72.4 20 Singapore ....................................72.0 21 Argentina9 ...................................71.2 22 Belgium .......................................70.6 23 Austria .........................................68.2 24 Ireland ..........................................66.2 25 Chile ............................................66.1 26 Portugal .......................................65.5 27 Netherlands .................................65.4 28 Italy ..............................................65.0 29 Estonia .........................................64.3 30 Czech Republic ...........................63.5 31 Uruguay .......................................63.2 32 Israel9 ..........................................62.5 33 Barbados10 .................................61.8 34 Hungary .......................................60.7 35 Hong Kong SAR10 ......................60.4 36 Latvia ...........................................60.1 37 Canada2 ......................................60.0 38 United Kingdom ...........................59.7 39 Japan ..........................................59.7 40 Romania ......................................58.8 41 Lebanon10 ...................................57.7 42 Mongolia10 ..................................57.2 43 Bulgaria .......................................56.9 44 France .........................................56.7 45 Turkey ..........................................55.4 46 Slovak Republic ...........................54.8 47 Switzerland ..................................54.8 48 Cyprus .........................................54.6 49 Libya3 ..........................................54.4 50 Croatia .........................................54.1 51 Serbia10 ......................................50.4 52 Armenia10....................................48.9 53 Iran, Islamic Rep.10 .....................48.6 54 Thailand10 ...................................47.7 55 Montenegro .................................47.6 56 Panama .......................................45.7 57 Albania10 .....................................43.9 58 Kazakhstan11 ..............................43.2 59 Peru .............................................43.0 60 Costa Rica10 ...............................43.0 61 Colombia10 .................................42.9 62 Kyrgyz Republic10 .......................41.3 63 Malaysia9 .....................................40.2 64 Ecuador8 .....................................39.8 65 Moldova10 ...................................39.4 66 Bolivia7 ........................................38.6 67 Macedonia, FYR ..........................38.6 68 Bosnia and Herzegovina10 ..........38.1 69 Jordan .........................................37.7 70 Saudi Arabia ................................36.8 71 Malta ...........................................35.3 72 Paraguay .....................................34.6
RANK COUNTRY/ECONOMY VALUE
73 Dominican Republic4 ...................34.0 74 Mauritius10 ..................................32.4 75 Egypt ...........................................32.4 76 Algeria10 ......................................32.1 77 Georgia10 ....................................30.0 78 Oman10 .......................................28.7 79 Philippines9 ..................................28.2 80 Mexico .........................................28.0 81 Jamaica .......................................26.0 82 China ...........................................25.9 83 Brazil5 ..........................................25.6 84 United Arab Emirates8 .................25.2 85 El Salvador...................................23.4 86 Indonesia .....................................23.1 87 Vietnam .......................................22.3 88 Kuwait4 ........................................21.9 89 Honduras .....................................20.6 90 Cape Verde10 ..............................20.4 91 Brunei Darussalam10 ...................19.6 92 Azerbaijan10 ................................19.3 93 Liberia1 ........................................19.1 94 Tajikistan10 ..................................18.7 95 Nicaragua3 ..................................18.0 96 India .............................................17.9 97 Guatemala7 .................................17.8 98 Timor-Leste9................................16.7 99 Sri Lanka .....................................15.5 100 South Africa6 ...............................15.4 101 Cambodia10 ................................14.5 102 Benin10 .......................................13.3 103 Morocco9 ....................................13.2 104 Cameroon10 ................................12.4 105 Ghana10 ......................................12.1 106 Suriname2 ...................................12.1 107 Guyana10 ....................................12.0 108 Qatar10 ........................................11.6 109 Trinidad and Tobago5 ..................11.5 110 Guinea10 .....................................11.3 111 Bangladesh9 ................................10.6 112 Luxembourg8...............................10.5 113 Nigeria5 .......................................10.3 114 Yemen7 .......................................10.2 115 Uganda10 ......................................9.1 116 Namibia8 .......................................9.0 117 Pakistan10 .....................................8.3 118 Côte d’Ivoire9 ................................8.3 119 Senegal .........................................7.9 120 Ethiopia10 ......................................7.6 121 Botswana6 .....................................7.4 122 Nepal6 ...........................................7.3 123 Rwanda10 .....................................6.6 124 Mali10 ............................................6.1 125 Zimbabwe10 ..................................6.0 126 Mozambique10 ..............................4.9 127 Swaziland6 ....................................4.4 128 Mauritania ......................................4.4 129 Gambia, The8 ................................4.1 130 Madagascar10 ...............................4.1 131 Kenya9 ..........................................4.0 132 Burkina Faso10 ..............................3.9 133 Lesotho6 ........................................3.5 134 Burundi ..........................................3.2 135 Zambia1 .........................................2.4 136 Chad10 ..........................................2.3 137 Tanzania ........................................2.1 138 Sierra Leone2 ................................2.1 139 Malawi10........................................0.8 n/a Bahrain ..........................................n/a n/a Gabon ...........................................n/a n/a Germany ........................................n/a n/a Haiti ...............................................n/a n/a Seychelles ......................................n/a
2.07 Tertiary education enrollment rateGross tertiary education enrollment rate (%) | 2010
SOURCES: United Nations Education, Science and Culture Organization (UNESCO), UNESCO Institute for Statistics Data Centre (accessed November 29, 2011); UNESCO, UNESCO Science Report 2010: The Current Status of Science around the World; World Bank, World Development Indicators 2009; national sources
1 2000 2 2002 3 2003 4 2004 5 2005 6 2006 7 2007 8 2008 9 2009 10 2011 11 2012
@ 2013 World Economic Forum

The Global Information Technology Report 2013 | 311
4: Data Tables
RANK COUNTRY/ECONOMY VALUE 1 MEAN: 4.2 7
1 United Kingdom ......................... 6.12 Belgium ..................................... 6.03 Switzerland ................................ 6.04 Spain ......................................... 5.85 Canada ...................................... 5.76 Singapore .................................. 5.77 Qatar ......................................... 5.78 France ....................................... 5.69 Netherlands ............................... 5.6
10 Finland ....................................... 5.611 Sweden ..................................... 5.412 United States ............................. 5.413 Lebanon .................................... 5.414 Chile .......................................... 5.415 South Africa ............................... 5.316 Australia ..................................... 5.317 Hong Kong SAR ........................ 5.318 Iceland ....................................... 5.219 Costa Rica ................................. 5.220 New Zealand ............................. 5.221 Barbados ................................... 5.222 Portugal ..................................... 5.123 Ireland ........................................ 5.124 Norway ...................................... 5.125 Denmark .................................... 5.126 Malaysia ..................................... 5.027 United Arab Emirates ................. 5.028 Malta ......................................... 5.029 Taiwan, China ............................ 5.030 Cyprus ....................................... 5.031 Gambia, The .............................. 4.932 Germany .................................... 4.933 India ........................................... 4.934 Argentina ................................... 4.935 Italy ............................................ 4.836 Trinidad and Tobago .................. 4.837 Austria ....................................... 4.838 Sri Lanka ................................... 4.839 Philippines ................................. 4.740 Israel .......................................... 4.741 Senegal ..................................... 4.742 Korea, Rep. ............................... 4.743 Guatemala ................................. 4.644 Puerto Rico ................................ 4.645 Saudi Arabia .............................. 4.646 Cameroon .................................. 4.547 Morocco .................................... 4.548 Estonia ....................................... 4.549 Peru ........................................... 4.550 Bosnia and Herzegovina ............ 4.451 Mexico ....................................... 4.452 Brazil .......................................... 4.453 Benin ......................................... 4.454 Uruguay ..................................... 4.455 Jordan ....................................... 4.356 Kenya ........................................ 4.357 Lithuania .................................... 4.358 Brunei Darussalam ..................... 4.359 Montenegro ............................... 4.360 Luxembourg .............................. 4.361 Albania ....................................... 4.362 Thailand ..................................... 4.363 Suriname ................................... 4.364 Guyana ...................................... 4.365 Ghana ........................................ 4.366 Slovenia ..................................... 4.367 Latvia ......................................... 4.268 China ......................................... 4.269 Liberia ........................................ 4.270 Indonesia ................................... 4.271 Pakistan ..................................... 4.272 Venezuela .................................. 4.2
RANK COUNTRY/ECONOMY VALUE 1 MEAN: 4.2 7
73 Rwanda ..................................... 4.2 74 Colombia ................................... 4.1 75 Zambia ...................................... 4.1 76 Mauritius .................................... 4.1 77 Jamaica ..................................... 4.1 78 Zimbabwe .................................. 4.1 79 Bahrain ...................................... 4.1 80 Japan ........................................ 4.1 81 Hungary ..................................... 4.1 82 Panama ..................................... 4.1 83 Côte d’Ivoire .............................. 4.1 84 Seychelles .................................. 4.0 85 Poland ....................................... 4.0 86 Nigeria ....................................... 3.9 87 Croatia ....................................... 3.9 88 Dominican Republic ................... 3.9 89 Uganda ...................................... 3.9 90 Madagascar ............................... 3.9 91 Bangladesh ................................ 3.9 92 Botswana .................................. 3.9 93 Iran, Islamic Rep. ....................... 3.9 94 Ecuador ..................................... 3.8 95 Czech Republic ......................... 3.8 96 Cambodia .................................. 3.8 97 Turkey ........................................ 3.8 98 Nicaragua .................................. 3.8 99 El Salvador................................. 3.8 100 Malawi ....................................... 3.7 101 Bulgaria ..................................... 3.7 102 Kuwait ....................................... 3.7 103 Kazakhstan ................................ 3.7 104 Greece ....................................... 3.7 105 Burkina Faso .............................. 3.7 106 Macedonia, FYR ........................ 3.7 107 Oman ........................................ 3.6 108 Ethiopia ...................................... 3.6 109 Honduras ................................... 3.6 110 Georgia ...................................... 3.6 111 Slovak Republic ......................... 3.6 112 Romania .................................... 3.5 113 Nepal ......................................... 3.5 114 Cape Verde ............................... 3.5 115 Russian Federation .................... 3.5 116 Serbia ........................................ 3.5 117 Ukraine ...................................... 3.4 118 Tanzania .................................... 3.4 119 Tajikistan .................................... 3.4 120 Bolivia ........................................ 3.4 121 Moldova ..................................... 3.3 122 Mali ............................................ 3.3 123 Azerbaijan .................................. 3.3 124 Paraguay ................................... 3.3 125 Vietnam ..................................... 3.2 126 Sierra Leone .............................. 3.2 127 Armenia ..................................... 3.2 128 Chad .......................................... 3.2 129 Namibia ..................................... 3.1 130 Gabon ....................................... 3.1 131 Algeria ....................................... 3.0 132 Mongolia .................................... 3.0 133 Mozambique .............................. 2.9 134 Lesotho ..................................... 2.8 135 Swaziland .................................. 2.8 136 Burundi ...................................... 2.8 137 Egypt ......................................... 2.8 138 Mauritania .................................. 2.7 139 Guinea ....................................... 2.7 140 Haiti ........................................... 2.7 141 Kyrgyz Republic ......................... 2.7 142 Yemen ....................................... 2.4 143 Timor-Leste ............................... 2.3 144 Libya .......................................... 2.3
2.08 Quality of management schoolsHow would you assess the quality of management or business schools in your country? [1 = poor; 7 = excellent—among the best in the world] | 2011–2012 weighted average
SOURCE: World Economic Forum, Executive Opinion Survey, 2011 and 2012 editions
@ 2013 World Economic Forum

312 | The Global Information Technology Report 2013
4: Data Tables
RANK COUNTRY/ECONOMY VALUE 1 MEAN: 3.6 7
1 Qatar ......................................... 5.8 2 Singapore .................................. 5.3 3 United Arab Emirates ................. 5.0 4 Malaysia ..................................... 4.9 5 Saudi Arabia .............................. 4.8 6 Israel .......................................... 4.6 7 Sri Lanka ................................... 4.6 8 Luxembourg .............................. 4.6 9 Taiwan, China ............................ 4.6 10 Rwanda ..................................... 4.5 11 Panama ..................................... 4.5 12 Sweden ..................................... 4.5 13 Gambia, The .............................. 4.5 14 Finland ....................................... 4.5 15 United States ............................. 4.4 16 China ......................................... 4.4 17 Oman ........................................ 4.4 18 Brunei Darussalam ..................... 4.4 19 Azerbaijan .................................. 4.4 20 Bahrain ...................................... 4.4 21 Germany .................................... 4.3 22 Switzerland ................................ 4.3 23 Netherlands ............................... 4.2 24 Cambodia .................................. 4.1 25 Belgium ..................................... 4.1 26 Tajikistan .................................... 4.1 27 Liberia ........................................ 4.1 28 Norway ...................................... 4.1 29 Indonesia ................................... 4.0 30 Iceland ....................................... 4.0 31 Hong Kong SAR ........................ 4.0 32 Turkey ........................................ 4.0 33 Korea, Rep. ............................... 4.0 34 Barbados ................................... 4.0 35 Estonia ....................................... 4.0 36 Portugal ..................................... 4.0 37 Chile .......................................... 3.9 38 Seychelles .................................. 3.9 39 Vietnam ..................................... 3.9 40 Montenegro ............................... 3.9 41 Zambia ...................................... 3.9 42 Cape Verde ............................... 3.9 43 Cameroon .................................. 3.9 44 Malta ......................................... 3.9 45 United Kingdom ......................... 3.9 46 Albania ....................................... 3.9 47 Canada ...................................... 3.8 48 Japan ........................................ 3.8 49 France ....................................... 3.8 50 Austria ....................................... 3.8 51 Senegal ..................................... 3.8 52 Colombia ................................... 3.8 53 Brazil .......................................... 3.8 54 Mali ............................................ 3.7 55 Cyprus ....................................... 3.7 56 Puerto Rico ................................ 3.7 57 New Zealand ............................. 3.7 58 Australia ..................................... 3.7 59 Ethiopia ...................................... 3.7 60 Ecuador ..................................... 3.7 61 Georgia ...................................... 3.7 62 Benin ......................................... 3.7 63 Denmark .................................... 3.7 64 Nigeria ....................................... 3.6 65 Botswana .................................. 3.6 66 Iran, Islamic Rep. ....................... 3.6 67 Mexico ....................................... 3.6 68 Uganda ...................................... 3.6 69 Jordan ....................................... 3.6 70 Uruguay ..................................... 3.6 71 Kazakhstan ................................ 3.6 72 Morocco .................................... 3.6
RANK COUNTRY/ECONOMY VALUE 1 MEAN: 3.6 7
73 Tanzania .................................... 3.5 74 Mauritius .................................... 3.5 75 Costa Rica ................................. 3.5 76 Kenya ........................................ 3.5 77 Guinea ....................................... 3.5 78 Guyana ...................................... 3.5 79 Bolivia ........................................ 3.5 80 Ireland ........................................ 3.5 81 Bulgaria ..................................... 3.4 82 Mauritania .................................. 3.4 83 India ........................................... 3.4 84 Mozambique .............................. 3.4 85 Latvia ......................................... 3.4 86 Côte d’Ivoire .............................. 3.4 87 Ghana ........................................ 3.4 88 Burkina Faso .............................. 3.4 89 Spain ......................................... 3.3 90 Namibia ..................................... 3.3 91 Malawi ....................................... 3.3 92 Timor-Leste ............................... 3.3 93 Dominican Republic ................... 3.3 94 Bosnia and Herzegovina ............ 3.3 95 Egypt ......................................... 3.3 96 Lithuania .................................... 3.2 97 Ukraine ...................................... 3.2 98 Thailand ..................................... 3.2 99 Peru ........................................... 3.2 100 Mongolia .................................... 3.2 101 Poland ....................................... 3.2 102 Macedonia, FYR ........................ 3.2 103 Sierra Leone .............................. 3.2 104 Honduras ................................... 3.1 105 South Africa ............................... 3.1 106 Slovenia ..................................... 3.1 107 Philippines ................................. 3.1 108 Armenia ..................................... 3.1 109 Pakistan ..................................... 3.1 110 Hungary ..................................... 3.1 111 Madagascar ............................... 3.1 112 Chad .......................................... 3.1 113 El Salvador................................. 3.1 114 Romania .................................... 3.1 115 Serbia ........................................ 3.1 116 Nicaragua .................................. 3.1 117 Gabon ....................................... 3.0 118 Libya .......................................... 3.0 119 Guatemala ................................. 3.0 120 Jamaica ..................................... 3.0 121 Italy ............................................ 2.9 122 Czech Republic ......................... 2.9 123 Kuwait ....................................... 2.9 124 Russian Federation .................... 2.9 125 Paraguay ................................... 2.9 126 Suriname ................................... 2.8 127 Slovak Republic ......................... 2.8 128 Trinidad and Tobago .................. 2.8 129 Croatia ....................................... 2.7 130 Greece ....................................... 2.7 131 Argentina ................................... 2.6 132 Nepal ......................................... 2.6 133 Lesotho ..................................... 2.6 134 Bangladesh ................................ 2.6 135 Zimbabwe .................................. 2.6 136 Moldova ..................................... 2.6 137 Swaziland .................................. 2.5 138 Kyrgyz Republic ......................... 2.4 139 Burundi ...................................... 2.4 140 Haiti ........................................... 2.3 141 Lebanon .................................... 2.3 142 Algeria ....................................... 2.2 143 Yemen ....................................... 2.1 144 Venezuela .................................. 2.0
2.09 Government procurement of advanced technology productsDo government procurement decisions foster innovation in your country? [1 = no, not at all; 7 = yes, extremely effectively] | 2011–2012 weighted average
SOURCE: World Economic Forum, Executive Opinion Survey, 2011 and 2012 editions
@ 2013 World Economic Forum

Data Tables
3rd pillar Infrastructure and digital content
@ 2013 World Economic Forum

314 | The Global Information Technology Report 2013
4: Data Tables
RANK COUNTRY/ECONOMY VALUE
1 Iceland1 ................................53,637.72 Norway1 ...............................25,372.83 Kuwait ..................................20,109.74 Canada1 ...............................17,522.85 Sweden1 ..............................16,291.66 Qatar ....................................15,519.27 Finland1 ................................14,982.08 United States1 ......................14,020.09 United Arab Emirates ............13,053.1
10 Australia1 ..............................11,488.711 Bahrain .................................10,308.012 New Zealand1 .......................10,261.513 Korea, Rep.1 ..........................9,675.014 Estonia1 ..................................9,673.515 Taiwan, China .........................9,221.516 Brunei Darussalam ..................9,218.117 Belgium1 .................................8,726.718 France1...................................8,722.719 Paraguay ................................8,666.020 Switzerland1 ...........................8,504.321 Japan1 ....................................8,405.822 Singapore ...............................8,381.023 Czech Republic1 .....................8,110.624 Saudi Arabia ...........................8,097.325 Austria1 ..................................7,987.826 Slovenia1 ................................7,931.327 Germany1 ...............................7,509.128 Israel1 .....................................7,507.729 Russian Federation .................6,976.630 Denmark1 ...............................6,952.131 Netherlands1 ..........................6,905.332 Oman .....................................6,571.633 Spain1 ....................................6,409.734 Luxembourg1..........................6,377.335 Ireland1 ...................................6,315.536 United Kingdom1 ....................6,075.737 Trinidad and Tobago ...............5,788.238 Bulgaria ..................................5,587.639 Puerto Rico .............................5,536.840 Hong Kong SAR .....................5,530.241 Greece1 ..................................5,370.042 Malta ......................................5,234.443 Serbia .....................................5,111.344 Slovak Republic1 ....................5,033.245 South Africa ............................5,004.346 Portugal1 ................................4,952.847 Kazakhstan .............................4,890.848 Italy1 .......................................4,877.749 Libya .......................................4,858.350 Cyprus ....................................4,793.351 Lithuania .................................4,384.852 Venezuela ...............................4,349.253 Bosnia and Herzegovina .........4,158.354 Montenegro ............................4,157.455 Poland1 ..................................4,111.056 Barbados1 ..............................3,793.957 Ukraine ...................................3,767.058 Malaysia ..................................3,759.759 Hungary1 ................................3,737.560 Chile1 .....................................3,649.361 Macedonia, FYR .....................3,319.862 Lebanon .................................3,281.263 Suriname ................................3,083.564 Argentina ................................3,041.865 Turkey1 ...................................2,903.166 Croatia ....................................2,865.767 Seychelles ...............................2,806.568 Iran, Islamic Rep. ....................2,778.269 China ......................................2,776.070 Romania .................................2,688.171 Uruguay ..................................2,647.972 Latvia ......................................2,469.8
RANK COUNTRY/ECONOMY VALUE
73 Brazil .......................................2,413.8 74 Jordan ....................................2,412.8 75 Tajikistan .................................2,377.4 76 Mexico1 ..................................2,366.7 77 Mauritius .................................2,265.8 78 Thailand ..................................2,159.8 79 Azerbaijan ...............................2,108.9 80 Kyrgyz Republic ......................2,061.9 81 Jamaica ..................................2,052.6 82 Costa Rica ..............................2,023.6 83 Panama ..................................2,006.7 84 Georgia ...................................1,940.2 85 Armenia ..................................1,838.3 86 Egypt ......................................1,743.7 87 Albania ....................................1,648.4 88 Mongolia .................................1,541.5 89 Dominican Republic ................1,529.3 90 Colombia ................................1,254.3 91 Peru ........................................1,229.1 92 Algeria ....................................1,223.7 93 Ecuador ..................................1,208.1 94 Gabon ....................................1,127.6 95 Guyana ...................................1,085.0 96 Moldova ..................................1,009.6 97 Vietnam .....................................967.1 98 El Salvador.................................939.5 99 Honduras ...................................883.1 100 Zambia ......................................810.1 101 Namibia .....................................777.0 102 India ...........................................744.7 103 Mozambique ..............................742.1 104 Morocco ....................................676.5 105 Philippines .................................675.2 106 Indonesia ...................................654.8 107 Guatemala .................................644.2 108 Zimbabwe ..................................631.6 109 Bolivia ........................................626.1 110 Nicaragua ..................................604.7 111 Cape Verde ...............................563.4 112 Pakistan .....................................559.5 113 Sri Lanka ...................................483.3 114 Swaziland ..................................431.2 115 Ghana ........................................376.0 116 Côte d’Ivoire ..............................304.6 117 Cameroon ..................................299.4 118 Yemen .......................................289.1 119 Bangladesh ................................257.5 120 Senegal .....................................236.1 121 Botswana ..................................224.1 122 Kenya ........................................174.2 123 Gambia, The ..............................142.7 124 Mauritania ..................................140.3 125 Nigeria .......................................128.0 126 Malawi .......................................120.2 127 Timor-Leste2..............................112.0 128 Tanzania ....................................106.3 129 Nepal .........................................106.0 130 Guinea .........................................97.8 131 Lesotho .......................................93.1 132 Liberia ..........................................87.3 133 Cambodia ....................................86.3 134 Uganda ........................................75.5 135 Haiti .............................................73.1 136 Madagascar .................................67.1 137 Ethiopia ........................................50.6 138 Burkina Faso ................................41.6 139 Mali ..............................................34.9 140 Rwanda .......................................23.3 141 Sierra Leone ................................20.9 142 Burundi ........................................15.5 143 Benin ...........................................14.8 144 Chad ..............................................8.7
3.01 Electricity productionElectricity production (kWh) per capita | 2009
SOURCES: The World Bank, World Development Indicators Online (accessed November 28, 2012); US Central Intelligence Agency (CIA), The World Factbook (accessed November 28, 2012)
1 2010 2 2011
@ 2013 World Economic Forum

The Global Information Technology Report 2013 | 315
4: Data Tables
RANK COUNTRY/ECONOMY VALUE
1 Azerbaijan ..................................100.0 1 Bahrain ......................................100.0 1 Chile ..........................................100.0 1 Croatia .......................................100.0 1 Hong Kong SAR ........................100.0 1 Indonesia ...................................100.0 1 Kuwait5 ......................................100.0 1 Lithuania5 ..................................100.0 1 Malta .........................................100.0 1 Montenegro5 .............................100.0 1 Namibia .....................................100.0 1 Nicaragua4 ................................100.0 1 Peru ...........................................100.0 1 Qatar .........................................100.0 1 Slovak Republic .........................100.0 1 Switzerland ................................100.0 1 Taiwan, China ............................100.0 1 Thailand .....................................100.0 1 Trinidad and Tobago5 ................100.0 1 Turkey5 ......................................100.0 1 Uganda ......................................100.0 1 United Arab Emirates .................100.0 1 Uruguay .....................................100.0 24 Brazil ..........................................100.0 24 Bulgaria .....................................100.0 24 Estonia .......................................100.0 27 Cyprus .......................................100.0 28 Belgium .......................................99.9 28 Greece .........................................99.9 28 Japan ..........................................99.9 28 Korea, Rep. .................................99.9 28 Luxembourg5...............................99.9 28 Macedonia, FYR5 ........................99.9 28 Mexico .........................................99.9 28 Romania ......................................99.9 28 Ukraine ........................................99.9 37 Singapore ....................................99.9 38 Spain ...........................................99.8 38 United States5 .............................99.8 40 South Africa2 ...............................99.8 41 Bosnia and Herzegovina ..............99.7 41 Egypt ...........................................99.7 41 Slovenia .......................................99.7 41 United Kingdom ...........................99.7 45 Czech Republic ...........................99.6 46 Poland .........................................99.5 47 Finland3 .......................................99.5 48 China4 .........................................99.5 49 Saudi Arabia ................................99.3 50 Georgia ........................................99.1 51 Albania .........................................99.0 51 Australia .......................................99.0 51 Austria .........................................99.0 51 Bangladesh ..................................99.0 51 Barbados .....................................99.0 51 Benin ...........................................99.0 51 Cambodia4 ..................................99.0 51 Canada ........................................99.0 51 France .........................................99.0 51 Germany ......................................99.0 51 Hungary .......................................99.0 51 Iceland .........................................99.0 51 Ireland ..........................................99.0 51 Israel ............................................99.0 51 Italy ..............................................99.0 51 Jordan .........................................99.0 51 Mauritius ......................................99.0 51 Morocco ......................................99.0 51 Philippines ...................................99.0 51 Portugal .......................................99.0 51 Sweden5 .....................................99.0 72 Armenia .......................................98.9
RANK COUNTRY/ECONOMY VALUE
73 Latvia2 .........................................98.8 74 Libya4 ..........................................98.0 74 Netherlands3 ...............................98.0 74 Oman ..........................................98.0 74 Seychelles ....................................98.0 74 Sri Lanka5....................................98.0 79 Moldova2 .....................................98.0 80 Rwanda .......................................97.3 81 Denmark3 ....................................97.0 81 Guyana ........................................97.0 81 Kyrgyz Republic ...........................97.0 81 Lebanon ......................................97.0 81 New Zealand ...............................97.0 86 Malaysia .......................................96.2 87 Botswana ....................................96.0 87 Cape Verde .................................96.0 89 Iran, Islamic Rep. .........................95.8 90 El Salvador2 .................................95.0 90 Jamaica2 .....................................95.0 90 Kazakhstan5 ................................95.0 90 Russian Federation1 ....................95.0 94 Swaziland ....................................94.9 95 Ecuador .......................................94.6 96 Argentina2 ...................................94.1 97 Paraguay5....................................94.0 98 Côte d’Ivoire ................................92.1 99 Pakistan .......................................92.0 99 Panama .......................................92.0 101 Nigeria .........................................90.0 101 Senegal .......................................90.0 101 Venezuela2 ..................................90.0 104 Honduras2 ...................................89.9 105 Kenya ..........................................89.1 106 Mongolia ......................................87.9 107 Serbia ..........................................87.4 108 Gambia, The2 ..............................85.0 108 Malawi .........................................85.0 108 Tanzania5 ....................................85.0 111 Ghana ..........................................84.9 112 Yemen5 .......................................84.0 113 Burundi4 ......................................83.0 113 Colombia1 ...................................83.0 113 India4 ...........................................83.0 116 Algeria2 ........................................81.5 117 Dominican Republic5 ...................81.2 118 Guinea3 .......................................80.0 119 Gabon2 ........................................79.0 120 Guatemala1 .................................76.0 121 Chad ............................................75.0 121 Lesotho .......................................75.0 123 Zimbabwe ....................................72.4 124 Sierra Leone1 ..............................70.0 124 Vietnam1 ......................................70.0 126 Costa Rica4 .................................69.5 127 Timor-Leste3................................69.0 128 Puerto Rico4 ................................68.4 129 Mauritania3 ..................................62.0 129 Zambia ........................................62.0 131 Burkina Faso1 ..............................61.1 132 Cameroon1 ..................................58.0 133 Bolivia2 ........................................45.9 134 Nepal5 .........................................35.1 135 Madagascar1 ...............................23.0 136 Mali1 ............................................20.0 137 Ethiopia1 ......................................10.0 138 Liberia ............................................0.8 n/a Brunei Darussalam .........................n/a n/a Haiti ...............................................n/a n/a Mozambique ..................................n/a n/a Norway ..........................................n/a n/a Suriname .......................................n/a n/a Tajikistan ........................................n/a
3.02 Mobile network coverage ratePercentage of total population covered by a mobile network signal | 2011
SOURCE: International Telecommunication Union (ITU), ITU World Telecommunication/ICT Indicators Database 2012 (December 2012 edition)
1 2006 2 2007 3 2008 4 2009 5 2010
@ 2013 World Economic Forum

316 | The Global Information Technology Report 2013
4: Data Tables
RANK COUNTRY/ECONOMY VALUE
1 Hong Kong SAR .....................1,046.32 Singapore ..................................343.73 Iceland .......................................287.14 Sweden .....................................244.45 Switzerland ................................167.66 United Kingdom .........................166.17 Netherlands ...............................162.58 Denmark ....................................159.59 Norway ......................................151.3
10 Puerto Rico3 ..............................135.411 Portugal .....................................135.312 Belgium .....................................131.113 Romania ....................................126.114 Finland .......................................118.415 Moldova .......................................91.116 Czech Republic ...........................91.117 Luxembourg ................................89.618 Montenegro .................................84.619 Austria .........................................81.920 France .........................................78.621 Serbia ..........................................76.822 Germany ......................................74.823 Bulgaria .......................................70.624 Canada ........................................70.225 Ireland ..........................................69.026 Slovenia .......................................68.227 Spain ...........................................64.128 Italy ..............................................60.829 Lithuania ......................................57.630 Mongolia ......................................53.631 Cyprus .........................................53.632 Australia .......................................50.433 Malta ...........................................47.834 United States ...............................47.235 Latvia ...........................................44.836 Panama .......................................44.137 Poland .........................................40.238 Barbados .....................................38.239 Israel ............................................37.840 Costa Rica ...................................36.241 Taiwan, China ..............................34.642 Turkey ..........................................33.943 Saudi Arabia ................................33.044 Uruguay .......................................32.145 Russian Federation ......................31.746 Jamaica .......................................29.547 Brazil ............................................28.048 Ecuador .......................................27.749 United Arab Emirates ...................27.650 Georgia ........................................26.751 Greece .........................................26.052 Argentina .....................................25.753 Thailand .......................................24.654 Estonia .........................................24.455 New Zealand ...............................23.756 Japan ..........................................23.157 Qatar ...........................................22.358 Armenia .......................................22.259 Brunei Darussalam .......................22.060 Kazakhstan ..................................21.961 Chile ............................................20.462 Croatia .........................................19.963 Trinidad and Tobago ....................19.864 Azerbaijan ....................................19.165 Albania .........................................19.066 South Africa .................................18.967 Côte d’Ivoire ................................18.068 Macedonia, FYR ..........................17.969 Bosnia and Herzegovina ..............17.870 Korea, Rep. .................................17.271 Timor-Leste .................................17.172 Colombia .....................................16.8
RANK COUNTRY/ECONOMY VALUE
73 Bahrain ........................................14.7 74 Cambodia ....................................13.5 75 Nicaragua ....................................12.9 76 Mauritius ......................................12.7 77 Philippines ...................................12.4 78 Slovak Republic ...........................12.3 79 Hungary .......................................12.2 80 Dominican Republic .....................11.8 81 Libya ............................................11.0 82 Malaysia .......................................10.7 83 Suriname .....................................10.0 84 Vietnam .......................................10.0 85 Ukraine ..........................................9.8 86 Paraguay .......................................9.5 87 Peru ...............................................9.3 88 Algeria ...........................................8.9 89 Mexico ...........................................8.7 90 Botswana ......................................8.4 91 Pakistan .........................................8.2 92 Venezuela ......................................8.1 93 Morocco ........................................7.6 94 Indonesia .......................................7.2 95 Ethiopia ..........................................7.0 96 Guatemala .....................................6.9 97 Jordan ...........................................6.3 98 Oman ............................................6.3 99 India ...............................................6.3 100 Gabon ...........................................6.3 101 El Salvador.....................................6.0 102 Kuwait3 ..........................................6.0 103 Seychelles ......................................5.9 104 Cape Verde ...................................5.8 105 Sri Lanka .......................................5.2 106 Mali ................................................4.9 107 Honduras .......................................4.9 108 Bolivia ............................................4.7 109 Guyana ..........................................4.5 110 Kenya ............................................4.5 111 Rwanda .........................................4.4 112 Uganda ..........................................4.2 113 Mauritania ......................................3.9 114 Egypt .............................................3.8 115 Malawi ...........................................3.8 116 Iran, Islamic Rep. ...........................3.5 117 Benin .............................................3.4 118 Senegal .........................................2.9 119 Lesotho .........................................2.8 120 China .............................................2.7 121 Namibia .........................................2.3 122 Swaziland ......................................2.3 123 Lebanon ........................................2.3 124 Burkina Faso ..................................2.2 125 Burundi ..........................................1.9 126 Zambia ..........................................1.9 127 Zimbabwe ......................................1.7 128 Guinea ...........................................1.7 129 Kyrgyz Republic .............................1.7 130 Gambia, The ..................................1.6 131 Nepal .............................................1.5 132 Bangladesh ....................................1.5 133 Mozambique ..................................1.2 134 Yemen ...........................................1.1 135 Tanzania ........................................0.9 136 Liberia ............................................0.6 137 Madagascar ...................................0.6 138 Tajikistan2 ......................................0.5 139 Nigeria ...........................................0.4 140 Cameroon ......................................0.3 141 Chad ..............................................0.2 142 Haiti1 .............................................0.2 143 Ghana ............................................0.2 n/a Sierra Leone ..................................n/a
3.03 International Internet bandwidthInternational Internet bandwidth (kb/s) per Internet user | 2011
SOURCE: International Telecommunication Union (ITU), ITU World Telecommunication/ICT Indicators Database 2012 (December 2012 edition)
1 2004 2 2007 3 2010
@ 2013 World Economic Forum

The Global Information Technology Report 2013 | 317
4: Data Tables
RANK COUNTRY/ECONOMY VALUE
1 Iceland ....................................3,025.1 2 Netherlands ............................2,749.8 3 Korea, Rep. ............................2,496.1 4 Denmark .................................2,180.7 5 Switzerland .............................2,137.5 6 Australia ..................................2,002.6 7 Luxembourg ...........................1,874.3 8 Norway ...................................1,810.6 9 Malta ......................................1,661.1 10 New Zealand ..........................1,597.4 11 United Kingdom ......................1,592.5 12 United States ..........................1,563.2 13 Finland ....................................1,486.7 14 Sweden ..................................1,451.4 15 Canada ...................................1,368.6 16 Seychelles ...............................1,348.8 17 Ireland .....................................1,154.4 18 Cyprus ....................................1,121.3 19 Germany .................................1,023.4 20 Austria .......................................993.2 21 Japan ........................................743.9 22 Singapore ..................................607.3 23 Belgium .....................................599.6 24 Hong Kong SAR ........................570.5 25 Estonia .......................................532.8 26 Taiwan, China1 ..........................492.7 27 Israel ..........................................470.1 28 Slovenia .....................................433.2 29 Barbados ...................................401.6 30 Czech Republic .........................387.2 31 France .......................................354.1 32 Spain .........................................284.7 33 Poland .......................................269.7 34 Lithuania ....................................242.0 35 Croatia .......................................224.6 36 Portugal .....................................223.7 37 Hungary .....................................219.9 38 Latvia .........................................205.9 39 Italy ............................................190.9 40 United Arab Emirates .................180.3 41 Kuwait .......................................179.2 42 Slovak Republic .........................163.8 43 Greece .......................................154.4 44 Panama .....................................143.1 45 Turkey ........................................142.5 46 Bulgaria .....................................139.1 47 Qatar .........................................126.2 48 Bahrain ......................................117.9 49 Mauritius ....................................116.6 50 Brunei Darussalam .....................113.3 51 Costa Rica .................................111.3 52 Puerto Rico ................................105.5 53 Trinidad and Tobago ....................85.4 54 South Africa .................................73.9 55 Uruguay .......................................70.4 56 Chile ............................................67.5 57 Malaysia .......................................54.4 58 Brazil ............................................54.2 59 Romania ......................................53.7 60 Oman ..........................................53.4 61 Jamaica .......................................48.4 62 Lebanon ......................................41.1 63 Suriname .....................................34.0 64 Argentina .....................................33.6 65 Serbia ..........................................28.9 66 Macedonia, FYR ..........................28.6 67 Armenia .......................................27.7 68 Russian Federation ......................27.1 69 Mexico .........................................26.8 70 Montenegro .................................25.3 71 Jordan .........................................25.2 72 Saudi Arabia ................................21.5
RANK COUNTRY/ECONOMY VALUE
73 Colombia .....................................21.2 74 Dominican Republic .....................20.3 75 Bosnia and Herzegovina ..............20.3 76 Namibia .......................................19.8 77 Ecuador .......................................19.7 78 Moldova .......................................19.7 79 Georgia ........................................18.7 80 Peru .............................................18.6 81 Ukraine ........................................17.7 82 El Salvador...................................16.9 83 Thailand .......................................16.6 84 Cape Verde .................................16.0 85 Swaziland ....................................15.0 86 Guatemala ...................................13.8 87 Albania .........................................13.7 88 Mongolia ......................................13.6 89 Nicaragua ....................................10.1 90 Paraguay .......................................9.7 91 Bolivia ............................................9.5 92 Guyana ..........................................9.3 93 Botswana ......................................8.9 94 Gabon ...........................................8.5 95 Venezuela ......................................8.1 96 Honduras .......................................7.7 97 Philippines .....................................7.5 98 Kazakhstan ....................................6.3 99 Sri Lanka .......................................6.0 100 Azerbaijan ......................................4.7 101 Vietnam .........................................4.7 102 Morocco ........................................4.3 103 Indonesia .......................................3.4 104 Kenya ............................................3.2 105 Egypt .............................................3.0 106 India ...............................................2.9 107 Gambia, The ..................................2.8 108 Timor-Leste ...................................2.6 109 Kyrgyz Republic .............................2.5 110 Cambodia ......................................2.5 111 China .............................................2.4 112 Ghana ............................................2.2 113 Mauritania ......................................2.0 114 Nepal .............................................1.9 115 Nigeria ...........................................1.7 116 Zambia ..........................................1.6 117 Uganda ..........................................1.5 118 Senegal .........................................1.4 119 Libya ..............................................1.4 120 Zimbabwe ......................................1.3 121 Liberia ............................................1.2 122 Haiti ...............................................1.2 123 Mozambique ..................................1.1 124 Pakistan .........................................1.1 125 Cameroon ......................................1.0 126 Iran, Islamic Rep. ...........................1.0 127 Mali ................................................0.9 128 Algeria ...........................................0.9 129 Côte d’Ivoire ..................................0.9 130 Rwanda .........................................0.9 131 Benin .............................................0.8 132 Sierra Leone ..................................0.7 133 Bangladesh ....................................0.6 134 Burkina Faso ..................................0.6 135 Tajikistan ........................................0.6 136 Madagascar ...................................0.5 137 Tanzania ........................................0.5 138 Guinea ...........................................0.5 139 Lesotho1 ........................................0.5 140 Yemen ...........................................0.4 141 Malawi ...........................................0.4 142 Ethiopia ..........................................0.2 143 Burundi ..........................................0.1 n/a Chad ..............................................n/a
3.04 Secure Internet serversSecure Internet servers per million population | 2011
SOURCES: The World Bank, World Development Indicators Online (accessed November 28, 2012); national sources
1 2010
@ 2013 World Economic Forum

318 | The Global Information Technology Report 2013
4: Data Tables
RANK COUNTRY/ECONOMY VALUE 1 MEAN: 4.9 7
1 United Kingdom ......................... 6.52 Netherlands ............................... 6.53 Iceland ....................................... 6.54 Switzerland ................................ 6.45 Finland ....................................... 6.46 Luxembourg .............................. 6.47 Singapore .................................. 6.48 Norway ...................................... 6.49 Austria ....................................... 6.3
10 Korea, Rep. ............................... 6.311 Estonia ....................................... 6.312 Taiwan, China ............................ 6.313 Japan ........................................ 6.314 Sweden ..................................... 6.315 Belgium ..................................... 6.216 Canada ...................................... 6.217 Denmark .................................... 6.218 Hong Kong SAR ........................ 6.219 Malta ......................................... 6.220 Australia ..................................... 6.121 Czech Republic ......................... 6.122 Germany .................................... 6.123 United Arab Emirates ................. 6.124 Lithuania .................................... 6.125 United States ............................. 6.026 Hungary ..................................... 6.027 Qatar ......................................... 6.028 Barbados ................................... 6.029 Portugal ..................................... 6.030 Puerto Rico ................................ 5.931 Bahrain ...................................... 5.932 New Zealand ............................. 5.933 Israel .......................................... 5.834 Slovenia ..................................... 5.835 Uruguay ..................................... 5.736 Spain ......................................... 5.637 Slovak Republic ......................... 5.638 France ....................................... 5.639 Latvia ......................................... 5.640 Malaysia ..................................... 5.641 Ireland ........................................ 5.542 Cyprus ....................................... 5.543 Saudi Arabia .............................. 5.544 Ukraine ...................................... 5.445 Bosnia and Herzegovina ............ 5.446 Brunei Darussalam ..................... 5.447 Croatia ....................................... 5.448 Jordan ....................................... 5.449 Vietnam ..................................... 5.350 Mongolia .................................... 5.351 China ......................................... 5.352 Montenegro ............................... 5.353 Oman ........................................ 5.354 Kuwait ....................................... 5.355 Chile .......................................... 5.256 Costa Rica ................................. 5.257 Romania .................................... 5.258 Kyrgyz Republic ......................... 5.259 Jamaica ..................................... 5.260 Macedonia, FYR ........................ 5.161 Trinidad and Tobago .................. 5.162 Turkey ........................................ 5.163 Russian Federation .................... 5.164 Greece ....................................... 5.165 Seychelles .................................. 5.166 Moldova ..................................... 5.167 Kazakhstan ................................ 5.168 El Salvador................................. 5.169 Panama ..................................... 5.070 Georgia ...................................... 5.071 Azerbaijan .................................. 5.072 Bulgaria ..................................... 5.0
RANK COUNTRY/ECONOMY VALUE 1 MEAN: 4.9 7
73 Poland ....................................... 5.0 74 Philippines ................................. 4.9 75 Armenia ..................................... 4.9 76 Guyana ...................................... 4.9 77 Senegal ..................................... 4.9 78 Dominican Republic ................... 4.9 79 Gambia, The .............................. 4.9 80 Guatemala ................................. 4.9 81 Indonesia ................................... 4.9 82 Brazil .......................................... 4.9 83 Mauritius .................................... 4.8 84 Mexico ....................................... 4.8 85 South Africa ............................... 4.8 86 Argentina ................................... 4.8 87 Italy ............................................ 4.8 88 Kenya ........................................ 4.7 89 Tajikistan .................................... 4.7 90 Thailand ..................................... 4.7 91 India ........................................... 4.6 92 Cambodia .................................. 4.6 93 Nigeria ....................................... 4.6 94 Colombia ................................... 4.6 95 Rwanda ..................................... 4.6 96 Morocco .................................... 4.5 97 Pakistan ..................................... 4.4 98 Venezuela .................................. 4.4 99 Sri Lanka ................................... 4.4 100 Egypt ......................................... 4.4 101 Cape Verde ............................... 4.4 102 Peru ........................................... 4.4 103 Botswana .................................. 4.4 104 Honduras ................................... 4.3 105 Namibia ..................................... 4.3 106 Paraguay ................................... 4.3 107 Serbia ........................................ 4.2 108 Albania ....................................... 4.2 109 Ecuador ..................................... 4.2 110 Lebanon .................................... 4.2 111 Ghana ........................................ 4.2 112 Suriname ................................... 4.1 113 Malawi ....................................... 4.1 114 Iran, Islamic Rep. ....................... 4.0 115 Bangladesh ................................ 4.0 116 Nicaragua .................................. 4.0 117 Swaziland .................................. 3.9 118 Zambia ...................................... 3.9 119 Nepal ......................................... 3.8 120 Uganda ...................................... 3.8 121 Yemen ....................................... 3.8 122 Liberia ........................................ 3.8 123 Madagascar ............................... 3.7 124 Mauritania .................................. 3.7 125 Mozambique .............................. 3.7 126 Zimbabwe .................................. 3.6 127 Cameroon .................................. 3.6 128 Benin ......................................... 3.6 129 Bolivia ........................................ 3.6 130 Mali ............................................ 3.5 131 Libya .......................................... 3.5 132 Timor-Leste ............................... 3.5 133 Tanzania .................................... 3.4 134 Côte d’Ivoire .............................. 3.4 135 Lesotho ..................................... 3.4 136 Burkina Faso .............................. 3.3 137 Algeria ....................................... 3.3 138 Haiti ........................................... 3.1 139 Sierra Leone .............................. 3.0 140 Ethiopia ...................................... 3.0 141 Chad .......................................... 2.9 142 Burundi ...................................... 2.8 143 Guinea ....................................... 2.6 144 Gabon ....................................... 2.5
3.05 Accessibility of digital contentIn your country, how accessible is digital content (e.g., text and audiovisual content, software products) via multiple platforms (e.g., fixed-line Internet, wireless Internet, mobile network, satellite)? [1 = not accessible at all; 7 = widely accessible] | 2011–2012 weighted average
SOURCE: World Economic Forum, Executive Opinion Survey, 2011 and 2012 editions
@ 2013 World Economic Forum

Data Tables
4th pillar Affordability
@ 2013 World Economic Forum

320 | The Global Information Technology Report 2013
4: Data Tables
RANK COUNTRY/ECONOMY VALUE
1 Liberia ..........................................0.00 2 Ukraine ........................................0.01 3 Hong Kong SAR ..........................0.02 4 Bangladesh ..................................0.03 5 Sri Lanka .....................................0.04 6 India .............................................0.04 7 Norway ........................................0.04 8 Egypt ...........................................0.05 9 China ...........................................0.06 10 Denmark ......................................0.06 11 Nepal ...........................................0.07 12 Pakistan .......................................0.07 13 Finland .........................................0.07 14 Sweden .......................................0.08 15 Austria .........................................0.08 16 Thailand .......................................0.09 17 United Arab Emirates ...................0.09 18 Costa Rica ...................................0.09 19 Ghana ..........................................0.10 20 Kenya ..........................................0.11 21 Mongolia ......................................0.11 22 Cyprus .........................................0.12 23 Iceland .........................................0.13 24 Kuwait .........................................0.14 25 Guinea2 .......................................0.14 26 Qatar ...........................................0.15 27 Ethiopia ........................................0.15 28 Azerbaijan ....................................0.15 29 Jordan .........................................0.15 30 Zimbabwe ....................................0.15 31 Kyrgyz Republic ...........................0.16 32 Bahrain2 ......................................0.16 33 Germany ......................................0.16 34 Oman ..........................................0.16 35 Armenia .......................................0.17 36 Turkey ..........................................0.17 37 Singapore ....................................0.17 38 Guatemala ...................................0.17 39 Indonesia .....................................0.17 40 Saudi Arabia ................................0.17 41 Serbia ..........................................0.18 42 Kazakhstan ..................................0.19 43 Malaysia .......................................0.19 44 Suriname2 ...................................0.19 45 Poland .........................................0.19 46 Russian Federation ......................0.19 47 Mauritius ......................................0.19 48 Haiti .............................................0.20 49 Algeria .........................................0.20 50 Yemen .........................................0.20 51 Cambodia ....................................0.20 52 Guyana2 ......................................0.21 53 Vietnam2 ......................................0.21 54 Latvia ...........................................0.22 55 Panama .......................................0.22 56 Croatia .........................................0.24 57 Iran, Islamic Rep.1 .......................0.24 58 Georgia ........................................0.24 59 Luxembourg ................................0.25 60 Lithuania ......................................0.25 61 Jamaica .......................................0.26 62 Paraguay .....................................0.26 63 El Salvador...................................0.26 64 Uganda ........................................0.26 65 Namibia .......................................0.27 66 Tajikistan ......................................0.27 67 Portugal .......................................0.27 68 United States ...............................0.27 69 Colombia .....................................0.28 70 Slovenia .......................................0.28 71 Italy ..............................................0.29 72 Chile ............................................0.29
RANK COUNTRY/ECONOMY VALUE
73 Philippines ...................................0.29 74 Israel ............................................0.30 75 Côte d’Ivoire ................................0.30 76 Moldova .......................................0.31 77 Hungary .......................................0.31 78 Trinidad and Tobago ....................0.32 79 Senegal .......................................0.32 80 Gambia, The ................................0.32 81 Rwanda .......................................0.32 82 Korea, Rep. .................................0.33 83 Bosnia and Herzegovina ..............0.34 84 Burkina Faso ................................0.35 85 Estonia .........................................0.35 86 Mauritania ....................................0.35 87 Netherlands .................................0.36 88 Cameroon ....................................0.36 89 Ireland ..........................................0.36 90 Morocco ......................................0.36 91 United Kingdom ...........................0.37 92 Canada ........................................0.37 93 Ecuador .......................................0.37 94 Uruguay .......................................0.37 95 Honduras .....................................0.37 96 Mali ..............................................0.38 97 Nigeria .........................................0.38 98 Tanzania ......................................0.39 99 Benin ...........................................0.39 100 Albania .........................................0.39 101 Botswana ....................................0.40 102 Mexico .........................................0.40 103 Madagascar .................................0.40 104 Barbados1 ...................................0.40 105 Cape Verde .................................0.42 106 Macedonia, FYR ..........................0.42 107 Timor-Leste .................................0.43 108 Zambia ........................................0.43 109 Dominican Republic .....................0.44 110 Brunei Darussalam2 .....................0.45 111 Bolivia ..........................................0.46 112 Swaziland ....................................0.47 113 Mozambique ................................0.48 114 Czech Republic ...........................0.50 115 Venezuela ....................................0.51 116 Gabon .........................................0.51 117 South Africa .................................0.51 118 Montenegro .................................0.51 119 Taiwan, China ..............................0.53 120 Switzerland ..................................0.53 121 Australia .......................................0.54 122 Malta ...........................................0.54 123 Lebanon ......................................0.54 124 Romania ......................................0.57 125 Lesotho .......................................0.57 126 France .........................................0.57 127 Belgium .......................................0.58 128 New Zealand ...............................0.58 129 Greece .........................................0.59 130 Brazil ............................................0.68 131 Seychelles ....................................0.74 132 Spain ...........................................0.75 133 Bulgaria .......................................0.78 134 Slovak Republic ...........................0.82 135 Chad ............................................0.83 136 Japan ..........................................0.84 137 Argentina .....................................0.86 138 Malawi .........................................0.90 139 Nicaragua ....................................0.96 140 Peru .............................................1.23 n/a Burundi ..........................................n/a n/a Libya ..............................................n/a n/a Puerto Rico ....................................n/a n/a Sierra Leone ..................................n/a
4.01 Mobile cellular tariffsAverage per-minute cost of different types of mobile cellular calls (PPP $) | 2011
SOURCES: Authors’ calculations based on International Telecommunication Union, ITU World Telecommunication/ICT Indicators Database 2012 (December 2012 edition); International Monetary Fund, World Economic Outlook (October 2012 edition); World Bank, World Development Indicators Online (accessed November 29, 2012); and national sources. See Technical Notes and Sources for more details.
1 2009 2 2010
@ 2013 World Economic Forum

The Global Information Technology Report 2013 | 321
4: Data Tables
RANK COUNTRY/ECONOMY VALUE
1 Israel ............................................8.112 Sri Lanka ...................................10.983 Cape Verde ...............................13.534 India ...........................................14.755 Mongolia ....................................14.786 Ukraine ......................................15.107 Georgia ......................................15.298 Bosnia and Herzegovina ............15.689 Russian Federation ....................16.52
10 Lithuania ....................................16.5611 Brazil ..........................................16.5812 Romania ....................................17.1613 Egypt .........................................17.2514 Taiwan, China ............................18.0315 Venezuela ..................................18.2716 Azerbaijan ..................................18.5517 Bangladesh ................................18.8718 United Kingdom .........................19.0519 Trinidad and Tobago ..................19.1620 Latvia .........................................19.2821 Japan ........................................19.8622 United States .............................19.9523 Morocco ....................................19.9824 Costa Rica .................................20.4625 Zimbabwe ..................................20.5326 Greece .......................................20.6827 Turkey ........................................20.8028 Kuwait .......................................21.3329 Moldova .....................................22.0330 Uruguay .....................................22.1131 Belgium .....................................22.1332 Cyprus .......................................22.9533 Mauritius ....................................22.9534 Iceland .......................................23.2335 Chad2 ........................................23.2436 Switzerland ................................23.4137 Canada ......................................24.7138 Malta .........................................24.8139 Chile ..........................................24.8440 Italy ............................................25.5141 Croatia .......................................25.8242 Lebanon ....................................26.3743 Albania .......................................26.3744 Sweden .....................................26.7045 Panama .....................................27.3246 France .......................................27.5647 Kazakhstan ................................28.0048 Vietnam2 ....................................28.0149 Mexico .......................................28.0550 Finland .......................................28.8551 China .........................................28.8852 Bulgaria .....................................29.0253 Jordan .......................................29.1854 El Salvador.................................29.3955 Estonia .......................................29.4556 Yemen .......................................29.6657 Indonesia ...................................29.7058 Netherlands ...............................29.7459 Oman ........................................29.7460 Ireland ........................................29.8261 Algeria .......................................30.2362 Hong Kong SAR ........................30.7563 Poland .......................................31.5264 Luxembourg ..............................31.5565 Saudi Arabia ..............................31.7266 Denmark ....................................31.8567 Macedonia, FYR ........................32.0868 Pakistan .....................................32.1369 Paraguay ...................................32.4370 Dominican Republic ...................32.5371 Spain .........................................32.8472 Portugal .....................................33.19
RANK COUNTRY/ECONOMY VALUE
73 Norway ......................................33.65 74 Bahrain2 ....................................34.65 75 Colombia ...................................34.81 76 Malaysia .....................................34.82 77 Hungary .....................................34.82 78 Austria .......................................35.33 79 Honduras ...................................35.39 80 Ghana ........................................35.71 81 Korea, Rep. ...............................36.52 82 New Zealand .............................36.72 83 Thailand .....................................36.79 84 Montenegro ...............................36.80 85 Armenia .....................................36.93 86 Singapore ..................................37.09 87 Argentina ...................................37.30 88 Germany ....................................37.39 89 South Africa ...............................37.48 90 Slovak Republic .........................37.62 91 Uganda ......................................38.88 92 Suriname2 .................................40.08 93 Serbia ........................................40.16 94 Australia .....................................40.24 95 Philippines .................................40.30 96 Slovenia .....................................41.06 97 Ecuador .....................................41.94 98 Jamaica .....................................42.65 99 United Arab Emirates .................42.85 100 Czech Republic .........................43.27 101 Guatemala .................................44.12 102 Nepal .........................................46.44 103 Nicaragua ..................................46.66 104 Botswana ..................................49.46 105 Barbados1 .................................50.44 106 Mauritania ..................................51.64 107 Peru ...........................................52.11 108 Qatar .........................................52.82 109 Guyana2 ....................................53.03 110 Bolivia ........................................54.67 111 Côte d’Ivoire ..............................63.98 112 Zambia ......................................64.61 113 Libya1 ........................................67.49 114 Senegal .....................................67.50 115 Ethiopia ......................................70.62 116 Kenya ........................................71.60 117 Sierra Leone1 ............................71.76 118 Iran, Islamic Rep.1 .....................76.88 119 Cambodia ..................................78.72 120 Brunei Darussalam2 ...................81.20 121 Madagascar ...............................81.28 122 Mali ............................................82.18 123 Lesotho .....................................82.21 124 Tanzania ....................................82.37 125 Seychelles ..................................90.19 126 Nigeria .....................................101.97 127 Mozambique ............................107.39 128 Benin .......................................107.58 129 Cameroon ................................115.21 130 Burkina Faso ............................120.00 131 Kyrgyz Republic .......................122.19 132 Namibia ...................................152.98 133 Timor-Leste .............................175.44 134 Rwanda ...................................232.09 135 Tajikistan ..................................868.84 136 Gambia, The ............................952.00 137 Swaziland .............................1,431.45 138 Malawi2 ................................1,463.32 139 Guinea2 ................................2,067.85 n/a Burundi ..........................................n/a n/a Gabon ...........................................n/a n/a Haiti ...............................................n/a n/a Liberia ............................................n/a n/a Puerto Rico ....................................n/a
4.02 Fixed broadband Internet tariffsMonthly subscription charge for fixed (wired) broadband Internet service (PPP $) | 2011
SOURCES: Authors’ calculations based on International Telecommunication Union, ITU World Telecommunication/ICT Indicators Database 2012 (December 2012 edition); International Monetary Fund, World Economic Outlook (October 2012 edition); World Bank, World Development Indicators Online (retrieved November 29, 2012); and national sources. See Technical Notes and Sources for more details.
1 2009 2 2010
@ 2013 World Economic Forum

322 | The Global Information Technology Report 2013
4: Data Tables
RANK COUNTRY/ECONOMY VALUE
1 Argentina .....................................2.00 1 Austria .........................................2.00 1 Belgium .......................................2.00 1 Brazil ............................................2.00 1 Canada ........................................2.00 1 Chile ............................................2.00 1 Colombia .....................................2.00 1 Croatia .........................................2.00 1 Dominican Republic .....................2.00 1 Ecuador .......................................2.00 1 El Salvador...................................2.00 1 Estonia .........................................2.00 1 France .........................................2.00 1 Gabon .........................................2.00 1 Georgia ........................................2.00 1 Germany ......................................2.00 1 Haiti .............................................2.00 1 Honduras .....................................2.00 1 Hong Kong SAR ..........................2.00 1 Iceland .........................................2.00 1 India .............................................2.00 1 Ireland ..........................................2.00 1 Japan ..........................................2.00 1 Kenya ..........................................2.00 1 Kyrgyz Republic ...........................2.00 1 Lesotho .......................................2.00 1 Luxembourg ................................2.00 1 Madagascar .................................2.00 1 Malaysia .......................................2.00 1 Malta ...........................................2.00 1 Mauritania ....................................2.00 1 Mauritius ......................................2.00 1 Mexico .........................................2.00 1 Moldova .......................................2.00 1 Montenegro .................................2.00 1 Morocco ......................................2.00 1 Nepal ...........................................2.00 1 Netherlands .................................2.00 1 Nigeria .........................................2.00 1 Norway ........................................2.00 1 Pakistan .......................................2.00 1 Panama .......................................2.00 1 Paraguay .....................................2.00 1 Peru .............................................2.00 1 Philippines ...................................2.00 1 Portugal .......................................2.00 1 Romania ......................................2.00 1 Singapore ....................................2.00 1 Slovenia .......................................2.00 1 Spain ...........................................2.00 1 Sweden .......................................2.00 1 Switzerland ..................................2.00 1 Taiwan, China ..............................2.00 1 Turkey ..........................................2.00 1 Uganda ........................................2.00 1 United States ...............................2.00 1 Venezuela ....................................2.00 58 Jordan .........................................1.94 59 Jamaica .......................................1.93 59 Rwanda .......................................1.93 61 Bahrain ........................................1.92 61 Lithuania ......................................1.92 63 Australia .......................................1.91 64 Denmark ......................................1.89 65 Cambodia ....................................1.88 65 Nicaragua ....................................1.88 67 Hungary .......................................1.88 68 Czech Republic ...........................1.87 68 Oman ..........................................1.87 68 Vietnam .......................................1.87 71 Bosnia and Herzegovina ..............1.86 71 Ukraine ........................................1.86
RANK COUNTRY/ECONOMY VALUE
71 United Kingdom ...........................1.86 74 Guatemala ...................................1.85 75 Cape Verde .................................1.83 75 Finland .........................................1.83 77 Slovak Republic ...........................1.82 78 Thailand .......................................1.82 79 Kazakhstan ..................................1.81 80 Greece .........................................1.80 81 Indonesia .....................................1.79 82 Zimbabwe ....................................1.79 83 Latvia ...........................................1.77 83 Poland .........................................1.77 85 Korea, Rep. .................................1.76 85 Senegal .......................................1.76 87 Liberia ..........................................1.75 88 Albania .........................................1.69 89 Guinea .........................................1.67 90 Zambia ........................................1.64 91 Costa Rica ...................................1.63 92 Italy ..............................................1.62 93 Russian Federation ......................1.60 94 Mongolia ......................................1.56 95 Burundi ........................................1.54 96 New Zealand ...............................1.53 97 Chad ............................................1.50 98 Namibia .......................................1.43 98 Serbia ..........................................1.43 100 Ghana ..........................................1.42 101 Egypt ...........................................1.40 102 Cameroon ....................................1.36 103 Bulgaria .......................................1.36 104 Azerbaijan ....................................1.35 105 Iran, Islamic Rep. .........................1.33 105 Saudi Arabia ................................1.33 107 Algeria .........................................1.31 107 Cyprus .........................................1.31 109 China ...........................................1.29 109 Mozambique ................................1.29 111 Israel ............................................1.27 112 Botswana ....................................1.27 113 Bangladesh ..................................1.25 114 Côte d’Ivoire ................................1.22 115 Armenia .......................................1.21 116 Barbados .....................................1.20 117 Mali ..............................................1.19 118 Gambia, The ................................1.13 118 Malawi .........................................1.13 118 South Africa .................................1.13 121 Suriname .....................................1.10 122 Seychelles ....................................1.08 123 Macedonia, FYR ..........................1.00 123 Tanzania ......................................1.00 123 Trinidad and Tobago ....................1.00 123 United Arab Emirates ...................1.00 127 Qatar ...........................................0.93 127 Sierra Leone ................................0.93 129 Sri Lanka .....................................0.88 130 Bolivia ..........................................0.80 131 Brunei Darussalam .......................0.78 132 Burkina Faso ................................0.75 132 Uruguay .......................................0.75 134 Lebanon ......................................0.55 135 Benin ...........................................0.50 135 Guyana ........................................0.50 137 Yemen .........................................0.46 138 Kuwait .........................................0.23 139 Swaziland ....................................0.08 140 Ethiopia ........................................0.00 140 Libya ............................................0.00 140 Tajikistan ......................................0.00 n/a Puerto Rico ....................................n/a n/a Timor-Leste ...................................n/a
4.03 Internet and telephony sectors competition indexLevel of competition index for Internet services, international long distance services, and mobile telephone services on a 0-to-2 (best) scale | As of 2011
SOURCE: Authors’ calculations based on International Telecommunication Union (ITU), ITU World Telecommunication Regulatory Database (accessed November 29, 2012).
@ 2013 World Economic Forum
Data Tables
5th pillar Skills
@ 2013 World Economic Forum

324 | The Global Information Technology Report 2013
4: Data Tables
RANK COUNTRY/ECONOMY VALUE 1 MEAN: 3.7 7
1 Switzerland ................................ 6.02 Finland ....................................... 5.83 Singapore .................................. 5.84 Qatar ......................................... 5.75 Belgium ..................................... 5.46 Canada ...................................... 5.47 Barbados ................................... 5.48 Iceland ....................................... 5.49 Ireland ........................................ 5.3
10 Lebanon .................................... 5.311 New Zealand ............................. 5.312 Sweden ..................................... 5.313 Netherlands ............................... 5.314 Malaysia ..................................... 5.115 Australia ..................................... 5.016 Malta ......................................... 5.017 United Arab Emirates ................. 5.018 Norway ...................................... 5.019 Denmark .................................... 5.020 Germany .................................... 4.921 Costa Rica ................................. 4.922 Cyprus ....................................... 4.823 Hong Kong SAR ........................ 4.824 Taiwan, China ............................ 4.825 Brunei Darussalam ..................... 4.726 Austria ....................................... 4.727 United Kingdom ......................... 4.728 United States ............................. 4.729 Gambia, The .............................. 4.630 Zimbabwe .................................. 4.531 Jordan ....................................... 4.432 Saudi Arabia .............................. 4.433 Sri Lanka ................................... 4.434 India ........................................... 4.435 Bahrain ...................................... 4.436 Luxembourg .............................. 4.437 Kenya ........................................ 4.338 Montenegro ............................... 4.239 Zambia ...................................... 4.240 Trinidad and Tobago .................. 4.241 France ....................................... 4.242 Guyana ...................................... 4.243 Japan ........................................ 4.244 Korea, Rep. ............................... 4.145 Philippines ................................. 4.146 Mauritius .................................... 4.147 Indonesia ................................... 4.148 Seychelles .................................. 4.149 Estonia ....................................... 4.150 Rwanda ..................................... 4.151 Puerto Rico ................................ 4.052 Albania ....................................... 4.053 Israel .......................................... 4.054 Lithuania .................................... 4.055 Botswana .................................. 4.056 Liberia ........................................ 4.057 China ......................................... 3.958 Cambodia .................................. 3.959 Czech Republic ......................... 3.960 Oman ........................................ 3.961 Portugal ..................................... 3.862 Ghana ........................................ 3.863 Slovenia ..................................... 3.864 Cape Verde ............................... 3.865 Malawi ....................................... 3.866 Cameroon .................................. 3.767 Tajikistan .................................... 3.768 Poland ....................................... 3.769 Uganda ...................................... 3.770 Ukraine ...................................... 3.671 Benin ......................................... 3.672 Vietnam ..................................... 3.6
RANK COUNTRY/ECONOMY VALUE 1 MEAN: 3.7 7
73 Senegal ..................................... 3.6 74 Latvia ......................................... 3.6 75 Pakistan ..................................... 3.6 76 Jamaica ..................................... 3.6 77 Colombia ................................... 3.6 78 Thailand ..................................... 3.5 79 Armenia ..................................... 3.5 80 Tanzania .................................... 3.5 81 Spain ......................................... 3.5 82 Turkey ........................................ 3.5 83 Nigeria ....................................... 3.5 84 Suriname ................................... 3.4 85 Ethiopia ...................................... 3.4 86 Russian Federation .................... 3.4 87 Italy ............................................ 3.4 88 Macedonia, FYR ........................ 3.4 89 Argentina ................................... 3.4 90 Hungary ..................................... 3.4 91 Chile .......................................... 3.4 92 Nepal ......................................... 3.4 93 Ecuador ..................................... 3.3 94 Iran, Islamic Rep. ....................... 3.3 95 Côte d’Ivoire .............................. 3.3 96 Bolivia ........................................ 3.3 97 Bangladesh ................................ 3.2 98 Bulgaria ..................................... 3.2 99 Croatia ....................................... 3.2 100 Mexico ....................................... 3.2 101 Kazakhstan ................................ 3.2 102 Lesotho ..................................... 3.2 103 Moldova ..................................... 3.2 104 Kuwait ....................................... 3.1 105 Morocco .................................... 3.1 106 Bosnia and Herzegovina ............ 3.1 107 Uruguay ..................................... 3.1 108 Romania .................................... 3.1 109 Azerbaijan .................................. 3.1 110 Swaziland .................................. 3.1 111 Serbia ........................................ 3.1 112 Panama ..................................... 3.0 113 Chad .......................................... 3.0 114 Georgia ...................................... 3.0 115 Greece ....................................... 3.0 116 Brazil .......................................... 3.0 117 Madagascar ............................... 3.0 118 Mali ............................................ 2.9 119 Mozambique .............................. 2.9 120 Slovak Republic ......................... 2.8 121 Nicaragua .................................. 2.8 122 Venezuela .................................. 2.8 123 Kyrgyz Republic ......................... 2.8 124 Burkina Faso .............................. 2.8 125 Sierra Leone .............................. 2.8 126 Namibia ..................................... 2.7 127 Gabon ....................................... 2.7 128 Guinea ....................................... 2.7 129 Timor-Leste ............................... 2.7 130 Guatemala ................................. 2.6 131 Algeria ....................................... 2.5 132 Peru ........................................... 2.5 133 Paraguay ................................... 2.5 134 El Salvador................................. 2.5 135 Honduras ................................... 2.4 136 Mongolia .................................... 2.4 137 Dominican Republic ................... 2.4 138 Mauritania .................................. 2.3 139 Egypt ......................................... 2.3 140 South Africa ............................... 2.2 141 Haiti ........................................... 2.1 142 Libya .......................................... 2.0 143 Burundi ...................................... 2.0 144 Yemen ....................................... 1.8
5.01 Quality of the educational systemHow well does the educational system in your country meet the needs of a competitive economy? [1 = not well at all; 7 = very well] | 2011–2012 weighted average
SOURCE: World Economic Forum, Executive Opinion Survey, 2011 and 2012 editions
@ 2013 World Economic Forum

The Global Information Technology Report 2013 | 325
4: Data Tables
RANK COUNTRY/ECONOMY VALUE 1 MEAN: 3.9 7
1 Singapore .................................. 6.3 2 Finland ....................................... 6.2 3 Belgium ..................................... 6.2 4 Lebanon .................................... 5.9 5 Switzerland ................................ 5.8 6 Taiwan, China ............................ 5.6 7 Barbados ................................... 5.6 8 Korea, Rep. ............................... 5.5 9 Qatar ......................................... 5.5 10 New Zealand ............................. 5.5 11 Hong Kong SAR ........................ 5.4 12 Netherlands ............................... 5.4 13 Cyprus ....................................... 5.3 14 Canada ...................................... 5.3 15 Malta ......................................... 5.2 16 Lithuania .................................... 5.2 17 United Arab Emirates ................. 5.2 18 Slovenia ..................................... 5.1 19 Estonia ....................................... 5.0 20 Malaysia ..................................... 5.0 21 Bosnia and Herzegovina ............ 5.0 22 Iceland ....................................... 5.0 23 Brunei Darussalam ..................... 4.9 24 Australia ..................................... 4.9 25 France ....................................... 4.9 26 Croatia ....................................... 4.8 27 Japan ........................................ 4.8 28 Jordan ....................................... 4.7 29 Germany .................................... 4.7 30 India ........................................... 4.7 31 Ireland ........................................ 4.7 32 Iran, Islamic Rep. ....................... 4.6 33 China ......................................... 4.6 34 Ukraine ...................................... 4.6 35 Trinidad and Tobago .................. 4.6 36 Sweden ..................................... 4.6 37 Saudi Arabia .............................. 4.5 38 Denmark .................................... 4.5 39 Hungary ..................................... 4.5 40 Albania ....................................... 4.5 41 Costa Rica ................................. 4.5 42 United Kingdom ......................... 4.5 43 Austria ....................................... 4.4 44 Montenegro ............................... 4.4 45 Indonesia ................................... 4.4 46 Luxembourg .............................. 4.3 47 United States ............................. 4.3 48 Latvia ......................................... 4.3 49 Mauritius .................................... 4.3 50 Zimbabwe .................................. 4.3 51 Benin ......................................... 4.3 52 Russian Federation .................... 4.3 53 Morocco .................................... 4.3 54 Greece ....................................... 4.2 55 Romania .................................... 4.2 56 Bahrain ...................................... 4.2 57 Norway ...................................... 4.2 58 Vietnam ..................................... 4.1 59 Poland ....................................... 4.1 60 Serbia ........................................ 4.1 61 Thailand ..................................... 4.1 62 Rwanda ..................................... 4.1 63 Mongolia .................................... 4.1 64 Moldova ..................................... 4.1 65 Italy ............................................ 4.1 66 Botswana .................................. 4.1 67 Macedonia, FYR ........................ 4.1 68 Bulgaria ..................................... 4.0 69 Sri Lanka ................................... 4.0 70 Guyana ...................................... 4.0 71 Armenia ..................................... 4.0 72 Seychelles .................................. 4.0
RANK COUNTRY/ECONOMY VALUE 1 MEAN: 3.9 7
73 Côte d’Ivoire .............................. 4.0 74 Gambia, The .............................. 4.0 75 Cameroon .................................. 3.9 76 Kenya ........................................ 3.9 77 Zambia ...................................... 3.9 78 Czech Republic ......................... 3.8 79 Senegal ..................................... 3.8 80 Burkina Faso .............................. 3.8 81 Kazakhstan ................................ 3.8 82 Madagascar ............................... 3.8 83 Slovak Republic ......................... 3.8 84 Puerto Rico ................................ 3.8 85 Suriname ................................... 3.8 86 Oman ........................................ 3.7 87 Liberia ........................................ 3.7 88 Pakistan ..................................... 3.7 89 Israel .......................................... 3.7 90 Cambodia .................................. 3.7 91 Tajikistan .................................... 3.7 92 Nigeria ....................................... 3.6 93 Ghana ........................................ 3.6 94 Portugal ..................................... 3.6 95 Nepal ......................................... 3.6 96 Malawi ....................................... 3.6 97 Spain ......................................... 3.6 98 Philippines ................................. 3.6 99 Azerbaijan .................................. 3.5 100 Turkey ........................................ 3.5 101 Georgia ...................................... 3.5 102 Ecuador ..................................... 3.5 103 Bolivia ........................................ 3.5 104 Kuwait ....................................... 3.4 105 Ethiopia ...................................... 3.4 106 Guinea ....................................... 3.4 107 Colombia ................................... 3.4 108 Cape Verde ............................... 3.4 109 Uganda ...................................... 3.4 110 Swaziland .................................. 3.2 111 Chad .......................................... 3.2 112 Burundi ...................................... 3.2 113 Bangladesh ................................ 3.2 114 Kyrgyz Republic ......................... 3.1 115 Argentina ................................... 3.1 116 Jamaica ..................................... 3.0 117 Chile .......................................... 3.0 118 Uruguay ..................................... 3.0 119 Lesotho ..................................... 3.0 120 Venezuela .................................. 2.9 121 Mali ............................................ 2.8 122 Tanzania .................................... 2.8 123 Gabon ....................................... 2.8 124 Mexico ....................................... 2.8 125 Panama ..................................... 2.8 126 Mauritania .................................. 2.7 127 Namibia ..................................... 2.7 128 Nicaragua .................................. 2.7 129 Algeria ....................................... 2.7 130 Haiti ........................................... 2.6 131 Mozambique .............................. 2.6 132 Brazil .......................................... 2.6 133 El Salvador................................. 2.5 134 Sierra Leone .............................. 2.5 135 Libya .......................................... 2.4 136 Timor-Leste ............................... 2.4 137 Guatemala ................................. 2.4 138 Honduras ................................... 2.3 139 Egypt ......................................... 2.3 140 Paraguay ................................... 2.2 141 Peru ........................................... 2.1 142 Dominican Republic ................... 2.1 143 South Africa ............................... 2.0 144 Yemen ....................................... 1.9
5.02 Quality of math and science educationHow would you assess the quality of math and science education in your country’s schools? [1 = poor; 7 = excellent—among the best in the world] | 2011–2012 weighted average
SOURCE: World Economic Forum, Executive Opinion Survey, 2011 and 2012 editions
@ 2013 World Economic Forum
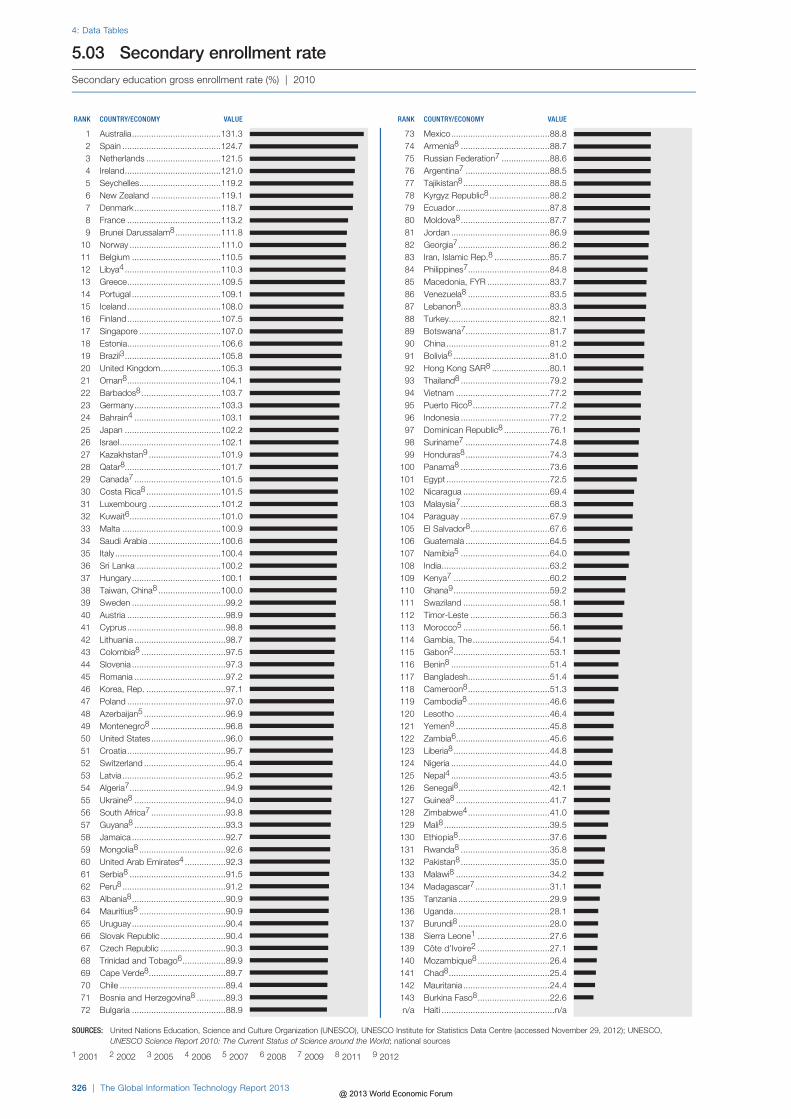
326 | The Global Information Technology Report 2013
4: Data Tables
RANK COUNTRY/ECONOMY VALUE
1 Australia .....................................131.32 Spain .........................................124.73 Netherlands ...............................121.54 Ireland ........................................121.05 Seychelles ..................................119.26 New Zealand .............................119.17 Denmark ....................................118.78 France .......................................113.29 Brunei Darussalam8 ...................111.8
10 Norway ......................................111.011 Belgium .....................................110.512 Libya4 ........................................110.313 Greece .......................................109.514 Portugal .....................................109.115 Iceland .......................................108.016 Finland .......................................107.517 Singapore ..................................107.018 Estonia .......................................106.619 Brazil3 ........................................105.820 United Kingdom .........................105.321 Oman8 .......................................104.122 Barbados8 .................................103.723 Germany ....................................103.324 Bahrain4 ....................................103.125 Japan ........................................102.226 Israel ..........................................102.127 Kazakhstan9 ..............................101.928 Qatar8........................................101.729 Canada7 ....................................101.530 Costa Rica8 ...............................101.531 Luxembourg ..............................101.232 Kuwait6 ......................................101.033 Malta .........................................100.934 Saudi Arabia ..............................100.635 Italy ............................................100.436 Sri Lanka ...................................100.237 Hungary .....................................100.138 Taiwan, China8 ..........................100.039 Sweden .......................................99.240 Austria .........................................98.941 Cyprus .........................................98.842 Lithuania ......................................98.743 Colombia8 ...................................97.544 Slovenia .......................................97.345 Romania ......................................97.246 Korea, Rep. .................................97.147 Poland .........................................97.048 Azerbaijan5 ..................................96.949 Montenegro8 ...............................96.850 United States ...............................96.051 Croatia .........................................95.752 Switzerland ..................................95.453 Latvia ...........................................95.254 Algeria7 ........................................94.955 Ukraine8 ......................................94.056 South Africa7 ...............................93.857 Guyana8 ......................................93.358 Jamaica .......................................92.759 Mongolia8 ....................................92.660 United Arab Emirates4 .................92.361 Serbia8 ........................................91.562 Peru8 ...........................................91.263 Albania8 .......................................90.964 Mauritius8 ....................................90.965 Uruguay .......................................90.466 Slovak Republic ...........................90.467 Czech Republic ...........................90.368 Trinidad and Tobago6 ..................89.969 Cape Verde8 ................................89.770 Chile ............................................89.471 Bosnia and Herzegovina8 ............89.372 Bulgaria .......................................88.9
RANK COUNTRY/ECONOMY VALUE
73 Mexico .........................................88.8 74 Armenia8 .....................................88.7 75 Russian Federation7 ....................88.6 76 Argentina7 ...................................88.5 77 Tajikistan8 ....................................88.5 78 Kyrgyz Republic8 .........................88.2 79 Ecuador .......................................87.8 80 Moldova8 .....................................87.7 81 Jordan .........................................86.9 82 Georgia7 ......................................86.2 83 Iran, Islamic Rep.8 .......................85.7 84 Philippines7 ..................................84.8 85 Macedonia, FYR ..........................83.7 86 Venezuela8 ..................................83.5 87 Lebanon8.....................................83.3 88 Turkey ..........................................82.1 89 Botswana7 ...................................81.7 90 China ...........................................81.2 91 Bolivia6 ........................................81.0 92 Hong Kong SAR8 ........................80.1 93 Thailand8 .....................................79.2 94 Vietnam .......................................77.2 95 Puerto Rico8 ................................77.2 96 Indonesia .....................................77.2 97 Dominican Republic8 ...................76.1 98 Suriname7 ...................................74.8 99 Honduras8 ...................................74.3 100 Panama8 .....................................73.6 101 Egypt ...........................................72.5 102 Nicaragua ....................................69.4 103 Malaysia7 .....................................68.3 104 Paraguay .....................................67.9 105 El Salvador8 .................................67.6 106 Guatemala ...................................64.5 107 Namibia5 .....................................64.0 108 India .............................................63.2 109 Kenya7 ........................................60.2 110 Ghana9 ........................................59.2 111 Swaziland ....................................58.1 112 Timor-Leste .................................56.3 113 Morocco5 ....................................56.1 114 Gambia, The ................................54.1 115 Gabon2 ........................................53.1 116 Benin8 .........................................51.4 117 Bangladesh ..................................51.4 118 Cameroon8 ..................................51.3 119 Cambodia8 ..................................46.6 120 Lesotho .......................................46.4 121 Yemen8 .......................................45.8 122 Zambia6 .......................................45.6 123 Liberia8 ........................................44.8 124 Nigeria .........................................44.0 125 Nepal4 .........................................43.5 126 Senegal8 ......................................42.1 127 Guinea8 .......................................41.7 128 Zimbabwe4 ..................................41.0 129 Mali8 ............................................39.5 130 Ethiopia8 ......................................37.6 131 Rwanda8 .....................................35.8 132 Pakistan8 .....................................35.0 133 Malawi8 .......................................34.2 134 Madagascar7 ...............................31.1 135 Tanzania ......................................29.9 136 Uganda ........................................28.1 137 Burundi8 ......................................28.0 138 Sierra Leone1 ..............................27.6 139 Côte d’Ivoire2 ..............................27.1 140 Mozambique8 ..............................26.4 141 Chad8 ..........................................25.4 142 Mauritania ....................................24.4 143 Burkina Faso8 ..............................22.6 n/a Haiti ...............................................n/a
5.03 Secondary enrollment rateSecondary education gross enrollment rate (%) | 2010
SOURCES: United Nations Education, Science and Culture Organization (UNESCO), UNESCO Institute for Statistics Data Centre (accessed November 29, 2012); UNESCO, UNESCO Science Report 2010: The Current Status of Science around the World; national sources
1 2001 2 2002 3 2005 4 2006 5 2007 6 2008 7 2009 8 2011 9 2012
@ 2013 World Economic Forum

The Global Information Technology Report 2013 | 327
4: Data Tables
RANK COUNTRY/ECONOMY VALUE
1 Estonia .........................................99.8 2 Latvia ...........................................99.8 3 Azerbaijan5 ..................................99.8 4 Georgia ........................................99.7 5 Ukraine ........................................99.7 6 Lithuania ......................................99.7 7 Kazakhstan ..................................99.7 8 Tajikistan ......................................99.7 9 Slovenia .......................................99.7 10 Russian Federation ......................99.6 11 Armenia .......................................99.6 12 Poland .........................................99.5 13 Kyrgyz Republic5 .........................99.2 14 Hungary .......................................99.0 15 Australia*......................................99.0 15 Austria* ........................................99.0 15 Belgium* ......................................99.0 15 Canada* .......................................99.0 15 Czech Republic* ..........................99.0 15 Denmark* .....................................99.0 15 Finland* ........................................99.0 15 France* ........................................99.0 15 Germany* .....................................99.0 15 Iceland* ........................................99.0 15 Ireland* ........................................99.0 15 Israel* ...........................................99.0 15 Japan* .........................................99.0 15 Korea, Rep.* ................................99.0 15 Luxembourg* ...............................99.0 15 Netherlands* ................................99.0 15 New Zealand* ..............................99.0 15 Norway* .......................................99.0 15 Slovak Republic* ..........................99.0 15 Sweden* ......................................99.0 15 Switzerland* .................................99.0 15 United Kingdom*..........................99.0 15 United States* ..............................99.0 38 Italy ..............................................98.9 39 Croatia .........................................98.8 40 Trinidad and Tobago ....................98.8 41 Chile5 ..........................................98.6 42 Moldova .......................................98.5 43 Montenegro .................................98.4 44 Bulgaria6 ......................................98.4 45 Cyprus .........................................98.3 46 Uruguay .......................................98.1 47 Taiwan, China6 ............................98.0 48 Serbia ..........................................97.9 49 Bosnia and Herzegovina ..............97.9 50 Argentina .....................................97.8 51 Spain ...........................................97.7 52 Romania ......................................97.7 53 Mongolia ......................................97.4 54 Macedonia, FYR ..........................97.3 55 Greece .........................................97.2 56 Qatar ...........................................96.3 57 Costa Rica ...................................96.2 58 Albania4 .......................................95.9 59 Singapore ....................................95.9 60 Venezuela5 ..................................95.5 61 Philippines4 ..................................95.4 62 Brunei Darussalam .......................95.2 63 Portugal .......................................95.2 64 Suriname .....................................94.7 65 China ...........................................94.3 66 Panama .......................................94.1 67 Kuwait4 ........................................93.9 68 Paraguay .....................................93.9 69 Thailand1 .....................................93.5 70 Colombia .....................................93.4 71 Vietnam .......................................93.2 72 Malaysia .......................................93.1
RANK COUNTRY/ECONOMY VALUE
73 Mexico .........................................93.1 74 Indonesia5 ...................................92.6 75 Jordan .........................................92.6 76 Malta1 ..........................................92.4 77 Zimbabwe ....................................92.2 78 Bahrain ........................................91.9 79 Ecuador .......................................91.9 80 Seychelles ....................................91.8 81 Sri Lanka .....................................91.2 82 Bolivia5 ........................................91.2 83 Turkey5 ........................................90.8 84 Puerto Rico ..................................90.4 85 Brazil5 ..........................................90.3 86 United Arab Emirates1 .................90.0 87 Lesotho .......................................89.6 88 Lebanon3.....................................89.6 89 Peru3 ...........................................89.6 90 Dominican Republic .....................89.5 91 Libya ............................................89.2 92 Namibia .......................................88.8 93 South Africa3 ...............................88.7 94 Mauritius ......................................88.5 95 Gabon .........................................88.4 96 Swaziland ....................................87.4 97 Kenya ..........................................87.4 98 Oman4 .........................................86.6 99 Jamaica .......................................86.6 100 Saudi Arabia ................................86.6 101 Iran, Islamic Rep.4 .......................85.0 102 Honduras .....................................84.8 103 El Salvador...................................84.5 104 Botswana ....................................84.5 105 Cape Verde .................................84.3 106 Nicaragua1 ..................................78.0 107 Guatemala ...................................75.2 108 Malawi .........................................74.8 109 Cambodia5 ..................................73.9 110 Uganda ........................................73.2 111 Tanzania ......................................73.2 112 Algeria2 ........................................72.6 113 Egypt ...........................................72.0 114 Zambia ........................................71.2 115 Rwanda .......................................71.1 116 Cameroon3 ..................................70.7 117 Ghana ..........................................67.3 118 Burundi ........................................67.2 119 Madagascar5 ...............................64.5 120 Yemen .........................................63.9 121 India2 ...........................................62.8 122 Nigeria .........................................61.3 123 Liberia ..........................................60.8 124 Nepal ...........................................60.3 125 Timor-Leste .................................58.3 126 Mauritania ....................................58.0 127 Bangladesh ..................................56.8 128 Côte d’Ivoire ................................56.2 129 Mozambique ................................56.1 130 Morocco5 ....................................56.1 131 Pakistan5 .....................................54.9 132 Gambia, The ................................50.0 133 Senegal5 ......................................49.7 134 Haiti2 ...........................................48.7 135 Benin ...........................................42.4 136 Sierra Leone ................................42.1 137 Guinea .........................................41.0 138 Ethiopia3 ......................................39.0 139 Chad ............................................34.5 140 Mali ..............................................31.1 141 Burkina Faso3 ..............................28.7 n/a Barbados .......................................n/a n/a Guyana ..........................................n/a n/a Hong Kong SAR ............................n/a
5.04 Adult literacy rateAdult literacy rate (%) | 2010
* Assumed valueSOURCES: United Nations Education, Science and Culture Organization (UNESCO), UNESCO Institute for Statistics Data Centre (accessed November 29, 2012); national
sources. See Technical Notes and Sources for details.
1 2005 2 2006 3 2007 4 2008 5 2009 6 2011
@ 2013 World Economic Forum

@ 2013 World Economic Forum
Data Tables
6th pillar Individual usage
@ 2013 World Economic Forum

330 | The Global Information Technology Report 2013
4: Data Tables
RANK COUNTRY/ECONOMY VALUE
1 Hong Kong SAR ........................214.72 Saudi Arabia ..............................191.23 Panama .....................................188.64 Montenegro1 .............................185.35 Russian Federation ....................179.36 Suriname ...................................178.97 Kuwait .......................................175.18 Oman ........................................169.09 Finland .......................................166.0
10 Italy ............................................157.911 Kazakhstan ................................155.712 Libya ..........................................155.713 Austria .......................................154.814 Lithuania ....................................151.315 Singapore ..................................150.216 United Arab Emirates .................148.617 Luxembourg ..............................148.318 Seychelles ..................................145.719 Vietnam .....................................143.420 Botswana ..................................142.821 Uruguay .....................................140.822 Bulgaria .....................................140.723 Guatemala .................................140.424 Estonia .......................................139.025 Trinidad and Tobago ..................135.626 Argentina ...................................134.927 El Salvador.................................133.528 Germany ....................................132.329 Switzerland ................................131.430 Poland .......................................131.031 United Kingdom .........................130.832 Chile ..........................................129.733 Denmark ....................................128.534 Bahrain ......................................128.035 Malaysia .....................................127.036 Barbados ...................................127.037 South Africa ...............................126.838 Serbia ........................................125.439 Malta .........................................124.940 Brazil ..........................................124.341 Taiwan, China ............................124.142 Czech Republic .........................123.443 Qatar .........................................123.144 Ukraine ......................................123.045 Israel ..........................................121.746 Sweden .....................................118.647 Jordan .......................................118.248 Gabon .......................................117.349 Hungary .....................................117.350 Belgium .....................................116.651 Kyrgyz Republic .........................116.452 Croatia .......................................116.453 Norway ......................................115.654 Netherlands1 .............................115.455 Portugal .....................................115.456 Morocco ....................................113.357 Spain .........................................113.258 Thailand .....................................111.659 Peru ...........................................110.460 Slovak Republic .........................109.361 New Zealand .............................109.262 Brunei Darussalam .....................109.263 Romania ....................................109.264 Azerbaijan ..................................108.765 Korea, Rep. ...............................108.566 Ireland ........................................108.467 Australia .....................................108.368 Jamaica .....................................108.169 Macedonia, FYR ........................107.270 Slovenia .....................................106.671 Greece .......................................106.572 Iceland .......................................106.1
RANK COUNTRY/ECONOMY VALUE
73 Mongolia ....................................105.1 74 Japan ........................................105.0 75 Moldova .....................................104.8 76 Ecuador .....................................104.5 77 Honduras ...................................104.0 78 Armenia .....................................103.6 79 Indonesia ...................................103.1 80 Latvia .........................................102.9 81 Georgia ......................................102.3 82 Egypt .........................................101.1 83 Paraguay .....................................99.4 84 Philippines ...................................99.3 85 Mauritius ......................................99.0 86 Algeria .........................................99.0 87 Colombia .....................................98.5 88 Venezuela ....................................97.8 89 Cyprus .........................................97.7 90 Albania .........................................96.4 91 Namibia .......................................96.4 92 Cambodia ....................................96.2 93 France .........................................94.8 94 Mauritania ....................................93.6 95 United States ...............................92.7 96 Costa Rica ...................................92.2 97 Tajikistan ......................................90.6 98 Turkey ..........................................88.7 99 Dominican Republic .....................87.2 100 Sri Lanka .....................................87.0 101 Côte d’Ivoire ................................86.1 102 Benin ...........................................85.3 103 Ghana ..........................................84.8 104 Bosnia and Herzegovina ..............84.5 105 Puerto Rico ..................................83.0 106 Bolivia ..........................................82.8 107 Mexico .........................................82.4 108 Nicaragua ....................................82.2 109 Canada ........................................79.7 110 Cape Verde .................................79.2 111 Gambia, The ................................78.9 112 Lebanon ......................................78.6 113 Iran, Islamic Rep. .........................74.9 114 Senegal .......................................73.3 115 China ...........................................73.2 116 Zimbabwe ....................................72.1 117 India .............................................72.0 118 Guyana ........................................69.9 119 Mali ..............................................68.3 120 Kenya ..........................................67.5 121 Swaziland ....................................63.7 122 Pakistan .......................................61.6 123 Zambia ........................................60.6 124 Nigeria .........................................58.6 125 Lesotho .......................................56.2 126 Bangladesh ..................................56.1 127 Tanzania ......................................55.5 128 Timor-Leste .................................53.2 129 Cameroon ....................................52.4 130 Liberia ..........................................49.2 131 Uganda ........................................48.4 132 Yemen .........................................47.0 133 Burkina Faso ................................45.3 134 Guinea .........................................44.0 135 Nepal ...........................................43.8 136 Haiti .............................................41.5 137 Madagascar .................................40.7 138 Rwanda .......................................40.6 139 Sierra Leone ................................35.6 140 Mozambique ................................32.8 141 Chad ............................................31.8 142 Malawi .........................................25.7 143 Burundi ........................................22.3 144 Ethiopia ........................................16.7
6.01 Mobile telephone subscriptionsMobile telephone subscriptions (post-paid and pre-paid) per 100 population | 2011
SOURCE: International Telecommunication Union (ITU), ITU World Telecommunication/ICT Indicators Database 2012 (December 2012 edition)
1 2010
@ 2013 World Economic Forum

The Global Information Technology Report 2013 | 331
4: Data Tables
RANK COUNTRY/ECONOMY VALUE
1 Iceland .........................................95.0 2 Norway ........................................94.0 3 Netherlands .................................92.3 4 Sweden .......................................91.0 5 Luxembourg ................................90.9 6 Denmark ......................................90.0 7 Finland .........................................89.4 8 Qatar ...........................................86.2 9 New Zealand ...............................86.0 10 Switzerland ..................................85.2 11 Korea, Rep. .................................83.8 12 Canada ........................................83.0 12 Germany ......................................83.0 14 United Kingdom ...........................82.0 15 Austria .........................................79.8 16 France .........................................79.6 17 Japan ..........................................79.5 18 Australia .......................................79.0 19 Belgium .......................................78.0 20 United States ...............................77.9 21 Bahrain ........................................77.0 22 Ireland ..........................................76.8 23 Estonia .........................................76.5 24 Hong Kong SAR ..........................74.5 25 Slovak Republic ...........................74.4 26 Kuwait .........................................74.2 27 Czech Republic ...........................73.0 28 Slovenia .......................................72.0 28 Taiwan, China ..............................72.0 30 Barbados .....................................71.8 31 Latvia ...........................................71.7 32 Singapore ....................................71.0 33 Croatia .........................................70.7 34 Israel ............................................70.0 34 United Arab Emirates ...................70.0 36 Malta ...........................................69.2 37 Oman ..........................................68.0 38 Spain ...........................................67.6 39 Lithuania ......................................65.1 40 Poland .........................................64.9 41 Malaysia .......................................61.0 42 Bosnia and Herzegovina ..............60.0 43 Hungary .......................................59.0 44 Cyprus .........................................57.7 45 Italy ..............................................56.8 46 Macedonia, FYR ..........................56.7 47 Brunei Darussalam .......................56.0 48 Portugal .......................................55.3 49 Trinidad and Tobago ....................55.2 50 Chile ............................................53.9 51 Greece .........................................53.0 52 Lebanon ......................................52.0 53 Uruguay .......................................51.4 54 Bulgaria .......................................51.0 54 Morocco ......................................51.0 56 Azerbaijan ....................................50.0 57 Albania .........................................49.0 57 Russian Federation ......................49.0 59 Puerto Rico ..................................48.0 60 Argentina .....................................47.7 61 Saudi Arabia ................................47.5 62 Brazil ............................................45.0 62 Kazakhstan ..................................45.0 64 Romania ......................................44.0 65 Seychelles ....................................43.2 66 Panama .......................................42.7 67 Serbia ..........................................42.2 68 Costa Rica ...................................42.1 69 Turkey ..........................................42.1 70 Colombia .....................................40.4 71 Venezuela ....................................40.2 72 Montenegro .................................40.0
RANK COUNTRY/ECONOMY VALUE
73 Egypt ...........................................38.7 74 China ...........................................38.3 75 Moldova .......................................38.0 76 Georgia ........................................36.6 77 Peru .............................................36.5 78 Mexico .........................................36.2 79 Dominican Republic .....................35.5 80 Vietnam .......................................35.1 81 Mauritius ......................................35.0 82 Jordan .........................................34.9 83 Armenia .......................................32.0 83 Cape Verde .................................32.0 83 Guyana ........................................32.0 83 Suriname .....................................32.0 87 Jamaica .......................................31.5 88 Ecuador .......................................31.4 89 Ukraine ........................................30.6 90 Bolivia ..........................................30.0 91 Philippines ...................................29.0 92 Nigeria .........................................28.4 93 Kenya ..........................................28.0 94 Paraguay .....................................23.9 95 Thailand .......................................23.7 96 Iran, Islamic Rep. .........................21.0 96 South Africa .................................21.0 98 Kyrgyz Republic ...........................20.0 98 Mongolia ......................................20.0 100 Swaziland ....................................18.1 101 Indonesia .....................................18.0 102 El Salvador...................................17.7 103 Senegal .......................................17.5 104 Libya ............................................17.0 105 Honduras .....................................15.9 106 Zimbabwe ....................................15.7 107 Sri Lanka .....................................15.0 108 Yemen .........................................14.9 109 Ghana ..........................................14.1 110 Algeria .........................................14.0 111 Tajikistan ......................................13.0 112 Uganda ........................................13.0 113 Namibia .......................................12.0 113 Tanzania ......................................12.0 115 Guatemala ...................................11.7 116 Zambia ........................................11.5 117 Gambia, The ................................10.9 118 Nicaragua ....................................10.6 119 India .............................................10.1 120 Nepal .............................................9.0 120 Pakistan .........................................9.0 122 Haiti2 .............................................8.4 123 Gabon ...........................................8.0 124 Botswana ......................................7.0 124 Rwanda .........................................7.0 126 Bangladesh ....................................5.0 126 Cameroon ......................................5.0 128 Mauritania ......................................4.5 129 Mozambique ..................................4.3 130 Lesotho .........................................4.2 131 Benin .............................................3.5 132 Malawi ...........................................3.3 133 Cambodia ......................................3.1 134 Burkina Faso ..................................3.0 134 Liberia ............................................3.0 136 Côte d’Ivoire ..................................2.2 137 Mali ................................................2.0 138 Chad ..............................................1.9 138 Madagascar ...................................1.9 140 Guinea ...........................................1.3 141 Burundi ..........................................1.1 142 Ethiopia ..........................................1.1 143 Timor-Leste ...................................0.9 144 Sierra Leone1 ................................0.3
6.02 Internet usersPercentage of individuals using the Internet | 2011
SOURCE: International Telecommunication Union (ITU), ITU World Telecommunication/ICT Indicators Database 2012 (December 2012 edition)
1 2009 2 2010
@ 2013 World Economic Forum

332 | The Global Information Technology Report 2013
4: Data Tables
RANK COUNTRY/ECONOMY VALUE
1 Iceland6 .......................................94.72 Netherlands6 ...............................94.23 Luxembourg6...............................91.74 Sweden6 .....................................91.65 Norway6 ......................................91.06 Denmark6 ....................................90.47 Bahrain6 ......................................90.08 Qatar6..........................................88.39 Taiwan, China6 ............................87.5
10 Germany6 ....................................86.911 Switzerland ..................................86.912 Singapore6 ..................................86.113 Finland6 .......................................85.114 United Kingdom6 .........................84.615 Canada ........................................83.916 New Zealand ...............................83.917 Japan ..........................................83.418 Australia6 .....................................82.619 Korea, Rep.6 ...............................81.920 Ireland6 ........................................80.621 Brunei Darussalam .......................79.622 Israel6 ..........................................79.023 Belgium6 ......................................78.924 France6........................................78.225 Austria6 .......................................78.126 Hong Kong SAR ..........................77.927 Malta6 ..........................................76.428 United Arab Emirates ...................76.029 United States ...............................75.530 Slovak Republic6 .........................75.431 Slovenia6 .....................................74.432 Spain6 .........................................71.533 Lebanon6.....................................71.534 Estonia6 .......................................71.435 Poland6 .......................................71.336 Czech Republic6 ..........................69.937 Hungary6 .....................................69.738 Kuwait6 ........................................69.039 Italy6 ............................................66.240 Latvia6 .........................................64.341 Malaysia6 .....................................64.142 Cyprus6 .......................................63.943 Portugal6 .....................................63.744 Lithuania6 ....................................61.845 Barbados .....................................61.446 Croatia .........................................60.047 Oman6 .........................................58.048 Saudi Arabia ................................57.349 Greece6 .......................................57.250 Russian Federation6 ....................57.151 Puerto Rico ..................................55.052 Macedonia, FYR ..........................53.653 Trinidad and Tobago ....................53.154 Uruguay .......................................52.855 Romania6 ....................................51.256 Serbia ..........................................50.957 Jordan6 .......................................50.858 Turkey6 ........................................48.559 Argentina .....................................47.060 Chile ............................................46.861 Bulgaria6 ......................................46.862 Montenegro6 ...............................46.663 Kazakhstan ..................................46.064 Brazil6 ..........................................45.465 Costa Rica6 .................................45.366 Seychelles6 ..................................45.067 Morocco6 ....................................39.068 Mauritius6 ....................................38.269 Moldova .......................................36.970 Egypt6 .........................................36.471 China ...........................................35.472 Iran, Islamic Rep. .........................33.7
RANK COUNTRY/ECONOMY VALUE
73 Bosnia and Herzegovina ..............33.7 74 Suriname6 ...................................32.3 75 Mexico6 .......................................30.0 76 Colombia6 ...................................29.9 77 Panama6 .....................................29.0 78 Ecuador6 .....................................28.8 79 Bolivia6 ........................................27.0 80 Ukraine ........................................25.2 81 Thailand6 .....................................24.7 82 Peru .............................................23.0 83 Paraguay6....................................22.7 84 Jamaica .......................................22.7 85 Mongolia ......................................22.3 86 Azerbaijan ....................................21.5 87 Algeria .........................................20.0 87 Armenia .......................................20.0 89 Dominican Republic6 ...................18.9 90 South Africa .................................18.3 91 Georgia ........................................18.2 92 Venezuela ....................................17.3 93 Vietnam6 ......................................16.0 94 Guatemala ...................................15.8 95 Albania .........................................15.6 96 El Salvador...................................13.3 97 Philippines ...................................13.1 98 Namibia6 .....................................13.0 99 Honduras .....................................12.9 100 Sri Lanka .....................................12.3 101 Indonesia6 ...................................12.0 102 Cape Verde .................................11.3 103 Swaziland ....................................10.7 104 Nigeria6 .........................................9.3 105 Ghana ............................................9.1 106 Nicaragua ......................................8.2 107 Pakistan3 .......................................8.1 108 Gabon ...........................................7.6 109 Libya2 ............................................7.6 110 Guyana ..........................................7.2 111 Botswana ......................................6.5 112 India ...............................................6.1 113 Zimbabwe6 ....................................5.9 114 Haiti ...............................................5.9 115 Gambia, The ..................................5.7 116 Senegal .........................................5.7 117 Cameroon ......................................5.4 118 Lesotho .........................................5.0 119 Malawi ...........................................4.5 120 Cambodia ......................................4.3 121 Nepal .............................................4.2 122 Kenya ............................................4.1 123 Mozambique4 ................................4.0 123 Tanzania6 ......................................4.0 125 Kyrgyz Republic .............................4.0 126 Yemen ...........................................4.0 127 Bangladesh ....................................3.1 128 Mali ................................................3.0 129 Mauritania ......................................3.0 130 Tajikistan ........................................2.9 131 Burundi5 ........................................2.6 132 Benin .............................................2.5 133 Zambia ..........................................2.4 134 Burkina Faso ..................................2.1 135 Côte d’Ivoire ..................................1.8 136 Guinea ...........................................1.5 137 Ethiopia ..........................................1.4 138 Madagascar ...................................1.4 139 Rwanda .........................................1.3 140 Uganda3 ........................................1.2 141 Liberia5 ..........................................1.0 142 Sierra Leone1 ................................0.8 143 Chad4 ............................................0.4 n/a Timor-Leste ...................................n/a
6.03 Households with a personal computerPercentage of households equipped with a personal computer | 2010
SOURCES: International Telecommunication Union (ITU), ITU World Telecommunication/ICT Indicators Database 2012 (December 2012 edition) and ITU World Telecommunication/ICT Indicators Database 2011 (December 2011 edition); national sources
1 2005 2 2006 3 2007 4 2008 5 2009 6 2011
@ 2013 World Economic Forum

The Global Information Technology Report 2013 | 333
4: Data Tables
RANK COUNTRY/ECONOMY VALUE
1 Korea, Rep. .................................97.2 2 Netherlands .................................93.6 3 Iceland .........................................92.6 4 Norway ........................................92.2 5 Sweden .......................................90.6 6 Luxembourg ................................90.6 7 Denmark ......................................90.1 8 United Kingdom ...........................85.1 9 Switzerland5 ................................85.0 10 Singapore ....................................84.8 11 Finland .........................................84.2 12 Qatar ...........................................83.6 13 Germany ......................................83.3 14 Taiwan, China ..............................82.5 15 Japan5 .........................................81.3 16 New Zealand5 ..............................79.0 17 Australia .......................................78.9 17 Canada5 ......................................78.9 19 Ireland ..........................................78.1 20 Bahrain ........................................76.8 21 Belgium .......................................76.5 22 Hong Kong SAR5 ........................76.4 23 France .........................................75.9 24 Austria .........................................75.4 25 Malta ...........................................75.3 26 Slovenia .......................................72.6 27 United States5 .............................71.6 28 Israel ............................................71.0 29 Estonia .........................................70.8 29 Slovak Republic ...........................70.8 31 United Arab Emirates ...................67.0 32 Poland .........................................66.6 33 Czech Republic ...........................66.6 34 Hungary .......................................65.2 35 Brunei Darussalam5 .....................65.0 36 Spain ...........................................63.9 37 Latvia ...........................................63.6 38 Lithuania ......................................61.8 39 Lebanon ......................................61.8 40 Italy ..............................................61.6 41 Croatia .........................................61.4 42 Malaysia .......................................61.4 43 Portugal .......................................58.0 44 Kuwait .........................................57.7 45 Cyprus .........................................57.4 46 Saudi Arabia5 ..............................54.4 47 Montenegro .................................51.4 48 Barbados5 ...................................51.0 49 Greece .........................................50.2 50 Puerto Rico5 ................................50.0 51 Romania ......................................47.4 52 Macedonia, FYR5 ........................46.1 53 Russian Federation ......................46.0 54 Bulgaria .......................................45.0 55 Kazakhstan5 ................................44.0 56 Turkey ..........................................42.9 57 Serbia5 ........................................40.2 58 Oman ..........................................38.9 59 Brazil ............................................37.8 60 Mauritius ......................................36.4 61 Jordan .........................................35.4 62 Azerbaijan5 ..................................35.3 62 Morocco ......................................35.3 64 Chile5 ..........................................35.0 65 Moldova5 .....................................34.7 66 Argentina5 ...................................34.0 66 Seychelles ....................................34.0 68 Costa Rica ...................................33.6 69 Uruguay5 .....................................33.3 70 Egypt ...........................................30.5 71 China5 .........................................23.7 72 Colombia .....................................23.4
RANK COUNTRY/ECONOMY VALUE
73 Mexico .........................................23.3 74 Bosnia and Herzegovina5 ............23.0 75 Ukraine5 ......................................22.2 76 Iran, Islamic Rep.5 .......................20.8 77 Panama .......................................20.7 78 Paraguay .....................................19.3 79 Trinidad and Tobago3 ..................18.6 80 Suriname .....................................17.5 81 Ecuador .......................................16.9 82 Georgia5 ......................................16.6 83 Peru5 ...........................................14.0 84 Jamaica5 .....................................14.0 85 Albania5 .......................................13.7 86 Armenia5 .....................................13.6 87 Thailand .......................................13.4 88 Vietnam5 ......................................12.5 89 Dominican Republic .....................11.8 90 Venezuela5 ..................................11.0 91 Philippines5 ..................................10.1 92 Algeria5 ........................................10.0 93 Namibia .......................................10.0 94 South Africa ...................................9.8 95 Bolivia ............................................9.4 96 Libya5 ............................................9.2 97 El Salvador5 ...................................8.0 98 Pakistan5 .......................................8.0 99 Mongolia5 ......................................7.7 100 Indonesia .......................................7.0 101 Honduras5 .....................................6.8 102 Guyana5 ........................................6.1 103 Gabon5 ..........................................6.0 104 Sri Lanka5......................................5.9 105 Nigeria ...........................................4.6 106 Senegal5 ........................................4.5 106 Tanzania ........................................4.5 108 India5 .............................................4.2 109 Zimbabwe ......................................4.0 110 Swaziland5 ....................................3.6 111 Kyrgyz Republic5 ...........................3.6 112 Rwanda5 .......................................3.2 113 Yemen5 .........................................2.9 114 Malawi5 .........................................2.9 115 Burundi4 ........................................2.7 116 Haiti5 .............................................2.7 117 Bangladesh5 ..................................2.6 118 Cape Verde3 ..................................2.5 119 Kenya2 ..........................................2.2 120 Guatemala1 ...................................2.1 121 Zambia5 .........................................2.0 122 Botswana3 .....................................2.0 122 Burkina Faso5 ................................2.0 122 Gambia, The3 ................................2.0 125 Nicaragua4 ....................................2.0 126 Cameroon3 ....................................1.3 126 Lesotho5 ........................................1.3 128 Mali5 ..............................................1.2 129 Côte d’Ivoire5 ................................1.1 130 Guinea5 .........................................1.0 130 Mauritania3 ....................................1.0 132 Nepal3 ...........................................1.0 133 Mozambique2 ................................0.9 134 Madagascar3 .................................0.7 135 Ghana2 ..........................................0.3 136 Cambodia3 ....................................0.2 137 Tajikistan5 ......................................0.2 138 Uganda3 ........................................0.2 139 Chad3 ............................................0.1 140 Ethiopia2 ........................................0.1 n/a Benin .............................................n/a n/a Liberia ............................................n/a n/a Sierra Leone ..................................n/a n/a Timor-Leste ...................................n/a
6.04 Households with Internet accessPercentage of households with Internet access at home | 2011
SOURCES: International Telecommunication Union (ITU), ITU World Telecommunication/ICT Indicators Database 2012 (December 2012 edition) and ITU World Telecommunication/ICT Indicators Database 2011 (December 2011 edition); national sources
1 2006 2 2007 3 2008 4 2009 5 2010
@ 2013 World Economic Forum

334 | The Global Information Technology Report 2013
4: Data Tables
RANK COUNTRY/ECONOMY VALUE
1 Switzerland ..................................40.02 Netherlands .................................38.73 Denmark ......................................37.64 Korea, Rep. .................................36.95 France .........................................36.06 Norway ........................................35.47 Iceland .........................................33.98 Germany ......................................33.19 Belgium .......................................33.0
10 Luxembourg ................................32.911 United Kingdom ...........................32.712 Canada ........................................31.813 Sweden .......................................31.814 Hong Kong SAR ..........................31.615 Malta ...........................................30.916 Finland .........................................29.517 Japan ..........................................27.618 United States ...............................27.419 New Zealand ...............................25.820 Singapore ....................................25.621 Austria .........................................25.422 Israel ............................................24.823 Estonia .........................................24.824 Slovenia .......................................24.325 Australia .......................................24.326 Spain ...........................................23.827 Taiwan, China ..............................23.728 Hungary .......................................22.229 Barbados .....................................22.130 Lithuania ......................................22.131 Italy ..............................................22.132 Ireland ..........................................22.033 Greece .........................................21.634 Portugal .......................................21.035 Latvia ...........................................20.436 Croatia .........................................19.637 Cyprus .........................................18.938 Bulgaria .......................................16.439 Czech Republic ...........................15.840 Romania ......................................15.241 Puerto Rico ..................................14.942 Poland .........................................14.743 Bahrain ........................................13.844 Slovak Republic ...........................13.645 Uruguay .......................................13.546 Russian Federation ......................13.147 Macedonia, FYR ..........................12.648 China ...........................................11.649 Chile ............................................11.650 Trinidad and Tobago ....................11.551 Serbia ..........................................11.352 United Arab Emirates ...................11.053 Azerbaijan ....................................10.754 Argentina .....................................10.555 Seychelles ....................................10.456 Turkey ..........................................10.357 Mexico .........................................10.258 Moldova .......................................10.059 Bosnia and Herzegovina ................9.760 Mauritius ........................................8.961 Costa Rica .....................................8.762 Qatar .............................................8.763 Brazil ..............................................8.664 Montenegro2 .................................8.365 Panama .........................................7.966 Georgia ..........................................7.567 Malaysia .........................................7.468 Kazakhstan ....................................7.469 Ukraine ..........................................7.070 Colombia .......................................6.971 Venezuela ......................................6.272 Brunei Darussalam .........................5.7
RANK COUNTRY/ECONOMY VALUE
73 Saudi Arabia ..................................5.6 74 Lebanon ........................................5.2 75 Thailand .........................................5.0 76 Armenia .........................................5.0 77 Suriname .......................................4.6 78 Cape Verde ...................................4.3 79 Vietnam .........................................4.3 80 Ecuador .........................................4.2 81 Peru ...............................................4.0 82 Dominican Republic .......................4.0 83 Albania ...........................................4.0 84 Jamaica .........................................3.9 85 El Salvador.....................................3.3 86 Mongolia ........................................3.2 87 Jordan ...........................................3.2 88 Algeria ...........................................2.8 89 Guyana ..........................................2.6 90 Iran, Islamic Rep. ...........................2.4 91 Egypt .............................................2.2 92 Philippines .....................................1.9 93 Oman ............................................1.8 94 Morocco ........................................1.8 95 Guatemala2 ...................................1.8 96 South Africa ...................................1.8 97 Sri Lanka .......................................1.7 98 Kuwait2 ..........................................1.7 99 Nicaragua ......................................1.4 100 Indonesia .......................................1.1 101 Libya ..............................................1.1 102 India ...............................................1.1 103 Paraguay .......................................0.9 104 Namibia .........................................0.8 105 Botswana ......................................0.8 106 Senegal .........................................0.7 107 Kyrgyz Republic .............................0.7 108 Bolivia ............................................0.7 109 Yemen ...........................................0.4 110 Honduras .......................................0.4 111 Pakistan .........................................0.4 112 Bangladesh ....................................0.3 113 Nepal .............................................0.3 114 Gabon ...........................................0.3 115 Zimbabwe ......................................0.3 116 Ghana ............................................0.3 117 Côte d’Ivoire ..................................0.2 118 Swaziland ......................................0.2 119 Mauritania ......................................0.2 120 Cambodia ......................................0.2 121 Nigeria ...........................................0.1 122 Uganda ..........................................0.1 123 Kenya ............................................0.1 124 Burkina Faso ..................................0.1 125 Tajikistan ........................................0.1 126 Mozambique ..................................0.1 127 Malawi ...........................................0.1 128 Lesotho .........................................0.1 129 Zambia ..........................................0.1 130 Timor-Leste ...................................0.0 131 Benin .............................................0.0 132 Rwanda .........................................0.0 133 Madagascar ...................................0.0 134 Gambia, The ..................................0.0 135 Mali ................................................0.0 136 Tanzania ........................................0.0 137 Guinea ...........................................0.0 138 Cameroon ......................................0.0 139 Ethiopia ..........................................0.0 140 Burundi2 ........................................0.0 141 Liberia ............................................0.0 142 Chad ..............................................0.0 143 Haiti ...............................................0.0 143 Sierra Leone1 ................................0.0
6.05 Fixed broadband Internet subscriptionsFixed broadband Internet subscriptions per 100 population | 2011
SOURCE: International Telecommunication Union (ITU), ITU World Telecommunication/ICT Indicators Database 2012 (December 2012 edition)
1 2007 2 2010
@ 2013 World Economic Forum

The Global Information Technology Report 2013 | 335
4: Data Tables
RANK COUNTRY/ECONOMY VALUE
1 Singapore ..................................114.1 2 Korea, Rep. ...............................105.1 3 Japan ........................................101.3 4 Sweden .......................................91.5 5 Finland .........................................87.1 6 Denmark ......................................80.2 7 Barbados .....................................77.1 8 Norway ........................................76.5 9 United States ...............................74.5 10 Australia .......................................73.0 11 Qatar ...........................................70.3 12 Luxembourg ................................66.7 13 Ireland ..........................................59.4 14 Iceland .........................................57.0 15 Hong Kong SAR ..........................55.2 16 New Zealand ...............................53.1 17 United Kingdom ...........................52.6 18 Poland .........................................49.6 19 Netherlands .................................49.2 20 Russian Federation ......................47.9 21 Czech Republic ...........................43.4 22 Taiwan, China ..............................42.7 23 Austria .........................................42.6 24 Estonia .........................................42.0 25 Spain ...........................................41.6 26 Israel ............................................40.6 27 Saudi Arabia ................................40.4 28 Greece .........................................39.9 29 Kazakhstan ..................................38.4 30 Canada ........................................38.4 31 Oman ..........................................37.8 32 Latvia ...........................................37.6 33 France1........................................36.6 34 Switzerland ..................................35.6 35 Croatia .........................................34.9 36 Germany ......................................34.8 37 Serbia ..........................................34.5 38 Italy ..............................................33.3 39 Malta ...........................................32.6 40 Slovak Republic ...........................31.9 41 Cyprus .........................................30.8 42 Bulgaria .......................................29.9 43 Slovenia .......................................29.3 44 Portugal .......................................27.4 45 Armenia .......................................25.9 46 Egypt ...........................................24.0 47 Ghana ..........................................23.0 48 Indonesia .....................................22.2 49 United Arab Emirates ...................21.7 50 Azerbaijan ....................................21.5 51 Uruguay .......................................21.5 52 Georgia ........................................21.3 53 Brazil ............................................20.9 54 Namibia .......................................20.9 55 South Africa .................................19.8 56 Belgium .......................................19.4 57 Macedonia, FYR ..........................18.1 58 Vietnam .......................................18.0 59 Chile ............................................18.0 60 Mongolia ......................................17.3 61 Lithuania ......................................17.2 62 Venezuela ....................................16.1 63 Montenegro .................................15.3 64 Zimbabwe ....................................14.9 65 Puerto Rico ..................................14.7 66 Panama .......................................14.5 67 Romania ......................................14.1 68 Mauritius ......................................12.5 69 Malaysia .......................................12.3 70 Hungary .......................................11.9 71 Botswana ....................................11.8 72 Argentina .....................................11.7
RANK COUNTRY/ECONOMY VALUE
73 Ecuador .......................................10.3 74 Nigeria .........................................10.0 75 Bahrain ..........................................9.5 76 China .............................................9.5 77 Bosnia and Herzegovina ................9.2 78 Albania ...........................................8.8 79 Turkey ............................................8.8 80 Morocco ........................................8.0 81 Dominican Republic .......................7.7 82 Mexico ...........................................6.5 83 Brunei Darussalam .........................6.3 84 Jordan ...........................................4.9 85 Mauritania ......................................4.9 86 Seychelles ......................................4.7 87 Ukraine ..........................................4.4 88 Paraguay .......................................4.4 89 Guatemala .....................................4.1 90 Colombia .......................................3.7 91 Honduras .......................................3.7 92 El Salvador.....................................3.6 93 Moldova .........................................3.5 94 Philippines .....................................3.4 95 Malawi ...........................................3.1 96 Cape Verde ...................................3.0 97 Uganda ..........................................2.8 98 Bolivia ............................................2.8 99 Sri Lanka .......................................2.3 100 Cambodia ......................................2.2 101 Costa Rica .....................................2.0 102 India ...............................................1.9 103 Lesotho1 ........................................1.7 104 Jamaica .........................................1.5 105 Senegal .........................................1.5 106 Peru ...............................................1.4 107 Tanzania ........................................1.2 108 Trinidad and Tobago ......................1.2 109 Mozambique ..................................1.0 110 Rwanda .........................................1.0 111 Nicaragua ......................................0.8 112 Swaziland ......................................0.7 113 Gambia, The ..................................0.5 114 Ethiopia ..........................................0.3 115 Mali ................................................0.3 116 Kenya ............................................0.3 117 Zambia ..........................................0.2 118 Pakistan .........................................0.2 119 Thailand .........................................0.1 120 Yemen ...........................................0.1 121 Nepal1 ...........................................0.1 122 Madagascar ...................................0.1 123 Lebanon ........................................0.0 124 Bangladesh ....................................0.0 125 Liberia ............................................0.0 126 Algeria ...........................................0.0 126 Benin .............................................0.0 126 Burkina Faso ..................................0.0 126 Burundi ..........................................0.0 126 Cameroon ......................................0.0 126 Chad ..............................................0.0 126 Côte d’Ivoire ..................................0.0 126 Gabon ...........................................0.0 126 Guinea ...........................................0.0 126 Guyana ..........................................0.0 126 Haiti ...............................................0.0 126 Iran, Islamic Rep. ...........................0.0 126 Suriname .......................................0.0 126 Timor-Leste ...................................0.0 n/a Kuwait ...........................................n/a n/a Kyrgyz Republic .............................n/a n/a Libya ..............................................n/a n/a Sierra Leone ..................................n/a n/a Tajikistan ........................................n/a
6.06 Mobile broadband Internet subscriptionsMobile broadband Internet subscriptions per 100 population | 2011
SOURCE: International Telecommunication Union (ITU), ITU World Telecommunication/ICT Indicators Database 2012 (December 2012 edition)
1 2010
@ 2013 World Economic Forum

336 | The Global Information Technology Report 2013
4: Data Tables
RANK COUNTRY/ECONOMY VALUE 1 MEAN: 5.3 7
1 Iceland ....................................... 6.62 United Kingdom ......................... 6.63 Netherlands ............................... 6.44 Malta ......................................... 6.45 Sweden ..................................... 6.46 Norway ...................................... 6.47 Estonia ....................................... 6.48 Finland ....................................... 6.39 Puerto Rico ................................ 6.3
10 Canada ...................................... 6.311 Qatar ......................................... 6.312 Hong Kong SAR ........................ 6.213 New Zealand ............................. 6.214 Switzerland ................................ 6.215 Bahrain ...................................... 6.216 United States ............................. 6.217 Australia ..................................... 6.218 Singapore .................................. 6.219 Belgium ..................................... 6.220 Austria ....................................... 6.221 United Arab Emirates ................. 6.222 Brunei Darussalam ..................... 6.123 Luxembourg .............................. 6.124 France ....................................... 6.125 Panama ..................................... 6.126 Barbados ................................... 6.127 Philippines ................................. 6.028 Lithuania .................................... 6.029 Denmark .................................... 6.030 Malaysia ..................................... 6.031 Chile .......................................... 6.032 Ireland ........................................ 6.033 Korea, Rep. ............................... 6.034 Israel .......................................... 6.035 Czech Republic ......................... 6.036 Jordan ....................................... 5.937 Taiwan, China ............................ 5.938 Egypt ......................................... 5.939 Portugal ..................................... 5.940 Montenegro ............................... 5.941 Azerbaijan .................................. 5.942 Macedonia, FYR ........................ 5.843 Costa Rica ................................. 5.844 Venezuela .................................. 5.845 Morocco .................................... 5.846 Germany .................................... 5.847 Brazil .......................................... 5.848 Argentina ................................... 5.849 Cyprus ....................................... 5.750 Guyana ...................................... 5.751 Indonesia ................................... 5.752 Seychelles .................................. 5.753 Slovak Republic ......................... 5.754 Kuwait ....................................... 5.755 Jamaica ..................................... 5.756 Uruguay ..................................... 5.757 El Salvador................................. 5.658 Dominican Republic ................... 5.659 Spain ......................................... 5.660 Georgia ...................................... 5.661 Italy ............................................ 5.662 Lebanon .................................... 5.663 Bosnia and Herzegovina ............ 5.664 Saudi Arabia .............................. 5.565 Trinidad and Tobago .................. 5.566 Albania ....................................... 5.567 Latvia ......................................... 5.568 Armenia ..................................... 5.469 Slovenia ..................................... 5.470 Senegal ..................................... 5.471 Turkey ........................................ 5.472 Thailand ..................................... 5.4
RANK COUNTRY/ECONOMY VALUE 1 MEAN: 5.3 7
73 Romania .................................... 5.4 74 Japan ........................................ 5.4 75 Colombia ................................... 5.4 76 Mauritius .................................... 5.4 77 Hungary ..................................... 5.4 78 Guatemala ................................. 5.3 79 Mexico ....................................... 5.3 80 Nigeria ....................................... 5.3 81 Oman ........................................ 5.3 82 Bulgaria ..................................... 5.3 83 Moldova ..................................... 5.3 84 Côte d’Ivoire .............................. 5.3 85 Mongolia .................................... 5.3 86 South Africa ............................... 5.3 87 Greece ....................................... 5.2 88 Algeria ....................................... 5.2 89 Kenya ........................................ 5.2 90 Croatia ....................................... 5.2 91 Madagascar ............................... 5.2 92 Ukraine ...................................... 5.2 93 Honduras ................................... 5.2 94 Cape Verde ............................... 5.2 95 Zambia ...................................... 5.2 96 India ........................................... 5.1 97 Gambia, The .............................. 5.1 98 Peru ........................................... 5.1 99 Russian Federation .................... 5.1 100 Ghana ........................................ 5.1 101 Swaziland .................................. 5.1 102 Benin ......................................... 5.0 103 Botswana .................................. 5.0 104 Kyrgyz Republic ......................... 4.9 105 Namibia ..................................... 4.9 106 Paraguay ................................... 4.9 107 Cambodia .................................. 4.9 108 China ......................................... 4.9 109 Liberia ........................................ 4.9 110 Suriname ................................... 4.9 111 Haiti ........................................... 4.8 112 Sri Lanka ................................... 4.8 113 Ecuador ..................................... 4.8 114 Pakistan ..................................... 4.8 115 Kazakhstan ................................ 4.8 116 Vietnam ..................................... 4.7 117 Libya .......................................... 4.7 118 Poland ....................................... 4.7 119 Cameroon .................................. 4.7 120 Malawi ....................................... 4.7 121 Gabon ....................................... 4.7 122 Zimbabwe .................................. 4.6 123 Bangladesh ................................ 4.5 124 Guinea ....................................... 4.5 125 Nicaragua .................................. 4.4 126 Nepal ......................................... 4.4 127 Mauritania .................................. 4.4 128 Rwanda ..................................... 4.4 129 Mali ............................................ 4.3 130 Uganda ...................................... 4.3 131 Lesotho ..................................... 4.3 132 Tajikistan .................................... 4.3 133 Tanzania .................................... 4.2 134 Serbia ........................................ 4.2 135 Burkina Faso .............................. 4.1 136 Timor-Leste ............................... 4.1 137 Mozambique .............................. 4.1 138 Yemen ....................................... 4.0 139 Sierra Leone .............................. 3.9 140 Bolivia ........................................ 3.9 141 Chad .......................................... 3.5 142 Ethiopia ...................................... 3.4 143 Burundi ...................................... 3.3 144 Iran, Islamic Rep. ....................... 3.1
6.07 Use of virtual social networksHow widely used are virtual social networks (e.g., Facebook, Twitter, LinkedIn) for professional and personal communications in your country? [1 = not used at all; 7 = used widely] | 2011–2012 weighted average
SOURCE: World Economic Forum, Executive Opinion Survey, 2011 and 2012 editions
@ 2013 World Economic Forum

Data Tables
7th pillar Business usage
@ 2013 World Economic Forum

338 | The Global Information Technology Report 2013
4: Data Tables
RANK COUNTRY/ECONOMY VALUE 1 MEAN: 4.8 7
1 Sweden ..................................... 6.3 2 Iceland ....................................... 6.3 3 Switzerland ................................ 6.2 4 Japan ........................................ 6.2 5 Israel .......................................... 6.2 6 Finland ....................................... 6.1 7 Hong Kong SAR ........................ 6.0 8 Singapore .................................. 6.0 9 Qatar ......................................... 6.0 10 Norway ...................................... 6.0 11 Korea, Rep. ............................... 6.0 12 United Arab Emirates ................. 6.0 13 Austria ....................................... 5.9 14 United States ............................. 5.9 15 Australia ..................................... 5.9 16 Germany .................................... 5.9 17 New Zealand ............................. 5.9 18 Denmark .................................... 5.8 19 Taiwan, China ............................ 5.8 20 Saudi Arabia .............................. 5.8 21 Bahrain ...................................... 5.8 22 Netherlands ............................... 5.8 23 United Kingdom ......................... 5.7 24 Luxembourg .............................. 5.6 25 Panama ..................................... 5.6 26 Puerto Rico ................................ 5.6 27 Portugal ..................................... 5.6 28 Jordan ....................................... 5.6 29 Malaysia ..................................... 5.6 30 Canada ...................................... 5.6 31 Belgium ..................................... 5.6 32 Malta ......................................... 5.5 33 Ireland ........................................ 5.5 34 Estonia ....................................... 5.5 35 France ....................................... 5.5 36 Senegal ..................................... 5.5 37 Barbados ................................... 5.4 38 South Africa ............................... 5.4 39 Turkey ........................................ 5.3 40 India ........................................... 5.2 41 Kuwait ....................................... 5.2 42 Sri Lanka ................................... 5.2 43 Cyprus ....................................... 5.2 44 Chile .......................................... 5.2 45 Guatemala ................................. 5.2 46 Philippines ................................. 5.2 47 Brazil .......................................... 5.2 48 Spain ......................................... 5.1 49 Czech Republic ......................... 5.1 50 Costa Rica ................................. 5.1 51 Seychelles .................................. 5.1 52 Oman ........................................ 5.0 53 Lithuania .................................... 5.0 54 Thailand ..................................... 5.0 55 Mauritius .................................... 4.9 56 Indonesia ................................... 4.9 57 Dominican Republic ................... 4.9 58 Kenya ........................................ 4.9 59 Slovak Republic ......................... 4.9 60 Honduras ................................... 4.9 61 Cambodia .................................. 4.9 62 Brunei Darussalam ..................... 4.9 63 Mexico ....................................... 4.8 64 Hungary ..................................... 4.8 65 Namibia ..................................... 4.8 66 Côte d’Ivoire .............................. 4.8 67 Jamaica ..................................... 4.8 68 Gambia, The .............................. 4.8 69 Ukraine ...................................... 4.8 70 Lebanon .................................... 4.8 71 China ......................................... 4.7 72 Nigeria ....................................... 4.7
RANK COUNTRY/ECONOMY VALUE 1 MEAN: 4.8 7
73 Azerbaijan .................................. 4.7 74 Guyana ...................................... 4.7 75 Morocco .................................... 4.7 76 Cape Verde ............................... 4.7 77 Croatia ....................................... 4.7 78 Slovenia ..................................... 4.7 79 Peru ........................................... 4.7 80 Albania ....................................... 4.6 81 Mongolia .................................... 4.6 82 Trinidad and Tobago .................. 4.6 83 Uruguay ..................................... 4.6 84 Rwanda ..................................... 4.6 85 Pakistan ..................................... 4.6 86 Egypt ......................................... 4.6 87 Mali ............................................ 4.5 88 Zambia ...................................... 4.5 89 Liberia ........................................ 4.5 90 Latvia ......................................... 4.5 91 Kazakhstan ................................ 4.5 92 El Salvador................................. 4.5 93 Colombia ................................... 4.4 94 Greece ....................................... 4.4 95 Tajikistan .................................... 4.4 96 Armenia ..................................... 4.4 97 Gabon ....................................... 4.4 98 Botswana .................................. 4.4 99 Zimbabwe .................................. 4.4 100 Montenegro ............................... 4.4 101 Ecuador ..................................... 4.3 102 Paraguay ................................... 4.3 103 Uganda ...................................... 4.3 104 Italy ............................................ 4.3 105 Bosnia and Herzegovina ............ 4.3 106 Argentina ................................... 4.3 107 Mauritania .................................. 4.3 108 Libya .......................................... 4.3 109 Yemen ....................................... 4.3 110 Mozambique .............................. 4.3 111 Bangladesh ................................ 4.2 112 Poland ....................................... 4.2 113 Cameroon .................................. 4.2 114 Benin ......................................... 4.2 115 Ghana ........................................ 4.2 116 Romania .................................... 4.1 117 Venezuela .................................. 4.1 118 Burkina Faso .............................. 4.1 119 Iran, Islamic Rep. ....................... 4.1 120 Nepal ......................................... 4.1 121 Suriname ................................... 4.1 122 Nicaragua .................................. 4.0 123 Georgia ...................................... 4.0 124 Swaziland .................................. 4.0 125 Bulgaria ..................................... 4.0 126 Vietnam ..................................... 4.0 127 Lesotho ..................................... 4.0 128 Moldova ..................................... 4.0 129 Tanzania .................................... 3.9 130 Haiti ........................................... 3.9 131 Sierra Leone .............................. 3.9 132 Madagascar ............................... 3.8 133 Macedonia, FYR ........................ 3.8 134 Malawi ....................................... 3.8 135 Guinea ....................................... 3.8 136 Kyrgyz Republic ......................... 3.7 137 Chad .......................................... 3.7 138 Bolivia ........................................ 3.7 139 Ethiopia ...................................... 3.7 140 Timor-Leste ............................... 3.7 141 Russian Federation .................... 3.6 142 Serbia ........................................ 3.6 143 Burundi ...................................... 3.5 144 Algeria ....................................... 3.2
7.01 Firm-level technology absorptionTo what extent do businesses in your country absorb new technology? [1 = not at all; 7 = aggressively absorb] | 2011–2012 weighted average
SOURCE: World Economic Forum, Executive Opinion Survey, 2011 and 2012 editions
@ 2013 World Economic Forum

The Global Information Technology Report 2013 | 339
4: Data Tables
RANK COUNTRY/ECONOMY VALUE 1 MEAN: 3.3 7
1 Japan ........................................ 5.92 Switzerland ................................ 5.83 Germany .................................... 5.74 Finland ....................................... 5.65 Sweden ..................................... 5.56 Israel .......................................... 5.47 United States ............................. 5.28 Netherlands ............................... 5.19 Austria ....................................... 5.0
10 France ....................................... 5.011 Belgium ..................................... 5.012 United Kingdom ......................... 5.013 Denmark .................................... 4.914 Norway ...................................... 4.715 Taiwan, China ............................ 4.716 Luxembourg .............................. 4.617 Malaysia ..................................... 4.618 Qatar ......................................... 4.619 Korea, Rep. ............................... 4.520 Singapore .................................. 4.421 Iceland ....................................... 4.422 Czech Republic ......................... 4.123 China ......................................... 4.124 New Zealand ............................. 4.125 Canada ...................................... 4.126 Ireland ........................................ 4.027 United Arab Emirates ................. 4.028 Italy ............................................ 4.029 Saudi Arabia .............................. 3.930 Indonesia ................................... 3.931 Slovenia ..................................... 3.932 Australia ..................................... 3.933 Estonia ....................................... 3.834 Brazil .......................................... 3.735 Guyana ...................................... 3.736 Liberia ........................................ 3.637 Hong Kong SAR ........................ 3.638 Puerto Rico ................................ 3.639 Azerbaijan .................................. 3.540 Portugal ..................................... 3.541 South Africa ............................... 3.542 India ........................................... 3.543 Costa Rica ................................. 3.544 Spain ......................................... 3.545 Hungary ..................................... 3.546 Kenya ........................................ 3.547 Lithuania .................................... 3.448 Turkey ........................................ 3.449 Latvia ......................................... 3.450 Oman ........................................ 3.451 Tajikistan .................................... 3.452 Gambia, The .............................. 3.353 Montenegro ............................... 3.354 Poland ....................................... 3.355 Rwanda ..................................... 3.356 Russian Federation .................... 3.357 Jordan ....................................... 3.358 Ukraine ...................................... 3.359 Iran, Islamic Rep. ....................... 3.360 Pakistan ..................................... 3.361 Bolivia ........................................ 3.262 Armenia ..................................... 3.263 Nigeria ....................................... 3.264 Bulgaria ..................................... 3.265 Cambodia .................................. 3.266 Colombia ................................... 3.267 Guatemala ................................. 3.268 Brunei Darussalam ..................... 3.269 Senegal ..................................... 3.270 Malta ......................................... 3.271 Tanzania .................................... 3.172 Croatia ....................................... 3.1
RANK COUNTRY/ECONOMY VALUE 1 MEAN: 3.3 7
73 Mongolia .................................... 3.1 74 Uruguay ..................................... 3.1 75 Mexico ....................................... 3.1 76 Zambia ...................................... 3.1 77 Romania .................................... 3.1 78 Vietnam ..................................... 3.0 79 Thailand ..................................... 3.0 80 Egypt ......................................... 3.0 81 Ghana ........................................ 3.0 82 Ecuador ..................................... 3.0 83 Chile .......................................... 3.0 84 Seychelles .................................. 3.0 85 Jamaica ..................................... 2.9 86 Philippines ................................. 2.9 87 Nicaragua .................................. 2.9 88 Slovak Republic ......................... 2.9 89 Cyprus ....................................... 2.9 90 Namibia ..................................... 2.9 91 Barbados ................................... 2.9 92 Kazakhstan ................................ 2.9 93 Sri Lanka ................................... 2.9 94 Panama ..................................... 2.9 95 Argentina ................................... 2.9 96 Botswana .................................. 2.8 97 Madagascar ............................... 2.8 98 Honduras ................................... 2.8 99 Macedonia, FYR ........................ 2.8 100 Malawi ....................................... 2.8 101 Bosnia and Herzegovina ............ 2.8 102 Uganda ...................................... 2.8 103 Peru ........................................... 2.8 104 Greece ....................................... 2.7 105 Chad .......................................... 2.7 106 Suriname ................................... 2.7 107 El Salvador................................. 2.7 108 Mauritania .................................. 2.7 109 Paraguay ................................... 2.7 110 Cameroon .................................. 2.7 111 Mali ............................................ 2.7 112 Mauritius .................................... 2.7 113 Kuwait ....................................... 2.6 114 Lebanon .................................... 2.6 115 Morocco .................................... 2.6 116 Georgia ...................................... 2.5 117 Bahrain ...................................... 2.5 118 Dominican Republic ................... 2.5 119 Lesotho ..................................... 2.5 120 Serbia ........................................ 2.5 121 Benin ......................................... 2.5 122 Moldova ..................................... 2.5 123 Libya .......................................... 2.5 124 Trinidad and Tobago .................. 2.4 125 Timor-Leste ............................... 2.4 126 Nepal ......................................... 2.4 127 Guinea ....................................... 2.4 128 Albania ....................................... 2.4 129 Zimbabwe .................................. 2.4 130 Swaziland .................................. 2.4 131 Bangladesh ................................ 2.4 132 Mozambique .............................. 2.3 133 Ethiopia ...................................... 2.3 134 Venezuela .................................. 2.3 135 Burkina Faso .............................. 2.3 136 Sierra Leone .............................. 2.3 137 Cape Verde ............................... 2.3 138 Haiti ........................................... 2.3 139 Côte d’Ivoire .............................. 2.2 140 Kyrgyz Republic ......................... 2.1 141 Gabon ....................................... 2.0 142 Yemen ....................................... 1.9 143 Algeria ....................................... 1.9 144 Burundi ...................................... 1.8
7.02 Capacity for innovationIn your country, how do companies obtain technology? [1 = exclusively from licensing or imitating foreign companies; 7 = by conducting formal research and pioneering their own new products and processes] | 2011–2012 weighted average
SOURCE: World Economic Forum, Executive Opinion Survey, 2011 and 2012 editions
@ 2013 World Economic Forum

340 | The Global Information Technology Report 2013
4: Data Tables
RANK COUNTRY/ECONOMY VALUE
1 Sweden .....................................297.1 2 Switzerland ................................284.7 3 Finland .......................................279.3 4 Japan ........................................251.1 5 Germany ....................................209.1 6 Israel ..........................................209.1 7 Denmark ....................................196.7 8 Netherlands ...............................180.9 9 Korea, Rep. ...............................172.1 10 Austria .......................................154.7 11 Norway ......................................144.4 12 United States .............................134.4 13 Singapore ..................................120.4 14 France .......................................108.2 15 Belgium .....................................106.2 16 Luxembourg ..............................100.1 17 Iceland .........................................95.5 18 United Kingdom ...........................87.3 19 Canada ........................................78.1 20 Australia .......................................77.5 21 Ireland ..........................................76.5 22 New Zealand ...............................71.9 23 Slovenia .......................................60.7 24 Italy ..............................................51.0 25 Spain ...........................................38.0 26 Estonia .........................................34.3 27 Seychelles ....................................26.0 28 Hungary .......................................22.3 29 Czech Republic ...........................14.7 30 Portugal .......................................12.2 31 Malaysia .......................................12.0 32 Barbados .....................................11.3 33 Latvia ...........................................10.0 34 Croatia ...........................................9.8 35 China .............................................9.0 36 Malta .............................................8.7 37 Greece ...........................................8.6 38 Cyprus ...........................................7.7 39 Slovak Republic .............................7.2 40 Poland ...........................................6.7 41 Turkey ............................................6.5 42 South Africa ...................................6.0 43 Russian Federation ........................6.0 44 Chile ..............................................5.5 45 Lithuania ........................................4.6 46 United Arab Emirates .....................4.2 47 Bulgaria .........................................3.6 48 Saudi Arabia ..................................3.2 49 Brunei Darussalam .........................3.1 50 Brazil ..............................................2.8 51 Ukraine ..........................................2.8 52 Serbia ............................................2.8 53 Bosnia and Herzegovina ................2.0 54 Bahrain ..........................................1.9 55 Romania ........................................1.8 56 Qatar .............................................1.8 57 Armenia .........................................1.7 58 Costa Rica .....................................1.6 59 Mexico ...........................................1.6 60 Georgia ..........................................1.4 61 Trinidad and Tobago ......................1.4 62 India ...............................................1.3 63 Oman ............................................1.3 64 Lebanon ........................................1.3 65 Kazakhstan ....................................1.2 66 Argentina .......................................1.2 67 Uruguay .........................................1.1 68 Colombia .......................................1.0 69 Thailand .........................................1.0 70 Macedonia, FYR ............................0.7 71 Suriname .......................................0.7 72 Egypt .............................................0.6
RANK COUNTRY/ECONOMY VALUE
73 Jamaica .........................................0.6 74 Sri Lanka .......................................0.5 75 Panama .........................................0.5 76 Morocco ........................................0.5 77 Azerbaijan ......................................0.4 78 Moldova .........................................0.4 79 Libya ..............................................0.4 80 Philippines .....................................0.3 81 Dominican Republic .......................0.2 82 Peru ...............................................0.2 83 Kuwait ...........................................0.2 84 Jordan ...........................................0.2 85 Cameroon ......................................0.2 86 Venezuela ......................................0.2 87 Gabon ...........................................0.2 88 Albania ...........................................0.2 89 Vietnam .........................................0.1 90 Guatemala .....................................0.1 91 Kyrgyz Republic .............................0.1 92 Paraguay .......................................0.1 93 Kenya ............................................0.1 94 Sierra Leone ..................................0.1 95 Swaziland ......................................0.1 96 Zimbabwe ......................................0.1 97 Ecuador .........................................0.1 98 Algeria ...........................................0.1 99 Bolivia ............................................0.1 100 El Salvador.....................................0.1 101 Indonesia .......................................0.1 102 Namibia .........................................0.1 103 Mauritius ........................................0.1 104 Iran, Islamic Rep. ...........................0.1 105 Mongolia ........................................0.1 106 Botswana ......................................0.0 107 Chad ..............................................0.0 108 Yemen ...........................................0.0 109 Senegal .........................................0.0 110 Benin .............................................0.0 111 Côte d’Ivoire ..................................0.0 112 Madagascar ...................................0.0 113 Burkina Faso ..................................0.0 114 Ghana ............................................0.0 115 Pakistan .........................................0.0 116 Tanzania ........................................0.0 117 Bangladesh ....................................0.0 118 Nigeria ...........................................0.0 119 Malawi ...........................................0.0 120 Nepal .............................................0.0 121 Uganda ..........................................0.0 122 Ethiopia ..........................................0.0 123 Burundi ..........................................0.0 123 Cambodia ......................................0.0 123 Cape Verde ...................................0.0 123 Gambia, The ..................................0.0 123 Guinea ...........................................0.0 123 Guyana ..........................................0.0 123 Haiti ...............................................0.0 123 Honduras .......................................0.0 123 Lesotho .........................................0.0 123 Liberia ............................................0.0 123 Mali ................................................0.0 123 Mauritania ......................................0.0 123 Montenegro ...................................0.0 123 Mozambique ..................................0.0 123 Nicaragua ......................................0.0 123 Rwanda .........................................0.0 123 Tajikistan ........................................0.0 123 Timor-Leste ...................................0.0 123 Zambia ..........................................0.0 n/a Hong Kong SAR ............................n/a n/a Puerto Rico ....................................n/a n/a Taiwan, China ................................n/a
7.03 PCT patents applicationsNumber of applications filed under the Patent Cooperation Treaty (PCT) per million population | 2009-2010 average
SOURCES: Organisation for Economic Co-operation and Development (OECD), Patent Database, January 2013; World Bank, World Development Indicators Online (retrieved November 28, 2012)
@ 2013 World Economic Forum

The Global Information Technology Report 2013 | 341
4: Data Tables
RANK COUNTRY/ECONOMY VALUE 1 MEAN: 5.0 7
1 Finland ...........................................6.32 Switzerland ....................................6.33 Austria ...........................................6.24 United Kingdom .............................6.15 Malta .............................................6.16 Sweden .........................................6.17 Japan ............................................6.08 Norway ..........................................6.09 Taiwan, China ................................6.0
10 Singapore ......................................6.011 New Zealand .................................6.012 Netherlands ...................................6.013 Qatar .............................................6.014 Germany ........................................5.915 Estonia ...........................................5.916 Luxembourg ..................................5.917 United Arab Emirates .....................5.918 Hong Kong SAR ............................5.919 Korea, Rep. ...................................5.920 Lithuania ........................................5.821 Belgium .........................................5.822 Denmark ........................................5.823 Czech Republic .............................5.824 Vietnam .........................................5.725 France ...........................................5.726 Slovenia .........................................5.727 Canada ..........................................5.728 Saudi Arabia ..................................5.729 Bahrain ..........................................5.630 Iceland ...........................................5.631 Australia .........................................5.632 Ireland ............................................5.633 Malaysia .........................................5.634 Costa Rica .....................................5.635 United States .................................5.636 South Africa ...................................5.637 Portugal .........................................5.638 Chile ..............................................5.539 Panama .........................................5.540 Brazil ..............................................5.541 Puerto Rico ....................................5.542 Israel ..............................................5.443 Slovak Republic .............................5.444 Guatemala .....................................5.445 Latvia .............................................5.446 Spain .............................................5.447 Dominican Republic .......................5.448 Mauritius ........................................5.349 Barbados .......................................5.350 Jordan ...........................................5.351 Philippines .....................................5.252 Croatia ...........................................5.253 Cameroon ......................................5.254 Armenia .........................................5.255 Brunei Darussalam .........................5.256 Senegal .........................................5.157 Mexico ...........................................5.158 Namibia .........................................5.159 India ...............................................5.160 Zambia ..........................................5.161 Guyana ..........................................5.162 Cyprus ...........................................5.063 Kazakhstan ....................................5.064 Gambia, The ..................................5.065 Honduras .......................................5.066 Hungary .........................................5.067 Trinidad and Tobago ......................5.068 Seychelles ......................................5.069 Uruguay .........................................5.070 Colombia .......................................5.071 Macedonia, FYR ............................4.972 Kuwait ...........................................4.9
RANK COUNTRY/ECONOMY VALUE 1 MEAN: 5.0 7
73 Oman ............................................4.9 74 Turkey ............................................4.9 75 Mali ................................................4.9 76 Kenya ............................................4.9 77 Jamaica .........................................4.9 78 Azerbaijan ......................................4.8 79 Peru ...............................................4.8 80 Ukraine ..........................................4.8 81 Montenegro ...................................4.8 82 Morocco ........................................4.8 83 Mongolia ........................................4.8 84 Argentina .......................................4.8 85 Ghana ............................................4.8 86 Romania ........................................4.7 87 Cambodia ......................................4.7 88 Yemen ...........................................4.7 89 China .............................................4.7 90 Greece ...........................................4.7 91 Cape Verde ...................................4.7 92 Moldova .........................................4.7 93 Thailand .........................................4.7 94 Uganda ..........................................4.7 95 Poland ...........................................4.7 96 Bulgaria .........................................4.6 97 Indonesia .......................................4.6 98 Swaziland ......................................4.6 99 Nigeria ...........................................4.6 100 Zimbabwe ......................................4.6 101 Italy ................................................4.5 102 Côte d’Ivoire ..................................4.5 103 Guinea ...........................................4.5 104 Gabon ...........................................4.5 105 Bosnia and Herzegovina ................4.5 106 Malawi ...........................................4.5 107 Russian Federation ........................4.4 108 Mozambique ..................................4.4 109 Venezuela ......................................4.4 110 Madagascar ...................................4.4 111 Egypt .............................................4.4 112 Nepal .............................................4.4 113 Paraguay .......................................4.4 114 Mauritania ......................................4.3 115 Burkina Faso ..................................4.3 116 Pakistan .........................................4.3 117 El Salvador.....................................4.3 118 Serbia ............................................4.2 119 Tajikistan ........................................4.2 120 Botswana ......................................4.2 121 Tanzania ........................................4.2 122 Liberia ............................................4.2 123 Benin .............................................4.2 124 Nicaragua ......................................4.2 125 Suriname .......................................4.2 126 Bangladesh ....................................4.1 127 Sierra Leone ..................................4.0 128 Lebanon ........................................4.0 129 Kyrgyz Republic .............................4.0 130 Ethiopia ..........................................4.0 131 Haiti ...............................................3.9 132 Bolivia ............................................3.9 133 Iran, Islamic Rep. ...........................3.9 134 Lesotho .........................................3.8 135 Timor-Leste ...................................3.7 136 Libya ..............................................3.6 137 Chad ..............................................3.5 138 Burundi ..........................................3.3 139 Algeria ...........................................2.7 n/a Albania ...........................................n/a n/a Ecuador .........................................n/a n/a Georgia ..........................................n/a n/a Rwanda .........................................n/a n/a Sri Lanka .......................................n/a
7.04 Business-to-business Internet useTo what extent do businesses in your country use ICTs for communicating and carrying out transactions with other businesses? [1 = not at all; 7 = extensively] | 2012
SOURCE: World Economic Forum, Executive Opinion Survey, 2012 edition
@ 2013 World Economic Forum

342 | The Global Information Technology Report 2013
4: Data Tables
RANK COUNTRY/ECONOMY VALUE 1 MEAN: 4.5 7
1 United Kingdom ......................... 6.3 2 Korea, Rep. ............................... 6.3 3 United States ............................. 6.0 4 Netherlands ............................... 6.0 5 Taiwan, China ............................ 6.0 6 Finland ....................................... 6.0 7 Japan ........................................ 5.9 8 Czech Republic ......................... 5.9 9 Australia ..................................... 5.8 10 Lithuania .................................... 5.8 11 Sweden ..................................... 5.8 12 Switzerland ................................ 5.8 13 Norway ...................................... 5.7 14 Germany .................................... 5.7 15 Estonia ....................................... 5.7 16 Austria ....................................... 5.6 17 Canada ...................................... 5.6 18 New Zealand ............................. 5.6 19 Panama ..................................... 5.5 20 Denmark .................................... 5.5 21 United Arab Emirates ................. 5.5 22 Hong Kong SAR ........................ 5.5 23 Israel .......................................... 5.5 24 Latvia ......................................... 5.4 25 France ....................................... 5.4 26 Malaysia ..................................... 5.4 27 Ireland ........................................ 5.3 28 Brazil .......................................... 5.3 29 Iceland ....................................... 5.3 30 Singapore .................................. 5.3 31 Chile .......................................... 5.2 32 Puerto Rico ................................ 5.2 33 Qatar ......................................... 5.2 34 Vietnam ..................................... 5.2 35 Portugal ..................................... 5.1 36 Luxembourg .............................. 5.1 37 Belgium ..................................... 5.1 38 Costa Rica ................................. 5.1 39 Slovak Republic ......................... 5.0 40 Spain ......................................... 5.0 41 Romania .................................... 5.0 42 Jordan ....................................... 4.9 43 Poland ....................................... 4.9 44 Indonesia ................................... 4.9 45 Colombia ................................... 4.9 46 Malta ......................................... 4.9 47 China ......................................... 4.9 48 Cyprus ....................................... 4.8 49 Dominican Republic ................... 4.8 50 Saudi Arabia .............................. 4.8 51 Philippines ................................. 4.8 52 South Africa ............................... 4.8 53 Thailand ..................................... 4.8 54 Kuwait ....................................... 4.8 55 Slovenia ..................................... 4.8 56 Turkey ........................................ 4.7 57 Guatemala ................................. 4.7 58 Hungary ..................................... 4.7 59 El Salvador................................. 4.7 60 Barbados ................................... 4.7 61 Brunei Darussalam ..................... 4.7 62 Kazakhstan ................................ 4.7 63 Russian Federation .................... 4.6 64 Bulgaria ..................................... 4.6 65 Argentina ................................... 4.6 66 Uruguay ..................................... 4.6 67 Peru ........................................... 4.6 68 Ukraine ...................................... 4.6 69 Mexico ....................................... 4.6 70 Nigeria ....................................... 4.5 71 Guyana ...................................... 4.5 72 Kenya ........................................ 4.5
RANK COUNTRY/ECONOMY VALUE 1 MEAN: 4.5 7
73 Senegal ..................................... 4.5 74 Croatia ....................................... 4.5 75 Gambia, The .............................. 4.5 76 India ........................................... 4.4 77 Azerbaijan .................................. 4.4 78 Montenegro ............................... 4.4 79 Mongolia .................................... 4.4 80 Egypt ......................................... 4.4 81 Honduras ................................... 4.4 82 Armenia ..................................... 4.4 83 Italy ............................................ 4.4 84 Benin ......................................... 4.3 85 Venezuela .................................. 4.3 86 Greece ....................................... 4.3 87 Paraguay ................................... 4.2 88 Bosnia and Herzegovina ............ 4.2 89 Oman ........................................ 4.2 90 Namibia ..................................... 4.2 91 Morocco .................................... 4.2 92 Mauritius .................................... 4.1 93 Trinidad and Tobago .................. 4.1 94 Cambodia .................................. 4.1 95 Moldova ..................................... 4.0 96 Tajikistan .................................... 4.0 97 Bahrain ...................................... 4.0 98 Zambia ...................................... 4.0 99 Kyrgyz Republic ......................... 4.0 100 Bolivia ........................................ 4.0 101 Cameroon .................................. 3.9 102 Nicaragua .................................. 3.9 103 Liberia ........................................ 3.9 104 Jamaica ..................................... 3.9 105 Macedonia, FYR ........................ 3.9 106 Mali ............................................ 3.8 107 Cape Verde ............................... 3.8 108 Botswana .................................. 3.8 109 Mozambique .............................. 3.8 110 Ghana ........................................ 3.8 111 Nepal ......................................... 3.8 112 Pakistan ..................................... 3.8 113 Madagascar ............................... 3.7 114 Seychelles .................................. 3.7 115 Uganda ...................................... 3.7 116 Iran, Islamic Rep. ....................... 3.6 117 Bangladesh ................................ 3.6 118 Burkina Faso .............................. 3.6 119 Mauritania .................................. 3.6 120 Côte d’Ivoire .............................. 3.5 121 Zimbabwe .................................. 3.5 122 Haiti ........................................... 3.5 123 Serbia ........................................ 3.5 124 Malawi ....................................... 3.4 125 Suriname ................................... 3.4 126 Tanzania .................................... 3.4 127 Swaziland .................................. 3.3 128 Guinea ....................................... 3.3 129 Gabon ....................................... 3.2 130 Yemen ....................................... 3.2 131 Libya .......................................... 3.1 132 Lebanon .................................... 3.1 133 Lesotho ..................................... 3.1 134 Ethiopia ...................................... 3.0 135 Timor-Leste ............................... 3.0 136 Chad .......................................... 2.8 137 Burundi ...................................... 2.7 138 Sierra Leone .............................. 2.6 139 Algeria ....................................... 2.4 n/a Albania ....................................... n/a n/a Ecuador ..................................... n/a n/a Georgia ...................................... n/a n/a Rwanda ..................................... n/a n/a Sri Lanka ................................... n/a
7.05 Business-to-consumer Internet useTo what extent do businesses in your country use internet for selling their goods and services to consumers? [1 = not at all; 7 = extensively] | 2012
SOURCE: World Economic Forum, Executive Opinion Survey, 2012 edition
@ 2013 World Economic Forum

The Global Information Technology Report 2013 | 343
4: Data Tables
RANK COUNTRY/ECONOMY VALUE 1 MEAN: 3.9 7
1 Switzerland ................................ 5.62 Finland ....................................... 5.43 Singapore .................................. 5.34 Luxembourg .............................. 5.35 Japan ........................................ 5.36 Sweden ..................................... 5.27 Malaysia ..................................... 5.28 Netherlands ............................... 5.29 Norway ...................................... 5.2
10 Denmark .................................... 5.111 Qatar ......................................... 5.012 Austria ....................................... 5.013 Germany .................................... 5.014 United Kingdom ......................... 5.015 United States ............................. 5.016 Ireland ........................................ 4.917 United Arab Emirates ................. 4.918 New Zealand ............................. 4.819 Puerto Rico ................................ 4.820 Belgium ..................................... 4.821 Iceland ....................................... 4.722 Gambia, The .............................. 4.723 Canada ...................................... 4.724 Hong Kong SAR ........................ 4.625 Bahrain ...................................... 4.626 South Africa ............................... 4.627 Israel .......................................... 4.628 Australia ..................................... 4.629 Costa Rica ................................. 4.630 Barbados ................................... 4.631 Taiwan, China ............................ 4.632 Philippines ................................. 4.633 Brazil .......................................... 4.434 Oman ........................................ 4.435 Saudi Arabia .............................. 4.436 Albania ....................................... 4.437 Mauritius .................................... 4.338 Chile .......................................... 4.339 Indonesia ................................... 4.340 Guatemala ................................. 4.341 France ....................................... 4.342 Korea, Rep. ............................... 4.343 Panama ..................................... 4.244 Côte d’Ivoire .............................. 4.245 China ......................................... 4.246 Estonia ....................................... 4.247 Suriname ................................... 4.248 Czech Republic ......................... 4.249 Thailand ..................................... 4.250 Malta ......................................... 4.151 Montenegro ............................... 4.152 Brunei Darussalam ..................... 4.153 Latvia ......................................... 4.154 India ........................................... 4.155 Namibia ..................................... 4.156 Azerbaijan .................................. 4.157 Nigeria ....................................... 4.158 Jamaica ..................................... 4.159 Poland ....................................... 4.060 Mongolia .................................... 4.061 Guyana ...................................... 4.062 Seychelles .................................. 4.063 Honduras ................................... 4.064 Liberia ........................................ 4.065 Turkey ........................................ 4.066 Lithuania .................................... 4.067 Mexico ....................................... 4.068 Botswana .................................. 3.969 Rwanda ..................................... 3.970 Kenya ........................................ 3.971 Trinidad and Tobago .................. 3.972 Kazakhstan ................................ 3.9
RANK COUNTRY/ECONOMY VALUE 1 MEAN: 3.9 7
73 Portugal ..................................... 3.9 74 Cambodia .................................. 3.9 75 Morocco .................................... 3.9 76 Dominican Republic ................... 3.9 77 Tanzania .................................... 3.8 78 Argentina ................................... 3.8 79 Tajikistan .................................... 3.8 80 Sri Lanka ................................... 3.8 81 El Salvador................................. 3.8 82 Zimbabwe .................................. 3.8 83 Cameroon .................................. 3.8 84 Peru ........................................... 3.8 85 Cyprus ....................................... 3.8 86 Uruguay ..................................... 3.8 87 Swaziland .................................. 3.8 88 Jordan ....................................... 3.8 89 Russian Federation .................... 3.7 90 Ecuador ..................................... 3.7 91 Slovenia ..................................... 3.7 92 Kuwait ....................................... 3.7 93 Gabon ....................................... 3.7 94 Malawi ....................................... 3.7 95 Slovak Republic ......................... 3.7 96 Ghana ........................................ 3.7 97 Nicaragua .................................. 3.6 98 Armenia ..................................... 3.6 99 Colombia ................................... 3.6 100 Uganda ...................................... 3.6 101 Georgia ...................................... 3.6 102 Lebanon .................................... 3.6 103 Bolivia ........................................ 3.6 104 Venezuela .................................. 3.6 105 Spain ......................................... 3.6 106 Ukraine ...................................... 3.6 107 Paraguay ................................... 3.5 108 Zambia ...................................... 3.5 109 Bosnia and Herzegovina ............ 3.5 110 Hungary ..................................... 3.5 111 Romania .................................... 3.4 112 Pakistan ..................................... 3.4 113 Madagascar ............................... 3.4 114 Guinea ....................................... 3.3 115 Greece ....................................... 3.3 116 Vietnam ..................................... 3.3 117 Lesotho ..................................... 3.3 118 Bulgaria ..................................... 3.3 119 Mozambique .............................. 3.2 120 Cape Verde ............................... 3.2 121 Yemen ....................................... 3.2 122 Moldova ..................................... 3.2 123 Italy ............................................ 3.2 124 Croatia ....................................... 3.2 125 Sierra Leone .............................. 3.1 126 Macedonia, FYR ........................ 3.1 127 Timor-Leste ............................... 3.1 128 Kyrgyz Republic ......................... 3.1 129 Egypt ......................................... 3.1 130 Ethiopia ...................................... 3.1 131 Mali ............................................ 3.1 132 Nepal ......................................... 3.1 133 Benin ......................................... 3.1 134 Iran, Islamic Rep. ....................... 3.0 135 Senegal ..................................... 3.0 136 Bangladesh ................................ 3.0 137 Burkina Faso .............................. 2.9 138 Serbia ........................................ 2.9 139 Chad .......................................... 2.9 140 Libya .......................................... 2.9 141 Mauritania .................................. 2.7 142 Algeria ....................................... 2.6 143 Burundi ...................................... 2.4 144 Haiti ........................................... 2.3
7.06 Extent of staff trainingTo what extent do companies in your country invest in training and employee development? [1 = hardly at all; 7 = to a great extent] | 2011–2012 weighted average
SOURCE: World Economic Forum, Executive Opinion Survey, 2011 and 2012 editions
@ 2013 World Economic Forum

@ 2013 World Economic Forum

Data Tables
8th pillar Government usage
@ 2013 World Economic Forum

346 | The Global Information Technology Report 2013
4: Data Tables
RANK COUNTRY/ECONOMY VALUE 1 MEAN: 4.0 7
1 Singapore .................................. 5.9 2 Qatar ......................................... 5.8 3 United Arab Emirates ................. 5.7 4 Malta ......................................... 5.6 5 Luxembourg .............................. 5.5 6 Malaysia ..................................... 5.4 7 Saudi Arabia .............................. 5.4 8 Bahrain ...................................... 5.4 9 Azerbaijan .................................. 5.4 10 Rwanda ..................................... 5.4 11 Taiwan, China ............................ 5.3 12 Sweden ..................................... 5.2 13 Korea, Rep. ............................... 5.2 14 Sri Lanka ................................... 5.1 15 Oman ........................................ 5.1 16 New Zealand ............................. 5.1 17 Seychelles .................................. 5.0 18 Finland ....................................... 4.9 19 Norway ...................................... 4.9 20 Panama ..................................... 4.8 21 Portugal ..................................... 4.8 22 China ......................................... 4.8 23 Estonia ....................................... 4.8 24 Cape Verde ............................... 4.8 25 United Kingdom ......................... 4.8 26 Australia ..................................... 4.7 27 Gambia, The .............................. 4.7 28 Kenya ........................................ 4.7 29 Brunei Darussalam ..................... 4.7 30 Chile .......................................... 4.6 31 Montenegro ............................... 4.6 32 Hong Kong SAR ........................ 4.5 33 Denmark .................................... 4.5 34 United States ............................. 4.5 35 Kazakhstan ................................ 4.5 36 Barbados ................................... 4.5 37 Switzerland ................................ 4.5 38 Morocco .................................... 4.4 39 Guyana ...................................... 4.4 40 Germany .................................... 4.4 41 Israel .......................................... 4.4 42 Liberia ........................................ 4.4 43 Jordan ....................................... 4.4 44 Ireland ........................................ 4.4 45 India ........................................... 4.3 46 Japan ........................................ 4.3 47 Netherlands ............................... 4.3 48 Mauritius .................................... 4.3 49 Tajikistan .................................... 4.3 50 France ....................................... 4.3 51 Canada ...................................... 4.2 52 Uganda ...................................... 4.2 53 Turkey ........................................ 4.2 54 Zambia ...................................... 4.2 55 Cambodia .................................. 4.2 56 Armenia ..................................... 4.2 57 Iceland ....................................... 4.2 58 Nigeria ....................................... 4.2 59 Ethiopia ...................................... 4.1 60 Cyprus ....................................... 4.1 61 Macedonia, FYR ........................ 4.1 62 Colombia ................................... 4.1 63 Mali ............................................ 4.1 64 Puerto Rico ................................ 4.1 65 Indonesia ................................... 4.1 66 Vietnam ..................................... 4.1 67 Botswana .................................. 4.1 68 Bangladesh ................................ 4.1 69 Belgium ..................................... 4.0 70 Albania ....................................... 4.0 71 Ghana ........................................ 4.0 72 Guinea ....................................... 4.0
RANK COUNTRY/ECONOMY VALUE 1 MEAN: 4.0 7
73 Lithuania .................................... 4.0 74 Jamaica ..................................... 3.9 75 Uruguay ..................................... 3.9 76 Mexico ....................................... 3.9 77 Austria ....................................... 3.9 78 Costa Rica ................................. 3.9 79 Senegal ..................................... 3.9 80 Brazil .......................................... 3.9 81 Iran, Islamic Rep. ....................... 3.9 82 Ecuador ..................................... 3.8 83 Cameroon .................................. 3.8 84 Spain ......................................... 3.8 85 Philippines ................................. 3.7 86 Burkina Faso .............................. 3.7 87 Trinidad and Tobago .................. 3.7 88 Tanzania .................................... 3.7 89 Sierra Leone .............................. 3.7 90 Gabon ....................................... 3.7 91 Georgia ...................................... 3.7 92 Mozambique .............................. 3.6 93 Mongolia .................................... 3.6 94 Côte d’Ivoire .............................. 3.6 95 Chad .......................................... 3.6 96 Moldova ..................................... 3.6 97 Namibia ..................................... 3.6 98 Dominican Republic ................... 3.6 99 Slovenia ..................................... 3.5 100 Malawi ....................................... 3.5 101 Slovak Republic ......................... 3.5 102 Hungary ..................................... 3.5 103 Latvia ......................................... 3.5 104 Thailand ..................................... 3.5 105 South Africa ............................... 3.4 106 Romania .................................... 3.4 107 Timor-Leste ............................... 3.4 108 Bulgaria ..................................... 3.4 109 Zimbabwe .................................. 3.4 110 Benin ......................................... 3.4 111 Croatia ....................................... 3.4 112 Peru ........................................... 3.4 113 Bosnia and Herzegovina ............ 3.3 114 Czech Republic ......................... 3.3 115 Bolivia ........................................ 3.3 116 Russian Federation .................... 3.3 117 Pakistan ..................................... 3.2 118 Italy ............................................ 3.2 119 Kuwait ....................................... 3.2 120 Mauritania .................................. 3.2 121 Nepal ......................................... 3.2 122 Egypt ......................................... 3.1 123 Poland ....................................... 3.1 124 Serbia ........................................ 3.1 125 Nicaragua .................................. 3.1 126 El Salvador................................. 3.1 127 Lesotho ..................................... 3.1 128 Honduras ................................... 3.0 129 Guatemala ................................. 3.0 130 Ukraine ...................................... 2.9 131 Swaziland .................................. 2.8 132 Libya .......................................... 2.8 133 Paraguay ................................... 2.7 134 Madagascar ............................... 2.7 135 Burundi ...................................... 2.7 136 Venezuela .................................. 2.7 137 Suriname ................................... 2.7 138 Greece ....................................... 2.7 139 Argentina ................................... 2.6 140 Algeria ....................................... 2.6 141 Kyrgyz Republic ......................... 2.5 142 Haiti ........................................... 2.4 143 Yemen ....................................... 2.2 144 Lebanon .................................... 2.1
8.01 Importance of ICTs to government vision of the futureTo what extent does the government have a clear implementation plan for utilizing ICTs to improve your country’s overall competitiveness? [1 = no plan; 7 = clear plan] | 2011–2012 weighted average
SOURCE: World Economic Forum, Executive Opinion Survey, 2011 and 2012 editions
@ 2013 World Economic Forum