the global green finance index 1
TRANSCRIPT

The Global Green Finance Index 1
MARCH 2018

We are pleased to present the first edition of the Global Green Finance Index (GGFI 1). The GGFI has been developed jointly by Z/Yen, as part of its Long Finance Initiative, and Finance Watch. We are grateful to the MAVA Foundation for its sponsorship of this work.
Founded by late Dr Luc Hoffmann in 1994, MAVA is a Swiss-based philanthropic foundation with a focus on biodiversity conservation. Running three region-based programmes in Switzerland, the Mediterranean and West Africa, and a fourth programme focused on Sustainable Economy, MAVA works through partnerships with international, national and local NGOs, research institutions and universities, and occasionally with government bodies or individuals.
Finance Watch is a European, not-for-profit association of civil society members, dedicated to making finance work for the good of society. Finance Watch works for a financial system that allocates capital to productive use through fair and open markets, in a transparent and sustainable manner without exploiting or endangering society at large.
Z/Yen helps organisations make better choices - our clients consider us a commercial think-tank that spots, solves and acts. Our name combines Zen and Yen - “a philosophical desire to succeed” - in a ratio, recognising that all decisions are trade-offs. One of Z/Yen’s specialisms is the development and publication of research combining factor analysis and perception surveys.
Long Finance is a Z/Yen initiative designed to address the question “When would we know our financial system is working?” This question underlies Long Finance’s goal to improve society’s understanding and use of finance over the long-term. In contrast to the short-termism that defines today’s economic views the Long Finance time-frame is roughly 100 years. The authors of this report, Greg Ford, Mireille Martini, Simon Mills and Mike Wardle, would like to thank Shevangee Gupta, Bikash Kharel, Nina Lazic, Benoît Lallemand, Michael Mainelli, Mark Yeandle and the rest of the Z/Yen and Finance Watch teams for their contributions with research modelling and ideas.

Global Green Finance Index 1 | 1
Foreword
Over the last 24 years of conservation philanthropy, the MAVA Foundation has supported more than 850 projects to bring human activity in harmony with nature. We are pleased to add the Global Green Finance Index (GGFI) to this list, in partnership with Finance Watch and Z/Yen, as part of our programme to contribute to the creation of a more sustainable global economic system. Great strides have been made by pioneering organisations over the last two decades and green finance is becoming a mainstream economic activity. The MAVA Foundation believes that in the coming years the profile of this field is set to grow rapidly. From tackling global threats such as climate change, to delivering new opportunities in risk management and the financing of technological innovation, financial services have a critical role in achieving the Sustainable Development Goals. As the markets for green finance continue to grow, the field has the potential to drive a shift towards an economy that ensures human prosperity and a healthy planet. In policy terms it is often remarked that “what you measure is what you get”. This new index that measures how ‘green’ financial centres are, will help catalyse movement towards supporting an economy that respects planetary limits and supports sustainable development.
In commissioning the Global Green Finance Index, the MAVA Foundation is seeking to establish a programme which will: • provide insight on what makes a financial
centre ‘green’ or not; • promote a race to the top in green finance;
and • spread best practice in green finance and
green financial centres. In pursuit of these goals the GGFI will be published twice a year with a significant online presence. We hope that the GGFI will give policy makers insight into the growth and competitiveness of green financial centres over time, and encourage the sharing of best practice. We are particularly excited that smaller and more specialised centres, such as Hamburg and San Francisco, and financial centres with strong policy frameworks around green finance, such as Paris, Luxembourg and centres in China have performed well in this first index. The findings in this report show that greener finance can follow its own path of development and that today’s strategic policymaking will be crucial for shaping tomorrow’s green financial centres.
André Hoffman President MAVA, Fondation pour la Nature

2 | Global Green Finance Index 1
Introduction
Welcome to the inaugural Global Green Finance Index (GGFI), the first edition in a series which will chart the progress of the world’s financial centres towards a financial system that delivers sustainable development, and values people and the planet as much as profit. As we accelerate through the 21st Century, the world is facing a number of significant challenges which will require unprecedented levels of investment in systems and infrastructure if they are to be overcome. The UN recognises the vitally important role of a sustainable financial system, which “serves the long term needs of a healthy real economy, an economy that provides decent, productive and rewarding livelihoods for all, and ensures that the natural environment on which we all depend remains intact and so able to support the needs of this and future generations.” 1
Why An Index? Measurement is important, and this is reflected in the mantra of business management, “we value what we measure”. As Mainelli and Harris point out, “Environmental Sustainability is a tough equation”, 2 so the more data we have to work with the better.
However, as Boyle states, we are often “exact about some of the least interesting things, but silent on wider and increasingly important truths.”3
Measurement is only a means to an end. The purpose of measurement is to create the data from which information and knowledge emerge. Information and knowledge which can be used as the basis for sound decision making and policy creation.
We hope that this index will provide policy makers, businesses, academics and NGOs with data that can be used to facilitate the development of sustainable financial systems and the greening of financial products and services. What Are We Seeking To Measure? The GGFI seeks to measure perceptions of the quality and depth of green financial products across the world’s financial centres. This leads to three questions: • What is Green Finance? • What is a financial centre? • How can you measure quality and depth?
1. UNEP 2016 Imagining a Sustainable Financial System http://unepinquiry.org/wp-content/uploads/2016/02/Imagining_a_Sustainable_Financial_System.pdf 2. Mainelli M & Harris I “The Price of Fish: A New Approach To Wicked Economics And Better Decisions” NB Publishing 2011 https://www.amazon.co.uk/Price-Fish-Approach-Economics-Decisions-ebook/dp/B01HPVH806/ref=sr_1_1?s=books&ie=UTF8&qid=1517488400&sr=1-1&keywords=The+price+of+fish 3,.Boyle,D 2010 “The Tyranny of Numbers”, Flamingo; New Ed edition

Global Green Finance Index 1 | 3
What Is Green Finance? Numerous organisations and institutions have developed their own definitions of Green Finance. The G20 defines Green Finance as the “financing of investments that provide environmental benefits in the broader context of environmentally sustainable development”. 4 The OECD considers the term to be “stand-alone, a sub-set of a broader investment theme or closely related to other investment approaches such as SRI (socially responsible investing), ESG (environmental, social and governance investing), sustainable, long-term investing or similar concepts.”5 Deutsches Institut für Entwicklungspolitik (DIE) defines it as the financing of public and private green investments (including preparatory and capital costs) in the following areas: • environmental goods and services (such as water
management or protection of biodiversity and landscapes);
• prevention, minimization and compensation of
damages to the environment and to the climate (such as energy efficiency or dams);
• the financing of public policies (including
operational costs) that encourage the implementation of environmental and environmental-damage mitigation or adaptation projects and initiatives (for example feed-in tariffs for renewable energies);
• components of the financial system that deal specifically with green investments, such as the Green Climate Fund or financial instruments for green investments (e.g. green bonds and structured green funds), including their specific legal, economic and institutional framework conditions.6
For the purposes of the GGFI, Green Finance refers to any financial instrument or financial services activity – including insurance, equity, bonds, commodity and derivatives trading, analytical or risk management tools – which results in positive change for the environment and society over the long term (sustainability). The most basic “greenness” criterion of a company or project is that it contributes to reducing the emission of Greenhouse Gases. Over the last two decades, the rise of new financial instruments, such as Green Bonds, and environmental markets, such as carbon, forestry, or water services, along with advances in analytical techniques, have increased attention on Green Finance. As demonstrated by its prominence in international policy discussions, such in recent World Economic Forum meetings, Green Finance is no longer seen as a fringe activity, but a profitable and desirable sector, which drives financial markets, serves society and enhances the status of financial centres that demonstrate expertise.
4. G20 Green Finance Study Group 2016 G20 Green Finance Synthesis Report http://unepinquiry.org/wp-content/uploads/2016/09/Synthesis_Report_Full_EN.pdf 5. Inderst, G., Kaminker, Ch., Stewart, F. (2012), “Defining and Measuring Green Investments: Implications for Institutional Inves-tors‟ Asset Allocations”, OECD Working Papers on Finance, Insurance and Private Pensions, No.24, OECD Publishing. https://www.oecd.org/finance/WP_24_Defining_and_Measuring_Green_Investments.pdf
6. Lindenberg, N. 2014 Definition of Green Finance, DIE, Bonn https://www.die-gdi.de/uploads/media/Lindenberg_Definition_green_finance.pdf

4 | Global Green Finance Index 1
The transition to a green economy, required if the world is to meet the targets laid down in the Paris Agreement, is a global investment opportunity estimated to be worth tens of trillions of dollars.7 Vast investment is required for sustainable urbanisation in the face of a growing world population.8
Financial services, if properly regulated and sized, are an essential component of a sustainable economy,9 which meets the needs of stakeholders, enhances quality of life, protects the environment and addresses global issues such as climate change. However, there is still a long way to go: so far, only five to ten percent of bank loans are “green”10 (based on data from the few countries where national definitions of green loans are available), brown finance (finance flows that support carbon-intensive projects or activities) still massively overshadows green: G20 countries alone spent USD 72 billion annually in public finance on fossil fuel energy production between 2013 and 2015.11
Financial systems are failing effectively to reflect pricing signals and risk, as financial systems do not routinely take account of environmental costs or environmental limits. Four out of nine “planetary boundaries” have been crossed: climate change, loss of biosphere integrity, land-system change, and altered biogeochemical cycles.12
To help explore these issues, the Global Green Finance Index gives a measure of how financial centres are responding to this challenge. We hope that enabling centres to compare their performance with their peers will improve policy makers’ understanding of the drivers of green growth, and assist them in shaping financial systems to support sustainability goals. What Is A Financial Centre? For practical purposes, a financial centre often means a city with a stock exchange. UNEP defines financial centres “as cities with an intense concentration of financial activity involving an interlocking set of financial sectors and transactions." 13
7. BOE 2017 The Bank of England’s response to climate change Quarterly Bulletin, 2017 Q2 https://www.bankofengland.co.uk/-/media/boe/files/quarterly-bulletin/2017/the-banks-response-to-climate-change.pdf? 8. Von Gunten, C. 2014 Financing Tomorrow’s Cities Z/Yen, London http://www.longfinance.net/images/reports/pdf/COLC_FTCMetaAnalysis_2014.pdf 9. Mainelli, M & Mills, S 2018 Financial Innovations & Sustainable Development Z/Yen ltd, London 10. Dombret, A. & Loriet, A. 2017 “These are the risks and opportunities of Green Finance” WEF https://www.weforum.org/agenda/2017/07/green-finance-risk-and-opportunity/
11. OCI 2017 “Talk Is Cheap: How G20 Governments are Financing Climate Disaster” http://priceofoil.org/content/uploads/2017/07/talk_is_cheap_G20_report_July2017.pdf 12. W Steffen 2015- Planetary Boundaries - an update http://www.stockholmresilience.org/research/research-news/2015-01-15-planetary-boundaries---an-update.html 13. UNEP 2017 Financial Centres For Sustainability UNEP/Corporate Knights https://wedocs.unep.org/bitstream/handle/20.500.11822/20999/Financial_Centres_for_Sustainability.pdf?sequence=1&isAllowed=y

Global Green Finance Index 1 | 5
Our Approach To Measuring Quality And Depth Green financial products and services have been traded for over two decades, but until recently, volumes were quite small and trade tended to be primarily restricted to niche and domestic, rather than mainstream international markets. Measuring the quality and depth of green financial products across the world’s financial centres presents a significant challenge. This has been recognised by the UN and other international bodies and has formed the focus of a number of initiatives, including UNEP FI’s Positive Impact Initiative,14 UNEP’s Financial Centres For Sustainability Initiative,15 Climate KIC, I4CE and PwC’s Benchmark,16 and UN PRI’s Sustainable Stock Exchanges Initiative.17
The GGFI is complementary to these initiatives, as it seeks to use advanced statistical techniques to bridge the gaps in existing data by combining quantitative factors with the perceptions of financial services professionals and other experts. Another strength of this approach is that it is future-facing; combining the real-time opinions of practitioners with past performance data. As survey data for the GGFI is gathered on a continual basis and the intention is to publish updates twice a year, the index will be sensitive to real-time changes in the international policy environment and developments in financial services markets.
The survey asks for views on the penetration of green finance in a financial centre’s overall financial activities. This reflects that the mix of financing activities, such as the ratio between green and brown financing, is important for sustainability. The survey also asks about the quality of green finance, enabling respondents to rate a financial centre independently from its market volumes. Thus, if a centre adopts weak green labelling standards in a bid to boost volumes, this may show up in the GGFI as a lower quality rating. This approach is designed to encourage a race-to-the-top among financial centre policymakers. The GGFI, in combination with the other measurement initiatives listed above will allow the identification of trends, and potentially enable policy makers to track the impacts of their decisions and identify and fill data gaps. We hope to add more instrumental factors to the index as the availability of green finance data improves, and to add more financial centres as we build the number and geographical spread of survey respondents (several centres that did not receive enough assessments to be included in GGFI 1, such as Casablanca, Istanbul and Prague, would have performed relatively well had they had more assessments). Information regarding the methodology used in the development of the GGFI is at Appendix 4.
14. UNEPFI 2017 Positive Impact Initiative http://www.unepfi.org/positive-impact/positive-impact/ 15. UNEP 2017 Financial Centres For Sustainability http://unepinquiry.org/wp-content/uploads/2017/06/Financial_Centres_for_Sustainability.pdf 16. Climate KIC, I4CE and PwC 2017 Benchmarking the Greenness of Financial Centres https://www.i4ce.org/wp-core/wp-content/uploads/2017/12/0118-Climate-KIC2752-Rapport-Benchmarking.pdf 17. UNPRI/UNCTAD 2009 http://www.sseinitiative.org/

6 | Global Green Finance Index 1
GGFI 1 Summary And Headlines
The Global Green Finance Index is based on a
worldwide survey of finance professionals’ views
on the quality and depth of green finance offerings
across 108 international financial centres.
The online survey is at http://
survey.greenfinanceindex.net/. Please take a
moment to fill it in if you have not already done so:
the survey is running continuously, and the more
responses are collected, the more significant the
results.
The 47 centres listed in this first edition of the Index (GGFI 1) are those which received a minimum of ten assessments from survey respondents. Assessments of respondents’ home centres were excluded from the data in ordered to avoid home centre bias. The assessments were combined with 113 Instrumental factors to give an overall rating for each centre. These instrumental factors are quantitative measures provided by third parties including Corporate Knights, the Carbon Bonds Initiative, the World Health Organisation, the United Nations Environment Programme Finance Initiative and the World Bank among others. We received 1,790 ratings from 337 individual respondents over two months, from 15 December 2017 to 5 February 2018. Details of the profile of these respondents can be found in Appendix 3. The survey runs continuously online and will be sampled every six months in order to generate further editions of the index.
18. Climate-KIC, I4CE and PwC, "Benchmarking the greenness of financial centres", December 2017 https://www.i4ce.org/wp-core/
wp-content/uploads/2017/12/0118-Climate-KIC2752-Rapport-Benchmarking.pdf
The Results – Penetration And Quality of Green Finance • The ratings for penetration of green finance
in a centre’s overall financial offering range between 333 and 402 out of 1000. This is equivalent to between three and four out of ten on a ten point scale. These assessments are higher than the very low historical market data on penetration - for example green bonds made up only 2.08% or less of G7 national bond markets in 201718 - and suggests that due to their involvement with the field or the general level of debate around green finance, survey respondents may perceive green finance as being more prevalent than it is.
• The ratings for quality given to centres
range between 322 and 437 out of 1,000. The generally low assessments given to centres by respondents, particularly for penetration, indicate that the green finance sector commands a relatively small share of global finance and there is significant room for growth in the range and quality of products on offer.
“Important that skilled
professionals have ease of
movement to different centres
- universally recognised
credentials are necessary.”
Central Banker, Brunei

Global Green Finance Index 1 | 7
Green Finance Innovation: Luxembourg - Luxembourg Green Exchange
In 2016, the Luxembourg Stock Exchange launched the Luxembourg Green Exchange (LGX), the
world’s first platform exclusively dedicated to green securities, and today listing half the world’s
green bonds. The LGX today also features a dedicated social and sustainable bond window.
Luxembourg has a long-established track record as the location of choice for sustainable and impact
investment funds, with a total market share of 39% of responsible investment funds in European,
over 60% of European impact funds as well as over 60% of global microfinance assets, and has been
a pioneer in the area of sustainable finance labels for more than a decade.
http://www.luxembourgforfinance.com/en/products-services/luxembourg-natural-choice-
international-sustainable-finance
• Narrow margins separate ranked centres. 115 points separate the top and bottom centres in the quality index (the equivalent of one point on an assessment scale of one to ten) and a mere 69 points separate them for penetration. As further editions of the index are published, rankings are likely to be sensitive to change because of the narrow margins between ratings.
• Western Europe does well, featuring nine of the top ten centres in the quality index and seven of the top ten in the penetration index. 21 of the 47 centres in the index are in Western Europe. London came top for both measures, closely followed by Amsterdam for Quality and Luxembourg for penetration. Only 58 points separate the top five centres for quality and just 21 points for penetration.
• San Francisco and Washington come equally in
tenth place in the ranking as the top North American centres in the quality index. San Francisco is also the top North American centre in the penetration index. Despite being acknowledged as one of the world’s top financial centres, New York was significantly outperformed by other North American centres in the GGFI.
• Shanghai and Shenzhen were top in the Asia Pacific region for quality and penetration respectively. Chinese centres all performed well and were closely clustered in terms of ratings.
• Johannesburg is the top-ranked centre in The
Middle East and Africa for quality, with Cape Town just below. Cape Town is the top centre in the penetration index in this region.
• Mexico City and Moscow were the only centres to achieve sufficient assessments to be listed in the Latin America and the Caribbean and Eastern Europe and Central Asian regions.
• The index appears to demonstrate an element
of centre specialism. Centres which have demonstrated significant leadership on green finance, such as Paris, Luxembourg, and the Chinese centres, have achieved high ranking in the index.

8 | Global Green Finance Index 1
Green Finance Innovation: San Francisco -
Green Bonds
San Francisco is a hub for cleantech finance. San Francisco benefits from California’s long-standing leadership on both climate change and clean energy, as well as the state’s active promotion of green finance. Public authorities in the City and Bay Area have also been active in the green bond market, issuing over US$1 billion to date. The local private sector is also participating, with Apple making US$2.5 billion in issuances. https://sfwater.org/index.aspx?page=1182
Additional findings
As part of the questionnaire, respondents were
asked their views on the future prospects of green
financial centres, on which areas of green finance
from a list of options given in the survey were of
most interest, which areas would have the
greatest impact on sustainability, and which
factors are driving the uptake of green finance.
Full results of the responses to these questions are
in Appendix 2.
Future Prospects
• Paris, New Delhi, and Los Angeles led the centres whose green finance offerings were expected to improve significantly over the next two to three years.
• Paris, Frankfurt, and New York led the centres most cited as likely to become more significant over the next two to three years.
• Moscow, Boston and Chicago were the centres most expected to decline in green finance over the next two to three years.
Areas Of Interest
From the list of options given in the survey:
• Green bonds and renewable energy investment scored highly as areas of interest in green finance, as did emerging areas such as Sustainable Infrastructure Finance and Energy Efficiency. Established areas such as Social and Impact Investment ESG analytics also did well.
• Respondents showed less interest in Climate
Risk Stress Testing, Disinvestment from Fossil Fuels, Carbon Markets and Carbon Disclosure, Natural Capital Valuation, and Green Insurance;
• Amongst other areas highlighted by
respondents were the circular economy and green quantitative easing.

Global Green Finance Index 1 | 9
Areas Of Impact
• With respect to views on the areas of green finance with the greatest impact on sustainable development, Renewable Energy Investment, Green Bonds and Sustainable Infrastructure Finance were rated highest.
• ESG analytics, Social and Impact Investment and
Disinvestment from Fossil Fuels were also ranked highly. The inclusion of Divestment from Fossil Fuels amongst the highest rankings in areas of impact contrasts with “areas of interest” where it received considerably less attention.
• There was a close correlation between interest
and impact suggesting that, with the exception of Disinvestment from Fossil Fuels, the financial professionals working within green finance are driven to focus their attention on the areas they consider will have the most beneficial impact on sustainable development.
Drivers Of Green Finance
• There were two themes that arose from respondents’ views on the drivers of the uptake of green finance.
First, an enabling policy framework - at
national and international level driving tax incentives, mandatory disclosure and technological change.
Second, demand – from investors, climate
change, public awareness, and infrastructure investment.
• These results appear to show that people in green finance markets recognise that policy has a critical role as an enabler both for technological change and in developing investor demand.
• Food security and loss of biodiversity score low
as drivers, which may suggest that these areas are currently a low priority in terms of the development of green finance products, or in policy.
• Few respondents gave insurance industry
research and academic research high scores as drivers of Green Finance uptake. Tthis may reflect the interests of respondents, few of whom were from the insurance industry.
Green Finance Innovation: Moscow - Capital Repairs Russia accounts for largest proportion of climate-aligned bonds from Eastern Europe. In addition to bond issuance associated with infrastructure renewal, a significant driver has been the Law on Capital Repairs (adopted in 2013), a large scale housing policy reform, established a new system for financing capital repairs of multi-family buildings in Russia, with increased role of the private sector, leading to climate change benefits.

10 | Global Green Finance Index 1
Conclusions
This is the first edition of the GGFI and ,as further editions of the index are developed, the data on which we base our conclusions will grow richer. The conclusions we reach at this stage are as follows: • Green finance is perceived as being more
prevalent than the data suggests;
• The market in green finance is immature;
• Respondents recognise the importance of policy frameworks and investor demand in fuelling the growth of green finance markets;
• There is a disconnection between some areas of high impact, such as disinvestment from fossil fuels, and areas of interest and activity, suggesting a potential role for policy action;
• There is a narrow range in the ratings of financial centres meaning that the index is reactive to changes in policy and market conditions;
• The relative positions of financial centres show that financial centres can pull ahead of more dominant rivals through specialisation, encouraged by policy frameworks;
• The level of response we had to our survey from the global finance community demonstrates a high level of interest in this area.
Green Finance Innovation: Paris - Finance For Tomorrow
Finance for Tomorrow is a major initiative led by Paris EUROPLACE and opinion leader in the Paris
Financial Center to promote sustainable finance in France and internationally. The objective of this
initiative, which is supported at the highest levels of the French Government, is to contribute to a shift in
financial flows towards a low carbon and inclusive economy, in line with the Paris Agreement and the UN
Sustainable Development Goals.
https://financefortomorrow.com/en/
Outlook For Further Research
As noted, we are in the early stages of the index, which is a piece of longitudinal research. Our work so far raises a number of questions that invite further research. We will explore these as we gather more data. Experience from other research suggests that significant improvements will be taking place in centres as we move forward and that as the data we have grows, we will be able to develop our analysis. Areas for further research are likely to include: • Which factors lead to significant improvements
in centres over time? • Which policy and regulatory changes are having
most effect? • How those working in different sectors and with
differing levels of involvement in green finance view the field?

Global Green Finance Index 1 | 11
GGFI 1 Ranks And Ratings
Table 1 | Ranks And Ratings Of Green Finance Penetration
Centre GGFI 1
Rank Rating
London 1 402
Luxembourg 2 389
Copenhagen 3 385
Amsterdam 4 384
Paris 5 381
Shenzhen 6 380
Stockholm 7 379
Guangzhou 8= 376
Zurich 8= 376
Shanghai 10= 375
Beijing 10= 375
Brussels 12 374
Hamburg 13 370
Sydney 14 367
Singapore 15 366
San Francisco 16 365
Munich 17= 364
Seoul 17= 364
Los Angeles 19= 361
Frankfurt 19= 361
Tokyo 19= 361
Dublin 22 360
Hong Kong 23 359
Washington DC 24 358
Centre GGFI 1
Rank Rating
Edinburgh 25 357
Milan 26= 356
Jersey 26= 356
Geneva 26= 356
Cape Town 29 355
Toronto 30= 353
Madrid 30= 353
Vienna 32 351
Rome 33= 350
Johannesburg 33= 350
Boston 35 348
Kuala Lumpur 36= 346
Dubai 36= 346
Isle of Man 38= 343
Chicago 38= 343
Abu Dhabi 38= 343
Mexico City 41= 342
Guernsey 41= 342
New York 43 341
Mumbai 44= 335
Bangkok 44= 335
New Delhi 46= 333
Moscow 46= 333

12 | Global Green Finance Index 1
Table 2 | Ranks and Ratings Of Green Finance Quality
Centre GGFI 1
Rank Rating
London 1 437
Amsterdam 2 385
Brussels 3 383
Hamburg 4 381
Paris 5 379
Stockholm 6= 378
Luxembourg 6= 378
Zurich 8 375
Copenhagen 9 374
San Francisco 10= 369
Washington DC 10= 369
Shanghai 12 364
Shenzhen 13 362
Singapore 14= 361
Edinburgh 14= 361
Geneva 16= 360
Sydney 16= 360
Los Angeles 16= 360
Frankfurt 19 359
Beijing 20= 357
Jersey 20= 357
Tokyo 22 356
Guangzhou 23 354
Munich 24= 353
Centre GGFI 1
Rank Rating
Dublin 24= 353
Rome 24= 353
Vienna 24= 353
Milan 28 352
Hong Kong 29 348
Boston 30= 347
New York 30= 347
Johannesburg 32 343
Cape Town 33 342
Toronto 34= 341
Seoul 34= 341
New Delhi 36= 340
Isle of Man 36= 340
Madrid 36= 340
Guernsey 39 339
Chicago 40 338
Dubai 41 332
Mumbai 42 329
Kuala Lumpur 43= 328
Mexico City 43= 328
Bangkok 45 327
Abu Dhabi 46 326
Moscow 47 322

Global Green Finance Index 1 | 13
Chart 1 | Relationship Between Ratings Of Penetration and Quality
Chart 1 shows the relationship between ratings of penetration and quality in the index. The ratings are universally low, however, this chart shows the
generally close correlation between the assessments of each factor by respondents.
“Many more people are gaining exposure to green finance and so
the skill set is developing. As knowledge grows the confidence
grows too.”
Head of Responsible Business, Wealth Advisers, London

14 | Global Green Finance Index 1
Future Prospects We asked respondents to identify which financial centres they thought would become more significant as green finance centres over the next two to three years. Table 3 shows the top five centres mentioned. It is notable that both Paris and Frankfurt, as the top centres mentioned, have developed strong leadership to promote green finance and have created a policy framework which is likely to enhance the scope and range of opportunities in green finance.
Table 3 | The Five Centres Likely To Become More
Significant
Centre Number of Mentions
Paris 19
Frankfurt 12
New York 11
Singapore 10
London 9
GGFI 1 Further Analysis
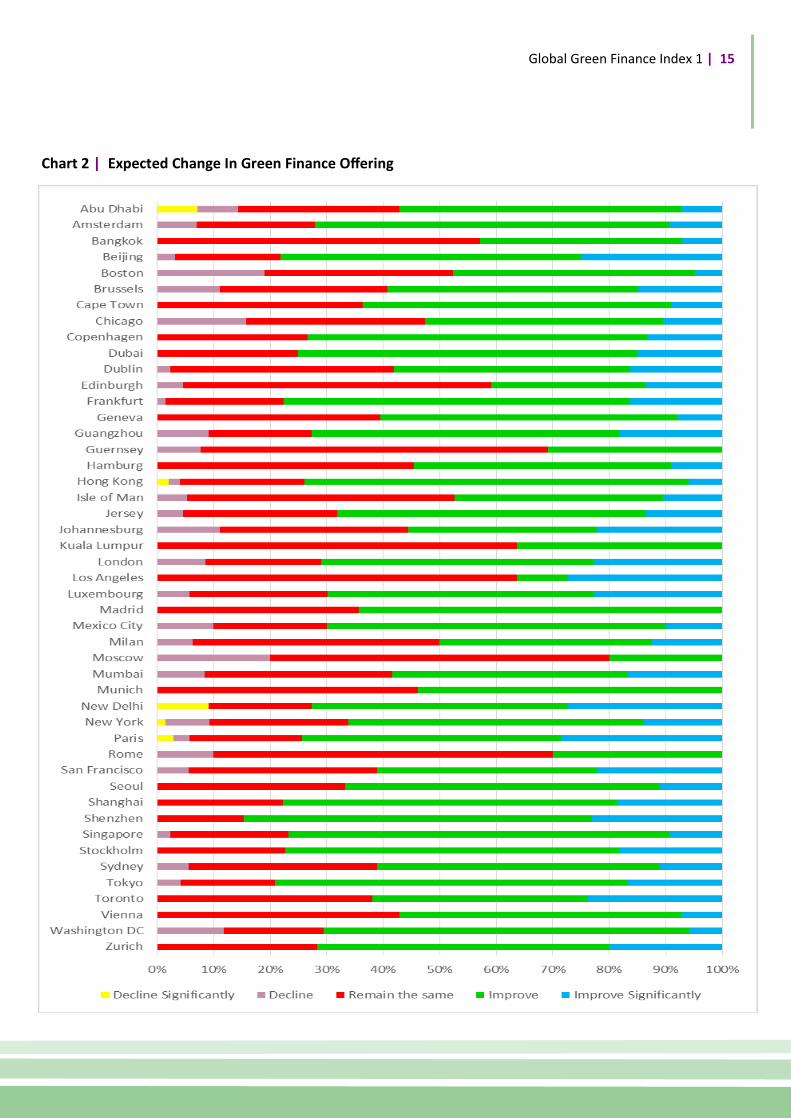
We asked respondents to the questionnaire to give a view as to whether the centres they rated would improve, decline or stay the same in relation to their Green Finance offering over the next two to three years. The results are displayed in Chart 2. Overall the picture is optimistic. Thirty-seven of the 47 centres in the index are considered likely to improve by over half the respondents who rated them. For 17 centres, over 70 percent of those who commented expected them to improve their green finance offering over the next two to three years. Centres whose green finance offerings were most expected to improve significantly over the next two to three years included Paris, New Delhi, Los Angeles, Beijing and Toronto. Centres whose green finance offerings were most expected to decline or significantly decline over the next two to three years included Moscow, Boston, Chicago, Abu Dhabi and Washington DC.
Expected Change In Centres
“This offers an opportunity for
smaller financial centres to
find niche markets in green
finance - by building up an
ecosystem of relevant
(specialized) skills.
Luxembourg and Singapore
are good emerging examples.”
Senior Analyst, Equity and Capital Markets, London
Global Green Finance Index 1 | 15
Chart 2 | Expected Change In Green Finance Offering

16 | Global Green Finance Index 1
Instrumental Factors
The GGFI is created using 113 instrumental factors
which relate to a range of aspects of
competitiveness, including green measures.
Table 4 shows the top ten instrumental factors in
terms of their correlation with the ranking of
penetration and quality. It is notable that many of
these factors are not specifically related to
sustainability.
Table 4 | Top Ten Instrumental Factors by R Squared Correlation
Penetration R Squared Quality R Squared
Networked Society Index 0.366 Networked Society Index 0.359
Global Sustainable Competitiveness Index
0.285 Logistics Performance Index 0.333
OECD Country Risk Classification 0.273 Global Innovation Index 0.322
Logistics Performance Index 0.254 Legatum Prosperity Index 0.299
Global Innovation Index 0.243 Global Enabling Trade Report 0.283
Global Enabling Trade Report 0.228 Open Government 0.282
Sustainable Cities Index 0.211 Global Sustainable Competitiveness Index
0.281
Wage Comparison Index 0.210 Quality of Living City Rankings 0.279
CBI labelled green bonds by exchange (preliminary data)
0.205 Sustainable Cities Index 0.278
Quality of Living City Rankings 0.197 Global Intellectual Property Index 0.267
“Ireland boasts a strong knowledge centre regarding Green
Finance with strong transferable skills. Investment in tertiary
education graduates with appropriate green finance skill-sets is
critical to developing the industry.”
Debt and Derivatives Adviser, Dublin

Global Green Finance Index 1 | 17
Penetration R Squared Quality R Squared
CBI labelled green bonds by exchange (preliminary data)
0.294 IESE cities in motion index 0.356
Logistics Performance Index 0.277 Sustainable Cities Index 0.344
Global Sustainable Competitiveness Index
0.253 Global Sustainable Competitiveness Index
0.329
Sustainable Cities Index 0.219 Railways per Land Area 0.303
IESE cities in motion index 0.206 Sustainable Economic Development 0.282
Sustainable Economic Development
0.197 Logistics Performance Index 0.271
Railways per Land Area 0.193 CBI labelled green bonds by exchange (preliminary data)
0.260
Quality of Domestic Transport Network
0.129 Environmental Performance 0.255
Financial institutions clean revenue to fossil-related
0.128 Shares of wind and solar in electricity
0.218
Share of renewables in electricity production
0.128 Air Quality Data 0.211
Table 5 | Top Ten ‘Green’ Instrumental Factors By R Squared Correlation
Focusing only on the instrumental factors which relate to sustainability, the factors most closely correlated
in terms of their R Squared relationship with the GGFI rankings are set out in Table 5.
Green Finance Innovation: Guangzhou - Green Finance Pilot Zone China is investing billions into clean energy, promoting the use of electric vehicles, investing in low-emissions infrastructure for its fast-growing cities, and widening the options for green financing. Guangzhou, is one of five pilot zones established in China to promote “green finance” and help for state efforts to tackle pollution, which are expected to cost at least 3 trillion yuan ($440 billion) a year. The capital of the industrialized Guangdong region, on China’s southeast coast, has been encouraged to develop credit mechanisms to support energy conservation and the reduction of emissions. http://ets-china.org/news/china-carbon-market-100-index-released-at-green-finance-forum-in-guangzhou/

18 | Global Green Finance Index 1
When all instrumental factors are taken into
account, it is apparent that the preferences for
high performing green financial centres are similar
to those for high performing international financial
centres - stable governance, a highly skilled
workforce, good trade links, and effective IT
infrastructure. However, a focus on sustainability
features prominently, particularly with respect to
market penetration.
When the scope is narrowed to green instrumental
factors, the size of labelled green bonds listed in a
centre stands out clearly in respect of penetration.
With respect to quality, things are more nuanced.
The top three factors in this analysis are:
• The Instituto de Estudios Superiores de la
Empresa (IESE) Cities in Motion Index. This index
evaluates cities in relation to ten dimensions the
economy, human capital, technology, the
environment, international outreach, social
cohesion, mobility and transportation,
governance, urban planning and public
management;
• The Arcadis Sustainable Cities Index. This ranks
100 global cities on three dimensions of
sustainability: people, planet and profit. These
represent social, environmental and economic
sustainability and offer an indicative picture of
the health and wealth of cities for the present
and the future.
• The Global Sustainable Competitiveness Index,
which measures current and future capability of
countries (nation-economies) to generate and/
or sustain financial and non-financial income
and wealth for its population. The Global
Sustainable Competitiveness Index is based on
109 quantitative performance indicators,
grouped in the five pillars of sustainable
competitiveness: natural capital, resource
intensity, intellectual capital, social cohesion,
and governance.
All three of these indices attempt to measure
sustainability performance at a national or local
level and cover social economic and environmental
factors. Cities, or cities located in nations scoring
highly in these indices, are likely to display the
following characteristics:
• Respect for the environment – characterised by
a well-defined policy framework;
• Respect for law – characterised by a well-
developed and progressive legal system; and
• High levels of social cohesion – characterised by
a high standard of living and low levels of crime.
Green Finance Innovation: Copenhagen - State
of Green
Denmark’s decision to become independent of
fossil fuels by 2050, is backed by an ambitious
policy framework which provides fertile ground
for domestic green finance. The use of blended
finance (the complementary use of grant-
equivalent instruments and non-grant financing
to enhance the risk profile of projects) has
enabled Danish financial institutions to invest in
sustainable infrastructure projects around the
world, enhancing the domestic eco-tech sector
and expertise in green finance products.
https://stateofgreen.com/files/download/9511

Global Green Finance Index 1 | 19
We have also conducted an analysis of the
assessments provided by respondents using only
the instrumental factors that have a direct
relationship to sustainability. This analysis
produces slightly different results to the main index
as shown in the comparison in Table 6.
Green Finance Innovation: Mexico City - Green Corridor Mexico City issues some $200m in municipal bonds every year. In December 2016 it became the first city in Latin America to finalise a green bond worth $50m (1 billion pesos) to finance the Green Corridor, an ambitious plan to build a 23 km “green corridor” along the Eje 8 Sur Popocatepetl, one of Mexico City’s largest arterial roads. In developing this bond, Mexico City worked with C40 Cities Finance Facility (CFF) to develop a sellable plan. Launched at the Paris COP21, the CFF assists cities to develop capacity to prepare urban climate change projects.
All Factors Green Factors
Penetration Quality Penetration Quality Rank
London London London London 1
Brussels Amsterdam Luxembourg Luxembourg 2
Copenhagen Brussels Paris Copenhagen 3
Paris Hamburg Amsterdam Amsterdam 4
Luxembourg Paris Shanghai Paris 5
Amsterdam Stockholm Beijing Shenzhen 6
Zurich Luxembourg Copenhagen Stockholm 7
Shanghai Zurich Shenzhen Guangzhou 8
Geneva Copenhagen Zurich Zurich 9
Jersey San Francisco Brussels Beijing 10
Frankfurt Washington DC Stockholm Shanghai 11
Washington DC Shanghai Guangzhou Brussels 12
Munich Shenzhen Singapore Hamburg 13
Beijing Singapore Sydney Sydney 14
Stockholm Edinburgh Munich Singapore 15
Table 6 | Top 15 Centres Using All Factors And Only Green Factors

20 | Global Green Finance Index
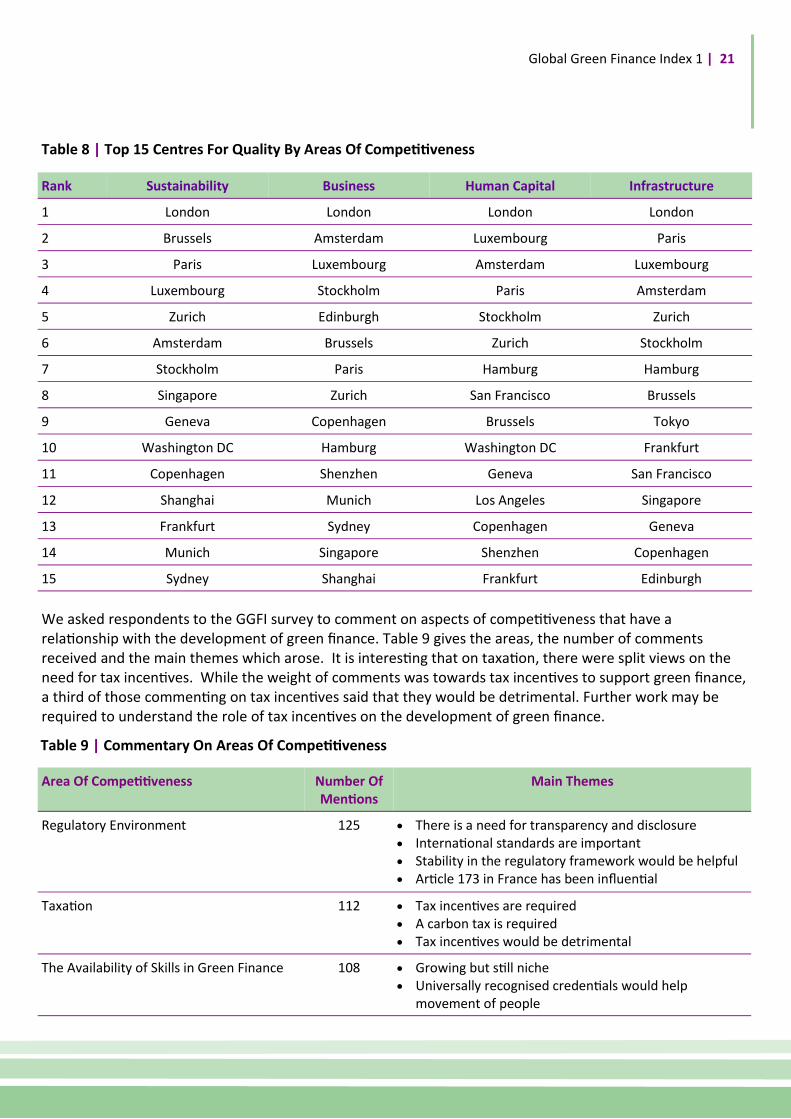
Areas Of Competitiveness
The instrumental factors used in the GGFI model
are grouped into four broad areas:
• Sustainability;
• Business;
• Human Capital;
• Infrastructure.
To assess how financial centres’ green finance
offerings perform against each of these areas, the
GGFI model is run for each area separately.
The top ranked 15 centres for penetration and
quality in each sub-index are shown in Tables 7
and 8.
Rank Sustainability Business Human Capital Infrastructure
1 London London London London
2 Luxembourg Shenzhen Luxembourg Paris
3 Paris Luxembourg Copenhagen Luxembourg
4 Shanghai Amsterdam Paris Amsterdam
5 Amsterdam Paris Stockholm Stockholm
6 Beijing Stockholm Amsterdam Zurich
7 Brussels Shanghai Shenzhen Copenhagen
8 Zurich Beijing Shanghai Beijing
9 Shenzhen Zurich Zurich Shanghai
10 Stockholm Copenhagen Guangzhou Brussels
11 Copenhagen Sydney Beijing Hamburg
12 Singapore Hamburg Brussels Tokyo
13 Guangzhou Guangzhou Singapore Singapore
14 Sydney Seoul Sydney Munich
15 Frankfurt Munich San Francisco Shenzhen
Table 7 | Top 15 Centres For Penetration By Areas Of Competitiveness
“Government has a key role in providing a regulatory framework
that drives change.”
Head of Economics and Climate Change, Edinburgh
Global Green Finance Index 1 | 21
Rank Sustainability Business Human Capital Infrastructure
1 London London London London
2 Brussels Amsterdam Luxembourg Paris
3 Paris Luxembourg Amsterdam Luxembourg
4 Luxembourg Stockholm Paris Amsterdam
5 Zurich Edinburgh Stockholm Zurich
6 Amsterdam Brussels Zurich Stockholm
7 Stockholm Paris Hamburg Hamburg
8 Singapore Zurich San Francisco Brussels
9 Geneva Copenhagen Brussels Tokyo
10 Washington DC Hamburg Washington DC Frankfurt
11 Copenhagen Shenzhen Geneva San Francisco
12 Shanghai Munich Los Angeles Singapore
13 Frankfurt Sydney Copenhagen Geneva
14 Munich Singapore Shenzhen Copenhagen
15 Sydney Shanghai Frankfurt Edinburgh
Table 8 | Top 15 Centres For Quality By Areas Of Competitiveness
We asked respondents to the GGFI survey to comment on aspects of competitiveness that have a relationship with the development of green finance. Table 9 gives the areas, the number of comments received and the main themes which arose. It is interesting that on taxation, there were split views on the need for tax incentives. While the weight of comments was towards tax incentives to support green finance, a third of those commenting on tax incentives said that they would be detrimental. Further work may be required to understand the role of tax incentives on the development of green finance.
Area Of Competitiveness Number Of Mentions
Main Themes
Regulatory Environment 125 • There is a need for transparency and disclosure • International standards are important • Stability in the regulatory framework would be helpful • Article 173 in France has been influential
Taxation 112 • Tax incentives are required • A carbon tax is required • Tax incentives would be detrimental
The Availability of Skills in Green Finance 108 • Growing but still niche • Universally recognised credentials would help
movement of people
Table 9 | Commentary On Areas Of Competitiveness

22 | Global Green Finance Index
Connectivity
One factor in the way in which financial centres’
green finance performance differs is the extent to
which centres are connected to other financial
centres.
One way of measuring this connectivity is to look at
the number of assessments given to and received
from other centres. Charts 3 and 4 use Shanghai
and Guangzhou as examples to contrast the
different levels of connectivity that the two centres
enjoy. Chart 3 | GGFI 1 Connectivity - Shanghai
Chart 4 | GGFI 1 Connectivity - Guangzhou
Table 10 | Relationship Between Number And
Spread Of Assessments For Top Ten Centres
Ranked On The Number Of Assessments They
Received
Centre Number Of Assessments
Number Of Centres Providing Assessments
London 95 27
Paris 72 20
Frankfurt 71 19
New York 68 22
Zurich 61 17
Luxembourg 55 16
Hong Kong 51 20
Amsterdam 45 15
Singapore 44 15
Dublin 44 12

Global Green Finance Index 1 | 23
‘Connectivity’ – the extent to which a centre is
well known around the world, and how much
non-resident professionals believe it is
connected to other green financial centres.
A centre’s connectivity is assessed using a
combination of ‘inbound’ assessment locations
(the number of locations from which a
particular centre receives assessments) and
‘outbound’ assessment locations (the number
of other centres assessed by respondents from
a particular centre).
If the weighted assessments for a centre are
provided by over 13 per cent of other centres,
this centre is deemed to be ‘Global’. If the
ratings are provided by over seven per cent of
other centres, this centre is deemed to be
‘International’.
Using clustering and correlation analysis we
have identified three measures (axes) that
determine a financial centre’s profile along
different dimensions relating to its offering.
‘Diversity’– the breadth of financial industry
sectors that flourish in a financial centre. We
consider this sector ‘richness’ to be
measurable in a similar way to that of the
natural environment. We therefore use a
combination of biodiversity indices (calculated
on the instrumental factors) to assess a
centre’s diversity. A high score means that a
centre is well diversified; a low diversity score
reflects a less rich business environment.
‘Speciality’ – the depth within a financial
centre of green finance and sustainability. A
centre’s ‘speciality’ or performance is
calculated from the difference between the
GGFI rating and the ratings based only on
sustainability factors.
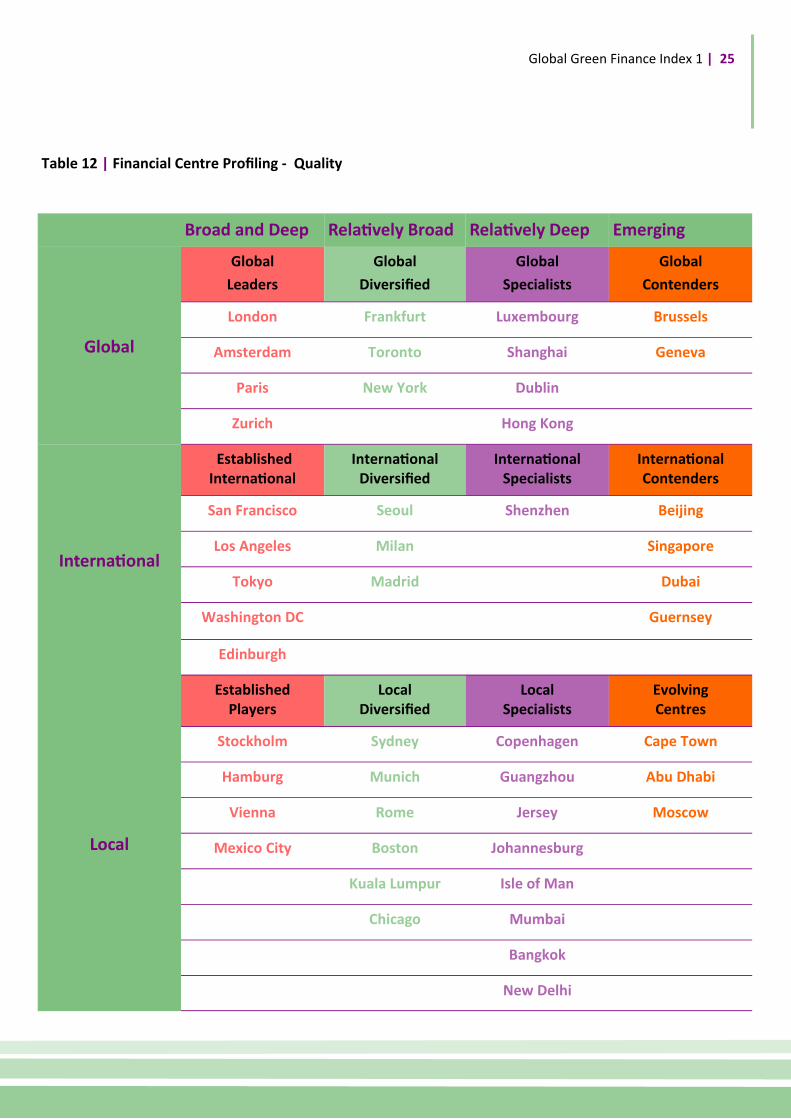
In Tables 11 and 12, ‘Diversity’ (Breadth) and
‘Speciality’ (Depth) are combined on one axis
to create a two dimensional table of financial
centre profiles, first for penetration and
second for quality. The 47 centres in GGFI 1
are assigned a profile on the basis of a set of
rules for the three measures: how well
connected a centre is, how broad its services
are, and how specialised it is.
The Global Leaders (in the top left of the
tables) have both broad and deep green
finance activity and are connected with a
greater range of other financial centres. Other
leading centres are profiled as Established
International Centres.
Financial Centre Profiles

24 | Global Green Finance Index
Broad and Deep Relatively Broad Relatively Deep Emerging
Global
Global
Leaders
Global
Diversified
Global
Specialists
Global
Contenders
London Frankfurt Luxembourg Shanghai
Amsterdam Toronto Brussels Dublin
Paris New York Hong Kong Geneva
Zurich
International
Established International
International Diversified
International Specialists
International Contenders
San Francisco Washington DC Shenzhen Beijing
Seoul Singapore
Los Angeles Dubai
Tokyo Guernsey
Edinburgh
Milan
Madrid
Local
Established Players
Local Diversified
Local Specialists
Evolving Centres
Stockholm Vienna Copenhagen Mumbai
Hamburg Boston Guangzhou New Delhi
Sydney Chicago Jersey Moscow
Munich Cape Town
Rome Johannesburg
Kuala Lumpur Isle of Man
Mexico City Abu Dhabi
Bangkok
Table 11 | Financial Centre Profiling - Penetration
Global Green Finance Index 1 | 25
Broad and Deep Relatively Broad Relatively Deep Emerging
Global
Global
Leaders
Global
Diversified
Global
Specialists
Global
Contenders
London Frankfurt Luxembourg Brussels
Amsterdam Toronto Shanghai Geneva
Paris New York Dublin
Zurich Hong Kong
International
Established International
International Diversified
International Specialists
International Contenders
San Francisco Seoul Shenzhen Beijing
Los Angeles Milan Singapore
Tokyo Madrid Dubai
Washington DC Guernsey
Edinburgh
Local
Established Players
Local Diversified
Local Specialists
Evolving Centres
Stockholm Sydney Copenhagen Cape Town
Hamburg Munich Guangzhou Abu Dhabi
Vienna Rome Jersey Moscow
Mexico City Boston Johannesburg
Kuala Lumpur Isle of Man
Chicago Mumbai
Bangkok
New Delhi
Table 12 | Financial Centre Profiling - Quality

26 | Global Green Finance Index 1
1/1
2/6
3/9
22/24 4/2
5/5
7/6
8/8
25/14
13/4
12/3
1919
17/24
16/10
19/16
26/16
2620
26/28
24/10
35/30
33/24
32/24
30/36
30/34
38/36
43/30
41/39
41/43
38/40
The GGFI 1 World

Global Green Finance Index 1 | 27
46/47
6/13
8/23
10/12
10/20
14/16
15/14
17/34
19/22
22/29
36/43
33/32
29/33
36/41
44/45
44/42
38/46
46/36
The numbers on the map indicate the rankings first for
penetration and second for quality in GGFI 1

28 | Global Green Finance Index 1
Table 13 shows the top 10 Western European
Centres in GGFI 1 for penetration and quality.
Overall, Western Europe performed well in the
index, holding seven out of the top ten rankings for
penetration and nine out of the top ten for quality.
Twenty-one of the 47 centres in the index are
located in Western Europe.
Gibraltar, Lisbon, Malta, Helsinki, Liechtenstein,
Oslo, and Glasgow were close to inclusion in the
index, but did not receive the required number of
assessments.
Regional Analysis
Western Europe
Penetration Quality
Centre
Centre GGFI 1 GGFI 1
Rank Rating Rank Rating
London 1 402 London 1 437
Luxembourg 2 389 Amsterdam 2 385
Copenhagen 3 385 Brussels 3 383
Amsterdam 4 384 Hamburg 4 381
Paris 5 381 Paris 5 379
Stockholm 7 379 Stockholm 6 378
Zurich 8 376 Luxembourg 6 378
Brussels 12 374 Zurich 8 375
Hamburg 13 370 Copenhagen 9 374
Munich 17 364 Edinburgh 14 361
Table 13 | Western European Top Ten Centres In GGFI
Green Finance Innovation: London - Green Investment Group
The new, fully integrated, business brings together the Green Investment Bank and Macquarie
Capital’s renewable team to create one of Europe’s largest team of specialist investors. The Green
Investment Group continues to have a strong relationship with the UK Government, making
investments in developing economies and managing assets in the UK on its behalf.
http://greeninvestmentgroup.com/what-we-do/

Global Green Finance Index 1 | 29
Table 14 shows the top ten performing centres for
penetration and quality in the Asia Pacific region. A
total of 13 Asia Pacific centres feature in the index,
with Shenzhen coming highest for penetration and
Shanghai just above Shenzhen for quality. Chinese
centres did well in the index.
Melbourne, Jakarta, and Manila all received just
under the minimum threshold of assessments to
be included in the index this time.
Asia Pacific
Table 14 | Asia Pacific Top Ten Centres In GGFI 1
Penetration Quality
Centre
Centre GGFI 1 GGFI 1
Rank Rating Rank Rating
Shenzhen 6 380 Shanghai 12 364
Guangzhou 8 376 Shenzhen 13 362
Beijing 10 375 Singapore 14 361
Shanghai 10 375 Sydney 16 360
Sydney 14 367 Beijing 20 357
Singapore 15 366 Tokyo 22 356
Seoul 17 364 Guangzhou 23 354
Tokyo 19 361 Hong Kong 29 348
Hong Kong 23 359 Seoul 34 341
Kuala Lumpur 36 346 New Delhi 36 340
“In Asia, a lot of the green finance innovation is being driven by
governments and regulatory bodies; there is a competition
between Singapore, Hong Kong and Tokyo to become the 'green
finance centres' of Asia.” Bond Analyst, Toronto

30 | Global Green Finance Index 1
Seven centres in North America are included in the
index. San Francisco is highest for penetration and
quality. Los Angeles and Washington DC also
scored highly.
Toronto is the only Canadian centre in the index.
Calgary, Montreal, and Vancouver received almost
enough assessments to join the index.
North America
Penetration Quality
Centre GGFI 1
Centre GGFI 1
Rank Rating Rank Rating
San Francisco 16 365 San Francisco 10 369
Los Angeles 19 361 Washington DC 10 369
Washington DC 24 358 Los Angeles 16 360
Toronto 30 353 Boston 30 347
Boston 35 348 New York 30 347
Chicago 38 343 Toronto 34 341
New York 43 341 Chicago 40 338
Four centres in the Middle East and Africa feature
in the index with Cape Town and Johannesburg
regional leaders for both penetration and quality.
Dubai and Abu Dhabi in the Middle East are both
ranked higher for penetration than quality.
Casablanca, Nairobi, Riyadh, and Mauritius are all
close to receiving the number of assessments
required to feature in the index, with Casablanca
scoring particularly well from the assessments it
received.
The Middle East & Africa
Table 16 | Middle East & African Centres In GGFI 1
Penetration Quality
Centre GGFI 1
Centre GGFI 1
Rank Rating Rank Rating
Cape Town 29 355 Johannesburg 32 343
Johannesburg 33 350 Cape Town 33 342
Dubai 36 346 Dubai 41 332
Abu Dhabi 38 343 Abu Dhabi 46 326
Table 15 | North American Centres in GGFI 1

Global Green Finance Index 1 | 31
Latin America & The Caribbean
Only Mexico City appears in the index from this
region.
The Cayman Islands and Sao Paulo were both just
outside the index on the number of assessment
they received from other centres.
Penetration Quality
Centre GGFI 1
Centre GGFI 1
Rank Rating Rank Rating
Mexico City 41 342 Mexico City 43 328
Moscow is the only centre from Eastern Europe
and Central Asia to receive enough assessments to
be included in the index.
Istanbul and Prague had almost enough
assessments to feature in the index and received
good scores from those who assessed them.
Eastern Europe & Central Asia
Penetration Quality
Centre GGFI 1
Centre GGFI 1
Rank Rating Rank Rating
Moscow 46 333 Moscow 47 322
Table 18 | Eastern European &Central Asian Centres in GGFI 1
Table 17 | Latin American & Caribbean Centres In GGFI 1
Green Finance Innovation: Cape Town - Greencape South Africa ranks 13th out of 21 countries to use tax as an incentive to drive the green growth agenda (ahead of Australia, Singapore, and Finland) according to the KPMG Green Tax Index. A range of funding solutions is available to green technology manufacturers and service companies, as well as those who use or procure such goods and services. These cover development finance institutions (DFI), local public and private sector financiers and investors, and a considerable range of tax incentives. The Green Finance Desk at Greencape acts as a facilitator in the financing of green projects and green business and acts as a gateway to a network of financial institutions (private and public) with green finance interests.
https://www.greencape.co.za/content/sector/green-finance
32 | Global Green Finance Index 1
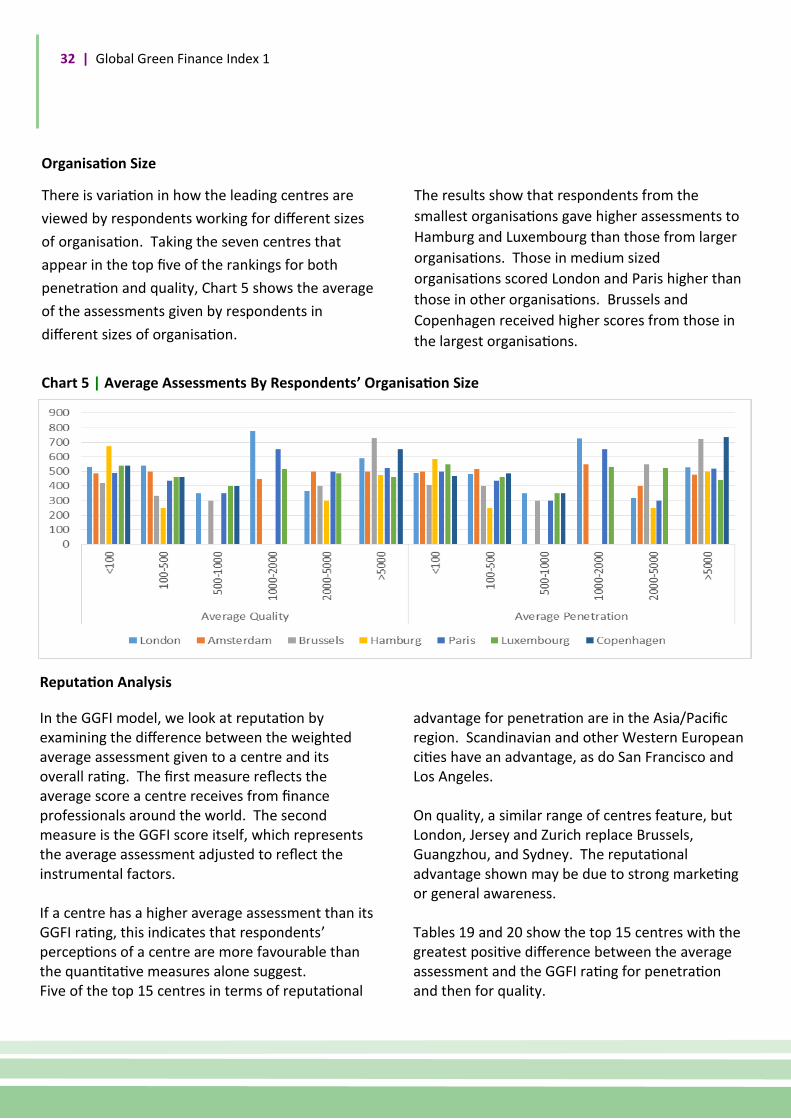
There is variation in how the leading centres are
viewed by respondents working for different sizes
of organisation. Taking the seven centres that
appear in the top five of the rankings for both
penetration and quality, Chart 5 shows the average
of the assessments given by respondents in
different sizes of organisation.
The results show that respondents from the
smallest organisations gave higher assessments to
Hamburg and Luxembourg than those from larger
organisations. Those in medium sized
organisations scored London and Paris higher than
those in other organisations. Brussels and
Copenhagen received higher scores from those in
the largest organisations.
Organisation Size
Chart 5 | Average Assessments By Respondents’ Organisation Size
Reputation Analysis
In the GGFI model, we look at reputation by examining the difference between the weighted average assessment given to a centre and its overall rating. The first measure reflects the average score a centre receives from finance professionals around the world. The second measure is the GGFI score itself, which represents the average assessment adjusted to reflect the instrumental factors. If a centre has a higher average assessment than its GGFI rating, this indicates that respondents’ perceptions of a centre are more favourable than the quantitative measures alone suggest. Five of the top 15 centres in terms of reputational
advantage for penetration are in the Asia/Pacific region. Scandinavian and other Western European cities have an advantage, as do San Francisco and Los Angeles. On quality, a similar range of centres feature, but London, Jersey and Zurich replace Brussels, Guangzhou, and Sydney. The reputational advantage shown may be due to strong marketing or general awareness. Tables 19 and 20 show the top 15 centres with the greatest positive difference between the average assessment and the GGFI rating for penetration and then for quality.

Global Green Finance Index 1 | 33
Table 19 | Top Ten Centres – Reputational
Advantage For Penetration in GGFI 1
Table 20 | Top Ten Centres – Reputational
Advantage For Quality in GGFI 1
Centre Weighted Average
Assessment
GGFI 1
Rating
Reputational Advantage
Copenhagen 516 385 131
Stockholm 498 379 119
Shenzhen 496 380 116
Hamburg 459 370 89
Beijing 446 375 71
Shanghai 443 375 68
Luxembourg 455 389 66
Amsterdam 445 384 61
Sydney 428 367 61
San Francisco 423 365 58
Los Angeles 418 361 57
Paris 436 381 55
Munich 412 364 48
Guangzhou 423 376 47
Brussels 413 374 39
Centre Weighted Average
Assessment
GGFI 1
Rating
Reputational Advantage
Hamburg 514 381 133
Stockholm 509 378 131
Copenhagen 503 374 129
San Francisco 462 369 93
Luxembourg 451 378 73
Zurich 438 375 63
Paris 440 379 61
Amsterdam 442 385 57
Shenzhen 419 362 57
Jersey 414 357 57
Munich 408 353 55
London 490 437 53
Los Angeles 409 360 49
Shanghai 400 364 36
Beijing 393 357 36
Table 21 | Bottom Ten Centres – Reputational
Disadvantage For Penetration in GGFI 1
Table 22 | Bottom Ten Centres – Reputational
Disadvantage For Quality in GGFI 1
Tables 21 and 22 show the 15 centres with the
greatest reputational disadvantage – an indication
that respondents’ perceptions of a centre are less
favourable than the quantitative measures alone
would suggest.
Centre Weighted Average
Assessment
GGFI 1
Rating
Reputational Advantage
Mexico City 300 342 -42
Chicago 292 343 -51
Seoul 305 364 -59
New Delhi 273 333 -60
Johannesburg 280 350 -70
Isle of Man 266 343 -77
Rome 272 350 -78
Guernsey 254 342 -88
Dubai 255 346 -91
Vienna 240 351 -111
Mumbai 200 335 -135
Abu Dhabi 200 343 -143
Kuala Lumpur 177 346 -169
Bangkok 164 335 -171 Moscow 135 333 -198
Centre Weighted Average
Assessment
GGFI 1
Rating
Reputational Advantage
Dubai 281 332 -51
Madrid 287 340 -53
Cape Town 286 342 -56
Rome 291 353 -62
Guernsey 277 339 -62
Isle of Man 272 340 -68
New Delhi 264 340 -76
Chicago 255 338 -83
Vienna 263 353 -90
Abu Dhabi 210 326 -116
Moscow 200 322 -122
Bangkok 203 327 -124
Seoul 200 341 -141
Mumbai 167 329 -162
Kuala Lumpur 96 328 -232

34 | Global Green Finance Index
GGFI 1 Interest, Impact And Drivers of Green Finance
Areas Of Interest In Green Finance
Alongside the ratings of penetration and quality in
the GGFI questionnaire, we asked additional
questions about the development of Green
Finance. These focused on:
• The areas of Green Finance which were
considered most interesting by respondents
• The areas of Green Finance which had most
impact on sustainability; and
• The factors driving the development of
Green Finance.
We asked respondents to identify the four areas of
green finance which they considered most
interesting. The results are shown in Chart 6
below. The top areas listed were:
• Sustainable Infrastructure Finance;
• Green Bonds;
• Renewable Energy Investment; and
• Social and Impact Investment.
Chart 6 | Most Interesting Areas Of Green Finance
Green Finance Innovation: Stockholm -
Green Digital Finance
Established in collaboration with Stockholm
Fintech Hub, Stockholm Green Digital
Finance works through constructive
partnerships with capital market actors,
international partners and fintech
innovators to deliver solutions that help
scale green finance and innovation globally
for effective delivery on the UN Sustainable
Development Goals and the Paris
Agreement.
https://stockholmgreenfin.tech/

Global Green Finance Index 1 | 35
Areas of Green Finance Impact On Sustainability
We also asked respondents to identify the four
areas of green finance which they considered had
most impact on sustainability. The results are
shown in Chart 7 below. The top areas listed were:
• Renewable Energy Investment;
• Green Bonds;
• Sustainable Infrastructure Finance;
• Environment, Social and Governance (ESG)
Analytics.
Chart 7 | Green Finance Activities With Most Impact On Sustainability
Green Finance Innovation: Amsterdam - Sustainable Finance Platform
The Sustainable Finance Platform is a cooperative venture of De Nederlandsche Bank (chair), the
Dutch Banking Association, the Dutch Association of Insurers, the Federation of the Dutch Pension
Funds, the Dutch Fund and Asset Management Association, the Netherlands Authority for the
Financial Markets, the Ministry of Finance, the Ministry of Infrastructure and the Environment,
and the Sustainable Finance Lab. The aim of this platform, set up by DNB in 2016, is to promote
and encourage a dialogue on sustainable finance in the financial sector.
https://www.dnb.nl/en/about-dnb/co-operation/platform-voor-duurzame-financiering/
werkgroepen/index.jsp

36 | Global Green Finance Index 1
Chart 8 | Relationship Between Areas of Interest and Impact
Looking at the areas of Green Finance respondents
identified as interesting and those they considered
had most impact, we see a close correlation, as
shown in Chart 8.
Disinvestment from Fossil Fuels stands out as
further from the trendline, reinforcing that its
impact was judged greater than the interest shown
in it as a green finance activity.
“Various regulators are asking questions on the degree of climate
change risk in bank portfolios which will drive awareness by
senior management.” Risk Manager, London
Relationship Between Areas Of Interest And Impact
Green Bonds
Sustainable Infrastructure
Finance
Carbon Disclosure
Environment, Social and
Governance (ESG) Analytics
Carbon Markets
Green Insurance
SRI Investment
Social and Impact Investment
Energy Efficient Investment
Disinvestment from Fossil Fuels
Green Loans
Greentech Venture Capital
Climate Risk Stress Testing
Natural Capital Valuation
Renewable Energy
Investment
0
20
40
60
80
100
120
140
160
180
200
0 20 40 60 80 100 120 140 160 180 200
Are
as o
f M
ost
Inte
rest
Impact on Sustainability

Global Green Finance Index 1 | 37
Chart 9 | Leading Drivers of Green Finance
Drivers of Green Finance
Finally, we asked respondents to identify the four
areas that they considered were driving the
development of Green Finance. The results are
shown in Chart 9 below.
The top drivers identified were:
• Policy and regulatory frameworks;
• Investor demand;
• Climate change;
• Public Awareness.
Green Finance Innovation: Casablanca - Casablanca Statement On Financial Centres For Sustainability The first global meeting of sustainable financial centres was hosted in Casablanca, in September 2017 by the Casablanca Finance City Authority and UN Environment, in association with Italy’s Ministry of the Environment and Morocco’s presidency of the COP22 climate conference. The meeting brought together representatives from 15 financial centres, including Astana, Casablanca, Dublin, Hong Kong, London, Luxembourg, Milan, Paris, Qatar, Shanghai, Stockholm, Tokyo, Toronto and Zurich. At the meeting, representatives agreed to promote strategic action in their financial centres on green and sustainable finance and cooperate on expanding the pipeline of green assets and products. http://www.casablancafinancecity.com/wp-content/uploads/2017/09/Casablanca-statement-on-financial-centres-for-sustainability_Final.pdf

38 | Global Green Finance Index
Appendix 1: Assessment Details
Table 23 | Details Of Assessments Of Green Finance Penetration By Centre
Centre GGFI 1
Rank
GGFI 1
Rating
——— Assessments ———
Number Average St. Dev
London 1 402 95 490 237
Luxembourg 2 389 55 505 254
Copenhagen 3 385 16 566 270
Amsterdam 4 384 45 494 251
Paris 5 381 72 485 259
Shenzhen 6 380 13 546 284
Stockholm 7 379 22 548 258
Guangzhou 8= 376 11 473 160
Zurich 8= 376 61 456 230
Shanghai 10= 375 33 495 217
Beijing 10= 375 27 493 239
Brussels 12 374 28 463 236
Hamburg 13 370 11 509 214
Sydney 14 367 18 478 267
Singapore 15 366 44 430 223
San Francisco 16 365 18 472 234
Munich 17= 364 13 462 266
Seoul 17= 364 10 355 148
Los Angeles 19= 361 11 468 212
Frankfurt 19= 361 71 408 214
Tokyo 19= 361 25 434 279
Dublin 22 360 44 392 229
Hong Kong 23 359 51 396 247
Washington DC 24 358 18 403 172
Centre GGFI 1
Rank
GGFI 1
Rating
——— Assessments ———
Number Average St. Dev
Edinburgh 25 357 22 382 225
Milan 26= 356 17 368 202
Jersey 26= 356 22 405 260
Geneva 26= 356 38 389 226
Cape Town 29 355 11 373 216
Toronto 30= 353 21 379 244
Madrid 30= 353 15 400 245
Vienna 32 351 15 290 153
Rome 33= 350 11 323 214
Johannesburg 33= 350 10 330 203
Boston 35 348 21 379 211
Kuala Lumpur 36= 346 11 227 113
Dubai 36= 346 21 305 243
Isle of Man 38= 343 19 316 216
Chicago 38= 343 19 342 173
Abu Dhabi 38= 343 15 250 207
Mexico City 41= 342 11 350 259
Guernsey 41= 342 13 304 265
New York 43 341 68 351 201
Mumbai 44= 335 12 250 154
Bangkok 44= 335 14 214 122
New Delhi 46= 333 11 323 273
Moscow 46= 333 10 185 140

Global Green Finance Index 1 | 39
Table 24 | Details Of Assessments Of Green Finance Quality By Centre
Centre GGFI 1
Rank
GGFI 1
Rating
——— Assessments ———
Number Average St. Dev
London 1 437 95 539 229
Amsterdam 2 385 45 492 243
Brussels 3 383 28 463 218
Hamburg 4 381 11 564 269
Paris 5 379 72 490 270
Stockholm 6= 378 22 559 265
Luxembourg 6= 378 55 501 255
Zurich 8 375 61 489 242
Copenhagen 9 374 16 553 275
San Francisco 10= 369 18 511 249
Washington DC 10= 369 18 436 206
Shanghai 12 364 27 450 237
Shenzhen 13 362 13 469 279
Singapore 14= 361 44 427 236
Edinburgh 14= 361 22 409 237
Geneva 16= 360 38 441 240
Sydney 16= 360 18 425 270
Los Angeles 16= 360 11 459 208
Frankfurt 19 359 71 426 226
Beijing 20= 357 33 442 240
Jersey 20= 357 22 464 282
Tokyo 22 356 25 432 291
Guangzhou 23 354 11 386 218
Munich 24= 353 13 458 292
Centre GGFI 1
Rank
GGFI 1
Rating
——— Assessments ———
Number Average St. Dev
Dublin 24= 353 44 393 254
Rome 24= 353 11 341 228
Vienna 24= 353 15 313 166
Milan 28 352 17 409 232
Hong Kong 29 348 51 379 229
Boston 30= 347 21 369 209
New York 30= 347 68 376 205
Johannesburg 32 343 10 390 274
Cape Town 33 342 11 336 242
Toronto 34= 341 21 371 243
Seoul 34= 341 10 250 160
New Delhi 36= 340 11 314 278
Isle of Man 36= 340 19 321 216
Madrid 36= 340 15 337 205
Guernsey 39 339 13 327 256
Chicago 40 338 19 305 169
Dubai 41 332 21 331 258
Mumbai 42 329 12 217 150
Kuala Lumpur 43= 328 11 145 65
Mexico City 43= 328 11 332 232
Bangkok 45 327 14 254 207
Abu Dhabi 46 326 15 260 216
Moscow 47 322 10 250 189

40 | Global Green Finance Index
Appendix 2: Interest, Impact And Drivers Details
Area of Green Finance Number
of
Mentions
Percentage
of Total
Mentions
Green Insurance 38 2.9
Carbon Disclosure 42 3.2
Natural Capital Valuation 42 3.2
Carbon Markets 50 3.8
Disinvestment from Fossil
Fuels
55 4.1
Climate Risk Stress Testing 61 4.6
Green Loans 63 4.7
SRI Investment 71 5.3
Greentech Venture Capital 87 6.6
Energy Efficient Investment 92 6.9
Environment, Social and
Governance (ESG) Analytics
118 8.9
Social and Impact
Investment
126 9.5
Renewable Energy
Investment
152 11.4
Green Bonds 160 12.0
Sustainable Infrastructure
Finance
171 12.9
Totals 1,328 100.0
Table 25 | Interesting Areas Of Green Finance
Area of Green Finance Number
of
Mentions
Percentage
of Total
Mentions
Natural Capital Valuation 22 1.7
Green Insurance 40 3.2
Carbon Markets 44 3.5
Green Loans 54 4.3
SRI Investment 59 4.7
Carbon Disclosure 60 4.8
Greentech Venture Capital 64 5.1
Climate Risk Stress Testing 79 6.3
Energy Efficient Investment 93 7.4
Disinvestment from Fossil
Fuels
98 7.8
Social and Impact Investment 99 7.9
Environment, Social and
Governance (ESG) Analytics
105 8.3
Sustainable Infrastructure
Finance
145 11.5
Green Bonds 146 11.6
Renewable Energy Investment 152 12.1
Totals 1,260 100.0
Table 26 | Areas Of Green Finance With Most
Impact On Sustainability

Global Green Finance Index 1 | 41
Table 27 | Drivers Of Green Finance
Driver Number of
Mentions
Percentage of Total
Mentions
Loss of Biodiversity 8 0.6
Food Security 8 0.6
Insurance Industry Research 13 1.0
Academic Research 17 1.3
Water Quality 17 1.3
Voluntary Standards 20 1.6
Air Quality 28 2.2
Finance Centre Activism 34 2.7
Energy Efficiency 35 2.7
Industry Activism 36 2.8
Non-financial Reporting 37 2.9
Risk Management Frameworks 38 3.0
Renewables 42 3.3
NGO Activism 43 3.4
Sustainability Reporting 48 3.8
Infrastructure Investment 50 3.9
International Initiatives 61 4.8
Mandatory Disclosure 65 5.1
Tax Incentives 68 5.3
Technological Change 84 6.6
Public Awareness 104 8.1
Climate Change 125 9.8
Investor Demand 135 10.5
Policy and Regulatory Frameworks 164 12.8
Totals 1,280 100.0

42 | Global Green Finance Index
Appendix 3: Respondents’ Details
Industry Sector Number Of
Respondents
Banking 43
Debt Capital Market 14
Equity Capital Markets 16
Insurance 7
Investment 35
Knowledge 75
Local Green Initiatives 4
Policy and Public Finance
36
Professional Services 83
Trading 2
Other 22
Total 337
Region Number Of
Respondents
Western Europe 248
Asia Pacific 36
North America 17
Middle East and Africa 12
Eastern Europe and
Central Asia
9
Latin America and the
Caribbean
4
Other 11
Total 337
Table 28 | Respondents By Industry Sector Table 30 | Respondents By Region
Engagement In Green
Finance
Number Of
Respondents
Working in Green Finance 167
Interested in Green
Finance
159
Other/not given 11
Total 337
Table 29 | Respondents By Engagement In Green
Finance
Global Green Finance Index 1 | 43
Age Band Number Of Respondents
18-30 48
30-45 120
45-60 122
60+ 39
Other/not given 8
Total 337
Table 33 | Respondents By Age
Gender Number Of
Respondents
Female 113
Male 211
Other 1
Prefer not to say/Not
given
12
Total 337
Size of Organisation Number Of Respondents
<100 163
100-500 52
500-1000 5
1000-2000 15
2000-5000 21
>5000 68
Other/not given 13
Total 337
Table 32 | Respondents By Gender
Table 31 | Respondents By Size Of
Organisation

44 | Global Green Finance Index
The GGFI provides ratings for the depth and quality
of the green finance offering of financial centres
calculated by a factor assessment model that uses
two distinct sets of input:
• Financial centre assessments: using an online
questionnaire, respondents are asked to rate
the penetration and quality of each financial
centre’s green finance offering using a ten point
scale ranging from little penetration/very poor
to mainstream/excellent. Responses are sought
from a range of individuals drawn from the
financial services sector, non-governmental
organisations, regulators, universities and trade
bodies.
• Instrumental factors: these are a range of
quantitative data about each financial centre.
These instrumental factors draw on data from
113 different sources and include:
The development of financial service activities in that centre, including data on sustainable and green finance;
The business environment, including legal and policy factors and statistics on economic performance;
Human capital, reflecting educational development and social factors;
Environment and infrastructure data that reflect the physical attributes of the centre, such as air quality and local carbon emissions, or telecommunications and public transport.
A full list of the instrumental factors used in the
model is in Appendix 5. Due to the way in which
the factor assessment model operates, several
indices can be used for each area of interest.
Neither of these sets of inputs in themselves would
allow the creation of a valid index and we use an
approach which combines these data in creating
the GGFI.
Factors Affecting The Inclusion Of Centres in the
GGFI
The questionnaire lists a total of 108 financial
centres which can be rated by respondents. The
questionnaire also asks whether there are financial
centres that will improve their green finance
offering significantly over the next two to three
years. Centres which are not currently within the
questionnaire and which receive a number of
mentions in response to this question will be
added to the questionnaire for future editions.
With the initial publication of the GGFI, we will
only give a financial centre a GGFI rating and
ranking if it receives a statistically significant
minimum number of assessments from individuals
based in other geographical locations - at least ten
in GGFI 1. This means that not all 108 centres in
the questionnaire will receive a ranking. We will
keep this number under review for further editions
of the index as the number of assessments
increases.
Appendix 4: Methodology

Global Green Finance Index 1 | 45
We will also develop rules as successive indices are
published as to when a centre may be removed
from the rankings, for example, if over a 24 month
period, a centre has not received a minimum
number of assessments.
Financial Centre Assessments Financial centre assessments are collected via an
online questionnaire which will run continuously
and which is at survey.greenfinanceindex.net/. A
link to this questionnaire is emailed to a target list
of respondents at regular intervals and other
interested parties can complete the questionnaire
by following the link given in GGFI publications.
For the first and subsequent editions of the GGFI:
• the score given by a respondent to their home
centre, and respondents who do not specify a
home centre, are excluded from the model –
this is designed to prevent home bias;
• financial centre assessments will be included in
the GGFI model for 24 months after they have
been received – we consider that assessments
still have validity for a period after they have
been given; and
• financial centre assessments from the month
when the GGFI is created will be given full
weighting with earlier responses given a
reduced weighting on a logarithmic scale as
shown in Chart 10 – this recognises that older
ratings, while still valid, are less likely to be up-to
-date.
Chart 10 | Reduction In Weighting As Assessments Get Older

46 | Global Green Finance Index 1
Instrumental Factor Data
For the instrumental factors, we have the following data requirements: • data series should come from a reputable body
and be derived by a sound methodology; and • data series should be readily available (ideally in
the public domain) and be regularly updated. The rules on the use of instrumental factor data in the model are as follows: • updates to the indices are collected and collated
every six months; • no weightings are applied to indices; • indices are entered into the GGFI model as
directly as possible, whether this is a rank, a derived score, a value, a distribution around a mean or a distribution around a benchmark;
• if a factor is at a national level, the score will be
used for all centres in that country; nation-based factors will be avoided if financial centre (city)-based factors are available;
• if an index has multiple values for a city or
nation, the most relevant value is used (and the method for judging relevance is noted);
• if an index is at a regional level, the most
relevant allocation of scores to each centre is made (and the method for judging relevance is noted);
• if an index does not contain a value for a
particular financial centre, a blank is entered against that centre (no average or mean is used).
Factor Assessment Neither the financial centre assessments not the instrumental factors on their own can provide a basis for the construction of the GGFI. The financial centre assessments rate centres on their green finance performance, but each individual completing the questionnaire will: • be familiar with only a limited number of
centres - probably no more than 10 or 15 centres out of the total number;
• rate a different group of centres making it
difficult to compare data sets; and • consider different aspects of centres’
performance in their ratings. The instrumental factors are based on a range of different models and using just these factors would require some system of totaling or averaging scores across instrumental factors. Such an approach would involve a number of difficulties:
• indices are published in a variety of different forms: an average or base point of 100 with scores above and below this; a simple ranking; actual values, e.g., $ per square foot of occupancy costs; or a composite ‘score’;
• indices would have to be normalised, e.g., in
some indices, a high score is positive while in others a low score is positive;
• not all centres are included in all indices; • the indices would have to be weighted.
Given these issues, the GGFI uses a statistical model to combine the financial centre assessments and instrumental factors.

Global Green Finance Index 1 | 47
This is done by conducting an analysis to determine whether there is a correlation between the financial centre assessments and the instrumental factors we have collected about financial centres. This involves building a predictive model of the rating of centres’ green financial offerings using a support vector machine (SVM). The details of the methodology can be accessed at http://www.longfinance.net/programmes/the-global-green-finance-index/methodology.html. The statistical model is developed in R, an open source language and environment for statistical computing and graphics. An SVM is a supervised learning model with associated learning algorithms that analyses data used for classification and regression analysis. SVMs are based upon statistical techniques that classify and model complex historic data in order to make predictions on new data. SVMs work well on discrete, categorical data but also handle continuous numerical or time series data. The SVM used for the GGFI provides information about the confidence with which each specific
rating is made and the likelihood of other possible ratings being made by the same respondent. The model then predicts how respondents would have assessed centres with which they are unfamiliar, by answering questions such as:
If a respondent gives Singapore and Sydney certain assessments then, based on the instrumental factors for Singapore, Sydney and Paris, how would that person assess Paris? Or If Edinburgh and Munich have been given a certain assessment by this respondent, then, based on the instrumental factors for Edinburgh, Munich and Zurich, how would that person assess Zurich?
Financial centre rating predictions from the SVM are re-combined with actual financial centre assessments to produce the GGFI – a set of ratings for financial centres’ green finance performance.
The process of creating the GGFI is outlined in
Chart 11 below.
Chart 11 | The GGFI Process

48 | Global Green Finance Index 1
Validation The rules on data use for both financial centre assessments and instrumental factors are a key part of data validation. In addition, we intend to scrutinise the data set for anomalous patterns, for example, exactly matching assessments given by respondents from the same region or multiple assessments given from the same source. Where there appears to be a discrepancy, we may ignore certain responses in compiling the index. Updating The Index The GGFI will be published twice a year and dynamically updated either by updating and adding to the instrumental factors or through new financial centre assessments. These updates permit, for instance, a recently changed index of volumes of green bonds issued to affect the green credentials rating of financial centres.
Use Of The Index The GGFI produces a central index rating of financial centres’ green finance credentials. The questionnaire collects other data and other analyses of the data are possible, for example: • Sector-specific ratings are available using the
business sectors represented by questionnaire respondents. This makes it possible to rate different centres in terms of their offering in, for example, insurance as opposed to their strength in debt capital.
• The factor assessment model can be queried in a
‘what if’ mode – for example, “how much would Singapore carbon emissions need to fall in order to increase Singapore’s ranking against Paris?”
Global Green Finance Index 1 | 49
Appendix 5: Instrumental Factors
Instrumental Factors R-squared
IESE cities in motion index 0.356
Sustainable Cities Index 0.344
Global Sustainable Competitiveness Index 0.329
Railways per Land Area 0.303
Sustainable Economic Development 0.282
Logistics Performance Index 0.271
CBI labelled green bonds by exchange (preliminary data) 0.260
Environmental Performance 0.255
Shares of wind and solar in electricity 0.218
Air Quality Data 0.211
Roadways per Land Area 0.182
Human Freedom Index 0.165
Energy Sustainability Index 0.155
City Commitment to Carbon Reduction (Cooperative Actions) 0.136
Financial Institutions Conventional to new Energy Data 0.118
Instrumental Factors R-squared
CBI labelled green bonds by exchange (preliminary data) 0.294
Logistics Performance Index 0.277
Global Sustainable Competitiveness Index 0.253
Sustainable Cities Index 0.219
IESE cities in motion index 0.206
Sustainable Economic Development 0.197
Railways per Land Area 0.193
Quality of Domestic Transport Network 0.129
Financial institutions clean revenue to fossil-related 0.128
Share of renewables in electricity production 0.128
Shares of wind and solar in electricity 0.123
Environmental Performance 0.115
Air Quality Data 0.095
Roadways per Land Area 0.094
Climate-aligned Bond 0.092
Table 34 | Sustainability Instrumental Factor Correlation With Penetration Ratings - Highest 15 Factors
Table 35 | Sustainability Instrumental Factor Correlation With Quality Ratings - Highest 15 Factors

50 | Global Green Finance Index 1
Instrumental Factor Source Website
Air Quality Data WHO http://www.who.int/entity/phe/health_topics/outdoorair/databases/who-aap-database-may2016.xlsx?ua=1
Average precipitation in depth (mm per year) The World Bank http://databank.worldbank.org/data/reports.aspx?source=world-development-indicators
Buildings Energy Efficiency Policies Database IEA https://www.iea.org/beep/
CBI labelled green bonds by exchange (preliminary data)
CBI https://www.climatebonds.net
City Commitment to Carbon Reduction (Cooperative Actions)
UNFCCC http://climateaction.unfccc.int/cities
City Commitment to Carbon Reduction (Individual Actions)
UNFCCC http://climateaction.unfccc.int/cities
Climate-aligned Bonds Outstanding by Country of Issuer
Corporate Knights http://www.finance-watch.org/our-work/dossiers?fid=192
CO2 Emissions Per Capita World Bank https://data.worldbank.org/indicator/EN.ATM.CO2E.PC
Energy Intensity of GDP Enerdata Statistical Yearbook https://yearbook.enerdata.net/download/
Energy Sustainability Index World Energy Council http://www.worldenergy.org/data/sustainability-index/
Environmental Performance Yale University http://epi.yale.edu//epi/country-rankings
Financial Centre Carbon Intensity Corporate Knights http://www.finance-watch.org/our-work/dossiers?fid=192
Financial Centre Clean Revenue to Fossil-related Corporate Knights http://www.finance-watch.org/our-work/dossiers?fid=192
Financial Centre Sustainability Disclosure Corporate Knights http://www.finance-watch.org/our-work/dossiers?fid=192
Financial Institutions Conventional to New Energy Finance Data
Corporate Knights http://www.finance-watch.org/our-work/dossiers?fid=192
Financial system green alignment Corporate Knights http://www.finance-watch.org/our-work/dossiers?fid=192
Forestry Area World Bank http://databank.worldbank.org/data/reports.aspx?source=2&series=AG.LND.FRST.ZS&country=
Global Sustainable Competitiveness Index Solability http://solability.com/the-global-sustainable-competitiveness-index/the-index
Green Bonds Issued by Country of Issuer Corporate Knights http://www.finance-watch.org/our-work/dossiers?fid=192
GREB Building Energy Intensity Score Corporate Knights http://www.finance-watch.org/our-work/dossiers?fid=192
IESE cities in motion index IESE http://citiesinmotion.iese.edu/indicecim/?lang=en
Protected Land Area as Percentage of Land Area The World Bank http://databank.worldbank.org/data/reports.aspx?source=2&series=ER.LND.PTLD.ZS&country=
Quality of Life Index Numbeo http://www.numbeo.com/quality-of-life/rankings.jsp
Quality of Living City Rankings Mercer http://www.mercer.com
Share of renewables in electricity production Enerdata Statistical Yearbook https://yearbook.enerdata.net/download/
Shares of Wind and Solar in Electricity Production Enerdata Statistical Yearbook https://yearbook.enerdata.net/download/
Sustainable Cities Index Arcadis https://www.arcadis.com/en/global/our-perspectives/sustainable-cities-index-2016/
Sustainable Economic Development Boston Consulting Group https://www.bcgperspectives.com/content/interactive/public_sector_globalization_interactive_map_sustainable_economic_development/
Sustainable Stock Exchanges UN Sustainable Stock Exchange Initiative
http://www.sseinitiative.org/sse-partner-exchanges/list-of-partner-exchanges/
Table 36 | Sustainability Factors

Global Green Finance Index 1 | 51
Instrumental Factor Source Website
Best Countries for Business Forbes http://www.forbes.com/best-countries-for-business/list/#tab:overall
Bilateral Tax Information Exchange Agreements OECD http://www.oecd.org/document/7/0,3343,en_2649_33767_38312839_1_1_1_1,00.html
Business Environment Rankings EIU http://www.eiu.com/public/thankyou_download.aspx?activity=download&campaignid=bizenviro2014
Business Process Outsourcing Location Index Cushman & Wakefield http://www.cushmanwakefield.com/en/research-and-insight/2015/business-process-outsourcing-location-index-2015/
Capitalisation of Stock Exchanges The World Federation of Stock Exchanges
http://www.world-exchanges.org/home/index.php/statistics/monthly-reports
City GDP composition (Business/Finance) The Brookings Institution http://www.brookings.edu/research/interactives/global-metro-monitor-3
Common Law Countries CIA https://www.cia.gov/library/publications/the-world-factbook/fields/2100.html
Corporate Tax Rates PWC http://www.doingbusiness.org/reports/thematic-reports/paying-taxes/
Domestic Credit Provided by Banking Sector (% of GDP)
The World Bank http://databank.worldbank.org/data/reports.aspx?source=world-development-indicators
Ease of Doing Business Index The World Bank http://databank.worldbank.org/data/reports.aspx?source=doing-business
External Positions of Central Banks as a share of GDP The Bank for International Settlements
http://www.bis.org/statistics/bankstats.htm
FDI Confidence Index AT Kearney http://www.atkearney.com/research-studies/foreign-direct-investment-confidence-index
FDI Inward Stock as a Percentage of GDP UNCTAD http://unctad.org/en/Pages/DIAE/World%20Investment%20Report/Annex-Tables.aspx
Financial Secrecy Index Tax Justice Network http://www.financialsecrecyindex.com/
Foreign Direct Investment Inflows UNCTAD http://unctadstat.unctad.org/ReportFolders/reportFolders.aspx?sRF_ActivePath=P,5,27&sRF_Expanded=,P,5,27
Global Connectedness Index DHL http://www.dhl.com/en/about_us/logistics_insights/studies_research/global_connectedness_index/global_connectedness_index.html
Global Enabling Trade Report World Economic Forum http://www.weforum.org/issues/international-trade
Global Services Location AT Kearney http://www.atkearney.com/research-studies/global-services-location-index
Government Debt as % of GDP CIA https://www.cia.gov/library/publications/the-world-factbook/rankorder/2186rank.html
Net External Positions of Banks The Bank for International Settlements
http://www.bis.org/statistics/bankstats.htm
Office Occupancy Cost CBRE Research http://www.cbre.com/research-and-reports/Global-Prime-Office-Occupancy-Costs-2016
Operational Risk Rating EIU http://www.viewswire.com/index.asp?layout=homePubTypeRK
Percentage of Firms Using Banks to Finance Investment
The World Bank http://databank.worldbank.org/data/reports.aspx?source=world-development-indicators
Real Interest Rate The World Bank http://databank.worldbank.org/data/reports.aspx?source=world-development-indicators
Total Net Assets of Regulated Open-End Funds Investment Company Institute http://www.icifactbook.org/
Value of Bond Trading The World Federation of Stock Exchanges
http://www.world-exchanges.org/home/index.php/statistics/monthly-reports
Value of Share Trading The World Federation of Stock Exchanges
http://www.world-exchanges.org/home/index.php/statistics/monthly-reports
Volume of Share Trading The World Federation of Stock Exchanges
http://www.world-exchanges.org/home/index.php/statistics/monthly-reports
World Competitiveness Scoreboard IMD http://www.imd.ch/research/publications/wcy/competitiveness_scoreboard.cfmue
Table 37 | Business Factors

52 | Global Green Finance Index 1
Table 38 | Human Capital Factors
Instrumental Factor Source Website
Citizens Domestic Purchasing Power UBS http://www.ubs.com/1/e/wealthmanagement/wealth_management_research/prices_earnings.html
Corruption Perception Index Transparency International http://www.transparency.org/policy_research/surveys_indices/cpi
Cost of Living City Rankings Mercer http://www.mercer.com
Crime Index Numbeo http://www.numbeo.com/crime/rankings.jsp#
GDP per Person Employed The World Bank http://databank.worldbank.org/data/reports.aspx?source=world-development-indicators
Global Cities Index AT Kearney https://www.atkearney.com/research-studies/global-cities-index
Global Innovation Index INSEAD http://www.globalinnovationindex.org/content.aspx?page=GII-Home
Global Intellectual Property Index Taylor Wessing http://www.taylorwessing.com/ipindex/
Global Peace Index Institute for Economics & Peace http://www.visionofhumanity.org/
Global Skills Index Hays http://www.hays-index.com/
Global Terrorism Index Institute for Economics & Peace http://www.visionofhumanity.org/
Good Country Index Good Country Party http://www.goodcountry.org/overall
Government Effectiveness The World Bank http://info.worldbank.org/governance/wgi/index.aspx#home
Graduates in social Science, Business and Law (as % of total graduates)
The World Bank http://databank.worldbank.org/data/reports.aspx?source=Education%20Statistics
Gross Tertiary Graduation Ratio The World Bank http://databank.worldbank.org/data/reports.aspx?source=Education%20Statistics
Health Care Index Numbeo http://www.numbeo.com/health-care/rankings.jsp
Homicide Rates UN Office of Drugs & Crime https://data.unodc.org/
Human Development Index UN Development Programme http://hdr.undp.org
Human Freedom Index Cato Institute https://www.cato.org/human-freedom-index
ICT Development Index United Nations http://www.itu.int/net4/ITU-D/idi/2016/
Individual Income Tax Rates KPMG https://home.kpmg.com/xx/en/home/services/tax/tax-tools-and-resources/tax-rates-online/individual-income-tax-rates-table.html
Innovation Cities Global Index 2ThinkNow Innovation Cities http://www.innovation-cities.com/
Legatum Prosperity Index Legatum Institute http://www.prosperity.com/#!/ranking
Linguistic Diversity Ethnologue http://www.ethnologue.com/statistics/country
Lloyd’s City Risk Index 2015-2025 Lloyd’s http://www.lloyds.com/cityriskindex/locations
Number of High Net Worth Individuals Capgemini https://www.worldwealthreport.com/
Number of International Association Meetings World Economic Forum http://reports.weforum.org/travel-and-tourism-competitiveness-report-2015/
OECD Country Risk Classification OECD http://www.oecd.org/tad/xcred/crc.htm
Global Green Finance Index 1 | 53
Instrumental Factor Source Website
Crude oil input to refineries Enerdata Statistical Yearbook https://yearbook.enerdata.net/download/
Global Competitiveness Index World Economic Forum http://www.weforum.org/en/initiatives/gcp/Global%20Competitiveness%20Report/index.htm
JLL Real Estate Transparency Index Jones Lang LaSalle http://www.jll.com/greti/Pages/Rankings.aspx
Liner Shipping Connectivity Index The World Bank http://databank.worldbank.org/data/reports.aspx?source=world-development-indicators
Logistics Performance Index The World Bank http://lpi.worldbank.org/international/global
Metro Network Length Metro Bits http://mic-ro.com/metro/table.html
Networked Readiness Index World Economic Forum http://reports.weforum.org/global-information-technology-report-2016/
Networked Society Index Ericsson https://www.ericsson.com/res/docs/2016/2016-networked-society-city-index.pdf
Quality of Domestic Transport Network World Economic Forum http://reports.weforum.org/travel-and-tourism-competitiveness-report-2015/
Quality of Roads World Economic Forum http://reports.weforum.org/travel-and-tourism-competitiveness-report-2015/
Railways per Land Area CIA https://www.cia.gov/library/publications/the-world-factbook/rankorder/2121rank.html
Roadways per Land Area CIA https://www.cia.gov/library/publications/the-world-factbook/rankorder/2085rank.html
Telecommunication Infrastructure Index CIA https://www.cia.gov/library/publications/the-world-factbook/rankorder/2085rank.html
TomTom Traffic Index TomTom https://www.tomtom.com/en_gb/trafficindex/list?citySize=LARGE&continent=ALL&country=ALL
Table 39 | Infrastructure Factors
Instrumental Factor Source Website
Open Data Barometer The World Wide Web Foundation http://opendatabarometer.org/?_year=2016&indicator=ODB
Open Government World Justice Project http://worldjusticeproject.org/rule-of-law-index
Personal Tax Rates OECD http://www.oecd.org/tax/tax-policy/tax-database.htm
Political Stability and Absence of Violence/Terrorism The World Bank http://info.worldbank.org/governance/wgi/index.aspx#home
Press Freedom Index Reporters Without Borders (RSF) http://en.rsf.org/
Prime International Residential Index Knight Frank http://www.knightfrank.com/wealthreport
Regulatory Quality The World Bank http://info.worldbank.org/governance/wgi/index.aspx#home
Tax as Percentage of GDP The World Bank http://databank.worldbank.org/data/reports.aspx?source=world-development-indicators
Top Tourism Destinations Euromonitor http://blog.euromonitor.com/2016/01/top-100-city-destinations-ranking-2016.html
Visa Restrictions Index Henley Partners http://www.henleyglobal.com/citizenship/visa-restrictions/
Wage Comparison Index UBS http://www.ubs.com/1/e/wealthmanagement/wealth_management_research/prices_earnings.html
World Talent Rankings IMD http://www.imd.org/wcc/news-talent-report/
Table 38 | Human Capital Factors Continued

PRODUCED BY Z/YEN AND FINANCE WATCH
SPONSORED BY THE MAVA FOUNDATION
www.zyen.com
Z/Yen helps organisations make better choices - our clients consider us a commercial think-tank that spots, solves and acts. Our name combines Zen and Yen - “a philosophical desire to succeed” - in a ratio, recognising that all decisions are trade-offs. One of Z/Yen’s specialisms is the development and publication of research combining factor analysis and perception surveys.
www.finance-watch.org Finance Watch is a European, not-for-profit association of civil society members, dedicated to making finance work for the good of society. Finance Watch works for a financial system that allocates capital to productive use through fair and open markets, in a transparent and sustainable manner without exploiting or endangering society at large.
www.en.mava-foundation.org MAVA is a Swiss-based philanthropic foundation with a focus on biodiversity conservation. Running three region-based programmes in Switzerland, the Mediterranean and West Africa, and a fourth programme focused on Sustainable Economy, MAVA works through partnerships with international, national and local NGOs, research institutions and universities, and occasionally with government bodies or individuals.
PUBLISHED BY LONG FINANCE AND FINANCIAL CENTRE FUTURES
www.longfinance.net Long Finance is a Z/Yen initiative designed to address the question “When would we know our financial system is working?” This question underlies Long Finance’s goal to improve society’s understanding and use of finance over the long-term. In contrast to the short-termism that defines today’s economic views the Long Finance timeframe is roughly 100 years.
www.globalfinancialcentres.net
Financial Centre Futures is a programme within the Long Finance initiative that initiates discussion on the changing landscape of global finance, seeking to explore how finance might work in the future. Financial Centre Futures comprises the Global Green Finance Index and other research publications that explore major changes to the way we will live and work in the financial system of the future.