the global financial crisis and its impacts on energy insurance markets trends & challenges
DESCRIPTION
The Global Financial Crisis and Its Impacts on Energy Insurance Markets Trends & Challenges. Insurance Information Institute April 2, 2009. Robert P. Hartwig, Ph.D., CPCU, President Insurance Information Institute 110 William Street New York, NY 10038 - PowerPoint PPT PresentationTRANSCRIPT

The Global Financial Crisis and Its Impacts on Energy
Insurance Markets Trends & Challenges
Robert P. Hartwig, Ph.D., CPCU, PresidentInsurance Information Institute 110 William Street New York, NY 10038
Tel: (212) 346-5520 [email protected] www.iii.org
Insurance Information Institute
April 2, 2009

Presentation Outline
• The Global Economic Storm: What Weakening Economy and the Financial Crisis Mean for the P/C Insurance Industry and Energy Concerns Recession, Growth & Insurance
• Economic Stimulus Package: Worldwide Spending Programs Impacts & Implications for P/C Insurers and the Energy Sector
• Insurer Financial Strength & Ratings Insurers vs. Banks: A Difference of Approach to Risk Management
• Energy Market Review Capacity, Rating, Exposure, Profitability, Reinsurance, ART The Financial Crisis: Global Energy Supply, Demand and Investment
• Insurance Industry Financial Performance• Capital & Capacity• Regulatory Response to Crisis
Emerging Blueprint for Insurance Regulatory Overhaul
THE GLOBAL ECONOMIC
STORMWhat Weakening Economies and the Financial Crisis Mean for the
Insurance Industry &Energy Concerns

Real GDP By Market 2007-2010F(% change from previous year)
2.6%
2.0%
2.0% 3.
0%
11.9
%
0.7% 1.0%
-0.7
%
1.3%
0.7%
9.0%
-2.1
%
-2.5
%
-4.1
% -2.6
%
-2.7
%
6.8%
0.9%
1.0%
0.9% 1.
9%
0.8%
8.0%
2.6%
-6%
-4%
-2%
0%
2%
4%
6%
8%
10%
12%
14%
Euro Area Germany Japan US UK China
2007 2008E 2009F 2010F
Source: Blue Chip Economic Indicators, 3/10/09 edition.
All major economies except China and Brazil are in recession.
Steep declines in GDP will negatively impact exposure growth on a global scale
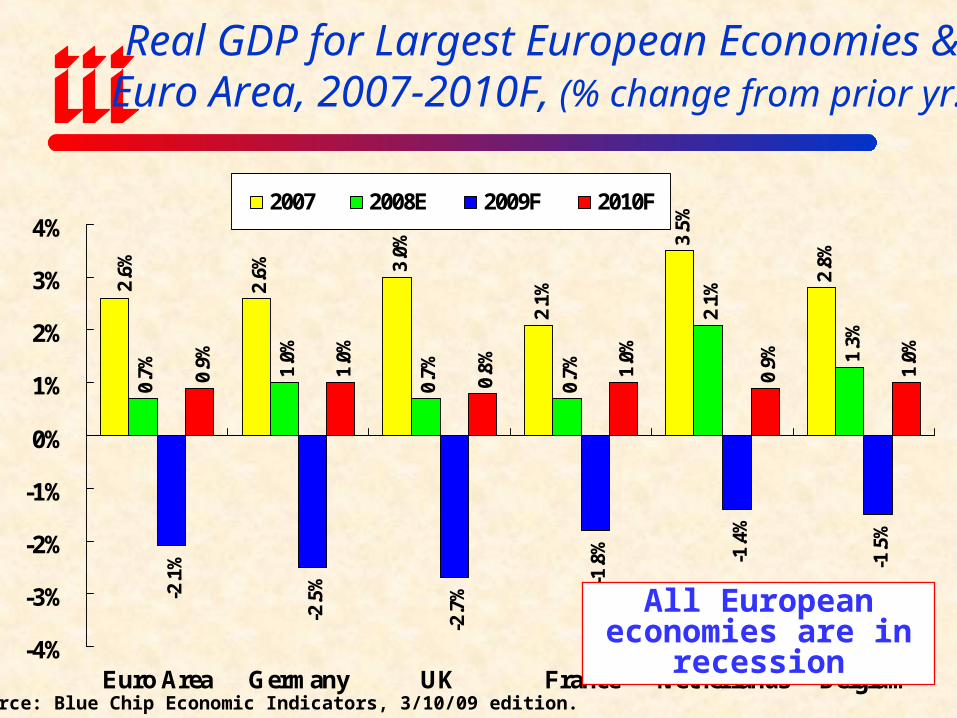
Real GDP for Largest European Economies & Euro Area, 2007-2010F, (% change from prior yr.)
2.6% 3.
0%
2.1%
3.5%
2.8%
0.7% 1.
0%
0.7%
0.7%
2.1%
1.3%
-2.1
%
-2.5
%
-2.7
%
-1.8
% -1.4
%
-1.5
%
0.9% 1.0%
0.8% 1.
0%
0.9% 1.0%
2.6%
-4%
-3%
-2%
-1%
0%
1%
2%
3%
4%
Euro Area Germany UK France Netherlands Belgium
2007 2008E 2009F 2010F
Source: Blue Chip Economic Indicators, 3/10/09 edition.
All European economies are in recession

3.7
%
0.8
% 1.6
% 2.5
% 3.6
%
3.1
%
2.9
%
0.1
%
4.8
%
4.8
%
0.9
%
2.8
%
-0.5
%
-2.0
%
0.5
% 1.8
%
2.3
%
2.8
%
2.9
%
3.1
%
-5.3%-6.2%
-0.2%
-8%
-6%
-4%
-2%
0%
2%
4%
6%
2
00
0
2
00
1
2
00
2
2
00
3
2
00
4
2
00
5
2
00
6
07
:1Q
07
:2Q
07
:3Q
07
:4Q
08
:1Q
08
:2Q
08
:3Q
08
:4Q
09
:1Q
09
:2Q
09
:3Q
09
:4Q
10
:1Q
10
:2Q
10
:3Q
10
:4Q
US Real GDP Growth*
*Yellow bars are Estimates/Forecasts from Blue Chip Economic Indicators.Source: US Department of Commerce, Blue Economic Indicators 3/09; Insurance Information Institute.
Recession began in December 2007. Economic toll of credit crunch, housing
slump, labor market contraction is growing
The Q4:2008 decline was the steepest since the
Q1:1982 drop of 6.4%
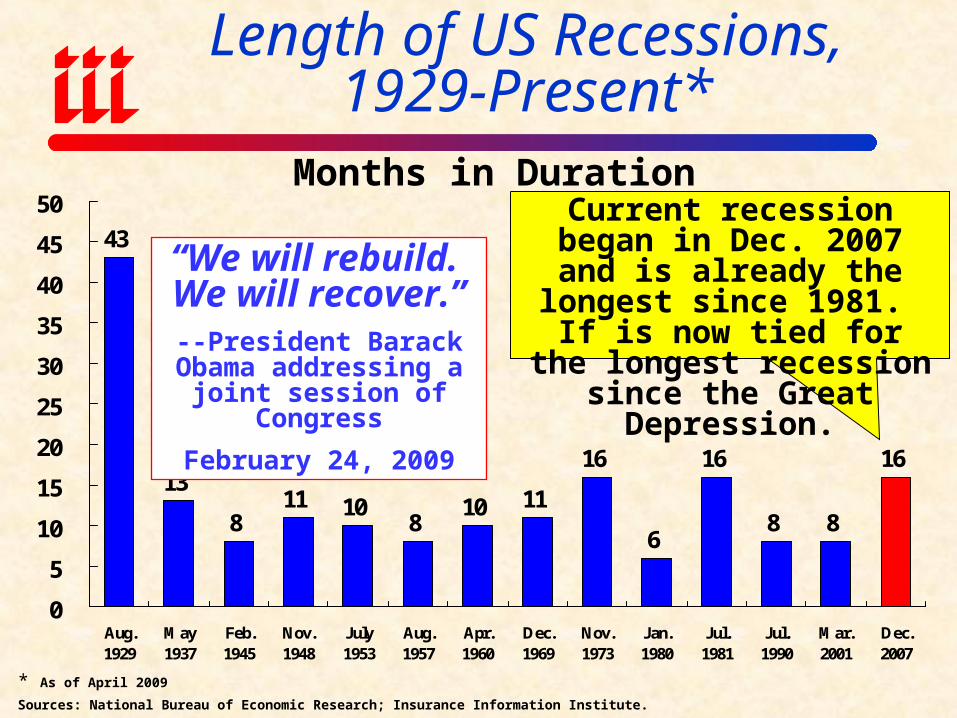
Length of US Recessions,1929-Present*
43
13
811 10
810 11
16
6
16
8 8
16
0
5
10
15
20
25
30
35
40
45
50
Aug.1929
May1937
Feb.1945
Nov.1948
July1953
Aug.1957
Apr.1960
Dec.1969
Nov.1973
Jan.1980
Jul.1981
Jul.1990
Mar.2001
Dec.2007
* As of April 2009
Sources: National Bureau of Economic Research; Insurance Information Institute.
Current recession began in Dec. 2007 and is already the longest since 1981. If is now tied for the longest recession since the Great Depression.
Months in Duration
“We will rebuild. We will recover.”
--President Barack Obama addressing a joint session
of Congress
February 24, 2009
-4.0
-2.0
0.0
2.0
4.0
6.0
8.0
10.0
70 72 74 76 78 80 82 84 86 88 90 92 94 96 98 00 02 04 06 08 10
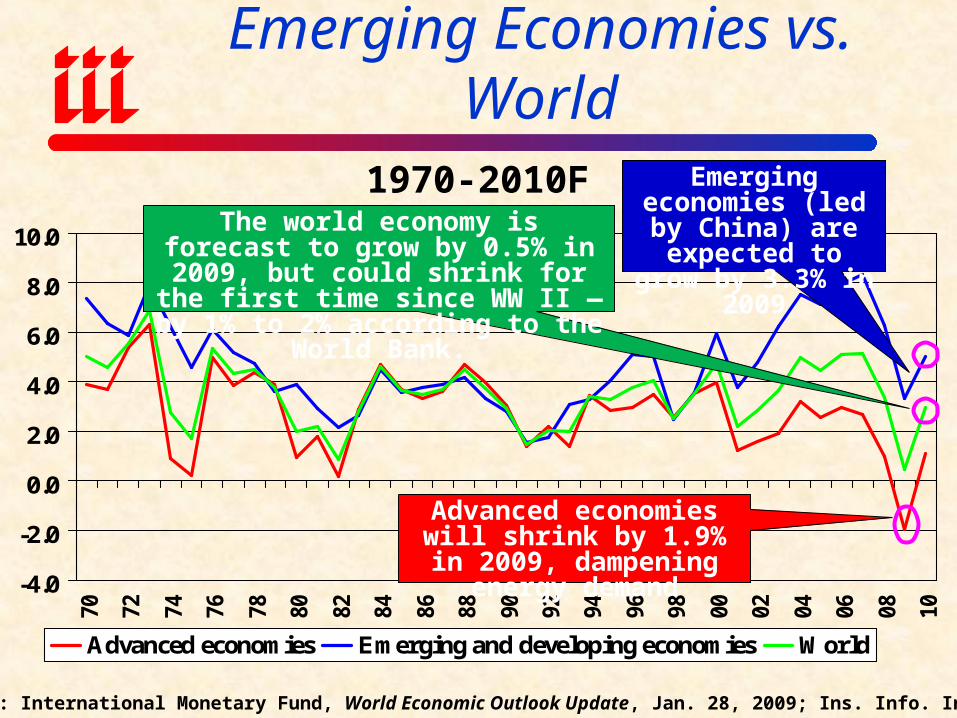
Advanced economies Emerging and developing economies World
1970-2010F
Source: International Monetary Fund, World Economic Outlook Update, Jan. 28, 2009; Ins. Info. Institute.
Emerging economies (led by China) are
expected to grow by 3.3% in 2009
GDP Growth: Advanced & Emerging Economies vs. World
Advanced economies will shrink by 1.9% in 2009,
dampening energy demand
The world economy is forecast to grow by 0.5% in 2009, but could shrink for the first time since WW II —by 1% to
2% according to the World Bank.
-15.0
-10.0
-5.0
0.0
5.0
10.0
15.0
1998 1999 2000 2001 2002 2003 2004 2005 2006 2007 2008
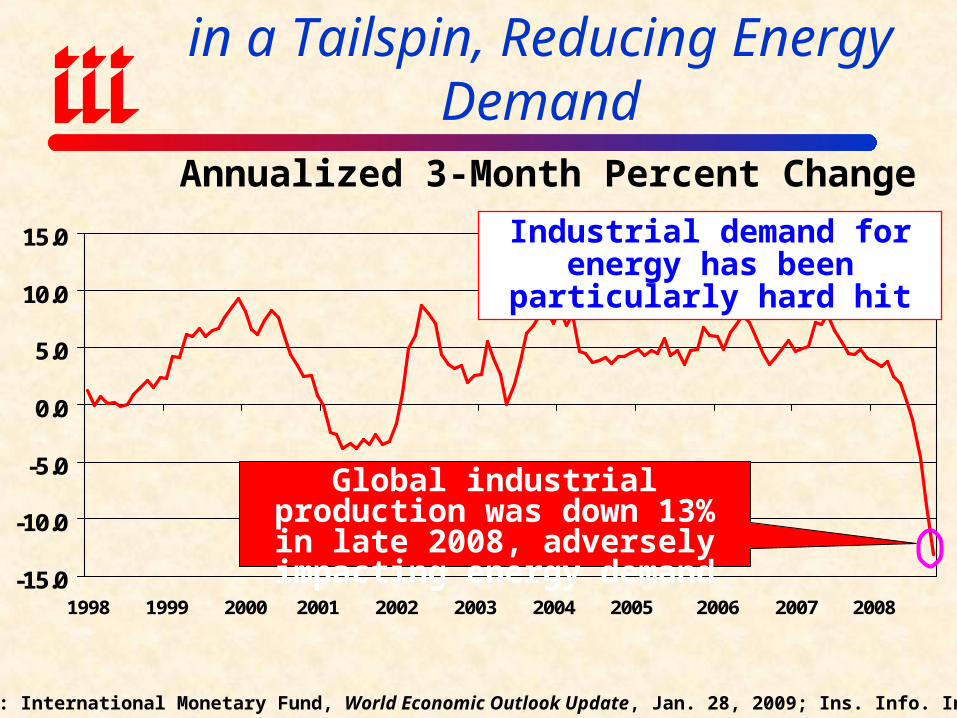
Annualized 3-Month Percent Change
Source: International Monetary Fund, World Economic Outlook Update, Jan. 28, 2009; Ins. Info. Institute.
Global Industrial Production Is in a Tailspin, Reducing Energy Demand
Global industrial production was down 13% in late 2008, adversely
impacting energy demand
Industrial demand for energy has been particularly hard hit
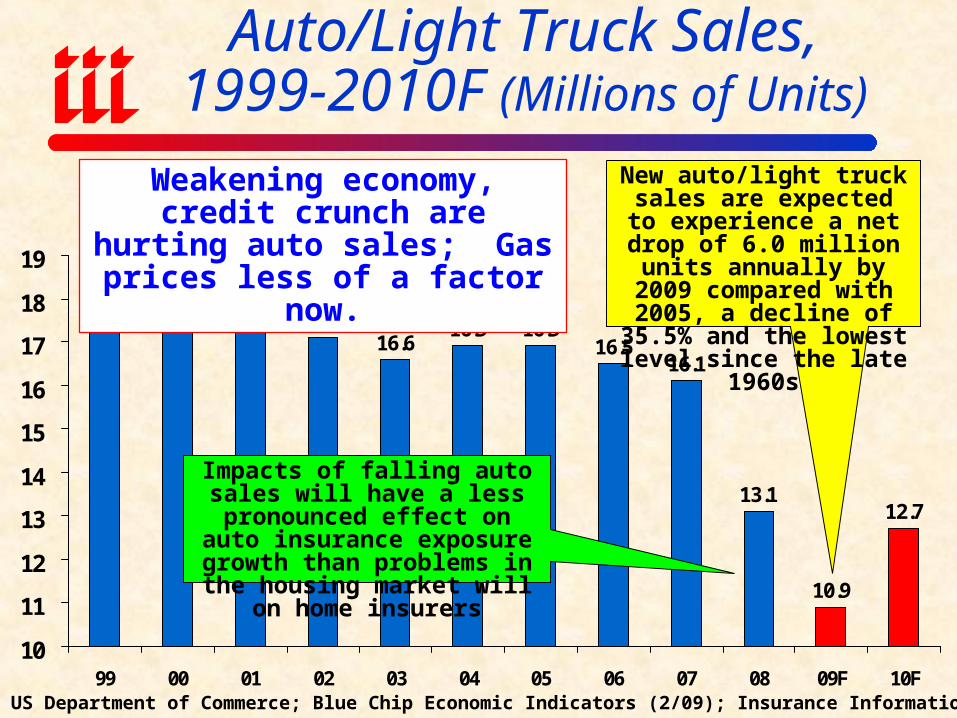
16.916.916.6
17.117.5
17.817.4
16.516.1
13.1
10.9
12.7
10
11
12
13
14
15
16
17
18
19
99 00 01 02 03 04 05 06 07 08 09F 10F
Weakening economy, credit crunch are hurting auto sales; Gas prices less of a factor now.
New auto/light truck sales are expected to experience a net drop of 6.0 million units annually by 2009 compared
with 2005, a decline of 35.5% and the lowest level
since the late 1960s
Impacts of falling auto sales will have a less pronounced effect on auto insurance exposure growth
than problems in the housing market will on home insurers
Auto/Light Truck Sales,1999-2010F (Millions of Units)
Source: US Department of Commerce; Blue Chip Economic Indicators (2/09); Insurance Information Inst.
5.2%
-0.9
%-7
.4%
-6.5
%-1
.5%
1.8%
4.3%
18.6
%20
.3%
5.8%
0.3%
-1.6
%-1
.0%
-1.8
%-1
.0%
3.1%
1.1%
0.8%
0.4%
0.6%
-0.4
%-0
.3%
1.6%
5.6%
13.7
%7.
7%1.
2%-2
.9% -0
.5%
-3.8
%-4
.2%
1.7%
-10%
-5%
0%
5%
10%
15%
20%
25%7
87
98
08
18
28
38
48
58
68
78
88
99
09
19
29
39
49
59
69
79
89
90
00
10
20
30
40
50
60
70
8E
09
F
Rea
l N
WP
Gro
wth
-4%
-2%
0%
2%
4%
6%
8%
Rea
l G
DP
Gro
wth
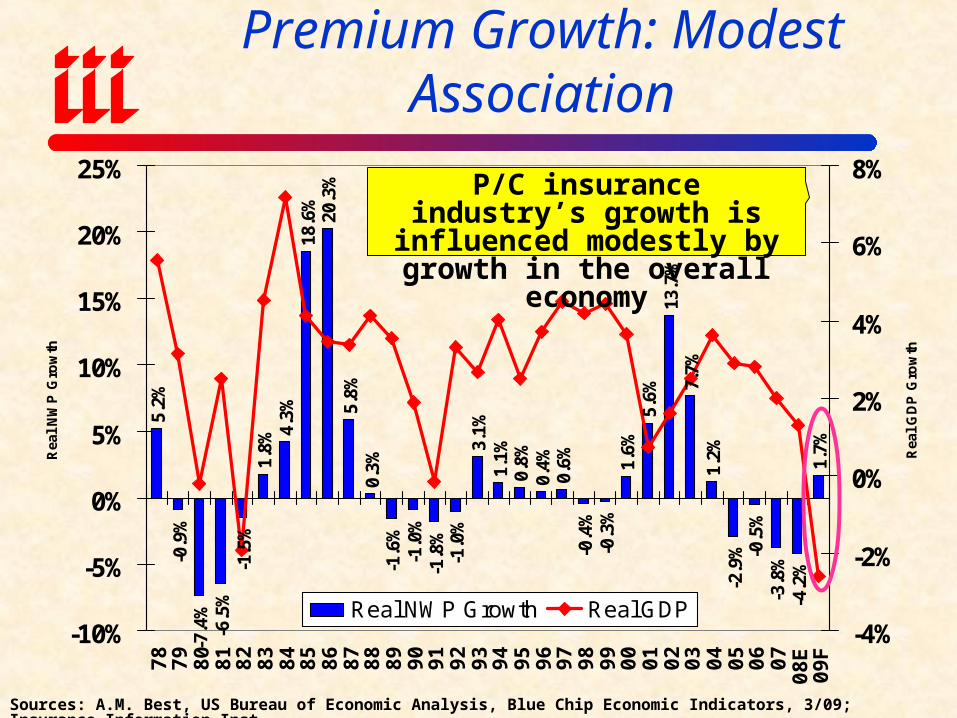
Real NWP Growth Real GDP
Real GDP Growth vs. Real P/C Premium Growth: Modest Association
P/C insurance industry’s growth is influenced modestly by growth
in the overall economy
Sources: A.M. Best, US Bureau of Economic Analysis, Blue Chip Economic Indicators, 3/09; Insurance Information Inst.
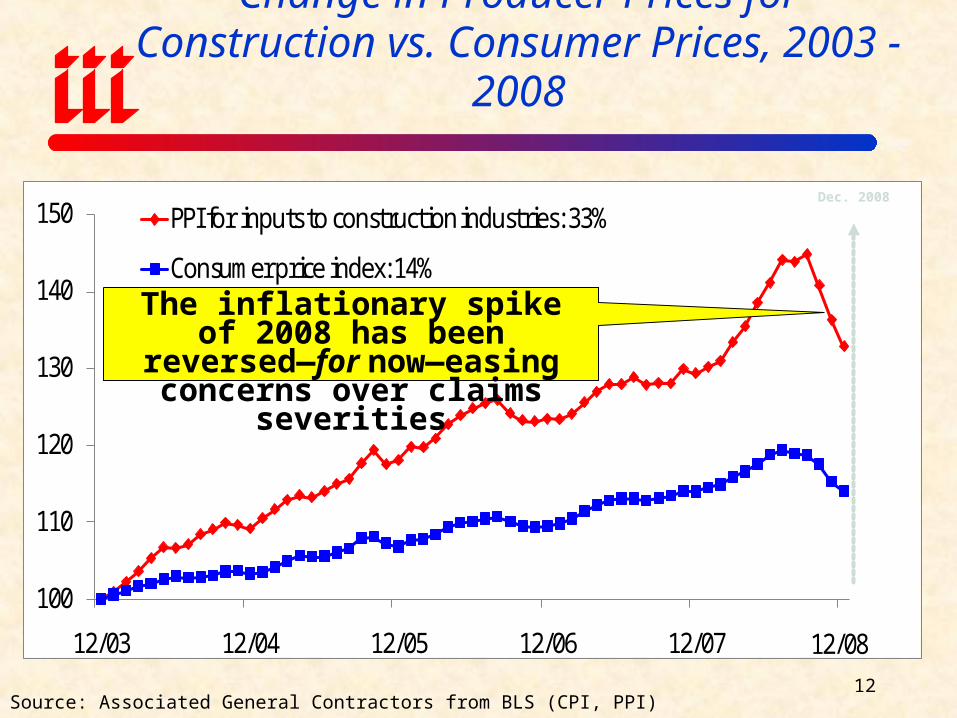
Change in Producer Prices for Construction vs. Consumer Prices, 2003 - 2008
100
110
120
130
140
150
12/03 12/04 12/05 12/06 12/07
PPI for inputs to construction industries: 33%
Consumer price index: 14%
12/08
Source: Associated General Contractors from BLS (CPI, PPI)12
Dec. 2008
The inflationary spike of 2008 has been reversed—for now—easing concerns over claims severities
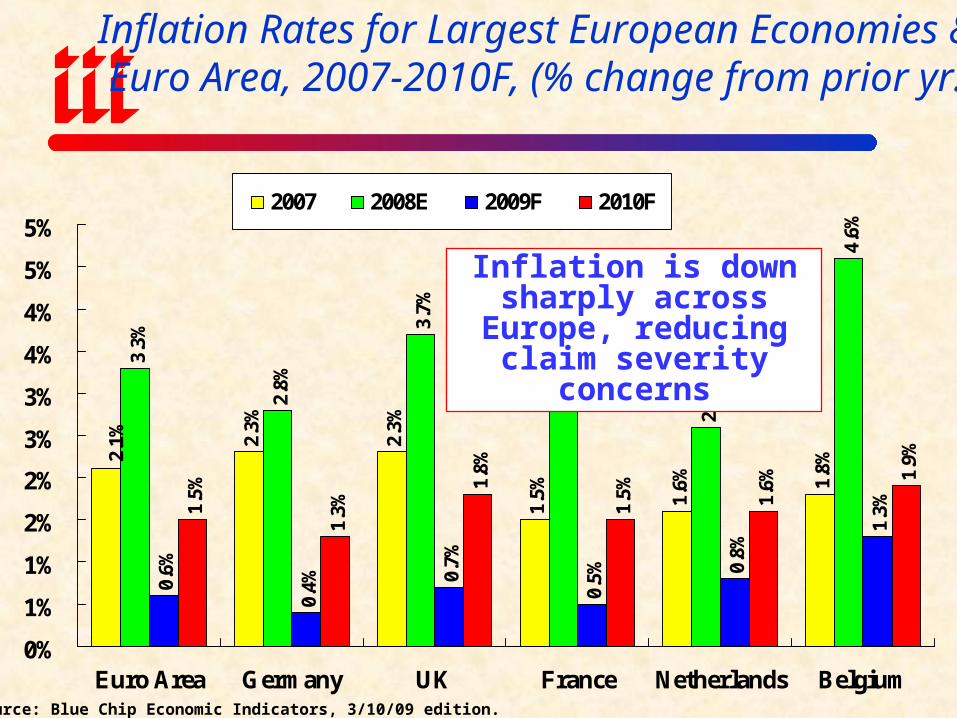
Inflation Rates for Largest European Economies & Euro Area, 2007-2010F, (% change from prior yr.)
2.3%
2.3%
1.5% 1.6% 1.
8%
3.3%
2.8%
3.7%
2.8%
2.6%
4.6%
0.6%
0.4% 0.
7%
0.5% 0.
8%
1.3%1.
5%
1.3%
1.8%
1.5% 1.6% 1.
9%2.1%
0%
1%
1%
2%
2%
3%
3%
4%
4%
5%
5%
Euro Area Germany UK France Netherlands Belgium
2007 2008E 2009F 2010F
Source: Blue Chip Economic Indicators, 3/10/09 edition.
Inflation is down sharply across Europe, reducing claim severity concerns

THE $2.75 TRILLION GLOBAL ECONOMIC
STIMULUS Countries Trying to Spend Their Way Out of Recession Will Need More Energy &
More Insurance
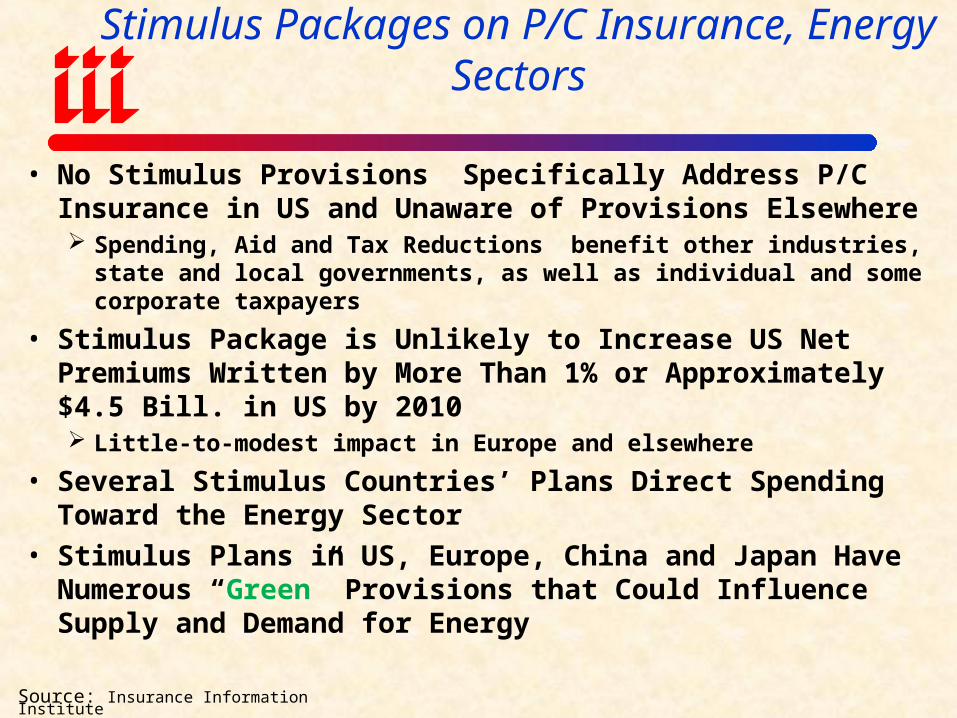
Summary of Short-Run Impacts of Global Stimulus Packages on P/C Insurance, Energy Sectors
• No Stimulus Provisions Specifically Address P/C Insurance in US and Unaware of Provisions Elsewhere Spending, Aid and Tax Reductions benefit other industries, state and local
governments, as well as individual and some corporate taxpayers
• Stimulus Package is Unlikely to Increase US Net Premiums Written by More Than 1% or Approximately $4.5 Bill. in US by 2010 Little-to-modest impact in Europe and elsewhere
• Several Stimulus Countries’ Plans Direct Spending Toward the Energy Sector
• Stimulus Plans in US, Europe, China and Japan Have Numerous “Green” Provisions that Could Influence Supply and Demand for Energy
Source: Insurance Information Institute
$5
.8
$2
.0
$1
30
.4
$3
3.0
$7
5.3
$8
.0
$7
.6
$6
.9
$2
.8
$1
.8
$5
86
.1
$4
85
.9
$11
.3
$2
8.0
$7
.4
$1
3.7
$3
6.8
$787
$4
0.8
$0
$100
$200
$300
$400
$500
$600
$700
$800
$900
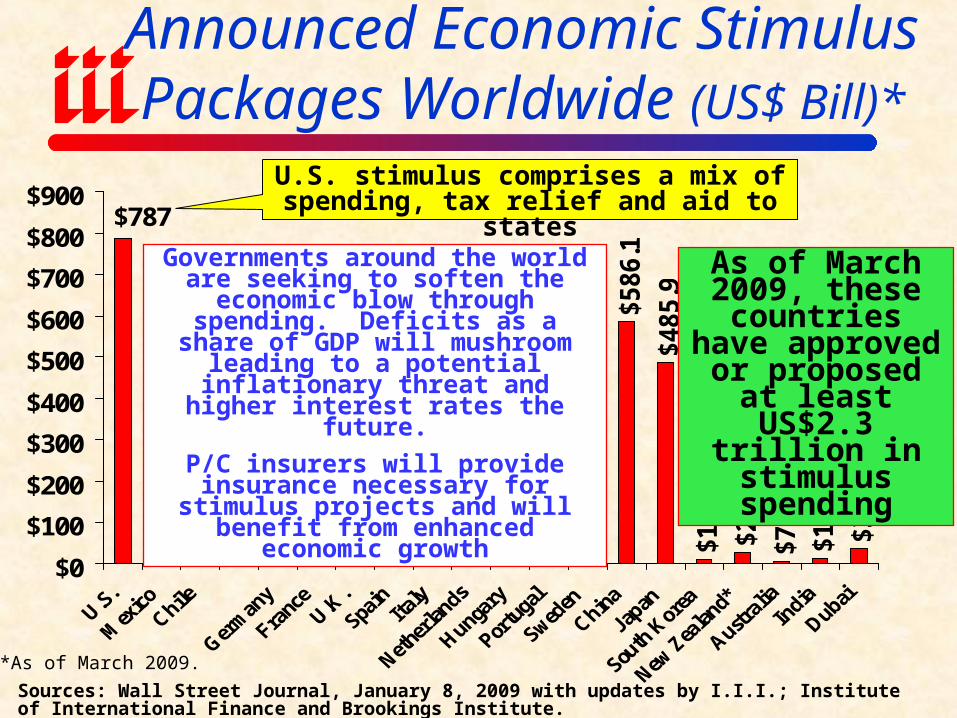
Announced Economic Stimulus Packages Worldwide (US$ Bill)*
Sources: Wall Street Journal, January 8, 2009 with updates by I.I.I.; Institute of International Finance and Brookings Institute.
U.S. stimulus comprises a mix of spending, tax relief and aid to states
*As of March 2009.
Governments around the world are seeking to soften the economic blow
through spending. Deficits as a share of GDP will mushroom leading to a
potential inflationary threat and higher interest rates the future.
P/C insurers will provide insurance necessary for stimulus projects and will benefit from enhanced economic growth
As of March 2009, these countries
have approved or proposed at least US$2.3 trillion in stimulus spending
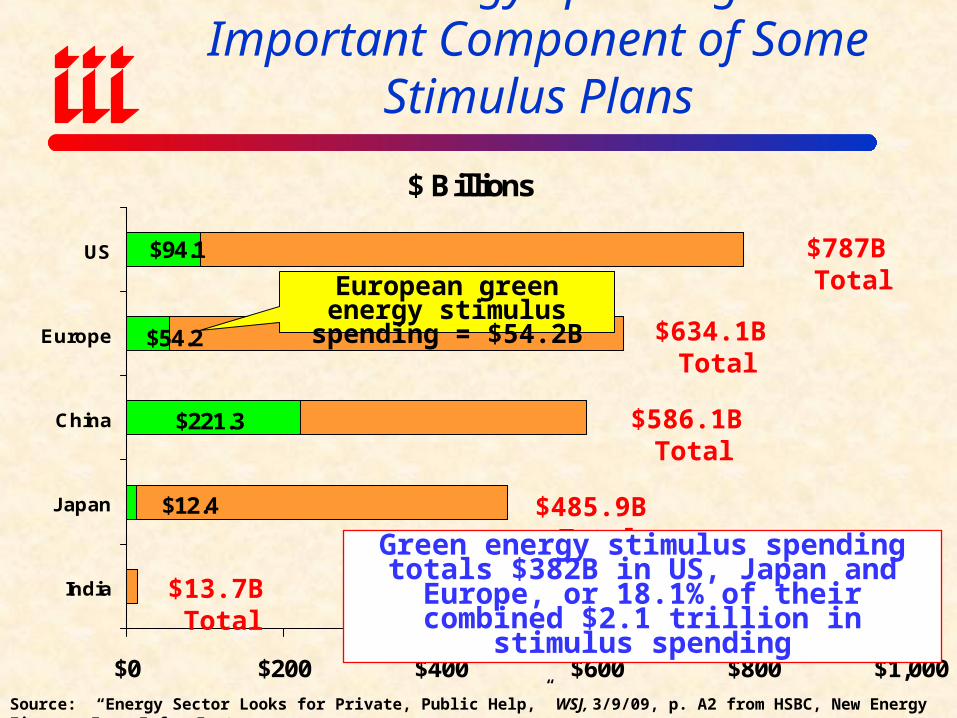
$ Billions
$221.3
$54.2
$94.1
$12.4
$0 $200 $400 $600 $800 $1,000
India
Japan
China
Europe
US $787B Total
Source: “Energy Sector Looks for Private, Public Help,” WSJ, 3/9/09, p. A2 from HSBC, New Energy Finance; Ins. Info. Inst.
Green Energy Spending: An Important Component of Some Stimulus Plans
European green energy stimulus spending = $54.2B
$634.1B Total
$586.1B Total
$485.9B Total
$13.7B Total
Green energy stimulus spending totals $382B in US, Japan and Europe, or 18.1% of their combined $2.1 trillion in stimulus spending

US Economic Stimulus Package: Where the $787B Goes—5% to Energy Projects
Tax Relief, $288 , 38%
State & Local Fiscal Relief, $144 , 18%
Infrastructure & Science, $111 , 14%
Protecting the Vulnerable, $81 , 10%
Health Care, $59 , 7% Education & Training, $53 , 7%
Energy, $43 , 5%
Other, 8, 1%
US stimulus package allocates $43B or 5% or total spending to energy
programs
Source: http://www.recovery.gov/ accessed 2/18/09; Insurance Information Institute.
$ Billions
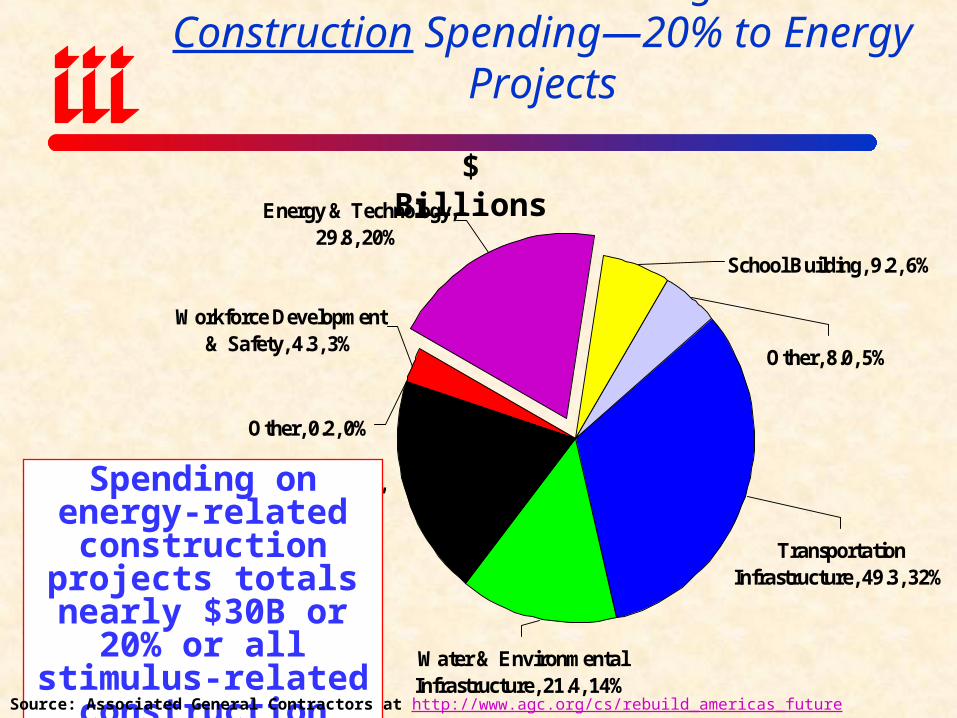
US Economic Stimulus Package: $143.4 in Construction Spending—20% to Energy Projects
Transportation Infrastructure, 49.3, 32%
Water & Environmental Infrastructure, 21.4, 14%
Building Infrastructure, 29.6, 20%
Other, 0.2, 0%
Workforce Development & Safety, 4.3, 3%
Energy & Technology, 29.8, 20%
School Building, 9.2, 6%
Other, 8.0, 5%
Spending on energy-related construction projects totals nearly $30B or 20% or all
stimulus-related construction spending
Source: Associated General Contractors at http://www.agc.org/cs/rebuild_americas_future (2/18/09); Insurance Info. Inst..
$ Billions
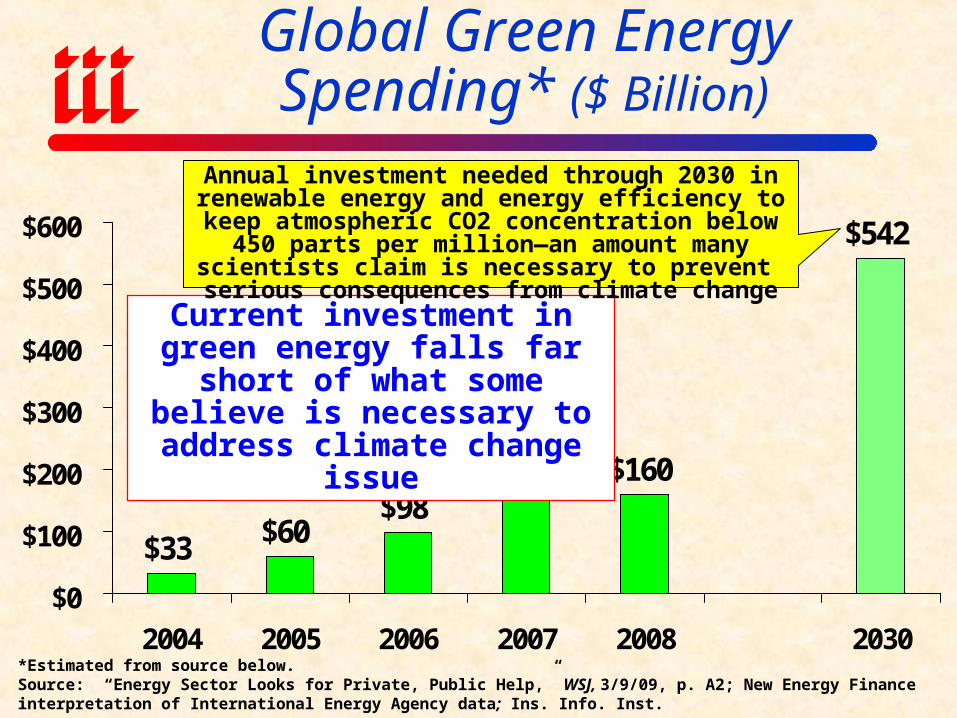
$542
$160$150$98
$60$33
$0
$100
$200
$300
$400
$500
$600
2004 2005 2006 2007 2008 2030
Current investment in green energy falls far short of what some believe is necessary to address climate change issue
Annual investment needed through 2030 in renewable energy and energy efficiency to keep atmospheric CO2 concentration below 450 parts per million—an amount many scientists claim is necessary to prevent serious
consequences from climate change
Global Green Energy Spending* ($ Billion)
*Estimated from source below.Source: “Energy Sector Looks for Private, Public Help,” WSJ, 3/9/09, p. A2; New Energy Finance interpretation of International Energy Agency data; Ins. Info. Inst.
Stimulus: Reading The Economic Tea Leaves for the Next 4 to 8 Years
Source: Insurance Information Institute
• Growing Role of Government: 2009 Stimulus Packages and Other Likely Spending Initiatives in US and Elsewhere Guarantee Government Will Play a Much Larger Role Than at Any Other Time in Recent History Every industry, including insurance, will and must attempt to
maximize direct and indirect benefits from this paradigm shift• Obama Administration Priorities: Stimulus Package
Acts as “Economic Tea Leaf” on the Administration’s Fiscal Priorities for the Next Several Years
• These Include: Alternative Energy Environmental Spending Health Care Aging/New Infrastructure Aid to States
• Global Financial Services Regulatory Reform Includes insurance
FINANCIAL STRENGTH &
RATINGS Industry Has Weathered
the Storms Well
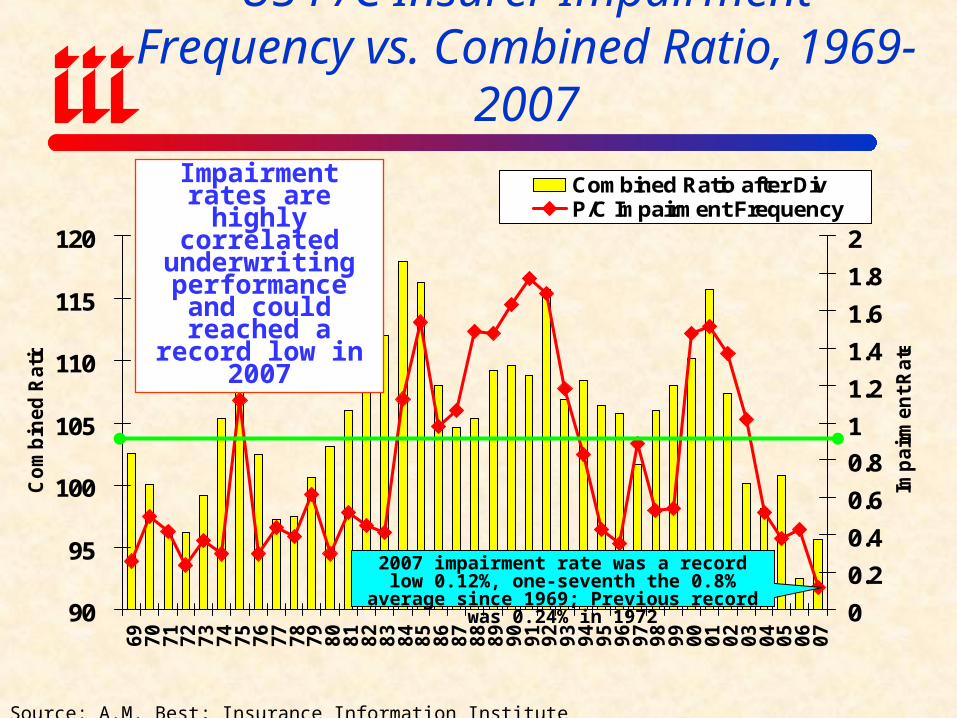
US P/C Insurer Impairment Frequency vs. Combined Ratio, 1969-2007
90
95
100
105
110
115
120
69
70
71
72
73
74
75
76
77
78
79
80
81
82
83
84
85
86
87
88
89
90
91
92
93
94
95
96
97
98
99
00
01
02
03
04
05
06
07
Co
mb
ined
Ratio
0
0.2
0.4
0.6
0.8
1
1.2
1.4
1.6
1.8
2
Imp
air
men
t R
ate
Combined Ratio after DivP/C Impairment Frequency
Impairment rates are highly correlated
underwriting performance and could reached a
record low in 2007
Source: A.M. Best; Insurance Information Institute
2007 impairment rate was a record low 0.12%, one-seventh the 0.8% average since 1969;
Previous record was 0.24% in 1972
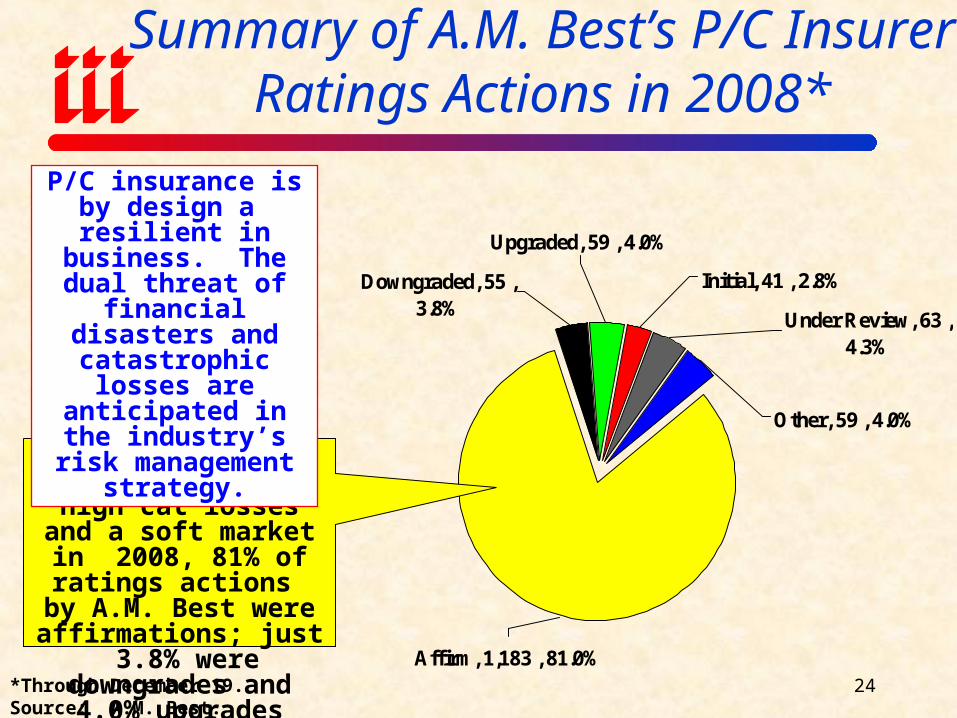
Summary of A.M. Best’s P/C Insurer Ratings Actions in 2008*
Under Review, 63 , 4.3%
Upgraded, 59 , 4.0%
Initial, 41 , 2.8%
Other, 59 , 4.0%
Affirm, 1,183 , 81.0%
Downgraded, 55 , 3.8%
*Through December 19.Source: A.M. Best.
24
Despite financial market turmoil, high cat losses and a soft market in 2008, 81% of ratings actions by A.M. Best
were affirmations; just 3.8% were downgrades
and 4.0% upgrades
P/C insurance is by design a resilient in business. The dual threat of financial
disasters and catastrophic losses are
anticipated in the industry’s risk
management strategy.

Historical Ratings Distribution,US P/C Insurers, 2008 vs. 2005 and 2000
Source: A.M. Best: Rating Downgrades Slowed but Outpaced Upgrades for Fourth Consecutive Year, Special Report, November 8, 2004 for 2000; 2006 and 2009 Review & Preview. *Ratings ‘B’ and lower.
A/A-48.4%
D0.2%C++/C+
1.9%
E/F2.3% A++/A+
11.5%
C/C-0.6%
B++/B+28.3%
B/B-6.9%
2008 2005
P/C insurer financial strength has improved since 2005 despite financial crisis
A/A-52.3%
A++/A+9.2%
B++/B+26.4%
Vulnerable*12.1%
A/A-60.0%
A++/A+10.8%
B++/B+21.3%
Vulnerable*7.9%
2000A++/A+ and A/A- gains
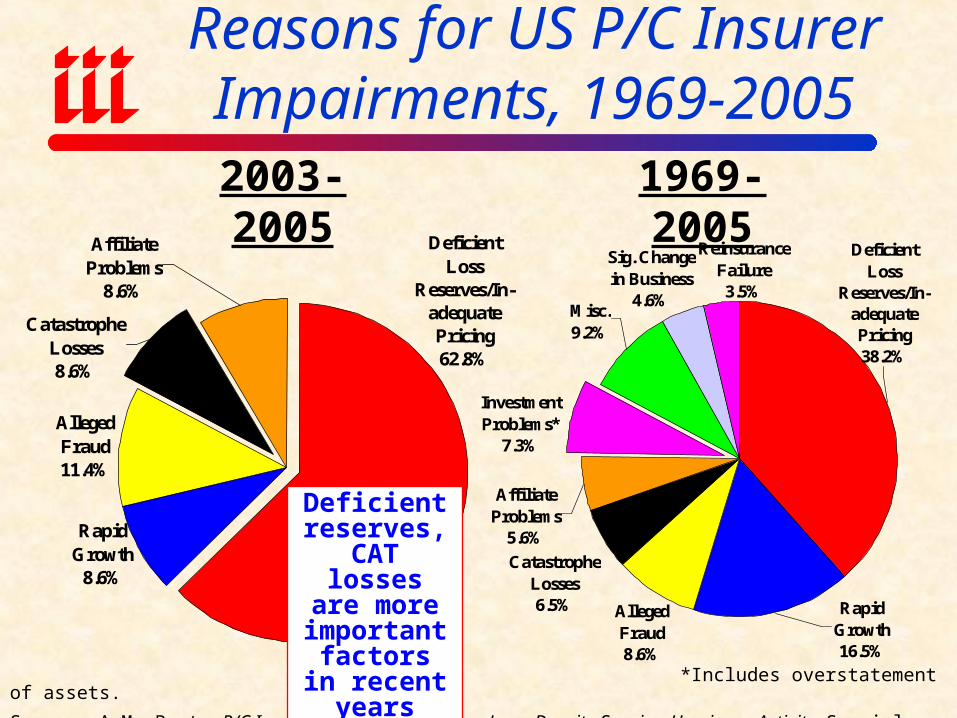
Reasons for US P/C Insurer Impairments, 1969-2005
*Includes overstatement of assets.
Source: A.M. Best: P/C Impairments Hit Near-Term Lows Despite Surging Hurricane Activity, Special Report, Nov. 2005;
Catastrophe Losses8.6%
Alleged Fraud11.4%
Deficient Loss
Reserves/In-adequate Pricing62.8%
Affiliate Problems
8.6%
Rapid Growth
8.6%
2003-2005 1969-2005
Deficient reserves,
CAT losses are more important factors in
recent years
Reinsurance Failure3.5%
Rapid Growth16.5%
Misc.9.2%
Affiliate Problems
5.6%
Sig. Change in Business
4.6%
Deficient Loss
Reserves/In-adequate Pricing38.2%
Investment Problems*
7.3%
Alleged Fraud8.6%
Catastrophe Losses6.5%
Critical Differences Between P/C
Insurers and BanksSuperior Risk Management Model
& Low Leverage Makea Big Difference
$600
$106
$780
$205
$0
$100
$200
$300
$400
$500
$600
$700
$800
Banks Insurers
Losses as of Sept 2008
Total expected losses
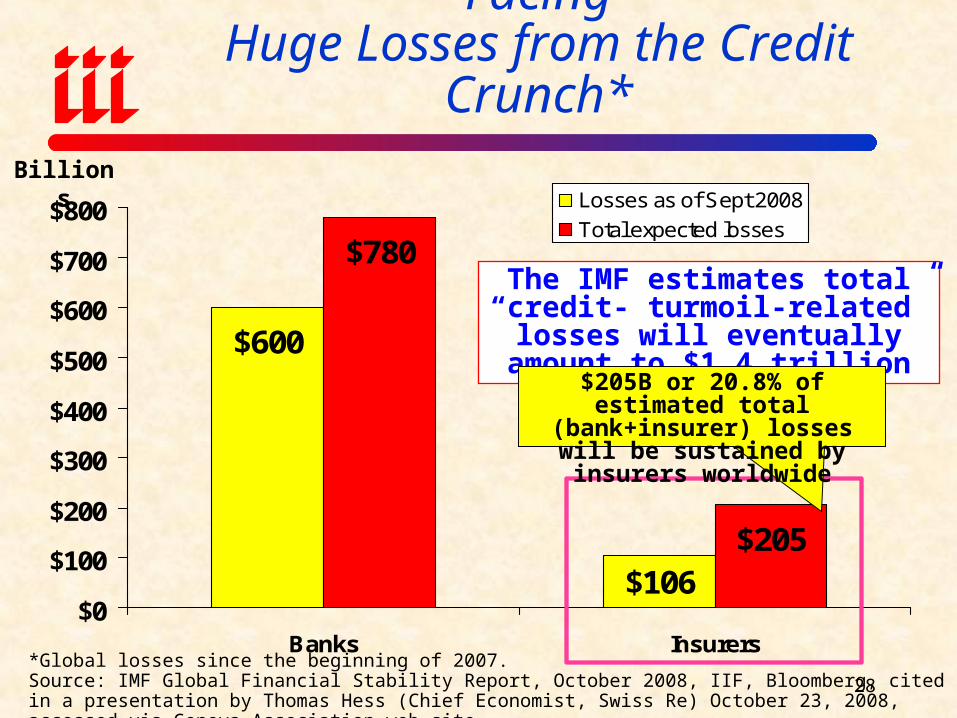
Financial Institutions Globally FacingHuge Losses from the Credit Crunch*
*Global losses since the beginning of 2007.Source: IMF Global Financial Stability Report, October 2008, IIF, Bloomberg, cited in a presentation by Thomas Hess (Chief Economist, Swiss Re) October 23, 2008, accessed via Geneva Association web site.
Billions
The IMF estimates total “credit- turmoil-related” losses will
eventually amount to $1.4 trillion
$205B or 20.8% of estimated total (bank+insurer) losses will be
sustained by insurers worldwide
28
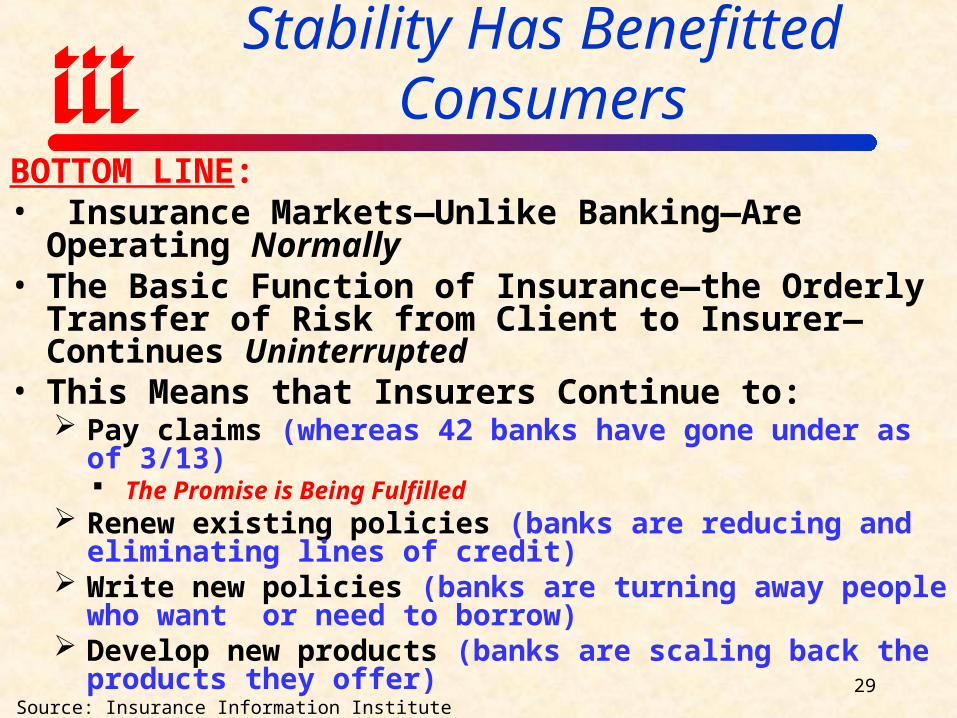
How Insurance Industry Stability Has Benefitted Consumers
BOTTOM LINE:• Insurance Markets—Unlike Banking—Are Operating
Normally• The Basic Function of Insurance—the Orderly Transfer
of Risk from Client to Insurer—Continues Uninterrupted• This Means that Insurers Continue to:
Pay claims (whereas 42 banks have gone under as of 3/13) The Promise is Being Fulfilled
Renew existing policies (banks are reducing and eliminating lines of credit)
Write new policies (banks are turning away people who want or need to borrow)
Develop new products (banks are scaling back the products they offer)
Source: Insurance Information Institute29
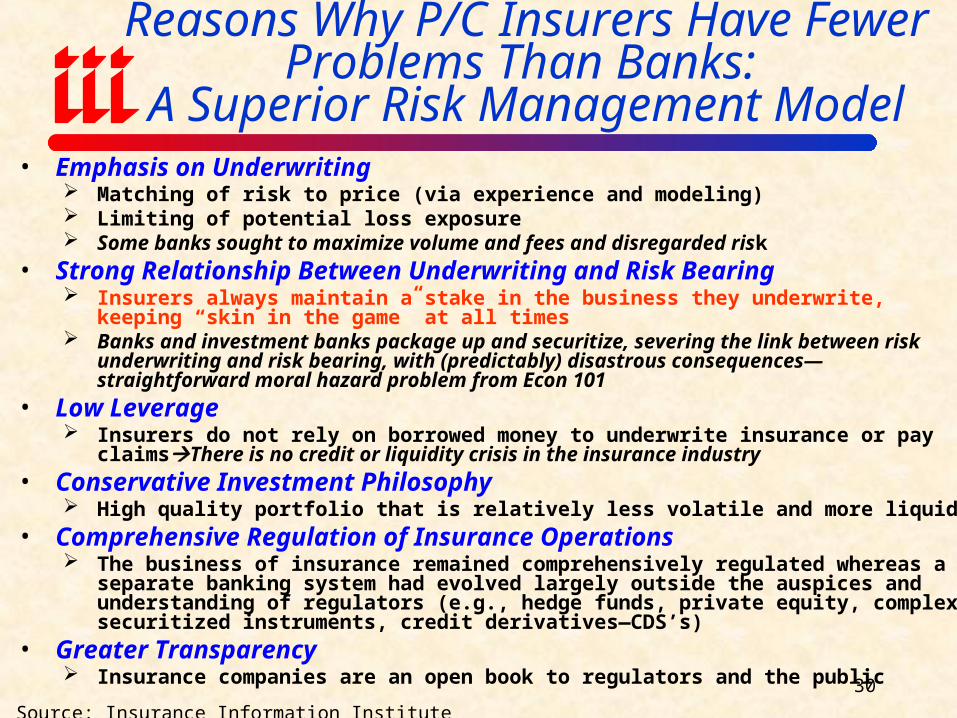
• Emphasis on Underwriting Matching of risk to price (via experience and modeling) Limiting of potential loss exposure Some banks sought to maximize volume and fees and disregarded risk
• Strong Relationship Between Underwriting and Risk Bearing Insurers always maintain a stake in the business they underwrite, keeping “skin in the game”
at all times Banks and investment banks package up and securitize, severing the link between risk
underwriting and risk bearing, with (predictably) disastrous consequences—straightforward moral hazard problem from Econ 101
• Low Leverage Insurers do not rely on borrowed money to underwrite insurance or pay claimsThere is no
credit or liquidity crisis in the insurance industry• Conservative Investment Philosophy
High quality portfolio that is relatively less volatile and more liquid• Comprehensive Regulation of Insurance Operations
The business of insurance remained comprehensively regulated whereas a separate banking system had evolved largely outside the auspices and understanding of regulators (e.g., hedge funds, private equity, complex securitized instruments, credit derivatives—CDS’s)
• Greater Transparency Insurance companies are an open book to regulators and the public
Source: Insurance Information Institute30
Reasons Why P/C Insurers Have Fewer Problems Than Banks:
A Superior Risk Management Model
ENERGY MARKET REVIEW
Global Energy Business Is Deeply Impacted by
Crisis, but Other Factors Matter Too

Key Trends
Capacity & RatingExposure
ProfitabilityReinsurance
Global Energy Insurance Markets: Key Trends
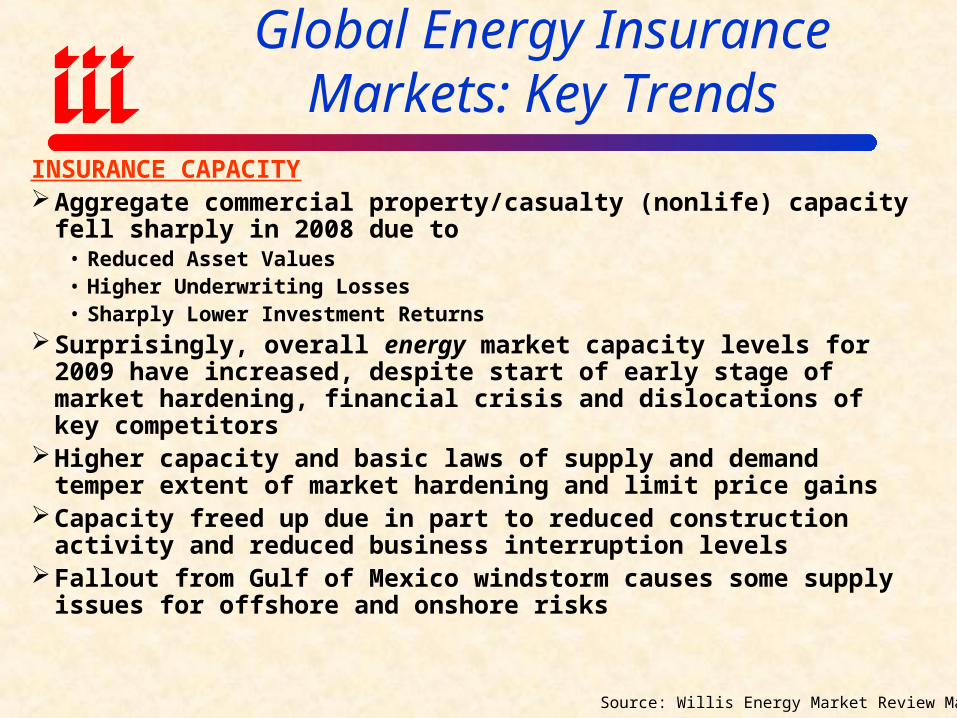
INSURANCE CAPACITYAggregate commercial property/casualty (nonlife) capacity fell sharply in
2008 due to• Reduced Asset Values• Higher Underwriting Losses• Sharply Lower Investment Returns
Surprisingly, overall energy market capacity levels for 2009 have increased, despite start of early stage of market hardening, financial crisis and dislocations of key competitors
Higher capacity and basic laws of supply and demand temper extent of market hardening and limit price gains
Capacity freed up due in part to reduced construction activity and reduced business interruption levels
Fallout from Gulf of Mexico windstorm causes some supply issues for offshore and onshore risks
Source: Willis Energy Market Review March 2009
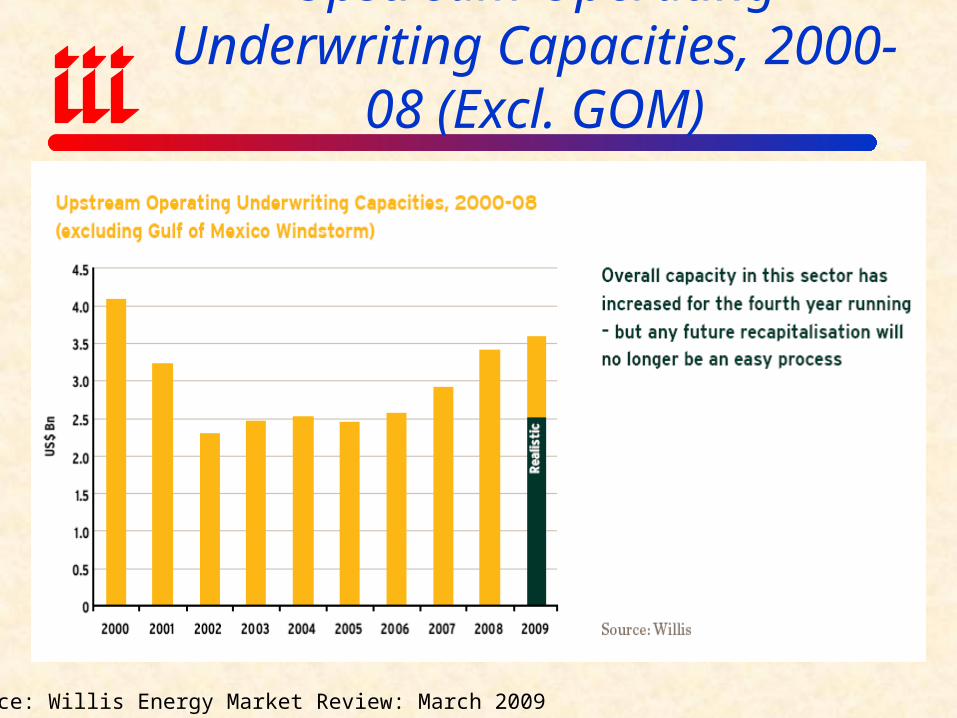
Upstream Operating Underwriting Capacities, 2000-08 (Excl. GOM)
Source: Willis Energy Market Review: March 2009
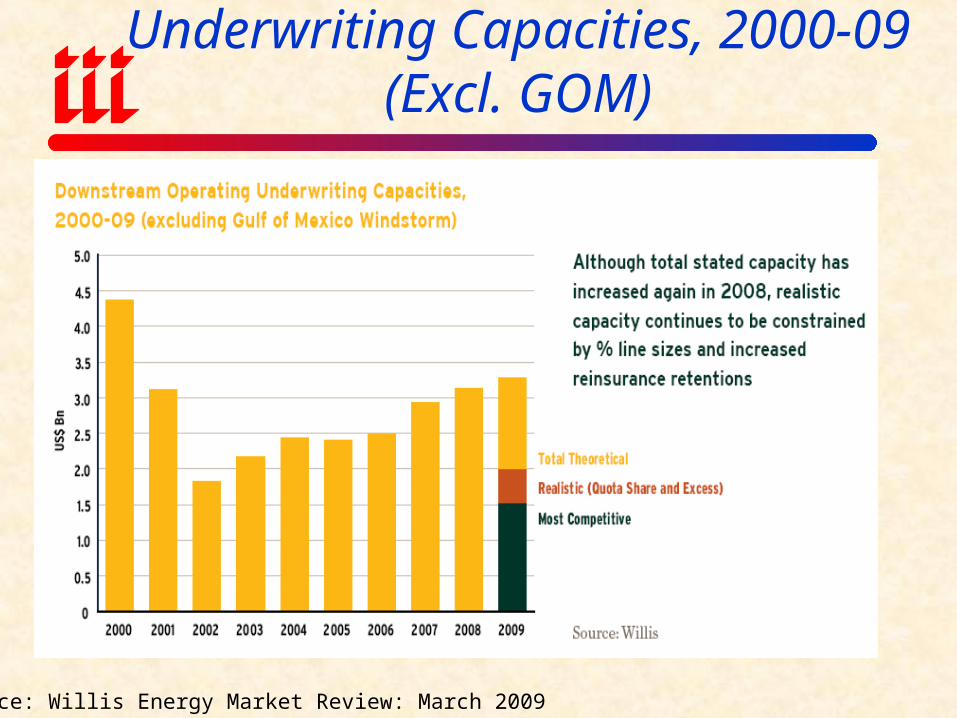
Downstream Operating Underwriting Capacities, 2000-09 (Excl. GOM)
Source: Willis Energy Market Review: March 2009
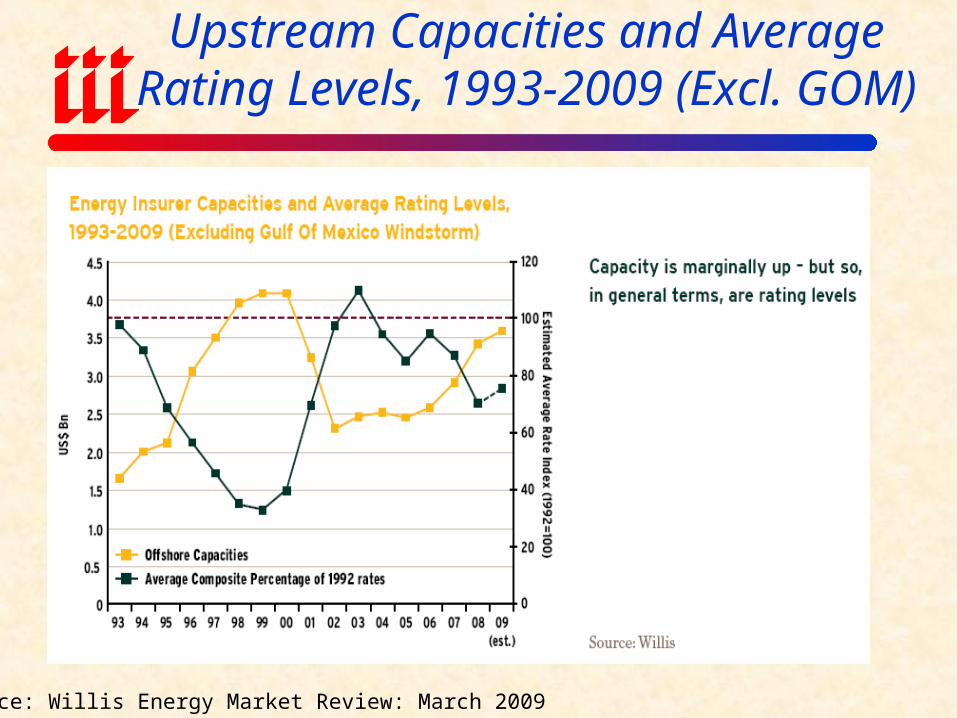
Upstream Capacities and Average Rating Levels, 1993-2009 (Excl. GOM)
Source: Willis Energy Market Review: March 2009
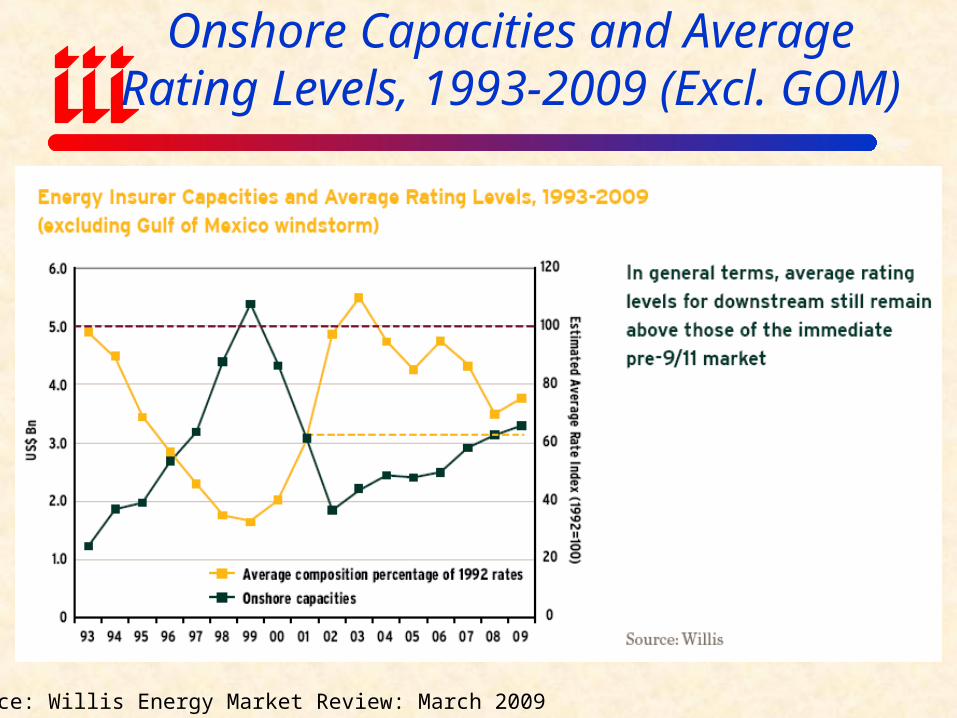
Onshore Capacities and Average Rating Levels, 1993-2009 (Excl. GOM)
Source: Willis Energy Market Review: March 2009
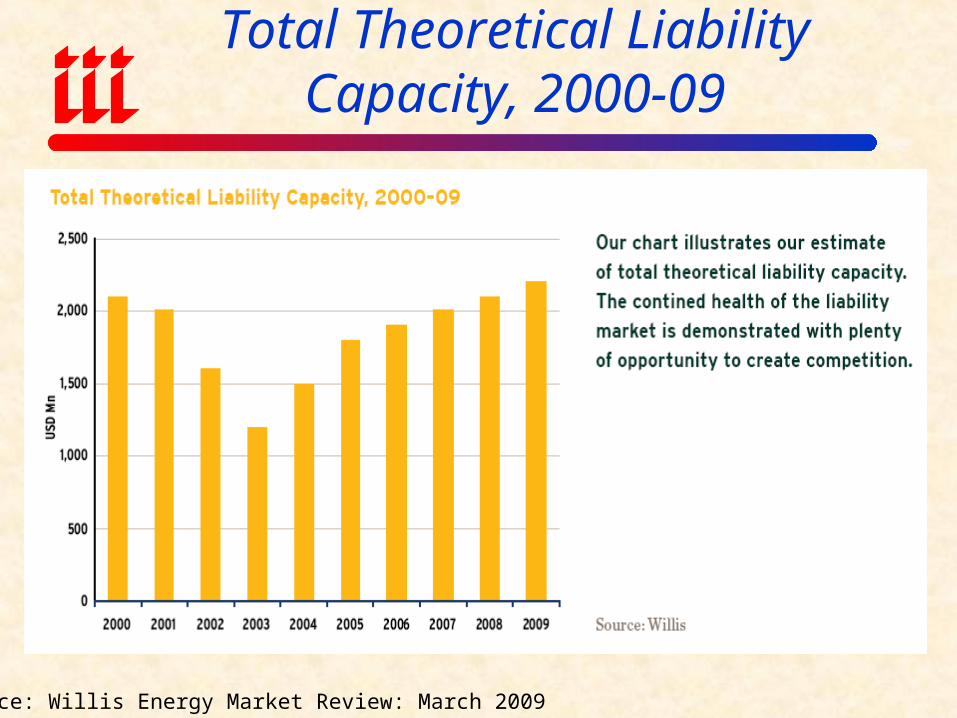
Total Theoretical Liability Capacity, 2000-09
Source: Willis Energy Market Review: March 2009
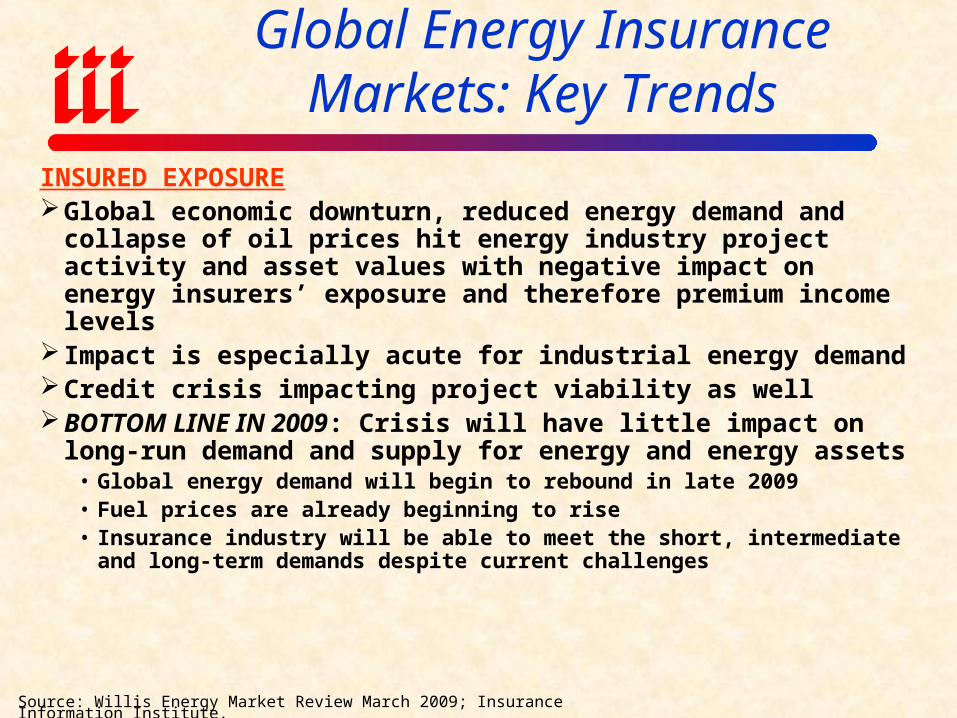
Global Energy Insurance Markets: Key Trends
INSURED EXPOSUREGlobal economic downturn, reduced energy demand and
collapse of oil prices hit energy industry project activity and asset values with negative impact on energy insurers’ exposure and therefore premium income levels
Impact is especially acute for industrial energy demandCredit crisis impacting project viability as wellBOTTOM LINE IN 2009: Crisis will have little impact on
long-run demand and supply for energy and energy assets• Global energy demand will begin to rebound in late 2009• Fuel prices are already beginning to rise• Insurance industry will be able to meet the short, intermediate and
long-term demands despite current challenges
Source: Willis Energy Market Review March 2009; Insurance Information Institute.
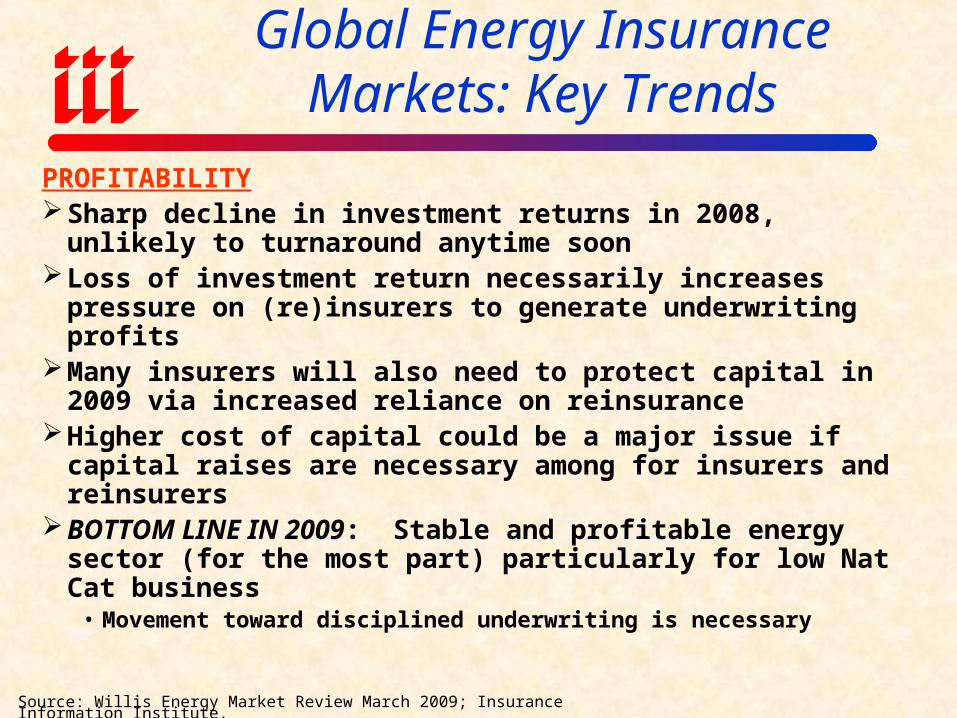
Global Energy Insurance Markets: Key Trends
PROFITABILITYSharp decline in investment returns in 2008, unlikely to
turnaround anytime soonLoss of investment return necessarily increases pressure on
(re)insurers to generate underwriting profitsMany insurers will also need to protect capital in 2009 via
increased reliance on reinsuranceHigher cost of capital could be a major issue if capital raises
are necessary among for insurers and reinsurersBOTTOM LINE IN 2009: Stable and profitable energy sector
(for the most part) particularly for low Nat Cat business• Movement toward disciplined underwriting is necessary
Source: Willis Energy Market Review March 2009; Insurance Information Institute.
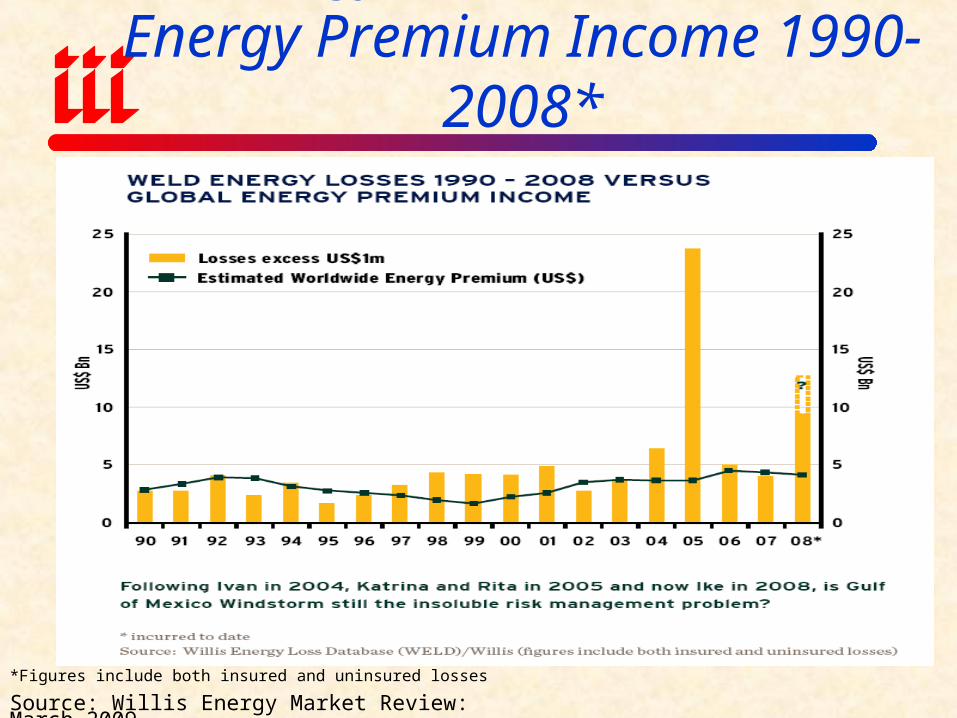
Energy Losses vs. Global Energy Premium Income 1990-2008*
*Figures include both insured and uninsured losses
Source: Willis Energy Market Review: March 2009
Gulf of Mexico Windstorm: Still An Insoluble Problem?
Gulf of Mexico windstorm (GOM) number one underwriting headache in the wake of Hurricane Ike
Long-term sustainability of Gulf wind insurance product in serious question by both the reinsurance and direct markets
Offshore energy losses spike in 2004, 2005 and 2008 due to impact of Big Four (Hurricanes Ivan, Katrina, Rita and Ike)
Lloyd’s Franchise Performance Directorate (LFPD) taking keen interest in individual syndicates’ plans to write GOM wind in 2009. Significant product changes expected.
Market expected to offer 30 percent less capacity than in 2008
Catastrophe modeling and capital market parametric solutions expected to play a role.
Source: Willis Energy Market Review March 2009
Reinsurance & Alternative Risk
Transfer
Capacity is Down, Demand is Up
Reinsurance Market TrendsAmid global capital markets turmoil and economic downturn
global reinsurance industry has faired relatively well (with a small number of exceptions)
Capacity, however, is down due to investment issuesBut reinsurers seeking price increases as of 1 January and risk
appetite more constrained (e.g., U.S. catastrophe risk)Primary insurers exploring lower retentions and other
reinsurance mechanisms to protect and enhance their capital positions
Increasing syndication of risk as insurers seek to use portfolio diversification to mitigate counterparty exposure
Opportunity for traditional reinsurance market to win back market share as some alternative forms of risk transfer have dried up
Source: Willis Energy Market Review March 2009; Insurance Information Institute.
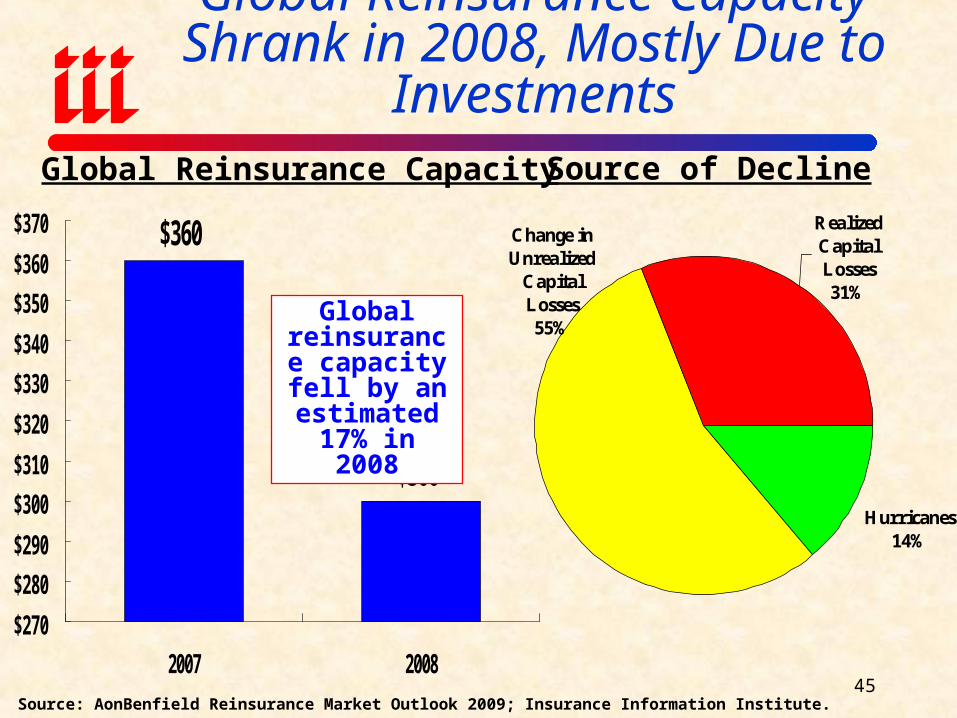
Global Reinsurance Capacity Shrank in 2008, Mostly Due to Investments
$360
$300
$270
$280
$290
$300
$310
$320
$330
$340
$350
$360
$370
2007 2008
Global Reinsurance Capacity
Global reinsurance
capacity fell by an estimated 17% in 2008
45
Hurricanes14%
Change in Unrealized
Capital Losses55%
Realized Capital Losses31%
Source of Decline
Source: AonBenfield Reinsurance Market Outlook 2009; Insurance Information Institute.
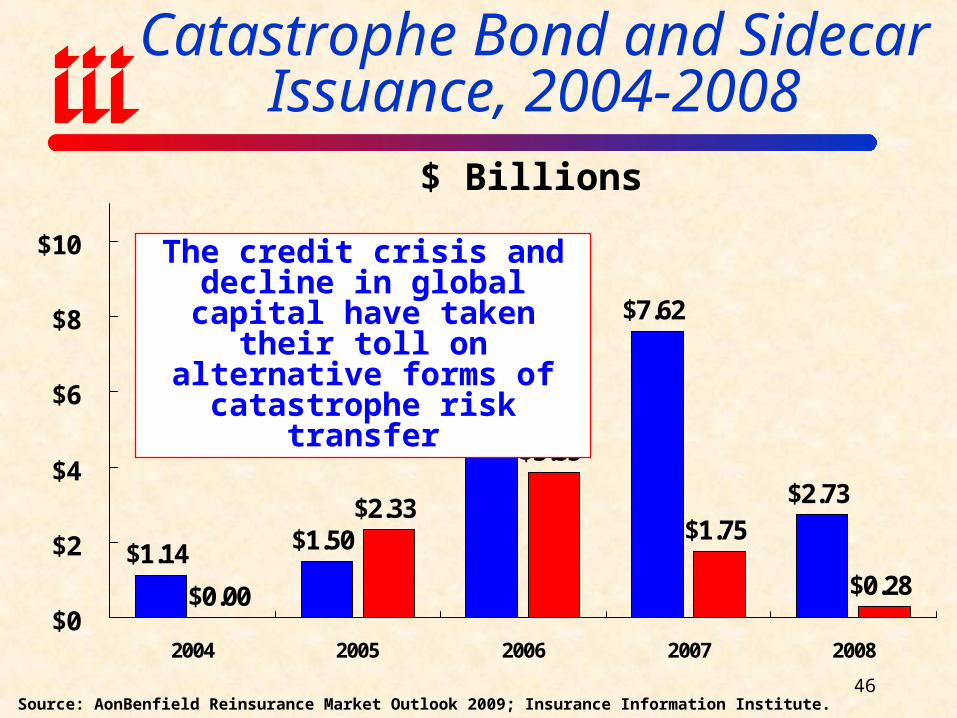
Catastrophe Bond and Sidecar Issuance, 2004-2008
$1.14 $1.50
$4.69
$7.62
$2.73
$0.00
$2.33
$3.85
$1.75
$0.28$0
$2
$4
$6
$8
$10
2004 2005 2006 2007 2008
$ Billions
The credit crisis and decline in global capital have taken their
toll on alternative forms of catastrophe risk transfer
46Source: AonBenfield Reinsurance Market Outlook 2009; Insurance Information Institute.
The Global Financial Crisis Affects Energy Industry Supply and Demand & Insurance
Exposure
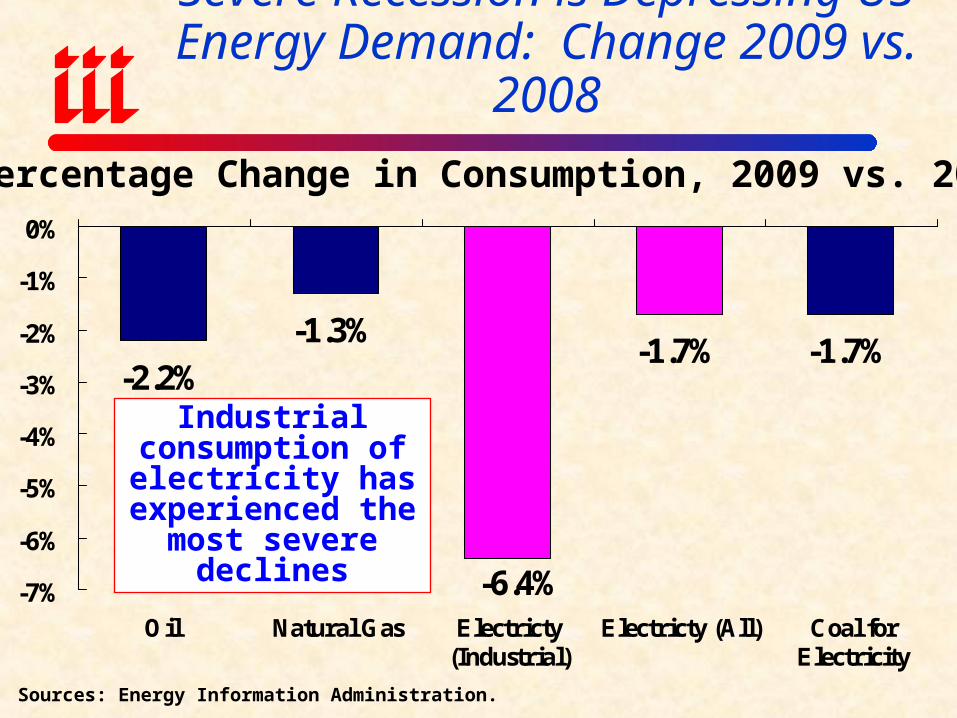
Severe Recession is Depressing US Energy Demand: Change 2009 vs. 2008
-2.2%
-1.3%-1.7% -1.7%
-6.4%-7%
-6%
-5%
-4%
-3%
-2%
-1%
0%
Oil Natural Gas Electricty(Industrial)
Electricty (All) Coal forElectricity
Sources: Energy Information Administration.
Industrial consumption of electricity has
experienced the most severe declines
Percentage Change in Consumption, 2009 vs. 2008
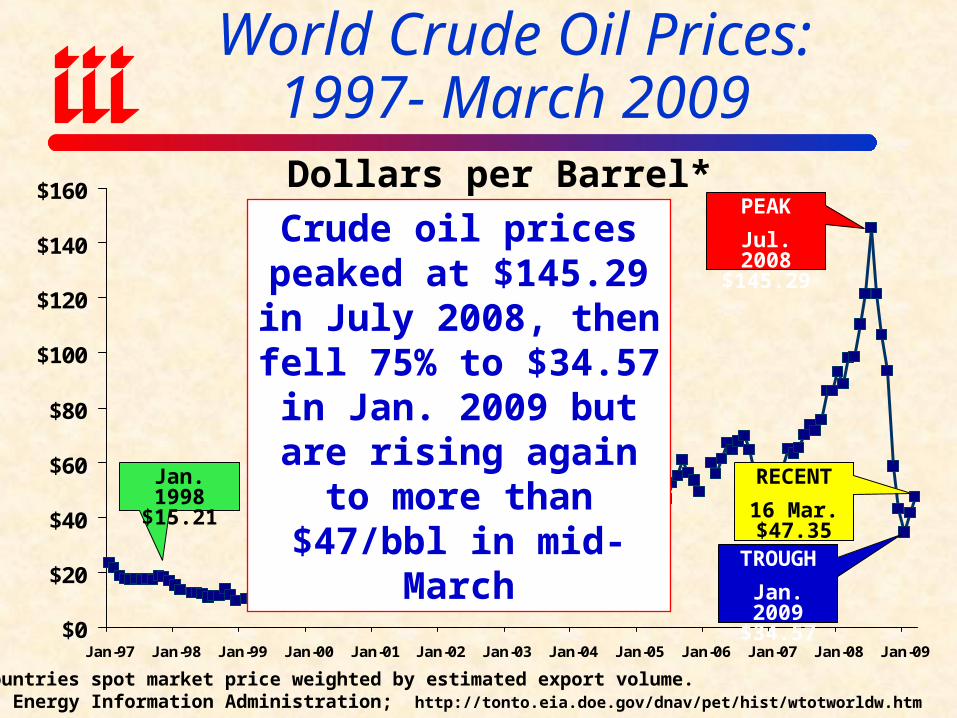
World Crude Oil Prices: 1997- March 2009
*All countries spot market price weighted by estimated export volume. Source: Energy Information Administration; http://tonto.eia.doe.gov/dnav/pet/hist/wtotworldw.htm
$0
$20
$40
$60
$80
$100
$120
$140
$160
Jan-97 Jan-98 Jan-99 Jan-00 Jan-01 Jan-02 Jan-03 Jan-04 Jan-05 Jan-06 Jan-07 Jan-08 Jan-09
Dollars per Barrel*
Crude oil prices peaked at $145.29 in July 2008, then fell 75% to $34.57
in Jan. 2009 but are rising again to more than
$47/bbl in mid-MarchJan. 1998
$15.21
PEAK
Jul. 2008 $145.29
TROUGH
Jan. 2009 $34.57
RECENT
16 Mar. $47.35
0%
2%
4%
6%
8%
10%
12%
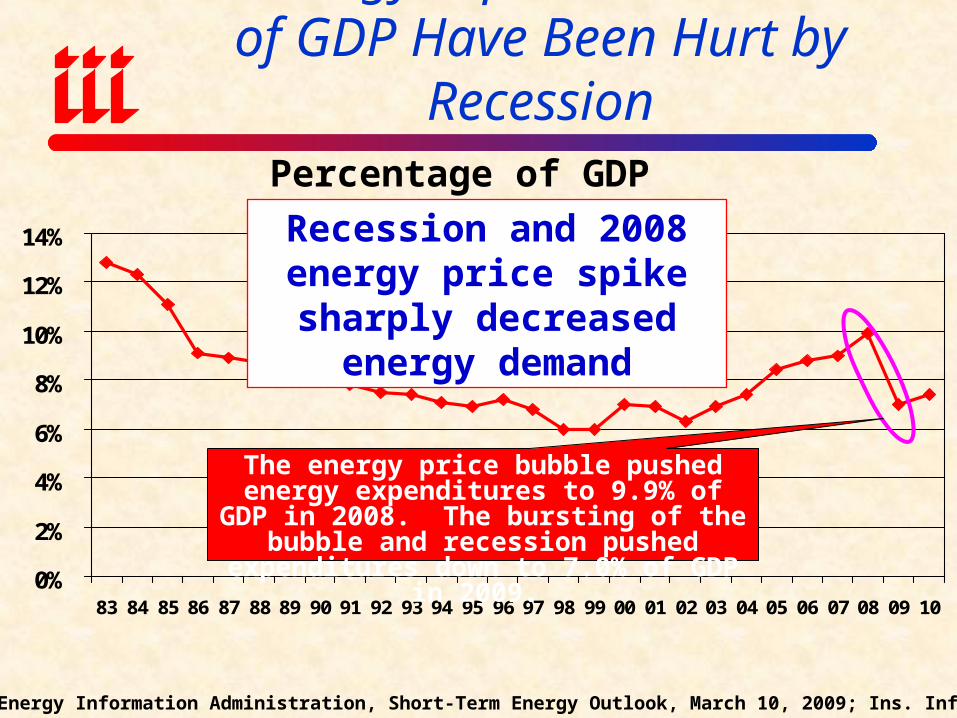
14%
83 84 85 86 87 88 89 90 91 92 93 94 95 96 97 98 99 00 01 02 03 04 05 06 07 08 09 10
Percentage of GDP
Source: Energy Information Administration, Short-Term Energy Outlook, March 10, 2009; Ins. Info. Inst.
US Energy Expenditures as a % of GDP Have Been Hurt by Recession
The energy price bubble pushed energy expenditures to 9.9% of GDP in 2008. The bursting of the bubble and recession pushed expenditures down to 7.0% of GDP in 2009.
Recession and 2008 energy price spike sharply
decreased energy demand
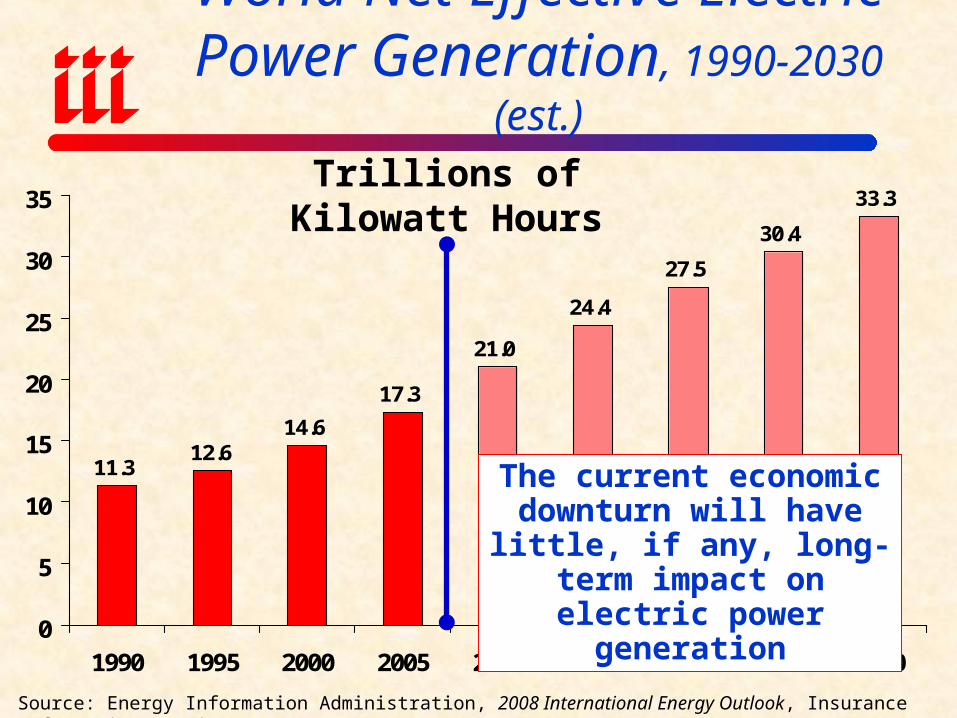
11.3
14.6
17.3
21.0
24.4
27.5
30.4
33.3
12.6
0
5
10
15
20
25
30
35
1990 1995 2000 2005 2010 2015 2020 2025 2030
World Net Effective Electric Power Generation, 1990-2030 (est.)
Source: Energy Information Administration, 2008 International Energy Outlook, Insurance Information Institute.
The current economic downturn will have little, if any, long-term impact on electric power generation
Trillions of Kilowatt Hours
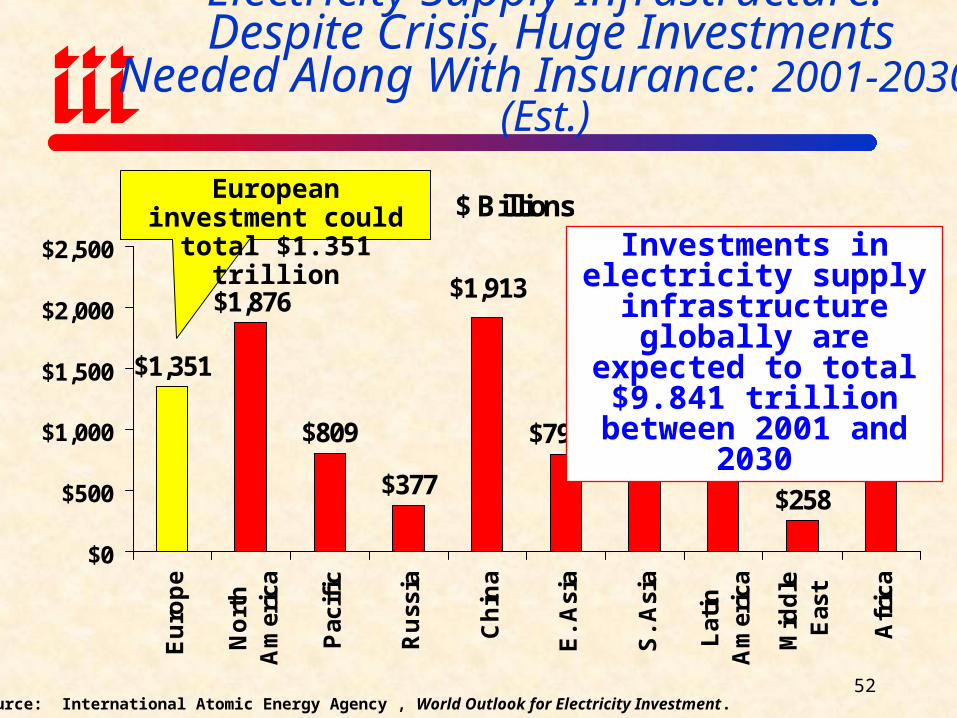
Electricity Supply Infrastructure: Despite Crisis, Huge Investments Needed
Along With Insurance: 2001-2030 (Est.)
$ Billions
$1,351
$1,876
$809
$377
$744
$258
$609$783$799
$1,913
$0
$500
$1,000
$1,500
$2,000
$2,500
Eu
rop
e
No
rth
Am
eric
a
Pac
ific
Ru
ssia
Ch
ina
E.
Asi
a
S.
Asi
a
Lat
inA
mer
ica
Mid
dle
Eas
t
Afr
ica
Source: International Atomic Energy Agency , World Outlook for Electricity Investment.
Investments in electricity supply infrastructure
globally are expected to total $9.841 trillion
between 2001 and 2030
European investment could total $1.351 trillion
52
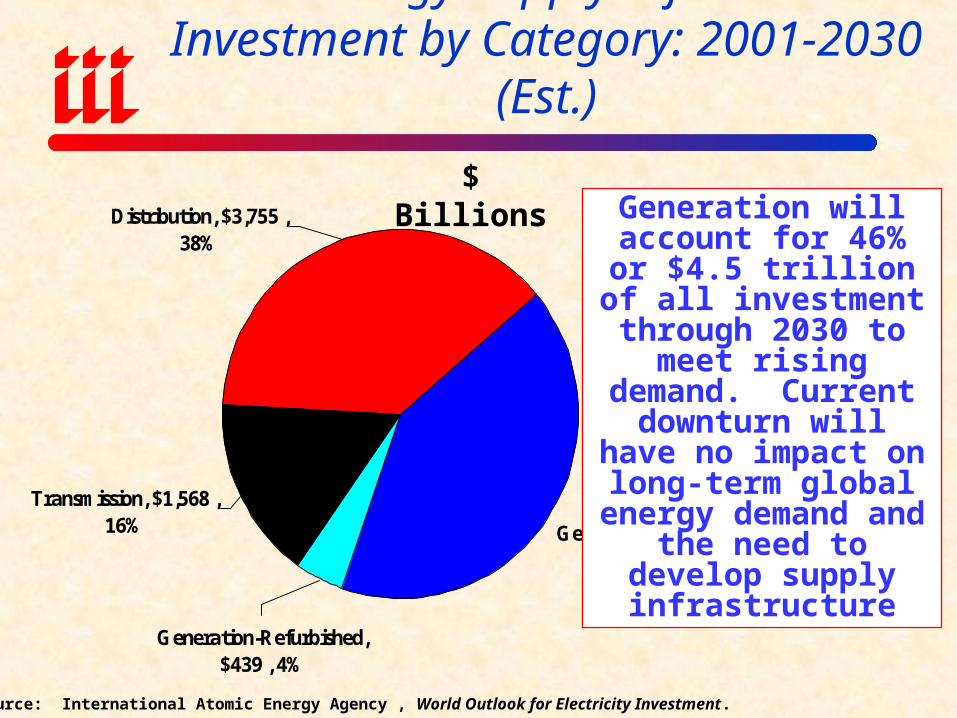
World Energy Supply Infrastructure Investment by Category: 2001-2030 (Est.)
Generation-New, $4,080 , 42%
Generation-Refurbished, $439 , 4%
Transmission, $1,568 , 16%
Distribution, $3,755 , 38%
Generation will account for 46% or $4.5 trillion
of all investment through 2030 to meet
rising demand. Current downturn will have no impact on long-term
global energy demand and the need to develop supply infrastructure
$ Billions
Source: International Atomic Energy Agency , World Outlook for Electricity Investment.
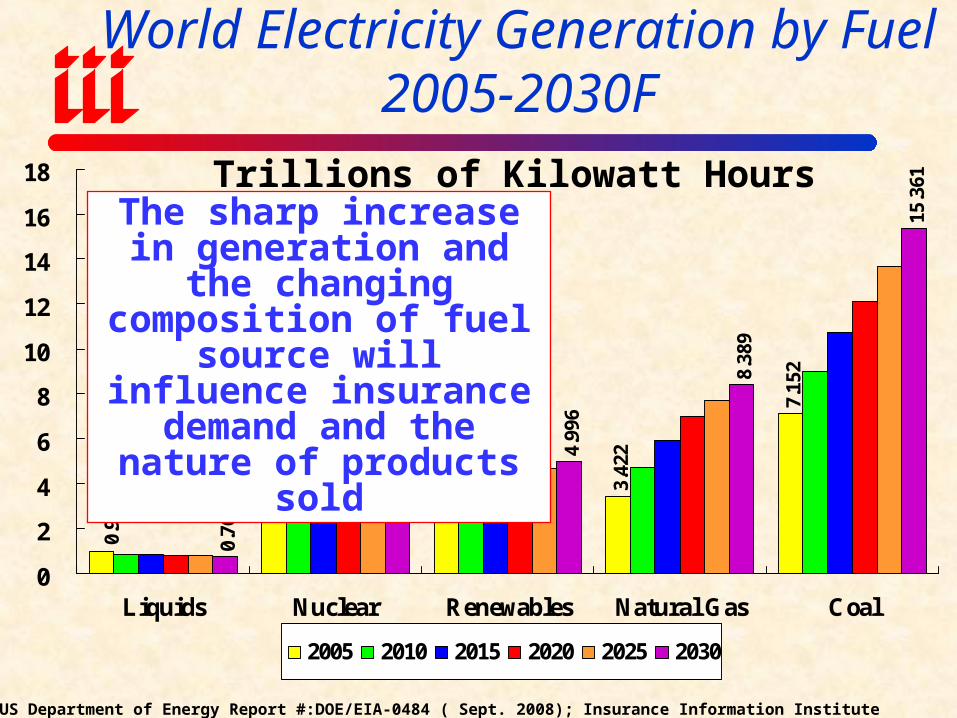
World Electricity Generation by Fuel 2005-2030F
2.63 3.
16 3.42
2
7.15
2
0.76
4
3.75
4 4.99
6
8.38
9
15.3
61
0.95
6
0
2
4
6
8
10
12
14
16
18
Liquids Nuclear Renewables Natural Gas Coal
2005 2010 2015 2020 2025 2030
Source: US Department of Energy Report #:DOE/EIA-0484 ( Sept. 2008); Insurance Information Institute
The sharp increase in generation and the
changing composition of fuel source will influence
insurance demand and the nature of products sold
Trillions of Kilowatt Hours
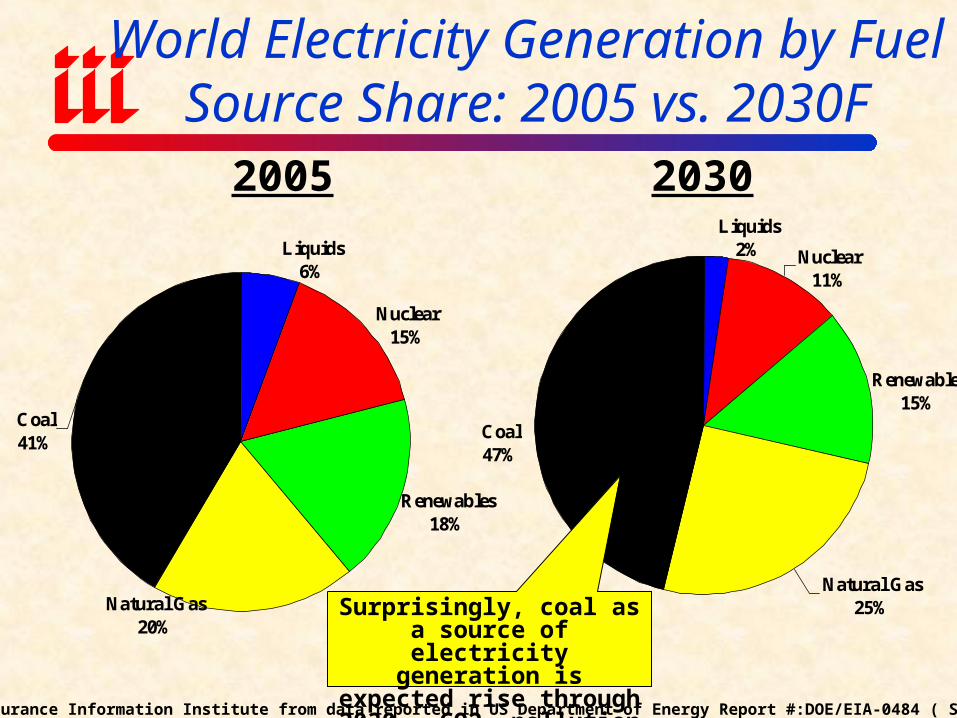
Natural Gas20%
Renewables18%
Liquids6%
Coal41%
Nuclear15%
2005 2030
World Electricity Generation by Fuel Source Share: 2005 vs. 2030F
Natural Gas25%
Renewables15%
Liquids2%
Coal47%
Nuclear11%
Surprisingly, coal as a source of electricity generation is
expected rise through 2030. CO2, pollution issues?
Source: Insurance Information Institute from data reported in US Department of Energy Report #:DOE/EIA-0484 ( Sept. 2008).
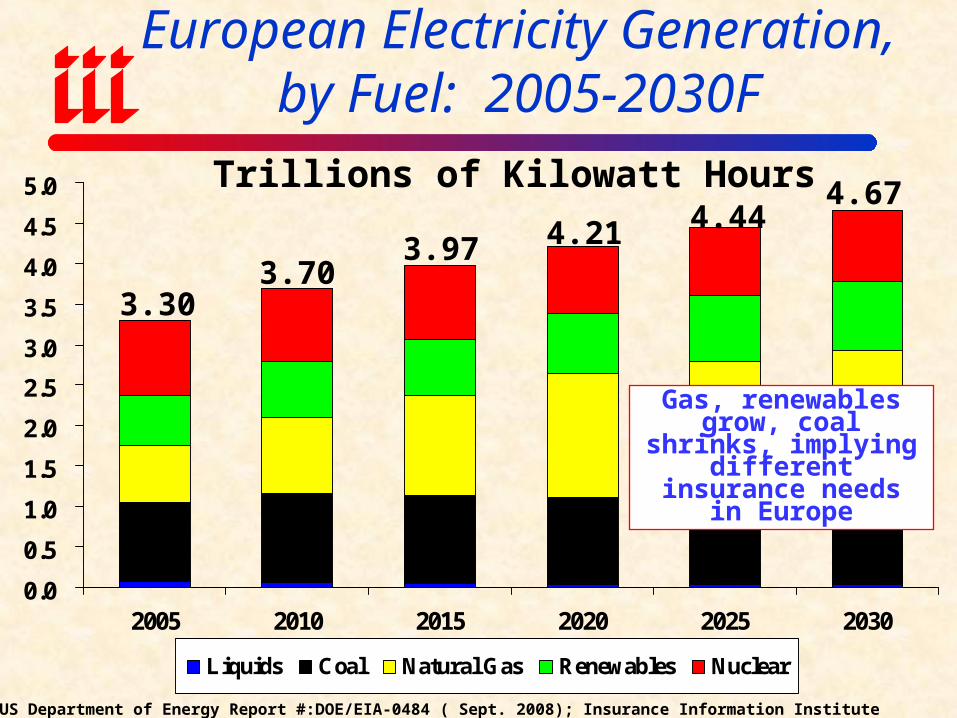
European Electricity Generation,by Fuel: 2005-2030F
0.0
0.5
1.0
1.5
2.0
2.5
3.0
3.5
4.0
4.5
5.0
2005 2010 2015 2020 2025 2030
Liquids Coal Natural Gas Renewables Nuclear
Source: US Department of Energy Report #:DOE/EIA-0484 ( Sept. 2008); Insurance Information Institute
Gas, renewables grow, coal shrinks, implying
different insurance needs in Europe
Trillions of Kilowatt Hours
3.303.70
3.97 4.21 4.444.67
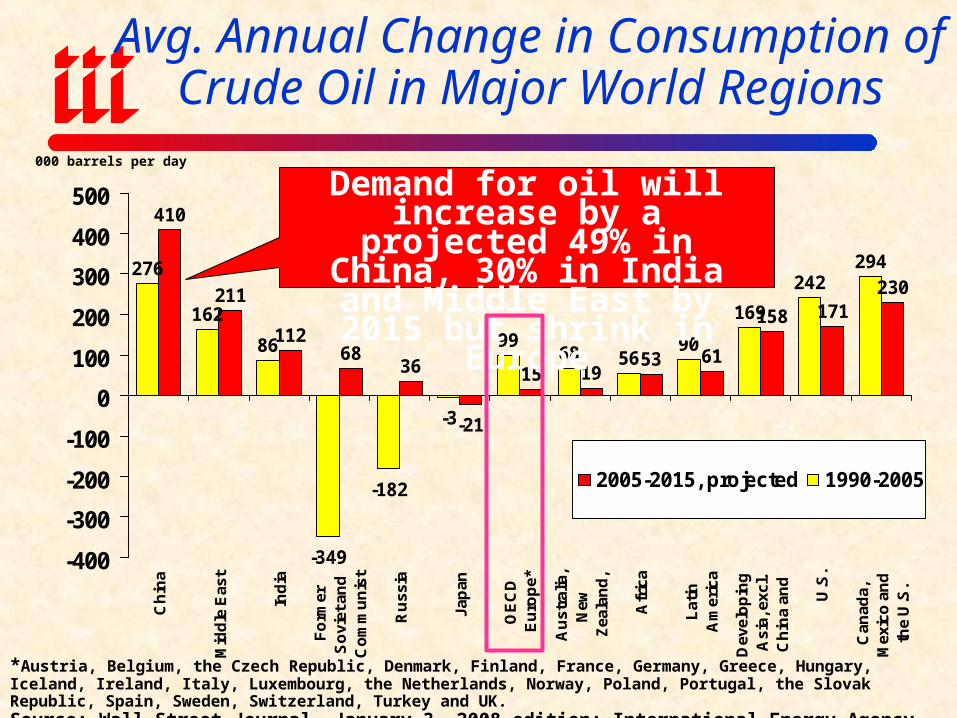
Avg. Annual Change in Consumption of Crude Oil in Major World Regions
171158
61531915
-21
3668
112
211
410
294242
169
905668
99
-3
-182
-349
86
162
276230
-400
-300
-200
-100
0
100
200
300
400
500
Can
ada,
Mex
ico
an
dth
e U
.S.
U.S
.
Dev
elo
pin
gA
sia,
exc
l.C
hin
a an
d
Lat
inA
mer
ica
Afr
ica
Au
stra
lia,
New
Zea
lan
d,
OE
CD
Eu
rop
e*
Jap
an
Ru
ssia
Fo
rmer
So
viet
an
dC
om
mu
nis
t
Ind
ia
Mid
dle
Eas
t
Ch
ina
2005-2015, projected 1990-2005
*Austria, Belgium, the Czech Republic, Denmark, Finland, France, Germany, Greece, Hungary, Iceland, Ireland, Italy, Luxembourg, the Netherlands, Norway, Poland, Portugal, the Slovak Republic, Spain, Sweden, Switzerland, Turkey and UK.Source: Wall Street Journal, January 3, 2008 edition; International Energy Agency
000 barrels per day
Demand for oil will increase by a projected 49% in China, 30%
in India and Middle East by 2015 but shrink in Europe
Lessons from Energy Boom of 2008

Oil/Energy is a Chief Source of Global Economic Instability
LESSONS OF 2008 ENERGY PRICE BUBBLESteeply rising oil/energy prices lead to severe economic
dislocation and hardship on a global scaleReduced economic growth globally (except energy
exporting countries)Fuels InflationMakes investment decisions in exploration more
uncertain Encourages collateral boom in other commoditiesDisastrous for transport sector (e.g., airlines)Food, energy costs are acute problems in poorest parts of
the world Increases the power and wealth of certain unstable
countries (e.g., Iran, Nigeria, Venezuela)Influence on biofuels/alternative energy policies
P/C INSURANCE FINANCIAL
PERFORMANCE
A Resilient Industry in Challenging Times

Profitability
Historically Volatile
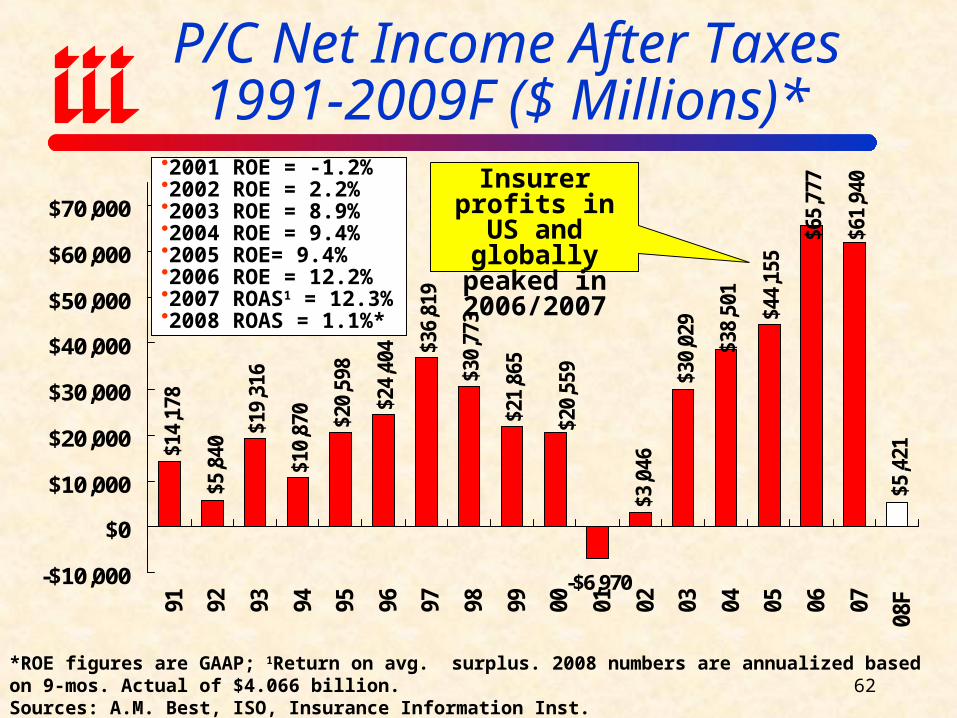
P/C Net Income After Taxes1991-2009F ($ Millions)*
$14,
178
$5,8
40
$19,
316
$10,
870
$20,
598
$24,
404 $3
6,81
9
$30,
773
$21,
865
$3,0
46
$30,
029
$61,
940
$5,4
21
-$6,970
$65,
777
$44,
155
$20,
559
$38,
501
-$10,000
$0
$10,000
$20,000
$30,000
$40,000
$50,000
$60,000
$70,000
91 92 93 94 95 96 97 98 99 00 01 02 03 04 05 06 07
08F
*ROE figures are GAAP; 1Return on avg. surplus. 2008 numbers are annualized based on 9-mos. Actual of $4.066 billion.Sources: A.M. Best, ISO, Insurance Information Inst.
2001 ROE = -1.2%2002 ROE = 2.2%2003 ROE = 8.9%2004 ROE = 9.4%2005 ROE= 9.4%2006 ROE = 12.2%2007 ROAS1 = 12.3%2008 ROAS = 1.1%*
Insurer profits in US and
globally peaked in 2006/2007
62
-5%
0%
5%
10%
15%
20%
25%
75 76 77 78 79 80 81 82 83 84 85 86 87 88 89 90 91 92 93 94 95 96 97 98 99 00 01 02 03 04 05 06 0608
F09
F10
F
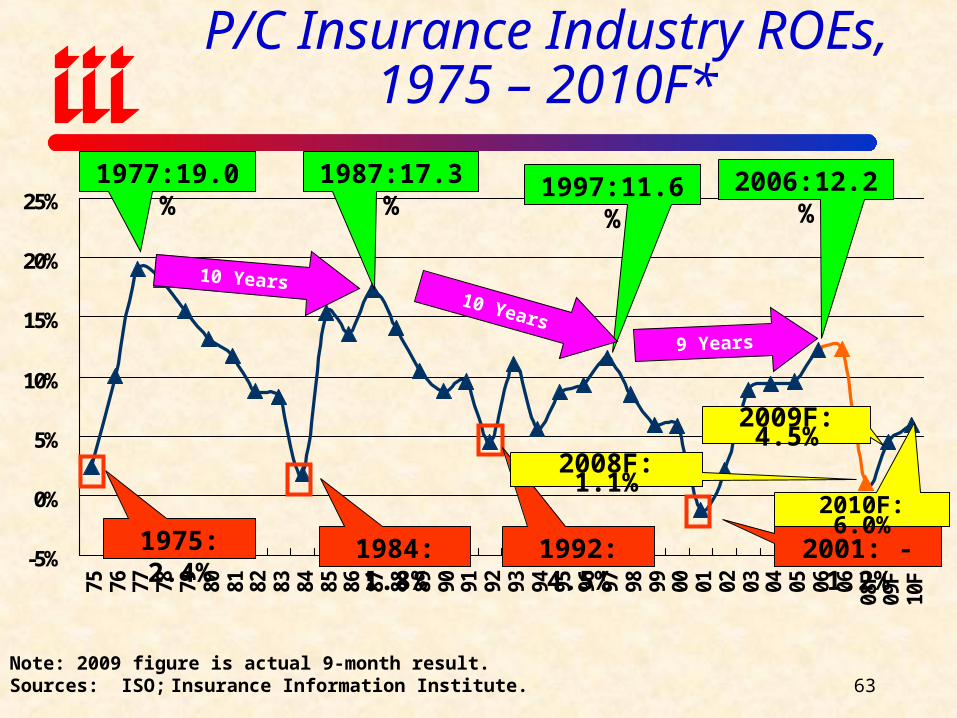
1975: 2.4%
1977:19.0% 1987:17.3% 1997:11.6% 2006:12.2%
1984: 1.8% 1992: 4.5% 2001: -1.2%
10 Years10 Years
9 Years
Note: 2009 figure is actual 9-month result.Sources: ISO; Insurance Information Institute.
2008F: 1.1%
P/C Insurance Industry ROEs,1975 – 2010F*
2010F: 6.0%
2009F: 4.5%
63
-4%
-2%
0%
2%
4%
6%
8%
10%
12%
14%
16%
18%
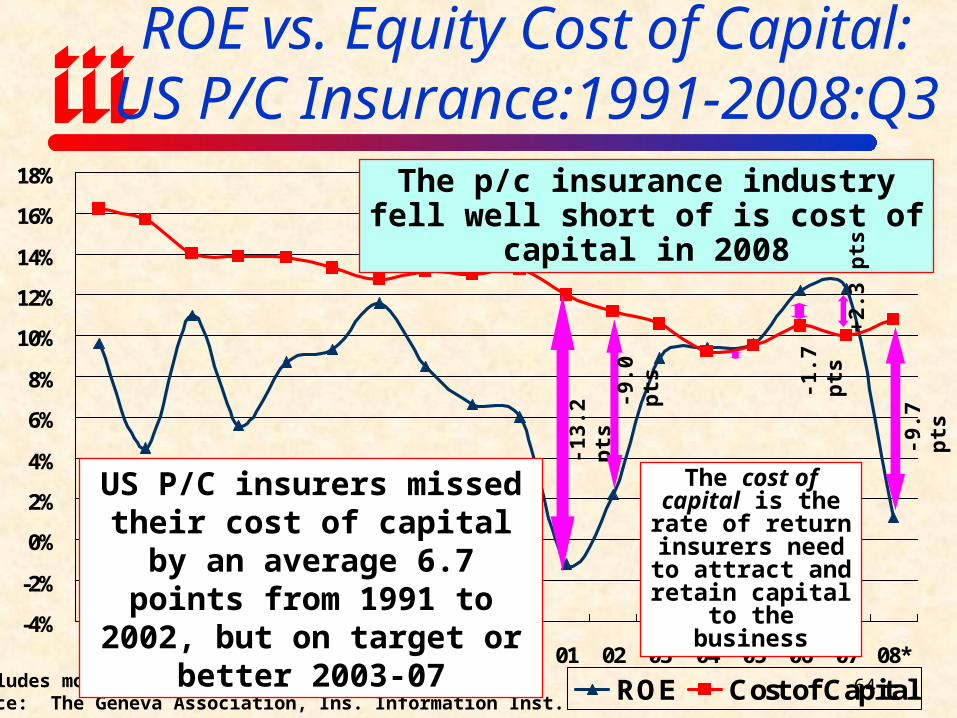
91 92 93 94 95 96 97 98 99 00 01 02 03 04 05 06 07 08*
ROE Cost of Capital
ROE vs. Equity Cost of Capital:US P/C Insurance:1991-2008:Q3
*Excludes mortgage and financial guarantee insurers.Source: The Geneva Association, Ins. Information Inst.
The p/c insurance industry fell well short of is cost of capital in 2008
-13.
2 p
ts
US P/C insurers missed their cost of capital by an average 6.7 points from 1991 to 2002, but on
target or better 2003-07
-1.7
pts
+2.
3 p
ts
-9.0
pts
The cost of capital is the rate of return
insurers need to attract and retain
capital to the business
-9.7
pts
64
Presidential Politics & P/C Insurance
How is Profitability Affected by the President’s Political Party?
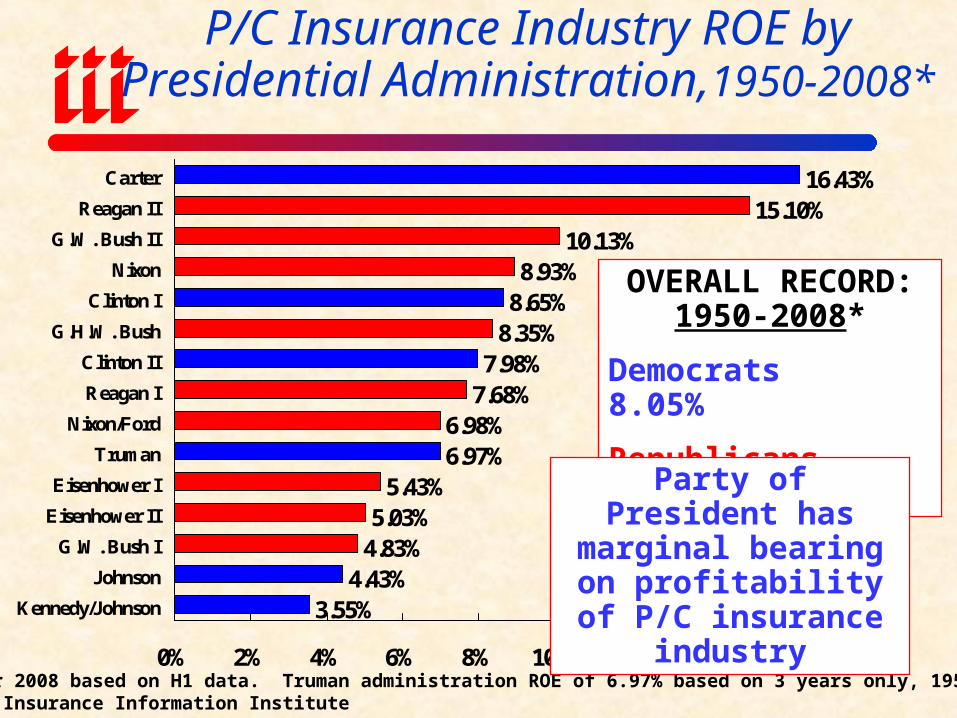
15.10%10.13%
8.93%8.65%
8.35%7.98%
7.68%6.98%6.97%
5.43%5.03%
4.83%4.43%
3.55%
16.43%
0% 2% 4% 6% 8% 10% 12% 14% 16% 18%
Carter
Reagan II
G.W. Bush II
Nixon
Clinton I
G.H.W. Bush
Clinton II
Reagan I
Nixon/Ford
Truman
Eisenhower I
Eisenhower II
G.W. Bush I
Johnson
Kennedy/Johnson
*ROE for 2008 based on H1 data. Truman administration ROE of 6.97% based on 3 years only, 1950-52.Source: Insurance Information Institute
OVERALL RECORD: 1950-2008*
Democrats 8.05%
Republicans 8.02%
Party of President has marginal bearing on profitability of P/C insurance industry
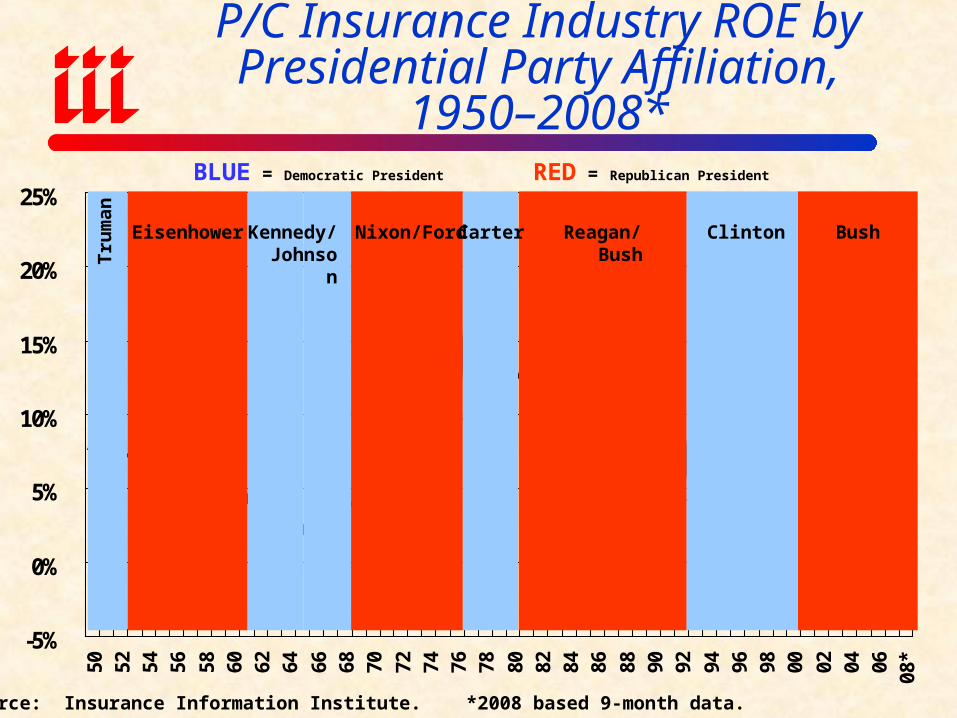
P/C Insurance Industry ROE byPresidential Administration,1950-2008*
-5%
0%
5%
10%
15%
20%
25%
50 52 54 56 58 60 62 64 66 68 70 72 74 76 78 80 82 84 86 88 90 92 94 96 98 00 02 04 06 08*
BLUE = Democratic President RED = Republican President
Source: Insurance Information Institute. *2008 based 9-month data.
Tru
man
Nixon/FordKennedy/ Johnson
Eisenhower Carter Reagan/Bush Clinton Bush
P/C Insurance Industry ROE by Presidential Party Affiliation,
1950–2008*
P/C Premium Growth
Primarily Driven by the Industry’s Underwriting Cycle, Not the Economy
-2%
0%
2%
4%
6%
8%
10%
12%
14%
16%
18%
20%
22%
24%
1971
1972
1973
1974
1975
1976
1977
1978
1979
1980
1981
1982
1983
1984
1985
1986
1987
1988
1989
1990
1991
1992
1993
1994
1995
1996
1997
1998
1999
2000
2001
2002
2003
2004
2005
2006
2007
2008
F20
09F
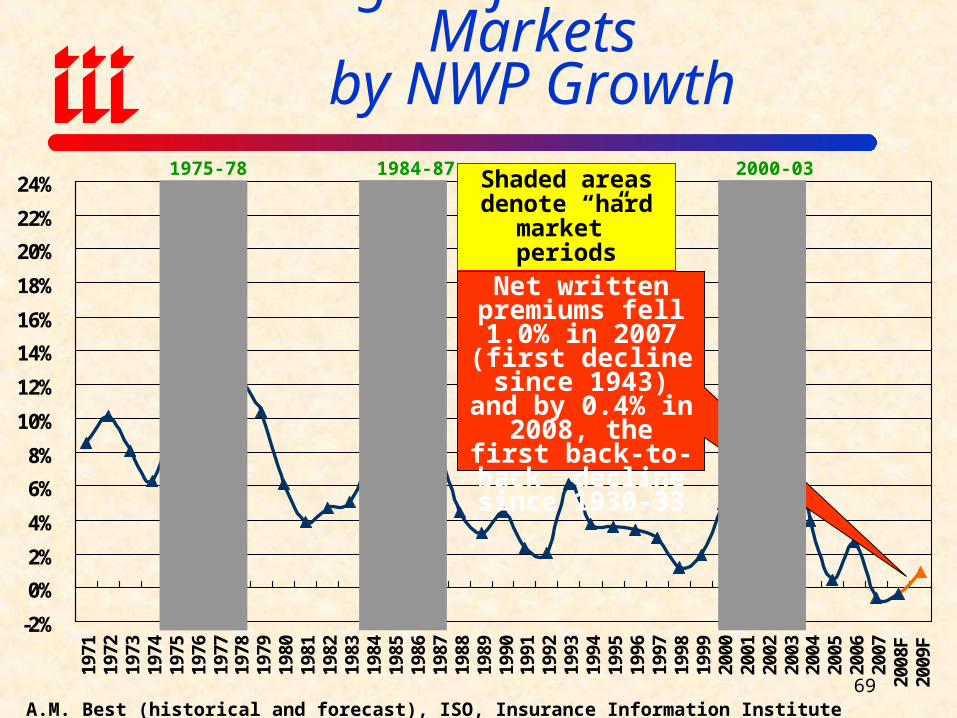
Sources: A.M. Best (historical and forecast), ISO, Insurance Information Institute
Strength of Recent Hard Marketsby NWP Growth
1975-78 1984-87 2000-03Shaded areas denote “hard
market” periods
Net written premiums fell 1.0%
in 2007 (first decline since 1943)
and by 0.4% in 2008, the first back-
to-back decline since 1930-33
69
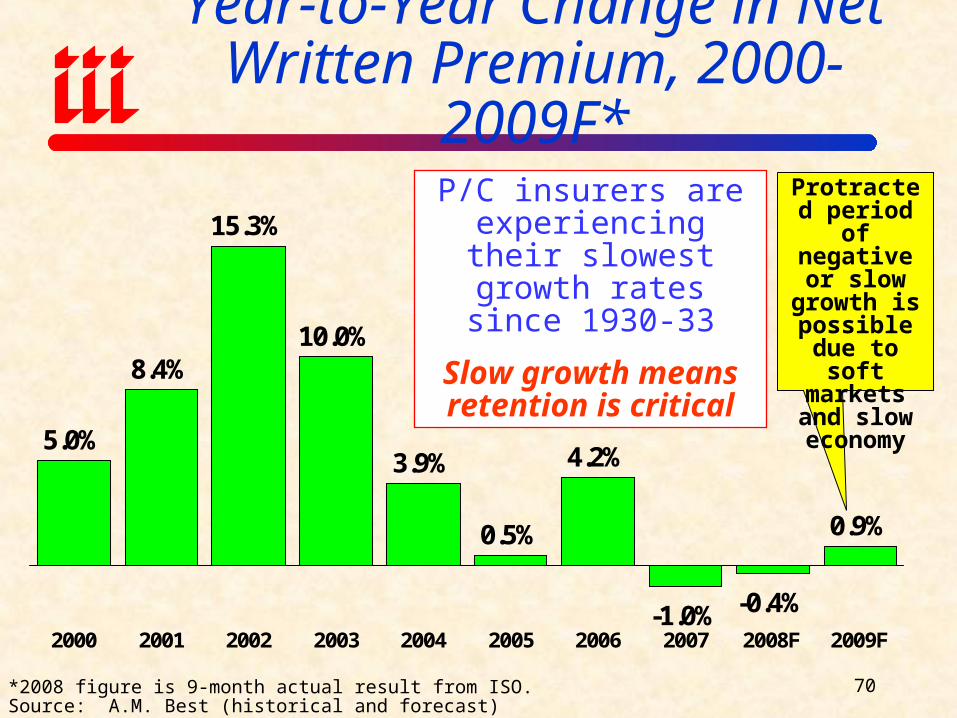
Year-to-Year Change in Net Written Premium, 2000-2009F*
*2008 figure is 9-month actual result from ISO.Source: A.M. Best (historical and forecast)
5.0%
8.4%
15.3%
10.0%
3.9%
0.5%
4.2%
-1.0% -0.4%
0.9%
2000 2001 2002 2003 2004 2005 2006 2007 2008F 2009F
P/C insurers are experiencing their
slowest growth rates since 1930-33
Slow growth means retention is critical
Protracted period of
negative or slow growth is possible due to soft
markets and slow
economy
70
Capital/Policyholder
Surplus
Shrinkage, but Capital is Within Historic Norms
$0
$50
$100
$150
$200
$250
$300
$350
$400
$450
$500
$550
75 76 77 78 79 80 81 82 83 84 85 86 87 88 89 90 91 92 93 94 95 96 97 98 99 00 01 02 03 04 05 06 07 08
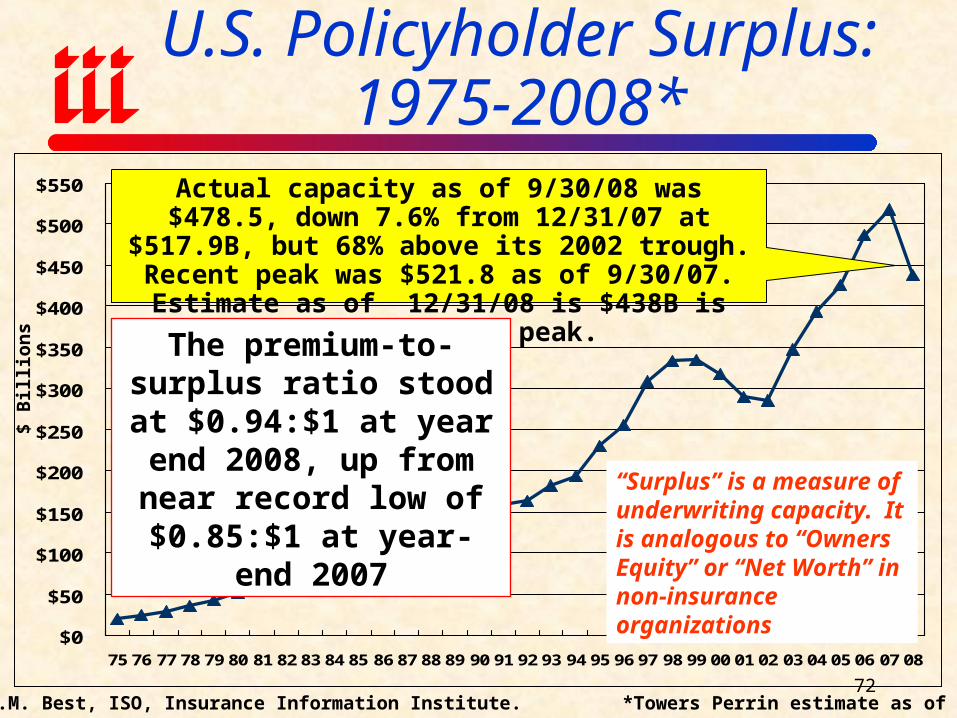
U.S. Policyholder Surplus: 1975-2008*
Source: A.M. Best, ISO, Insurance Information Institute. *Towers Perrin estimate as of 12/31/08
$ B
illi
ons
“Surplus” is a measure of underwriting capacity. It is analogous to “Owners Equity” or “Net Worth” in non-insurance organizations
Actual capacity as of 9/30/08 was $478.5, down 7.6% from 12/31/07 at $517.9B, but 68% above its 2002
trough. Recent peak was $521.8 as of 9/30/07. Estimate as of 12/31/08 is $438B is 16% below 2007
peak.
The premium-to-surplus ratio stood at $0.94:$1 at year end 2008, up from
near record low of $0.85:$1 at year-end 2007
72
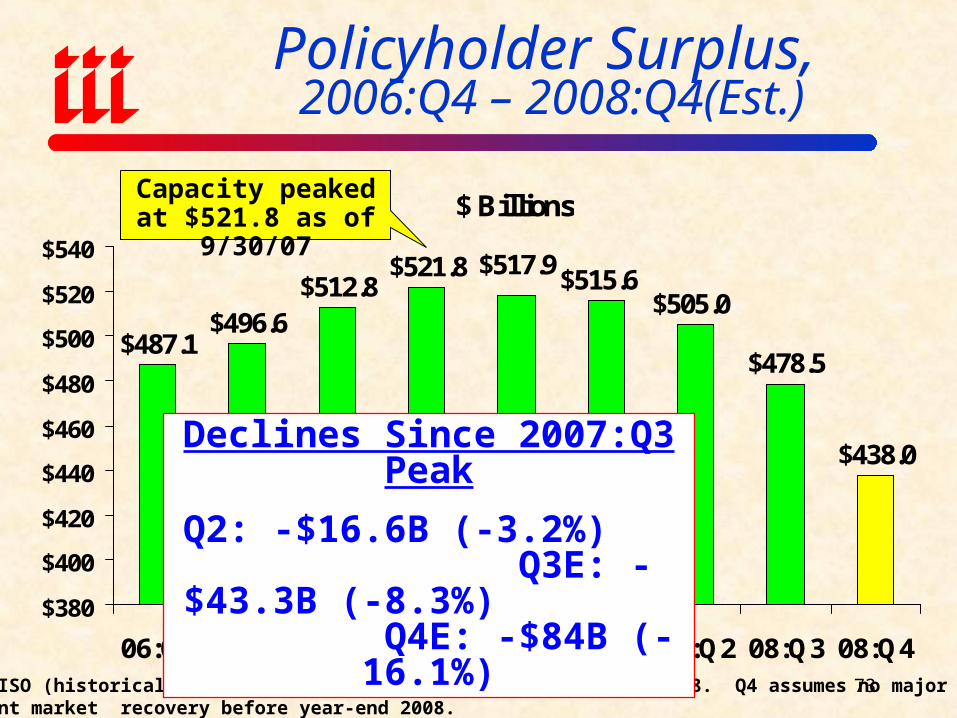
Policyholder Surplus, 2006:Q4 – 2008:Q4(Est.)
$ Billions
$487.1$496.6
$512.8$521.8
$478.5
$438.0
$505.0$515.6
$517.9
$380
$400
$420
$440
$460
$480
$500
$520
$540
06:Q4 07:Q1 07:Q2 07:Q3 07:Q4 08:Q1 08:Q2 08:Q3 08:Q4
Source: ISO (historical); Towers Perrin (Oct. 21) estimates for Q4 2008. Q4 assumes no major Investment market recovery before year-end 2008.
Declines Since 2007:Q3 Peak
Q2: -$16.6B (-3.2%) Q3E: -$43.3B (-8.3%)
Q4E: -$84B (-16.1%)
Capacity peaked at $521.8 as of 9/30/07
73
0.8
1.0
1.2
1.4
1.6
1.8
2.0
85 86 87 88 89 90 91 92 93 94 95 96 97 98 99 00 01 02 03 04 05 06 0708:Q3
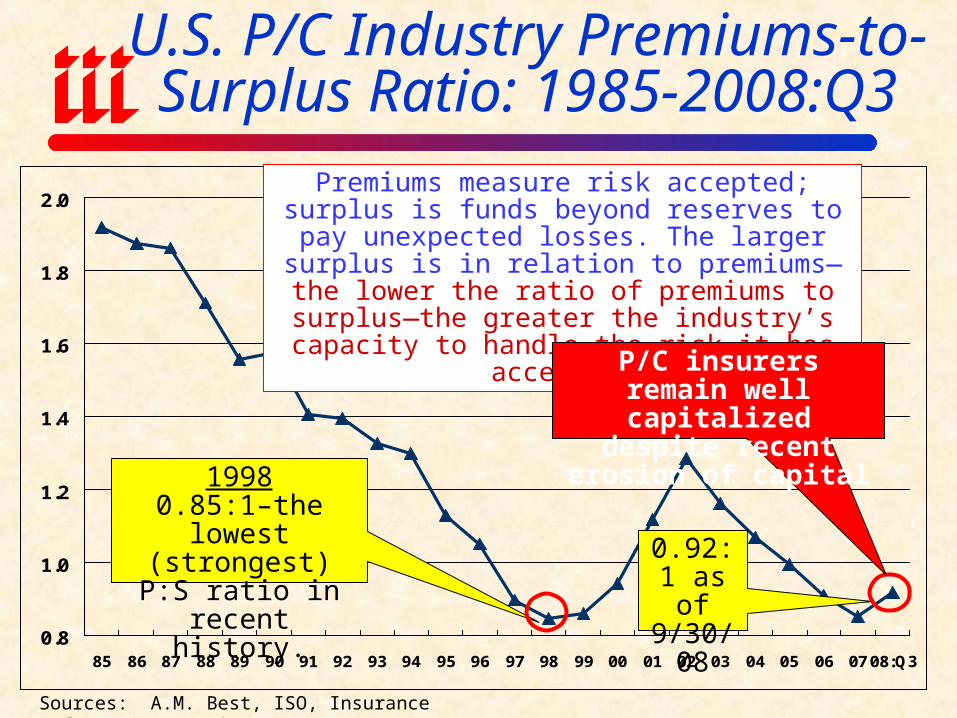
U.S. P/C Industry Premiums-to-Surplus Ratio: 1985-2008:Q3
Sources: A.M. Best, ISO, Insurance Information Institute.
19980.85:1–the lowest
(strongest) P:S ratio in recent history.
Premiums measure risk accepted; surplus is funds beyond reserves to pay unexpected losses. The larger
surplus is in relation to premiums—the lower the ratio of premiums to surplus—the greater the
industry’s capacity to handle the risk it has accepted.
0.92:1 as of
9/30/08
P/C insurers remain well capitalized despite recent
erosion of capital
-10%
-5%
0%
5%
10%
15%
20%
25%
30%
19
78
19
79
19
80
19
81
19
82
19
83
19
84
19
85
19
86
19
87
19
88
19
89
19
90
19
91
19
92
19
93
19
94
19
95
19
96
19
97
19
98
19
99
20
00
20
01
20
02
20
03
20
04
20
05
20
06
20
07
20
08
*
NWP % changeSurplus % change
*Actual 9-month 2008 result.Sources: A.M. Best, ISO, Insurance Information Institute
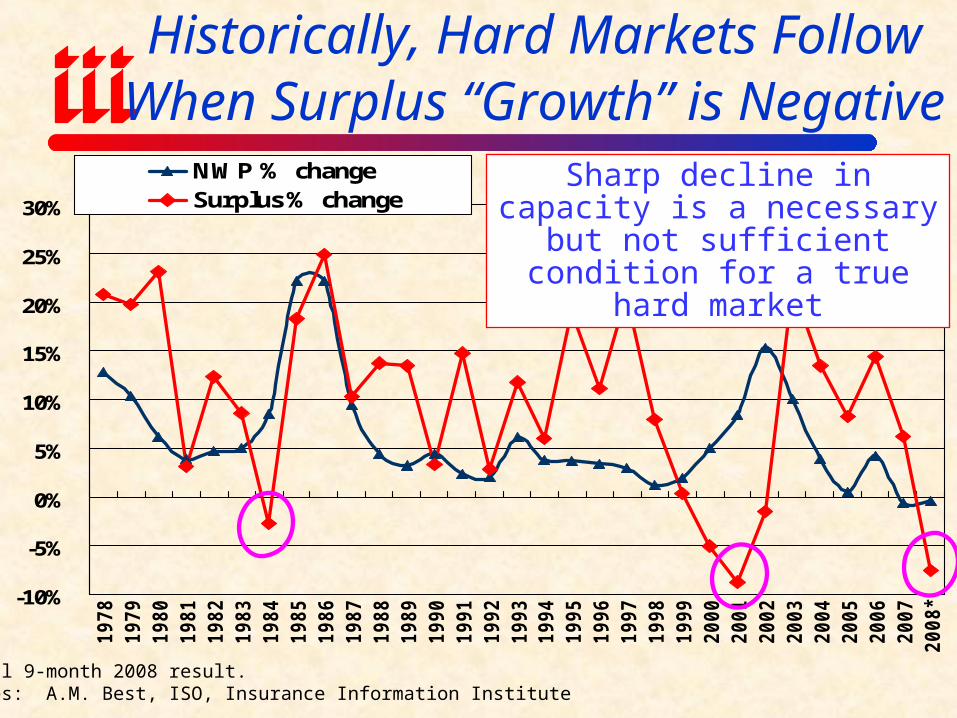
Historically, Hard Markets Follow When Surplus “Growth” is Negative
Sharp decline in capacity is a necessary but not sufficient
condition for a true hard market

Investment Performance
Investments are the Principle Source of Declining
Profitability
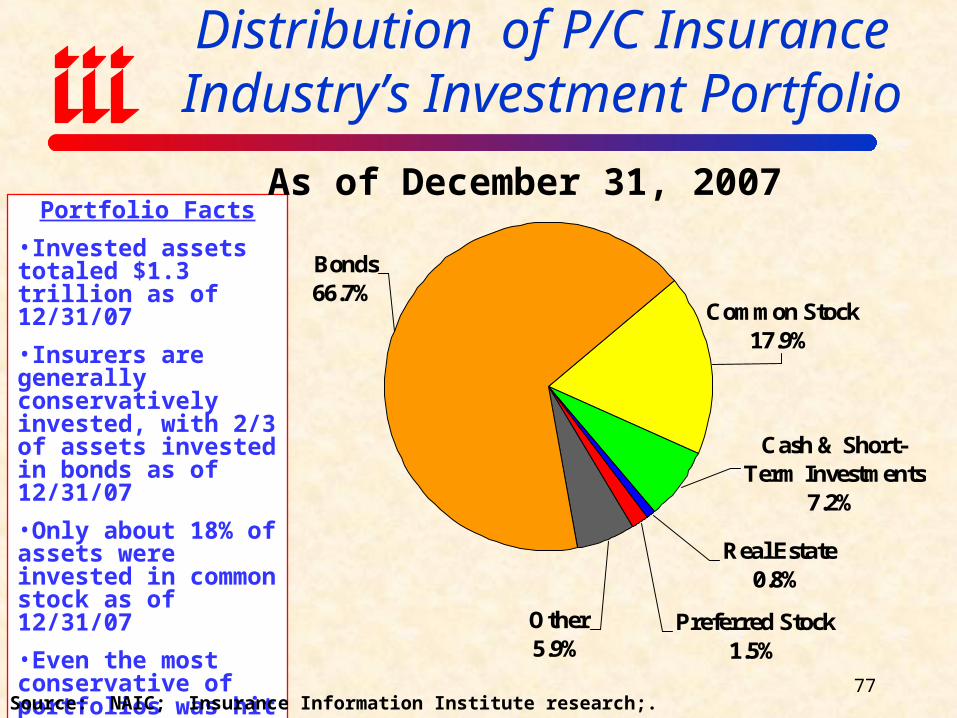
Distribution of P/C Insurance Industry’s Investment Portfolio
Cash & Short-Term Investments
7.2%
Common Stock17.9%
Bonds66.7%
Preferred Stock1.5%
Real Estate0.8%
Other5.9%
Portfolio Facts
•Invested assets totaled $1.3 trillion as of 12/31/07
•Insurers are generally conservatively invested, with 2/3 of assets invested in bonds as of 12/31/07
•Only about 18% of assets were invested in common stock as of 12/31/07
•Even the most conservative of portfolios was hit hard in 2008
Source: NAIC; Insurance Information Institute research;.
As of December 31, 2007
77
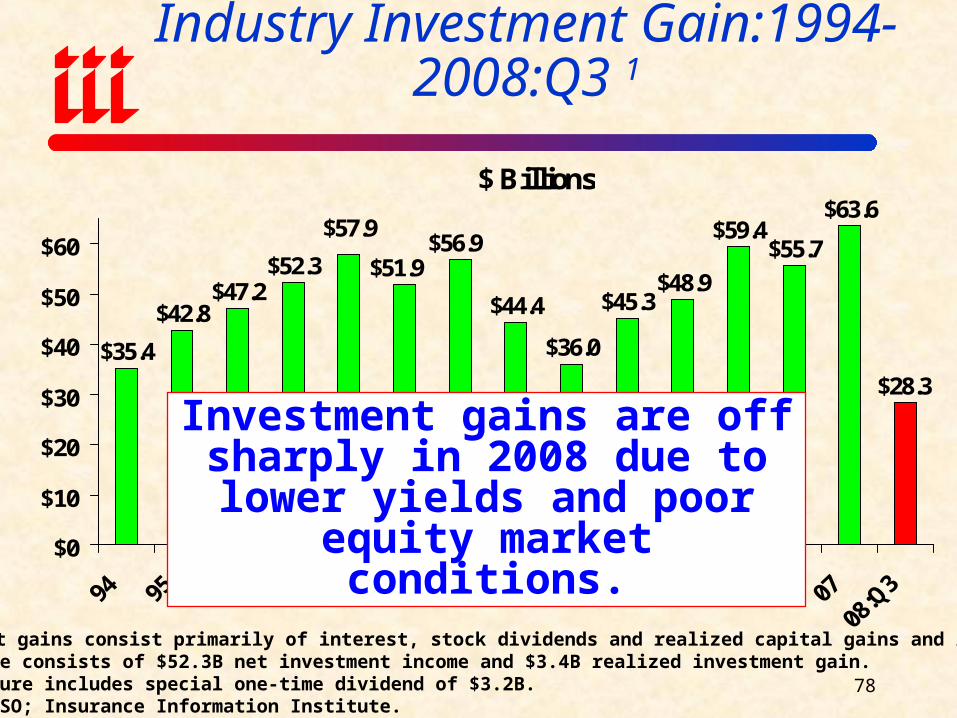
Property/Casualty Insurance Industry Investment Gain:1994- 2008:Q3 1
$ Billions
$35.4
$42.8$47.2
$52.3
$44.4
$36.0
$45.3$48.9
$59.4$55.7
$63.6
$28.3
$56.9$51.9
$57.9
$0
$10
$20
$30
$40
$50
$60
1Investment gains consist primarily of interest, stock dividends and realized capital gains and losses. 2006 figure consists of $52.3B net investment income and $3.4B realized investment gain. *2005 figure includes special one-time dividend of $3.2B.Sources: ISO; Insurance Information Institute.
Investment gains are off sharply in 2008 due to lower yields and poor equity market conditions.
78
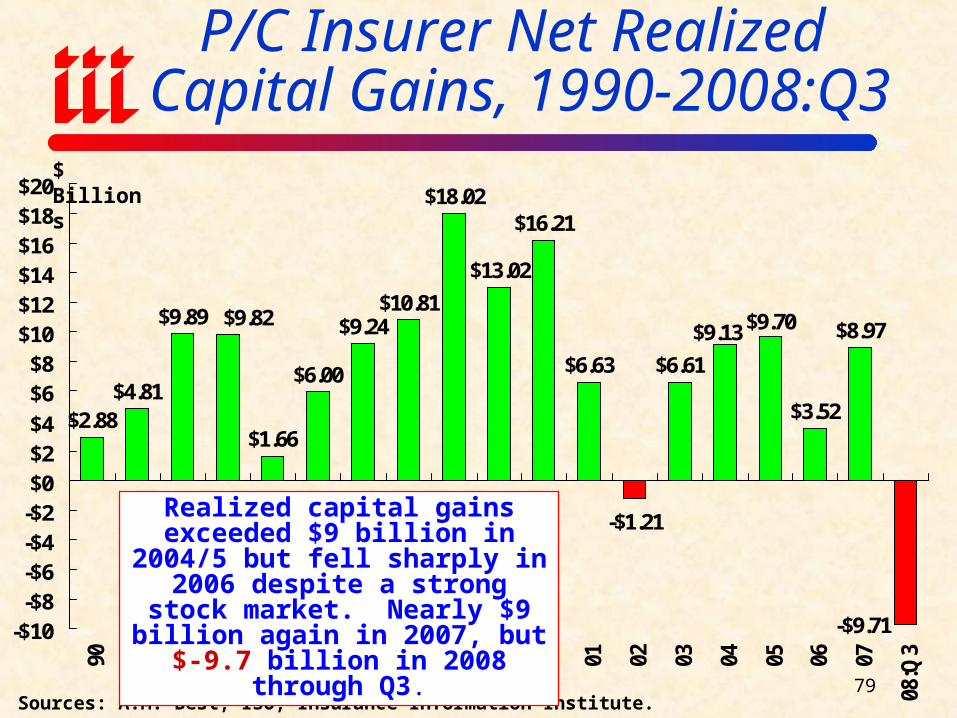
P/C Insurer Net Realized Capital Gains, 1990-2008:Q3
$2.88$4.81
$9.89
$1.66
$6.00
$9.24$10.81
$13.02
$16.21
$6.63
-$1.21
$6.61
$8.97
-$9.71
$18.02
$3.52
$9.70$9.13$9.82
-$10-$8-$6-$4-$2$0$2$4
$6$8
$10$12$14$16$18$20
90 91 92 93 94 95 96 97 98 99 00 01 02 03 04 05 06 07
08:Q
3
Sources: A.M. Best, ISO, Insurance Information Institute.
Realized capital gains exceeded $9 billion in 2004/5 but fell sharply in
2006 despite a strong stock market. Nearly $9 billion again in 2007, but
$-9.7 billion in 2008 through Q3.
$ Billions
79
-45%
-35%
-25%
-15%
-5%
5%
15%
25%
35%
19
70
19
71
19
72
19
73
19
74
19
75
19
76
19
77
19
78
19
79
19
80
19
81
19
82
19
83
19
84
19
85
19
86
19
87
19
88
19
89
19
90
19
91
19
92
19
93
19
94
19
95
19
96
19
97
19
98
19
99
20
00
20
01
20
02
20
03
20
04
20
05
20
06
20
07
20
08
20
09
Source: Ibbotson Associates, Insurance Information Institute. *Through March 18, 2009.
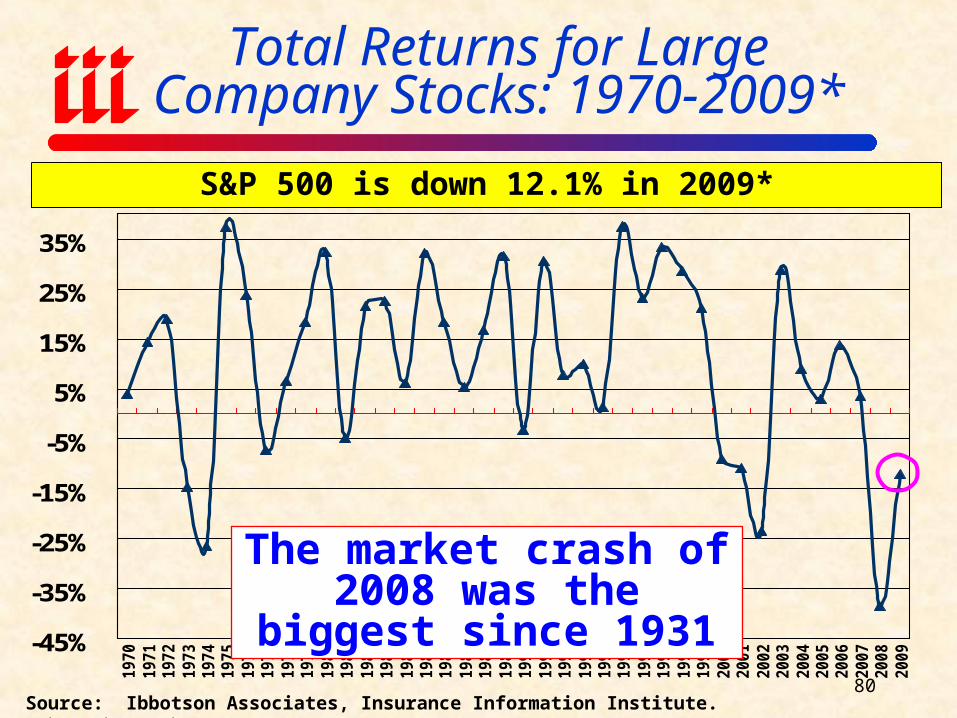
Total Returns for Large Company Stocks: 1970-2009*
S&P 500 is down 12.1% in 2009*
The market crash of 2008 was the biggest since 1931
80
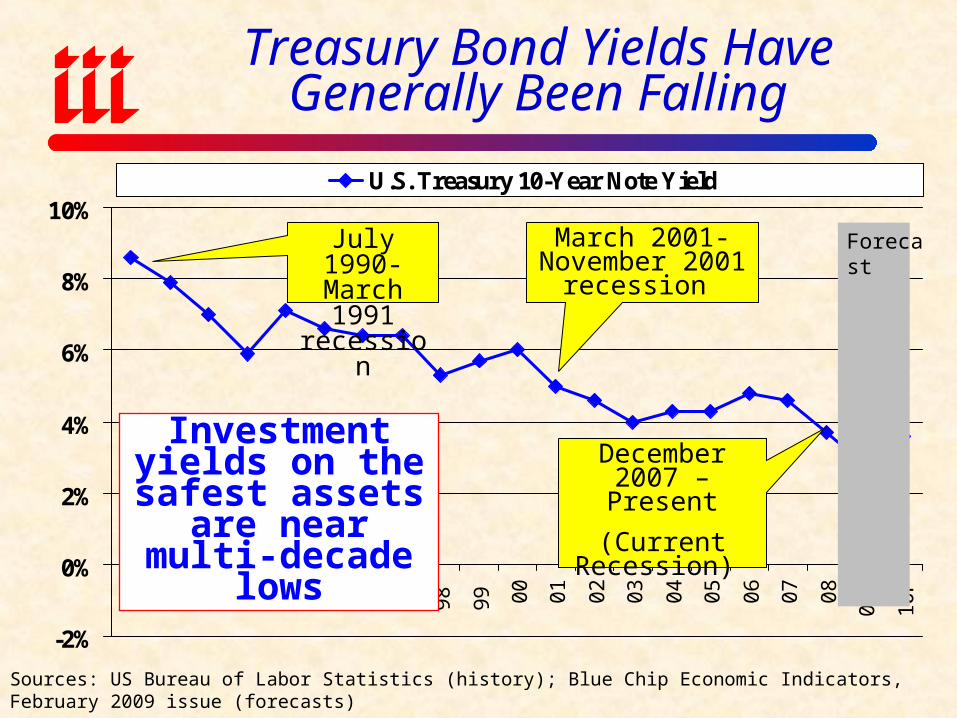
Treasury Bond Yields HaveGenerally Been Falling
-2%
0%
2%
4%
6%
8%
10%
90
91
92
93
94
95
96
97
98
99 00
01
02
03
04
05
06
07
08
09
F
10
F
U.S. Treasury 10-Year Note Yield
Sources: US Bureau of Labor Statistics (history); Blue Chip Economic Indicators, February 2009 issue (forecasts)
ForecastJuly 1990-March 1991
recession
March 2001-November 2001
recession
December 2007 – Present
(Current Recession)
Investment yields on the safest assets
are near multi-decade lows

82
0.22% 0.30% 0.46% 0.62%0.98%
1.37%
1.87%2.30%
2.87%
3.83%3.59%
4.82% 4.96% 5.04% 4.96% 4.82% 4.82% 4.88% 4.93% 5.00% 5.19% 5.11%
0%
1%
2%
3%
4%
5%
6%
1M 3M 6M 1Y 2Y 3Y 5Y 10Y 20Y 30Y
Current Yield Curve*Pre-Crisis (July 2007)
Treasury Yield Curves: Pre-Crisis vs. Current*
*February 2009.Sources: Federal Reserve; Insurance Information Institute.
Stock dividend cuts will further pressure investment income
Treasury Yield Curve is at its most depressed level in at least 45 years. Investment income will fall
significantly as a result.
Underwriting Trends
Financial Crisis Does Not Directly Impact Underwriting
Performance: Cycle, Catastrophes Were 2008’s Drivers
90
95
100
105
110
115
120
70
71
72
73
74
75
76
77
78
79
80
81
82
83
84
85
86
87
88
89
90
91
92
93
94
95
96
97
98
99
00
01
02
03
04
05
06
07
08
F
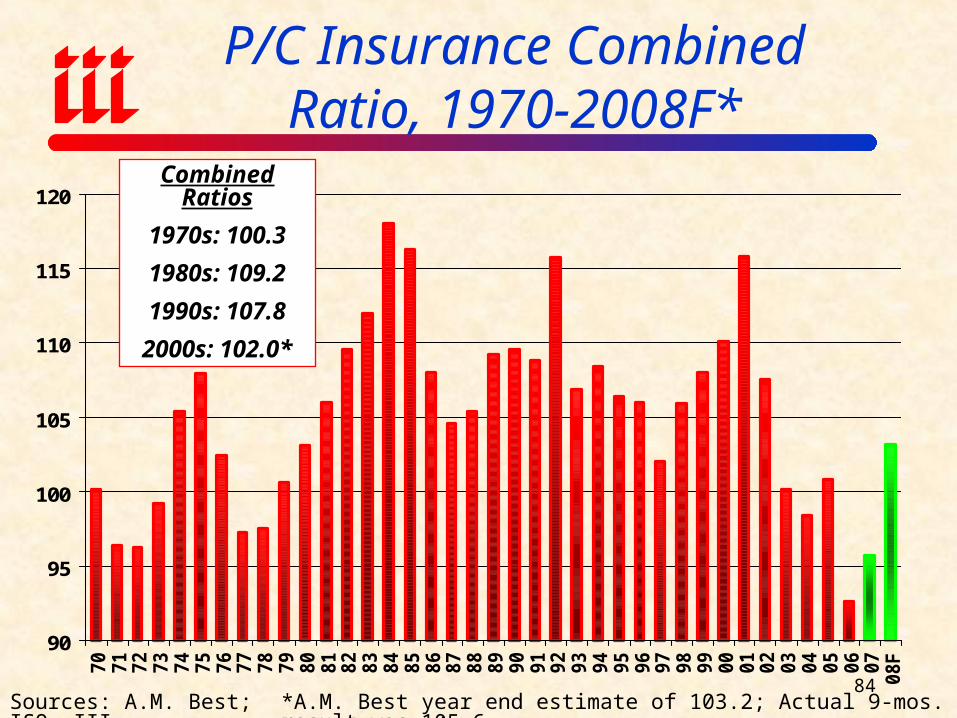
Combined Ratios
1970s: 100.3
1980s: 109.2
1990s: 107.8
2000s: 102.0*
Sources: A.M. Best; ISO, III *A.M. Best year end estimate of 103.2; Actual 9-mos. result was 105.6.
P/C Insurance Combined Ratio, 1970-2008F*
84
115.8
107.5
100.198.4
100.8
92.6
101
103.3101.2
95.7
90
100
110
120
2001 2002 2003 2004 2005 2006 2007 2008 2008* 2009F
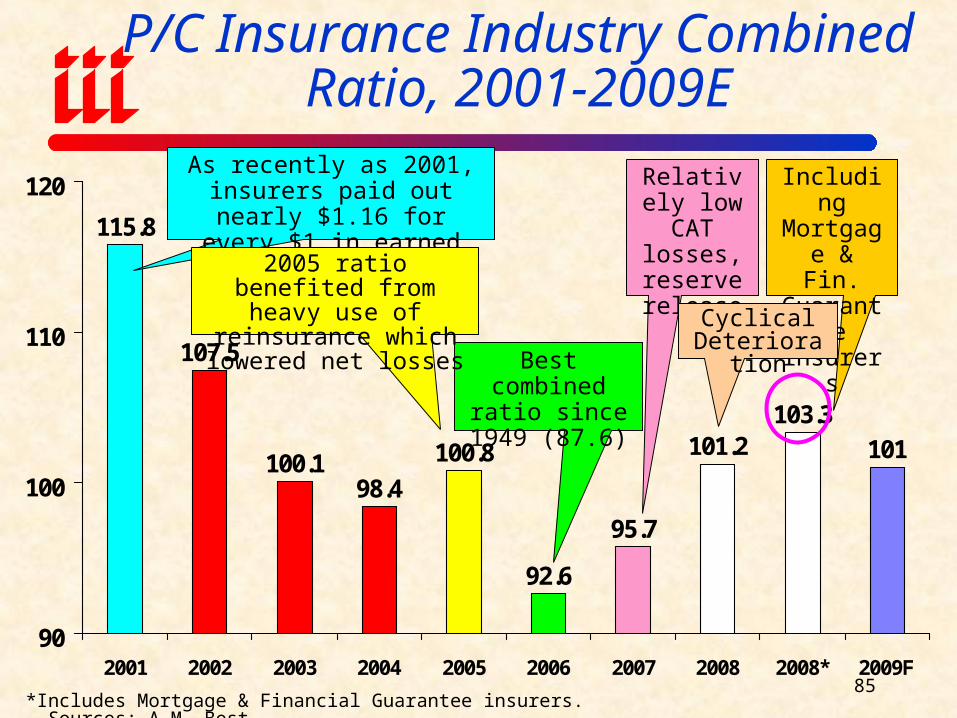
P/C Insurance Industry Combined Ratio, 2001-2009E
*Includes Mortgage & Financial Guarantee insurers. Sources: A.M. Best.
Best combined ratio since 1949
(87.6)
As recently as 2001, insurers paid out nearly $1.16 for every
$1 in earned premiums
Relatively low CAT
losses, reserve releases
Including Mortgage
& Fin. Guarantee insurers
Cyclical Deterioration
85
2005 ratio benefited from heavy use of reinsurance which lowered net losses
-55-50-45-40-35-30-25-20-15-10-505
101520253035
75
76
77
78
79
80
81
82
83
84
85
86
87
88
89
90
91
92
93
94
95
96
97
98
99
00
01
02
03
04
05
06
07
08
Source: A.M. Best, ISO; Insurance Information Institute * Includes mortgage & finl. guarantee insurers
$ B
illi
ons
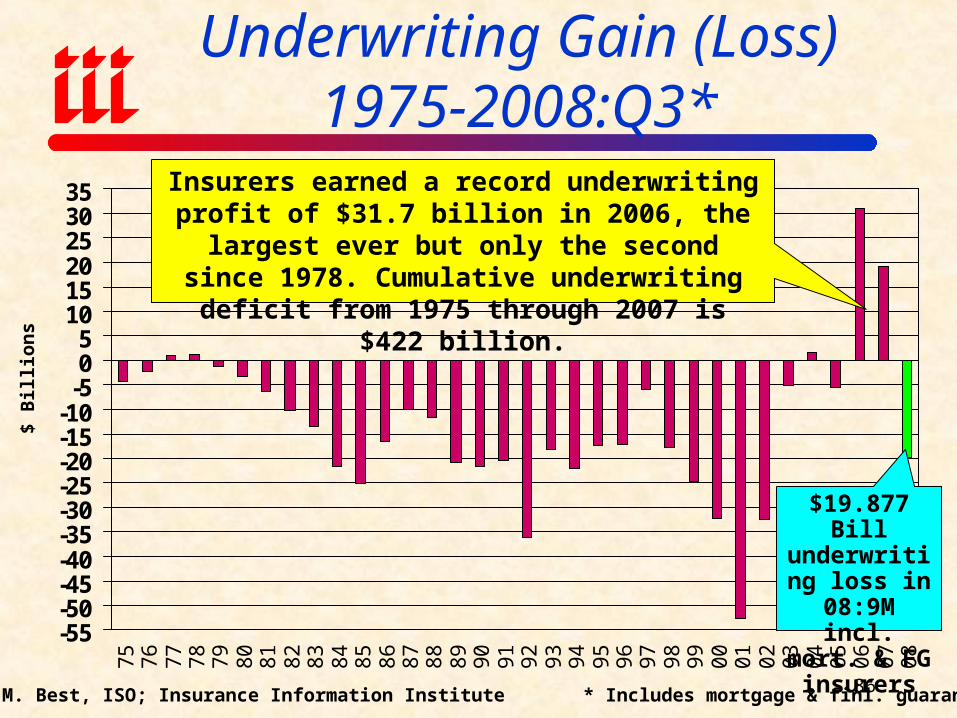
Insurers earned a record underwriting profit of $31.7 billion in 2006, the largest ever but only the
second since 1978. Cumulative underwriting deficit from 1975 through 2007 is $422 billion.
Underwriting Gain (Loss)1975-2008:Q3*
$19.877 Bill underwriting loss in 08:9M incl. mort. & FG insurers
86

Number of Years With Underwriting Profits by Decade, 1920s –2000s
67
10
8
45
0 0
3
0
2
4
6
8
10
1920s 1930s 1940s 1950s 1960s 1970s 1980s 1990s 2000s*
Note: Data for 1920 – 1934 based on stock companies only.Sources: Insurance Information Institute research from A.M. Best Data. *2000 through 2008.
Number of Years with Underwriting ProfitsUnderwriting profits were common before the 1980s (40 of the 60 years
before 1980 had combined ratios below 100)—but then they vanished. Not a single underwriting profit was recorded in the 25 years from 1979
through 2003.
87

Commercial Lines
110.
3
110.
2
107.
6
103.
9
109.
7
112.
3
111.
1
122.
3
110.
2
102.
5
105.
4
91.1
95.1
106.
5
105.
1
102.
0
112.
5
85
90
95
100
105
110
115
120
125
93 94 95 96 97 98 99 00 01 02 03 04 05 06 07 08E 09F
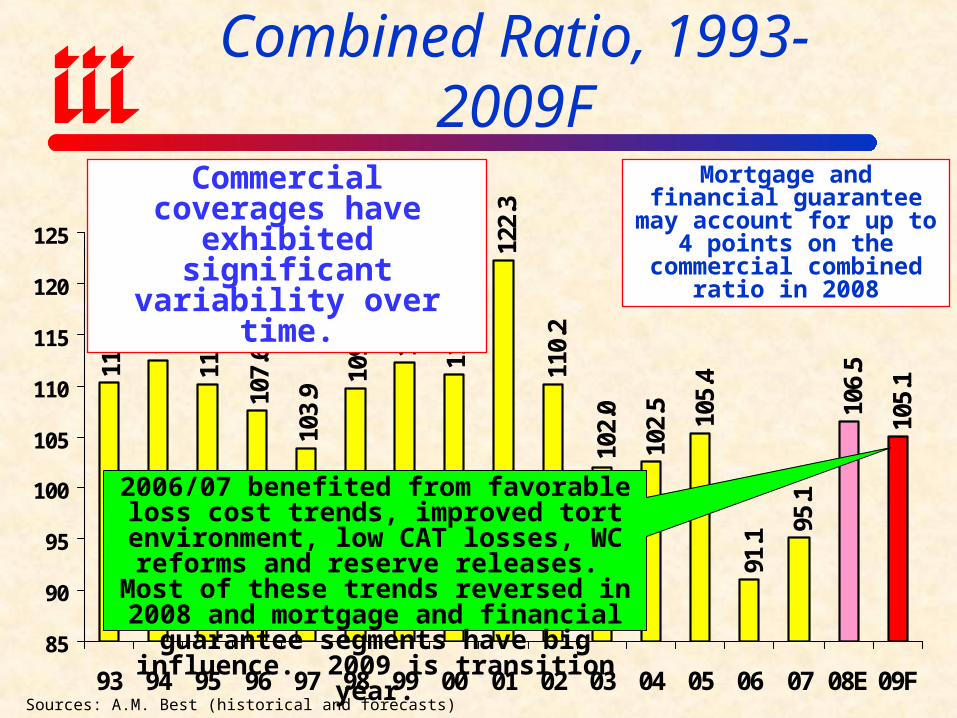
2006/07 benefited from favorable loss cost trends, improved tort environment, low CAT
losses, WC reforms and reserve releases. Most of these trends reversed in 2008 and
mortgage and financial guarantee segments have big influence. 2009 is transition year.
Commercial coverages have exhibited significant
variability over time.
Commercial Lines Combined Ratio, 1993-2009F
Mortgage and financial guarantee may account for up to 4 points on the commercial
combined ratio in 2008
Sources: A.M. Best (historical and forecasts)
Average Commercial Rate Change,All Lines, (1Q:2004 – 4Q:2008)
-3.2
%
-5.9
%
-7.0
%
-9.4
%
-9.7
% -8.2
%
-4.6
% -2.7
%
-3.0
%
-5.3
%
-9.6
%
-11.
3%
-11.
8%
-13.
3% -12.
0%
-13.
5%
-12.
9% -11.
0%
-6.0
%
-16%
-14%
-12%
-10%
-8%
-6%
-4%
-2%
0%
1Q04
2Q04
3Q04
4Q04
1Q05
2Q05
3Q05
4Q05
1Q06
2Q06
3Q06
4Q06
1Q07
2Q07
3Q07
4Q07
1Q08
2Q08
3Q08
4Q08
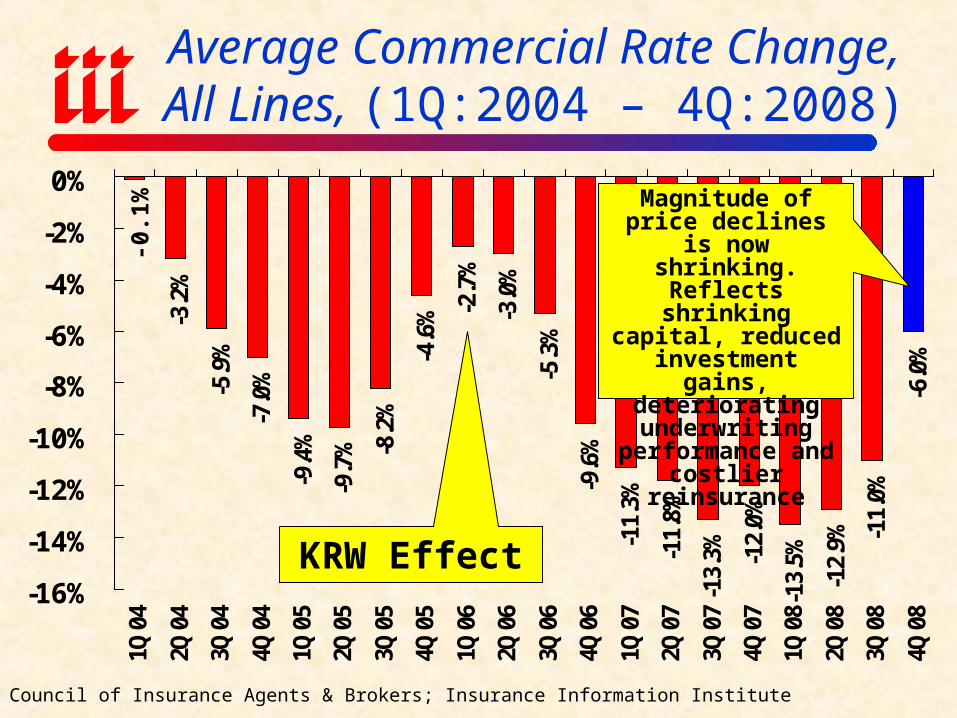
Source: Council of Insurance Agents & Brokers; Insurance Information Institute
KRW Effect
-0.1
% Magnitude of price declines is now
shrinking. Reflects shrinking capital,
reduced investment gains, deteriorating
underwriting performance and
costlier reinsurance
Catastrophe Losses
The Energy Sector is Vulnerable to a Increasing
Natural Catastrophe Activity
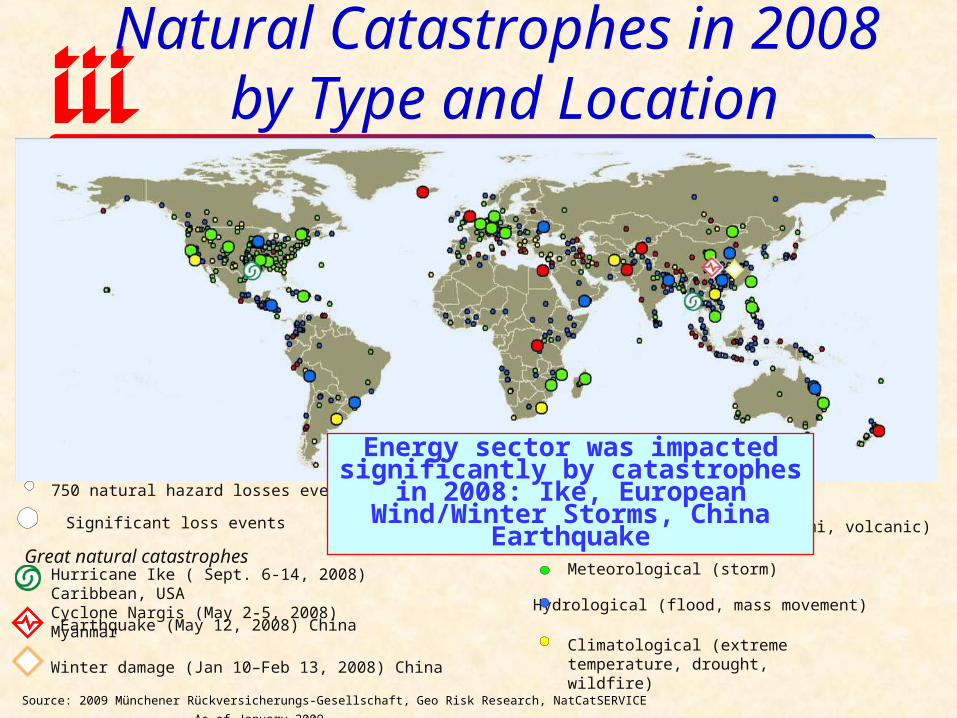
Natural Catastrophes in 2008 by Type and Location
Geophysical (earthquake, tsunami, volcanic)
Meteorological (storm)
Hydrological (flood, mass movement)
Climatological (extreme temperature, drought, wildfire)
Significant loss events
750 natural hazard losses events
Great natural catastrophesHurricane Ike ( Sept. 6-14, 2008) Caribbean, USACyclone Nargis (May 2-5, 2008) Myanmar
Earthquake (May 12, 2008) China
Winter damage (Jan 10–Feb 13, 2008) China
Source: 2009 Münchener Rückversicherungs-Gesellschaft, Geo Risk Research, NatCatSERVICE As of January 2009
Energy sector was impacted significantly by catastrophes in 2008: Ike, European
Wind/Winter Storms, China Earthquake
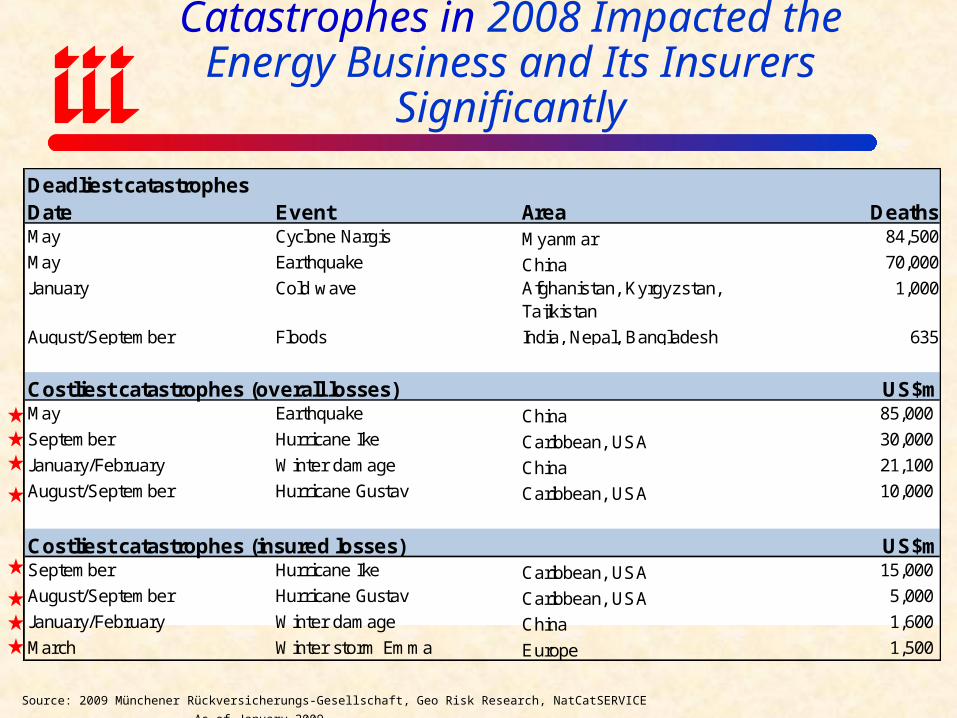
Deadliest catastrophesDate Event Area DeathsMay Cyclone Nargis Myanmar 84,500
May Earthquake China 70,000
January Cold wave Afghanistan, Kyrgyzstan, Tajikistan
1,000
August/September Floods India, Nepal, Bangladesh 635
Costliest catastrophes (overall losses) US$mMay Earthquake China 85,000
September Hurricane Ike Caribbean, USA 30,000
January/February Winter damage China 21,100
August/September Hurricane Gustav Caribbean, USA 10,000
Costliest catastrophes (insured losses) US$mSeptember Hurricane Ike Caribbean, USA 15,000
August/September Hurricane Gustav Caribbean, USA 5,000
January/February Winter damage China 1,600
March Winter storm Emma Europe 1,500
Some of the Costliest Natural Catastrophes in 2008 Impacted the Energy Business and
Its Insurers Significantly
Source: 2009 Münchener Rückversicherungs-Gesellschaft, Geo Risk Research, NatCatSERVICE As of January 2009
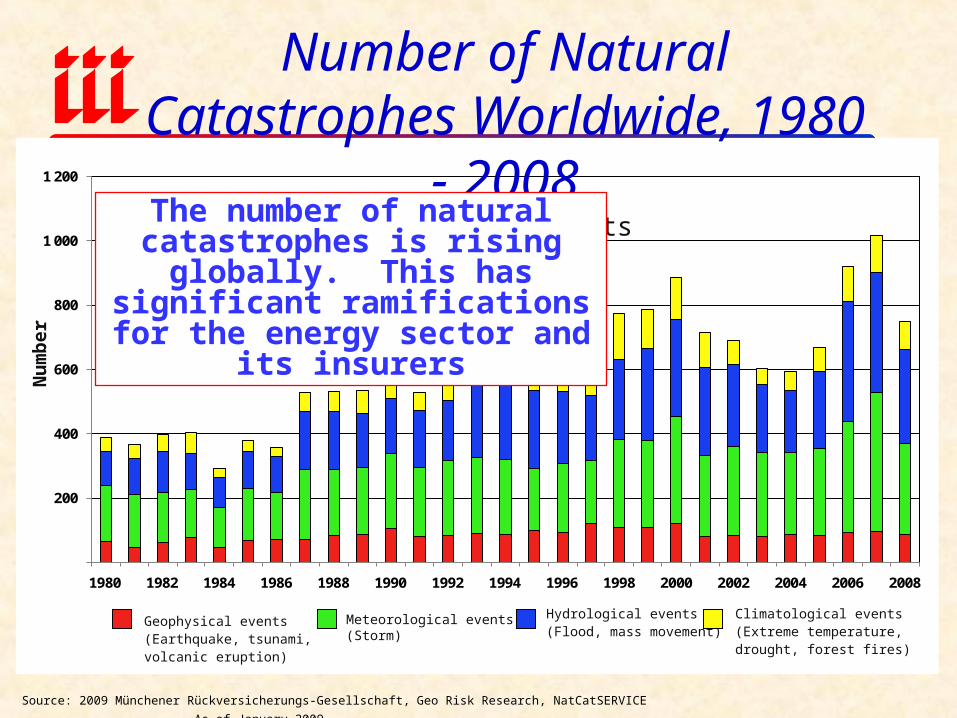
200
400
600
800
1 000
1 200
1980 1982 1984 1986 1988 1990 1992 1994 1996 1998 2000 2002 2004 2006 2008
Number of Natural Catastrophes Worldwide, 1980 - 2008
Number of events
Nu
mb
er
Climatological events (Extreme temperature, drought, forest fires)
Hydrological events (Flood, mass movement)
Meteorological events(Storm)
Geophysical events (Earthquake, tsunami, volcanic eruption)
Source: 2009 Münchener Rückversicherungs-Gesellschaft, Geo Risk Research, NatCatSERVICE As of January 2009
The number of natural catastrophes is rising globally. This has significant ramifications for the
energy sector and its insurers

50
100
150
200
250
1980 1982 1984 1986 1988 1990 1992 1994 1996 1998 2000 2002 2004 2006 2008
US
$b
n
Overall losses (2008 values) Insured losses (2008 values)
Overall and Insured Losses from Natural Catastrophes Worldwide, 1980 - 2008
The overall and insured costs from natural
catastrophes has been on the rise in recent year.
This has significant implications for the energy
sector and its insurers
Source: 2009 Münchener Rückversicherungs-Gesellschaft, Geo Risk Research, NatCatSERVICE As of January 2009

U.S. Insured Catastrophe Losses*$7
.5
$2.7
$4.7
$22.
9
$5.5 $1
6.9
$8.3
$7.4
$2.6 $1
0.1
$8.3
$4.6
$26.
5
$5.9 $1
2.9 $2
7.5
$6.7
$25.
2$1
00.0
$61.
9
$9.2
$0
$20
$40
$60
$80
$100
$120
89 90 91 92 93 94 95 96 97 98 99 00 01 02 03 04 05 06 07
08**
20??
*Excludes $4B-$6b offshore energy losses from Hurricanes Katrina & Rita.**Based on PCS data through Dec. 31. PCS $2.1B loss of for Gustav. $10.655B for Ike of 12/05/08.Note: 2001 figure includes $20.3B for 9/11 losses reported through 12/31/01. Includes only business and personal property claims, business interruption and auto claims. Non-prop/BI losses = $12.2B.Source: Property Claims Service/ISO; Insurance Information Institute
$ Billions2008 CAT losses exceeded
2006/07 combined. 2005 was by far the worst year ever for
insured catastrophe losses in the US, but the worst has yet to come.
$100 Billion CAT year is coming soon
96
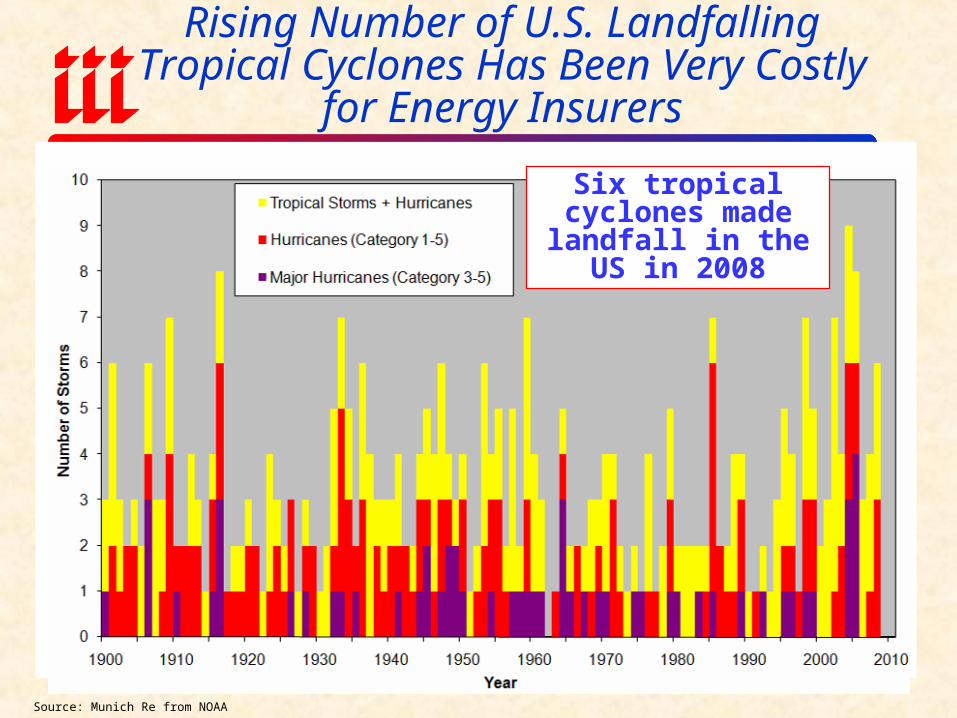
Rising Number of U.S. Landfalling Tropical Cyclones Has Been Very Costly
for Energy Insurers
Source: Munich Re from NOAA
Six tropical cyclones made landfall in the
US in 2008
Key Issues & Threats Facing P/C
Insurers Amid Financial Crisis
Manageable Challenges
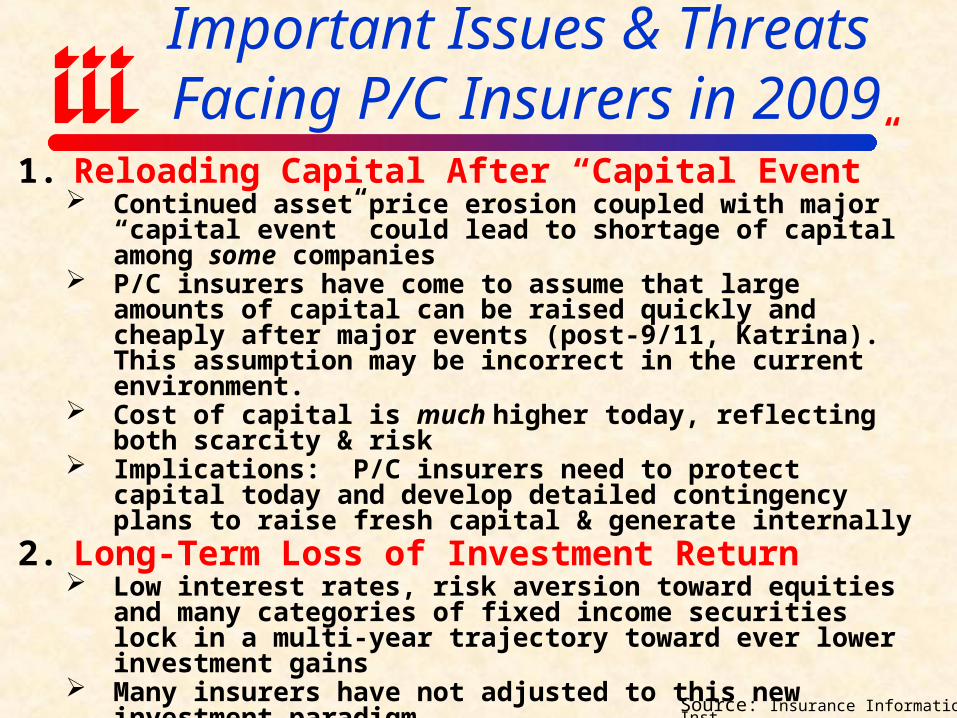
Important Issues & Threats Facing P/C Insurers in 2009
Source: Insurance Information Inst.
1. Reloading Capital After “Capital Event” Continued asset price erosion coupled with major “capital event”
could lead to shortage of capital among some companies P/C insurers have come to assume that large amounts of capital can be
raised quickly and cheaply after major events (post-9/11, Katrina). This assumption may be incorrect in the current environment.
Cost of capital is much higher today, reflecting both scarcity & risk Implications: P/C insurers need to protect capital today and develop
detailed contingency plans to raise fresh capital & generate internally2. Long-Term Loss of Investment Return
Low interest rates, risk aversion toward equities and many categories of fixed income securities lock in a multi-year trajectory toward ever lower investment gains
Many insurers have not adjusted to this new investment paradigm Regulators will not readily accept it; Many will reject it Implication 1: Industry must be prepared to operate in environment
with investment earnings accounting for a smaller fraction of profits Implication 2: Implies underwriting discipline of a magnitude not
witnessed in this industry in more than 30 years Lessons from the period 1920-1975
Source: Insurance Information Inst.
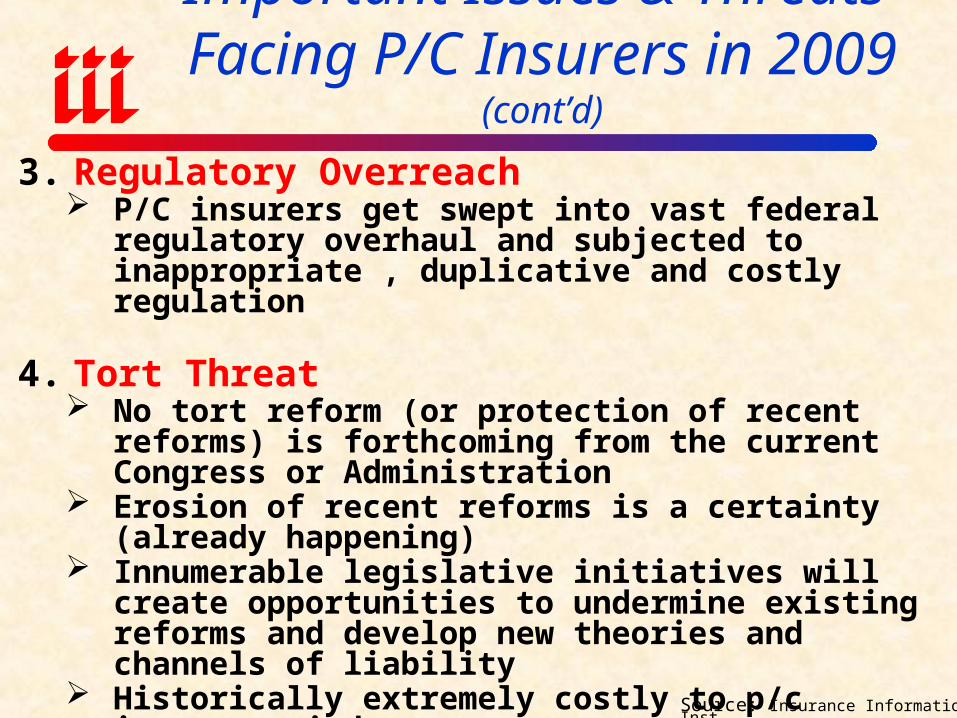
3. Regulatory Overreach P/C insurers get swept into vast federal regulatory
overhaul and subjected to inappropriate , duplicative and costly regulation
4. Tort Threat No tort reform (or protection of recent reforms) is
forthcoming from the current Congress or Administration Erosion of recent reforms is a certainty (already
happening) Innumerable legislative initiatives will create opportunities
to undermine existing reforms and develop new theories and channels of liability
Historically extremely costly to p/c insurance industry
Important Issues & Threats Facing P/C Insurers in 2009 (cont’d)
AFTERSHOCK: Regulatory Response
Could Be Harsh
All Financial Segments Including InsurersWill Be Impacted
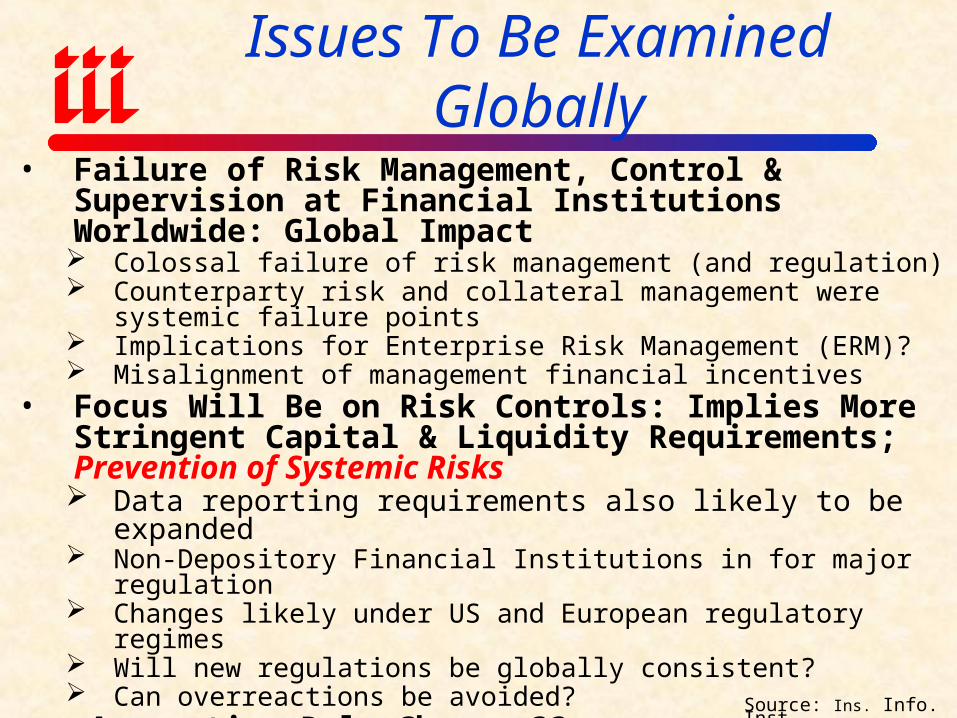
Post-Crunch: Fundamental Issues To Be Examined Globally
Source: Ins. Info. Inst.
• Failure of Risk Management, Control & Supervision at Financial Institutions Worldwide: Global Impact Colossal failure of risk management (and regulation) Counterparty risk and collateral management were systemic failure points Implications for Enterprise Risk Management (ERM)? Misalignment of management financial incentives
• Focus Will Be on Risk Controls: Implies More Stringent Capital & Liquidity Requirements; Prevention of Systemic Risks Data reporting requirements also likely to be expanded Non-Depository Financial Institutions in for major regulation Changes likely under US and European regulatory regimes Will new regulations be globally consistent? Can overreactions be avoided?
• Accounting Rule Changes?? Problems arose under FAS, IAS Asset Valuation, including Mark-to-Market Structured Finance & Complex Derivatives
• Ratings on Financial Instruments New approaches to reflect type of asset, nature of risk
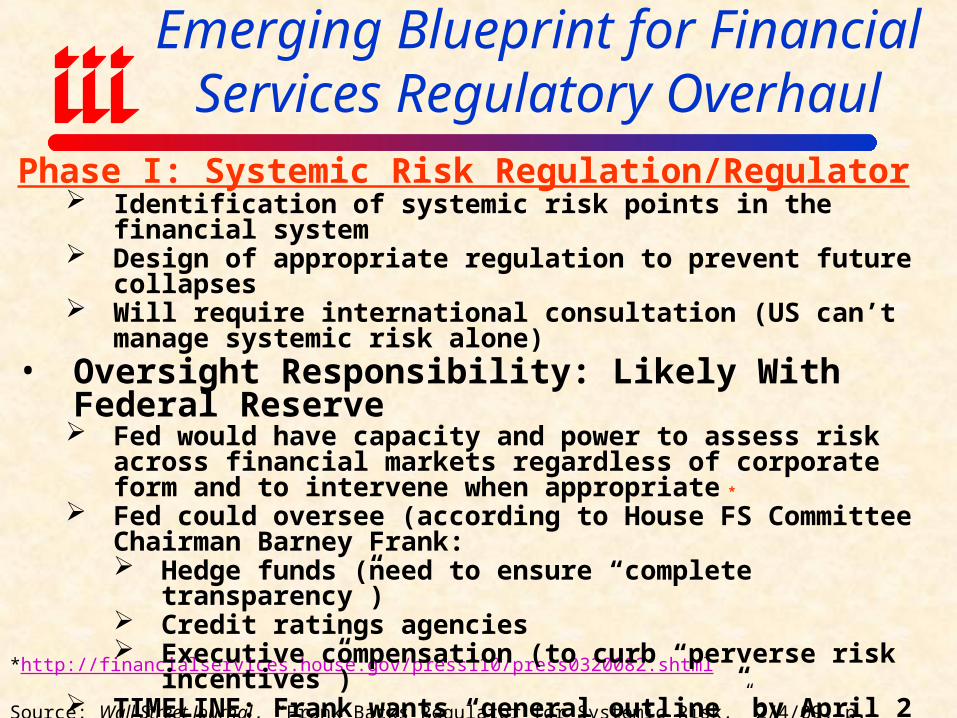
Emerging Blueprint for Financial Services Regulatory Overhaul
*http://financialservices.house.gov/press110/press0320082.shtml
Source: Wall Street Journal, “Frank Backs Regulator for Systemic Risk,” 2/4/09, p. C3; I.I.I. research.
Phase I: Systemic Risk Regulation/Regulator Identification of systemic risk points in the financial system Design of appropriate regulation to prevent future collapses Will require international consultation (US can’t manage systemic risk
alone) • Oversight Responsibility: Likely With Federal Reserve
Fed would have capacity and power to assess risk across financial markets regardless of corporate form and to intervene when appropriate *
Fed could oversee (according to House FS Committee Chairman Barney Frank: Hedge funds (need to ensure “complete transparency”) Credit ratings agencies Executive compensation (to curb “perverse risk incentives”)
TIMELINE: Frank wants “general outline” by April 2 meeting of G20 industrialized and developing nations
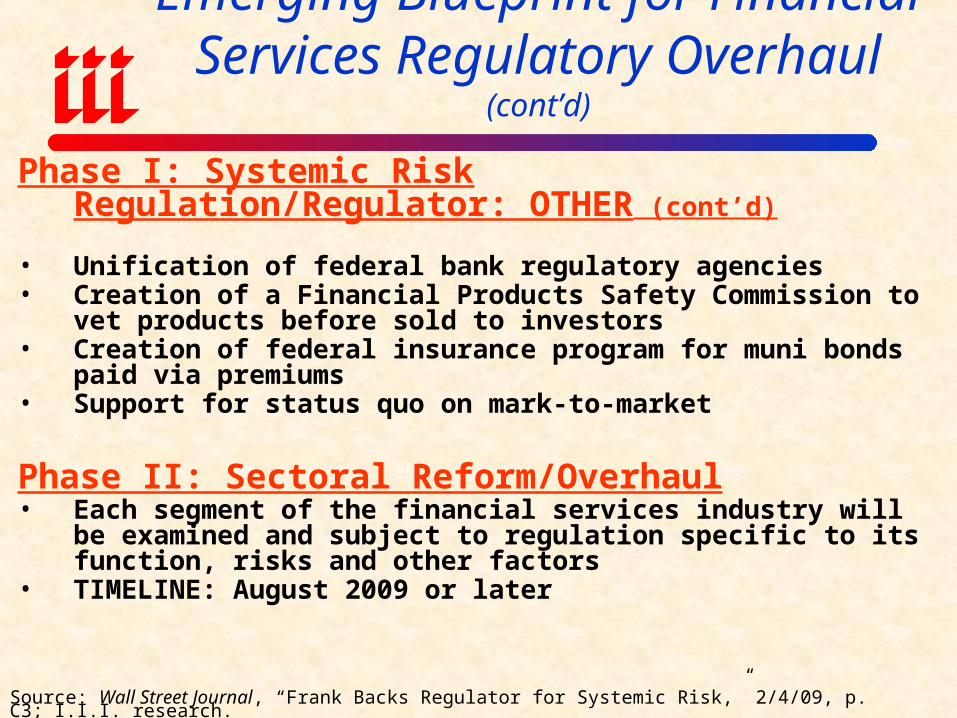
Emerging Blueprint for Financial Services Regulatory Overhaul (cont’d)
Phase I: Systemic Risk Regulation/Regulator: OTHER (cont’d)
• Unification of federal bank regulatory agencies• Creation of a Financial Products Safety Commission to vet products
before sold to investors• Creation of federal insurance program for muni bonds paid via premiums• Support for status quo on mark-to-market
Phase II: Sectoral Reform/Overhaul• Each segment of the financial services industry will be examined and
subject to regulation specific to its function, risks and other factors• TIMELINE: August 2009 or later
Source: Wall Street Journal, “Frank Backs Regulator for Systemic Risk,” 2/4/09, p. C3; I.I.I. research.
Post-Crunch: Fundamental Regulatory Issues & Insurance
Source: Insurance Information Institute
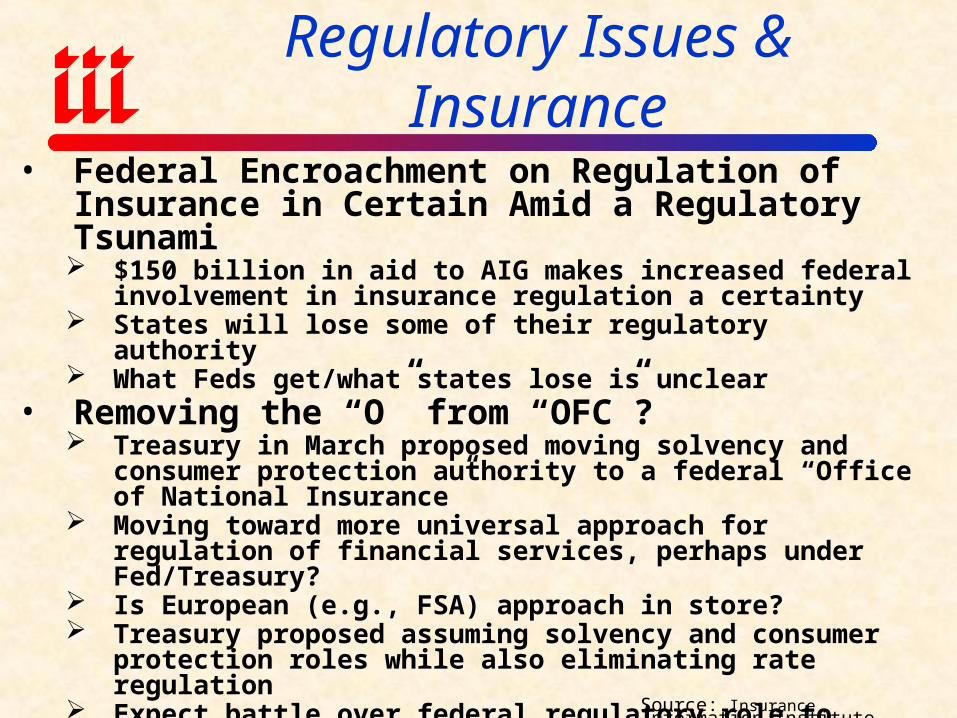
• Federal Encroachment on Regulation of Insurance in Certain Amid a Regulatory Tsunami $150 billion in aid to AIG makes increased federal involvement in
insurance regulation a certainty States will lose some of their regulatory authority What Feds get/what states lose is unclear
• Removing the “O” from “OFC”? Treasury in March proposed moving solvency and consumer
protection authority to a federal “Office of National Insurance” Moving toward more universal approach for regulation of financial
services, perhaps under Fed/Treasury? Is European (e.g., FSA) approach in store? Treasury proposed assuming solvency and consumer protection roles
while also eliminating rate regulation Expect battle over federal regulatory role to continue to be a divisive
issue within the industry States will fight to maximize influence, arguing that segments of the
financial services industry under their control had the least problems
Possible Regulatory Scenarios for P/C Insurers as of Year-End 2009
Source: Insurance Information Inst.
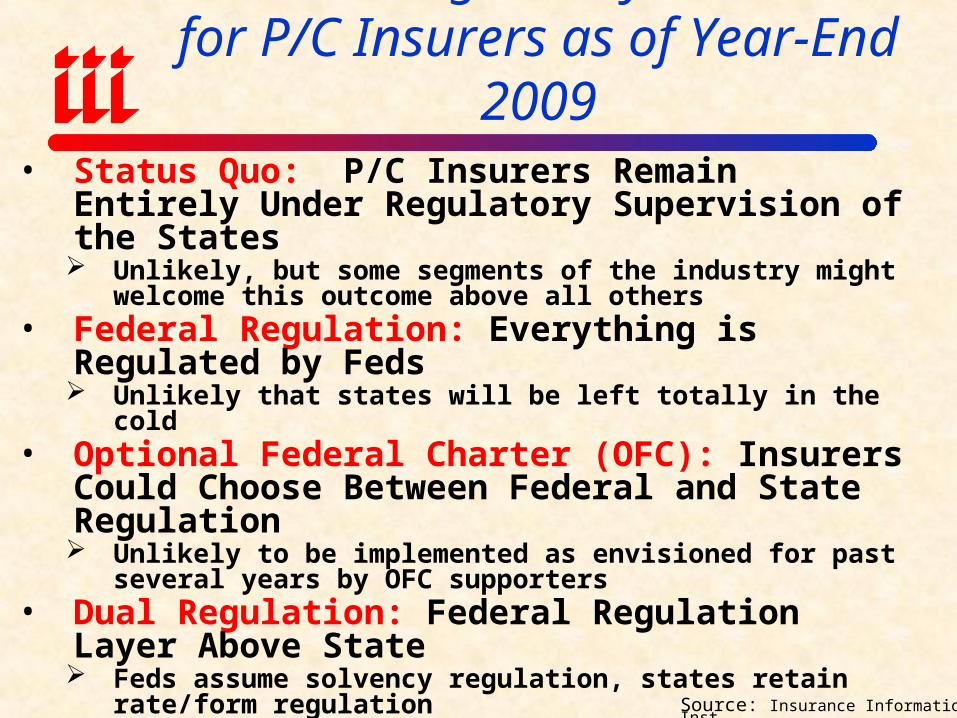
• Status Quo: P/C Insurers Remain Entirely Under Regulatory Supervision of the States Unlikely, but some segments of the industry might welcome this
outcome above all others• Federal Regulation: Everything is Regulated by Feds
Unlikely that states will be left totally in the cold• Optional Federal Charter (OFC): Insurers Could Choose
Between Federal and State Regulation Unlikely to be implemented as envisioned for past several years by
OFC supporters• Dual Regulation: Federal Regulation Layer Above State
Feds assume solvency regulation, states retain rate/form regulation• Hybrid Regulation: Feds Assume Regulation of Large
Insurers at the Holding Company Level• Systemic Risk Regulator: Feds Focus on Regulation of
Systemic Risk Points in Financial Services Sector What are these points for insurers? P/C vs. Life?
Major Regulatory Considerations for Insurance Regulation in 2009
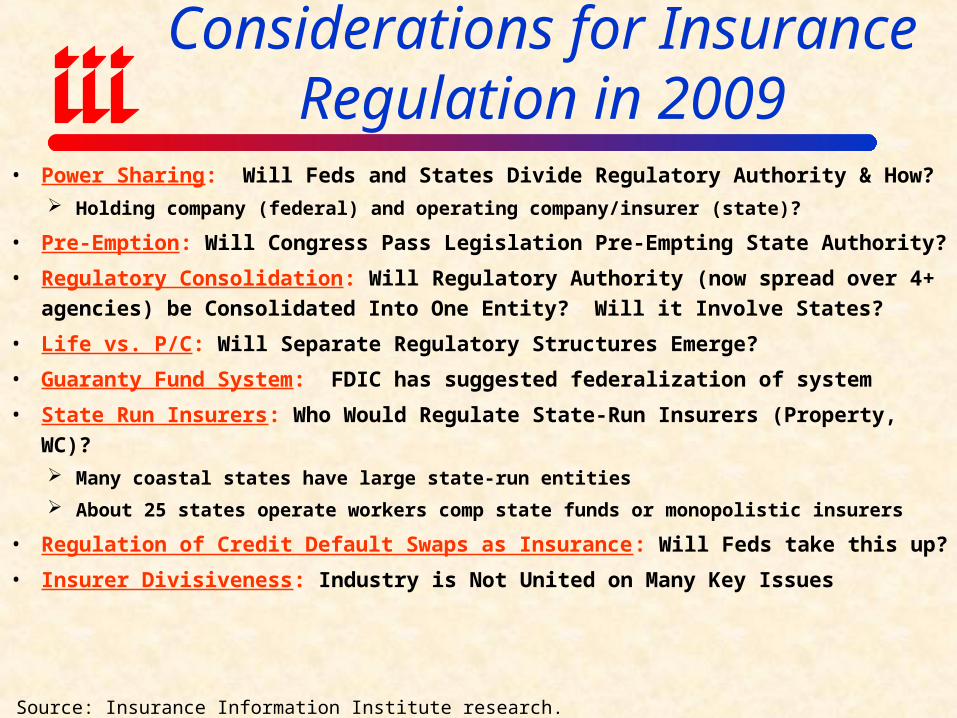
• Power Sharing: Will Feds and States Divide Regulatory Authority & How?
Holding company (federal) and operating company/insurer (state)?
• Pre-Emption: Will Congress Pass Legislation Pre-Empting State Authority?
• Regulatory Consolidation: Will Regulatory Authority (now spread over 4+
agencies) be Consolidated Into One Entity? Will it Involve States?
• Life vs. P/C: Will Separate Regulatory Structures Emerge?
• Guaranty Fund System: FDIC has suggested federalization of system
• State Run Insurers: Who Would Regulate State-Run Insurers (Property, WC)?
Many coastal states have large state-run entities
About 25 states operate workers comp state funds or monopolistic insurers
• Regulation of Credit Default Swaps as Insurance: Will Feds take this up?
• Insurer Divisiveness: Industry is Not United on Many Key Issues
Source: Insurance Information Institute research.
Insurance Information Institute On-Line
THANK YOU FOR YOUR TIME AND
YOUR ATTENTION!
108