the global engagement index - tmbc · revealed the causal link between employee engagement and...
TRANSCRIPT
The Global Engagement IndexCross-country engagement baselines for team leaders
WHITE PAPER SERIES
tmbc.com


3
Introduction Over the last 20 years, numerous research studies have
revealed the causal link between employee engagement and
positive business outcomes.
Teams and business units with higher engagement levels produce statistically significantly higher levels of performance, quality, safety and retention. With organizations becoming increasingly global, there is a need to compare business unit levels of engagement across countries consistently and reliably. This is problematic, not least because different countries respond to ratings scales in different ways. For example, South Americans and southern Europeans are much more likely to use the positive extremes of a scale than Chinese, Japanese or Germans. Any employee engagement metric that does not accommodate these country-specific differences will yield consistently distorted data, leading to inaccurate and misleading cross-country comparisons.
Two years ago, The Marcus Buckingham Company (TMBC) set out to design and build a Global Engagement Index (GEI) that could take into account these inter-country differences and produce reliably comparable data. In this paper, we present the research undertaken to build the GEI and the results of its deployment across an initial study group of thirteen countries.

4
Purpose
The purpose of the GEI was threefold:
1. To measure reliably the overall
level of engagement in each
country, and to establish a stable
baseline for each country.
2.To provide all team leaders with
a tool to compare their team’s
engagement level against the
country-specific baseline.
3.To reveal, country by country,
which conditions in the workplace
are most likely to drive team
members to become fully
engaged at work.
TheEngagementPulseInstrument
The GEI is derived from the items contained within TMBC’s Engagement Pulse (SL8). These items have been developed through decades of research with a focus on reducing measurement and psychometric error (see the TMBC white paper Engagement Pulse for full details). In brief, the Engagement Pulse items were intentionally written with four specific criteria in mind:
(1) A single thought per item — A single thought measuring one construct per item helps to reduce the cognitive burden experienced by the user.
(2) Containing extreme wording — The Engagement Pulse survey deliberately uses extreme wording to overcome problems with acquiescence (i.e., agreement regardless of content).
(3) “Me rating me” — The Engagement Pulse was intentionally designed to solicit information from team members about themselves, or “me rating me.” We chose this method to overcome potential issues that occur with the ratings of others — namely rater effect and rater insufficiency (i.e., cognitive limitations).
(4) Actionable for change — The items are designed to be actionable and under the control of the team leader to effect change.

5
Below are the 8 items of the Engagement Pulse (SL8), measured on a Likert scale (1–5):
Purpose 1. Iamreallyenthusiasticaboutthemissionofthecompany.
2. Atwork,Iclearlyunderstandwhatisexpectedofme.
Excellence 3. Inmyteam,Iamsurroundedbypeoplewhosharemyvalues.
4. Ihavethechancetousemystrengthseverydayatwork.
Support 5. Myteammateshavemyback.
6. IknowIwillberecognizedforexcellentwork.
Future 7. Ihavegreatconfidenceinmycompany’sfuture.
8. InmyworkIamalwayschallengedtogrow.
The odd-numbered items measure aspects of the workplace that are communal — the “We” of the workplace. The even-numbered items measure aspects of the workplace that are individual — the “Me” of the workplace. In combination they capture the twin challenges of leading a team effectively: first, how to conjure within the team feelings of shared purpose, values, meaning and future; and second, how to ensure that each person feels understood, challenged and developed as a unique individual.
6
DataOutput
The GEI metric yields two related but distinct scores:
1. LevelofEngagement:
This score, expressed as a number
between 1–100, reveals a team’s
(or company’s/country’s) overall
level of engagement. It is the most
reliable and calibrated summary
of the entire data set of the team
(or company/country).
2.ExtremeofEngagement:
This score, expressed as a “% Fully
Engaged,” reveals the percentage
of a team (company/country) who
are psychologically committed
to their work. These people are
dedicated to the purpose of the
company, certain in their definition
of excellence, confident in the
support of their teammates, and
excited by the company’s future.
The two scores produced by the GEI co-vary, and yet they also diverge in important ways. Some teams have a relatively high level of engagement but low “% Fully Engaged.” Others have the inverse pattern: a high “% Fully Engaged,” and relative lower overall level. Although the ideal is to have a team that scores positively on both, of the two, the “% Fully Engaged” score is the more important.

7
WhyIs“%FullyEngaged”the
MoreMeaningfulScore?
The purpose of an employee engagement metric is not to measure engagement. Instead, its purpose is to help a team create more productive behaviors. A significant body of previous research reveals that what best predicts these productive behaviors — such as lower turnover, fewer accidents, higher productivity, and customer satisfaction — is the percentage of team members who can report “strongly agree” to the items in the metric. Top Box responses are the best predictor. Many organizations, apparently unaware of this, choose to combine the top two boxes into a “percentage favorable” score. This is an unhelpful aggregation of the data because, when it comes to predicting subsequent employee behavior, 4s operate more like 3s than they do like 5s.
By measuring precisely the number of team members who report extreme levels of engagement, the “% Fully Engaged” score helps the team leader (and the company) predict how productive the team is going to be in the near-term future.
Those team members who are not “Fully Engaged” are not necessarily disengaged. Some survey instruments suggest that there is a gradation of engagement descending from full engagement to disengagement to active disengagement. This is neither accurate nor helpful. All engagement metrics are designed to measure engagement. However, since it is impossible to measure the exact opposite of something by asking about that something, these engagement metrics have very little to say on disengagement.
Thus, while the GEI has a “% Fully Engaged” threshold and can measure how many team members are above that threshold, the most it can say about those who fall below the threshold is that their engagement, and therefore their subsequent productive behaviors, cannot be predicted. Since the only accurate prediction to be made about them is that their level of engagement is non-predictive, the GEI simply describes these team members as “Coming to Work.” The absence of engagement is not necessarily active disengagement.

8
The Global Study
The items were translated into eight languages: English, German, French, Spanish, Latin American Spanish, Portuguese, Chinese, and Italian. The translations were then back-translated independently to ensure that content, accuracy and the idiomatic meaning of the items were captured correctly.
In April and May of 2015, the items were fielded to a random stratified sample of 1,000 working adults from 13 countries: United States, Britain, Germany, France, Canada, Brazil, Argentina, Australia, Mexico, China, Italy, Spain, and India.
Cross-CountryCalibration
Past research suggests that individuals respond to survey items differently based on language and culture. This source effect introduces error into the survey measurement. To control for this error, the items were adjusted across countries using a sub-set of items, the “calibration items.” Item means were calculated within each country, and then compared to the grand mean. This difference was treated as a cultural/language effect, and the engagement data were adjusted. Further analysis then proceeded with these adjusted data.
PowerWeightingCalibration
Through past research, we identified which of the eight items are the most powerful predictors of productive employee behaviors, and have the most explanatory power of overall engagement. These items were given additional weightings.
Results
We completed a multi-group confirmatory factor analysis (MG-CFA) of the eight Engagement Pulse items to determine whether this new global sample had the same factor structure as we had previously established (see the TMBC white paper Engagement Pulse for full details). As before, only one stable factor emerged. These eight items measure one coherent factor which, given the purpose for which the survey was built, we will label “engagement.”These weightings were then incorporated into an algorithm.
To generate the GEI scores, we took the calibrated data by country and then applied this algorithm.

9
GEILevel:ComparisonbyCountry
The GEI level for each country was standardized to allow for comparison across all countries. Some variance within each country does exist but, by design, little variation occurs across countries.
Glo
balE
ng
ag
em
en
tIn
dexL
eve
l
GlobalSample
Min
Median Max
Mean
10
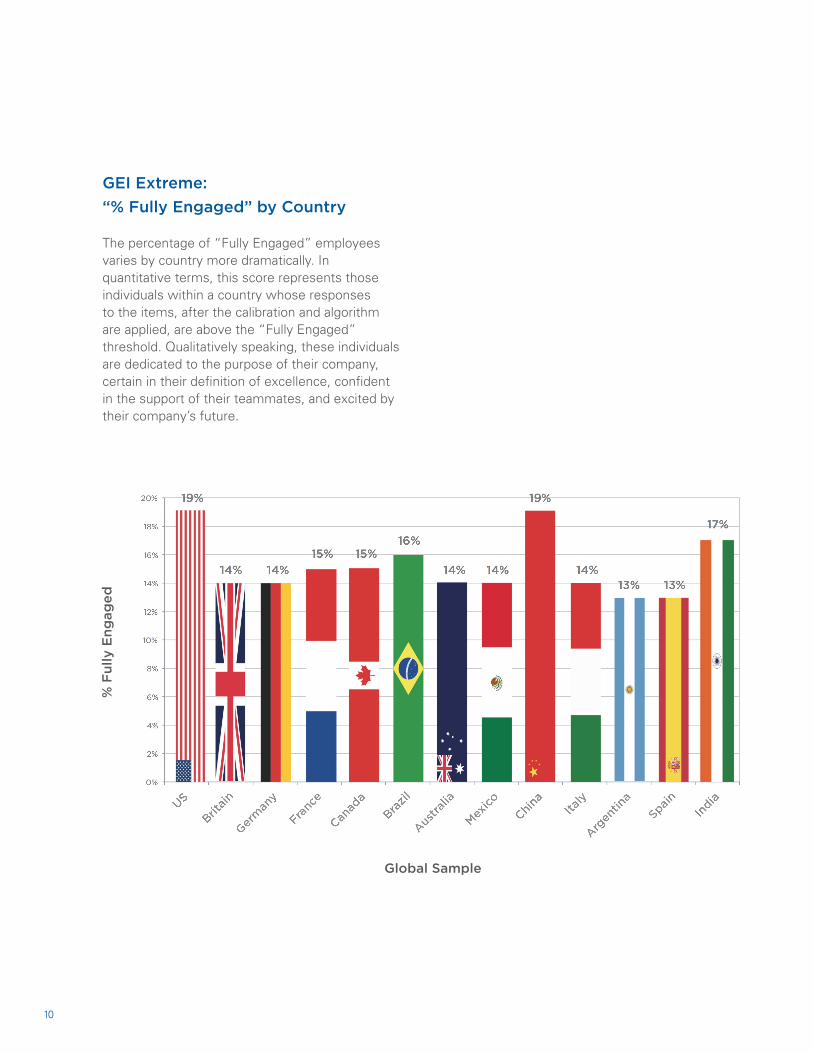
GEIExtreme:
“%FullyEngaged”byCountry
The percentage of “Fully Engaged” employees varies by country more dramatically. In quantitative terms, this score represents those individuals within a country whose responses to the items, after the calibration and algorithm are applied, are above the “Fully Engaged” threshold. Qualitatively speaking, these individuals are dedicated to the purpose of their company, certain in their definition of excellence, confident in the support of their teammates, and excited by their company’s future.
%F
ullyE
ng
ag
ed
GlobalSample

11
InEachCountry,WhatCausesa
TeamtoBecomeFullyEngaged?
Even with one factor, we wanted to understand what made a team member “Fully Engaged” as compared to “Coming to Work.” We separated the overall sample and selected only those who were “Fully Engaged” to understand what drives their engagement within each country. We then performed a number of different statistical analyses to understand the interrelationship between the items, and between the items and the “Fully Engaged” threshold.
Findings:TheMostPowerfulItem
Despite obvious cultural differences between the countries in the study, we discovered that the same one item demonstrated the greatest power in explaining engagement in every country in the study. Item #4:
I have the chance to use my
strengths every day at work.
This finding is consistent with previous research — conducted by TMBC and others — showing that teams whose members feel that they have frequent opportunities to do their best work outperform those teams whose members do not. Even after applying the country-specific calibration and the power algorithm, this item still possessed more explanatory power than any other. This suggests that there is far greater consistency around the world to what team members want from their work than one might have expected. Although corporate methods, behaviors and values vary by country — and by industry — the most powerful human need at work remains the same: help me discover my strengths, and help me use them a lot.

12
Findings:DifferencesbyCountry
Though item #4 is the foundation of full engagement in every country in our study, further analyses revealed that different configurations of items explained full engagement in different countries. This suggests that, though the foundation of a Fully Engaged team is the same the world over — “Play to my strengths” — the next “bricks” laid upon that foundation vary by country. Companies and team leaders need to be aware of these variations if they are to successfully build more teams like their most engaged teams.
• In the United States, the next most powerful predictor of Full Engagement is item #1: I am really enthusiastic about the mission of the company. This suggests that, in the US, the best way to build an effective team is to tie each person’s unique strengths to a universal purpose in which everyone can find shared meaning. Strengths in the service of mission lead to a fully engaged team.
• The two countries whose workplace statistics most closely resemble the United States’ in this respect are China and Germany. Though many cultural differences exist between these three countries, they all appear to share an appetite for a communal mission. The best way to build a fully engaged team in China and Germany — and the US — is to rally people toward a shared and noble goal.
• This is not so in the UK and India. In these two countries, item #3 is the next strongest predictor of a fully engaged team: In my team, I am surrounded by people who share my values. This suggests that in the UK and India, a sense of grand purpose is less powerful and less relevant than the sense that my teammates all value what I value. Full engagement, then, is a result of considered, rational and parochial calculations, rather than passionate enthusiasm for a shared cause.
• France and Canada display a different pattern from any of the countries described above. It is a pattern they share with each other, and, interestingly, with Brazil and Argentina. In these four countries, the next block laid upon the foundation of “play to my strengths” is item #5: My teammates have my back. In contrast to items 1 and 3, this item is neither emotional nor rational, but is instead instinctive. It measures a gut-level feeling that “I am covered.” This suggests that in these countries a fully engaged team has the quality of a tight-knit group of teammates who must stick together, protecting one another from external threat. A Fully Engaged team is a defensive unit.
• Australian teams display another pattern altogether. In Australia, the most powerful next building block is item #7: I have great confidence in my company’s future. “Confidence” and “future” are obviously the
13
trigger words in this item. To create a fully engaged team in Australia, the team leader must delineate clearly the future business context and must reassure the team that they possess some sort of material comparative advantage in that future context. Team members appear to be demanding of their leaders: “Tell me why we will win.”
• Spain’s pattern is different again, and is perhaps best explained by their current economic environment — and thus raises the question of whether these patterns are enduringly stable or whether they will fluctuate based on macroeconomic conditions. (We will study this over time.) In Spain, the biggest driver of Full Engagement is item #8: In my work I am always challenged to grow. Though Spaniards may want many things from their workplaces, the need that integrates and explains all others is that, on this team, I see a way for me to grow my skills, and even my career. When one combines this item with the “play to my strengths” item — which is the foundation of Full Engagement in Spain, as in every country in our study — a picture emerges of a workforce preoccupied with their own present and future worth. All team members in all countries share these preoccupations, of course, but in present-day Spain they are amplified. Given the current economic situation in Spain, this is hardly surprising.

14
Conclusion
The GEI fills an alarming gap in our understanding of global employee engagement. Through the combination of the country calibration and the power algorithm, it provides team leaders with a reliable metric to measure their team’s overall level of engagement, and their extremes of engagement, using the “% Fully Engaged” score. It also reveals the levers that best explain what drives full engagement within a particular country and culture.
Since TMBC’s mission is to serve team leaders the world over, we plan to give the GEI away to all team leaders through the SurveyMonkey platform.
In addition to the data gathered through the platform, we will repeat and extend this global study yearly. Our hope is that this ongoing research will yield an increasingly precise understanding of global engagement, and thereby contribute to all team leaders’ ability to build more fully engaged teams.


IN0093_GEI_white_paper_r02v01 © 2017 by TMBC. All rights reserved. Reproduction in any form without the express written consent of
The Marcus Buckingham Company is prohibited.