the global energy scene – current status of the energy ... · the global energy scene – –...
TRANSCRIPT
Necdet PAMNecdet PAMİİRR
Board Board MemberMember, , WorldWorld
EnergyEnergy
CouncilCouncil
TurkishTurkish
NationalNational
CommitteeCommitteeInstructorInstructor, Bilkent , Bilkent UniversityUniversity
The Global Energy Scene The Global Energy Scene –– Current Status of the Energy Current Status of the Energy
Resources and the Scenarios for Resources and the Scenarios for TomorrowTomorrow
13 October 2009

ReferenceReference DocumentsDocuments & & MainMain TopicsTopics
Global Global EnergyEnergy TrendsTrendsOilOil Market OutlookMarket Outlook

IntroductionIntroduction
TheThe financialfinancial crisiscrisis andand thethe deepdeep economiceconomiccontractioncontraction is is stillstill thethe mostmost importantimportant global global considerationconsideration..No need to say, the energy and the oilmarket are facing with dramatic negativeimpacts of such crisis to include wide pricefluctuations and significant demanddecreases.Oil prices hit over $140 a barrel in July 2008 before sharply falling below $40/bbl withinonly 6 months time.
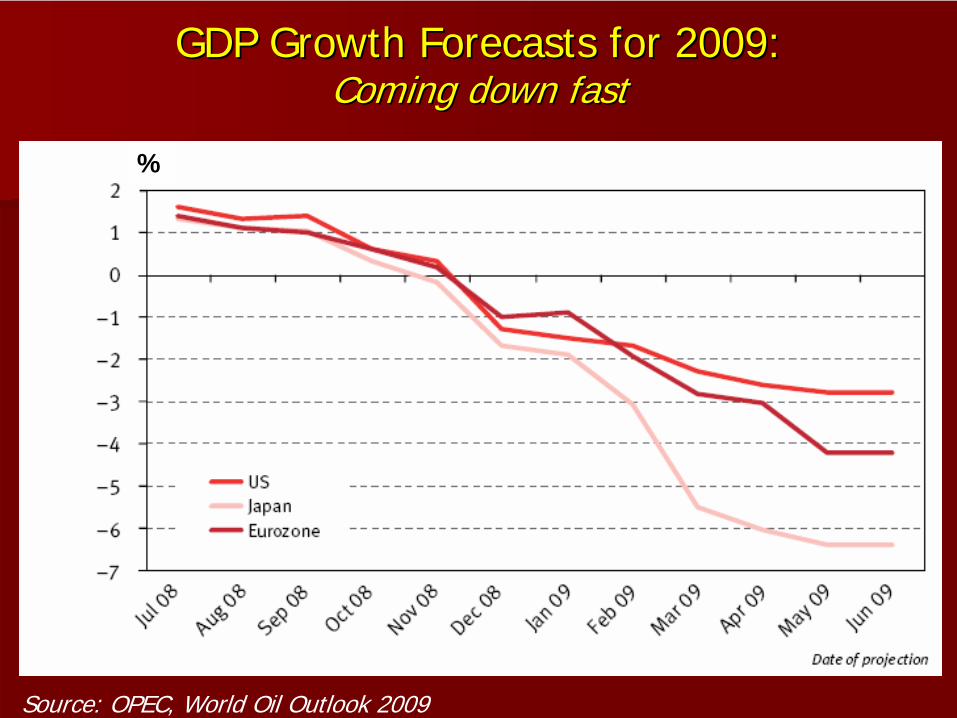
GDP GDP GrowthGrowth ForecastsForecasts forfor 2009:2009: ComingComing downdown fastfast
Source: OPEC, World Oil Outlook 2009
%
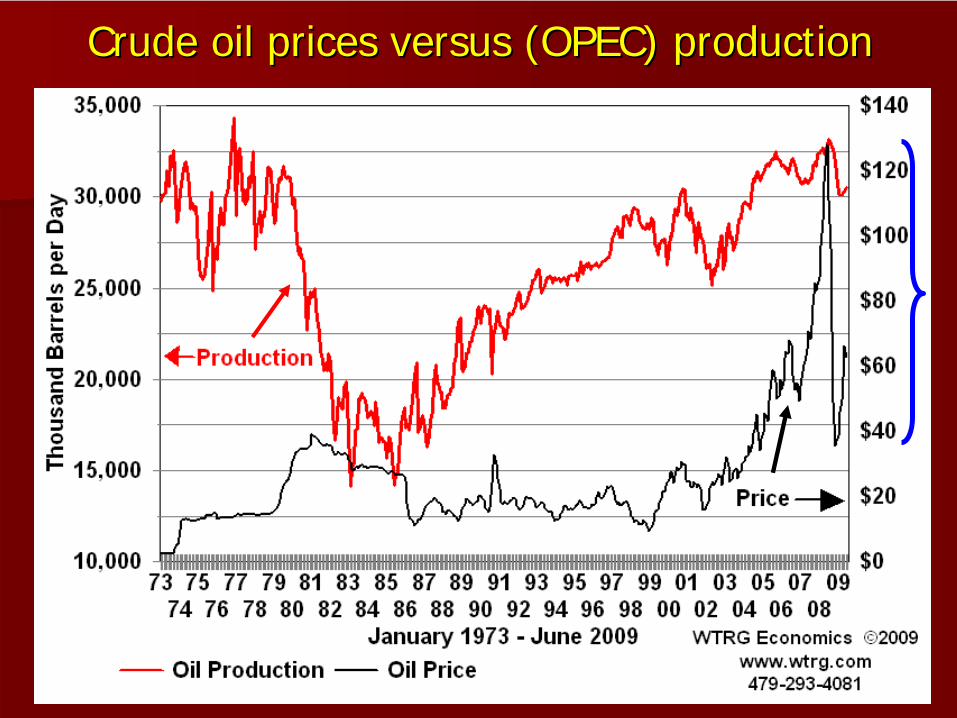
CrudeCrude oiloil pricesprices versusversus (OPEC) (OPEC) productionproduction

EnergyEnergy PricePrice VolatilityVolatility andand ForecastForecast UncertaintyUncertainty is a is a mattermatter of of deepdeep concernconcern
EIA of the US Department of Energy, October 2009
$/barrel
$120

ShortShort andand longlong termterm EconomicEconomic OutlooksOutlooks
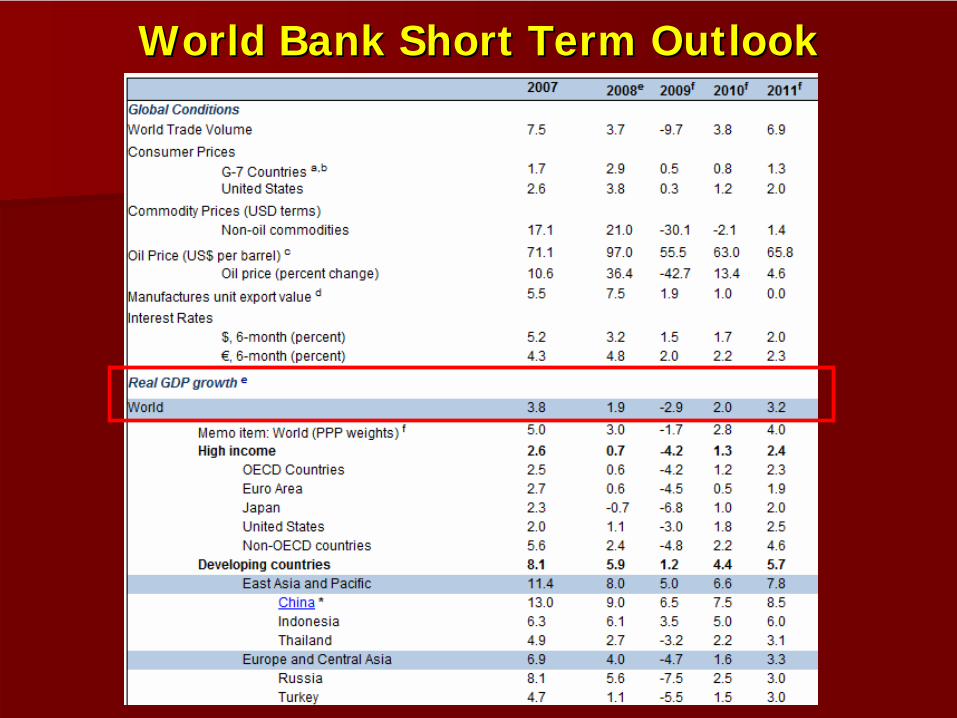
WorldWorld Bank Bank ShortShort TermTerm OutlookOutlook
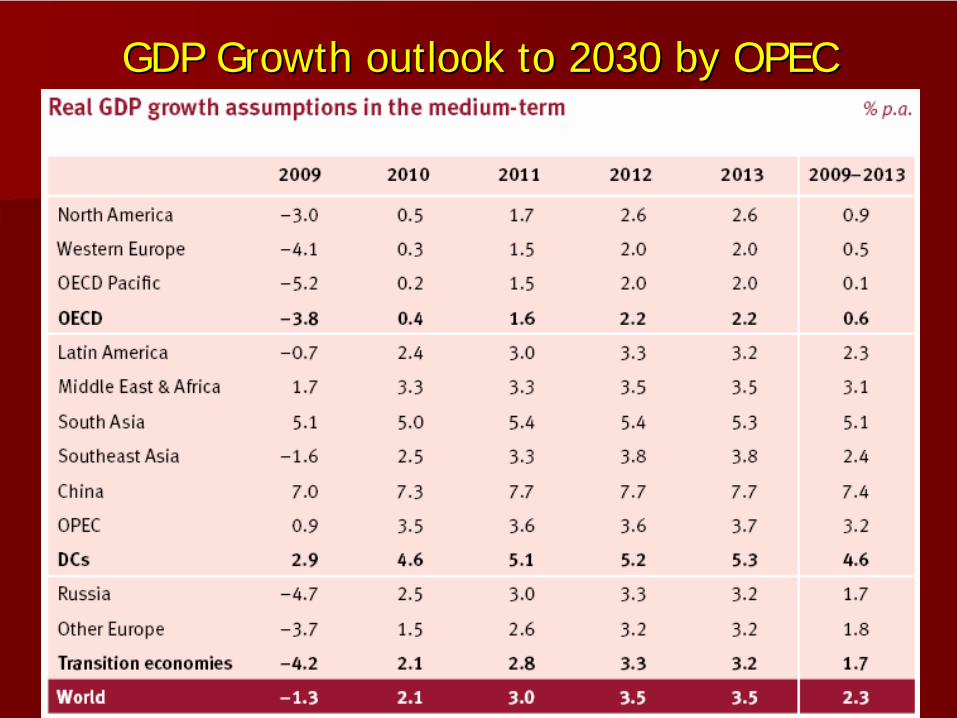
GDP GDP GrowthGrowth outlook to 2030outlook to 2030 byby OPECOPEC

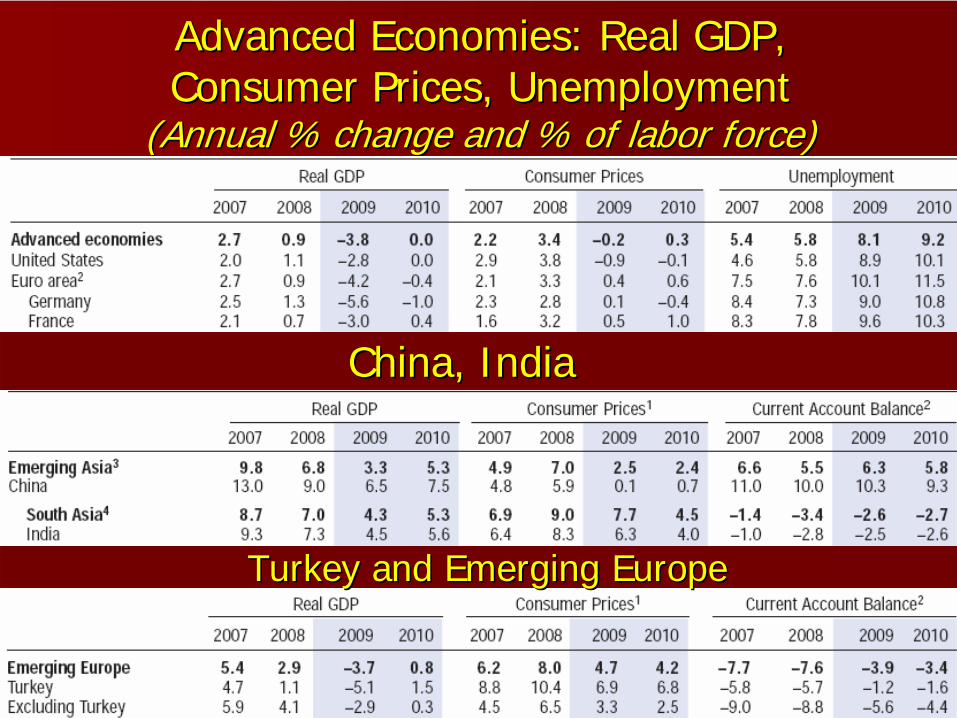
AdvancedAdvanced EconomiesEconomies: Real GDP, : Real GDP, ConsumerConsumer PricesPrices, , UnemploymentUnemployment
((AnnualAnnual % % changechange andand % of % of laborlabor forceforce))
ChinaChina, , IndiaIndia
TurkeyTurkey andand EmergingEmerging EuropeEurope

World
Bank , April 2009

OPEC: “The high oil prices in the middle of 2008 were not justified by physical supplyand demand fundamentals. The price movements were made worse bymassive direct and indirect investmentinflows by non-commercial players looking togain exposure to commodity markets. This was facilitated, among other things, bythe the absence of a cap on speculativeactivity.We also believe in the widely held view thatlow oil prices are not sustainable.”
Source: World Oil Outllook 2009, OPEC

““New New EnergyEnergy forfor AmericaAmerica””BarackBarack Obama & Obama & JoeJoe BidenBiden

SHORTSHORT TERMTERM SOLUTIONS:SOLUTIONS: ImmedImmediiate ate RelReliiefef From PaFrom Paiin At The Pumpn At The Pump
Immediately Provide Emergency Energy Immediately Provide Emergency Energy RebateRebate ($ 500 ($ 500 –– 1000/1000/yearyear))
Crack Down on Excessive Energy Crack Down on Excessive Energy SpeculationSpeculation((CloseClose thethe ccurrenturrent loopholes in Commodity Futures Tradingloopholes in Commodity Futures TradingCommission regulationsCommission regulations))
Swap Light and Heavy Crude, Release Oil Swap Light and Heavy Crude, Release Oil from Strategic Petroleum Reserve to Cut from Strategic Petroleum Reserve to Cut PricesPrices

The availability of energy sources and fossilfuels in specific (Are the reserves sufficient?)The costs of developing those reservesThe global economic outlookThe climate for investment(Energy) Scenarios for the next decadesThe developments for alternative sourcesConcerns of climate change and its impacts
Some basic factors to consider for a realistic market outlook…

WorldWorld
PrimaryPrimary
EnergyEnergy
ConsumptionConsumption
byby
SourcesSources
(%),(%),
endend 2008
Coal 29.3 % Oil
34.8 %
Gas 24.1 %
Hydro, other
renewables 6.4 %
Nuclear5.4 %
Source: BP Statistical
World
Review
of Energy, June
2009

WorldWorld
RecoverableRecoverable
OilOil
ReservesReserves, , endend
20082008 1,258 1,258 billionbillion
barrelsbarrels
(1,408 w/(1,408 w/CanadianCanadian oiloil sandssands))
Africa125.6 billion
barrels
South, Central
America
123.2 billion
barrels
Asia
Pasific42 billion
barrels
N. America70.9 billion
barrels 18.4 billion bbl
FSU127.8 billion
barrels
Reserve/Production: 42 years
EU6.3 billion
barrels
M. East754 billion
barrels
Source: BP Statistical Review of World Energy, June 2009
End 2005
Canada oil sands:151 billion bbls
% 60
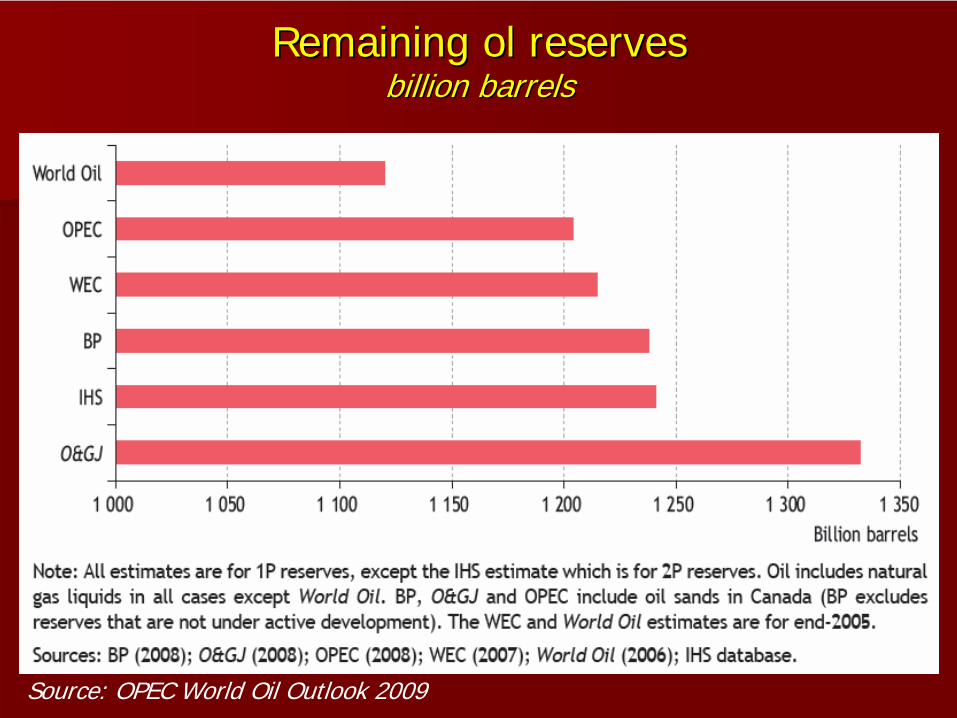
RemainingRemaining ol ol reservesreserves billionbillion barrelsbarrels
Source: OPEC World Oil Outlook 2009

WhoWho controlscontrols oiloil reservesreserves ??
Pie diagramfrom EIA

Foreign company access to proven oil reserves, Foreign company access to proven oil reserves, endend--20072007
Sources: O&GJ (2007); IEA databases and analysis.
?

WhoWho ownsowns thethe ((conventionalconventional) ) oiloil reservesreserves??
EU0,5%
OECD7,1%
OPEC76,0 %
Non-OPEC13,9 % FSU
10,2 %
Source: BP, June 2009

OilOil andand GasGas ReservesReserves byby CountryCountry oror CompanyCompany ((billionsbillions of of barrelbarrel oiloil equivalentequivalent, 2007), 2007)
RecoverableRecoverable
GasGas
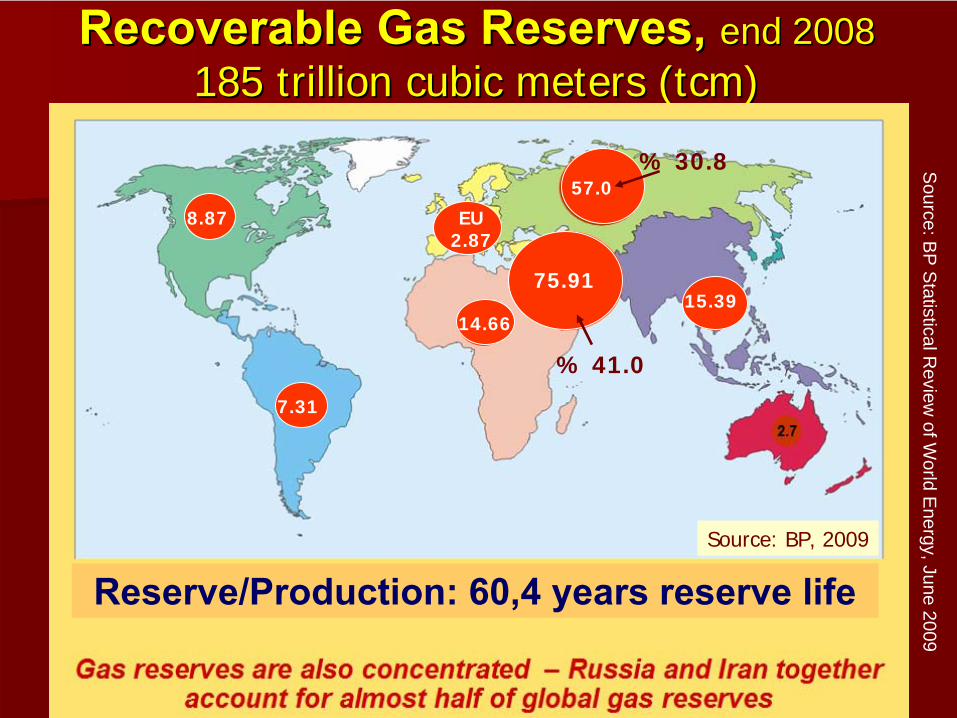
ReservesReserves, , endend 20082008 185 185 trilliontrillion cubiccubic metersmeters ((tcmtcm))
Reserve/Production: 60,4 years
reserve
life
7.31
8.87 EU2.87
75.91
% 41.0
14.6615.39
57.0% 30.8
Source: BP, 2009
Source:B
P S
tatisticalReview
of World
Energy, June
2009

Russia % 23.4Other % 29
OECD % 8
Qatar % 14M. Eastern countries restricting
foreign investments
% 9
Iran % 16
Who controls the gas reserves ?
Russian
Gas
Production: 602 bcm/year
(19.6 %)
Russian
Gas
Exports: 182 bcm Source: BP, 2009
43.3 tcm
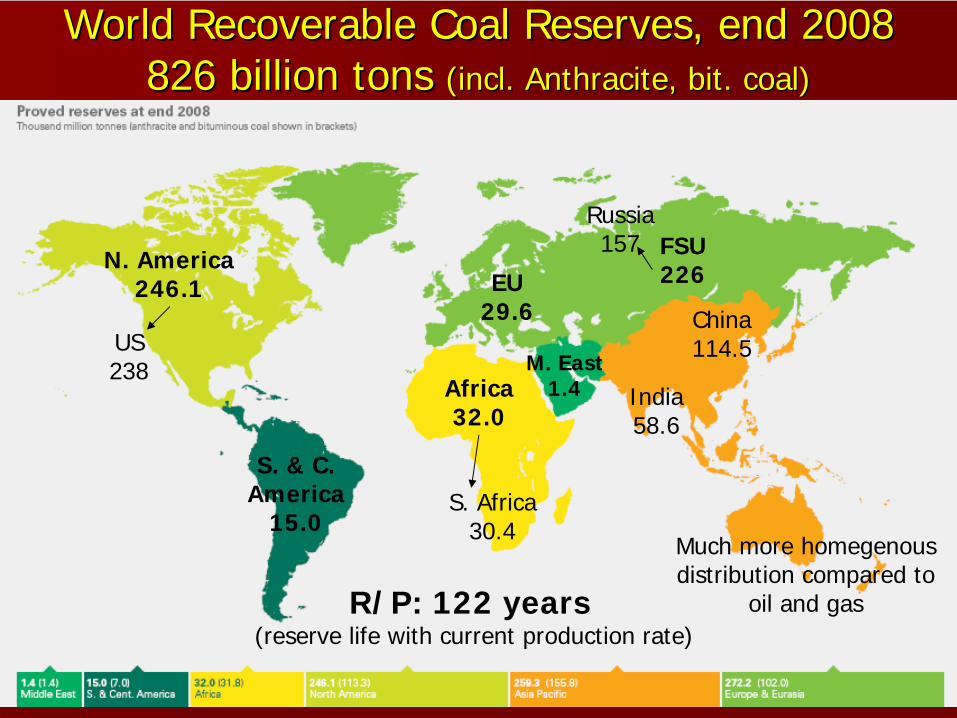
WorldWorld RecoverableRecoverable CoalCoal ReservesReserves, , endend 20082008 826 826 billionbillion tonstons ((inclincl. . AnthraciteAnthracite, bit. , bit. coalcoal))
M. East1.4
S. & C.America
15.0
N. America246.1
Africa32.0
FSU226EU
29.6 China114.5
India58.6
Russia157
US238
R/P: 122 years(reserve life with current production rate)
Much more homegenousdistribution compared to
oil and gas
S. Africa30.4
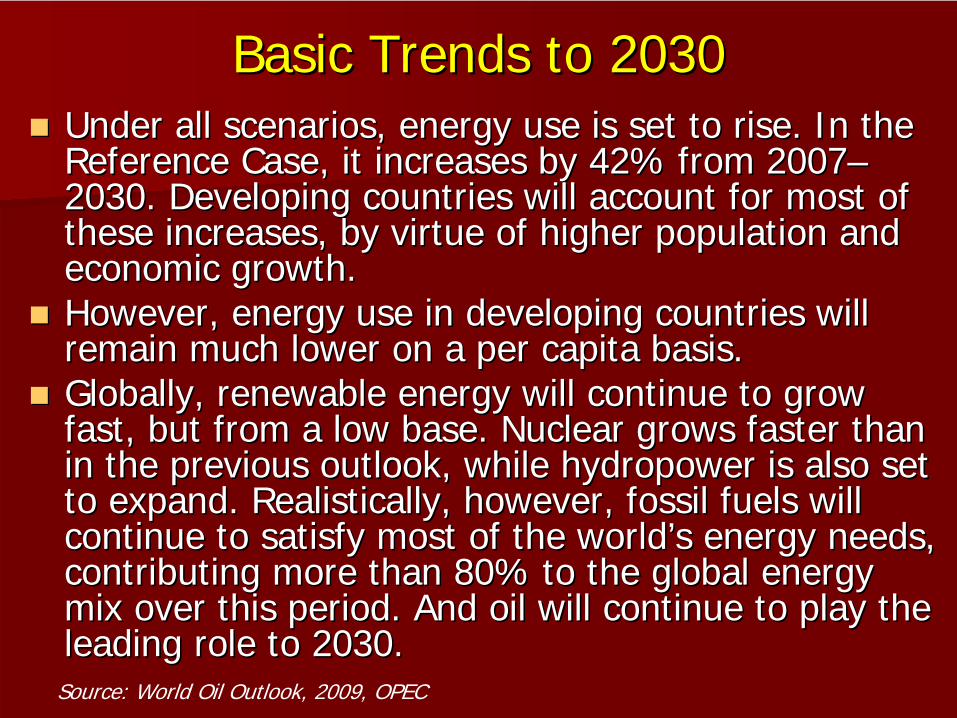
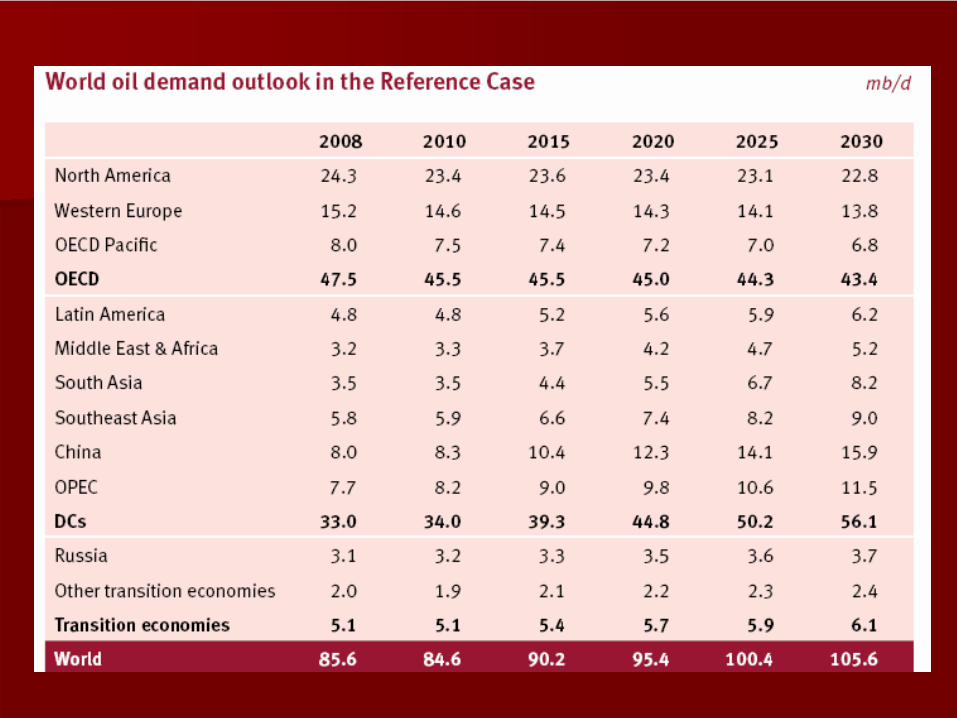
BasicBasic TrendsTrends toto 20302030Under all scenarios, energy use is set to rise. In the Under all scenarios, energy use is set to rise. In the Reference Case, it increases byReference Case, it increases by 42% from 200742% from 2007––2030. Developing countries will account for most of 2030. Developing countries will account for most of these increases,these increases, by virtue of higher population and by virtue of higher population and economic growtheconomic growth..However, energy use in developingHowever, energy use in developing countries will countries will remain much lower on a per capita basis. remain much lower on a per capita basis. Globally, renewableGlobally, renewable energy will continue to grow energy will continue to grow fast, but from a low base. Nuclear grows faster than fast, but from a low base. Nuclear grows faster than inin the previous outlook, while hydropower is also set the previous outlook, while hydropower is also set to expand. Realistically, however,to expand. Realistically, however, fossil fuels will fossil fuels will continue to satisfy most of the worldcontinue to satisfy most of the world’’s energy needs, s energy needs, contributing morecontributing more than 80% to the global energy than 80% to the global energy mix over this period. And oil will continue to play themix over this period. And oil will continue to play theleading role to 2030.leading role to 2030.
Source: World Oil Outlook, 2009, OPEC

WorldWorld
PrimaryPrimary
EnergyEnergy
ConsumptionConsumption((RefRef. Sen.). Sen.) ((byby SourcesSources (%),(%), millionmillion tonstons oiloil equivalentequivalent))
Oil
Coal
Gas
Biomass
NuclearHydro
Other renewables
Source: WEO 2008, IEA
Between 2006 and 2030, energy consumption will increase by 45%(yearly increase: 1.6 %); less than 2007 forecast by 0.2 %
% 26
% 29% 34
% 30
% 22
% 6 % 5
% 9.8% 10.1
% 20.5
% 2.2 % 2.4% 2.1

WorldWorld primaryprimary energyenergy supplysupply byby fuelfuel typetype
35%
28.5%
22.6% 31%
28.1%
24.1%
Source: OPEC, 2009Million tons oil equivalent

WorldWorld ((OilOil) ) ExplorationExploration++ProductionProduction CostsCosts ($/($/bblbbl))N. Sea9.85
Gulf
of Mexico9.0
Alaska8.0
Latin America(excl. Mex., Ven., Bras.)
5.52
Mexico9.5
Russia8.0
Kazakhistan6.0
Iran5.0
Iraq2.5
Algeria7.5
Angola11.5
Nigeria11.0
Canada
Oil
Sands8.41(?)
Indonesia10.5
S. Arabia4.0
West CanadaConventional: 9.0
East Canada10.0
Source: CERA, 2008TPAO, 2008
Brasil8.50
Venezuella4.23
(excl. Heavy
oil)Heavy
oil: 9.0
China
(land)8.90
China
(off-shore)11.80
Exploration, production, development
costs
are
included;Tax, royalty, other
state
revenues
are
excluded
23Libya6.5

Global Global OilOil
SupplySupply
CostsCosts
(CERA, 2008)(CERA, 2008) ((FindingFinding, , developmentdevelopment andand productionproduction))

ExplorationExploration andand productionproduction capacitiescapacities areare reachingreaching toto deeperdeeper zoneszones, , but but costscosts areare increasingincreasing
Source: OPEC, World Oil Outlook 2009
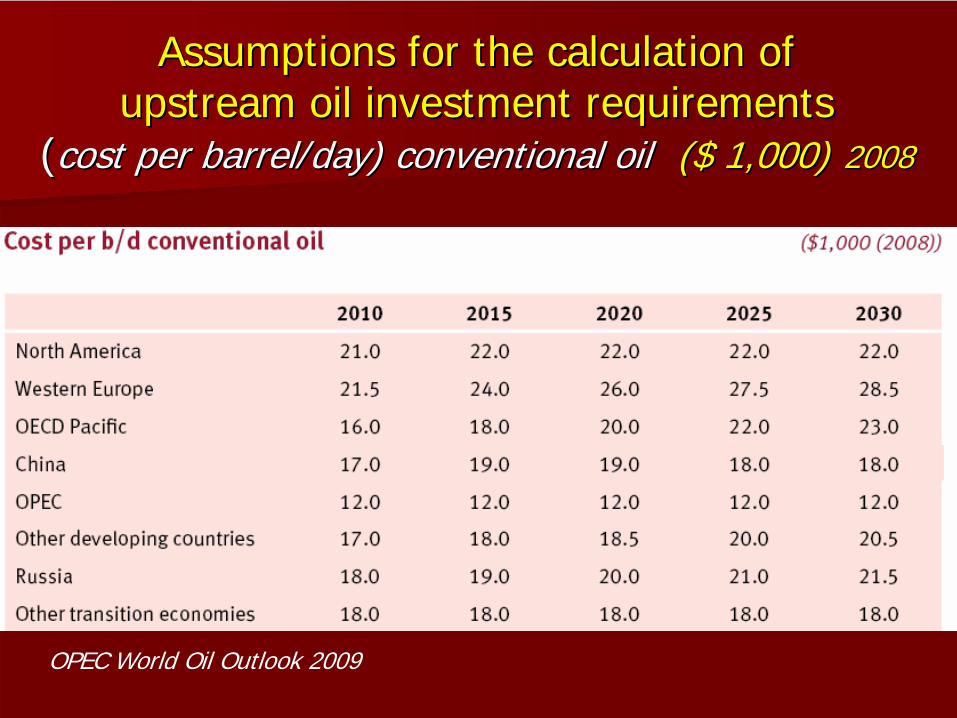
AssumptionsAssumptions forfor thethe calculationcalculation of of upstreamupstream oiloil investmentinvestment requirementsrequirements
((costcost perper barrelbarrel//dayday) ) conventionalconventional oiloil ($ 1,000)($ 1,000) 20082008
OPEC World Oil Outlook 2009
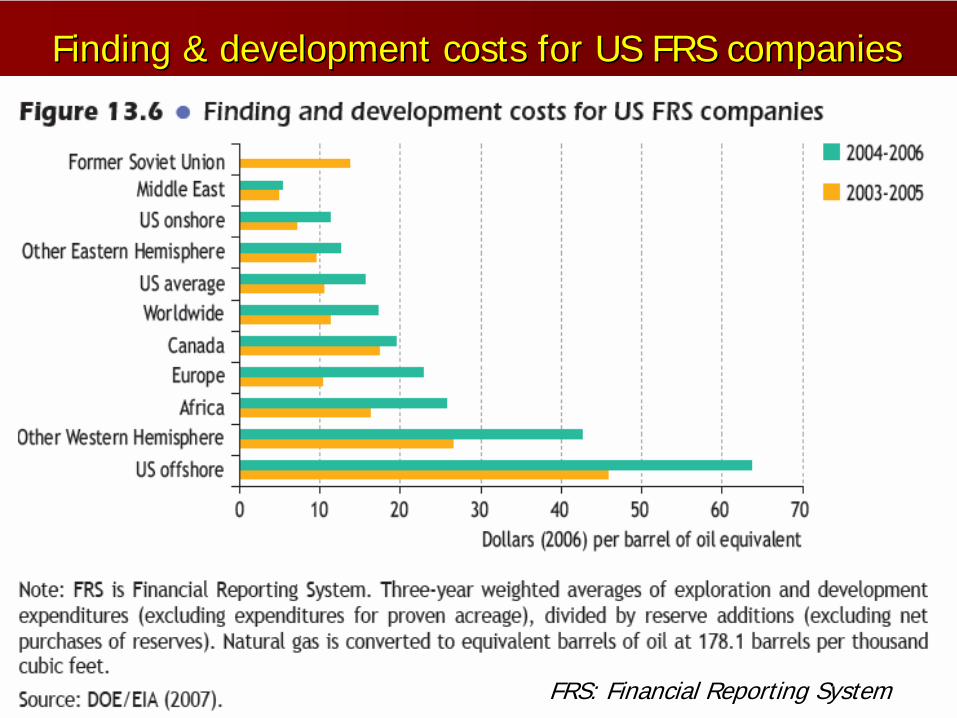
FindingFinding & & developmentdevelopment costscosts forfor US FRS US FRS companiescompanies
FRS: Financial Reporting System
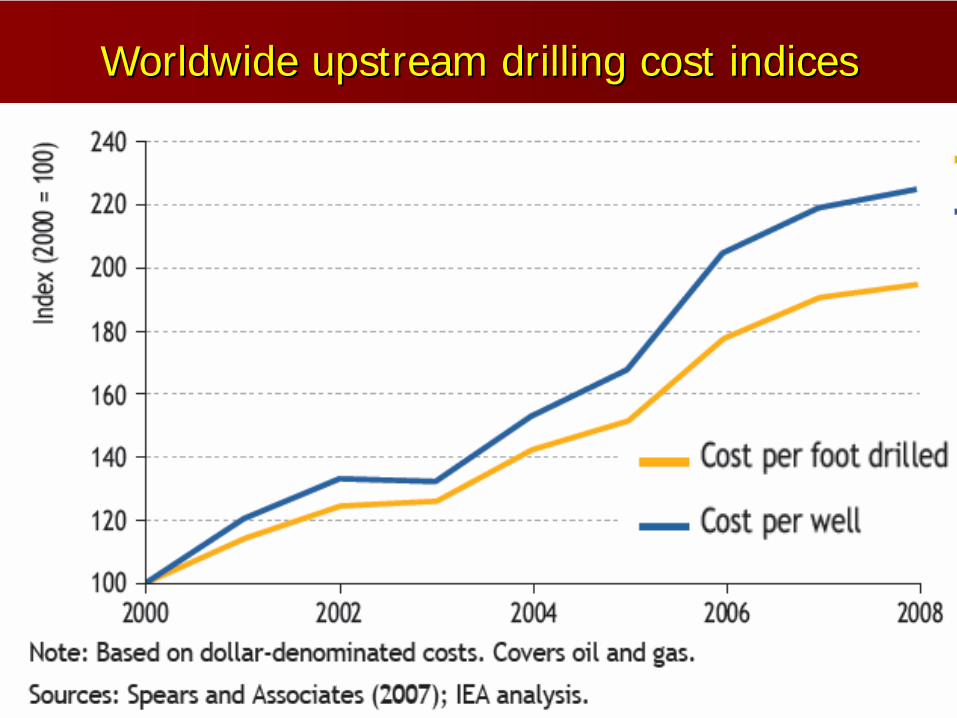
WorldwideWorldwide upstreamupstream drillingdrilling costcost indicesindices

Average capital cost of upstream projects Average capital cost of upstream projects under developmentunder development
WEO 2008, IEA
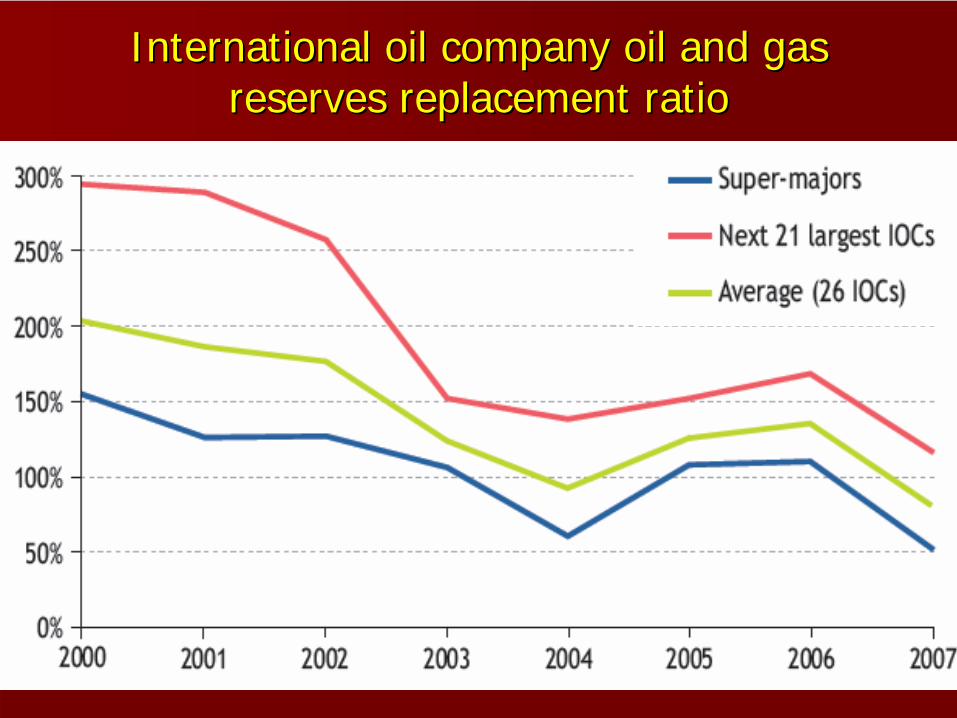
International oil company oil and gas International oil company oil and gas reserves replacementreserves replacement rratioatio

Cumulative upstream investment by region Cumulative upstream investment by region 20072007--2030 ($ billion in year2030 ($ billion in year--2007 dollars)2007 dollars)

TURNING OIL RESOURCES INTO RESERVES
-Are we going to run out of oil in 40 years time?
-How much oil is left to produce?

HighlightsHighlights (WEO 2008, IEA)(WEO 2008, IEA)
The world is far from running short of oil.Remaining proven reserves of oil and natural gasliquids (end of 2007): 1.2 to 1.3 trillion barrels(includes 0.2 trillion barrels of Canadian oil sands)These reserves have almost doubled since 1980.Ultimately recoverable conventional resources(includes initial proven and probable reserves fromdiscovered fields, reserves growth and economicallyrecoverable oil that has yet to be found) — amounts to3.5 trillion barrels (leaving aside about 0.5 trillionadditional barrels which might come from new sources not yet assessed and the application of new technologies)
HighlightsHighlightsOnly a third of this total has been produced up tonow.Undiscovered resources account for about a third of the remaining recoverable oil.The largest volumes of which are thought to lie in the Middle East, Russia and the Caspian regionFuture reserves growth will depend, to a largeextent, on increases in the recovery factor, which is estimated to average about 35% worldwide today. It will probably take much more than two decadesfor the average recovery factor worldwide to be raised from about 35% today to 50%. Achievingthis would boost world reserves by about 1.2 trillionbarrels — equal to the whole of today’s provenreserves

HighlightsHighlights
Such increases, through secondary andenhanced oil recovery (EOR) techniques andother factors, could make a big difference torecoverable reserves, prolonging theproduction life of producing fields andpostponing the peak of conventional oilproductionOne percentage point increase in the averagerecovery factor at existing fields alone wouldadd more than 80 billion barrels (two years of current consumption) or 6% to the world’sproven oil reserves.

HighlightsHighlights
Non-conventional oil resources are also large. Oil sands and extra-heavy oil resources in placeworldwide amount to around 6 trillion barrels, of which between 1 and 2 trillion barrels may be ultimately recoverable economically.These resources are largely concentrated in Canada(mainly in Alberta) and Venezuela (in the OrinocoBelt). There is additional potential from oil shales, but their production cost and the environmental impactof their commercialisation are very uncertain.
EmergingEmerging FuelsFuels
BiofuelsBiofuelsGasGas--toto--LiquidsLiquids (GTL)(GTL)HydrogenHydrogenFuelFuel CellsCellsCoalCoal toto LiquidsLiquids (CTL)(CTL)

LongLong termterm oiloil supplysupply costcost curvecurve
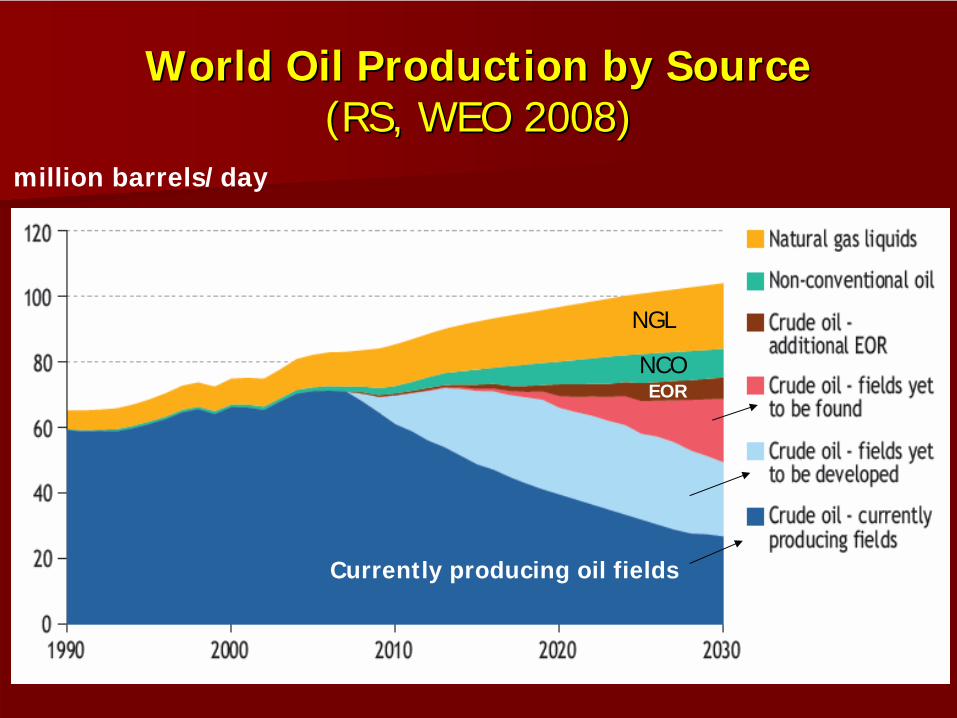
WorldWorld OilOil ProductionProduction byby SourceSource (RS, WEO 2008)(RS, WEO 2008)
million barrels/day
NGL
NCOEOR
Currently producing oil fields

OilOil PricesPrices andand ForecastsForecasts

AverageAverage IEA IEA crudecrude oiloil importimport priceprice dollarsdollars//barrelbarrel
WEO 2008, IEA

$0
$20
$40
$60
$80
$100
$120
$140
$160
$180
$200
1980 1990 2000 2010 2020 2030
2007
Dol
lars
per
Bar
rel
IEO2009 High
IEO2009 Low
IEO2009 Reference
The IEO, AEO includes three oil price cases
History
Projections
$130
$50
$200

ShortShort--Term Energy and Winter Fuels OutlookTerm Energy and Winter Fuels Outlook;; October 6, 2009 ReleaseOctober 6, 2009 Release (Next Update: November 10, 2009)(Next Update: November 10, 2009); EIA; EIA
59.90 72.42
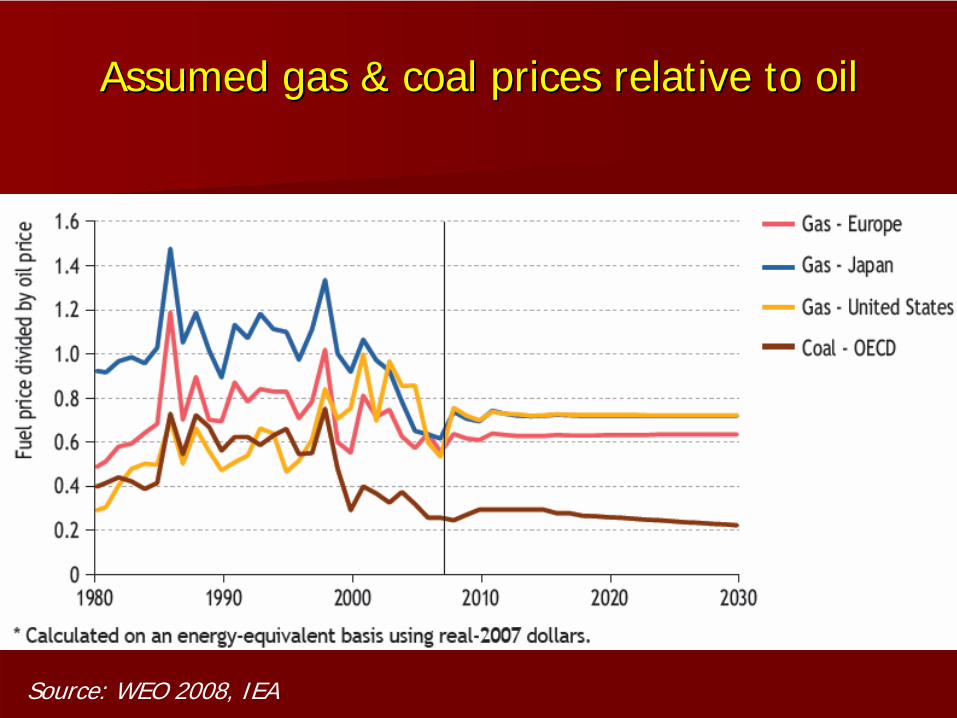
AssumedAssumed gasgas & & coalcoal pricesprices relativerelative toto oiloil
Source: WEO 2008, IEA

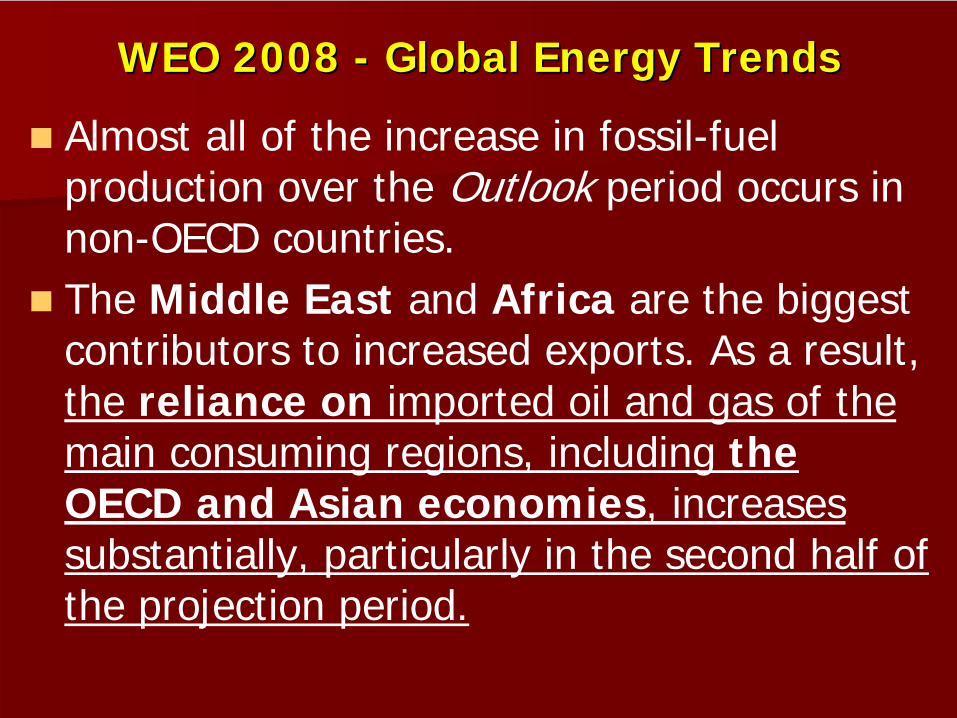
WEO 2008 WEO 2008 -- Global Global EnergyEnergy TrendsTrends
World energy useWorld energy use continues to increase continues to increase steadily in the Reference Scenario, but atsteadily in the Reference Scenario, but at a a slower rate than projected in WEOslower rate than projected in WEO--2007, 2007, mainly due to higher energy prices andmainly due to higher energy prices andslower economic growth. slower economic growth. Global Global primary energy demandprimary energy demand grows by grows by 1.6% per year1.6% per year on average in 2006on average in 2006--2030. 2030. OilOildemand increases progressively, though demand increases progressively, though more slowlymore slowly than in WEOthan in WEO--2007, particularly in 2007, particularly in the second half of the Outlook period.the second half of the Outlook period.

WEO 2008 WEO 2008 -- Global Global EnergyEnergy TrendsTrends
Fossil fuels account for 80%Fossil fuels account for 80% of the worldof the world’’s s primary energy mix in 2030 primary energy mix in 2030 —— downdown slightly on slightly on today. Oil remains the dominant fuel, though today. Oil remains the dominant fuel, though demand for coal risesdemand for coal rises more than demand for any more than demand for any other fuel in absolute terms. other fuel in absolute terms. The share of The share of natural gasnatural gas in total energy demand in total energy demand rises marginally, with most of the growth coming rises marginally, with most of the growth coming from thefrom the powerpower--generation sector. Coal continues to generation sector. Coal continues to account for about half of fuel needsaccount for about half of fuel needs for power for power generation. generation. The contribution of The contribution of nonnon--hydro hydro renewablesrenewables to to meetingmeeting primary energy needs inches up from 11% primary energy needs inches up from 11% now to 12% in 2030.now to 12% in 2030.

WEO 2008 WEO 2008 -- Global Global EnergyEnergy TrendsTrends
Due to strong economic growth, Due to strong economic growth, China and IndiaChina and Indiaaccount for 51% of incrementalaccount for 51% of incremental world primary world primary energy demand in 2006energy demand in 2006--2030. 2030. Middle EastMiddle East countries emerge as ancountries emerge as an important important demand centre. demand centre. Of the global increase in oil demand, 43% comes Of the global increase in oil demand, 43% comes fromfrom ChinaChina, 20% from the Middle East and 19% , 20% from the Middle East and 19% from from IndiaIndia. Over a quarter of the growth. Over a quarter of the growth in world in world gas demand comes from the gas demand comes from the Middle EastMiddle East. . NonNon--OECD OECD countries accountcountries account for 87% of the for 87% of the increase in global demand between 2006 and 2030. increase in global demand between 2006 and 2030. As a result,As a result, their share of world primary energy their share of world primary energy demand rises from 51% to 62%.demand rises from 51% to 62%.

WorldWorld primaryprimary energyenergy demanddemand byby regionregion millionmillion tonstons oiloil equivalentequivalent
China & India
Rest of non-OECD
OECD Totalnon-OECD
WEO 2008, IEA

WEO 2008 WEO 2008 -- Global Global EnergyEnergy TrendsTrends
IndustryIndustry overtakes overtakes transport transport before 2010 before 2010 to become the secondto become the second--largestlargest final energyfinal energy--consuming sector, after the combined consuming sector, after the combined residential, services andresidential, services and agricultural sector.agricultural sector.Among all final energy forms, Among all final energy forms, electricityelectricityconsumption growsconsumption grows fastest, nearly doubling fastest, nearly doubling in 2006in 2006--2030, boosting its share in total final 2030, boosting its share in total final energyenergy consumption from 17% to 21%. consumption from 17% to 21%. Oil Oil remains the single largest endremains the single largest end--use fuel, use fuel, thoughthough its share drops from 43% in 2006 to its share drops from 43% in 2006 to 40% in 2030.40% in 2030.
WEO 2008 WEO 2008 -- Global Global EnergyEnergy TrendsTrends
Almost all of the increase in fossil-fuel production over the Outlook period occurs in non-OECD countries. The Middle East and Africa are the biggest contributors to increased exports. As a result, the reliance on imported oil and gas of themain consuming regions, including the OECD and Asian economies, increasessubstantially, particularly in the second half of the projection period.
WEO 2008 WEO 2008 -- Global Global EnergyEnergy TrendsTrends
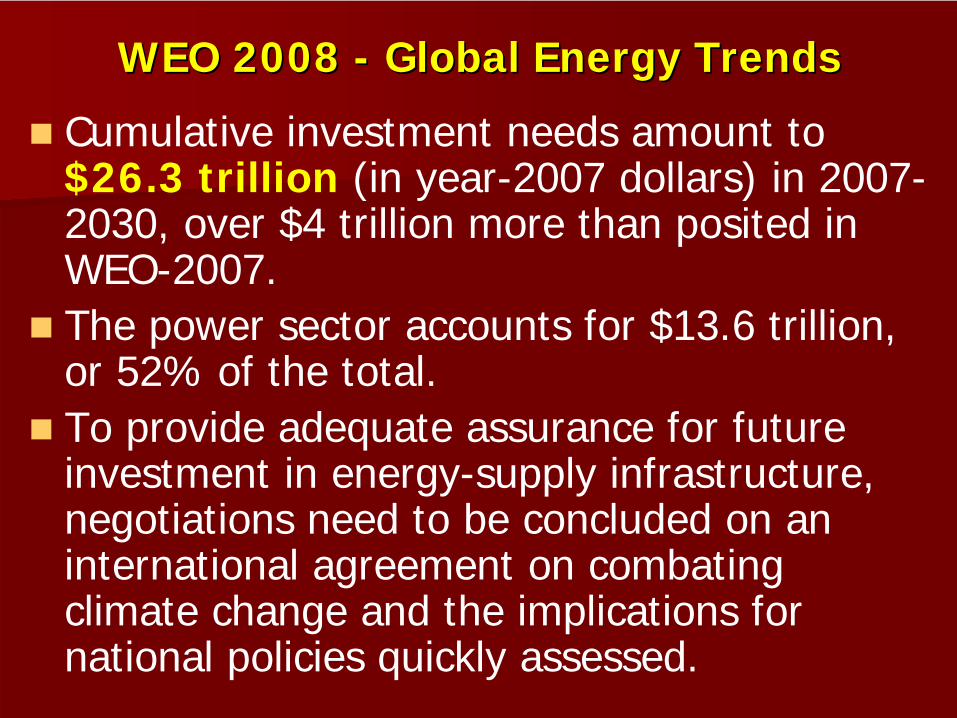
Cumulative investment needs amount to $26.3 trillion (in year-2007 dollars) in 2007-2030, over $4 trillion more than posited in WEO-2007. The power sector accounts for $13.6 trillion, or 52% of the total. To provide adequate assurance for future investment in energy-supply infrastructure, negotiations need to be concluded on an international agreement on combating climate change and the implications for national policies quickly assessed.

Power52 %
$13.6 trillion
Oil24 %$6.3
trillion
Gas21 %$5.5
trillion
Total Investment Requirement: $ 26 trillion

OIL MARKET OUTLOOK (WEO 2008)
Global primary demand for oil (excluding Global primary demand for oil (excluding biofuelsbiofuels) ) (RS)(RS) risesrises by 1% per year on by 1% per year on average, from 85 million barrels per day in average, from 85 million barrels per day in 2007 to 106 2007 to 106 mb/dmb/d inin 2030. 2030. This is a significant downward revision from This is a significant downward revision from last yearlast year’’s Outlook, reflectings Outlook, reflecting mainly the mainly the impact of much higher prices and slightly impact of much higher prices and slightly slower GDP growth.slower GDP growth.New government policies introduced in the New government policies introduced in the past year also contribute to lowerpast year also contribute to lower demand.demand.

OIL MARKET OUTLOOK (WEO 2008)All the increase in world oil demand comes All the increase in world oil demand comes from nonfrom non--OECD countries. India seesOECD countries. India sees the the fastest growth, averaging 3.9% per year fastest growth, averaging 3.9% per year over the Outlook period, followed byover the Outlook period, followed by China, China, at 3.5%. at 3.5%. Other emerging Asian economies and the Other emerging Asian economies and the Middle East alsoMiddle East also see rapid growth. By see rapid growth. By contrast, demand in all three OECD regions contrast, demand in all three OECD regions falls, due largelyfalls, due largely to declining nonto declining non--transport transport demand. As a result of these trends, the demand. As a result of these trends, the share of OECDshare of OECD countries in global oil demand countries in global oil demand drops from 57% in 2007 to 43% in 2030.drops from 57% in 2007 to 43% in 2030.

OilOil useuse ((barrelsbarrels)) perper capitacapita in 2030in 2030

TheThe OilOil DemandDemand OutlookOutlook
http://www.inkcinct.com.au/Web/CARTOONS/2006/2006-484-world-oil-demand.jpg

OilOil DemandDemand,, ReferenceReference CasesCases, , OPEC OPEC –– IEA IEA -- EIAEIA
millionmillion barrelsbarrels//dayday
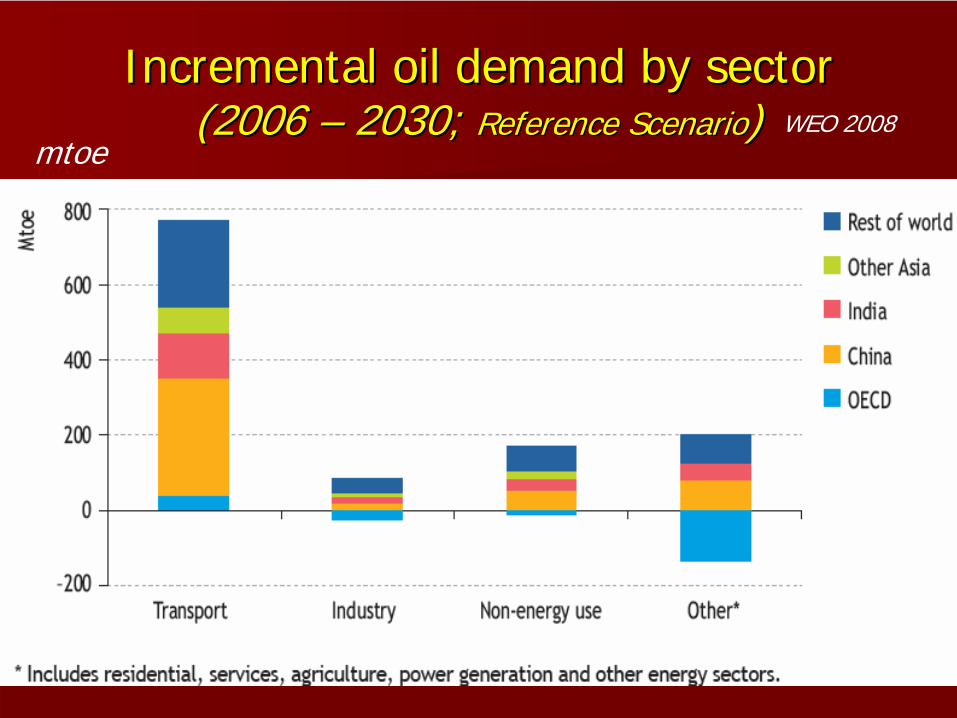
IncrementalIncremental oiloil demanddemand byby sectorsector (2006 (2006 –– 2030; 2030; ReferenceReference ScenarioScenario))
mtoeWEO 2008
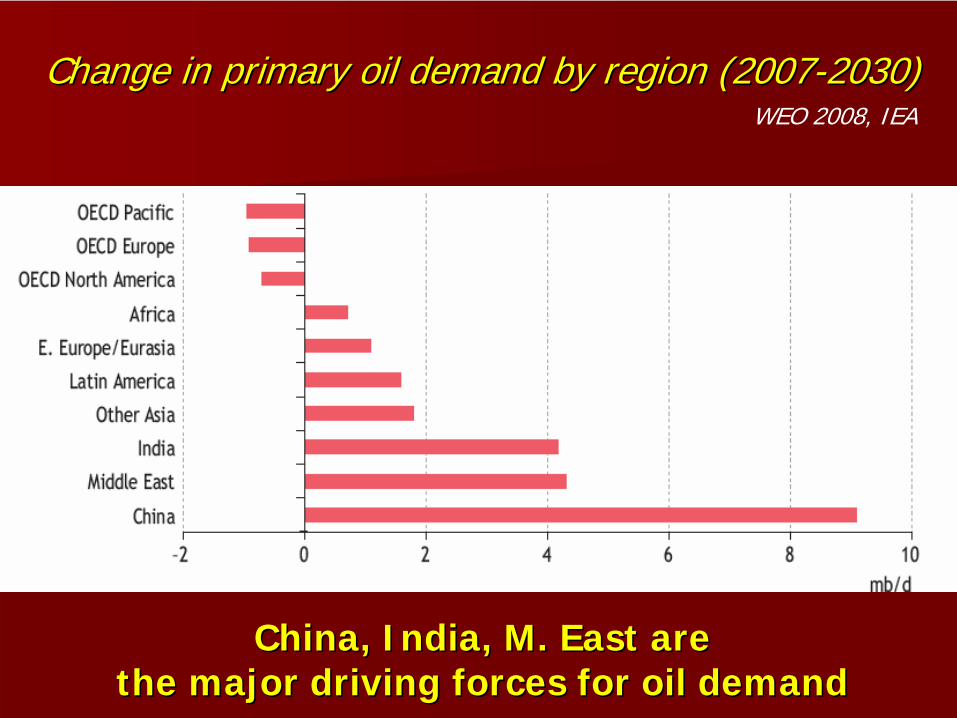
ChangeChange in in primaryprimary oiloil demanddemand byby regionregion (2007(2007--2030)2030)
ChinaChina, , IndiaIndia, M. East , M. East arearethethe majormajor drivingdriving forcesforces forfor oiloil demanddemand
WEO 2008, IEA
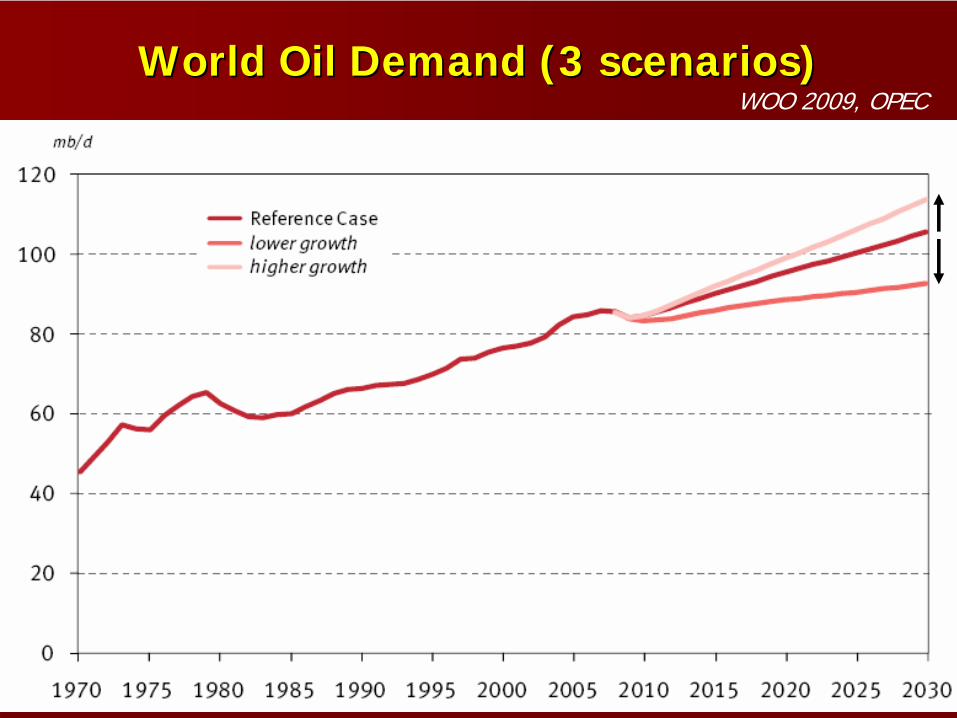
WorldWorld OilOil DemandDemand (3 (3 scenariosscenarios))WOO 2009, OPEC
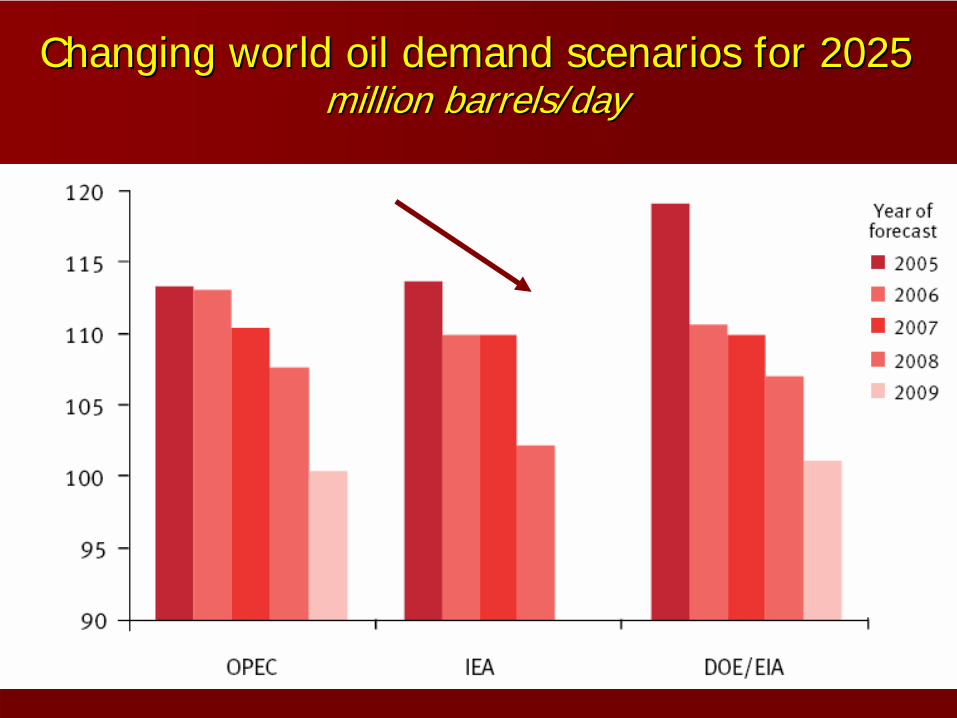
ChangingChanging worldworld oiloil demanddemand scenariosscenarios forfor 20252025 millionmillion barrelsbarrels//dayday

BasicBasic TrendsTrends –– OilOil MarketMarketThe medium-term prospects for oil demand are adversely impacted by the lower economic growth assumptions. OECD oil demand falls from 47.5 mb/din 2008 to 45.5 mb/d by 2010, and remains at that level to 2013. The main source of incremental oil demand will be developing countries. However, given the anticipatedslow recovery, the annual increments in demand for 2010 and 2011 are below that of 2012, once economic growth is assumed to return to its trend potential. This, in total, represents a major reassessment from the previous reference case. By 2013, oil demand is 5.7 mb/d lower than in last year’s outlook, with a difference of more than 4 mb/d already witnessed in 2009.

OIL MARKET OUTLOOK (WEO 2008)
These oilThese oil--demand projections, combined with demand projections, combined with IEA IEA oiloil--price assumptions, point toprice assumptions, point to persistently high persistently high levels of spending on oil in both OECD and nonlevels of spending on oil in both OECD and non--OECD countries.OECD countries.As a share of world GDP at market exchange rates, As a share of world GDP at market exchange rates, oil spending soared fromoil spending soared from a little over 1% in 1999 to a little over 1% in 1999 to around 4% in 2007, with serious implications foraround 4% in 2007, with serious implications forthe economies of consuming countries. the economies of consuming countries. That share is projected to That share is projected to stabilisestabilise atat around 5% around 5% over much of the Outlook period. For nonover much of the Outlook period. For non--OECD OECD countries, the sharecountries, the share averages 6% to 7%.averages 6% to 7%.

OIL MARKET OUTLOOK (WEO 2008)
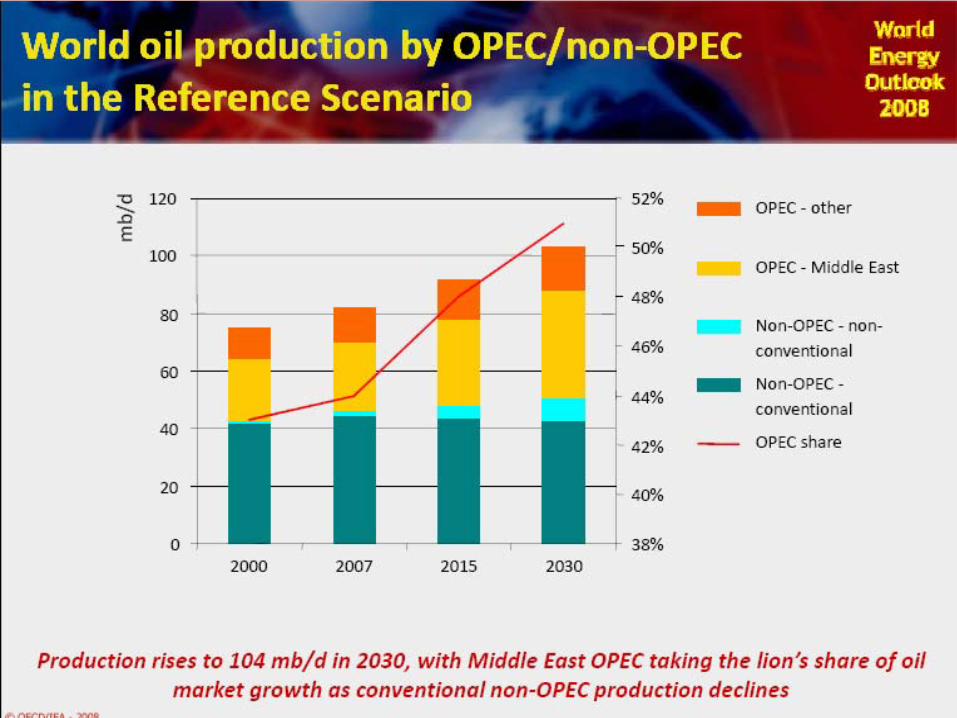
Most of the projected increase in world oil supply Most of the projected increase in world oil supply comes from comes from OPEC countriesOPEC countries,, which hold the majority which hold the majority of the worldof the world’’s remaining reserves of conventional oil.s remaining reserves of conventional oil.Their share of global output rises Their share of global output rises from 44% in 2007 from 44% in 2007 to 51% in 2030to 51% in 2030. . Although global oil production is not expected to Although global oil production is not expected to peak before 2030, output ofpeak before 2030, output of conventional crude oil conventional crude oil and natural gas liquids levels off towards the end of and natural gas liquids levels off towards the end of thethe projection period. projection period. NonNon--conventional oil production, mainly from oil conventional oil production, mainly from oil sands insands in Canada, continues to grow steadily, keeping Canada, continues to grow steadily, keeping total nontotal non--OPEC output broadly flatOPEC output broadly flat over the second over the second half of the projection period.half of the projection period.


OilOil demanddemand, , longlong termterm
Efficiency improvements are greater thanpreviously estimated, and this, together with thedownward revision to the medium-termexpectations due to the current global recession, has led to a significant downward revision for oildemand in the longer term. Oil demand in the Reference Case rises by 20 mb/d from 2008–2030, when it reaches almost 106 mb/d. This is down from an estimated figure of 113.3 mb/d in the WOO 2008.

OilOil SupplySupply OutlookOutlook

WorldWorld OilOil ProductionProduction andand SupplySupply (RS, WEO 2008), (RS, WEO 2008), millionmillion barrelsbarrels perper dayday

OilOil SupplySupply,, ReferenceReference CasesCases, , OPEC OPEC –– IEA IEA -- EIAEIA
millionmillion barrelsbarrels//dayday

World oil supply outlook in the Ref. Case (OPEC)
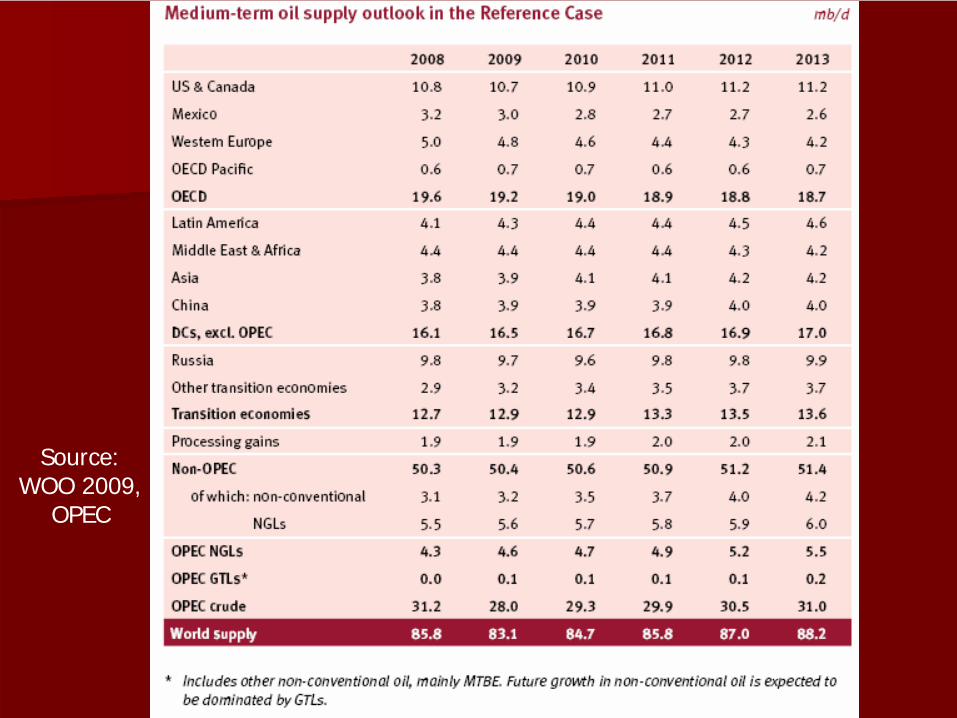
Source:WOO 2009,
OPEC

WorldWorld oiloil supplysupply toto 2030:2030: ConventionalConventional andand otherother sourcessources ((mbmb/d)/d)
WOO 2009, OPEC

WorldWorld OilOil ProductionProduction byby SourceSource (RS, WEO 2008)(RS, WEO 2008)
million barrels/day
NGL
NCOEOR
Currently producing oil fields
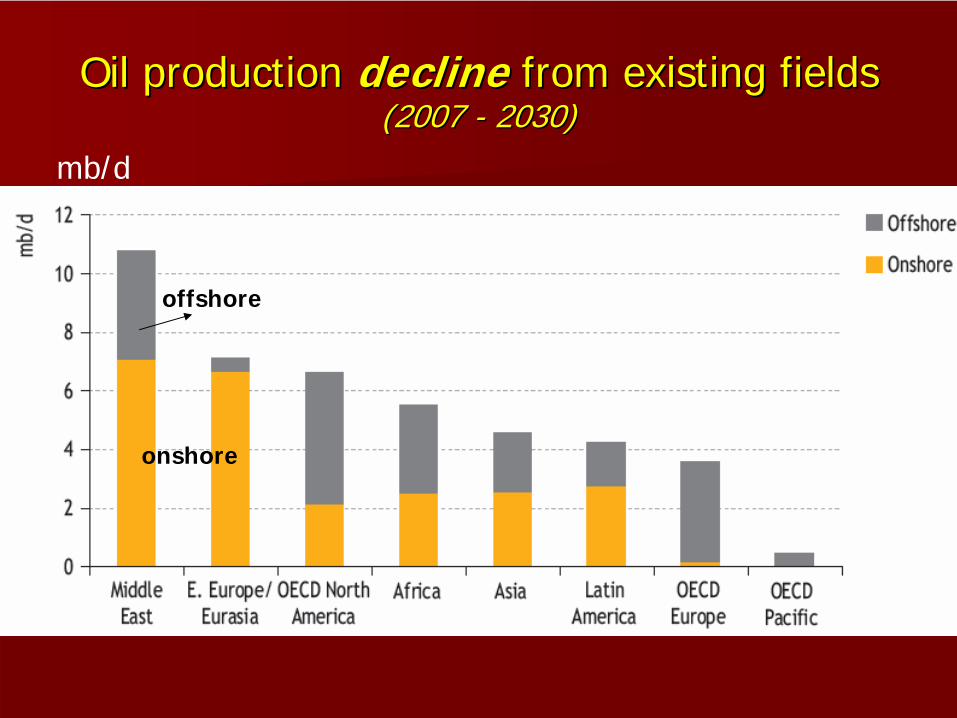
OilOil productionproduction declinedecline fromfrom existingexisting fieldsfields (2007 (2007 -- 2030)2030)
mb/d
offshore
onshore
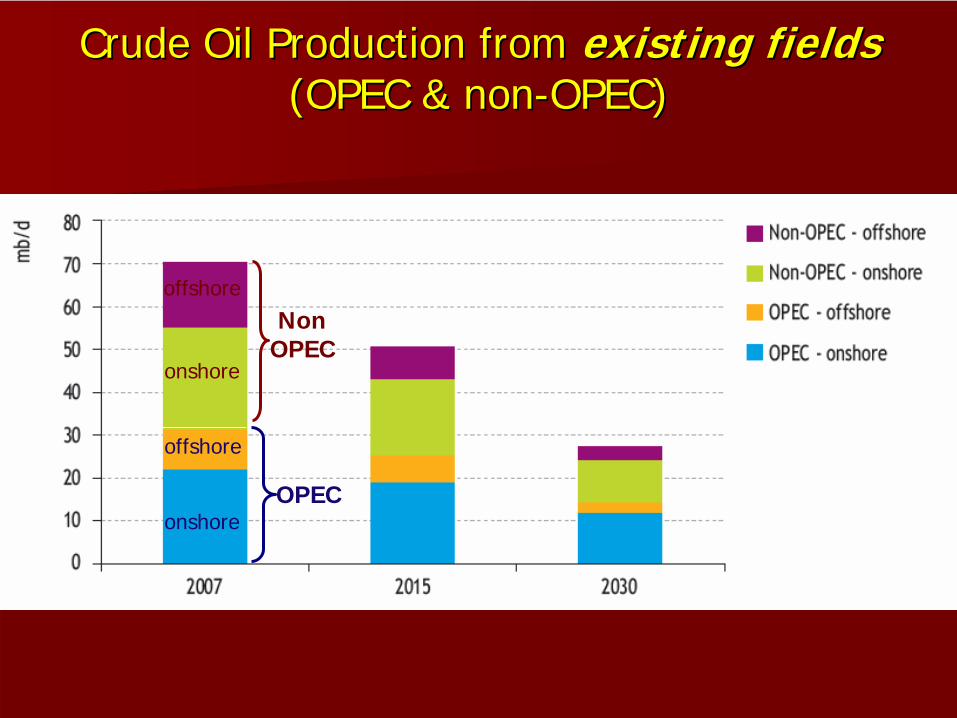
CrudeCrude OilOil ProductionProduction fromfrom existingexisting fieldsfields (OPEC & (OPEC & nonnon--OPEC)OPEC)
OPEC
NonOPEC
onshore
onshore
offshore
offshore
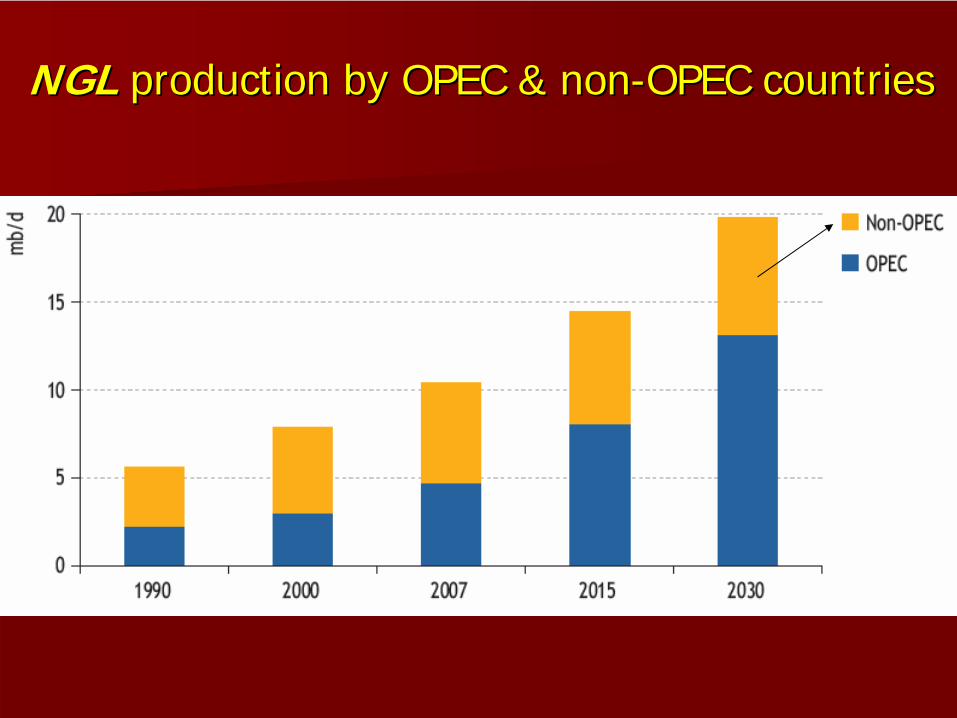
NGLNGL productionproduction byby OPEC & OPEC & nonnon--OPEC OPEC countriescountries
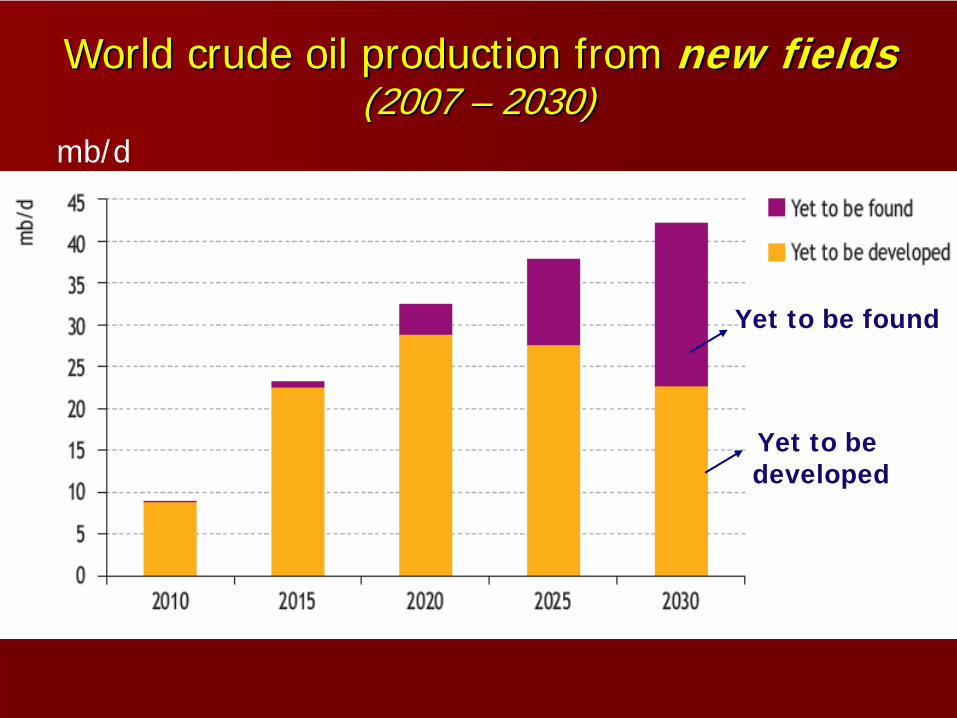
WorldWorld crudecrude oiloil productionproduction fromfrom newnew fieldsfields (2007 (2007 –– 2030)2030)
mb/d
Yet to be found
Yet to be developed

NumberNumber of of yetyet--toto--bebe--developeddeveloped oilfieldsoilfields byby regionregion//locationlocation ((endend 2007)2007) WEO 2008WEO 2008
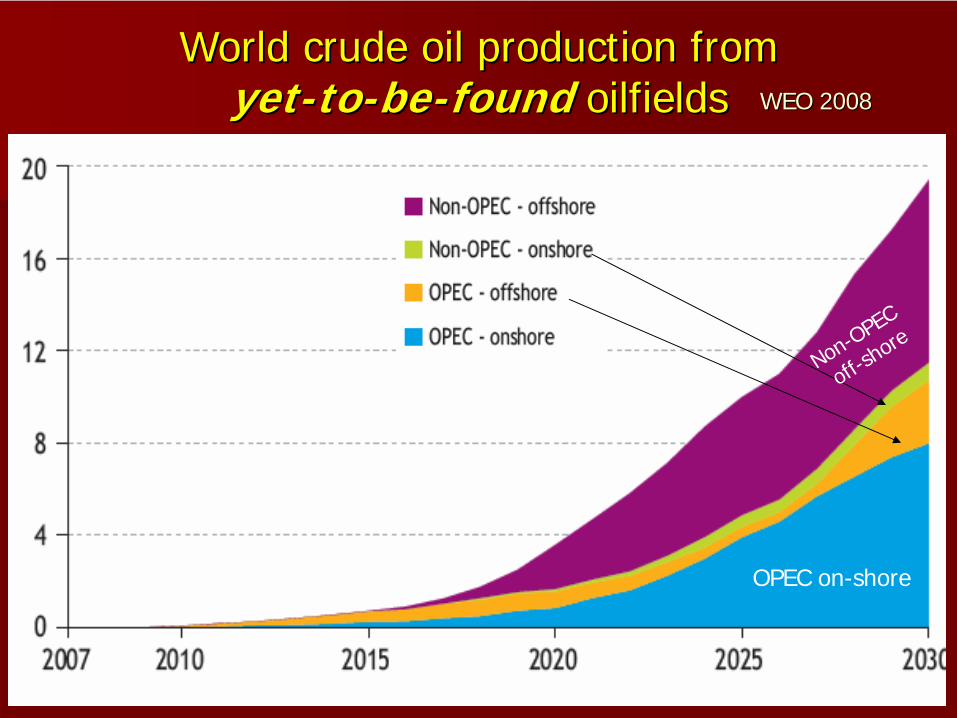
WorldWorld crudecrude oiloil productionproduction fromfrom yetyet--toto--bebe--foundfound oilfieldsoilfields
OPEC on-shore
Non-OPEC
off-sh
ore
WEO 2008WEO 2008

EOREOR productionproduction byby countrycountry
million barrels/dayWEO 2008WEO 2008
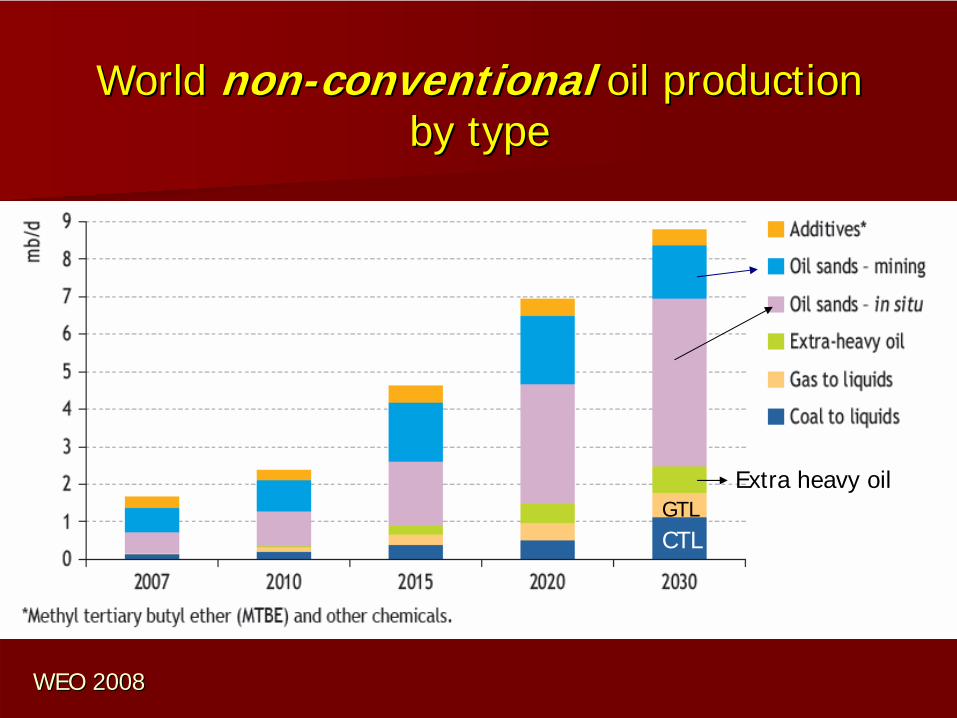
WorldWorld nonnon--conventionalconventional oiloil productionproduction byby typetype
CTLGTL
Extra heavy oil
WEO 2008WEO 2008

World oil and gas production World oil and gas production by type of companyby type of company
million barrels/day billion cubic meters
NOCNOC
WEO 2008, IEA
RisingRising costscostsOil services and commodities costs, the pace of investment, as well as currency exchange rates andthe availability of skilled labour for construction andoperations are principally cyclical. Structural changes come from the continued movetoward deeper water, deeper wells and harsherenvironments, coupled with smaller discoveries andmore stringent health, safety and environmentregulations. It should be noted, however, that the unit costs of equipment and services tend to decline as a resultof economies of scale, technology deployment anddiffusion, and the sharing of best practices.
Source: OPEC World Oil Outlook 2009
RisingRising CostsCostsThe average worldwide unit capital cost of addingone new barrel of oil or gas had more than doubledsince 2000, due on the whole to higher finding anddevelopment costs. The oil industry witnesses huge increases in thecost of raw materials, as well as in all segments of petroleum services. Moreover, the cost to find and develop themarginal barrel had almost tripled. It should be noted that the oil sands projects and some of thedeep and ultra deepwater projects are stillconsidered to be the industry’s benchmark formarginal costs.
Source: OPEC World Oil Outlook 2009

TheThe impactimpact of of risingrising costscosts
In the current low oil price environment, set alongside the ongoing global economic crisisand the recently observed low earnings of many companies in the industry, the abilityto finance new projects has become moredifficult. This has led to a slowing down in the pace of investment in new upstream projects, and in some instances, project cancellations anddelays.

UpstreamUpstream oiloil andand gasgas investmentinvestment of 50 of 50 companiescompanies ((surveyedsurveyed))
Potential barriers to upstream investmentPotential barriers to upstream investment
Up to 2012, the total amount of investment to be made in upstream oil and gas facilities is knownwith a reasonable degree of confidence.However, beyond the next 5 years or so, there is considerable uncertainty about the prospects forupstream investment, costs and, therefore, therate of capacity additions. Few investment decisions that will determinecapacity additions after 2012 have yet been taken, with the exception of some very large projects, such as the Kashagan development in Kazakhstan(where production is now expected to start up onlyin 2014 at the earliest, peaking later at around 0.8 mb/d).

Host government policies, including licensing andfiscal arrangements, could shift and the overallinvestment and business climate may deteriorate, making upstream investments riskier and lessattractive. Uncertainty about future climate-change and otherenvironmental policies adds to investment risk.Not all of the uncertainties are on the down-side: in the longer term, technological advances, lowerinput prices and a more favourable policyenvironment could open up new opportunities forinvestment and help lower costs.
OIL MARKET OUTLOOK Inter-regional Trade (WEO 2008)
The volume of The volume of interinter--regional oil traderegional oil trade increases by a increases by a third between 2007 andthird between 2007 and 2030. The Middle East, 2030. The Middle East, already the biggest exporting region, sees its net already the biggest exporting region, sees its net exportsexports rise most. rise most. OECD Europe and Asia become even more OECD Europe and Asia become even more dependent on imports overdependent on imports over the projection periodthe projection period, but , but net imports drop in North America and in OECD net imports drop in North America and in OECD Pacific.Pacific.Though Though increased trade consolidates mutual increased trade consolidates mutual dependence, it also enhances thedependence, it also enhances the risk of shortrisk of short--term term supply interruptions,supply interruptions, particularly as much of the particularly as much of the additional oiladditional oil imports will have to come from the imports will have to come from the Middle East and transit vulnerable maritimeMiddle East and transit vulnerable maritime routes.routes.
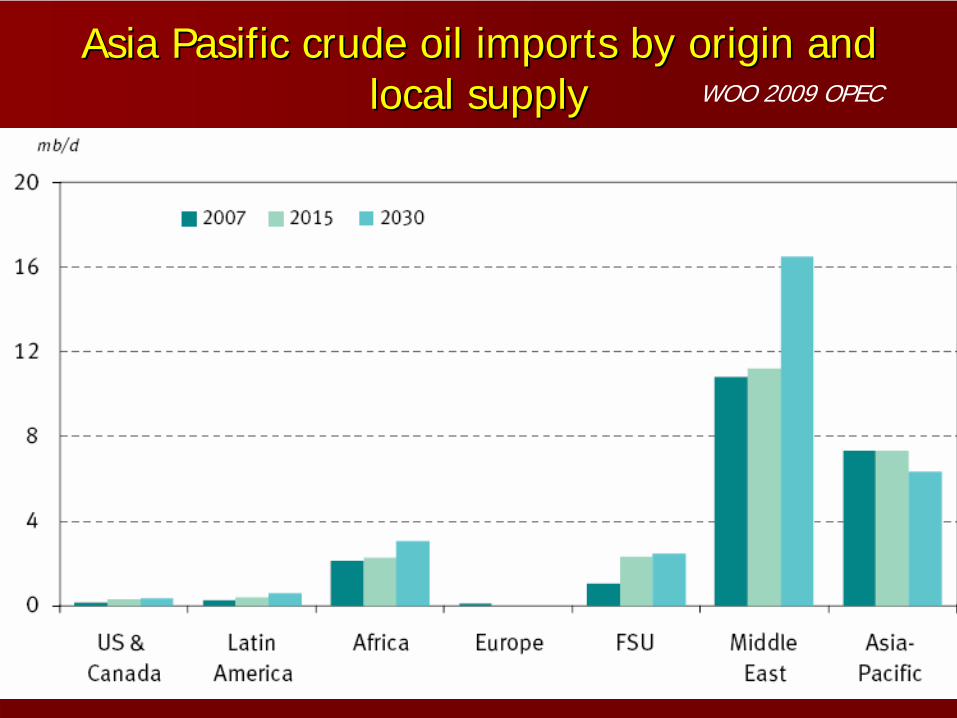
AsiaAsia PasificPasific crudecrude oiloil importsimports byby originorigin andand locallocal supplysupply WOO 2009 OPEC

DestinationDestination of M. East of M. East crudecrude oiloil exportsexports andand locallocal supplysupply, 2007 , 2007 -- 20302030
WOO 2009, OPEC

InterInter--Regional Trade in World FossilRegional Trade in World Fossil--Fuel SupplyFuel Supply
Energy trade between regions more than doubles by 2030, most of it still in the form of oil
0
1 000
2 000
3 000
4 000
5 000
6 000
Mto
e
2002 2030 2002 2030 2002 2030
Domestic consumption Traded between regionsOil CoalGas
14%
15%46%
63%
15%
26%
Trade as % of world demand
0
1 000
2 000
3 000
4 000
5 000
6 000
Mill
ion
tons
oile
quiv
alen
t
2002 2030 2002 2030 2002 2030
Domestic
consumption Traded
between
regionsOil CoalGas
14%
15%46%
63%
15%
26%
Trade
as % of world
demand

Major Net InterMajor Net Inter--Regional Oil Trade FlowsRegional Oil Trade Flows
Inter-regional oil trade doubles by 2030, with most of the additional exports coming from the Middle East
Source: IEA, 2005

Net Net interinter--regionalregional oiloil tradetrade (RS)(RS) millionmillion barrelsbarrels perper dayday
WEO 2008

OilOil exportexport flowsflows fromfrom thethe M. EastM. East WEO 2008
%
%
%
%
Oil flowmb/d
Oil flowmb/d
Share ofworld oil demand

Oil Flows & Major Chokepoints: The Oil Flows & Major Chokepoints: The ““Dire StraitsDire Straits””
The risk of an oil-supply disruption will grow as trade and flows through key maritime and pipeline chokepoints expand

InterInter--regionalregional crudecrude oiloil andand productsproducts exportsexports 2007 2007 -- 20302030
WOO 2009, OPEC

OPECOPEC’’ss shareshare increasesincreases fromfrom 44% 44% toto 50%50% andand M. East OPEC M. East OPEC fromfrom 29% 29% toto 36% 36%
betweenbetween 2007 2007 andand 20302030
OPEC
Million barrels/day
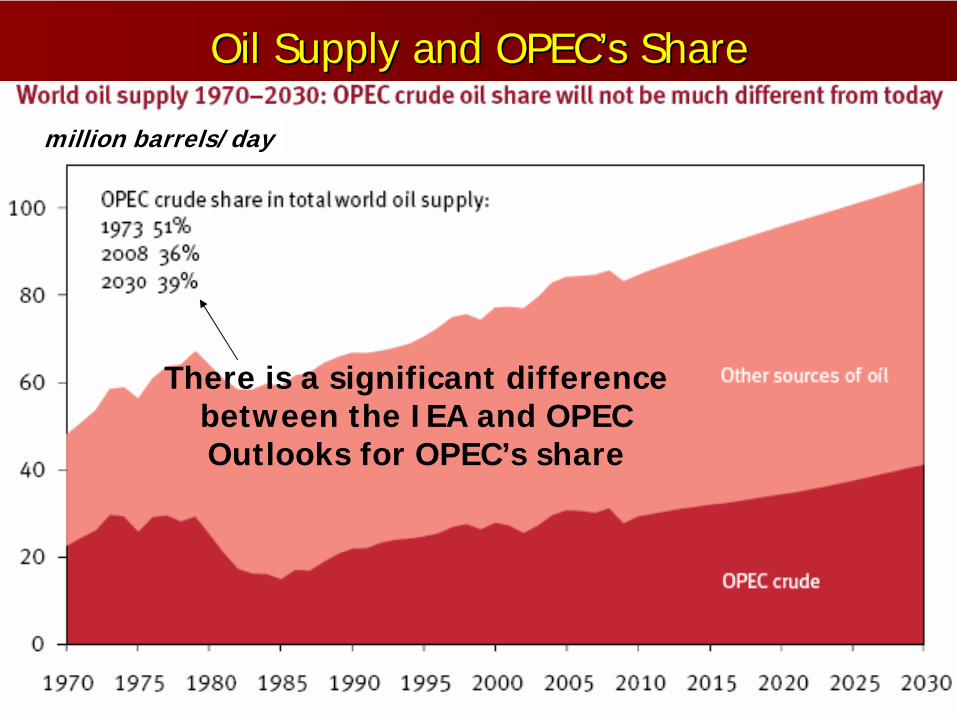
OilOil SupplySupply andand OPECOPEC’’ss ShareShare
million barrels/day
There is a significant differencebetween the IEA and OPECOutlooks for OPEC’s share

OPEC OPEC crudecrude capacitycapacity andand supplysupply in in thethe mediummedium--termterm ((millionmillion barrelsbarrels//dayday))
Supply
Source: OPEC WOO 2009

InterInter--regionalregional gasgas tradetrade (2006 (2006 –– 2030), 2030), bcmbcm/y/y
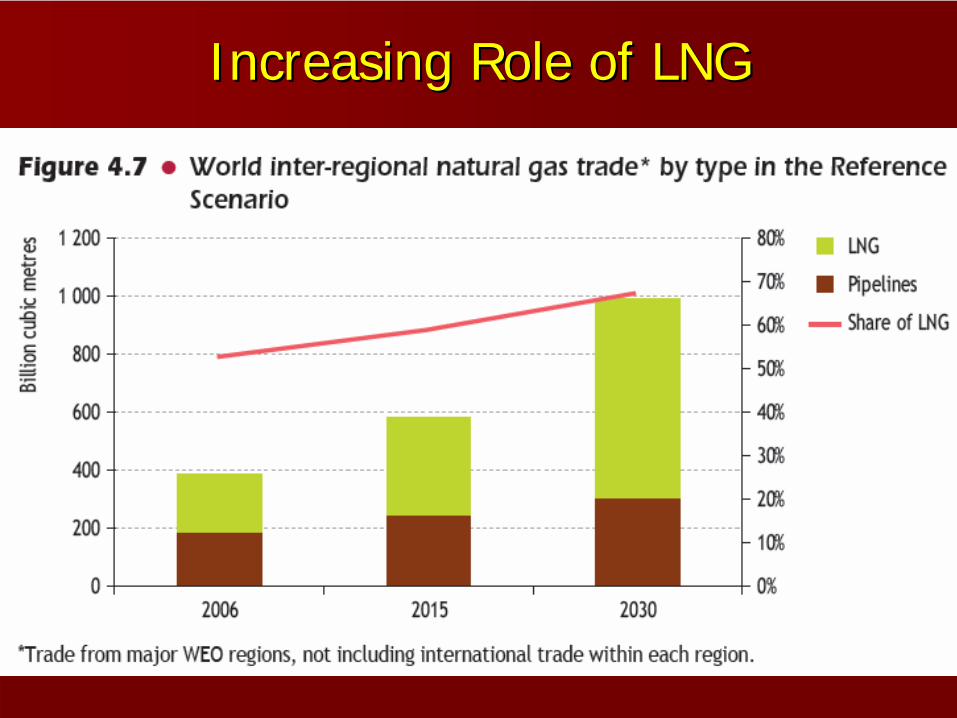
IncreasingIncreasing Role of LNGRole of LNG

NATURAL GAS MARKET OUTLOOKNATURAL GAS MARKET OUTLOOK
World primary demand for natural gas expands by World primary demand for natural gas expands by just over half between 2006just over half between 2006 and 2030 in the Rand 2030 in the RSS to to 4.4 trillion cubic 4.4 trillion cubic metresmetres, a rate of increase, a rate of increase of 1.8% of 1.8% per year. per year. The share of gas in total world primary energy The share of gas in total world primary energy demand increasesdemand increases marginally, from 21% in 2006 to marginally, from 21% in 2006 to 22% in 2030. 22% in 2030. More than threehree--quarters in total quarters in total ——comes from noncomes from non--OECD regions, especially those OECD regions, especially those thatthat are well endowed with gas resources. are well endowed with gas resources. Gas demand is projected to grow most inGas demand is projected to grow most in absolute absolute terms in the Middle East. The pace of demand terms in the Middle East. The pace of demand growth is fastest in China.growth is fastest in China. Despite their much less Despite their much less rapid economic growth, North America and Europe rapid economic growth, North America and Europe stillstill contribute a fifth of the global increase in gas contribute a fifth of the global increase in gas demand.demand.
NATURAL GAS MARKET OUTLOOKNATURAL GAS MARKET OUTLOOK
Gas resources are sufficient to meet the projected Gas resources are sufficient to meet the projected increase in global demand, butincrease in global demand, but production is set to production is set to become much more concentrated in the most become much more concentrated in the most resourceresource--richrich regions. regions. Some 46% of the projected growth in world gas Some 46% of the projected growth in world gas production in 2006production in 2006--20302030 comes from the Middle comes from the Middle East, its output tripling to around 1 East, its output tripling to around 1 tcmtcm by 2030. by 2030. About 60% ofAbout 60% of the regionthe region’’s incremental output is s incremental output is consumed locally, mainly in power stations. consumed locally, mainly in power stations. MostMost of the remaining increase in world output is of the remaining increase in world output is provided by Africa and Eastern Europeprovided by Africa and Eastern Europe and Eurasia and Eurasia (mainly Russia). These capacity expansions hinge (mainly Russia). These capacity expansions hinge on timely investment.on timely investment.
NATURAL GAS MARKET OUTLOOKNATURAL GAS MARKET OUTLOOK
InterInter--regional natural gas trade is projected regional natural gas trade is projected to more than double over theto more than double over the projection projection period, from 441 billion cubic period, from 441 billion cubic metresmetres in 2006 in 2006 to just over 1 to just over 1 tcmtcm inin 2030. 2030. Imports rise in all the regions except nonImports rise in all the regions except non--Russia Eurasia that are currentlyRussia Eurasia that are currently net net importers of gas, both in volume and as a importers of gas, both in volume and as a share of their total gas consumption.share of their total gas consumption.The The EUEU sees the biggest increase in import sees the biggest increase in import volumes.volumes.

NATURAL GAS MARKET OUTLOOKNATURAL GAS MARKET OUTLOOK
Most of the growth in gas exports over 2006-2030 comes from the Middle East and Africa. Together, they account for about 60% of total exports in 2030. Russia and the Caspian/Central Asian countriescombined remain the other main exporting region. Most of the increase in inter-regional trade is in the form of liquefied natural gas, its share of trade rising from 52% in 2006 to 69% in 2030. Liquefaction capacity is set to expand markedly through to early in the 2010s, but a shortage could emerge thereafter if a wave of new investment is not sanctioned soon.

Necdet PAMNecdet PAMİİRR
Board Board MemberMember, , WorldWorld
EnergyEnergy
CouncilCouncil
TurkishTurkish
NationalNational
CommitteeCommitteeInstructorInstructor, Bilkent , Bilkent UniversityUniversity
The Global Energy Scene The Global Energy Scene –– Current Status of the Energy Current Status of the Energy
Resources and the Scenarios for Resources and the Scenarios for TomorrowTomorrow

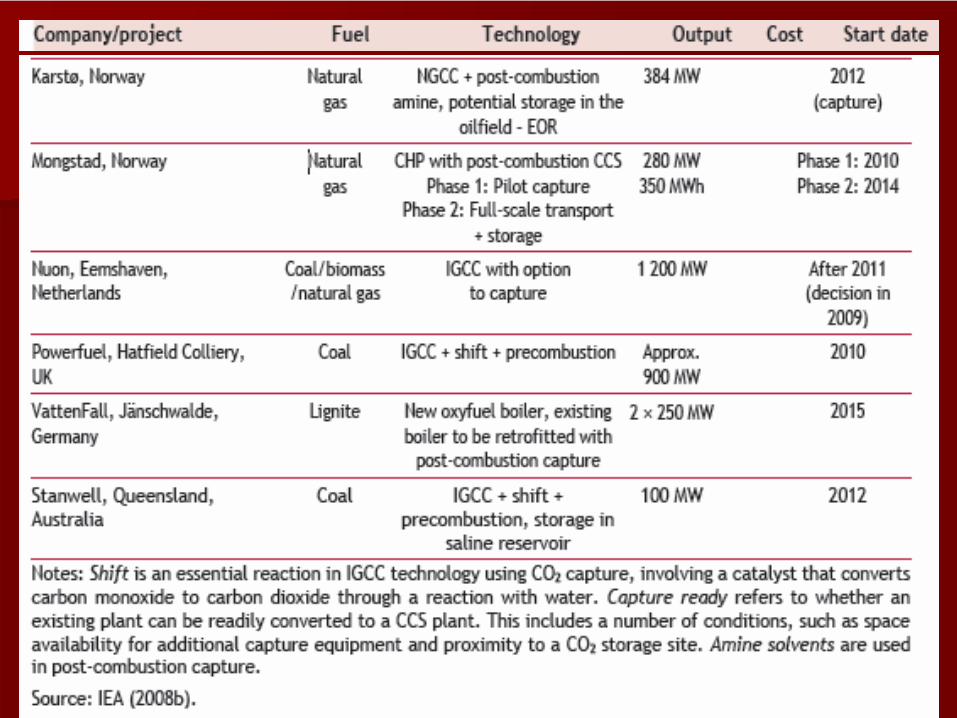
Trends in CO2 capture and storage
Carbon capture and storage (CCS) is a promising technology for carbon abatement, even though it has not yet been applied tolarge-scale power generationWidespread deployment of CCS depends on developments in legal and regulatoryframeworks, financing mechanisms, international co-operation, technologicaladvances and public awareness

Recent legal and regulatory developments includeamendments to the London Protocol and the OSPAR (Oslo-Paris) Convention to allow for storage of CO2in formations below the international waters thatare covered by those treaties. The European Commission’s climate change andrenewable energy package, released in January2008, includes a new directive on the EU EmissionsTrading Scheme (ETS), which addresses CCS amongother matters. It proposes new legislation toencourage CO2 storage. Also, under the EU’s ZeroEmissions Technology Platform, the FLAGSHIP programme will provide guidance on criteria forselecting 10 to 12 demonstration projects coveringall the technology blocks of CCS (power plant andcapture, and CO2 transport and storage) forevaluation by the European Commission

RecentRecent CCS CCS ProposalsProposals & & DevelopmentsDevelopments
BasicBasic TrendsTrends –– Tanker MarketTanker Market
The tanker market is also exposed to a combination of the fallout from the current economic turmoil, stagnant medium-term demand for oil movements, even declining in the short-term, and a relatively large increase in tanker capacity over the next few years as a result of record order books. Longer term, growth in the interregional crude oil trade and refined products will necessitate increases in global tanker capacity. However, this is limited, with the global tanker fleet expected to expand byaround 100 million deadweight tonnes, or 25%, by 2030, compared to its capacity at the end of 2008.

FieldField Size Size DefinitionDefinition byby WEO 2008WEO 2008
SuperSuper GiantGiant: > 5 : > 5 billionbarrelsbillionbarrelsGiantGiant: 500 : 500 millionmillion –– 5 5 billionbillion barrelsbarrelsLargeLarge: > 100 : > 100 millionmillion barrelsbarrels
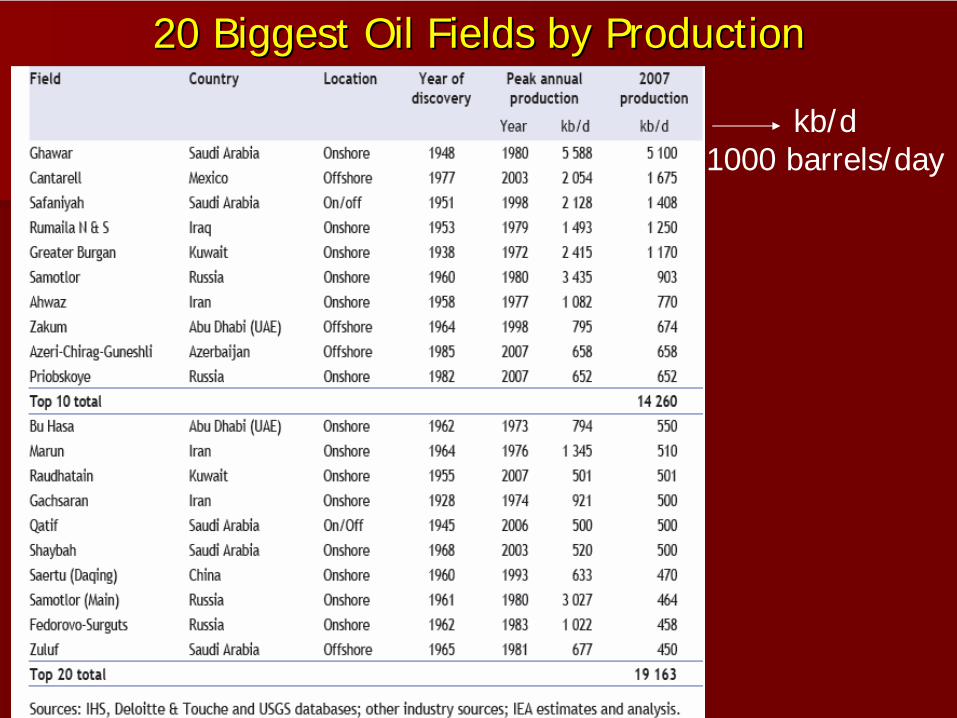
20 20 BiggestBiggest OilOil FieldsFields byby ProductionProduction
kb/d1000 barrels/day
The US EISAThe US EISA is already signed into law. In the WOO 2008, scenarios were developed to assess thepotential impact on oil demand and the call on OPEC oil. That analysis pointed to the stricter CorporateAverage Fuel Economy (CAFE) standards reducingdemand by 1.1 mb/d in 2020, and 2.1 mb/d by 2030 (this was the centralcase — low and high cases werealso developed, suggesting losses of 1.2 mb/d and2.7 mb/d respectively by 2030). That central casescenario has now been incorporated into theReference Case. This assumes a moderate spill-overto lorry efficiencies, and beyond 2020, some furtherefficiency improvement over and above previousreference case assumptions.

The EUEU heads of state and government worked out a compromise deal in December 2008, and followingthis, the European Parliament approved the package. The so-called ‘20-20-20’ package is in line with theoriginal 36 Commission proposals of January 2008, and entails legally binding targets for the year 2020 that will oblige EU countries to reduce CO2 emissions by 20% from 1990 levels, to improveenergy efficiency by 20% and to reach a minimum 20% share forrenewable energy.Six proposals were agreed upon:
6 6 proposalsproposals fromfrom thethe EUEU
To revise the EU’s Emissions TradingSystem (ETS)– This is seen as a key tool in achieving the
20% greenhouse gas reduction by 2020. The revision involves expanding the coverage to include further industries such as petrochemicals, and the introduction of full auctioning by 2013. The Directive also provides for agreements with other mandatory greenhouse gas trading systems.

CO2 reduction targets for sectors not coveredby the ETS– This foresees a ‘corrective action’ whereby
countries will have to compensate for underachievement in the following year.
A legal framework for CCS– The new directive sees the ETS setting aside up to
300 million allowances for carbon capture & storage (CCS) projects, with an estimated resulting funding of €6–9 billion. This is suggested to be sufficient for nine or 10 demonstration projects.

Binding targets for CO2 emissions from new cars– The new legislation sees a binding target of 120g CO2/km,
phased in over the period 2012–2015, with fines payable by manufacturers for excessive emissions. This represents a reduction of 25% from current levels. A long-term target, although not yet binding, of 95 g/km by 2020 is also included in the agreement.
– A binding target of 20% renewable energy in theenergy mix by 2020– Energy produced from hydro, solar, wind, biomass or
geothermal sources in the EU is to rise to 20% by 2020. This includes a 10% share of renewables in the transport sector.

RefiningRefining OutlookOutlook

The refining industry experienced a so-called‘golden period’ between 2004 and 2008,which attracted many investors and ledrefiners to consider numerous options forfurther capacity expansion. It is a processthat accelerated during 2008.In 2007, the list of announced projectstotalled around 14 mb/d, but in 2008 thisincreased to 22 mb/d. Today, several specialized institutions reportthat there is potential for around 40 mb/d of additional crude distillation capacity if allannounced projects are successfullyimplemented.


In response to falling demand and costs, manyrefiners have deferred or are considering deferringtheir investment plans due to demanduncertainties, in expectation of lower capital costs, and because of difficulties securing the requiredfinancing.This is especially true for a number of major newprojects that have yet to move to the constructionstage. For example, some US projects alreadyunder construction are experiencing delays. Thisincludes the Motiva expansion project of 325,000 b/d in Port Arthur, Texas, which has been delayedfrom 2010 to 2012. Marathon also announced it would delay the completion of its Detroit refineryexpansion to mid-2012 in an effort to cut spending. The project had been scheduled for completion in 2010.
Other world regions are following the sametrend. In the Middle East, plans for the singlebiggest global project, the 625,000 b/d Al-Zour refinery, have been deferred.Total’s joint venture project for a newrefinery in Jubail, Saudi Arabia, is stalledhinting that it will be delayed until it can be executed for under $10 billionIn India, grassroots refinery projects in Mangalore and Vadinar have been put on hold, together with other projects in thecountry.


New capacity additions to 2015 aredominated by developments in Asia, mainlyChina and India, with almost 50% of additional capacity, or 2.8 mb/d, located in this region.The Middle East remains the second biggestcontributor to future refining expansion in themedium-term, even after Kuwait’s huge Al-Zour project was deferred.The third biggest contributor will be the US & Canada, dominated by developments in theUS refining sector. Here, around 0.9 mb/d of new apacity is expected through theexpansion of existing facilities


Plug-in hybrids: plugged in, or plugged out?
HEV relies ultimately on the fuel in its tank to obtainits energy requirements, the PHEV obtains a portionof its energy needs — when it is not travelling —through being plugged into the electricity network. Thus, the PHEV provides an opportunity for fuelswitching in the transportation sector, as in themain, fuels other than oil are used to supplyelectricity to the grid.There is clearly potential for PHEVs, and theirdevelopment has received much governmentimpetus in recent years. However, a number of question marks remain.

Plug-in hybrids: plugged in, or plugged out?The fact that PHEVs need to plug into the electricity gridimplies specific battery requirements. For example, there is the importance of battery storage capacity, which willdetermine the distance that can be travelled using the electricdrive of the vehicle, the charge depleting (CD) range, andhow many recharging stops are required.It is evident that batteries for PHEVs need to be larger in volume and heavier in weight than those that have so far been used for HEVs, mainly nickel-metal hydride (NiMH) batteries. With this in mind, Lithium-ion (Li-ion) batteries aretaking centre stage. These can achieve higher specific powerand energy levels, making them more suitable for PHEV applications. In addition, Li-ion batteries are potentiallycheaper than NiMH. However, the current state of development of Li-ion 92 batteries, for demandingapplications in transportation, remain short of industrytargets, for example, those set by the United States AdvancedBattery Consortium (USABC).