the global economy: crisis or opportunity for latin...
TRANSCRIPT

www.aegirports.comFranc J Pigna CRE FRICS CMC, Managing Director
AAPA XXIV Latin American Congress of Ports
Arica, Chile
Port Property Advisors Maritime Research Maritime Advisors Supply Chain Advisors Maritime Equity Research
The global economy: crisis or
opportunity for Latin American ports?
An analysis of salient factors ©

Header
Sub header
www.aegirports.com
Subjects to be cover today
Global & Latin American trade forecasts
State of the shipping industry
State of the ports industry
Challenges
Solutions
Conclusions

Header
Sub header
www.aegirports.com
Global and Latin American Trade Forecast

www.aegirports.com4
AAPA XXIV LA Congress of Ports 2015 | © Aegir 2015
Global & LAC Forecast? Troubled waters ahead…
• Regional outlook dramatically changed;
downward adjustments occurring due to
worsening situation in Brazil and Venezuela
• Forecast now for contraction of 0.1%; first since
global financial crisis of 2009
• Outlook for 2016 – will disappoint (1.0% GDP,
Focus Economics)
• Fast population growth areas, like LAC, need at
least 5% growth to maintain employment
• ‘Without investment, there is no growth, and
without growth, there is no poverty
reduction… they just don’t get it’, Hernando
Henrique Cardoso (ex president of Brazil) to
Andres Oppenheimer recently
World GDP 2015 forecast; % increase on a year earlier
OECD Economic Outlook 2014 – LAC/OECD
Economic Intelligence Unit

www.aegirports.com5
AAPA XXIV LA Congress of Ports 2015 | © Aegir 2015
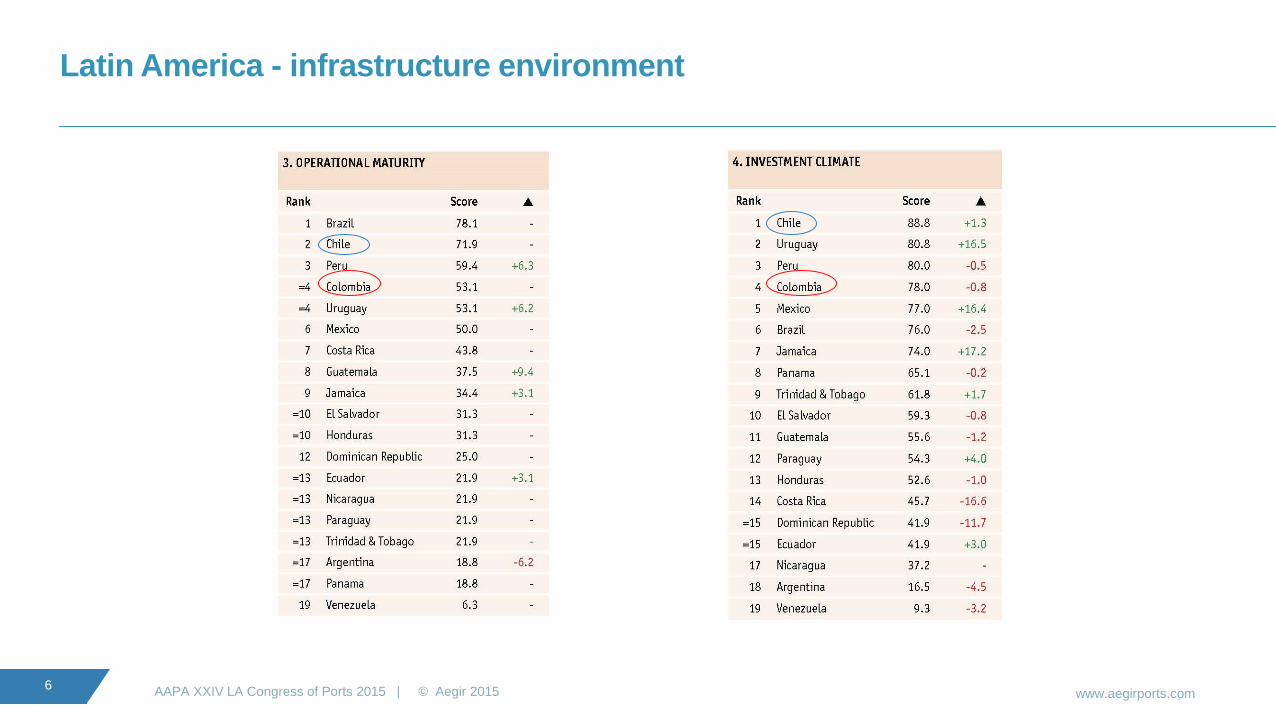
Latin America: infrastructure environment, the road to growth
www.aegirports.com6
AAPA XXIV LA Congress of Ports 2015 | © Aegir 2015
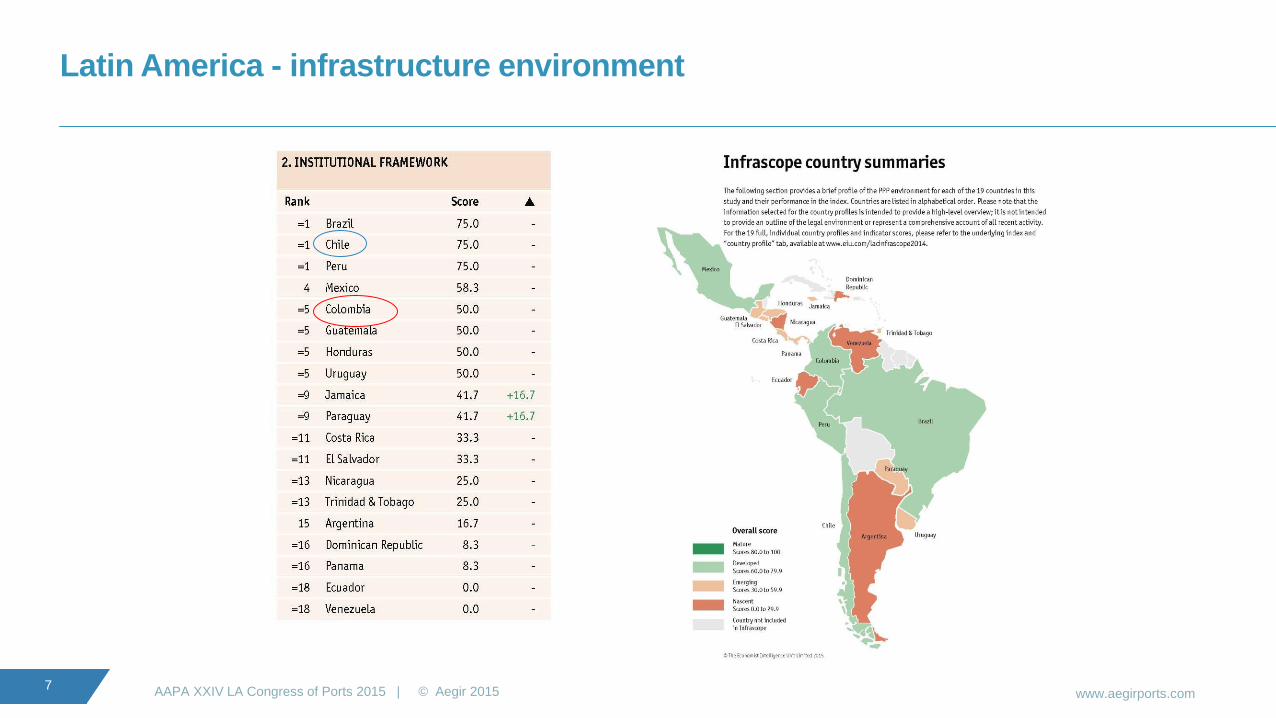
Latin America - infrastructure environment
www.aegirports.com7
AAPA XXIV LA Congress of Ports 2015 | © Aegir 2015
Latin America - infrastructure environment

Header
Sub header
www.aegirports.com
State of the shipping industry

www.aegirports.com9
AAPA XXIV LA Congress of Ports 2015 | © Aegir 2015
(Much) bigger ships + Bigger alliances + Vessel cascading
The triple punch!

www.aegirports.com10
AAPA XXIV LA Congress of Ports 2015 | © Aegir 2015
Much bigger ships
The cycle is happening faster; Maersk leapfrogged
Mid 1990’s - Regina
Maersk 7,400 teu
Other carriers
followed…
Mid 2000’s - Emma
Maersk 15,500 teu
Other carriers
followed…
2015 - MSC Maya E
19,224 teu
(21,000 teu on ordered)
Other carriers
following…
2020? 25,000 teu vessels?
Carriers will follow…?

www.aegirports.com11
AAPA XXIV LA Congress of Ports 2015 | © Aegir 2015
Bigger alliances – consolidation
How long will they stay as they are? Are they stable?
Shipping line Alliances/vessel sharing agreements (VSAs)
Maersk
P3 (denied)2M
MSC
CMA CGM
Ocean ThreeChina Shipping China Shipping/UASC
UASC
NYK
Grand Alliance
G6 Alliance
OOCL
Hapag-Lloyd
APL
New World AllianceMOL
Hyundai
Cosco
CKYH AllianceCKYHE Alliance
K Line
Yang Ming
Hanjin
Evergreen Independent
16 6 4
More
convergence?
Further
changes?

www.aegirports.com12
AAPA XXIV LA Congress of Ports 2015 | © Aegir 2015
Vessel cascadingRapid and ongoing increases in largest and average container ship sizes
Increase in average ship size: 1Q 2013 - 1Q 2015
80%
37%
34%
32%
21%
19%
15%
15%
14%
10%
9%
9%
8%
8%
6%
0% 10% 20% 30% 40% 50% 60% 70% 80% 90%
Europe-S Africa
Asia-ECSA
Asia-W Africa
Europe- W Africa
Europe-ECSA
Asia-N Europe
Asia-USEC (Suez)
Asia-USWC
N Europe-Gulf/Mex
Asia-S Africa
SE Asia-Aus
N Europe- N Atlantic
Asia-WCSA
Asia-Med
N Asia-Aus
Source: Drewry Maritime Research
• Ship sizes growing faster on north-
south trade routes
• Implications for all ports and
terminals, not just ones serving
mega ships
• Infrastructure demands at and
behind ports

www.aegirports.com13
AAPA XXIV LA Congress of Ports 2015 | © Aegir 2015
Demand growth and terminal capacity issues

www.aegirports.com14
AAPA XXIV LA Congress of Ports 2015 | © Aegir 2015
Demand growthCoping with high growth rates used to be the big challenge; less so now
249 279
315
363 399
443
497 525
478
548
596 625
645 678
707742
2001 2002 2003 2004 2005 2006 2007 2008 2009 2010 2011 2012 2013 2014 2015 (f) 2016 (f)
Million teu
CAGR 11.3% CAGR 5.3%
Source: Drewry Maritime Research
Wide regional
variations in
growth rates
though

www.aegirports.com15
AAPA XXIV LA Congress of Ports 2015 | © Aegir 2015
Demand and capacity forecasts(5 year forecasts of container port demand and capacity for 20 world regions)
Fastest growingregions forecast to be:
West Africa
Greater China
North Africa
Slowest growingregions forecast to be:
East Africa
Northwest Europe
West Coast North America
Global container port throughput to exceed 840 million teu by 2018, growing by 5.6% per annum on average
Globally, average terminal utilisation is forecast to increase from 67% in 2013 to 75% in 2018; there are wide variations at the sub-region level though – entering the world of chaos
Impact and need
for more
infrastructure

Header
Sub header
www.aegirports.com
State of the ports industry

www.aegirports.com17
AAPA XXIV LA Congress of Ports 2015 | © Aegir 2015
Demand peaks/Concentration of demand
Reduced service frequency and bigger ships = greater peaks
ECT website: 28 October 2014
“Last weekend, the Thalassa Pistis of Evergreen Line called at the ECT
Delta Terminal where the ship set a new record for ECT and for the Port of
Rotterdam: during its visit to the terminal, 10,557 containers were
handled”
“On the vessel a berth productivity of more than 150 container moves per
hour was achieved”
Even with this good
performance, vessel
was still in port for
nearly 3 days –
infrastructure defecit
www.aegirports.com18
AAPA XXIV LA Congress of Ports 2015 | © Aegir 2015
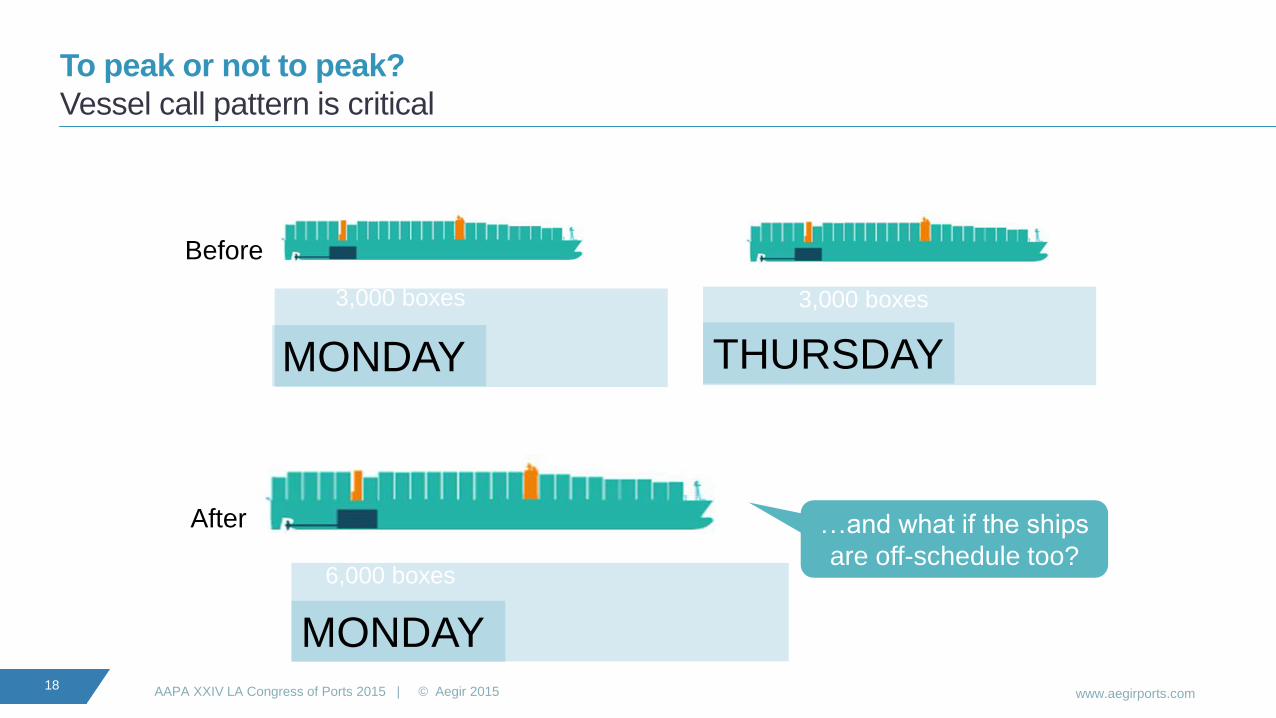
To peak or not to peak?
Vessel call pattern is critical
THURSDAY
Before
After
6,000 boxes
MONDAY
3,000 boxes
…and what if the ships
are off-schedule too?
3,000 boxes
MONDAY

www.aegirports.com19
AAPA XXIV LA Congress of Ports 2015 | © Aegir 2015
Changing nature of demand:
same volume and list of ports of call… but greater peaks
Typically the same number of ports called at per loop, but less frequently
0
5
10
15
20
25
30
35
Jan 2012 Jan 2014
Number of weekly loops
Asia - North Europe trade route
75
80
85
90
95
100
105
110
Jan 2012 Jan 2014
Number of port calls per week
Asia - North Europe trade route

www.aegirports.com20
AAPA XXIV LA Congress of Ports 2015 | © Aegir 2015
Investment implications – for the wider supply chain…
Shipping lines obtaining sea transport
cost savings for themselves (and cargo
owners) with bigger ships…
…but generating higher investment needs in
other parts of the supply chain (for other service providers) eg,
infrastructure

www.aegirports.com21
AAPA XXIV LA Congress of Ports 2015 | © Aegir 2015
Fragmented terminal capacity =
need to consolidate
Investment implications for ports and terminals
Demand for faster
handling speeds =
need to invest
Terminal demand peaks =
need for more capacity

www.aegirports.com22
AAPA XXIV LA Congress of Ports 2015 | © Aegir 2015
Enhanced equipment and
infrastructure required
Investment implications for ports and terminals
More rapid obsolescence of existing terminal capacity

www.aegirports.com23
AAPA XXIV LA Congress of Ports 2015 | © Aegir 2015
Investment implications – for the wider supply chain
Demand peaks = need
for more road/rail/barge
capacity
Demand peaks =
changes to inland
transport modal split
Structural changes,
organisational changes
and innovation in
landside transportation
and logistics
New and improved
inland terminals
and distribution
centresrequires demands

www.aegirports.com24
AAPA XXIV LA Congress of Ports 2015 | © Aegir 2015
Fragmented terminal capacity
Fragmented capacity
means:
• Multiple terminal
calls in the same
port and/or
• More inter-terminal
transfers
Results in
demand for
bigger
terminals due
to:
• Consolidated
volumes
• Annual
volumes/cus-
tomer
increasing

www.aegirports.com25
AAPA XXIV LA Congress of Ports 2015 | © Aegir 2015
Equipment and infrastructure: bigger ships requires more investment in
equipment, infrastructure, systems and more and more efficient use of real estate…
• Larger (and more) cranes
• Longer berths
• Deeper berths
• Deeper approach channels
• Greater air draft
• Higher crane and berth productivity
• And a yard/landside operation and
inland links capable of coping……
Are shipping lines prepared to pay
for these enhanced requirements?
Leads to obsolescence
of some capacity

www.aegirports.com26
AAPA XXIV LA Congress of Ports 2015 | © Aegir 2015
Hamburg Sud 9,800 teu
vessel in draft restricted
Buenos Aires (at terminal
using mobile harbour
cranes)
Traditional ports out of the game? Ever larger ships still accessing ports with
navigational, infrastructure restrictions …but for how long?
Large vessels in
Itajai, Brazil
MSC Loretta (300m LOA, 40m beam, 6,750 teu)
Maersk Lavras (300m LOA, 45m beam, 7,450 teu)

www.aegirports.com27
AAPA XXIV LA Congress of Ports 2015 | © Aegir 2015 Source: Drewry Route Capacity Database
Latin America Black Sea
Buenaventura Constanza
Buenos Aires Ilychevsk
Callao Odessa
Coronel
Iquique Adriatic
Itajai Koper
Itapoa Rijeka
Montevideo Trieste
Navegantes
Paranagua Africa
Rio Grande Cape Town
Salvador Coega (Ngqura)
San Antonio Durban
San Vicente Port Elizabeth
Santos Port Louis
Sepetiba
Don’t forget:
It’s all about the
cargo!
Traditional ports out of the game?Ports in north-south/secondary trade lanes currently receiving calls by 8-10,000 teu ships

Header
Sub header
www.aegirports.com
Challenges

www.aegirports.com29
AAPA XXIV LA Congress of Ports 2015 | © Aegir 2015
Vessel call volumes and handling speeds: the increasing disconnect
(size of exchanges per vessel call get very large, very quickly)
0
500
1,000
1,500
2,000
2,500
3,000
3,500
4,000
4,500
5,000
Number of boxes
exchanged if = 40% of ship capacity *
Ship size (teu)
Former Maersk Line CEO:
6,000 moves in 24 hours =
250 berth moves per hour
* i.e. 20% of vessel discharged and 20% loaded per port call
** JOC Port Productivity Data (2013, 8,000teu+ sized ships)
Best performing terminal in the
world
Annual average 179 berth moves
per hour **What level of productivity does the
shipping line want (they may not
want the fastest) and
are they prepared to pay for it?

www.aegirports.com30
AAPA XXIV LA Congress of Ports 2015 | © Aegir 2015
Sweating the assets - intensity of asset use:
global container terminals and key asset performance metrics
• On all three measures, terminals in Asia and the Middle East
achieved higher figures than world averages
• Difference is most marked in teu per hectare, where the highest
performing regions saw up to 70% more than the world averages
• Regions which achieved lower figures than the world averages
included North America and parts of Europe – why?
Performance measure Global average (2013)
Teu per metre of quay p.a. 1,072
Teu per hectare p.a. 24,791
Teu per gantry crane p.a. 123,489
Only around half the
theoretical maximum annual
throughput of a gantry crane
www.aegirports.com31
AAPA XXIV LA Congress of Ports 2015 | © Aegir 2015
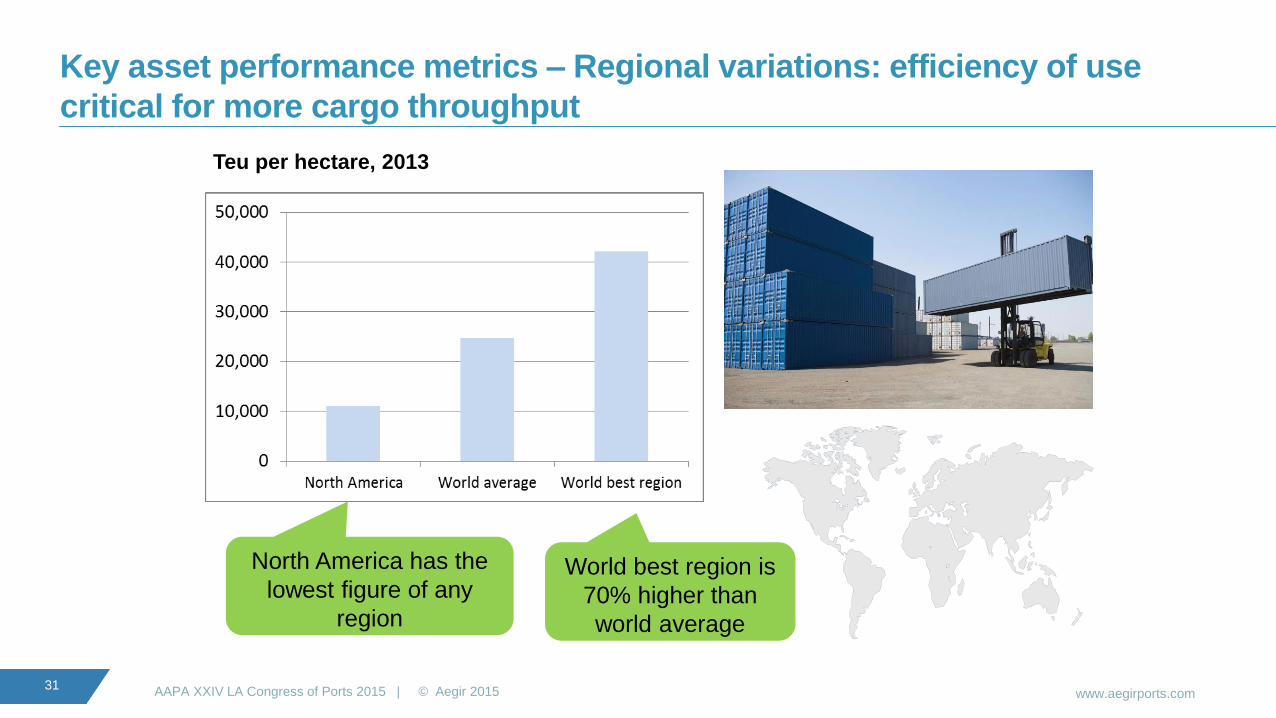
Key asset performance metrics – Regional variations: efficiency of use
critical for more cargo throughput
Teu per hectare, 2013
North America has the
lowest figure of any
region
World best region is
70% higher than
world average

www.aegirports.com32
AAPA XXIV LA Congress of Ports 2015 | © Aegir 2015
Automation: Geographical range spreading: Countries with at least one
container terminal with significant equipment automation technology deployed
(or planned)
10 years ago
Australia
Germany
Netherlands
Singapore
UK
Today
Australia
Belgium
China
Germany
Japan
Netherlands
Singapore
South Korea
Spain
Taiwan
UAE
UK
USA
)
Low
wage
economy
Low
wage
economy
Picking up
pace

www.aegirports.com33
AAPA XXIV LA Congress of Ports 2015 | © Aegir 2015
Small number but growingExisting and planned fully and semi-automated container terminals
Less than 5% of terminals
globally are fully or semi-
automated………but the
proportion is growing

Header
Sub header
www.aegirports.com
Solutions

www.aegirports.com35
AAPA XXIV LA Congress of Ports 2015 | © Aegir 2015
Regional rationalisation of regional port assets
• Regional rationalisation of regional port assets
‒ Transhipment
‒ Gateways
‒ Inland ports
‒ Logistics clusters
• Private capital – PPP
• Automation
• More strategic use of port’s largest asset – property for:
‒ More competitive advantages
‒ Increase revenues streams
‒ Enhanced port values

www.aegirports.com36
AAPA XXIV LA Congress of Ports 2015 | © Aegir 2015
Infrastructure investment – now beyond reach of most governments; one
solution: the Colombian example
• Colombia
‒ January 2012: government approves PPP law applicable to
government entities at national and subnational level (No
1508), allows environmental licence and land acquisition to
contractors
‒ November 2012: Transport Infrastructure law (No 1682)
address cost overruns, simplifies land acquisition and
disposition, greatly enhances bidding mechanisms with
‘cost-benefit analysis’ thresholds
‒ Now, there is political consensus to maintain favourable
frameworks and to be proactive with concessions
‒ Fourth generation of concessions will involve billions of
pesos, greatly reduce large infrastructure deficit in roads,
ports and airports for the country

www.aegirports.com37
AAPA XXIV LA Congress of Ports 2015 | © Aegir 2015
• Infrastructure:
‒ Government has reduced procedure for port concessions -
now a single hearing required
‒ Under country’s nine port clusters there are 25 concession
requests under consideration
‒ To date: $1.645 billion has been invested by
concessionaires in the ports of Buenaventura, Cartagena,
Santa Marta, Baranquilla and others; Colombian pension
funds have approximately 18% invested in infrastructure
‒ Major oil terminals planned for Cartagena and
Buenavenutra
‒ MOT revelas that new investment in port concessions will
add further capacity of 50.94 million tonnes to the country
‒ Strategy is to make Colombia a ‘great container transport
hub of the Americas’
• Colombia: analysing challenges, identifying
opportunities and developing solutions
• Market:
‒ Business International Monitor (BMI) forecasts
growth across Colombian ports in 2015 and
beyond
‒ Notwithstanding commodity price freefall,
throughput volumes to be supported by
growing dry bulk export eg, coal to China via
Pacific ports
‒ Port example -Cartagena: total tonnage
increase by 4.5% to 21.3 m tonnes; average
growth 5.3% through 2019, containers
average growth 10.2% same period (currently
2.27 m teu’s)
State of Colombian port infrastructure development

www.aegirports.com38
AAPA XXIV LA Congress of Ports 2015 | © Aegir 2015
Logistics Cluster* to enhance throughput results in real estate opportunities
Clusters: art, finance, film, logistics Logistics Zone?
Florence Guilds
Film Capital
of the world
Memphis
Aerotroplois: Port
Memphis, Fedex, etc
Global
Capital
Center
• Clusters: agglomeration of companies
• Logistics centric; singularity of purpose
• Geographic comparative advantage
• Government facilitator
• Globalization feeds logistics clusters
• Intermodal = higher velocity
• Clusters generate sub-clusters
• Net result:
• Jobs
• Investment
• growth
* Sheffi, Yossi, ‘Logsitics Clusters’, 2012

Header
Sub header
www.aegirports.com
Conclusions

www.aegirports.com40
AAPA XXIV LA Congress of Ports 2015 | © Aegir 2015
All of this will result in:
• More cargo at higher peaks and less cycles requiring more inventory,
warehousing and need for real estate
• In the ‘sea – land’ equation, compression of the supply chain and relative costs
will now be on the land side
• Logistics, shipping and ports industry will continue on ‘revolutionary’ rather than
evolutionary track
• The future is both ‘INLAND’ and ‘IN LAND’

www.aegirports.com
USA (Aegir)
299 Alhambra Circle
Suite 402
Coral Gables Florida
33134-5117 USA
UK (Drewry)
15-17 Christopher Street
London
EC2A 2BS
United Kingdom
India (Drewry)
209 Vipul Square
Sushant Lok - 1
Gurgaon 122002
India
Singapore (Drewry)
#13-02 Tower Fifteen
15 Hoe Chiang Road
Singapore 089316
China (Drewry)
Office 555, 4th floor
Standard Chartered Tower
201 Shi Ji Avenue
Pudong District, Shanghai
China, 200120
T +1 888 517 9990 T +44 20 7538 0191 T +91 124 497 4979 T +65 6220 9890 T +86 (0) 21 6182 6759
Port Property Advisers
ort Property Advisers
Port Property Advisors
Since 2003, Aegir Port Property Advisers have been a pioneer
consultancy engineered to meet the unique property challenges of
the ports and maritime industries. Aegir’s focus is to enhance a
port’s competitive and financial value by more strategically using its
major asset.
In the last decade Aegir has undertaken complex port property lease,
asset management, valuation, development feasibility, management
consultancy and strategy instructions in Europe, the Middle East,
Africa, the Americas and Asia.
Aegir & Drewry: helping you navigate the world of ports by
bridging the gap between the port and property sectors.
From our origins in 1970 London to a 21st century
maritime and shipping consultancy, Drewry has
established itself as one of the most widely used and
respected sources of impartial market insight, industry
analysis and advice. This in-depth understanding and
objectivity provides our clients with the actionable advice
and recommendations they need to achieve their
ambitions and stay ahead of the market.
• Over 400 port assignments in 50 countries in the past
10 years.
• Since 2010, provided commercial and due diligence
advice in port M&A and financing with a value of
approximately $20bn.
• In last 5 years provided advice on vessel valuations on
asset value of more than $180bn (combined).
• In last five years advised on container shipping
industry investments totalling $6bn.