the global e-waste monitor 2020
TRANSCRIPT

Authors: Vanessa Forti, Cornelis Peter Baldé, Ruediger Kuehr, Garam Bel
Contributions by: S. Adrian, M. Brune Drisse, Y. Cheng, L. Devia, O. Deubzer, F. Goldizen, J. Gorman, S. Herat, S. Honda, G. Iattoni, W. Jingwei, L. Jinhui, D.S. Khetriwal, J. Linnell, F. Magalini, I.C. Nnororm, P. Onianwa, D. Ott, A. Ramola, U. Silva, R. Stillhart, D. Tillekeratne, V. Van Straalen, M. Wagner, T. Yamamoto, X. Zeng
Quantities, flows, and the circular economy potential
Supporting Contributors:
The Global E-waste Monitor 2020

2

3
The Global E-waste Monitor 2020Quantities, flows, and the circular economy potential
Authors: Vanessa Forti, Cornelis Peter Baldé, Ruediger Kuehr, Garam Bel
Contributions by: S. Adrian, M. Brune Drisse, Y. Cheng, L. Devia, O. Deubzer, F. Goldizen, J. Gorman, S. Herat, S. Honda, G. Iattoni, W. Jingwei, L. Jinhui, D.S. Khetriwal, J. Linnell, F. Magalini, I.C. Nnororm, P. Onianwa, D. Ott, A. Ramola, U. Silva, R. Stillhart, D. Tillekeratne, V. Van Straalen, M. Wagner, T. Yamamoto, X. Zeng
4
Copyright and publication information

5
Contact information: For enquiries, please contact the corresponding author C.P. Baldé via [email protected]. Please cite this publication as: Forti V., Baldé C.P., Kuehr R., Bel G. The Global E-waste Monitor 2020: Quantities, flows and the circular economy potential. United Nations University (UNU)/United Nations Institute for Training and Research (UNITAR) – co-hosted SCYCLE Programme, International Telecommunication Union (ITU) & International Solid Waste Association (ISWA), Bonn/Geneva/Rotterdam. ISBN Digital: 978-92-808-9114-0 ISBN Print: 978-92-808-9115-7
United Nations University (UNU) is an autonomous component of the UN General Assembly dedicated to generating and transferring knowledge and strengthening capacities relevant to global issues of human security, development, and welfare. The University operates through a worldwide network of research and training centres and programmes, coordinated by the UNU Centre in Tokyo. www.unu.edu.
The United Nations Institute for Training and Research (UNITAR) is a dedicated training arm of the United Nations, with a mission of developing the individual, institutional, and organizational capacity of countries and other United Nations stakeholders through high-quality learning solutions and related knowledge products and services to enhance global decision-making and to provide support at the country level in overcoming global challenges. www.unitar.org.
The SCYCLE Programme, now in transition from UNU to UNITAR, envisions enabling societies to reduce the environmental load from production, use, and the disposal of ubiquitous goods and especially electrical and electronic equipment to sustainable levels by means of independent, comprehensive, and practical research and training, providing more thorough fact bases for policy development and decision-making. Therefore, SCYCLE activities are focused on the development of sustainable production, consumption, and disposal patterns for electrical and electronic equipment, as well as other ubiquitous goods. SCYCLE leads the global e-waste discussion and advances sustainable e-waste management strategies based on life-cycle thinking. For detailed information on SCYCLE and its projects, including its research and training activities, please visit www.scycle.info and http://scycle.vie.unu.edu.
The International Telecommunication Union (ITU) is the specialized United Nations agency for information and communication technologies (ICTs), driving innovation in ICTs together with 193 member states and a membership of more than 900 companies, universities, and international and regional organizations.
Established in 1865, ITU is the intergovernmental body responsible for coordinating the shared global use of the radio spectrum, promoting international cooperation in assigning satellite orbits, improving communication infrastructure in the developing world, and establishing the worldwide standards that foster seamless interconnection of a vast range of communications systems. From broadband networks to cutting-edge wireless technologies, aeronautical and maritime navigation, radio astronomy, oceanographic and satellite-based earth monitoring as well as converging fixed-mobile phone, internet, and broadcasting technologies, ITU is committed to connecting the world. For more information, visit www.itu.int.
About ISWA:The International Solid Waste Association (ISWA) is a global, independent and non-profit making association, working in the public interest promoting sustainable, comprehensive and professional waste management and the transition to a circular economy.
Disclaimer:The designations employed and the presentation of the material in this publication do not imply the expression of any opinion whatsoever on the part of the United Nations University (UNU)/ United Nations Institute for Training and Research (UNITAR), the International Telecommunication Union (ITU), or the World Health Organization (WHO) concerning the legal status of any country, territory, city, or area, or of its authorities, or concerning delimitation of its frontiers or boundaries. Trademark names and symbols are used in an editorial fashion with no intention on infringement of trademark or copyright laws. Moreover, the views expressed in this publication are those of the authors and do not necessarily represent those of the UNU/UNITAR, ITU, or WHO, nor does citing of trade names, companies, schemes, or commercial processes constitute endorsement. We regret any errors or omissions that may have unwittingly been made. © Maps, photos, and illustrations as specified.
This publication is licensed by the United Nations University/United Nations Institute for Training and Research and the International Telecommunication Union under a Creative Commons Attribution Noncommercial-Share Alike 3.0 IGO License. Please take the time to learn more about Creative Commons.
© UNU/UNITAR and ITU, 2020.
Your fair use and other rights are in no way affected by the above.
Credits© Illustrations UNU/UNITAR SCYCLE -Nienke HaccoûCredits© Photos UNU/UNITAR SCYCLE -Yassyn Sidki

6
Acknowledgments

7
• Innocent Chidi Nnororm (Abia State University) – Africa • Percy Onianwa (Basel Convention Coordinating Centre for the African Region)
– Africa • Daniel Ott (RLG Americas) – Latin America • Uca Silva (RELAC) – Latin America • Ruweyda Stillhart (SOFIES) – Policy & Legislation – Africa and Southeast Asia • Dulip Tillekeratne (CleanTech, GSMA) – Policy & Legislation – Africa and Southeast
Asia • Xianlai Zeng (Tsinghua University) – East and Southeast Asia
Design:Nienke Haccoû | Op de Kaart | www.bureauopdekaart.nl
Photography:Yassyn Sidki | Yassyn Sidki Photography | www.yassynsidki.com
Additional thanks to:Reed Miller (Yale University Center for Industrial Ecology), Giulia Iattoni (UNU/UNITAR), Vincent Van Straalen (Statistics Netherlands), Michelle Wagner (UNU/UNITAR), and Tales Yamamoto (Institute of Environmental Science – Leiden University) for their support in data collection and analysis.
The Organisation for Economic Co-operation and Development (OECD) and the United Nations Statistics Division (UNSD) for their collaboration in distributing questionnaires on e-waste to various countries.
Terry Collins and Mijke Hertoghs (ITU) for their support in the launch of the publication and the media campaign.
The Global E-waste Monitor 2020 is a collaborative effort of the Sustainable Cycles (SCYCLE) Programme presently co-hosted by the United Nations University (UNU) and the United Nations Institute for Training and Research (UNITAR), the International Telecommunication Union (ITU), and the International Solid Waste Association (ISWA).
This collaborative effort was made possible by financial contributions from: • International Telecommunication Union (ITU) • United Nations University (UNU) • International Solid Waste Association (ISWA) • World Health Organization (WHO) • German Ministry for Economic Cooperation and Development (BMZ) acting through
the Deutsche Gesellschaft für Internationale Zusammenarbeit (GIZ GmbH)
Authors Vanessa Forti, Kees Baldé, Ruediger Kuehr (UNU/UNITAR), and Garam Bel (ITU) would like to thank the contributing authors and reviewers for their contribution to the preparation of this third edition of the Global E-waste Monitor. Contributing authors and reviewers have contributed to the report in varying capacities; their affiliations are included for identification purposes.
Project steering committee:Kees Baldé, Ruediger Kuehr (UNU/UNITAR), Garam Bel (ITU), Aditi Ramola (ISWA).
Contributors: • Stephanie Adrian (US EPA) – North America • Marie Noel Brune Drisse (WHO) – E-waste Impacts on the Health of Children and
Workers • Yu-shu (Candy) Cheng (E-titanium Consulting, Inc) – Taiwan, Province of China • Leila Devia (Basel Convention Regional Centre for South America) – South America • Otmar Deubzer (UNU/UNITAR SCYCLE) – The Potential of E-waste in a Circular
Economy • Fiona Goldizen (WHO consultant) – E-waste Impacts on the Health of Children and
Workers • Julia Gorman (WHO consultant) – E-waste Impacts on the Health of Children and
Workers • Sunil Herat (Griffith University) – Oceania • Shunichi Honda (United Nations Environment Programme) – Japan • Wang Jingwei (Shanghai Collaborative Innovation Center for WEEE Recycling) –
East and Southeast Asia • Li Jinhui (Tsinghua University) – East and Southeast Asia • Deepali Sinha Khetriwal (UNU/UNITAR) – South Asia • Jason Linnell (Electronic Recycling) – North America • Federico Magalini (SOFIES) – Policy & Legislation – Africa and Southeast Asia

88
Foreword UNU, ITU, and ISWA
9
Electrical and electronic equipment (EEE) has become an essential part of everyday life. Its availability and widespread use have enabled much of the global population to benefit from higher standards of living. However, the way in which we produce, consume, and dispose of e-waste is unsustainable. Because of the slow adoption of collection and recycling, externalities –such as the consumption of resources, the emission of greenhouse gases, and the release of toxic substances during informal recycling procedures– illustrate the problem to remain within sustainable limits. Consequently, many countries are challenged by the considerable environmental and human health risks of inadequately managed Waste Electrical and Electronic Equipment (WEEE), widely known as e-waste. Even countries with a formal e-waste management system in place are confronted with relatively low collection and recycling rates.
Monitoring the quantities and flows of e-waste is essential for evaluating developments over time, and to set and assess targets towards a sustainable society and circular economy. The development of a recycling infrastructure, sound policies, and legal instruments are more efficiently implemented on the basis of sound e-waste data. Without a global picture of e-waste, the true nature of transboundary movements and, in some cases, illegal shipments will also be incomprehensible.
Building on the Partnership on Measuring ICT for Development, the United Nations University (UNU), the International Telecommunication Union (ITU), and the International Solid Waste Association (ISWA), in close collaboration with the United Nations Environment Programme (UNEP), have joined forces in the Global E-waste Statistics Partnership (GESP). Since late 2019, the United Nations Institute for Training and Research (UNITAR) has been co-hosting SCYCLE, UNU’s specialized programme on e-waste. The GESP collects data from countries in an internationally standardized way and ensures that this information is publicly available via its open-source global e-waste database, www.globalewaste.org. Since 2017, the GESP has made substantial efforts by expanding national and regional capacity on e-waste statistics in various countries.
Ultimately, the GESP assists countries in compiling e-waste statistics that are useful for national policy-making with an internationally recognised, harmonised measurement framework. The GESP brings together policy makers, statisticians, and industry representatives to enhance quality, understanding, and interpretation of e-waste data. At the global level, the GESP contributes to the monitoring of relevant waste streams, measuring progress made towards reaching the Sustainable Development Goals 11.6, 12.4, and 12.5. Recently, e-waste has officially been included in the work plan for the 12.4.2 and 12.5.1 indicator and in the documentation pertaining to this indicator. The GESP allows international organizations, such as the ITU, to measure progress towards their own goals. In 2018, the highest policy-making body of the ITU, the Plenipotentiary Conference, established a target of increasing the global e-waste recycling rate to 30% by 2023. This would correspond to a 12.6% increase in today’s global average.
This third edition of the Global E-waste Monitor is a result of the GESP and its close collaborators; a follow-up to the 2017 edition and UNU-SCYCLE’s groundbreaking Global E-waste Monitor 2014. This report shows that the global growth in the generation of e-waste continues.
In 2019, the world generated 53.6 million metric tons (Mt), and only 17.4% of this was officially documented as properly collected and recycled. It grew with 1.8 Mt since 2014, but the total e-waste generation increased by 9.2 Mt. This indicates that the recycling activities are not keeping pace with the global growth of e-waste.
Besides a global perspective, this report includes national and regional analysis on e-waste quantities and legislative instruments. Although 71% of the world’s population is covered by some form of e-waste policy, legislation, or regulation, greater efforts must be made towards implementation and enforcement in order to encourage the take-up of a collection and recycling infrastructure.
The Global E-waste Monitor 2020 introduces the wider public to the global e-waste challenge, explains how the challenge currently fits into international efforts to reach the SDGs, and discusses how to create a circular economy and sustainable societies. In parallel, we encourage decision-makers to increase their activities to measure and monitor e-waste by using and adopting the internationally recognised methodological framework developed by UNU-SCYCLE, in collaboration with the Partnership on Measuring ICT for Development.
We would like to thank all authors and contributors for this report, and we invite you to collaborate with the GESP and support our continuous efforts to improve the global understanding and environmentally sound management of e-waste.
Ruediger Kuehr Director of the Sustainable Cycles Programme, UNU & UNITAR, (SCYCLE)
Doreen Bogdan-MartinDirector of the Telecommunication Development Bureau, International Telecommu-nication Union (ITU)
Antonis MavropoulosPresident of the International Solid Waste Association (ISWA)

10
Tableof contents
10

11
Executive Summary ................................................................................................................. 12
Chapter 1. What is EEE and E-waste? ................................................................................. 16
Chapter 2. Global E-waste Key Statistics ..........................................................................20
Chapter 3. How E-waste Data Contribute to the SDGs ..................................................28
Chapter 4. Measuring E-waste Statistics ..........................................................................32
Chapter 5. Worldwide Harmonisation by the Global E-waste Statistics Partnership ..................................................................................................................................42
Chapter 6. E-waste Legislation and Transboundary Movement ...............................50
Chapter 7. The Potential of E-waste in a Circular Economy .......................................56
Chapter 8. E-waste Impact on the Health of Children and Workers ........................62
Chapter 9. Regional E-waste Key Statistics .....................................................................68 Africa ....................................................................................................................................... 70 Americas ................................................................................................................................ 72 Asia ............................................................................................................................................74 Europe ...................................................................................................................................... 76 Oceania ................................................................................................................................... 78
Endnotes .......................................................................................................................................80
Literature ..................................................................................................................................... 84
About the Authors .................................................................................................................... 94
Annex 1: UNU-KEYS and Link to E-waste Categories ...................................................96Annex 2: Methodology ...........................................................................................................100Annex 3: Country E-waste Key Statistics ........................................................................104

1212
ExecutiveSummary

13
The consumption of Electrical and Electronic Equipment (EEE) is strongly linked to widespread global economic development. EEE has become indispensable in modern societies and is enhancing living standards, but its production and usage can be very resource-demanding, as such also illustrates a counter to that very improvement in living standards. Higher levels of disposable incomes, growing urbanization and mobility, and further industrialization in some parts of the world are leading to growing amounts of EEE. On average, the total weight (excluding photovoltaic panels) of global EEE consumption increases annually by 2.5 million metric tons (Mt).
After its use, EEE is disposed of, generating a waste stream that contains hazardous and valuable materials. This waste stream is referred to as e-waste, or Waste Electrical and Electronic Equipment (WEEE), a term used mainly in Europe.
This monitor provides the most comprehensive update of global e-waste statistics. In 2019, the world generated a striking 53.6 Mt of e-waste, an average of 7.3 kg per capita. The global generation of e-waste grew by 9.2 Mt since 2014 and is projected to grow to 74.7 Mt by 2030 – almost doubling in only 16 years. The growing amount of e-waste is mainly fueled by higher consumption rates of EEE, short life cycles, and few repair options. Asia generated the highest quantity of e-waste in 2019 at 24.9 Mt, followed by the Americas (13.1 Mt) and Europe (12 Mt), while Africa and Oceania generated 2.9 Mt and 0.7 Mt, respectively. Europe ranked first worldwide in terms of e-waste generation per capita, with 16.2 kg per capita. Oceania was second (16.1 kg per capita), followed by the Americas (13.3 kg per capita), while Asia and Africa generated just 5.6 and 2.5 kg per capita, respectively.
Executive Summary
Higher levels of disposable income
Urbanization
Industrialization
EEE E-waste
Annual gro
wth
of 2.5
Mt
53.6 Mt7.3 kg per capitaGlobal e-waste generated 20
19
Growth of 9.2
Mt
since 2014
Asia 24.9 Mt
Am
ericas 13.1 M
t
Europe 12 Mt
Af
rica 2.9 Mt
Oc
eania 0.7 Mt
Higher consumption rates of EEE
Short life cycles
Few repair options

14
Global e-waste documented to be
collected and properly recycled
Recycled materials are reclaimed
17.4% | 9.3 Mt
Africa
0.9%
Americas
9.4%
Asia
11.7%
Oceania
8.8%
Europe
42.5%
82.6% | 44.3 Mt
Global e-waste flows that are not documented
is estimated to be exported as second-hand products or e-waste
8%is discarded into waste bins in high-income countries
Growth
of 1.8
Mt
since 2014
iron
copperaluminium
7-20%
53.6 Mt7.3 kg per capita
Glob
al e-waste generated 2019
Collection and recycling rates
14
In 2019, the formal documented collection and recycling was 9.3 Mt, thus 17.4% compared to e-waste generated. It grew with 1.8 Mt since 2014, an annual growth of almost 0.4 Mt. However, the total e-waste generation increased by 9.2 Mt, with an annual growth of almost 2 Mt. Thus the recycling activities are not keeping pace with the global growth of e-waste. The statistics show that in 2019, the continent with the highest collection and recycling rate was Europe with 42.5%, Asia ranked second at 11.7%, the Americas and Oceania were similar at 9.4% and 8.8%, respectively, and Africa had the lowest rate at 0.9%.
The fate of 82.6% (44.3 Mt) of e-waste generated in 2019 is uncertain, and its whereabouts and the environmental impact varies across the different regions. In high income countries, a waste recycling infrastructure is usually developed, and: • Around 8% of the e-waste is discarded in waste bins
and subsequently landfilled or incinerated. This is mostly comprised of small equipment and small IT.
• Discarded products can sometimes still be refurbished and reused, and thus are usually shipped as second-hand products from high-income to low- or middle-income countries. However, a considerable amount of e-waste is still exported illegally or under the guise of being for reuse or pretending to be scrap metal. It can be assumed that the volume of transboundary movements of used EEE or e-waste ranges from 7-20% of the e-waste generated.
• The majority of undocumented domestic and commercial e-waste is probably mixed with other waste streams, such as plastic waste and metal waste. This means that easily recyclable fractions might be recycled but often under inferior conditions without depollution and without the recovery of all valuable materials. Therefore, such recycling is not preferred.
In middle- and low-income countries, the e-waste management infrastructure is not yet fully developed or, in some cases, is entirely absent. Hence, e-waste is managed mostly by the informal sector. In this case, e-waste is often handled under inferior conditions, causing severe health effects to workers as well as to the children who often live, work and play near e-waste management activities.
Executive Summary
15Executive Summary
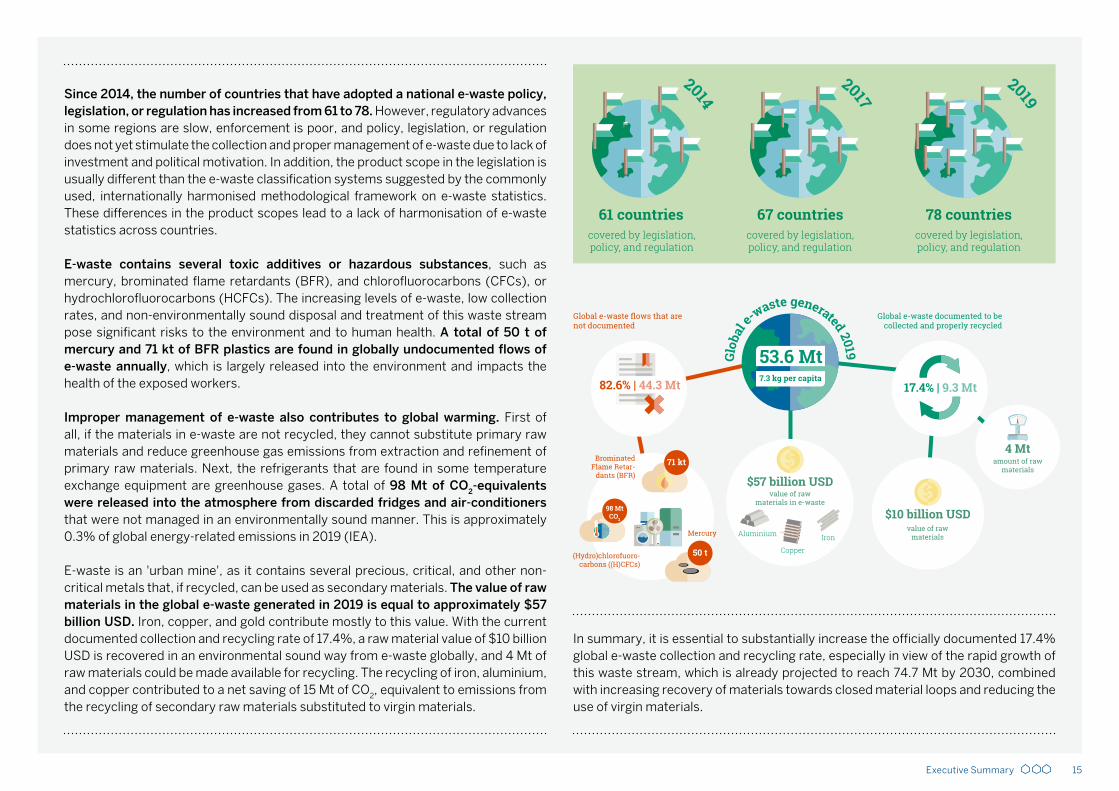
Since 2014, the number of countries that have adopted a national e-waste policy, legislation, or regulation has increased from 61 to 78. However, regulatory advances in some regions are slow, enforcement is poor, and policy, legislation, or regulation does not yet stimulate the collection and proper management of e-waste due to lack of investment and political motivation. In addition, the product scope in the legislation is usually different than the e-waste classification systems suggested by the commonly used, internationally harmonised methodological framework on e-waste statistics. These differences in the product scopes lead to a lack of harmonisation of e-waste statistics across countries.
E-waste contains several toxic additives or hazardous substances, such as mercury, brominated flame retardants (BFR), and chlorofluorocarbons (CFCs), or hydrochlorofluorocarbons (HCFCs). The increasing levels of e-waste, low collection rates, and non-environmentally sound disposal and treatment of this waste stream pose significant risks to the environment and to human health. A total of 50 t of mercury and 71 kt of BFR plastics are found in globally undocumented flows of e-waste annually, which is largely released into the environment and impacts the health of the exposed workers. Improper management of e-waste also contributes to global warming. First of all, if the materials in e-waste are not recycled, they cannot substitute primary raw materials and reduce greenhouse gas emissions from extraction and refinement of primary raw materials. Next, the refrigerants that are found in some temperature exchange equipment are greenhouse gases. A total of 98 Mt of CO
2-equivalents were released into the atmosphere from discarded fridges and air-conditioners that were not managed in an environmentally sound manner. This is approximately 0.3% of global energy-related emissions in 2019 (IEA).
E-waste is an 'urban mine', as it contains several precious, critical, and other non-critical metals that, if recycled, can be used as secondary materials. The value of raw materials in the global e-waste generated in 2019 is equal to approximately $57 billion USD. Iron, copper, and gold contribute mostly to this value. With the current documented collection and recycling rate of 17.4%, a raw material value of $10 billion USD is recovered in an environmental sound way from e-waste globally, and 4 Mt of raw materials could be made available for recycling. The recycling of iron, aluminium, and copper contributed to a net saving of 15 Mt of CO2, equivalent to emissions from the recycling of secondary raw materials substituted to virgin materials.
53.6 Mt7.3 kg per capita
Glob
al e-
waste generated 2019
Brominated Flame Retar-
dants (BFR)
71 kt
(Hydro)chlorofuoro-carbons ((H)CFCs)
Mercury Iron
Copper
Aluminiumvalue of raw
materials
$10 billion USD
value of raw materials in e-waste
$57 billion USD
17.4% | 9.3 Mt82.6% | 44.3 Mt
50 t
98 MtCO2
Global e-waste flows that are not documented
Global e-waste documented to be collected and properly recycled
amount of raw materials
4 Mt
67 countriescovered by legislation, policy, and regulation
covered by legislation, policy, and regulation
covered by legislation, policy, and regulation
78 countries61 countries
2014
2017
2019
In summary, it is essential to substantially increase the officially documented 17.4% global e-waste collection and recycling rate, especially in view of the rapid growth of this waste stream, which is already projected to reach 74.7 Mt by 2030, combined with increasing recovery of materials towards closed material loops and reducing the use of virgin materials.

16
Chapter 1 What is EEE and E-waste?

17

18 Chapter 1. What is EEE and E-Waste?
What is EEE and E-waste?
EEE includes a wide range of products with circuity or electrical components with a power or battery supply (Step Initiative 2014). Almost any household or business use products like basic kitchen appliances, toys, tools to music, and ICT items, such as mobile phones, laptops, etc.
Besides everyday household and business use, EEE are becoming increasingly used in transport, health, security systems, and generators of energy, such as photovoltaics. Traditional products, such as clothes and furniture, are often equipped with electrical components, and consequently are increasingly contributing to the global e-waste generated. More and more EEE is also employed in the expanding sector of the Internet of Things (IoT), such as sensors or devices pertaining to the concept of the “smart home” or “smart cities”.
EEE becomes e-waste once it has been discarded by its owner as waste without the intent of reuse (Step Initiative 2014). Each product has different material content, is disposed of and recycled in different ways, and is unequally harmful to the environment and human health if not managed in an environmentally sound manner.
EEE comprises of a large variety of products. For statistical purposes, however, EEE is classified by similar function, comparable material composition, average weight, and similar end-of-life attributes. The E-waste Statistics Guidelines on Classification Reporting and Indicators – Second Edition (Forti, Baldé, and Kuehr 2018) therefore divides EEE into 54 different product-centric categories. The categorization is referred to as the UNU-KEYs. The full list of UNU-KEYs can be viewed in Annex 1.
The 54 EEE product categories are grouped into six general categories that correspond closely to their waste management characteristics.

19
E-waste systems and schemes do not yet cover any kind of batteries, accumula-tors, or electrical components of vehicles.
Currently, this categorization is compliant with both the WEEE directive adopted by European member states (European Paliament 2003) and the internationally recognised framework for e-waste statistics described in the aforementioned Guidelines (Forti, Baldé, and Kuehr 2018) that are used in this report.
1. Temperature exchange equipment: more commonly referred to as cooling and freezing equip-ment. Typical equipment includes refrigerators, freezers, air conditioners, and heat pumps.
USB
2. Screens and monitors: typical equipment includes televisions, monitors, laptops, notebooks, and tablets.
USB
5. Small equipment: typical equipment includes vacuum cleaners, microwaves, ventilation equipment, toasters, electric kettles, electric shavers, scales, calculators, radio sets, video cameras, electrical and electronic toys, small electrical and electronic tools, small medical devices, small monitoring, and control instruments.
USB
USB
6. Small IT and Telecommunication equipment: typical equipment includes mobile phones, Global Positioning System (GPS) devices, pocket calculators, routers, personal computers, printers, and telephones.
USB
Chapter 1. What is EEE and E-Waste?
3. Lamps: typical equipment includes fluorescent lamps, high intensity discharge lamps, and LED lamps.
USB
4. Large equipment: typical equipment includes washing machines, clothes dryers, dishwashing machines, electric stoves, large printing machines, copying equipment, and photovoltaic panels.
USB

20
Chapter 2 Global E-waste Key Statistics

21
22 Chapter 2. Global E-waste Key Statistics
High income
2.8
51.581
0.7 1.6
16 0.4
0.4 1.4
Average household size:
Average purchasing power parity in USD per capita:
High/middle income
3.6
21.697
0.3 0.3
8 0.2
0.1 1.2
Average household size:
Average purchasing power parity in USD per capita:
Middle income
4.5
9.874
0.1 0.2
6 0.1
0.03 1
Average household size:
Average purchasing power parity in USD per capita:
Middle/low income
5.3
3.503
0.1 0.1
6 0.01
0.01 0.9
Average household size:
Average purchasing power parity in USD per capita:
Low income
5.0
1.261
0.02 0.1
4 0.001
0.003 0.6
Average household size:
Average purchasing power parity in USD per capita:
Washing machines (incl. combined dryers)
Microwaves (incl. combined, excl. grills)
Mobile phone subscriptions
Fridges (incl. combi-fridges)
Laptops (incl. tablets)
Lamps
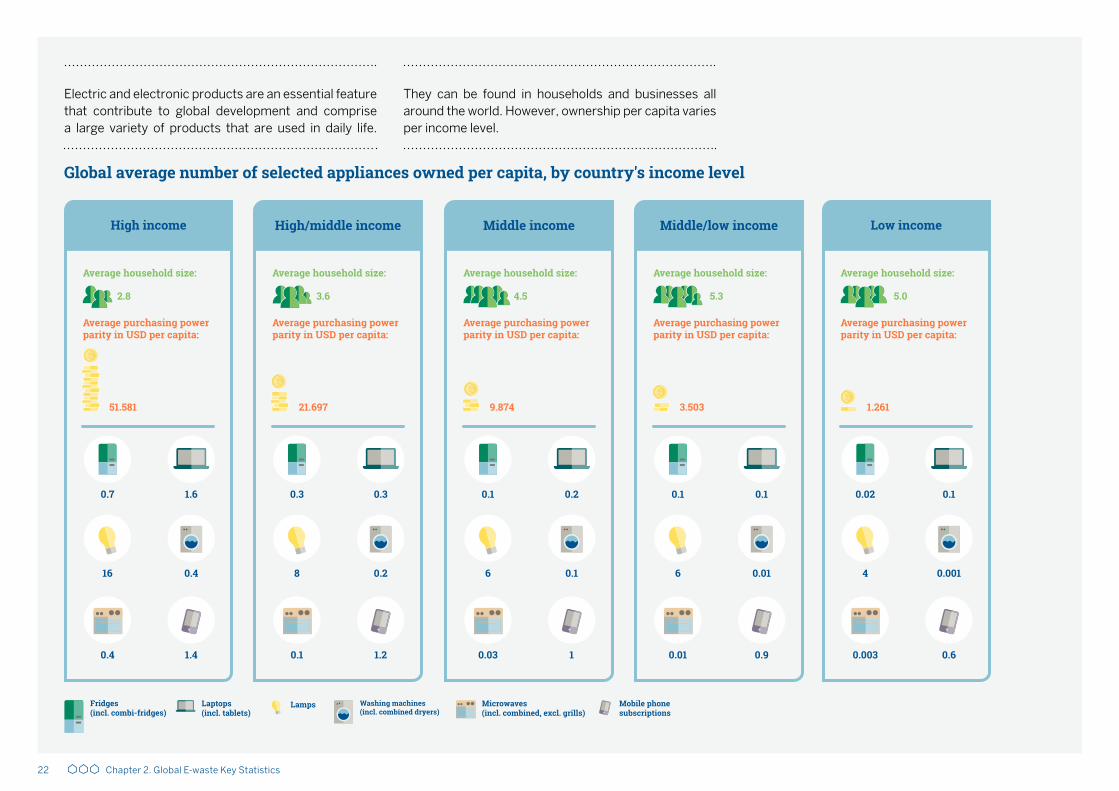
Electric and electronic products are an essential feature that contribute to global development and comprise a large variety of products that are used in daily life.
They can be found in households and businesses all around the world. However, ownership per capita varies per income level.
Global average number of selected appliances owned per capita, by country's income level

23Chapter 2. Global E-waste Key Statistics
of e-waste is unknown; this e-waste is likely dumped, traded, or recycled in a non-environmentally sound way
44.4 Mt6.4 kg per capita
53.6 Mt7.3 kg per capita
74.7 Mt9 kg per capita
Growth of 9.2 Mt
since 2014
2014
Global e-waste documented to becollected and properly
Global e-waste flows that are not documented
17.4% | 9.3 Mt
17.0% | 7.5 Mt
82.6% | 44.3 Mt
2030
0.6 Mt is estimated to end up in waste bins in EU countries
43.7 Mt
2019
Glob
al e-waste generatedGlob
al e-waste generated
Glob
al E-waste Generated
Growth of 1.8 Mtsince 2014
In 2019, approximately 53.6 million metric tons (Mt) of e-waste (excluding PV panels) was generated, or 7.3 kg per capita. It is estimated that the amount of e-waste generated will exceed 74Mt in 2030. Thus, the global quantity of e-waste is increasing at an alarming rate of almost 2 Mt per year.
In 2019, the formal documented collection and recycling was 9.3 Mt, thus 17.4% compared to e-waste generated. It grew with 1.8 Mt since 2014, an annual growth of almost 0.4 Mt. However, the total e-waste generation increased by 9.2 Mt, with an annual growth of almost 2 Mt. This illustrates that recycling activities
are not keeping pace with the global growth of e-waste.
Statistics on e-waste collected and recycled are based on data reported by countries. The most recent information available on the e-waste documented as formally collected and recycled worldwide refers on average to the year 2016 (see Annex 2 for the methodology and Annex 3 for the country data).
In 2019, the large majority of e-waste generated (82.6%) was most likely not formally collected and not managed in an environmental sound manner. Those flows are usually not documented in a
consistent or systematic manner. The lack of data on formally collected and recycled e-waste implies that most of the e-waste generated in 2019 (44.3 Mt) is managed outside the official collection system and, in some cases, is shipped to developing countries. In households of higher income countries, small-size electronics can end up in normal waste bins and be disposed with the municipal solid waste. Therefore, it is not subjected to proper recycling, resulting in a loss of materials. It is estimated that in EU countries, 0.6 Mt of e-waste ends up in waste bins (Rotter et al. 2016).

24 Chapter 2. Global E-waste Key Statistics
Temperature exchangeequipment
+7%10.8 Mt
Screens and monitors
-1%6.7 Mt
Largeequipment
+5%13.1 Mt
Lamps
0.9 Mt+4%
Smallequipment
17.4 Mt+4%
Small IT and telecom-munication equipment
4.7 Mt
USB
+2%
since 2014
since 2014
since 2014
since 2014
since 2014
since 2014
0 20 40 60 80 100
Mt
2030
2029
2028
2027
2026
2025
2024
2023
2022
2021
2020
2019
2018
2017
2016
2015
2014
2030
2029
2028
2027
2026
2025
2024
2023
2022
2021
2020
2019
2018
2017
2016
2015
2014kg per capita
10 8 6 4 2 0
6.4 44.4
46.4
48.2
50.0
51.8
53.6
55.5
57.4
59.4
61.3
63.3
65.3
67.2
69.2
71.1
72.9
74.7
6.6
6.8
6.9
7.1
7.3
7.5
7.6
7.8
8.0
8.2
8.3
8.5
8.6
8.8
8.9
9.0
0 10 20 30 40 50 60 70 80 90 100
Mt
The global quantity of e-waste in 2019 is mainly comprised of Small equipment (17.4 Mt), Large equipment (13.1 Mt), and Temperature exchange equipment (10.8 Mt). Screens and monitors, Small IT and telecommunication equipment, and Lamps represent a smaller share of the e-waste generated in 2019: 6.7 Mt, 4.7 Mt, and 0.9 Mt, respectively. Since 2014, the e-waste categories that have been increasing the most (in terms of total weight of e-waste generated) are the Temperature exchange equipment (with an annual average of 7%), Large equipment
(+5%), and Lamps and Small equipment (+4%). This trend is driven by the growing consumption of these products in lower income countries, where the products enhance living standards. Small IT and telecommunication equipment have been growing at lower speed, and Screens and monitors have shown a slight decrease (-1%). This decline can be explained by the fact that, lately, heavy CRT monitors and screens have been replaced by lighter flat panel displays, resulting in a decrease of the total weight even as the number of pieces continue to grow.
Global E-waste Generated by year
(Future projections do not take into account economic consequences related to the Covid-19 crisis)

25Chapter 2. Global E-waste Key Statistics
Asia
24.9 Mt (5.6 kg per capita)e-waste generated
2.9 Mt | 11.7% e-waste documented to be collected and properly recycled
Africa
2.9 Mt (2.5 kg per capita)e-waste generated
0.03 Mt | 0.9% e-waste documented to be collected and
Americas
13.1 Mt (13.3 kg per capita)e-waste generated
1.2 Mt | 9.4% e-waste documented to be collected and properly recycled
Oceania
0.7 Mt (16.1 kg per capita)e-waste generated
0.06 Mt | 8.8% e-waste documented to be collected and properly recycled
Europe
12 Mt (16.2 kg per capita)e-waste generated
5.1 Mt | 42.5% e-waste documented to be collected and properly recycled
In 2019, most of the e-waste was generated in Asia (24.9 Mt), while the continent that generates the most in kg per capita is Europe (16.2 kg per capita). Europe is also the continent with the highest documented formal e-waste collection and recycling rate (42.5%). In all other continents, the e-waste documented as formally collected and recycled is substantially lower than the estimated e-waste generated.
Current statistics show that in 2019, Asia ranked second at 11.7%, the Americas and Oceania stood at 9.4% and 8.8%, respectively, while Africa ranked last at 0.9%. However, statistics can vary substantially across different regions as the consumption and disposal behavior depends on a number of factors (e.g. income level, policy in place, structure of the waste management system, etc.).(2)

26 Chapter 2. Global E-waste Key Statistics
67 countries
population covered by legislation, policy, or
regulation
covered by legislation, policy, and regulation
covered by legislation, policy, and regulation
covered by legislation, policy, and regulation
population covered by legislation, policy, or
regulation
population covered by legislation, policy, or
regulation
66% 71%44%
78 countries
2014
61 countries
2017 2019
As of October 2019, 71% of the world’s population was covered by a national e-waste policy, legislation, or regulation. Improvements have been made since 2014 when only 44% of the population was covered. The high coverage rate is affected by the fact that the most populous countries, such as China and India, have national legal instruments in place. However, this population coverage equates to only 78 of the 193 countries. Thus, less than half of all countries in the world are currently covered by a policy, legislation, or regulation.

27Chapter 2. Global E-waste Key Statistics

28
Chapter 3 How E-waste Data Contribute to the SDGs

29

30 Chapter 3. How E-waste Data Contribute to the SDGs
In September 2015, the United Nations and all member states adopted the ambitious 2030 Agenda for Sustainable Development and identified 17 Sustainable Development Goals (SDGs) and 169 targets for ending poverty, protecting the planet, and ensuring prosperity for all over a 15-year span. Increasing levels of e-waste, improper and unsafe treatment, and disposal through incineration or in landfills pose significant challenges to the environment, human health, and to the achievement of the SGDs.
Progress towards attaining the SDGs and their 169 targets are measured by indicators and official statistics. Several targets and indicators are defined or are currently in the process of being measured as part of monitoring progress. Per target, a custodian agency, or agencies, have been defined to guide the process.
E-waste management closely relates to many SDGs, such as SDG 8 on decent work and economic growth, SDG 3 on good health and well-being, SDG 6 on clean waste and sanitation, and SDG 14 on life below water. In particular, given the high raw material demand for the production of EEE, e-waste also closely relates to the SDG indicators on the material footprint (SDGs 8.4.1 and 12.1.1) and the SDGs on the domestic material consumption (SDGs 8.4.2 and 12.2.2). Relatively general indicators are being used to measure progress towards these SDGs. By contrast, for e-waste, a more specific sub-indicator has been recognised for monitoring growth in the waste stream, which is of particular concern due to both its potential hazardousness and its high residual value. E-waste has been officially included in the work plan for the 12.5.1 SDG indicator and in the documentation around the indicator.(3) The importance of considering e-waste is discussed further in SDG indicator 12.4.2 on hazardous waste.

31Chapter 3. How E-waste Data Contribute to the SDGs
E-waste is covered namely by SDGs 11 and 12.
Target 11.6: By 2030, reduce the adverse per capita environmental impact of cities by paying special attention to air quality as well as municipal and other waste management. Since over half of the world’s population lives in cities, rapid urbanization requires new solutions to address rising environmental and human health risks, especially in densely populated areas. Most e-waste will be generated in cities, and it is particularly important to properly manage e-waste in urban areas, improve collection and recycling rates, and reduce the amount of e-waste that ends up in dumpsites. The move towards smart cities and the use of ICTs for waste management offer new and exciting opportunities.
Indicator 11.6.1: Percentage of urban solid waste regularly collected and with adequate final discharge with regard to the total waste generated by the city.
Target 12.4: By 2030, achieve the environmentally sound management of chemicals and all waste throughout the life cycle, in accordance with agreed-upon international frameworks, and significantly reduce their release into air, water, and soil in order to minimize their adverse impacts on human health and the environment. Indicator 12.4.2: Treatment of waste, generation of hazardous waste, and hazardous waste management, by type of treatment.
Target 12.5: By 2030, substantially reduce waste generation through prevention, reduction, repair, recycling, and reuse. An increasing number of people on the planet are consuming growing amounts of goods, and it is critical to make production and consumption more sustainable by raising awareness levels of producers and consumers, specifically in the area of electrical and electronic equipment.
Indicator 12.5.1 National recycling rate and tons of material recycled.
Goal 12: Ensure sustainable consumption and production patterns
Goal 11: Make cities and human settlements inclusive, safe, resilient, and sustainable
SDG 12.5.1 National recycling rate and tons of material recycled (e-waste sub-indicator)
The e-waste sub-indicator in SDG 12.5.1 has been defined as:
SDG 12.5.1 Sub-indicator on e-waste =
Where the “Total e-waste recycled” is equivalent to the “E-waste formally collected”, which is defined in E-Waste Statistics Guidelines (Forti, Baldé, and Kuehr 2018) as the amount of e-waste that is collected as such by the formal collection system. The “e-waste generated” is defined as the amount of discarded electrical and electronic products (e-waste) due to consumption within a national territory in a given reporting year, prior to any collection, reuse, treatment, or export.
For methodology and datasets, the custodian agencies UNEP and UNSD use the datasets and methodologies developed by SCYCLE, the Global E-waste Statistics Partnership, and the Partnership Measuring ICT for Development. With the current data, the SDG 12.5.1 sub-indicator on the e-waste recycling rate is 17.4% for 2019.
Total e-waste recycledTotal e-waste generated

32
Chapter 4 Measuring E-waste Statistics

33

34
Prevent dumping and emissions, as well as the improper treatment of e-waste
Reduce e-waste generation
Promoterecycling
USB
Create green jobs in the refur-bishment and recycling sectors
Quantify the magnitude of the e-waste challenges
Establish priorities for policy makers, influ-encing regulations, and setting policy targets
Set appropriate collection and recycling targets
Allocate adequate financial resources
iron
copper
aluminium
Chapter 4. Measuring E-waste Statistics
Monitoring the quantities and flows of e-waste is essential for evaluating developments over time, for setting and assessing targets. The development of sound policies and legal instruments can only be achieved with better
e-waste data. Understanding the quantities and flows of e-waste provides a basis for monitoring, controlling, and ultimately preventing illegal transportation, dumping, and improper treatment of e-waste. In the
At the global level, better data will help to minimize e-waste generation as a result of taking stock of the challenges and having the basis to make targeted policy interventions. Understanding the quantities of e-waste better helps and setting up ad-hoc instruments to promote recycling. Understanding the potential for e-waste recycling and refurbishment activities enables a forecast of potential green job creation in the refurbishment and recycling sectors. Having better e-waste data is essential in order to measure progress towards the global target set in 2018 at the
ITU Plenipotentiary Conference of increasing the global e-waste recycling rate to 30% by 2023.
Meanwhile, at the national level, harmonised and coherent e-waste data will also contribute to estimating the magnitude of challenges relating to e-waste, setting appropriate collection and recycling targets, establishing priorities for policy makers, influencing regulations, setting policy targets, and allocating adequate financial resources.
Global National
absence of any quantification of transboundary movements or informal e-waste activities, policy makers at the national, regional, and international levels will not be in a position to address these issues.

35
The internationally standardized methodology for measuring e-waste has been developed by the UNU SCYCLE Programme, in collaboration with the Task Group on Measuring E-waste within the UN Partnership on Measuring ICT for Development. The first edition of the E-waste Statistics Guidelines on classification, reporting, and indicators was published in 2015 and authored by UNU-SCYCLE(4), and underwent global consultation (Baldé, et al. 2015). The second edition was updated by UNU in 2018 (Forti, Baldé, and Kuehr 2018). The international methodology helps to harmonize the measurement framework and indicators, proving to be a substantial step towards reaching an integrated and comparable global measurement framework for e-waste. The same concepts formed the basis for the first Global E-waste Monitor (Baldé, Wang et al. 2015), and they are also used in the European Union as the common methodology to calculate the collection target of the recast EU-WEEE Directive (EU WEEE Directive 2012/19/EU).
The framework captures and measures the most essential features of a country's e-waste. The following indicators can be constructed from the framework:
1. Total EEE Placed on the Market (POM) (unit kg per capita).This represents the size of the national e-goods market.
2. Total e-waste generated (unit kg per capita). This represents the size of the national e-waste generated.
3. E-waste formally collected (unit kg per capita). This represents the amount of e-waste that is collected as such by the formal collection system.
4. E-waste collection rate = This indicator represents the performance of the formal collection systems.
total e-waste recycledx 100 per cent
total e-waste generated
Chapter 4. Measuring E-waste Statistics
Nowadays, there are only a few data sources on e-waste statistics that have global coverage, such as the WEEE Calculation tools developed by UNU-SCYCLE (European Commission 2019). International agencies, such as the Organization for Economic Co-operation and Development (OECD), the OECD Working Party on Environmental Information (WPEI), targeting non-EU OECD Member States, the United Nations Environment (UNEP), and the United Nations Statistics Division (UNSD, Environment Statistics Section) have recently begun gathering data on e-waste through specific questionnaires addressed to the ministries in charge of e-waste monitoring or National Statistical Offices. Several countries outside the EU still lack a measurement framework for measuring e-waste statistics. Other less developed countries lack a waste management infrastructure, specific legislation, and/or enforcement. Most importantly, the majority of the countries, including those that have received a survey, have reported the unavailability of official data on e-waste formally collected and recycled.

36 Chapter 4. Measuring E-waste Statistics
2. Use phase, including items in hibernation
1. Market EntryProductionand Trade
Life-time
Import & Export
3. E-waste Generated
Legislation, Policies, Expenditures (Countering Illicit Trade, Financing, Environmental Protection), and Benefits
(Environmental, Reclaimed Materials, Jobs)
Trade
The measurement framework starts with tracking the “production and trade” of EEE. There is a strong link between trade statistics and national production statistics. In this stage, the data is collected and published by custom organizations and/or national statistical institutes. By deducting the exports from the EEE imported and domestically produced, one is able to obtain data on EEE POM. The market entry includes EEE placed on the market by households, businesses, and the public sector.
After the equipment has been sold, it stays in households or businesses for some time until it is disposed of. This period is called “lifetime”. The equipment in households, businesses, and the public sector is referred to as the “use phase”, and includes the items that are in hibernation. This is destined to become e-waste in the future. The lifetime includes the dormant time in sheds and exchange of second-hand equipment between households and businesses within the country.
The third phase is when the product becomes obsolete to its final owner, is disposed of, and turns to waste, which is referred to as “e-waste generated”. It is the annual supply of domestically generated e-waste prior to collection without imports of externally generated e-waste.
The E-waste Statistics Guidelines describe a measurement framework that captures the most important dynamics of flows and stocks of EEE and e-waste.

37
E-waste Generated
Scenario 1: E-waste formally collected
Scenario 2: E-waste in waste bins
Scenario 3: E-waste collected outside of formal systems
in countries with a developed (e-)waste management infrastructure
Scenario 4: E-waste collected outside of formal systems
in countries with no developed (e-)waste management infrastructure
The e-waste generated is usually managed in one of four ways(5)
Chapter 4. Measuring E-waste Statistics

38
E-WASTERECYCLING
E-WASTERECYCLING
COLLECTION POINT
USB
MUNICIPAL PICK-UP SERVICE
COMMERCIAL PICK-UP SERVICE
RETAIL STOREE-WASTE
RECYCLING
Chapter 4. Measuring E-waste Statistics
The “formal collection” activities usually fall under the requirements of national e-waste legislation, in which e-waste is collected by designated organizations, producers, and/or the government. This happens via retailers, municipal collection points, and/or pick-up services. The final destination for the collected e-waste is a specialized treatment facility, which recovers the valuable materials in an environmentally controlled way and manages the hazardous substances in an environmental sound way. Residuals will then go to incineration or controlled landfills.
Scenario 1. E-waste formally collected

39Chapter 4. Measuring E-waste Statistics
In this scenario, the holder directly disposes of e-waste in normal waste bins with other types of household waste. As a consequence, the disposed e-waste is then treated with the regular mixed-waste from households. This waste is most likely incinerated or landfilled without material recycling, depending on the waste management infrastructure in a country. Neither option is regarded as an appropriate technique for treating e-waste because both could potentially negatively impact the environment and lead to resource loss.
Scenario 2. E-waste in waste bins

40
METALRECYCLING
PLASTICRECYCLING
INDIVIDUALWASTE
COMPANIES
PLASTICRECYCLING
METALRECYCLING
EXPORT
In countries that have developed waste management laws, e-waste is collected by individual waste dealers or companies and traded through various channels. Possible destinations for e-waste in this scenario include metal recycling and plastic recycling; however, the hazardous substances in e-waste are most likely not depolluted. In this scenario, e-waste is often not treated in a specialized recycling facility for e-waste management, and e-waste might also be exported.
Chapter 4. Measuring E-waste Statistics
Scenario 3. E-waste collected outside of formal systems in countries with a developed (e-)waste management infrastructure
41
BACKYARDRECYCLING
DOOR-TO-DOOR BUYERS
SECOND-HAND MARKET
DISMANTLING
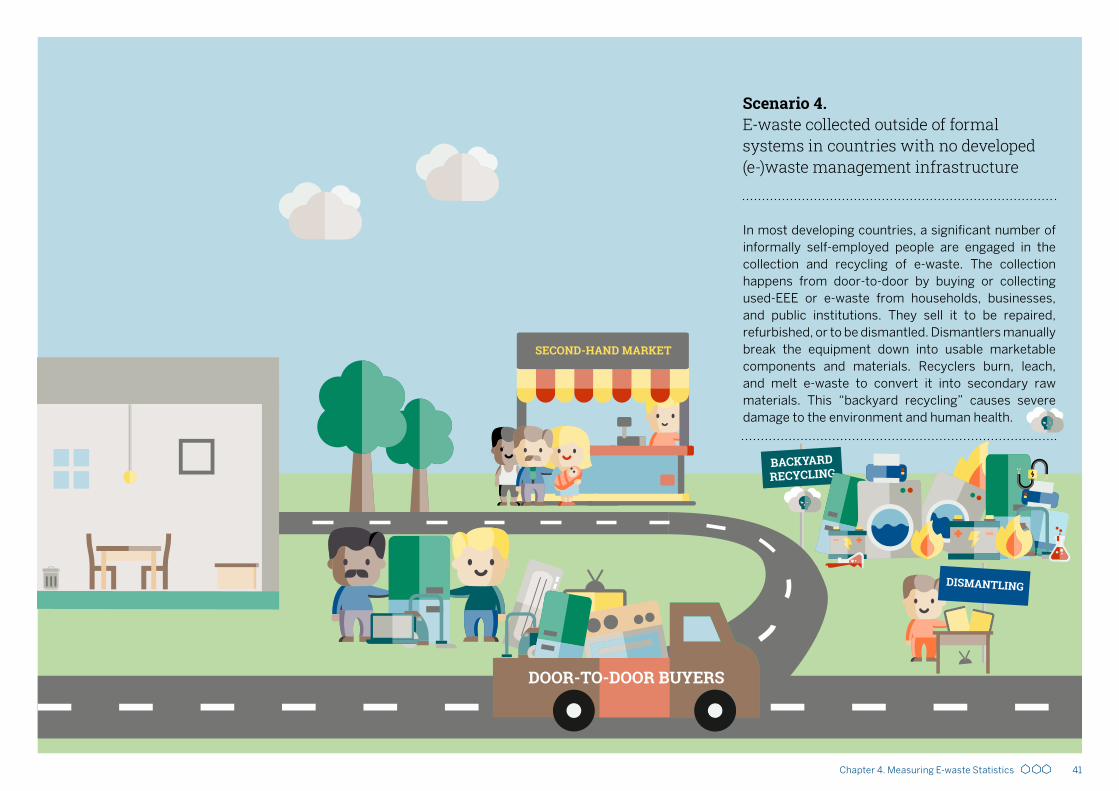
In most developing countries, a significant number of informally self-employed people are engaged in the collection and recycling of e-waste. The collection happens from door-to-door by buying or collecting used-EEE or e-waste from households, businesses, and public institutions. They sell it to be repaired, refurbished, or to be dismantled. Dismantlers manually break the equipment down into usable marketable components and materials. Recyclers burn, leach, and melt e-waste to convert it into secondary raw materials. This “backyard recycling” causes severe damage to the environment and human health.
Chapter 4. Measuring E-waste Statistics
Scenario 4. E-waste collected outside of formal systems in countries with no developed (e-)waste management infrastructure
42
Chapter 5 Worldwide Harmonisation by the Global E-waste Statistics Partnership
43

44 Chapter 5. Worldwide Harmonisation by the Global E-waste Statistics Partnership
Building on the partnership on Measuring ICT for development, in 2017, the United Nations University – SCYCLE programme (UNU-SCYLE), the International Solid Waste Association (ISWA), and the International Telecommunication Union (ITU) joined forces to create the Global E-waste Statistics Partnership in close collaboration with the United Nations Environment Programme (UNEP) to create the Global E-waste Statistics Partnership as a way of addressing the challenges associated with managing e-waste.
This initiative aims to collect data from countries and build a global e-waste database to track developments over time. The partnership has achieved this result by publishing the second edition of the Global E-waste Monitor – 2017 and building a website www.globalewaste.org to publicly visualize the most relevant e-waste indicators.
Since 2017, the Global E-waste Statistics Partnership has made substantial progress by organizing national
and regional progress by organizing workshops on e-waste statistics in various countries. So far, regional capacity-building workshops have been conducted in East Africa, Latin America, Eastern Europe, and the Arabian States. More than 360 people from 60 countries have been trained on the internationally adopted methodology. Between 2017 and 2019, approximately nine countries (apart from EU countries) have started compiling e-waste statistics on the adoption of the harmonised measurement framework, and most of them have obtained satisfactory results.
countries (apart from EU countries) have started compiling national e-waste statistics
9
people have been trained on e-waste statistics361
countries participated in e-waste statistics workshops
Regions that participated in e-waste statistics workshops
60
Eastern Europe
Latin America
East Africa
Arab states
CIS region
Between 2017 and 2020

45
“The workshop on e-waste statistics, held in November 2017 in Arusha, Tanzania, was very useful and provided me with a basic knowledge of e-waste statistics, which enabled me to initiate Ugandan statistics on e-waste. Having learned that the key variable for the POM was exports and imports of electronics, I started off with an inquiry from the Ugandan trade statistics section for provision of the data on EEE. I was then able to covert the national POM data in the international classification system, thanks to the correlation tables provided by SCYCLE. Finally, I was able to enter the data into the excel tool and calculate the e-waste generated in Uganda over a lengthy time period. This is an important achievement as country-specific e-waste statistics are useful both for quantifying the problem of e-waste in Uganda and for policy-making. I wish to thank the SCYCLE team for the invaluable support”.
0
5
10
15
20
25
30
35
40
20182017201620152014
0
5
10
15
20
20182017201620152014
EEE Put on the market (in kt)
E-Waste generated (in kt)
Uganda
Chapter 5. Worldwide Harmonisation by the Global E-waste Statistics Partnership
Mulindwa Muminu Matovu
Senior Statistician, Environment and Forestry Statistics Bureau of Statistics, Uganda Uganda
0
5
10
15
20
25
30
35
40
20182017201620152014
0
5
10
15
20
20182017201620152014
EEE Put on the market (in kt)
E-Waste generated (in kt)
Uganda
EEE Placed on the Market (in kt) in Uganda
E-waste generated (in kt) in Uganda

46 Chapter 5. Worldwide Harmonisation by the Global E-waste Statistics Partnership
“With SCYCLE’s support, the team and Environment Statistics Division carried out a workshop in October 2018 to develop the expertise in the field of electronic waste statistics. The workshop was a good opportunity to identify the current available data that can be used to produce e-waste statistics and identify the data gaps. The tools that were provided helped us to produce estimations of e-waste generated in the country. As a result of the capacity-building exercise, some data-producing institutions have adopted clear and specific methods and classifications (such as DOS, General Customs Department, Ministry of Industry and Trade). Additionally,the Environment Statistics Division carried out the survey of electronic and electrical waste in the domestic sector by using the international e-waste classification (Hamdan 2019). This exercise is the first of its kind in the region and represents a great success for the Jordan Department of Statistics. The data modelled using the e-waste statistics tools provided by SCYCLE have been used to match the results obtained from the surveys.
The Department of Statistics in Jordan plans to prepare an e-waste inventory report in the near future, and further refine the calculations for EEE POM and e-waste, and develop other monitoring methods.
Our warm thanks go to the SCYCLE team and the Global E-waste Statistics Partnership for their support and assistance in developing such an internationally harmonised e-waste classification, databases, and methodological framework. The results obtained in Jordan will be useful for informing policy makers and enhancing decisions”.
Jordan
Temperature exchange
equipment
Screens and monitors
160 823
563 20
657 11225
Lamps Large equipment
Small equipmentSmall IT and
telecommunication equipment
USB
E-waste generated from households in Jordan in 2018 (in tons)
Enas Mohammad Al-Arabyat
Sudki Sameer Hamdan
Head Assistance of Environment Statistics Division
Department of Statistics, Jordan
Expert Environmental and Energy Statistics Department of Statistics, Jordan

47Chapter 5. Worldwide Harmonisation by the Global E-waste Statistics Partnership
EEE Put on the market (in kt)
E-Waste generated (in kt)
0
5
10
15
20
25
30
35
20182017201620152014
0123456789
10
20182017201620152014
Bosnia and Herzogovina
EEE Put on the market (in kt)
E-Waste generated (in kt)
0
5
10
15
20
25
30
35
20182017201620152014
0123456789
10
20182017201620152014
Bosnia and Herzogovina
“Thanks to the cooperation with the SCYCLE programme from the United Nations University/Vice-Rectorate in Europe, Bosnia and Herzegovina adapted the e-waste generated tool for the calculation of e-waste in the country. The national bureau of statistics successfully calculated national EEE POM data in accordance with the requirements of Directive 2012/19/EU of the European Parliament and the Council of 4th of July 2012 on Waste Electrical and Electronic Equipment (WEEE). Additionally, the total e-waste generated both in terms of total weight and per capita was calculated. Results show that the average annual e-waste per capita is on the rise”.
Ševala Korajčević
Head of Transport, Environment, Energy and Regional Statis-tics Department Agency of Statistics, Bosnia and HerzegovinaEEE Put on the market (in kt)
E-Waste generated (in kt)
0
5
10
15
20
25
30
35
20182017201620152014
0123456789
10
20182017201620152014
Bosnia and Herzogovina
EEE Placed on the Market (in kt) in Bosnia and Herzegovina
E-waste generated (in kg per capita) in Bosnia and Herzegovina

48
EEE Put on the market (in kt)
E-Waste generated per category in 2017 (in kt)
05
101520253035404550
2017201620152014
Temperature exchange equipment
Screens and monitors
Lamps
Large equipment
Small equipment
Small IT and telecommuni-cation equipment
4.8
1.90.7
19.0
7.9
1.5
Tanzania
Chapter 5. Worldwide Harmonisation by the Global E-waste Statistics Partnership
“Before 2018, Tanzania, like many other developing countries, had challenges with respect to available and reliable e-waste data for tracking the progress to the implementation of national, regional, and global development frameworks. In addressing e-waste data gaps, the National Bureau of Statistics (NBS) of Tanzania has taken a lead role in a special programme to enhance availability of such data in the country. The outcome of this programme is the publication of the National E-Waste Statistics Report, 2019 (NEWSR). The NEWSR is the first-ever analytical report on e-waste in Tanzania and presents a fresh statistical outlook of the problem of e-waste in Tanzania. The NEWSR features analysis of data for EEE POM, mobile phone service subscriptions, and possession of some EEE from recent household surveys.
The production of NEWSR is a result of institutional collaborations, with NBS taking the lead role. In this collaboration, the SCYCLE team provided capacity-building and tools for data analysis. NEWSR wishes to thank the SCYCLE team for their technical support and all other institutions that financially supported this effort: Government of Tanzania, Deutsche Gesellschaft für Internationale Zusammenarbeit (GIZ GmbH), United Nations Environment Program (UNEP), and the Global e-waste Statistics Partnership”.
EEE Put on the market (in kt)
E-Waste generated per category in 2017 (in kt)
05
101520253035404550
2017201620152014
Temperature exchange equipment
Screens and monitors
Lamps
Large equipment
Small equipment
Small IT and telecommuni-cation equipment
4.8
1.90.7
19.0
7.9
1.5
TanzaniaEEE Put on the market (in kt)
E-Waste generated per category in 2017 (in kt)
05
101520253035404550
2017201620152014
Temperature exchange equipment
Screens and monitors
Lamps
Large equipment
Small equipment
Small IT and telecommuni-cation equipment
4.8
1.90.7
19.0
7.9
1.5
TanzaniaRuth Minja
Ag. Director for Population Census and Social Statistics
National Bureau of Statistics, Tanzania
EEE Placed on the Market (in kt) in Tanzania
E-waste generated per category in 2017 (in kt) in Tanzania

49Chapter 5. Worldwide Harmonisation by the Global E-waste Statistics Partnership

50
Chapter 6 E-waste Legislation and Transboundary Movement

51

52 Chapter 6. E-waste Legislation and Transboundary Movement
Governments around the world are developing national e-waste policies and legislation to deal with the growth of end-of-life electrical and electronic products. Such a policies lay out plans or courses of action and indicate, in a non-binding manner, what can be achieved by a society, institution, or company. Legislations are enacted at the national or municipal level and enforced by regulators, and a regulation indicates the way in which a legislation is enforced by regulators.
As of October 2019, 78 countries have either a policy, legislation, or regulation governing e-waste in place. With these, 71% of the world’s population is currently covered. This is an increase by 5% from 66% in 2017. But the coverage rate can be misleading, as it gives the impression that there is little left to do in terms of regulating the management of e-waste: in many countries, policies are non-legally binding strategies, but only programmatic ones. Across Africa and Asia, for example, there are 19 countries with legally binding legislation on e-waste, 5 countries with an e-waste policy but non-legally binding legislation, and 31 countries with policy in development (GSMA 2020).
67 countries
population covered by legislation, policy, or
regulation
covered by legislation, policy, and regulation
covered by legislation, policy, and regulation
covered by legislation, policy, and regulation
population covered by legislation, policy, or
regulation
population covered by legislation, policy, or
regulation
66% 71%44%
78 countries
2014
61 countries
2017 2019
However, even in some countries where legally binding policies are enacted, enforcement is a key issue. In the European Union, for example, the range of collected e-waste is vis-à-vis to what has been put on market, and ranges from 12% in Malta to 26% in Cyprus to 56% in Sweden to 58% in both Poland and Austria to 61% in Hungary. Only Estonia (82%) and Bulgaria (79%) are above the legally binding 65% target, jointly set in the European Union (SCYCLE data, unpublished).
Having the best policy or regulatory framework in the world means nothing unless it is setting reachable targets and effectively enforced. This is, unfortunately too often not the case, while at the same time, the overarching e-waste management system in many countries is not appropriately financed – if it is financed at all.
Since the Global E-waste Monitor 2017, policy makers in industrialized and emerging economies have continued focusing much of their policy and legislative efforts on developing financing and awareness schemes that ensure better participation of both the private sector and individual consumers. The objective here is to ensure higher collection and recycling rates and to generate the revenue necessary to meet treatment costs. Most legislative instruments concentrate on resource recovery through recycling and countermeasures against environmental pollution and human health impacts at the end-of-life of products. The reduction of e-waste volumes and substantive repair and reuse of EEE has been limited so far.
Since the Global E-waste Monitor 2017, more and more e-waste-related policies, legislations, and resulting regulations are also considering more upscale design and production aspects – no longer focusing on the purely curative waste management aspects. This is in line with the globally increasing policy efforts towards a Circular Economy. Also, in response to the recently forecasted scenarios for e-waste increases in 2050 and 2100 (Parajuly et al. 2019), which could result in more than a doubling of the annual e-waste generation in the next 30 years, a reconsideration of the present approaches, or at least a substantial enforcement of the present legislations and regulations, is required.
53Chapter 6. E-waste Legislation and Transboundary Movement
Establish a clear legal framework for e-waste collection and recycling.
Introduce extended producer responsibility to ensure producers finance the collection and recycling of e-waste.
Enforce legislation for all stakeholders, and strengthen monitoring and compliance mechanisms across the country to ensure a level playing field.
Create favourable investment conditions for experienced recyclers to bring the required technical expertise to the country.
Create a licensing system or encourage certification via international standards for collection and recycling.
If an informal collection system exists, use it to collect e-waste, and ensure e-waste is sent to licensed recyclers through incentives.
When no local end-processing facilities exist for an e-waste fraction, ensure good and easy access to internationally licensed treatment facilities.
Ensure that costs to run the system are transparent, and stimulate competition in the collection and recycling system to drive cost effectiveness.
Ensure that all stakeholders involved in e-waste collection and recycling are aware of the potential impacts on the environment and human health as well as possible approaches to the environmentally sound treatment of e-waste.
Create awareness on the environmental benefits of recycling among consumers. (Magalini et al. 2016)
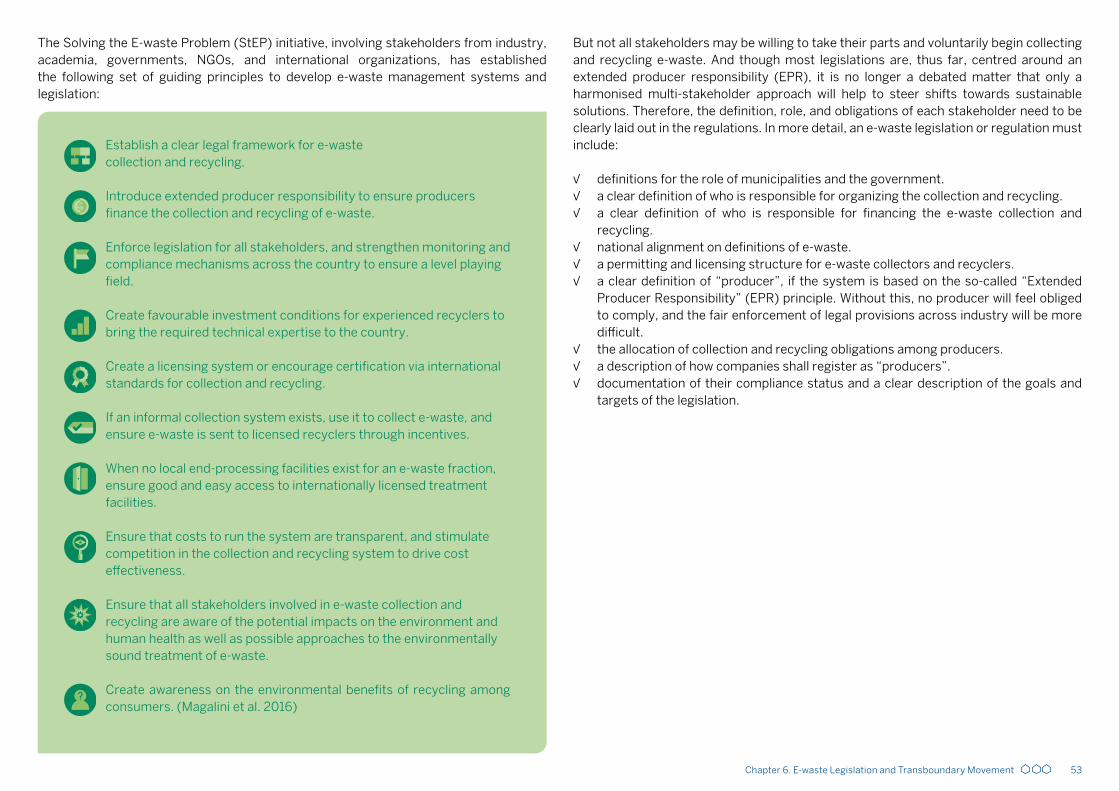
The Solving the E-waste Problem (StEP) initiative, involving stakeholders from industry, academia, governments, NGOs, and international organizations, has established the following set of guiding principles to develop e-waste management systems and legislation:
But not all stakeholders may be willing to take their parts and voluntarily begin collecting and recycling e-waste. And though most legislations are, thus far, centred around an extended producer responsibility (EPR), it is no longer a debated matter that only a harmonised multi-stakeholder approach will help to steer shifts towards sustainable solutions. Therefore, the definition, role, and obligations of each stakeholder need to be clearly laid out in the regulations. In more detail, an e-waste legislation or regulation must include:
√ definitions for the role of municipalities and the government. √ a clear definition of who is responsible for organizing the collection and recycling. √ a clear definition of who is responsible for financing the e-waste collection and
recycling. √ national alignment on definitions of e-waste. √ a permitting and licensing structure for e-waste collectors and recyclers. √ a clear definition of “producer”, if the system is based on the so-called “Extended
Producer Responsibility” (EPR) principle. Without this, no producer will feel obliged to comply, and the fair enforcement of legal provisions across industry will be more difficult.
√ the allocation of collection and recycling obligations among producers. √ a description of how companies shall register as “producers”. √ documentation of their compliance status and a clear description of the goals and
targets of the legislation.

54
About the Basel Convention
The Basel Convention on the Control of Transboundary Movements of Hazardous Wastes and Their Disposal is a multilateral treaty aimed at suppressing environmentally and socially detrimental hazardous waste trading patterns. The convention was opened for signature in 1989 and made effective in 1992 and, to date, has been signed by 187 countries. (6) E-waste, due to its constitution, often contains hazardous elements. Therefore, the Convention affirms that in order to protect human health and the environment, hazardous waste should not be traded freely like ordinary commercial goods, and thus it establishes a written notification and approval process for all cross-border movements of hazardous wastes. But the Basel Convention’s regulatory exemption on equipment destined for reuse is entirely compatible with its prime environmental objective of preventing waste generation, as reuse extends the life cycle of EEE and therefore mitigates the generation of hazardous waste. By prolonging the functionality of electronics, reuse promotes natural resource conservation and at least temporarily diverts the need for recycling or disposal. However, the distinction of whether something is waste or not, and therefore intended for reuse, is a longstanding discussion under the Basel Convention. Although the most recent Conference-of-Parties (COP14) adopted, on an interim basis, the revised technical guidelines on transboundary movements of electrical and electronic waste and used electrical and electronic equipment, a final consensus has still not been reached concerning the definition of waste. National reporting, which is carried out voluntarily by Parties to the Convention, currently stands at less than 50% of signatories.
There are two sound policy decisions that can be made unilaterally with regard to ensuring better and more effective enforcement, which is the major stumbling block for all legislation and policies in place. First, more resources should be provided to customs and harbour officials to help them in combatting the illegal trade in e-waste. Given all the other priorities that are often rightly deemed more critical for authorities to focus on – such as the arms trade, drug shipments, and human trafficking – it is of little wonder that e-waste is not in the priority list, despite of recent development towards a circular economy. Secondly, penalties for trying to export e-waste illegally should be increased so that they provide some sort of meaningful deterrent, or at least a substantial inconvenience, to those trying to break the law.
McCann and Wittmann (2015) worked out that, based on the differences in the operational and financial structures of systems in place around the world, it is possible to define at least three generic financing models, or stakeholder groups, that have potential, individual, or shared responsibility for end-of-life EEE:
(i) Entire society: the first model looks to set upfront fees to be paid by the producer when the product is placed on the market. (ii) Consumers: secondly, there is the model that makes the person or entity responsible for disposing the e-waste financially liable for the cost of the collection and recycling. (iii) Producers: the third type uses a market share approach to financing, seeking to recoup all the actual operational costs of running the collection system.
Also, since the Global E-waste Monitor 2017, the EPR principle is usually taken into account when developing new legislations and policies around the globe. With this, the producers shall also take responsibility over the post-consumer stage of a product’s lifecycle. Therefore, EPR policies were expected to incentivize product design that encourages reuse and recycling. But it is becoming more and more obvious that most producers are unwilling and likely unable to take up their responsibility without a concerted effort with other key stakeholders, such as governments, municipalities, retailers, collectors, recyclers, and consumers. The staggering collection against what is put of market gives reason for this assessment. Moreover, producers also show increasingly less interest in e-waste initiatives such as StEP or the Basel Convention’s PACE and, instead, are interested in being associated with circular economy approaches.
Chapter 6. E-waste Legislation and Transboundary Movement

55Chapter 6. E-waste Legislation and Transboundary Movement
Transboundary flows of e-waste have become a major concern for both exporter and importer countries. Some data suggests that the majority of e-waste is shipped from the Northern hemisphere for informal disposal in developing countries. Although the exact volume of the flow of e-waste is difficult to measure – as much of it is exported illegally or under the guise of being intended for reuse or as scrap – it is widely accepted that the volume is significant, but a considerable share takes other routes. The issue of transboundary movements of e-waste from developed to developing countries raises concerns both because it causes an additional environmental burden in the destination countries and because e-waste is likely to be managed by the informal sector. As a consequence, the management of e-waste is carried out in an environmentally unsound manner, which poses significant risks to health and the environment. However, recent trends show that, in some cases, e-waste shipments take a regional route (e.g. from Western/Northern Europe to Eastern Europe) rather than a strictly “North-South” route. On the other end, as the e-waste collection system make progress in developing counties, there is evidence that valuable components such as Printed Circuit Boards (PCB) are being shipped these days from the Southern hemisphere to the Northern hemisphere for recycling. This is the case in Ghana and Tanzania, for example. And though transboundary movements were long-perceived as exports from the rich to the poor, there are growing indications worldwide that historically well-regarded import countries such as China are also increasingly exporting e-waste to Southeast Asia, Africa, and elsewhere (Lepawsky 2015). Transboundary movement also appears dynamic in time, reacting to social, economic, and regulatory changes. One example is the rapid shift of processing operations from China to Southeast Asian countries such as Thailand, Malaysia, and Vietnam as a consequence of the China’s import ban on waste in effect since 2018.
Currently, there are very few statistics based on hard data that are related to imports and exports of waste, used electronics, and e-waste. The national reporting data by Parties (meaning country signatories) to the Basel Convention mandated under Article 13 provides some information to analyse flows and amounts of transboundary movement of e-waste, but it is insufficient for a comprehensive analysis because of incomplete reporting by many Parties, ambiguous definitions, incorrect categorization among the
Parties, discrepancies in reporting, and data inaccuracies (Forti, Baldé, and Kuehr 2018). Currently, international trade data do not distinguish between new and used EEE, and, obviously illegal trade flows across countries are cumbersome to measure directly, due to the illegal nature of the activity. An interesting update is that recently, the Harmonised System Committee (RSC) provisionally adopted amendments to the HS codes to provide for the identification of electrical and electronic waste in the HS nomenclature under 8549. The amendments are likely to enter into effect on 1 January 2022 (Basel Convention 2019).
Thus far, there have been some attempts to quantify the transboundary movements of used electronics and e-waste, using several different methods. Most credible reports regarding transboundary flows of used EEE in the USA were conducted by Duan et al. (2013) under the Step umbrella. The study undertook a quantitative analysis of the transboundary flows of used electronics between and from North American countries and used a Mass Balance method together with a Hybrid Sales Obsolescence-Trade Data Method (HSOTDM). By analysing the results, it can be concluded that approximately 8.5% of the used EEE products generated in 2010 were exported (Lasaridi et al. 2016).Another study presented a similar result for the year 2011: 7% of used EEE were exported from the USA in 2011 (USITC 2013).
According to a study for the European Commission (BIO intelligence Service 2013), roughly 15% of used electrical and electronic equipment (UEEE) is exported from the EU, mainly for reuse. It is important to note that part of this UEEE either becomes WEEE during the transport (e.g. if there is not appropriate protection of the product during transport) or shortly after arriving in the destination country. This share is confirmed by another study undertaken by the Countering WEEE Illegal Trade (CWIT) project, which found that in the EU, 15.8 % (1.5 Mt) of the e-waste generated in 2012 (9.5 Mt) was exported. 1.3 Mt departed the EU in undocumented exports. Since the main economic driver behind these shipments is reuse and repair, as opposed to the dumping of the e-waste, an estimated 30% of this volume is e-waste (Huisman et al. 2015). A more recent study (Baldé et al 2020) reports that 8% of the total e-waste generated in the Netherlands is exported for reuse. Another study conducted in 2019 (Zoeteman, Krikke, and Venselaar 2010) assumed that free riders were responsible for 10-20% of the total e-waste generated being illegally exported to non-OECD countries, and that a part was exported legally for reuse in developing countries. An earlier study (Geeraerts, Mutafoglu, and Illés 2016) suggested that assuming a “minimum export/import scenario”, 10% of EU e-waste is exported illegally from the EU, while another 10% of the EU e-waste is exported legally as used EEE.
Based on the above estimates, it can be concluded that the transboundary movements of used EEE or e-waste is in the range of 7-20 % of the e-waste generated.

56
Chapter 7 The Potential of E-waste in a Circular Economy

57

58
From a material design perspective, EEE is very complex. Up to 69 elements from the periodic table can be found in EEE, including precious metals (e.g. gold, silver, copper, platinum, palladium, ruthenium, rhodium, iridium, and osmium), Critical Raw Materials (CRM)(7) (e.g. cobalt, palladium, indium, germanium, bismuth, and antimony), and non-critical metals, such as aluminium and iron.
Within the paradigm of a circular economy, the mine of e-waste should be considered an important source of secondary raw materials. Due to issues relating to primary mining, market price fluctuations, material scarcity, availability, and access to resources, it has become necessary to improve the mining of secondary resources and reduce the pressure on virgin materials. By recycling e-waste, countries could at least mitigate their material demand in a secure and sustainable way.
This report shows that, globally, only 17.4% of e-waste is documented to be formally collected and recycled. Collection and recycling rates need to be improved worldwide.
H He
Li Be NeB C N O F
Na Mg ArAl Si P S Cl
K Ca KrSc Ti V Cr Mn Fe Co Ni Cu Zn Ga Ge As Se Br
Rb Sr XeY Zr Nb Mo Tc Ru Rh Pd Ag Cd In Sn Sb Te I
Cs Ba Rn57 71
Hf Ta W Re Os Ir Pt Au Hg Tl Pb Bi Po At
Fr Ra UuoRf Db Sg Bh Hs269
Mt Ds Rg Cn Uut Fl Uup Lv Uus
La Ce Pr Nd Pm Sm Eu Gd Tb Dy Ho Er Tm Yb Lu
Ac Th Pa U Np Pu Am Cm Bk Cf Es Fm Md No Lr
89 103
1
Hydrogen1.008
2
Helium4.002602
3
Lithium6.94
4
Beryllium9.0121831
10
Neon20.1797
5
Boron10.81
6
Carbon12.011
7
Nitrogen14.007
8
Oxygen15.999
9
Fluorine18.998403163
11
Sodium22.98976928
12
Magnesium24.305
18
Argon39.948
13
Aluminium26.9815385
14
Silicon28.085
15
Phosphorus30.973761998
16
Sulfur32.06
17
Chlorine35.45
19
Potassium39.0983
20
Calcium40.078
36
Krypton83.798
21
Scandium44.955908
22
Titanium47.867
23
Vanadium50.9415
24
Chromium51.9961
25
Manganese54.938044
26
Iron55.845
27
Cobalt58.933194
28
Nickel58.6934
29
Copper63.546
30
Zinc65.38
31
Gallium69.723
32
Germanium72.630
33
Arsenic74.921595
34
Selenium78.971
35
Bromine79.904
37
Rubidium85.4678
38
Strontium87.62
54
Xenon131.293
39
Yttrium88.90584
40
Zirconium91.224
41
Niobium92.90637
42
Molybdenum95.95
43
Technetium98
44
Ruthenium101.07
45
Rhodium102.90550
46
Palladium106.42
47
Silver107.8682
48
Cadmium112.414
49
Indium114.818
50
Tin118.710
51
Antimony121.760
52
Tellurium127.60
53
Iodine126.90447
55
Caesium132.90545196
56
Barium137.327
86
Radon222
72
Hafnium178.49
73
Tantalum180.94788
74
Tungsten183.84
75
Rhenium186.207
76
Osmium190.23
77
Iridium192.217
78
Platinum195.084
79
Gold196.966569
80
Mercury200.592
81
Thallium204.38
82
Lead207.2
83
Bismuth208.98040
84
Polonium209
85
Astatine210
87
Francium223
88
Radium226
118
Ununoctium294
104
Rutherfordium267
105
Dubnium268
106
Seaborgium269
107
Bohrium270
108
Hassium
109
Meitnerium278
110
Darmstadtium281
111
Roentgenium281
112
Copernicium285
113
Ununtrium286
114
Flerovium289
115
Ununpentium289
116
Livermorium293
117
Ununseptium294
57
Lanthanum138.90547
58
Cerium140.116
59
Praseodymium140.90766
60
Neodymium144.242
61
Promethium145
62
Samarium150.36
63
Europium151.964
64
Gadolinium157.25
65
Terbium158.92535
66
Dysprosium162.500
67
Holmium164.93033
68
Erbium167.259
69
Thulium168.93422
70
Ytterbium173.054
71
Lutetium174.9668
89
Actinium227
90
Thorium232.0377
91
Protactinium231.03588
92
Uranium238.02891
93
Neptunium237
94
Plutonium244
95
Americium243
96
Curium247
97
Berkelium247
98
Californium251
99
Einsteinium252
100
Fermium257
101
Mendelevium258
102
Nobelium259
103
Lawrencium266
LanthanideSeries
ActinideSeries
Elements quantifiedin the report
Elements found in EEE
Precious
Critical
Non-critical
On the other hand, the recycling sector is often confronted with high costs of recycling and challenges in recycling the materials. For instance, the recovery of some materials such as germanium and indium is challenging because of their dispersed use in products, and the products are neither designed nor assembled with recycling principles having been taken into account.
On the other hand, base metals (e.g. gold) used in certain devices, such as mobile phones and PCs, have a relatively high level of concentration: 280 grams per ton of e-waste. Methods employed to separate and recycle e-waste can be economically viable, especially if carried out manually, where the material losses are less than 5% (Deubzer 2007). Separate collection and recycling of e-waste can thus be economically viable for products containing high concentrations and contents of precious metals. Nevertheless, the recycling rate of most CRMs is still very low and can be improved for precious metals by better collection and pre-treatment of e-waste.
Chapter 7. The Potential of E-waste in a Circular Economy
Source: Deubzer et al. 2019

59Chapter 7. The Potential of E-waste in a Circular Economy
Overall, the value of selected raw materials(8) contained in e-waste in 2019 was equal to approximately $57 billion USD(9), corresponding to a total of 25 Mt.
Iron, aluminium, and copper represent the majority of the total weight of raw waste materials that can be found in e-waste in 2019. These quantities and the material value could be recovered only in an ideal scenario in which all e-waste generated globally is recycled and the recycling of all selected raw materials is economically viable or even feasible with
manufacturing
use
recycle
ideal 100% recycling
AgAlAuBiCoCuFeGe
mill.USD579
60629481
1.31036
1096024645
0.4
kt1.2
30460.20.113
180820466
0.01
InIrOsPdPtRhRuSb
mill.USD175
1083532
71320
3644
kt0.2
0.0010.01
0.10.002
0.010.0003
76
estimated amount of the analysed raw materials in e-waste in 2019
25 Mt
potential value of the analysed raw materials in e-waste in 2019
$57 billion USD
53.6 Mt7.3 kg per capitaGlobal E-waste Genera
ted
14 M
t of v
irgin
raw m
aterial
estimated demand of raw materials for the production of new electronics
39 Mt
EEE
the recycling technologies currently available.
By improving e-waste collection and recycling practises worldwide, a considerable amount of secondary raw materials – precious, critical, and non-critical – could be made readily available to re-enter the manufacturing process while reducing the continuous extraction of new materials.
The demand of iron, aluminium, and copper for the production of new electronics in 2019 was
approximately 39 Mt. Even in an ideal scenario in which all the iron, copper and aluminium resulting from e-waste (25 Mt) is recycled, the world would still require approximately 14 Mt of iron, aluminium and copper from primary resources to manufacture new electronics (11.6 Mt, 1.4 Mt, and 0.8 Mt, respectively).(10) This indicates that the gap between the secondary iron, aluminium and copper found in e-waste and their demand for the production of new EEE is quite large. This is a consequence of the continuous growth of sales of EEE.

60
71 ktamount of Brominated Flame Retardants (BFR) from unaccounted flows of e-waste
0.05 ktamount of mercury from unaccounted flows of e-waste
Mt C
O2 e
quiv
alen
ts
0
20
40
60
80
100
20192018201720162015201420132012201120102009200820072006200520042003200220012000
-15 Mt of CO2 equivalents their reuse as secondary products has helped save up to 15 Mt of CO2 equivalents emissions
$10 billion USDpotential value that could be recovered
4 Mtestimated amount of raw materials that could be available for recycling
iron
copperaluminium
+ 98 Mt of CO2 equivalentspotentially released from the inferior recycling of undocumented fridges and air-conditioners
CO2
53.6 Mt7.3 kg per capita
Glob
al
E-waste Generated in 2019CO2
17.4% documented:
collected/properly recycled
82.6% of e-waste flows
is not documented
Chapter 7. The Potential of E-waste in a Circular Economy
With the current documented formal collection and recycling rate of 17.4%, a potential raw material value of $10 billion USD can be recovered from e-waste, and 4 Mt of secondary raw materials would become available for recycling. Focusing only on iron, aluminium, and copper and comparing emissions resulting from their use as virgin raw materials or secondary raw materials, their recycling has helped save up to 15 Mt of CO2 equivalent emissions in 2019 (see Annex 2 for details on the methodology).
EEE also contains hazardous substances, usually heavy metalssuch as mercury, cadmium, or lead and chemicals such as chlorofluorocarbons (CFCs), hydrochlorofluorocarbons (HCFCs), and flame retardants. Approximately 71 kt of plastic containing BFR (Brominated Flame Retardants) arise from the unaccounted flows of e-waste generated in 2019 (see Annex 2 for details on the methodology). In particular, BFR are used in appliances to reduce the product's flammability, appearing, for example, in outer casings of
computers, printed wiring boards, connectors, relays, wires, and cables (McPherson, Thorpe, and Blake 2004 & Herat 2008). The recycling of plastic containing BFR represents a major challenge for e-waste recycling because of the costs related to the separation of plastic containing PBDEs and PBBs from other plastic. Recycled plastic with PBDE and PBB content higher than 0.1% cannot be used for manufacturing of any products, including EEEs. In most cases, compliant recyclers incinereate plastic containing PBDEs and PBBs under controlled conditions to avoid the release of dioxins and furans. On the other end, if incineration is not carried out in an environmentally sound manner, those substances are likely to pose risks to health or the environment. The use of PBDEs and PBBs have been banned in Europe (European Parliament 2011). Some of these contaminants have been banned in Europe, as risk assessment studies have shown that they are persistent, bioaccumulative, and toxic, and can be responsible for kidney damage, several skin disorders, and nervous and immune systems and effects to the nervous and immune systems.

61Chapter 7. The Potential of E-waste in a Circular Economy
Mercury is used in fluorescent light sources, e.g. in background lights of older flat panel displays and TVs, in compact fluorescent lamps (“energy-saving lamps”), fluorescent lamps, in measure and control equipment, and in old switches. (Baldé et al. 2018). If these appliances are abandoned in open dumpsites as opposed to being properly recycled, mercury can enter the food chain and accumulate in living organisms while bringing damage to the central nervous system, thyroid, kidneys, lungs, immune system, etc (Baldé et al. 2018). A total of 50 t of mercury can be found in the unaccounted flows of e-waste generated in 2019 worldwide.
Chlorofluorocarbons (CFCs) and Hydrochlorofluorocarbons (HCFCs) are present in refrigerant circuits and insulating foams of older generations of cooling and freezing equipment, such as refrigerators, freezers, and air-conditioning systems. These molecules have a long lfespan in the atmosphere. They react with ozone molecules (O3), generating molecular oxygen that thins the stratospheric ozone layer (ozone hole). This process leads to an increment of the UV radiation that can pass the stratosphere, likely causing skin cancers, eye-related diseases, and a weakening of the immune system. The Montreal Protocol (adopted in 1987) regulates the production and consumption of manmade chemicals known as ozone-depleting substances, which includes the phasing out of CFCs and HCFCs. These gases have high global warming potential (GWP). If EEE containing these gases is not managed in an environmentally sound manner, refrigerants could be emitted into the atmosphere. Estimations show that a total of 98 Mt of CO2 equivalents(11) were released from the inferior recycling of undocumented fridges and air conditioners (40% in Europe and 82.6% in the rest of the world). Greenhouse gas (GHG) emissions from the improperly managed refrigerants estimated to be found in air conditioners overtook the emissions from fridges in 2013. In 2019, of the total CO2 equivalents estimated to be released into the atmosphere, 73% were from air conditioners and 27% were from fridges. This is explained by the fact that refrigerants with high global warming potential were used before 1994 (e.g. R-11 and R-12) and until 2017 (R-134a and R-22). Since then, the refrigerants have been substituted by others with a substantially lower GWP (e.g. R-152a and R-124yf). The decrease of CO2 equivalent emissions, reflecting the recent obligations for replacing the refrigerants, will be observed only in the next decades, when the new products placed on the market will become waste (see Annex 2 for details on the methodology).
The presence of hazardous substances and scarce or valuable materials in e-waste makes it necessary to recycle and treat the e-waste in an environmentally sound manner; doing so helps avoid the release of such substances into the environment and the losses of ecologically and economically valuable materials. Although several pieces of legislation have banned the use of some substances and are pushing for them to be replaced by safer materials, appliances that were produced in the past and still contain those substances must, once discarded, be treated adequately in order to contain the risks that they can pose to the environment and health. In addition, new equipment may also still contain smaller amounts of those banned substances, due to the fact that they technically cannot yet be substituted or eliminated.
It can be assumed that at least most e-waste collection, treatment, and disposal in the formal sector is legally compliant, thus taking care of the environmental, health, and safety aspects. This assumption may not be applicable for treatment and disposal outside the formal sector. Non-compliant recycling proves to be a cheaper option than the compliant recycling. A recent study by the European Electronics Recyclers Association (EERA) and the United Nations University (Magalini and Huisman 2018) shows that a European compliant recycler incurs substantially higher costs than a non-compliant recycler. In detail, the compliant recyclers based in Europe normally incur technical costs such as costs related to treatment, de-pollution, disposal of hazardous fractions, and disposal of non-hazardous fractions, as well as the proof of legal compliance, quality, and service level.
The study concludes that the potential cost reductions that can be realised by non-compliant treatment exceed the normal economic margins of legitimate recyclers, applying best available technology and ensuring full compliance, which leads to unfair competition.
Small household equipment
Large household equipment
Cooling and freezing equipment
$220 USD per ton
$290 USD per ton
$130 USD per ton
Source: Magalini and Huisman 2018
62
Chapter 8 E-waste Impact on the Health of Children and Workers

63

64
Occupational exposure
- Dumping acid used to remove gold into rivers- Leaching of substances from landfills or stored electronics - Particulate matter, dioxins, furans from dismantling electronics- Contaminants entering the water system and food system through livestock, fish, and crops
Children
Community exposure - Inhaling fumes from burning wires and cooking circuit boards- Pregnant women working as recyclers – exposure of fetuses
- Exposure through food, water, air- Home based workshops
- Ingesting contaminated dust on surfaces- Playing with dismantled electronics- Children and adolescents working in collection, dismantling, and recycling
Environmental contamination
Chapter 8. E-waste Impact on the Health of Children and Workers
Sources of health or environmental impact caused by informal e-waste recycling
Children live, work, and play in informal e-waste recycling sites. Adults and children can be exposed by inhaling toxic fumes and particulate matter, through skin contact with corrosive agents and chemicals, and by ingesting contaminated food and water. Children are also at risk from additional routes of exposure. Some hazardous chemicals can be passed from mothers to children during pregnancy and breast-feeding. Young children playing outside or in nature frequently put their hands, objects, and soil in their mouths, increasing the risk of exposure. Fetuses, infants, children, and adolescents are particularly vulnerable to damage from exposure to toxicants in e-waste because of their physiology, behaviour, and additional routes of exposure (Landrigan & Goldman 2011; Pronczuk de Garbino 2004).
Adverse health effects recently found to be associated with e-waste Since the publication of the previous e-waste monitor in 2017, the number of studies on the adverse health effects from e-waste have increased. These studies have continued to highlight the dangers to human health from exposure to well-studied toxins, such as lead. Recently, research has found that unregulated e-waste recycling is associated with increasing numbers of adverse health effects. These include adverse birth outcomes (Zhang Y et al. 2018), altered neurodevelopment (Huo X et al. 2019b), adverse learning outcomes (Soetrisno et al. 2020), DNA damage (Alabi OA et al. 2012.), adverse cardiovascular effects (Cong X et al. 2018), adverse respiratory effects (Amoabeng Nti AA et al. 2020), adverse effects on the immune system (Huo X et al. 2019b), skin diseases (Decharat S et al. 2019; Seith et al. 2019), hearing loss (Xu L et al. 2020), and cancer (Davis JM et al. 2019).

65Chapter 8. E-waste Impact on the Health of Children and Workers
Associations between exposure to informal e-waste recycling and health of infants and children.
Adverse birth outcomes.(12)
A small number of studies have suggested the effects to health shown below, which may be associated with exposure to informal e-waste management.
Increased or decreased growth.(13)
Effects on the immune system.(16)
Effects on lung function.(17) (18) Multiple studies have investigated the impact of e-waste exposure on thyroid function of children but have reported inconsistent results.(19)
Altered neurodevelopment, adverse learning, and behavioural outcomes.(14) (15)
DNA damage(21) and changes in gene expression(22) (23)
Cardiovascular regulatory changes(26)
Rapid onset of blood coagulation(25)
Olfactory memory(20)
Hearing loss(24)
Because of their unique vulnerability and susceptibility to environmental toxicants, infants and children have been a significant focus of health effects studies.
Since the publication of the previous e-waste monitor in 2017, research on unregulated e-waste recycling and its associations with adverse health outcomes has expanded. These studies have continued to highlight the dangers to human health from exposure to well-studied toxins, such as lead. The following section highlights the most recent findings between e-waste recycling and human health outcomes.
Studies have reported associations between exposure to informal e-waste recycling and adverse birth outcomes (stillbirth, premature birth, lower gestational age, lower birth weight and length, and lower APGAR scores), increased or decreased growth, altered neurodevelopment, adverse learning and behavioral outcomes, immune system function, and lung function. Multiple studies have investigated the impact of e-waste exposure on thyroid function in children but have reported inconsistent results. A small number of studies have also suggested that DNA damage, changes in gene expression, cardiovascular regulatory changes, rapid onset of blood coagulation, hearing loss, and olfactory memory may be associated with exposure to informal e-waste management.
Associations between exposure to informal e-waste recycling and the health of infants and children

66 Chapter 8. E-waste Impact on the Health of Children and Workers
Associations between exposure to informal e-waste recycling and health of workers.
The lack of workplace health and safety regulations leads to an increased risk of injuries for workers in informal e-waste dismantling and recycling.(27) (28)
E-waste workers have also reported stress, headaches, shortness of breath, chest pain, weakness, and dizziness.(29) (30)
As well as
DNA damage(31) (32)
Fasting blood glucose levels(33)
Male reproductive and genital disorders, as well as effects on sperm quality(35) (36)
Effects on liver function(34)
The lack of workplace health and safety regulations leads to an increased risk of injuries for workers in informal e-waste dismantling and recycling.
E-waste workers have also reported stress, headaches, shortness of breath, chest pain, weakness, and dizziness. Among adults involved in informal e-waste management or living in e-waste communities, DNA damage has been associated with exposure to chemicals in e-waste. A small number of studies have also reported effects on liver function, fasting blood glucose levels, male reproductive and genital disorders, and effects on sperm quality from exposure to informal e-waste recycling. There has been a large increase in research into the health impacts of e-waste recycling over the last decade. It is difficult to assess whether exposure to e-waste as a whole causes specific health outcomes because of studies' small populations, the variety of chemical exposures measured, the variety of outcomes measured, and the lack of prospective long-term studies. Yet the body of research suggests there is a significant risk of harm, especially to children who are still growing and developing. Individual chemicals in e-waste such as lead, mercury, cadmium, chromium, PCBs, PBDEs, and PAHs are known to have serious impacts on nearly every organ system (Grant et al. 2013).
Associations between exposure to informal e-waste recycling and the health of workers

67
Availability of health statistics In addition to reliable statistics on e-waste collection, processing, and conditions of work, harmonised data on the number of people exposed, exposure to hazardous toxicants, and health effects are critical to understanding the impact of e-waste management. Harmonised statistics are vital for monitoring health impacts, informing decision-makers of the scope of the problem, and evaluating interventions.
ExposureLimited data are available on the number of people exposed to e-waste. Only rough estimates are available of the number of people involved in informal e-waste management internationally and in impacted countries (EMG 2019; ILO, 2019; Perkins DN 2014; Prakash et al 2010; Xing GH et al. 2009). It is often unclear what methods have been used to produce these estimates. They often do not take into account individuals living in communities but not involved in informal recycling, children, or those exposed to pollutants through environmental contamination.
Large populations in e-waste recycling hotspots may be at risk. But just because a country doesn’t have a concentrated neighbourhood of e-waste recycling activity doesn’t mean it has no e-waste problem. E-waste is part of a larger waste context and is often collected door-to door or sent to landfills as part of general waste. Waste-pickers, who are among the poorest and most vulnerable, may be exposed in communities around the world (Gutberlet J & Uddin SMN 2017). In Latin America, e-waste is often recycled in small shops across cities, instead of being concentrated in one area (ITU et al. 2016a).
A growing number of studies have measured the daily intake and body burden of single e-waste pollutants, but they have been limited to small numbers of participants (Song & Li 2014). Long-term monitoring of occupational exposure, burdens on the body, environmental levels, and health is needed to quantify the impact of e-waste (Heacock et al. 2018). Experts have recommended that exposure and environmental monitoring include metals, small particulate matter (PM2.5), persistant organic pollutants (POPs), and PAHs (Heacock et al. 2018). Large biomonitoring initiatives are being developed to monitor exposure to chemical hazards (Prüss-Ustün A et al. 2011) and may be a good model for e-waste.
Health effects Although there is a growing amount of information about the health effects of e-waste exposure, there is limited data available about the number of people suffering from the effects. Academic studies of exposure and health effects have primarily been small studies of 50 to 450 participants (Grant K et al. 2013; Song Q & Li J 2015; Zeng X et al. 2019b; Zeng Z et al. 2018a). Some of these studies have reported contamination of control groups, suggesting the widespread transport of contaminants (Sepúlveda et al. 2010; Song Q & Li J 2015). No large-scale longitudinal studies have been published. There are significant challenges to collecting e-waste-related health statistics, such as the large number of potential health outcomes, the challenges of studying chemical mixtures, the lack of confirmed exposure-outcome relationships, and the long latency periods of some diseases. Internationally harmonised indicators can assist in measuring the number of people at risk of e-waste-related health effects and with monitoring trends over time.
Chapter 8. E-waste Impact on the Health of Children and Workers

68
Chapter 9 Regional E-Waste Key Statistics

69

70 Chapter 9. Regional E-Waste Key Statistics
LegislationIn past years, there have been some improvements in the legal, institutional, and infrastructural framework for achieving sound management of e-waste in some countries. In Ghana, Technical Guidelines on Environmentally Sound E-Waste Management for Collectors, Collection Centers, Transporters, Treatment Facilities, and Final Disposal have been developed and are being enforced. In Nigeria, the EPR took off with formation of the E-waste Producer Responsibility Organisation of Nigeria (EPRON), a non-profit organization set up by electrical and electronic producers in Nigeria. EPRON is the first Producer Responsibility Organization (PRO) for electronic waste in Nigeria and was founded in March 2018 with such stakeholders as HP, Dell, Phillips, Microsoft, and Deloitte contributing towards its establishment in Nigeria. In East Africa, there are also significant continuing developments, with Rwanda adopting e-waste regulation and other countries looking at adopting future regulations.
Nevertheless, specific e-waste legislation on management of e-waste is still lacking in most African countries. Few countries have e-waste legislation published in Africa (e.g. Egypt, Ghana, Madagascar, Nigeria, Rwanda, South Africa, Cameroon, Côte D'Ivoire). However, enforcing the legislation is very challenging. Some countries, such as Rwanda, have recently passed regulations governing e-waste management. Uganda implemented an Electronic Waste Management Policy in 2012. In the East Africa community, Tanzania, Rwanda, Uganda, Burundi, Kenya, and South Sudan have adopted a regional e-waste strategy to achieve a sustainable e-waste management system (EACO 2017). The strategy prioritizes a) strengthening the policy, legal, and regulatory framework for sustainable resourcing of e-waste management, b) putting in place the requisite e-waste management infrastructure, c) establishing mechanisms for comprehensive and sustainable mobilization for e-waste management resources, d) strengthening e-waste coordination structures at regional and national levels, and e) promoting research and innovation in e-waste management.
E-waste management systemE-waste management in Africa is dominated by thriving informal sector collectors and recyclers in most countries; neither organized take-back systems nor license provisions for sorting and dismantling e-waste exist. Government control of this sector is currently very minimal and inefficient. The handling of e-waste is often processed in backyards by manual stripping to remove electronic boards for resale, open burning of wires to recover few major components (e.g. copper, aluminum, and iron), and the deposition of other bulk components, including CRTs, in open dumpsites. An example that has attracted international attention is the Agbogbloshie site in Ghana – always referred to as Africa's largest electronic waste dump. However, Agbogbloshie's reality is complex and can be described as a well-organized scrapyard as opposed to an e-waste dumpsite. At Agbogbloshie, roughly 5,000 scrap workers turn up at the dump every day to search for valuable metals contained in the waste, such as aluminium and copper.
$3.2 Billion value of raw materials in e-waste
9.4 Mt CO2 equivalentspotential release of GHG emissions from undocu-mented wasted fridges and air conditioners
0.01 ktamount of mercury from undocumented flows of e-waste
5.6 ktamount of BFR from undocumented flows of e-waste
2.9 Mt | 2.5 kg per capitae-waste generated
0.9% | 0.03 Mt e-waste documented to be collected and properly recycled
13 countries have a national e-waste legisla-tion/policy or regulation in place
E-waste status in Africa in 2019
1152population (millions)
49countries analysed
0 to 1 kg per capita1 to 3 kg per capita3 to 6 kg per capita6 to 10 kg per capita10+ kg per capita
E-waste generatedLegend
E-waste generated (in Mt and kg per capita)E-waste documented to be collected and properly recycledPopulation (in millions)
Countries with the highest e-waste generation per sub-region
Eastern Africa
0.3 Mt | 0.8 kg per capita 1.3% | 0.004 Mt 383
EthiopiaKenyaTanzania
55.2 kt51.3 kt50.2 kt
Middle Africa
0.2 Mt | 2.5 kg per capita 0.03% | 0.0001 Mt 80
AngolaCameroonCongo
125.1 kt26.4 kt18.3 kt
Northern Africa
1.3 Mt | 5.4 kg per capita 0% | 0 Mt 240
EgyptAlgeriaMorocco
585.8 kt308.6 kt164.5 kt
Southern Africa
0.5 Mt | 6.9 kg per capita 4% | 0.02 Mt 67
South AfricaBotswanaNamibia
415.5 kt18.8 kt15.7 kt
Western Africa
0.6 Mt | 1.7 kg per capita 0.4% | 0.002 Mt 382
NigeriaGhanaCôte d'Ivoire
461.3 kt52.9 kt30.0 kt

71
In such cities or countries where the e-waste is a source of revenue for many, the “informal” e-waste collection rate is extremely high, most of the valuable materials are recovered, and many components are reused or resold. The downside of such intense informal activities is not of interest economically or that don't end up having a second application are disposed of in a hazardous way.
Few countries, such as South Africa, Morocco, Egypt, Namibia, and Rwanda, have some facilities in place for e-waste recycling, but those co-exist with the existence of a large informal sector. Therefore, some of those recycling companies have struggled to progress and increase the volumes processed, but interesting pilots and energies are also mobilized through new initiatives. On the other hand, sizeable countries such as Nigeria, Kenya, and Ghana are still very reliant on informal recycling. A study conducted in Nigeria shows that approximately 60,000-71,000 t of used EEE were imported annually into Nigeria through the two main ports in Lagos in 2015 and 2016. It was found that most of the imported used e-waste was shipped from developed countries such as Germany, UK, Belgium, USA, etc. Additionally, a basic functionality test showed that, on average, at least 19% of devices were non-functional (Odeyingbo, Nnorom, and Deubzer 2017).
E-waste management problems and attendant remedies are somewhat similar in the various sub-regions of Africa. In summary, the major problems include the lack of adequate public awareness, lack of government policy and legislation, lack of an effective collection system and EPR system, the dominance of the recycling sector by an uncontrolled, ill-equipped informal sector that pollutes the environment, lack of adequate recycling facilities, and poor financing of hazardous waste management activities.
Chapter 9. Regional E-Waste Key Statistics

72
LegislationThe United States of America does not have national legislation on the management of e-waste, but 25 states and the District of Columbia have enacted some form of legislation. The state laws vary in their scope and impact and in whether or not they prohibit consumers from disposing electronics in landfills. In all, the laws cover 75-80% of the USA population. However, due to the differences in scope, many areas of the country, including states covered by laws, do not have convenient collection opportunities. Apart from California and Utah, all states that have implemented laws use an EPR approach. Canada does not have a national legislation in effect on the management of e-waste, as the federal agency would not have this authority. However, 12 provinces and territories have regulations in place with industry-managed programmes – all but Nunavut, the least populated territory in Canada. On average, the product scope is much wider than USA; in many Canadian provinces, the EPR requirements can be met by joining an approved e-waste compliance scheme.
Regulatory advances in Latin America take time, and only a few countries have managed to establish e-waste laws. Although there has been considerable progress regarding the implementation of specific e-waste regulations in Latin America in the past 5-10 years, this progress is limited to a few countries, and for the rest, the road ahead is still very long. Apart from Mexico, Costa Rica, Colombia, and Peru – likely the leading forces in the region for environmentally sound e-waste management and which, in 2020, are working on improving the already established systems, only Brazil and Chile are establishing the bases from which to start with the implementation of a formal regulatory framework for e-waste.Brazil recently published the “Sectoral Agreement for the Implementation of the Reverse Logistics System for WEEE from households” for public consultation, and its formal signature is expected in 2020. After enacting the “Framework Law on Waste Management, Extended Producer Responsibility, and Promotion of Recycling” in 2016, Chile is now working on the specific e-waste regulation, which will include collection and recycling targets and set the guidelines for the implementation of formal collection systems. Seven years after implementing Decree 1512 for waste from computers, printers, and peripherals, Colombia is working on a new regulation to extend EPR to all e-waste categories and make adjustments to the integrated management system for e-waste, taking into account the lessons learned and the guidelines established by WEEE Law 1672 and the National Policy for WEEE Management. Looking back already on five years since the implementation of its first e-waste management systems, Peru has been evaluating the experience very closely so that it can close loopholes and make alignments with the country’s general waste management strategy. The revised regulation is expected to be published soon and will also extend the scope of e-waste categories with a mandatory collection target of small and large household appliances and, in particular, cooling appliances.
13.1 Mt | 13.3 kg per capitae-waste generated
9.4% | 1.2 Mt e-waste documented to be collected and properly recycled
10 countries have a national e-waste legisla-tion/policy or regulation in place
E-waste status in the Americas in 2019
$14.2 billion USDvalue of raw materials in e-waste
26.3 Mt CO2 equivalentspotential release of GHG emissions from undocu-mented wasted fridges and air conditioners
0.01 ktamount of mercury from undocumented flows of e-waste
18 ktamount of BFR from undocumented flows of e-waste984
population (millions)34countries analysed
0 to 4 kg per capita4 to 7 kg per capita7 to 10 kg per capita10 to 15 kg per capita15+ kg per capita
E-waste generatedLegend
E-waste generated (in Mt and kg per capita)E-waste documented to be collected and properly recycledPopulation (in millions)
Northern America
15% | 1.2 Mt
USACanada
6.918 kt757 kt
3677.7 Mt | 20.9 kg per capita
Caribbean
1% | 0.001 Mt
Jamaica 18 kt
160.1 Mt | 7.8 kg per capita
Central America
MexicoGuatemalaCosta Rica
1.220 kt75 kt51 kt
1.5 Mt | 8.3 kg per capita 3% | 0.04 Mt 176
South America
BrazilArgentinaColombia
2.143 kt465 kt318 kt
3.9 Mt | 9.1 kg per capita 0.7% | 0.03 Mt 425
Countries with the highest e-waste generation per sub-region
Chapter 9. Regional E-Waste Key Statistics

73
As of 2020, Mexico is planning on reviewing the current regulation after its first five-year term and has been expanding several studies in order to redefine the responsibilities of involved stakeholders, establish clearly defined categories, and set mandatory collection targets, thereby increasing collected and formally recycled volumes.Costa Rica has finally overcome its initial challenges created by contradictory regulations and is now focusing on improving the implementation of the current regulation. Following numerous unsuccessful initiatives and law projects with a specific focus on e-waste at both the federal and provincial level, Argentina has now changed its approach by drafting an EPR law for multiple waste categories. The law is still being discussed in the Congress. Through its Ministerial Agreement 191, Ecuador has been enforcing the take-back of mobile phones from all mobile phone operators and importers, which led to the collection and recycling of nearly 50,000 units in 2017. Bolivia introduced the principle of EPR in its general waste management law in 2015, which applies to several waste fractions, especially batteries. Nevertheless, the law has never been regulated and therefore doesn’t establish any applicable collection targets.
The short summary of abovementioned countries highlights a general problem observable throughout the region: the lack of harmonisation of these regulations and the general principles they are based upon. Most of them present differences in the general approach (EPR vs. shared responsibility vs. public sector programmes), in jurisdictions level (federal vs. state vs. city), the definitions of the fundamental principles, the involved stakeholders, the allocation of roles and responsibilities, and the applicable e-waste categories, just to name a few.
E-waste management systemThe USA undertook general measures to prevent e-waste at the federal level and, so, does have a set of regulatory measures for limiting the adverse effects posed by unappropriated disposal and treatment of electronics. Certain electronics, if meeting certain criteria, must be managed under the requirements of the Resource Conservation and Recovery Act (RCRA). Federal agencies are directed to use electronics recyclers that are certified according to either the Responsible Recycling (R2) or e-Stewards standards. Hundreds of electronics recycling facilities have been independently certified to one or both of the certification programmes, whose standard have been updated and enhanced since their inception in 2010.Latin America still offers a very wide range of companies involved in today’s e-waste management and disposal activities, especially when it comes to the development of the local recyclers. On one hand, while there were only three R2-certified companies south of Mexico just a few years ago, there are now more than 15. On the other hand, the number of e-waste recyclers in nearly all countries has grown considerably, but most of the newer companies are still at the very bottom of the learning curve. Although there have been some interesting initiatives, it has not been possible yet to establish technical standards
that respond to the local conditions of the region.
Without a doubt, the growing number of recyclers in the region is also a consequence of the growing volumes of formally collected end-of-life electronics. In countries with a specific legal framework for e-waste and mandatory collection targets, such as Colombia and Peru, the growth of the collected volumes has been steady and remarkable. In parallel, the range of appliances collected has also widened. The focus is no longer only on information and communication technologies only. Goods – especially cooling appliances – have been included in the scope, and there are several projects focusing primarily on energy efficiency programmes and the development of local infrastructure in order to ensure proper handling and treatment of discarded appliances and, thus, the reduction of greenhouse gas emissions.
Driven by regulation, the importance of formal collection systems is also increasing, as is the number of individual or collective compliance schemes. Very large quantities are still handled by the informal sector or, in the best cases, stored away in basements. The informal sector is part of the labor structure of Latin America, but only very few countries, such as Brazil and Chile, are actively addressing their role in relation to e-waste management. Recognition, regulation, and integration of their work in this area is clearly one of the region's great challenges.
Another challenge is the lack of contributions from the research field. There are hardly any e-waste statistics, and the few available have been overused and are worn out. There is a need for up-to-date information and proven methodologies that support the definition of policies and regulations. Only by getting a grip on such updating of information will it be possible to tackle the far more complex topic of raising the awareness level and educating consumers of all sorts to help bring e-waste management in Latin America to the next level.
Chapter 9. Regional E-Waste Key Statistics
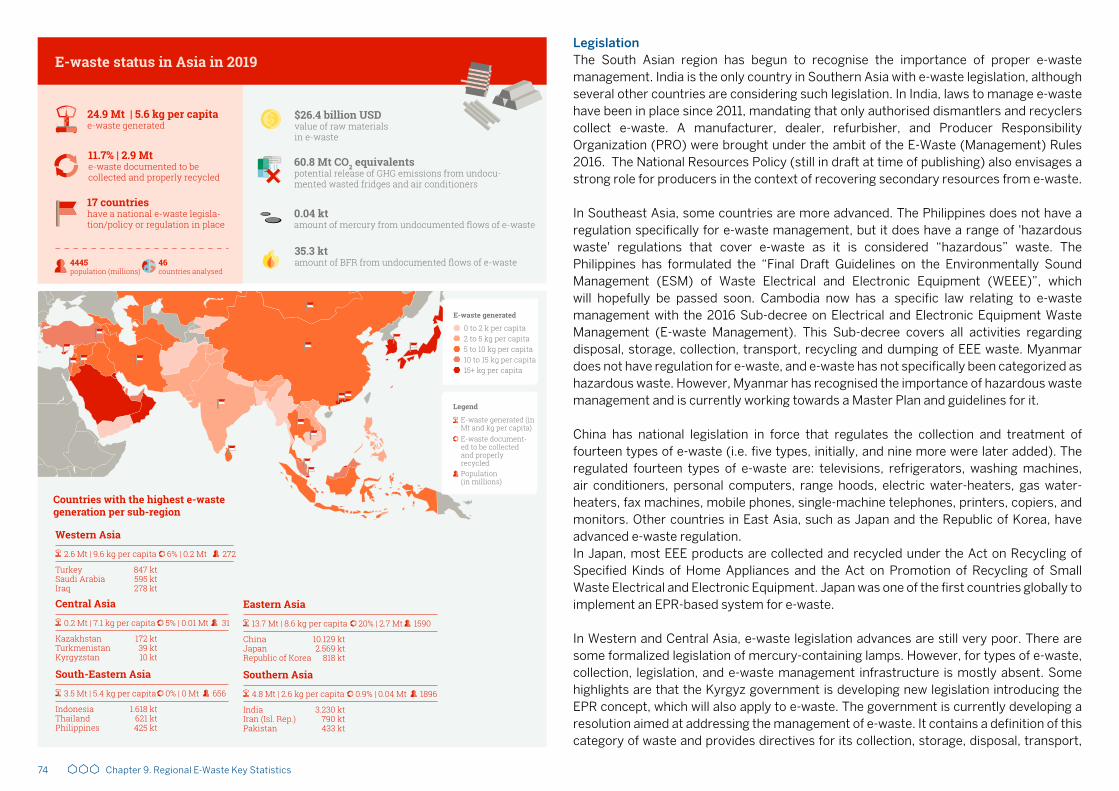
74
LegislationThe South Asian region has begun to recognise the importance of proper e-waste management. India is the only country in Southern Asia with e-waste legislation, although several other countries are considering such legislation. In India, laws to manage e-waste have been in place since 2011, mandating that only authorised dismantlers and recyclers collect e-waste. A manufacturer, dealer, refurbisher, and Producer Responsibility Organization (PRO) were brought under the ambit of the E-Waste (Management) Rules 2016. The National Resources Policy (still in draft at time of publishing) also envisages a strong role for producers in the context of recovering secondary resources from e-waste.
In Southeast Asia, some countries are more advanced. The Philippines does not have a regulation specifically for e-waste management, but it does have a range of 'hazardous waste' regulations that cover e-waste as it is considered “hazardous” waste. The Philippines has formulated the “Final Draft Guidelines on the Environmentally Sound Management (ESM) of Waste Electrical and Electronic Equipment (WEEE)”, which will hopefully be passed soon. Cambodia now has a specific law relating to e-waste management with the 2016 Sub-decree on Electrical and Electronic Equipment Waste Management (E-waste Management). This Sub-decree covers all activities regarding disposal, storage, collection, transport, recycling and dumping of EEE waste. Myanmar does not have regulation for e-waste, and e-waste has not specifically been categorized as hazardous waste. However, Myanmar has recognised the importance of hazardous waste management and is currently working towards a Master Plan and guidelines for it.
China has national legislation in force that regulates the collection and treatment of fourteen types of e-waste (i.e. five types, initially, and nine more were later added). The regulated fourteen types of e-waste are: televisions, refrigerators, washing machines, air conditioners, personal computers, range hoods, electric water-heaters, gas water-heaters, fax machines, mobile phones, single-machine telephones, printers, copiers, and monitors. Other countries in East Asia, such as Japan and the Republic of Korea, have advanced e-waste regulation. In Japan, most EEE products are collected and recycled under the Act on Recycling of Specified Kinds of Home Appliances and the Act on Promotion of Recycling of Small Waste Electrical and Electronic Equipment. Japan was one of the first countries globally to implement an EPR-based system for e-waste.
In Western and Central Asia, e-waste legislation advances are still very poor. There are some formalized legislation of mercury-containing lamps. However, for types of e-waste, collection, legislation, and e-waste management infrastructure is mostly absent. Some highlights are that the Kyrgyz government is developing new legislation introducing the EPR concept, which will also apply to e-waste. The government is currently developing a resolution aimed at addressing the management of e-waste. It contains a definition of this category of waste and provides directives for its collection, storage, disposal, transport,
$26.4 billion USDvalue of raw materials in e-waste
60.8 Mt CO2 equivalentspotential release of GHG emissions from undocu-mented wasted fridges and air conditioners
0.04 ktamount of mercury from undocumented flows of e-waste
35.3 ktamount of BFR from undocumented flows of e-waste
24.9 Mt | 5.6 kg per capitae-waste generated
11.7% | 2.9 Mt e-waste documented to be collected and properly recycled
17 countries have a national e-waste legisla-tion/policy or regulation in place
E-waste status in Asia in 2019
4445population (millions)
46countries analysed
0 to 2 k per capita2 to 5 kg per capita5 to 10 kg per capita10 to 15 kg per capita15+ kg per capita
E-waste generated
Legend
E-waste document-ed to be collected and properly recycledPopulation (in millions)
E-waste generated (in Mt and kg per capita)
South-Eastern Asia
3.5 Mt | 5.4 kg per capita 0% | 0 Mt 656
IndonesiaThailandPhilippines
1.618 kt621 kt425 kt
Central Asia
0.2 Mt | 7.1 kg per capita 5% | 0.01 Mt 31
KazakhstanTurkmenistanKyrgyzstan
172 kt39 kt10 kt
Eastern Asia
13.7 Mt | 8.6 kg per capita 20% | 2.7 Mt 1590
ChinaJapanRepublic of Korea
Southern Asia
4.8 Mt | 2.6 kg per capita 0.9% | 0.04 Mt 1896
IndiaIran (Isl. Rep.)Pakistan
3.230 kt790 kt433 kt
10.129 kt2.569 kt
818 kt
Western Asia
2.6 Mt | 9.6 kg per capita 6% | 0.2 Mt 272
TurkeySaudi ArabiaIraq
847 kt595 kt278 kt
Countries with the highest e-waste generation per sub-region
Chapter 9. Regional E-Waste Key Statistics

75
and recycling. In Kazakhstan, the EPR for e-waste has been reflected in the concept for transition of the Republic of Kazakhstan to a Green Economy, adopted in 2013, which provides a basis for the implementation of “the principles of a manufacturer’s extended liability to cover part of the costs for collection and disposal of packaging, electronic and electric equipment, transport vehicles, batteries, furniture, and other used goods”. This is close to the EPR concept, but does not have any licensing or financing mechanism to cover the transportation and depollution in the legislation. The inclusion of such licensing and financial mechanisms are currently under discussion. E-waste management systemThe e-waste management systems found in Asia are rather broad. The e-waste management systems found in Asia are rather broad. They range from very advanced e-waste management systems, such as in the Republic of Korea, Japan, China (including the Province of Taiwan) to informal activities that coexist alongside the advanced recycling system in China, but which dominate the e-waste management in the other parts of Asia. E-waste management in South Asia is largely based on informal sector activities for collection, dismantling, and recycling. Legislation in India has been a driver for the setting up of formal recycling facilities, and there are 312 authorised recyclers in India, with the capacity for treating approximately 800 kt annually. However, formal recycling capacity remains underutilised, as the large majority of the waste is still handled by the informal sector. There are 31 authorised PROs providing compliance services, including the collection and channelization of e-waste to formal recycling facilities, as well as the administration of awareness campaigns. Enforcing rules remains a challenge, as do other aspects, such as the lack of proper collection and logistics infrastructure, limited awareness of consumers on the hazards of improper disposal of e-waste, the lack of standards for collection, dismantling of e-waste and treatment of it, and an inefficient and tedious reporting process.
Current statistics show that China is the world's top e-waste producer, having generated 10.1 Mt of e-waste in 2019. China plays a key role in the global EEE industry for two primary reasons: it is the world's most populous country, so the domestic demand of EEE is very high, and it has a strong EEE manufacturing industry. Additionally, China plays a significant role in the refurbishment, reuse, and recycling of e-waste. Driven by e-waste regulation and the facilities expansion, the formal e-waste recycling industry has shown considerable growth in treatment capacity and quality; more than 70 million e-waste units are dismantled annually (China Ministry of Ecology and Environment 2019). According to the Chinese government, the actual collection and recycling rate is 40%, but it is important to note that this number only refers to 5 EEE products, as opposed to the 54 EEE products (UNU-Keys) listed in the international e-waste classification (Annex 1). The collection and recycling rate drops to 15% if all 54 products are considered. The informal sector has been dramatically declining, due to stricter controls from China’s new environmental law. The illegal importation of e-waste disappears more expeditiously
because of the solid waste ban import policy. However, the increasing gap between fund levies and subsidies is imposing the distinct challenges for e-waste funding policy (Zeng et al. 2017). The Chinese Government has set targets of sourcing 20% of raw materials for new electronics products from recycled content and recycling 50% of electronic waste by 2025 (World Economic Forum 2018). Taiwan’s (Province of China) e-waste collection and recycling rate had reached 64% of the products covered by the legislation in 2018(37); this significant achievement is based on the 4-in-1 recycling system that focuses on applying the EPR concept to the recycling system. The mechanism has substantially improved under the supervision of the Recycling Fund Management Board (RFMB). Taiwan, Province of China, has about 20 e-waste recycling facilities whose capacity is higher than the current domestic e-waste generation, so the e-waste recycling business in Taiwan, Province of China, is experiencing challenges. Japan relies on a strong legal framework, an advanced collection system, and developed processing infrastructure. In 2016, under the Act on Recycling of Specified Kinds of Home Appliances, Japan collected 570.3 kt through official channels.
In Central Asia, most of e-waste generated ends up in landfills or illegal dumping sites. In the Kazakhstan EPR system, some collection and recycling sites have been set up, but the capacity is not sufficient to manage the country's entire e-waste or to finance the transportation of e-waste to it. In the entire region, it is common that consumers send their discarded electric/electronic devices to small companies, which then dismantle them and reuse certain components. So, several governments took measures in order to address the issue. For instance, in Uzbekistan, progress was achieved from 2014-2016 by upgrading municipal waste infrastructure, and in 2017, the president launched a major five-year programme to improve waste collection, disposal, and recycling nationwide. However, no regulatory measures have been introduced specifically in relation to e-waste.
In Western Asia, the countries range from very rich to very poor. Despite that, the e-waste management system is mostly informal. In the rich countries, there are large migrant workers that reuse or repair donated used-EEE from the richer households, but this is unique within the region. The United Arab Emirates have invested in a specialized facility located at the Dubai Industrial Park that has a capacity of 100 kt of e-waste per year. However, as aforementioned, most e-waste is largely uncontrolled and managed by the informal sector. In the middle and south of Palestine, there are three main landfills where e-waste is dumped, and the region is experiencing illegal imports of e-waste without having the adequate environmentally sound recycling infrastructure in place. According to an e-waste study conducted in 2019 by UNIDO in coordination with the Lebanese Ministry of Industry, a certain quantity of e-waste in Lebanon is also landfilled, and more still is exported as scrap, mainly by the informal sector, while a small percentage is dismantled and sent to abroad to recycling facilities through the formal sector. The study also revealed that e-waste recycling in Lebanon is currently limited because of high operational costs, particularly energy, and the complexity and potential hazards of e-wastes (UNIDO 2019).
Chapter 9. Regional E-Waste Key Statistics

76
LegislationIn Europe, the majority of e-waste is regulated by the WEEE Directive (2012/19/EU). This regulation is in force in the European Union and in Norway. Other countries – including Iceland, Switzerland, and several Balkan countries, such as Serbia and Bosnia and Herzegovina – have similar laws. The WEEE Directive set collection, recycling, reuse, and recovery targets for all six categories of e-waste. From 2018 onwards, article 7 of the WEEE Directive states that the minimum collection rate to be achieved annually by a member state shall be either 65% of the average weight of EEE POM in the three preceding years or 85% of e-waste generated on the territory of a member state in 2018. Bulgaria, the Czech Republic, Latvia, Lithuania, Hungary, Malta, Poland, Romania, Slovenia, and Slovakia may have the option to remove themselves from this regulation by 2021 because of their relatively low level of EEE consumption. The latest developments in the implementation of the WEEE Directive are the introduction of the open scope and newly specified reporting guidelines.
Since August 15, 2018, the so-called open scope has been in place. The open scope means that EEE products are a priori considered to be in scope in the European Union, unless specific exclusions apply. This means, in practice, that new products, such as clothes and furniture with electric functionality, can fall under the directive. With regard to e-waste statistics, the most important decisions are calculation methods for preparation of reuse, exports of e-waste, the e-waste generated methodology, and the reporting categories. Preparation for reuse is defined as the weight of whole appliances that have become waste and of components of e-waste that, following checking, cleaning, or repairing operations, can be reused without any further sorting or preprocessing. It also contains a decision on the registration of e-waste exports. Where e-waste is sent for treatment in another member state or exported for treatment in a third country in accordance with Article 10 of Directive 2012/19/EU, only the member state that has collected and sent or exported the e-waste for treatment may count it towards the minimum recovery targets referred. Note that the directive does not yet cover any decision on exports of reused products, as they are not yet waste. Also, member states have to report the data on the weight of e-waste generated. Another decision is that data shall be reported in the six categories, but that Category 4, Large equipment, is split into Category 4a (Large equipment excluding photovoltaic panels) and Category 4b (Large equipment including photovoltaic panels).
In Ukraine, an EPR system based on the EU WEEE Directive is in development, by the association agreement from the EU and Ukraine. Thanks to the collaborative project supported by the EU, the Ministry of Ukraine Regional Development received support to establish a legal basis on the disposal of electronic waste and batteries. Recently, the two-year project “Implementation of Management System for Waste of Electric and Electronic Equipment and Batteries in Ukraine” has been completed. This project helped develop two laws: The Bill on Batteries and Accumulators and the Bill on Waste of Electric and Electronic Equipment, which is expected to pass parliament in 2020.
$12.9 billion USDvalue of raw materials in e-waste
12.7 Mt CO2 equivalentspotential release of GHG emissions from undocu-mented wasted fridges and air conditioners
0.01 ktamount of mercury from undocumented flows of e-waste
11.4 ktamount of BFR from undocumented flows of e-waste
12.0 Mt | 16.2 kg per capitae-waste generated
42.5% | 5.1 Mt e-waste documented to be collected and properly recycled
37 countries have a national e-waste legisla-tion/policy or regulation in place
E-waste status in Europe in 2019
740population (millions)
39countries analysed
0 to 5 kg per capita5 to 10 kg per capita10 to 15 kg per capita15 to 20 kg per capita20 to 25 kg per capita25+ kg per capita
E-waste generatedLegend
E-waste documented to be collected and properly recycledPopulation (in millions)
E-waste generated (in Mt and kg per capita)Eastern Europe
3.2 Mt | 11 kg per capita 23% | 0.7 Mt 289
Russian FederationPolandUkraine
1.631 kt443 kt324 kt
Northern Europe
2.4 Mt | 22.4 kg per capita 59% | 1.4 Mt 105
United KingdomSwedenNorway
1.598 kt208 kt139 kt
Southern Europe
2.5 Mt | 16.7 kg per capita 34% | 0.9 Mt 151
ItalySpainGreece
1.063 kt888 kt181 kt
Western Europe
4 Mt | 20.3 kg per capita 54% | 2.1 Mt 195
GermanyFranceNetherlands
1.607 kt1.362 kt
373 kt
Countries with the highest e-waste generation per sub-region
Chapter 9. Regional E-Waste Key Statistics

77
In Belarus, there is a general law, Law No. 271-Z on waste management, dated July 20, 2007. E-waste is managed within a framework of EPR of manufacturers and suppliers. The e-waste categories featured are large equipment, whose lengths are over 160 cm; medium-sized items, sized 80-160 cm; and small items, under 80 cm in length. Within the “Municipal Waste Management and Use of Recycled Resources” component of the national programme “Comfortable Accommodation and Favourable Environment” for 2016-2020 (Order of the Council of Ministers of Belarus, dated April 21, 2016, No. 326), an objective was set to reach the intermediate target of 20% by 2019. Ferrous metal law bans the collection of e-waste by metal scrap recyclers. Despite that, such collection probably still happens. Valuable components are taken out, and hazardous substances are dumped. In Moldova, a national strategy on waste has been in effect since 2013. There is an EU-Republic Moldovan association agreement, under which several association agreements on environmental legislation exist. Within that context, the EPR on e-waste was approved in 2018. In Moldova, e-waste is classified into the 10 categories of the old EU WEEE Directive, as opposed to the current 6 categories enforced in the EU. The EPR law specifies that there are also collection and recycling targets based on EEE POM of the three preceding years. In 2020, there is a 5% collection target. This will gradually increase by 5% each year until 30% in 2025. In 2017, Russia has started an EPR programme for electrical and electronic scrap. Manufacturers and importers must help collect and process obsolete electronics in accordance with Russian circular economy legislation.
E-waste management systemsIn the European Union, there is a very well-developed compliant e-waste management infrastructure to collect e-waste in shops and municipalities by private operators, as well as to further recover the recyclable components of the collected e-waste and dispose residuals in a compliant and environmentally sound manner. This has been established by the relatively long-running history of EU e-waste legislation since early in 2003. Consequently, statistics show that 59% of the e-waste generated in Northern Europe and 54% of e-waste generated in Western Europe is documented as being formally recycled; the e-waste collection data was reported for 2017. Those are the highest percentages in the world. For the reference year 2019, 85% of e-waste generated, or 65% EEE POM of the three preceding years, has to be collected by a member state of the EU, which indicates that collection and recycling must increase even further to meet the collection targets.
The feasibility of achieving the target and the location of other e-waste have therefore been subject to several country studies in recent years. During the writing of this study, the most recent studies have been performed in the Netherlands (Baldé et al. 2020) and Romania (Magalini et al. 2019). These studies indicate that an increasing share of e-waste, compared to the e-waste generated, has been compliantly recycled in the past. However, significant parts are still managed outside the compliant recycling sectors in the EU. E-waste management takes place by exporting for reuse, e-waste that is disposed
of in mixed residual waste as well as e-waste that is non-compliantly recycled with metal scrap. In the Netherlands, the exports for reuse have been quantified as being roughly 8% of the total e-waste generated (Baldé et al. 2020). These exports are mostly comprised of EEE from IT servers and laptops from dedicated refurbishing companies, as well as used fridges, used microwaves, and other durable goods that are stuffed in second-hand vehicles or containers and shipped to Africa. Exports for reuse are considered as lifetime extensions and are a part of the circular economy. But many other EU countries do not have such data, and without it, reaching the collection targets in those exporting countries will be more difficult, if not impossible. The lower-income EU countries that have a lower consumption of EEE than higher-income countries can also be recipient countries of those exports for reuse. The recent studies also indicate that despite the relatively high environmental awareness in the EU, e-waste is still disposed of in residual waste, and the small e-waste ends up in residual waste bins. This comprises approximately 0.6 Mt of the EU's e-waste (Rotter et al. 2016). A positive note is that the share of e-waste in the residual waste declined in the Netherlands from 11% to 9% of e-waste generated in the past decade (Baldé et al. 2020). The largest uncompliant flow of e-waste is managed together with metal scrap, but without proper depollution steps in place.
Compared to other European countries in its region, Belarus has a relatively advanced e-waste collection and recycling sector. There are municipal drop-off and collection points and private pick-up and collection points, and e-waste is also collected from repair and service centers. Belarus collected 23 kt of e-waste in 2019. The collection from households is incentivized by a small financial transaction that the compliant waste collector (or recycler) receives from the government. However, private companies and governmental agencies have to pay for the e-waste collection. The e-waste collection from public agencies might be hampered because they have to pay a small fee, and the agencies are typically underfunded. So, public agencies typically store the equipment.
In other Eastern European countries, such as the Balkans, e-waste collection is beginning and an e-waste management infrastructure is currently in development, but not yet achieving same rates of e-waste as in Northern and Western Europe. In Moldova, there are collection points from municipalities. Some private companies get equipment from schools, universities, and other public authorities. In Russia and Ukraine, there are enterprises that collect e-waste and manage it in an environmentally sound manner. However, there are too few e-waste collection points, and the e-waste management capacity is not enough to recycle all domestic e-waste in an environmentally sound manner. Thus, e-waste is likely to be recycled together with metal scrap or dumped in landfills.
Chapter 9. Regional E-Waste Key Statistics

78
LegislationThe National Television and Computer Recycling Scheme (NTCRS) was implemented in Australia under the Australian Government’s Product Stewardship Act 2011. The Act went into effect on August 8, 2011. Under the Act, the Product Stewardship (Televisions and Computers) Regulations 2011 also went into effect on November 8, 2011. This regulation provides Australian householders and small business with access to industry-funded collection and recycling services for televisions and computers. The co-regulatory aspect is a key feature of the above regulation, whereby the Australian Government, through the regulations, has set the outcomes to be achieved by industry and how the plan to be implemented. The television and computer industries, operating through the approved co-regulatory arrangements (Producer Responsibility Organisation) will determine how to deliver these outcomes efficiently. The plan provides approximately 98% of the Australian population with reasonable access to collection services. These services may include a permanent collection site at a local waste transfer station or retail outlet, or at one-off events. The television and computer industries are required to fund collection and recycling of a proportion of the televisions and computers disposed of in Australia each year and to increase the rate of recycling of televisions and computers in Australia to 80% by 2026-2027.
E-waste management systemUnder the Product Stewardship (Televisions and Computers) Regulations 2011, approved co-regulatory arrangements are required to provide independently audited annual reports for the Department to publish. These co-regulatory arrangements report on a range of matters related to their role as administrators of the plan. Currently, four co-regulatory arrangements manage the day-to-day operation of NTCRS. Since the plan's inception, more than 291 kt of TV and computer e-waste has been collected and recycled. During the 2017-2018 financial year, the plan recycled approximately 58 kt of e-waste, equating to a recovery rate greater than 93%. The plan also ensured that all recyclers were certified to AS/NZS 5377:2013 standards with regard to recycling e-waste safely (Australian Government 2019).
With a ban starting in July 2019, the Government of Victoria is the latest Australian state government to ban e-waste in landfills and has announced an A$16.5 million package both to encourage safe management of hazardous materials found in e-waste and to enable greater recovery of the valuable materials, ultimately leading to a more stable industry and more jobs for Victoria. Sustainability Victoria launched a new campaign, implementing a A$1.5 million community education programme on July 4, 2018 to educate Victorians about the value of e-waste and how it can be recycled. The campaign features a new website, ewaste.vic.gov.au, which includes an animated video showcasing the valuable materials inside our electronics and social media and digital advertising (Sustainability Victoria 2019).
$0.7 billion USDvalue of raw materials in e-waste
1.0 Mt CO2 equivalentspotential release of GHG emissions from undocu-mented wasted fridges and air conditioners
0.001 ktamount of mercury from undocumented flows of e-waste
1.1 ktamount of BFR from undocumented flows of e-waste
0.7 Mt | 16.1 kg per capitae-waste generated
8.8% | 0.06 Mt e-waste documented to be collected and properly recycled
1 country has a national e-waste legisla-tion/policy or regulation in place
E-waste status in Oceania in 2019
42population (millions)
12countries analysed
0 to 5 kg per capita5 to 15 kg per capita15+ kg per capita
E-waste generatedLegend
E-waste documented to be collected and properly recycledPopulation (in millions)
E-waste generated (in Mt and kg per capita)
Australia and New Zealand
0.7 Mt | 21.3 kg per capita 9% | 0.06 Mt 31
AustraliaNew Zealand
554 kt96 kt
Melanesia
0.02 Mt | 1.5 kg per capita 0% | 0 Mt 10
Papua New GuineaFiji
9 kt5 kt
Micronesia
0.0005 Mt | 2 kg per capita 0% | 0 Mt 0.2
Micronesia (Fed. St.)Palau
0.20 kt0.17 kt
Polynesia
0.001 Mt | 3.1 kg per capita 0% | 0 Mt 0.3
SamoaTonga
0.6 kt0.3 kt
Countries with the highest e-waste generation per sub-region
Chapter 9. Regional E-Waste Key Statistics

79Chapter 9. Regional E-Waste Key Statistics
Compared to Australia, the Government of New Zealand is still considering developing a mandatory national plan for dealing with the e-waste issue. Estimations are that more than 97 kt of e-waste are being disposed of as landfill each year with more than 98.2% of generated household e-waste ending up in landfills. Such an outcome is largely due to limited diversion of e-waste into more appropriate recycling and treatment and the lack of a mandatory product stewardship-based approach to managing e-waste in New Zealand. E-waste product stewardship plans by individual producers are few and relatively minor. As well, there is no formalized system overall for e-waste management (Blake, Farrelly, and Hannon 2019).
The Pacific Islands region (PICTs), consisting of 22 countries and territories, face unique challenges due to their spread-out geography. The limited availability of suitable land on small islands and atolls for constructing landfills, the islands' remoteness, and the islands' relatively small populations cause issues for large economies, as waste management technologies, rapid urbanisation, limited institutional, and human resource capacities are among the key challenges faced by PICTs. The Secretariat of the Pacific Regional Environment Programme (SPREP) has the lead responsibility for regional coordination and delivery of waste management and pollution control action and uses the strategic management framework, Cleaner Pacific 2025, in guiding regional cooperation and collaboration. SPREP also works with key international and regional partners to achieve greater integration of sustainable funding and to support mechanisms for waste, chemicals, and pollution management programmes.

80
Endnotes

81
(1) The e-waste collection rate is identical to the sub-indicator defined in SDG 12.5.1. If the e-waste is collected through official collection systems, it can be assumed that e-waste collected equals e-waste recycled, though in practice there might be losses taking place during the treatment phase. > page 23
(2) E-waste documented as being formally collected and recycled and its respective recycling rate refer to data officially reported by governments (the preferred data source in this report) or, in other instances, by recyclers. In several countries and global regions, e-waste is often also collected by the informal system, but those quantities are not accounted for in either the indicator “e-waste documented to be collected and recycled” or the respective recycling rate – for two main reasons: 1) due to the activities' “informal” nature, they are not regulated, and data are hardly available at the governmental level; and 2) e-waste managed by the informal system is most likely not recycled in an environmental sound way. > page 25
(3) The workplan and other information is available from https://uneplive.unep.org/indicator/index/12_5_1. > page 30
(4) The Guidelines were endorsed by ESCAP, ESCWA, ITU, OECD, UNCTAD, UNECA, EUROSTAT, UNEP/SBC, and UNU. > page 35
(5) E-waste is also often not discarded by its owner and, instead, is stored at home or can be donated as a second-hand product. However, by definition, the EEE becomes e-waste only once its owner intends to discard the product and, thus, after it leaves the home. > page 37
(6) www.basel.int/Countries/StatusofRatifications/PartiesSignatories/tabid/4499/Default.aspx > page 54
(7) Critical raw materials are identified as one of the priority areas in the EU action plan for the Circular Economy. The most recent criticality assessment, performed in 2017, identified 27 critical raw materials. > page 58
(8) Precious metals (e.g. gold, silver, copper, platinum, palladium, ruthenium, rhodium, iridium, and osmium) and critical materials (e.g. cobalt, palladium, indium, germanium, bismuth, and antimony). > page 59
(9) The methodology for the calculation of the value of precious metals found in e-waste has been updated from the methodology in the Global E-waste Monitor 2017. This update is explicated in Annex 2. > page 59
(10) The total amount of raw materials found in e-waste generated in 2019 was compared to the total amount of raw materials found in EEE Placed on the Market in the same year. The methodology for the calculation of raw materials found in e-waste and the related data sources are presented in Annex 2. > page 59
(11) The releases of CO2 equivalents were estimated by linking the amount and type of
refrigerant used in fridges and air conditioners produced between 1995 and 2019 to their global warming potential, expressed in CO2 equivalents (Duan et al. 2018). > page 61
(12) Guo Y at al. 2010a; Guo Y et al. 2012a; Huo X et al. 2019a; Li M et al. 2018a; Wu K et al. 2011a; Wu K et al. 2012a; Xu X et al. 2012a; Xu L et al. 2015b; Xu L et al. 2016a; Zhang Y et al. 2018a. > page 65
(13) Zheng G et al 2013a; Xu X et al. 2015a; Zeng X et al. 2019a, Xu X et al. 2015b. > page 65
(14) Li Y et al. 2008b; Zhang R et al. 2015a; Liu J et al. 2011a; Liu L et al. 2015a; Liu L et al. 2018a; Wang X et al. 2012a; Zhang R et al. 2015a. > page 65
(15) Soetrisno et al. 2020. > page 65(16) Cao J et al. 2018; Dai Y et al. 2017a; Huo X et al. 2019b; Zhang Y et al 2016a; Zhang
Y et al. 2017a. > page 65(17) Zheng G et al. 2013a; Zeng X et al. 2017a; Zeng X et al. 2017b. > page 65(18) Amoabeng Nti AA et al. 2020. > page 65(19) Grant et al. 2013; Xu P et al. 2015a. > page 65(20) Zhang B et al. 2017a. > page 65(21) Li Y et al. 2008a; Ni W et al. 2014a. > page 65(22) Li Y et al. 2011. > page 65(23) Neitzel RL et al. 2020; Alabi OA et al. 2012. > page 65(24) Liu Y et al. 2018a. > page 65(25) Zeng Z et al. 2018a. > page 65(26) Cong X et al. 2018a; Lu X et al 2018a. > page 65 (27) Yohannessen K et al. 2019; Ohajinwa CM et al. 2018. > page 66(28) Fischer et al. 2020; Decharat et al 2020. > page 66(29) Decharat S 2018; Feldt T et al. 2014. > page 66(30) Okeme JO et al. 2019; Decharat et al 2020; Seith et al. 2019. > page 66(31) Chen L et al. 2010a; Li K et al. 2014a; Liu Q et al. 2009a; Wang Q et al. 2011a; Yuan
J et al. 2008a. > page 66(32) Neitzel RL et al. 2020. > page 66(33) Song S et al. 2019a. > page 66(34) Chen Y et al. 2019a. > page 66(35) Li Y et al. 2012a; Xu X 2014a. > page 66(36) Igharo OG et al. 2018. > page 66(37) Regulated Recyclable waste under the 4-in-1 Recycling system: laptops,
motherboards, hard disks, power packs, shells, monitors, printers, keyboards, televisions, washing machines, refrigerators, air conditioners, fans, and light bulbs/tubes (US EPA and Office of Internartional Affairs Tribal 2012). > page 75
(38) The Harmonised Commodity Description and Coding System, generally referred to as “Harmonised System” or simply “HS”, is a multipurpose international product nomenclature developed by the World Customs Organization (WCO). > page 101
(39) Central Product Classification (CPC), Version 1.1. > page 101
Endnotes

82
Sources to Annex 3: Country E-waste Key Statistics > page 104
(40) Telecom Argentina.(41) Australian Ministry of Environment.(42) Eurostat.(43) UNSD Questionnaire (UNSD 2019).(44) Reporte de Sustentabilidad Bienal 2011-2012.(45) Solidarite Technologique.(46) OECD Questionnaire.(47) Ministry of Environment (Chile).(48) Ministry of Environment (China).(49) Hong Kong Environmental Protection Department.(50) Ministry of Education (El Salvador).(51) Litterature (Rush Martínez et. al 2015).(52) Assocham India.(53) National Solid Waste Management Authority (Jamaica).(54) National Statistics Office (Jordan).(55) Africa Institute 2012.(56) Namigreen.(57) Ministry of Health (Peru).(58) Analytical Center for the Government of Russian Federation.(59) Ministry of Trade and Industry (Rwanda). (60) Litterature (Roldan 2017).(61) IENE.(62) Litterature (Lydall M. et al. 2017).(63) Exitcom.(64) Computers for School Uganda. (65) Environmental Protection Agency (USA).(66) Questionnaires conducted by UNSD, OECD and UNECE in 2014/2015.
Endnotes

83Endnotes

84
Literature

85Literature
Abbasi, G. 2015. “Story of Brominated Flame Retardants : Substance Flow Analysis of PBDEs from Use to Waste”.
Australian Government, Department of the Environment and Energy. 2019. “National Television and Computer Recycling Scheme – Home Page | Department of the Environ-ment and Energy”. 2019.
Baldé CP, D’Angelo E, Forti V, Kuehr R, and Van den Brink S. 2018 “Waste mercury per-spective, 2010-2035: from global to regional – 2018”. United Nations University (UNU), United Nations Industrial Development Organization, Bonn/Vienna.
Baldé CP, Forti V, Gray V, Kuehr R, and Stegmann P. 2017. “The Global E-Waste Mo-nitor 2017”. Edited by United Nations University (UNU), International Telecomunication Union (UNU), and International Solid Waste Association (ISWA). United Nations Univer-sity. Bonn/Geneva/Vienna. https://globalewaste.org/wp-content/uploads/2018/10/Global-E-waste-Monitor-2017.pdf
Baldé CP, Kuehr R, Blumenthal K, Fondeur Gill S, Kern M, Micheli P, Magpantay E, and Huisman J. 2015. “E-Waste Statistics Guidlines on Classification, Reporting and Indica-tors”.
Baldé C.P, van den Brink S, Forti V, van der Schalk A. and Hopstaken F. The Dutch WEEE Flows 2020. “What happened between 2010 and 2018”. United Nations University (UNU) / United Nations Institute for Training and Research (UNITAR) – co-hosted SCY-CLE Programme, Bonn, Germany.
BIO intelligence Service. 2013. “Equivalent Conditions for Waste Electrical and Electro-nic Equipment (WEEE) Recycling Operations Taking Place Outside the European Union”. DG Environment.
Blake V, Farrelly T, and Hannon J. 2019. “Is Voluntary Product Stewardship for E-Waste Working in New Zealand? A Whangarei Case Study”. Sustainability (Switzerland) 11 (11): 1–26. https://doi.org/10.3390/su11113063.
Chen Y, Jinhui L, Lieqiang C, Shusheng C, and Weihua D. 2012. “Brominated Flame Re-tardants (BFRs) in Waste Electrical and Electronic Equipment (WEEE) Plastics and Prin-ted Circuit Boards (PCBs)”. Procedia Environmental Sciences 16: 552–59. https://doi.org/10.1016/j.proenv.2012.10.076.
China Ministry of Ecology and Environment. 2019. “Waste Electrical and Electronic Pro-ducts Processing Information System”. 2019. http://weee.mepscc.cn/Index.do.
Deubzer, O. 2007. “Explorative Study into the Sustainable Use and Substitution of Sol-dering Metals in Electronics”.
Deubzer O, Herreras L, Hajosi E, Hilbert I, Buchert M, Wuisan L, and Zonneveld N. 2019. “Baseline and gap/obstacle analysis of standards and regulations – CEWASTE Voluntary Certification Scheme for Waste Treatment”. https://cewaste.eu/wp-content/uploads/2020/03/CEWASTE_Deliverable-D1.1_191001_FINAL-Rev.200305.pdf.
Duan, H, Miller TR, Gang L, Xianlai Z, Keli Y, Qifei H, and Jian Z. 2018. “Supporting Information for : Chilling Prospect : Climate Change Effects of Mismanaged Refrigerants in China Table of Centent Tables and Figures”. Environmental Science and Technology 52 (11).
Duan H, Miller TR, Gregory J, and Kirchain R. 2013. “Quantitative Characterization of Domestic Flows of Used Electronics.” Step, no. December: 122.
EACO. 2017. “Regional E-Waste Strategy. Edited by Waste Management Steering Com-mittee under Working Group 10 : Environment and E-Waste Management”.
European Commission. 2019. “Statistics - Electronics Waste - Environment - European Commission”. 2019. https://ec.europa.eu/environment/waste/weee/data_en.htm.
European Paliament. 2011. “DIRECTIVE 2011/65/EU OF THE EUROPEAN PARLIAMENT AND OF THE COUNCIL of 8 June 2011 on the Restriction of the Use of Certain Hazardous Substances in Electrical and Electronic Equipment.” Official Journal of the European Uni-on, 88–110.
European Paliament. 2012. “Directive 2002/96/EU of the European Parliament and of the Council of 27 Jenuary 2003 on Waste Electrical and Electronic Equipment (WEEE)”. Official Journal of the European Union, 2003, no. June: 38–71.
Forti V, Baldé CP, and Kuehr R. 2018. “E-Waste Statistics Guidelines on Classification, Reporting and Indicators”. Edited by ViE - SCYCLE United Nations University. Bonn, Ger-many.
Geeraerts K, Mutafoglu K, and Illés A. 2016. “Illegal Shipments of E–Waste from the EU to China”. Fighting Environmental Crime in Europe and Beyond, no. 320276: 129–60.
GSMA. 2020. “GSMA CleanTech e-waste policy study”. https://www.gsma.com/mobilefordevelopment/cleantech/e-waste/

86
Global E-waste Statistics Partnership (GESP). 2019. “About GESP”. [Website]. Switzerland: “Global E-waste Statistics Partnership (GESP)”. https://globalewaste.org/about-us/, accessed 8 September 2019.
Hamdan S. 2019. “في المنازل 2018 النفايات الإلكترونية والكهربائية”.
Herat S. 2008. “Environmental Impacts and Use of Brominated Flame Retar-dants in Electrical and Electronic Equipment”. Environmentalist 28 (4): 348–57. https://doi.org/10.1007/s10669-007-9144-2.
Hopson E., and Pucket J. 2016. “Scam Recycling: e-Dumping on Asia by US Recyclers”. Basel Action Network, USA.
Huisman J, Botezatu I, Herreras L, Liddane M, Hintsa J, Luda di Cortemiglia V, Le-roy P, Vermeersch E, Mohanty S, van den Brink S, Ghenciu B, Dimitrova D, Nash E, Shryane T, Wieting M, Kehoe J, Baldé CP, Magalini F, Zanasi A, Ruini F, Männistö T, and Bonzio A. “Countering WEEE Illegal Trade (CWIT) Summary Report, Market As-sessment, Legal Analysis, Crime Analysis and Recommendations Roadmap”. August 30, 2015. Lyon, France.
Huisman J, Downes S, Leroy P, Herreras L, Ljunggren M, Kushnir D, Løvik AN, et al. 2017. “ProSUM FINAL REPORT - Deliverable 6.6”.
Lasaridi K, Terzis E, Chroni C, and Kostas A. 2016. “Bir Global Facts & Figures World Statistics on E-Scrap Arisings and the Movement of E-Scrap Between Countries 2016-2025.”
Lepawski J. (2015). “The changing geography of global trade in electronic discards: Time to rethink the e-waste problem.” The Geographical Journal, 181(2), 147–159.
Lydall M, Nyanjowa W, and James Y. 2017. “Mapping South Africa’s Waste Electrical and Electronic Equipment (WEEE) Dismantling, Pre-Processing and Processing Techno-logy Landscape”, Mintek.
Magalini F, and Huisman J. 2018. “WEEE Recycling Economics”. 1–12. https://doi.org/10.13140/RG.2.2.24945.53608.
Magalini F, Smit E, Adrian S, Gunsilius E, Herbeck E, Oelz B, Perry J, et al. 2016. “Guiding Principles to Develop E-Waste Management Systems and Legislation”. 3576: 15. ISSN: 1999-7965.
Magalini F, Thiebaud E, and Kaddouh S. 2019. “Quantifying WEEE in Romania 2019 vs 2015”.
Literature
Magalini F, Feng W, Huisman J, Kuehr R, Baldé K, van Straalen V, Hestin M, Lecerf L, Sayman U, and Akpulat O. 2014. “Study on Collection Rates of Waste Electrical and Elec-trical and Electronic Equipment (WEEE). Possible measures to be initiated by the com-mission as required by article 7(4), 7(5), 7(6) and 7(7) of directive 2012/19/eu on waste electrical and electronic equipment (WEEE)”. European Commission.
Mccann D, and Wittmann A. 2015. “E-Waste Prevention, Take-Back System Design and Policy Approaches”. Step (February): http://www.step-initiative.org/files/_documents/whitepapers/StEP_TF1_WPTakeBackSystems.pdf.
McPherson A, Thorpe B, and Blake A. 2004. “Brominated Flame Retardants in Dust on Computers”, 1–40.
Odeyingbo O, Nnorom I, and Deubzer O. 2017. “Person in the Port Project - As-sessing Import of Used Electrical and Electronic Equipment into Nigeria”. http://collections.unu.edu/eserv/UNU:6349/PiP_Report.pdf.
Parajuly K, Kuehr R, Awasthi AK, Fitzpatrick C, Lepawsky J, Smith E, Widmer R, and Zeng X. 2019. “Future E-Waste Scenarios”. Step (Bonn), UNU ViE SCYCLE (Bonn) & UNEP IETC (Osaka).
Riahi K, van Vuuren DP, Kriegler E, Edmonds J, O’Neill B, Fujimori S, Bauer N, et al. 2017. “The Shared Socioeconomic Pathways and Their Energy, Land Use, and Green-house Gas Emissions Implications: An Overview”. Global Environmental Change 42 (Ja-nuary): 153–68. https://doi.org/10.1016/J.GLOENVCHA.2016.05.009.
Roldan M. 2017. “E-waste management policy and regulatory framework for Saint Lu-cia”. Telecommunication Management Group, Inc.
Rotter VS, Maehlitz P, Korf N, Chancerel P, Huisman J, Habib H, Herreras L, Ljunggren SM, and Hallberg A. 2016. “ProSUM Deliverable 4.1 - Waste Flow Studies”. 1–100.
Rush Martínez M. and Cálix, N. 2014. “Estimación de la Generación de los Residuos de Aparatos Eléctricos y Electrónicos (RAEE) en Honduras”. Tegucigalpa M.D.C, Honduras.
Step Initiative. 2014. “One Global Definition of E-Waste”. United Nations University 3576 (June): 08. https://collections.unu.edu/eserv/UNU:6120/step_one_global_definition_amended.pdf.
Sudki, Hamdan. 2019. “في المنازل 2018 النفايات الإلكترونية والكهربائية”.

87Literature
Sustainability Victoria. 2019. “E-Waste”. 2019. https://www.sustainability.vic.gov.au/You-and-your-home/Waste-and-recycling/Household-waste/eWaste.
UNDESA. 2019 – Population Division. 2019. “World Population Prospects - Population Division”. https://population.un.org/wpp/.
UNICEF. 2018. “Surveys - UNICEF MICS”. 2018. http://mics.unicef.org/surveys.
UNIDO. 2019. “Preliminary Baseline Assessment of E-wastes in Lebanon”.
UNSD. 2019. “UNdata | Industrial Commodity Statistics Database (UNSD)”. 2019. http://data.un.org/Browse.aspx?d=ICS.
USITC. 2013. “Used Electronic Products: An Examination of U.S. Exports,” Investigation no. 332-528.
Van der Voet E, Van Oers L, Verboon M, and Kuipers K. 2019. “Environmental Implications of Future Demand Scenarios for Metals: Methodology and Applicati-on to the Case of Seven Major Metals”. Journal of Industrial Ecology 23 (1): 141–55. https://doi.org/10.1111/jiec.12722.
Wagner M, Bavec Š, Huisman J, Løvik AN, Söderman ML, Emmerich J, Sperlich K, et al. 2019. “Optimizing Quality of Information in RAw MAterial Data Collection across Euro-pe Draft Good Practice Guidelines for the Collection of SRM Data, Improvement Potential, Definition and Execution of Case”. 1–189.
Wolk-Lewanowicz A, James K, Huisman J, Habib H, Brechu M, Herreras L, and Chancerel P. 2016. “ProSUM Deliverable 3.2 - Assessment of Complementary Waste Flows”. 3.2.
World Economic Forum. 2018. “Recovery of Key Metals in the Electronics Industry in the People’s Republic of China: An Opportunity in Circularity”. January.
Yu D, Duan H, Song Q, Liu Y, Li Y, Li J, Shen W, Luo J, and Wang J. 2017. “Charac-terization of brominated flame retardants from e-waste components in China”. Waste Management 68: 498–507. https://doi.org/10.1016/j.wasman.2017.07.033.
Zoeteman BC.J, Krikke HR, and Venselaar J. 2010. “Handling WEEE was-te hows: on the effectiveness of producer responsibility in a globalizing world”. In-ternational Journal of Advanced Manufacturing Technology 47 (5–8): 415–36. https://doi.org/10.1007/s00170-009-2358-3.

88 Literature
References from Chapter 8. E-waste Impact on the Health of Workers and Children
Alabi OA, Bakare AA, Xu X, Li B, Zhang Y, and Huo X. 2012. “Comparative evaluation of environmental contamination and DNA damage induced by electronic-waste in Nigeria and China”. Sci Total Environ. 423:62-72. doi.org/10.1016/j.scitotenv.2012.01.056.
Amoabeng Nti AA, Arko-Mensah J, Botwe PK, Dwomoh D, Kwarteng L, Takyi SA, et al. 2020. “Effect of particulate matter exposure on respiratory health of e-waste workers at Agbogbloshie, Accra, Ghana”. Int J Environ Res Public Health. 17(9):E3042. doi:10.3390/ijerph17093042.
Amoyaw-Osei Y, Agyekum OO, Pwamang JA, Mueller E, Fasko R, and Schluep M. 2019. “Ghana e-Waste country assessment. SBC E-waste Africa Project”. http://www.basel.int/Portals/4/Basel%20Convention/docs/eWaste/E-wasteAssessmentGhana.pdf.
Cao J, Xu X, Zhang Y, Zeng Z, Hylkema MN, and Huo X. 2018. “Increased memory T cell populations in Pb-exposed children from an e-waste-recycling area”. Sci Total En-viron.; 616-617:988-995. doi: 10.1016/j.scitotenv.2017.10.220. Epub 2017 Oct 31. Pub-Med PMID: 29096958.
Chan JK, and Wong MH. 2013. “A review of environmental fate, body burdens, and hu-man health risk assessment of PCDD/Fs at two typical electronic waste recycling sites in China”. Sci Total Environ. 463-464:1111-23. doi: 10.1016/j.scitotenv.2012.07.098.
Chen L, Guo H, Yuan J, et al. 2010. “Polymorphisms of GSTT1 and GSTM1 and increased micronucleus frequencies in peripheral blood lymphocytes in residents at an e-waste dis-mantling site in China”. J Environ Sci Health A Tox Hazard Subst Environ Eng. 45: 490–97.
Chen Y, Xu X, Zeng Z, Lin X, Qin Q, and Huo X. 2019. “Blood lead and cadmium levels associated with hematological and hepatic functions in patients from an e-waste-polluted area”. Chemosphere. 220:531-538. doi: 10.1016/j.chemosphere.2018.12.129. Epub 2018 Dec 20. PubMed PMID: 30594806.
Chi X, Streicher-Porte M, Wang MY, and Reuter MA. 2011. “Informal electronic waste recycling: a sector review with special focus on China“. Waste Manag. 31(4):731-42. doi: 10.1016/j.wasman.2010.11.006.
Cong X, Xu X, Xu L, Li M, Xu C, Qin Q, and Huo X. 2018. “Elevated biomarkers of sym-patho-adrenomedullary activity linked to e-waste air pollutant exposure in preschool children”. Environ Int.115:117-126. doi: 10.1016/j.envint.2018.03.011. Epub 2018 Mar 20. PubMed PMID: 29558634.
Dai Y, Huo X, Zhang Y, Yang T, Li M, and Xu X. 2017. “Elevated lead levels and changes in blood morphology and erythrocyte CR1 in preschool children from an e-waste area”. Sci Total Environ. 592:51-59. doi: 10.1016/j.scitotenv.2017.03.080. Epub 2017 Mar 29. PubMed PMID: 28301822.
Davis JM, and Garb Y. 2019. “A strong spatial association between e-waste burn sites and childhood lymphoma in the West Bank, Palestine”. Int J Cancer. 144(3):470-75. doi: 10.1002/ijc.31902.
Decharat S. 2018. “Urinary Mercury Levels Among Workers in E-waste Shops in Nak-hon Si Thammarat Province, Thailand”. J Prev Med Public Health. 51(4):196-204. doi: 10.3961/jpmph.18.049.
Decharat S, and Kiddee P. “Health problems among workers who recycle electronic waste in southern Thailand”. 2020. Osong Public Health res Perspect. 11(1):34-43. doi: 10.24171/j.phrp.2020.11.1.06.
Feldt T, Fobil JN, Wittsiepe J, Wilhelm M, Till H, Zoufaly A, Burchard G, and Göen T. 2014. “High levels of PAH-metabolites in urine of e-waste recycling workers from Agbogbloshie, Ghana”. Sci Total Environ. 466-467:369-76. doi: 10.1016/j.scitotenv.2013.06.097. Epub 2013 Aug 7. PubMed PMID: 23921367.
Fischer D, Seidu F, Yang J, Felten MK, Garus C, Kraus T, et al. 2020. “Health conse-quences for e-waste workers and bystanders – a comparative cross-sectional study”. Int J Environ Res Public Health. 17(5):1534. doi: 10.3390/ijerph17051534.
Goldizen FC, Sly PD, and Knibbs LD. 2016. “Respiratory effects of air pollution on child-ren”. Pediatr Pulmon. 51(1):94–108.
Grant K, Goldizen FC, Sly PD, Brune MN, Neira M, van den Berg M, et al. 2013. “Health consequences of exposure to e-waste: a systematic review”. Lancet Glob Health. 1: e350–61.
Guo Y, Huo X, Li Y, et al. 2010. “Monitoring of lead, cadmium, chromium and nickel in placenta from an e-waste recycling town in China”. Sci Total Environ. 408: 3113–17.
Guo Y, Huo X, Wu K, Liu J, Zhang Y, and Xu X. 2012. “Carcinogenic polycyclic aromatic hydrocarbons in umbilical cord blood of human neonates from Guiyu, China”. Sci Total Environ. 427: 35–40.
Gutberlet J, and Uddin SMN. 2017. “Household waste and health risks affecting waste pickers and the environment in low- and middle-income countries”. Int J Occup Environ

89Literature
Health. 23(4):299-310. doi: 10.1080/10773525.2018.1484996.
Heacock M, Trottier B, Adhikary S, Asante KA, Basu N, Brune MN, et al. 2018. “Preven-tion-intervention strategies to reduce exposure to e-waste”. Rev Environ Health. 33(2): 219–228.
Hu C, Hou J, Zhou Y, Sun H, Yin W, Zhang Y, et al. 2018. “Association of polycyclic aro-matic hydrocarbons exposure with atherosclerotic cardiovascular disease risk: A role of mean platelet volume or club cell secretory protein”. Environ. Pollut. 233:45-53.
Huang CL, Bao LJ, Luo P, Wang ZY, Li SM, and Zeng EY. 2016. “Potential health risk for residents around a typical e-waste recycling zone via inhalation of size-fractionated particle-bound heavy metals”. Journal of Hazardous Materials. 317:449-456.
Huo X, Dai Y, Yang T, Zhang Y, Li M, and Xu X. 2019. “Decreased erythrocyte CD44 and CD58 expression link e-waste Pb toxicity to changes in erythrocyte immunity in pre-school children”. Sci Total Environ. 2019b May 10;664:690-697. doi: 10.1016/j.scito-tenv.2019.02.040. PubMed PMID: 30763849.
Huo X, Wu Y, Xu L, Zeng X, Qin Q, and Xu X. 2019. “Maternal urinary metabolites of PAHs and its association with adverse birth outcomes in an intensive e-waste recycling area”. Environ Pollut.245:453-461. doi: 10.1016/j.envpol.2018.10.098. Epub 2018 Nov 7. PubMed PMID: 30458375.
Igharo OG, Anetor JI, Osibanjo O, Osadolor HB, Odazie EC, and Uche ZC. 2018. “Endo-crine disrupting metals lead to alteration in the gonadal hormone levels in Nigerian e-was-te workers”. Universa Medicina. 37(1):65-74. doi: 10.18051/UnivMed.2018.
ILO. 2013. “The Informal Economy and Decent Work: A Policy Resource Guide suppor-ting transitions to formality. Geneva, Switzerland: International Labour Organization”. https://www.ilo.org/emppolicy/pubs/WCMS_212688/lang--en/index.htm, accessed 16 August 2019.
ILO. 2019. Decent work in the management of electrical and electronic waste (e-waste). Issue paper for the Global Dialogue Forum on Decent Work in the Management of Elec-trical and Electronic Waste (E-waste) (9–11 April 2019). Geneva, Switzerland: Internati-onal Labour Organization. https://www.ilo.org/sector/activities/sectoral-meetings/WCMS_673662/lang--en/index.htm, accessed 7 August 2019.
ITU, Secretariat of the Basel Convention, UNESCO, UNIDO, UNU, WIPO, BCRC-South America, and ECLAC. 2016. “Sustainable management of waste electrical and electronic equipment in Latin America”. Geneva, Switzerland: International Telecommunications Union.
Landrigan P, Goldman LR. 2011. “Children's vulnerability to toxic chemicals: a challenge and opportunity to strengthen health and environmental policy”. Health Aff (Millwood). 30(5):842-50. doi: 10.1377/hlthaff.2011.0151.
Li K, Liu S, Yang Q, Zhao Y, Zuo J, Li R, Jing Y, He X, Qiu X, Li G, and Zhu T. 2014. “Genotoxic effects and serum abnormalities in residents of regions proximal to e-was-te disposal facilities in Jinghai, China”. Ecotoxicol Environ Saf. 2014a Jul;105:51-8. doi: 10.1016/j.ecoenv.2014.03.034. PubMed PMID: 24785710.
Li M, Huo X, Pan Y, Cai H, Dai Y, and Xu X. 2017. “Proteomic evaluation of human umbi-lical cord tissue exposed to polybrominated diphenyl ethers in an e-waste recycling area”. Environ Int. 2018a Feb;111:362-371. doi: 10.1016/j.envint.2017.09.016. PubMed PMID: 29169793.
Li Y, Huo X, Liu J, Peng L, Li W, and Xu X. 2011. “Assessment of cadmium exposure for neonates in Guiyu, an electronic waste pollution site of China”. Environ Monit Assess. 177(1-4):343-51. doi: 10.1007/s10661-010-1638-6.
Li Y, Xu X, Liu J, et al. 2008. “The hazard of chromium exposure to neonates in Guiyu of China”. Sci Total Environ. 403: 99–104.
Li Y, Xu X, Wu K, et al. 2008. “Monitoring of lead load and its effect on neonatal behavi-oral neurological assessment scores in Guiyu, an electronic waste recycling town in Chi-na”. J Environ Monit. 10: 1233–38.
Li Y, Li M, Liu Y, Song G, Liu N. 2012. “A microarray for microRNA profiling in spermato-zoa from adult men living in an environmentally polluted site”. Bull Environ Contam Toxi-col. Dec;89(6):1111-4. doi: 10.1007/s00128-012-0827-0.
Liu J, Xu X, Wu K, et al. 2011. “Association between lead exposure from electronic waste recycling and child temperament alterations”. Neurotoxicology. 32: 458–64.
Liu L, Xu X, Yekeen TA, Lin K, Li W, and Huo X. 2015. “Assessment of association bet-ween the dopamine D2 receptor (DRD2) polymorphism and neurodevelopment of child-ren exposed to lead”. Environ Sci Pollut Res Int.. 22(3):1786-93. doi: 10.1007/s11356-014-2565-9. Epub 2014 Jan 28. PubMed PMID: 24469773.
Liu L, Zhang B, Lin K, Zhang Y, Xu X, and Huo X. 2018. “Thyroid disruption and redu-ced mental development in children from an informal e-waste recycling area: A mediation analysis. Chemosphere”. 193:498-505. doi: 10.1016/j.chemosphere.2017.11.059. Epub 2017 Nov 13. PubMed PMID: 29156335.

90 Literature
Liu Q, Cao J, Li KQ, et al. 2009. “Chromosomal aberrations and DNA damage in human populations exposed to the processing of electronics waste. Environ Sci Pollut Res Int”. 16: 329–38.
Liu Y, Huo X, Xu L, Wei X, Wu W, Wu X, and Xu X. 2018. “Hearing loss in children with e-waste lead and cadmium exposure”. Sci Total Environ. 624:621-627. doi: 10.1016/j.sci-totenv.2017.12.091. Epub 2017 Dec 27. PubMed PMID: 29272831.
Lu X, Xu X, Zhang Y, Zhang Y, Wang C, and Huo X. 2018. “Elevated inflammatory Lp-PLA2 and IL-6 link e-waste Pb toxicity to cardiovascular risk factors in preschool child-ren”. Environ Pollut. 234:601-609. doi: 10.1016/j.envpol.2017.11.094. Epub 2017 Dec 21. PubMed PMID: 29223817.
Lundgren K. 2012. “The global impact of e-waste: addres-sing the challenge. Geneva: International Labour Organization”. http://www.ilo.org/sector/Resources/publications/WCMS_196105/lang--en/index.htm.
Mitro SD, Johnson T, and Zota AR. 2015. “Cumulative Chemical Exposures During Pregnancy and Early Development”. Curr Environ Health Rep. 2(4):367-78. doi: 10.1007/s40572-015-0064-x.
Navas-Acien A, Guallar E, Silbergeld EK, and Rothenberg SJ. 2007. “Lead exposure and cardiovascular disease - a systematic review. Environ Health Perspect” 115(2007):472-482.
Neitzel RL, Sayler SK, Arain AL, and Nambunmee K. 2020. “Metal levels, genetic in-stability and renal markers in electronic waste workers in Thailand”. Int J Occup Environ Med. 11(2):72-84. doi: 10.34172/ijoem.2020.1826.
Ni W, Huang Y, Wang X, Zhang J, and Wu K. 2014. “Associations of neonatal lead, cadmi-um, chromium and nickel co-exposure with DNA oxidative damage in an electronic waste recycling town”. Sci Total Environ. 15;472:354-62. doi: 10.1016/j.scitotenv.2013.11.032. Epub 2013 Nov 30. PubMed PMID: 24295751.
Ohajinwa CM, van Bodegom PM, Vijver MG, Olumide AO, Osibanjo O, and Peijnenburg WJGM. 2018. “Prevalence and injury patterns among electronic waste workers in the in-formal sector in Nigeria”. Inj Prev. 24(3):185-192. doi: 10.1136/injuryprev-2016-042265.
Okeme JO, and Arrandale VH. 2019. “Electronic waste recycling: occupational ex-posures and work-related health effects”. Curr Environ Health Rep.6(4):256-268. doi: 10.1007/s40572-019-00255-3.
Prakash S., Manhart, A., Amoyaw-Osei, Y., and Agyekum. 2010. “O. Socio-economic as-sessment and feasibility study on sustainable e-waste management in Ghana”. Accra. Frei-burg, Germany: Öko-Institut e.V. (https://www.oeko.de/oekodoc/1057/2010-105-en.pdf).
Pronczuk de Garbino J. 2004. “Children’s health and the environment: a global perspec-tive. A resource manual for the health sector”. In: Pronczuk de Garbino J, ed. New York: World Health Organization.
Prüss-Ustün A, Vickers C, Haefliger P, and Bertollini R. 2011. “Knowns and unknowns on burden of disease due to chemicals: a systematic review”. Environ Health. 10:9. doi: 10.1186/1476-069X-10-9.
Sabra S, Malmqvist E, Saborit A, Gratacós E, and Gomez Roig MD. 2017. “Heavy me-tals exposure levels and their correlation with different clinical forms of fetal growth res-triction”. PLoS One. 12(10):e0185645. doi: 10.1371/journal.pone.0185645.
Secretariat of the UN Environment Management Group (EMG). 2019. “A New Circular Vision for Electronics: Time for a Global Reboot”. Geneva, Switzerland: World Economic Forum. http://www3.weforum.org/docs/WEF_A_New_Circular_Vision_for_Electronics.pdf
Seith R, Arain AL, Nambunmee K, Adar SD, and Neitzel RL. 2019. “Self-Reported Health and Metal Body Burden in an Electronic Waste Recycling Community in Northeastern Thai-land”. J Occup Environ Med. 61(11):905-909. doi: 10.1097/JOM.0000000000001697.
Sepúlveda A, Schluep M, Renaud FG, Streicher M, Kuehr R, and Hagelüken C. 2010. “A review of the environmental fate and effects of hazardous substances released from electrical and electronic equipments during recycling: Examples from China and India”. Environmental Impact Assessment Review. 30(1):28-41.
Soetrisno FN, and Delgado-Saborit JM. 2020. “Chronic exposure to heavy metals from informal e-waste recycling plants and children’s attention, executive function and acade-mic performance”. Sci Total Environ. 717:137099. doi: 10.1016/j.scitotenv.2020.137099
Song S, Duan Y, Zhang T, Zhang B, Zhao Z, Bai X, Xie L, He Y, Ouyang JP, Huang X, and Sun H. 2019. “Serum concentrations of bisphenol A and its alternatives in elderly population living around e-waste recycling facilities in China: Associations with fasting blood glucose”. Ecotoxicol Environ Saf. 169:822-828. doi: 10.1016/j.ecoenv.2018.11.101. Epub 2018 Nov 29. PubMed PMID: 30597781.
Song Q, and Li J. 2014. “A systematic review of the human body burden of e-waste ex-posure in China”. Environ Int. 68:82-93. doi: 10.1016/j.envint.2014.03.018.

91Literature
Song Q, and Li J. 2015. “A review on human health consequences of metals exposure to e-waste in China”. Environ Pollut. 2015 Jan;196:450-61.
The Basel Action Network (BAN), Silicon Valley Toxics Coalition (SVTC). 2002. “Exporting Harm: The High-Tech Trashing of Asia”. The Basel Action Network (BAN), Silicon Valley Toxics Coalition (SVTC).
Wang F, Kuehr R, Ahlquist D, and Li J. 2012. “E-waste in China: a country report”. Bonn, Germany: United Nations University/StEP Initiative. https://collections.unu.edu/eserv/UNU:1624/ewaste-in-china.pdf, accessed 7 September 2019.
Wang Q, He AM, Gao B, et al. 2011. “Increased levels of lead in the blood and frequencies of lymphocytic micronucleated binucleated cells among workers from an electronic-was-te recycling site”. J Environ Sci Health A Tox Hazard Subst Environ Eng. 46: 669–76.
Wang X, Miller G, Ding G, et al. 2012. “Health risk assessment of lead for children in tinfoil manufacturing and e-waste recycling areas of Zhejiang Province, China”. Sci Total Environ. 426: 106–12.
WHO. 2003. “Making a Difference: Indicators to Improve Children’s Environmental Health”. Geneva, Switzerland: World Health Organization.https://www.who.int/phe/children/childrenindicators/en/, accessed 15 September 2019.
Wu K, Xu X, Liu J, Guo Y, and Huo X. 2011. “In utero exposure to polychlorinated bip-henyls and reduced neonatal physiological development from Guiyu, China”. Ecotoxicol Environ Saf. 74: 2141–47.
Wu K, Xu X, Peng, Liua J, Guo Y, and Huo X. 2012. “Association between maternal ex-posure to perfluorooctanoic acid (PFOA) from electronic waste recycling and neonatal health outcomes”. Environ Int. 48: 1–8.
Xing GH, Chan JK, Leung AO, Wu SC, and Wong MH. 2009. “Environmental impact and human exposure to PCBs in Guiyu, an electronic waste recycling site in China”. Environ Int. 35(1):76-82. doi: 10.1016/j.envint.2008.07.025.
Xu L, Ge J, Huo X, Zhang Y, Lau ATY, and Xu X. 2016. “Differential proteomic expression of human placenta and fetal development following e-waste lead and cadmium exposu-re in utero”. Sci Total Environ. 550:1163-1170. doi: 10.1016/j.scitotenv.2015.11.084. Epub 2016 Feb 16. PubMed PMID: 26895036.
Xu L, Huo X, Liu Y, Zhang Y, Qin Q, and Xu X. 2020. “Hearing loss risk and DNA met-hylation signatures in preschool children following lead and cadmium exposure from an
electronic waste recycling area”. Chemosphere. 246:125829. https://doi.org/10.1016/j.chemosphere.2020.125829, doi.org/10.1016/j.chemosphere.2020.125829.
Xu L, Huo X, Zhang Y, Li W, Zhang J, and Xu X. 2015. “Polybrominated diphenyl ethers in human placenta associated with neonatal physiological development at a typical e-waste recycling area in China”. Environ Pollut. 196:414-22. PubMedPMID: 25468211.
Xu P, Lou X, Ding G, Shen H, Wu L, Chen Z, Han J, Han G, and Wang X. 2014. “Asso-ciation of PCB, PBDE and PCDD/F body burdens with hormone levels for children in an e-waste dismantling area of Zhejiang Province, China”. Sci Total Environ. 499:55-61. doi: 10.1016/j.scitotenv.2014.08.057. Epub 2014 Aug 29. PubMed PMID: 25173862.
Xu P, Lou X, Ding G, Shen H, Wu L, Chen Z, Han J, and Wang X. 2015. “Effects of PCB sand PBDEs on thyroid hormone, lymphocyte proliferation, hematology and kidney in-jury markers in residents of an e-waste dismantling area in Zhejiang, China”. Sci Total Environ. 536:215-222. doi: 10.1016/j.scitotenv.2015.07.025. Epub 2015 Jul 25. PubMed PMID: 26218560.
Xu X, Yang H, Chen A, et al. 2012. “Birth outcomes related to informal e-waste recycling in Guiyu, China”. Reprod Toxicol. 33: 94–98.
Xu X, Hu H, Kearney GD, Kan H, and Sheps DS. 2013. “Studying the effects of polycy-clic aromatic hydrocarbons on peripheral arterial disease in the United States”. Sci. Total Environ. 461–462:341-347.
Xu X, Liu J, Huang C, Lu F, Chiung YM, and Huo X. 2015. “Association of polycyclic aromatic hydrocarbons (PAHs) and lead co-exposure with child physical growth and de-velopment in an e-waste recycling town”. Chemosphere. 139:295-302. doi: 10.1016/j.chemosphere.2015.05.080. Epub 2015 Jul 4. PubMed PMID: 26151377
Xu X, Zeng X, Boezen HM, Huo X. 2015. “E-waste environmental contamination and harm to public health in China”. Front Med. 9(2):220-228.
Yohannessen K, Pinto-Galleguillos D, Parra-Giordano D, Agost A, Valdés M, Smith LM, Galen K, Arain A, Rojas F, Neitzel RL, and Ruiz-Rudolph P. 2019. “Health Assessment of Electronic Waste Workers in Chile: Participant Characterization”. Int J Environ Res Public Health. 16(3). pii: E386. doi: 10.3390/ijerph16030386. PubMed PMID: 30700055; Pub-Med Central PMCID: PMC6388190.
Yuan J, Chen L, Chen D, et al. 2008. “Elevated serum polybrominated diphenyl ethers and thyroid-stimulating hormone associated with lymphocytic micronuclei in Chinese workers from an E-waste dismantling site”. Environ Sci Technol. 42: 2195–200.

92 Literature
Zeng X, Xu X, Boezen HM, Vonk JM, Wu W, and Huo X. 2017. “Decreased lung function with mediation of blood parameters linked to e-waste lead and cadmium exposure in pre-school children”. Environ Pollut. 230:838-848. doi: 10.1016/j.envpol.2017.07.014. Epub 2017 Jul 19. PubMed PMID: 28734265.
Zeng X, Xu X, Qin Q, Ye K, Wu W, and Huo X. 2019. “Heavy metal exposure has adverse effects on the growth and development of preschool children”. Environ Geochem Health. 41(1):309-321. doi: 10.1007/s10653-018-0114-z. Epub 2018 Apr 25. PubMed PMID: 29696494.
Zeng X, Xu X, Zhang Y, Li W, and Huo X. 2017. “Chest circumference and birth weight are good predictors of lung function in preschool children from an e-waste recycling area”. Environ Sci Pollut Res Int. 24(28):22613-22621. doi: 10.1007/s11356-017-9885-5. Epub 2017 Aug 15. PubMed PMID: 28808870.
Zeng Z, Huo X, Zhang Y, Xiao Z, Zhang Y, and Xu X. 2018. “Lead exposure is associated with risk of impaired coagulation in preschool children from an e-waste recycling area”. Environ Sci Pollut Res Int. 25(21):20670-20679. doi: 10.1007/s11356-018-2206-9.
Zhang B, Huo X, Xu L, Cheng Z, Cong X, Lu X, and Xu X. 2017. “Elevated lead levels from e-waste exposure are linked to decreased olfactory memory in children”. Environ Pollut. 231(Pt 1):1112-1121. doi: 10.1016/j.envpol.2017.07.015.
Zhang R, Huo X, Ho G, Chen X, Wang H, Wang T, and Ma L. 2015. “Attention deficit/hy-peractivity symptoms in preschool children from an e-waste recycling town: assessment by the parent report derived from DSM-IV”. BMC Pediatr. 15:51. doi: 10.1186/s12887-015-0368-x. PubMed PMID: 25939992; PubMed Central PMCID: PMC4429982.
Zhang Y, Huo X, Cao J, Yang T, Xu L, and Xu X. 2016. “Elevated lead levels and adver-se effects on natural killer cells in children from an electronic waste recycling area”. En-viron Pollut. 213:143-150. doi: 10.1016/j.envpol.2016.02.004. Epub 2016 Feb 17. PubMed PMID: 26895538.
Zhang Y, Xu X, Chen A, Davuljigari CB, Zheng X, Kim SS, Dietrich KN, Ho SM, Reponen T, and Huo X. 2018. “Maternal urinary cadmium levels during pregnancy associated with risk of sex-dependent birth outcomes from an e-waste pollution site in China”. Reprod Toxicol. 75:49-55. doi: 10.1016/j.reprotox.2017.11.003. Epub 2017 Nov 14. PubMed PMID: 29154917.
Zhang Y, Xu X, Sun D, Cao J, Zhang Y, and Huo X. 2017. “Alteration of the number and percentage of innate immune cells in preschool children from an e-waste recycling area”. Ecotoxicol Environ Saf. 145:615-622. doi: 10.1016/j.ecoenv.2017.07.059. Epub 2017 Aug
12. PubMed PMID: 28806563.
Zheng G, Xu X, Li B, Wu K, Yekeen TA, and Huo X. 2013. “Association between lung function in school children and exposure to three transition metals from an e-waste recy-cling area”. J Expo Sci Environ Epidemiol. 23: 67–72.

93Literature

94
About the Authors
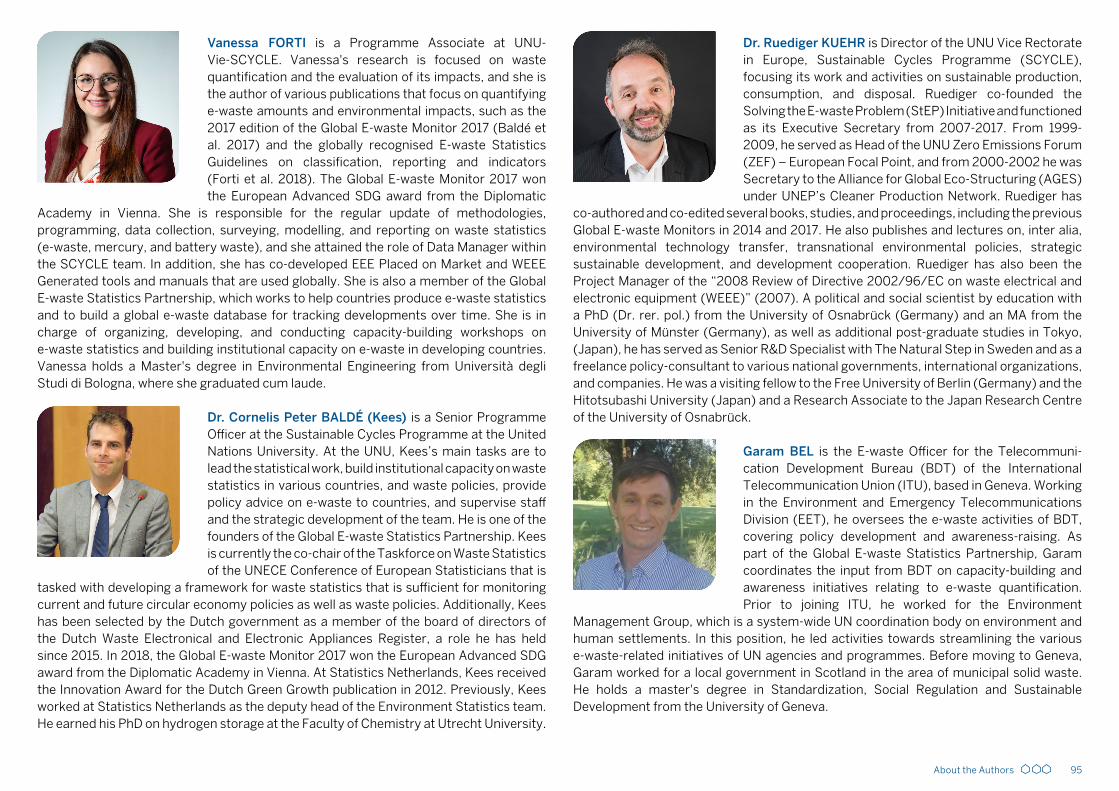
95About the Authors
Vanessa FORTI is a Programme Associate at UNU-Vie-SCYCLE. Vanessa's research is focused on waste quantification and the evaluation of its impacts, and she is the author of various publications that focus on quantifying e-waste amounts and environmental impacts, such as the 2017 edition of the Global E-waste Monitor 2017 (Baldé et al. 2017) and the globally recognised E-waste Statistics Guidelines on classification, reporting and indicators (Forti et al. 2018). The Global E-waste Monitor 2017 won the European Advanced SDG award from the Diplomatic
Academy in Vienna. She is responsible for the regular update of methodologies, programming, data collection, surveying, modelling, and reporting on waste statistics (e-waste, mercury, and battery waste), and she attained the role of Data Manager within the SCYCLE team. In addition, she has co-developed EEE Placed on Market and WEEE Generated tools and manuals that are used globally. She is also a member of the Global E-waste Statistics Partnership, which works to help countries produce e-waste statistics and to build a global e-waste database for tracking developments over time. She is in charge of organizing, developing, and conducting capacity-building workshops on e-waste statistics and building institutional capacity on e-waste in developing countries. Vanessa holds a Master's degree in Environmental Engineering from Università degli Studi di Bologna, where she graduated cum laude.
Dr. Cornelis Peter BALDÉ (Kees) is a Senior Programme Officer at the Sustainable Cycles Programme at the United Nations University. At the UNU, Kees’s main tasks are to lead the statistical work, build institutional capacity on waste statistics in various countries, and waste policies, provide policy advice on e-waste to countries, and supervise staff and the strategic development of the team. He is one of the founders of the Global E-waste Statistics Partnership. Kees is currently the co-chair of the Taskforce on Waste Statistics of the UNECE Conference of European Statisticians that is
tasked with developing a framework for waste statistics that is sufficient for monitoring current and future circular economy policies as well as waste policies. Additionally, Kees has been selected by the Dutch government as a member of the board of directors of the Dutch Waste Electronical and Electronic Appliances Register, a role he has held since 2015. In 2018, the Global E-waste Monitor 2017 won the European Advanced SDG award from the Diplomatic Academy in Vienna. At Statistics Netherlands, Kees received the Innovation Award for the Dutch Green Growth publication in 2012. Previously, Kees worked at Statistics Netherlands as the deputy head of the Environment Statistics team. He earned his PhD on hydrogen storage at the Faculty of Chemistry at Utrecht University.
Dr. Ruediger KUEHR is Director of the UNU Vice Rectorate in Europe, Sustainable Cycles Programme (SCYCLE), focusing its work and activities on sustainable production, consumption, and disposal. Ruediger co-founded the Solving the E-waste Problem (StEP) Initiative and functioned as its Executive Secretary from 2007-2017. From 1999-2009, he served as Head of the UNU Zero Emissions Forum (ZEF) – European Focal Point, and from 2000-2002 he was Secretary to the Alliance for Global Eco-Structuring (AGES) under UNEP’s Cleaner Production Network. Ruediger has
co-authored and co-edited several books, studies, and proceedings, including the previous Global E-waste Monitors in 2014 and 2017. He also publishes and lectures on, inter alia, environmental technology transfer, transnational environmental policies, strategic sustainable development, and development cooperation. Ruediger has also been the Project Manager of the “2008 Review of Directive 2002/96/EC on waste electrical and electronic equipment (WEEE)” (2007). A political and social scientist by education with a PhD (Dr. rer. pol.) from the University of Osnabrück (Germany) and an MA from the University of Münster (Germany), as well as additional post-graduate studies in Tokyo, (Japan), he has served as Senior R&D Specialist with The Natural Step in Sweden and as a freelance policy-consultant to various national governments, international organizations, and companies. He was a visiting fellow to the Free University of Berlin (Germany) and the Hitotsubashi University (Japan) and a Research Associate to the Japan Research Centre of the University of Osnabrück.
Garam BEL is the E-waste Officer for the Telecommuni-cation Development Bureau (BDT) of the International Telecommunication Union (ITU), based in Geneva. Working in the Environment and Emergency Telecommunications Division (EET), he oversees the e-waste activities of BDT, covering policy development and awareness-raising. As part of the Global E-waste Statistics Partnership, Garam coordinates the input from BDT on capacity-building and awareness initiatives relating to e-waste quantification. Prior to joining ITU, he worked for the Environment
Management Group, which is a system-wide UN coordination body on environment and human settlements. In this position, he led activities towards streamlining the various e-waste-related initiatives of UN agencies and programmes. Before moving to Geneva, Garam worked for a local government in Scotland in the area of municipal solid waste. He holds a master's degree in Standardization, Social Regulation and Sustainable Development from the University of Geneva.

96
Annex 1 UNU-KEYS and Link to E-waste CategoriesClassification of EEE under the UNU-keys and correlation of UNU-keys with the categories under EU-6 classification

97Annex 1. UNU-KEYS and Link to E-waste Categories
UNU-KEY
Description EEE category under EU-6
0001 Central Heating (household installed) Large equipment
0002 Photovoltaic Panels (incl. inverters) Large equipment
0101 Professional Heating & Ventilation (excl. cooling
equipment)
Large equipment
0102 Dish washers Large equipment
0103 Kitchen equipment (e.g. large furnaces, ovens,
cooking equipment)
Large equipment
0104 Washing Machines (incl. combined dryers) Large equipment
0105 Dryers (washer-dryers, centrifuges) Large equipment
0106 Household Heating & Ventilation (e.g. hoods, ventila-
tors, space heaters)
Large equipment
0108 Fridges (incl. combi fridges) Temp. exchange
equipment
0109 Freezers Temp. exchange
equipment
0111 Air Conditioners (household installed and portable) Temp. exchange
equipment
UNU-KEY
Description EEE category under EU-6
0112 Other Cooling equipment (e.g. dehumidifiers, heat
pump dryers)
Temp. exchange
equipment
0113 Professional Cooling equipment (e.g. large air conditi-
oners, cooling displays)
Temp. exchange
equipment
0114 Microwaves (incl. combined, excl. grills) Small equipment
0201 Other small household equipment (e.g. small ventila-
tors, irons, clocks, adapters)
Small equipment
0202 Equipment for food preparation (e.g. toaster, grills,
food processing, frying pans)
Small equipment
0203 Small household equipment for hot water preparation
(e.g. coffee, tea, water cookers)
Small equipment
0204 Vacuum Cleaners (excl. professional) Small equipment
0205 Personal Care equipment (e.g. tooth brushes, hair
dryers, razors)
Small equipment
0301 Small IT equipment (e.g. routers, mice, keyboards, ex-
ternal drives, accessories)
Small IT
0302 Desktop PCs (excl. monitors, accessoires) Small IT
0303 Laptops (incl. tablets) Screens and
monitors

98
UNU-KEY
Description EEE category under EU-6
0304 Printers (e.g. scanners, multifunctionals, faxes) Small IT
0305 Telecommunication equipment (e.g. [cordless]
phones, answering machines)
Small IT
0306 Mobile Phones (incl. smartphones, pagers) Small IT
0307 Professional IT equipment (e.g. servers, routers, data
storage, copiers)
Large equipment
0308 Cathode Ray Tube Monitors Screens and
monitors
0309 Flat Display Panel Monitors (LCD, LED) Screens and
monitors
0401 Small Consumer Electronics (e.g. headphones, remote
controls)
Small equipment
0402 Portable Audio & Video (e.g. MP3 players, e-readers,
car navigation)
Small equipment
0403 Musical Instruments, Radio, Hi-Fi (incl. audio sets) Small equipment
0404 Video (e.g. Video recorders, DVD and Blu-ray players,
set-top boxes) and Projectors
Small equipment
0405 Speakers Small equipment
UNU-KEY
Description EEE category under EU-6
0406 Cameras (e.g. camcorders, photo & digital still came-
ras)
Small equipment
0407 Cathode Ray Tube TVs Screens and
monitors
0408 Flat Display Panel TVs (LCD, LED, Plasma) Screens and
monitors
0501 Small Lighting equipment (excl. LED & incandescent) Small equipment
0502 Compact Fluorescent Lamps (incl. retrofit &
non-retrofit)
Lamps
0503 Straight Tube Fluorescent Lamps Lamps
0504 Special Lamps (e.g. professional mercury, high & low
pressure sodium)
Lamps
0505 LED Lamps (incl. retrofit LED lamps) Lamps
0506 Household Luminaires (incl. household
incandescent fittings & household LED luminaires)
Small equipment
0507 Professional Luminaires (offices, public space,
industry)
Small equipment
0601 Household Tools (e.g. drills, saws, high-pressure clea-
ners, lawnmowers)
Small equipment
Annex 1. UNU-KEYS and Link to E-waste Categories

99Annex 1. UNU-KEYS and Link to E-waste Categories
UNU-KEY
Description EEE category under EU-6
0602 Professional Tools (e.g. for welding, soldering,
milling)
Large equipment
0701 Toys (e.g. car racing sets, electric trains, music toys,
biking computers, drones)
Small equipment
0702 Game Consoles Small IT
0703 Leisure equipment (e.g. sports equipment, electric
bikes, juke boxes)
Large equipment
0801 Household Medical equipment (e.g. thermometers,
blood pressure meters)
Small equipment
0802 Professional Medical equipment (e.g. hospital,
dentist, diagnostics)
Large equipment
0901 Household Monitoring & Control equipment (alarm,
heat, smoke, excl. screens)
Small equipment
0902 Professional Monitoring & Control equipment
(e.g. laboratory, control panels)
Large equipment
1001 Non-cooled Dispensers (e.g. for vending, hot drinks,
tickets, money)
Large equipment
1002 Cooled Dispensers (e.g. for vending, cold drinks) Temp. exchange
equipment

100
Annex 2 Methodology

101Annex 2. Methodology
Calculation of EEE Placed on Market (POM), E-waste Generated, and Stocks The calculation of e-waste generated is based on both empirical data from the apparent consumption method for calculating the EEE POM and a sales-lifespan model. In this model, lifespan data for each product is subjected to the EEE POM (using a Weibull function) to calculate the e-waste generated. The methodology described to determine EEE Placed on the Market is compliant with the Common Methodology approach as defined in Article 7 of the EU-WEEE Directive (Magalini et al. 2014).
The data in this report was obtained and treated using the following steps:1. Select the relevant codes that describe EEE in the Harmonised Commodity
Description and Coding System (HS).(38)
2. For the European Union, the international trade statistical data was extracted from Eurostat in the eight-digit combined nomenclature (CN) codes. Domestic production data was also extracted from Eurostat. For the other countries, statistical data on imports and exports was extracted from the UN Comtrade database. This was done for 181 countries and approximately 220 HS codes for the years 1995-2018. Countries were then classified into five groups according to the Purchasing Power Parity (PPP) for the scenario business as usual, retrieved from Riahi et al. 2017. This procedure was repeated for each year since the Country’s PPP changes over the years, especially for developing countries. This process was useful to make statistics comparable between countries and to calculate trends between groups.
Group 1: highest PPP (higher than $32,312 USD per capita in 2016) Group 2: high PPP ($32,312 USD - $13,560 USD per capita in 2016) Group 3: mid PPP ($13,560 - $6,217 USD per capita in 2016) Group 4: low PPP ($6,217 - $1,769 USD per capita in 2016) Group 5: lowest PPP (lower than $1,769 USD per capita in 2016)
3. Convert the units to weight using the average weight data per appliance type. The average weights are published in E-waste Statistics Guidelines (Forti, Baldé, and Kuehr 2018).
4. Calculate the weight of Placed on the Market for the 54 UNU-KEYS by using the apparent consumption approach: POM = Domestic Production + Import – Export (this equation refers to the 28 EU member states). For countries other than the 28 EU member states, data on domestic production was retrieved from the UNSD database in CPC1.1(39) (UNSD 2019), while for China and Vietnam, data on domestic production was retrieved from national registries. When data on domestic production was not available, the following approach was used: POM = Import – Export.
5. The numbers presented in this report exclude the UNU-KEY 0002 (Photovoltaic
Panels) because data are not available in the UN Comtrade database.
6. Perform automatic corrections for outliers on the sales data. This is needed to detect values that were too low (due to the lack of domestic production data in some countries where domestic production is relatively large) or too high (due to misreporting of codes or units). Those detected entries are replaced with more realistic sales values either from the time series of the origin country or from comparable countries. These statistical routines lead to a harmonised dataset with a similar scope and consistent sales for a country based on their own trade statistics.
7. Perform manual corrections based on the analysis of the automatic corrections. This is needed to correct unreliable data using knowledge of the market. For instance, CRT TVs have not been sold in recent years. In addition, country data on Placed on the Market kindly provided by Bosnia and Herzegovina were substituted to the data estimated with the apparent consumption method.
8. Perform corrections based on the knowledge of the possession rates measured by ITU for desktop PCs and by UNICEF (UNICEF 2018) for 75 countries and 5 UNU_KEYS (0403, 0407, 0306, 0305, 0108).
9. Extend the time series of Placed on the Market. Past POM are calculated back to 1980 based on the trends of the available data and the market entry of the appliance. Future POM are predicted until 2030 using sophisticated extrapolation methods. The principle takes into account the ratio between the POM and the PPP per county and uses that ratio to estimate the Placed on the Market with the forecast of the PPP from the SSP Database (Shared Socioeconomic Pathways) (Riahi et al. 2017).
10. Determine the e-waste generated by country by using the Placed on the Market and lifetime distributions. Lifetime data is obtained from the 28 EU member states using the Weibull distribution. Ideally, the lifetime of each product are determined empirically per product per type of country. At this stage, only harmonised European residence times of EEE were available from extensive studies performed for the EU and were found to be quite homogeneous across Europe, leading to a 10% deviation in final outcomes (Magalini et al. 2014). Due to the absence of data, it was assumed that the higher residence times per product in the EU were approximately applicable for non-EU countries as well. In some cases, this would lead to an overestimation, as a product could last longer in developing countries than in developed countries because residents of developing countries are likelier to repair products. However, it can also lead to an underestimation, as the quality of products is often lower in developing countries because reused equipment or more cheaply produced versions that don’t last as long might enter the domestic market. But in general, it is assumed that this process leads to relatively accurate estimates. It should be noted that the Placed on the Market

102 Annex 2. Methodology
are much more sensitive for the amount of e-waste generated than the lifespans.
11. Determining the stock quantities as the difference between the historical Placed on the Market and the e-waste generated over the years.
E-waste in Waste BinsThe data on waste bin complementary waste flows in the EU were gathered from the ProSUM project (Wolk-Lewanowicz et al. 2016 & Rotter et al. 2016); the ProSUM project is a comprehensive review and analysis of literature of current data and past trends regarding the disposal of WEEE in waste bins in the EU-28, plus Norway and Switzerland Primary and secondary data sources were analysed using the ProSUM bibliography, which consisted of publications, journals, and country studies quantifying the country’s WEEE and the analysis of household waste sorting in order to assess the presence of WEEE in current municipal solid waste flows destined for incineration and landfills (Wolk-Lewanowicz et al. 2016).
E-waste documented to be formally collected and recycledFor the EU, total amount of e-waste formally collected and recycled was extracted from the Eurostat database for 32 countries. The latest data refer to the year 2017. For other countries in the world, data was collected from questionnaires conducted by SCYCLE, OECD, and UNSD. Questionnaires have been distributed to more than 80 countries in total, but in most cases countries did not have any information, and for those that responded, the datasets were far from complete and harmonised. If data was not available, relevant information was searched in literature. On average, data on e-waste formally collected and recycled refer to the year 2016. For all countries, data for 2019 were nowcasted by using recycling and collection rates in the available time series and multiplying that with the e-waste generated data. The calculations were conducted for the countries for which there was at least one data point available. The results of the UNSD and OECD questionnaires and pilot questionnaires were used to compile the global totals on e-waste collection and recycling in this report.
Unknown FlowsThe e-waste gap is the amount of e-waste that is unaccounted for. The unknown flows are calculated by subtracting the e-waste quantities officially collected and the e-waste found in waste bins from the total amount of e-waste generated.
Transboundary movements of UEEE or e-wasteThe range of UEEE or e-waste exported was derived by reviewing estimates published in existing literature (e.g. Duan et al. 2013; Lasaridi et al. 2016; USITC 2013; BIO intelligence Service 2013; Huisman et al. 2015; Zoeteman, Krikke, and Venselaar 2010; Geeraerts, Mutafoglu, and Illés 2016). Population covered by national policies and legislationThe development of national e-waste policies and legislation was evaluated in this report to assess whether a country had national e-waste management policy and/or legislation in effect through 2019. Population data was obtained from the UNDESA - Population Division 2019. The e-waste policy and legislation status in countries were derived from a database that was kindly provided by C2P and complemented with information from a GSMA study (GSMA, 2020).
Quantification of raw materials found in e-wasteThe amount of raw materials found in e-waste was calculated by linking the composition data from ProSUM to the estimated amount of e-waste generated (Huisman et al. 2017). The list of elements considered in the analysis is Ag, Al, Au, Bi, Co, Cu, Fe, Ge, Hg, In, Ir, Os, Pd, Pt, Rh, Ru, Sb.
Quantification of BFR found in E-wasteComposition data relative to Brominated Flame Retardant plastics were searched for in the literature, and relevant information was found in (Chen et al. 2012; Abbasi 2015; Yu et al. 2017). Similarly to the raw materials found in e-waste, composition data on BRF were linked to the estimated amount of e-waste generated.

103Annex 2. Methodology
Quantification of mercury found in E-wasteThe amount of mercury found in e-waste was calculated by linking the composition data from ProSUM to the estimated amount of e-waste (Huisman et al. 2017).
Quantification of savings of greenhouse gas (GHG) emissions (primary vs secondary production) Estimates of GHG emissions per kg of produced metal in the case of primary and secondary production were sourced from Van der Voet et al. 2019 and multiplied by the amount of metals (iron, aluminium and copper) estimated to be recycled globally in 2019.
Quantification of GHG missions for refrigerantsThe scope of this research is to estimate the amount of CO2 equivalents that could potentially be released into the atmosphere if cooling and freezing equipment (and, thus, the refrigerants contained in the appliances) were not recycled and treated in an environmentally sound way.
A literature review was conducted to assess the amount and type of refrigerants used in cooling and freezing equipment. Relevant information was found for fridges and air conditioners in Duan et al. 2018. Subsequently, the amount of refrigerants was linked to the estimated amount of waste fridges and air conditioners generated by each of the 181 countries analyzed, as well as by year. Lastly, the Global Warming Potential (GWP) was researched for each type of refrigerant and linked the amount of refrigerants found in fridges and air conditioners. It was discovered that in fridges, the refrigerants R-11 and R-12 were used until 1994; they were then substituted with R-134a and R-22 until 2017. Since 2017, only R-152a and R1234yf have been used. In air conditioners, R-410a, R-134a, and R-22 were used until 2017, and the R-32 and R-1234yf have been used since.

104
Annex 3 Country E-waste Key Statistics
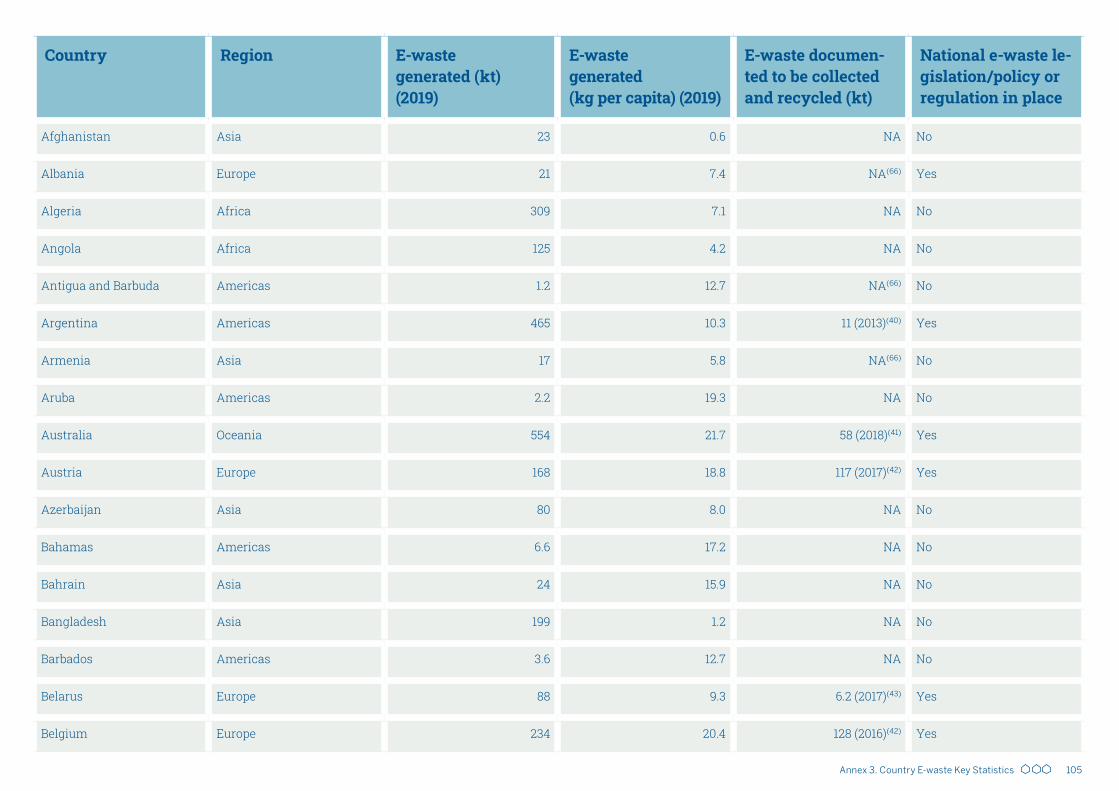
105Annex 3. Country E-waste Key Statistics
Country Region E-waste generated (kt) (2019)
E-waste generated (kg per capita) (2019)
E-waste documen-ted to be collected and recycled (kt)
National e-waste le-gislation/policy or regulation in place
Afghanistan Asia 23 0.6 NA No
Albania Europe 21 7.4 NA(66) Yes
Algeria Africa 309 7.1 NA No
Angola Africa 125 4.2 NA No
Antigua and Barbuda Americas 1.2 12.7 NA(66) No
Argentina Americas 465 10.3 11 (2013)(40) Yes
Armenia Asia 17 5.8 NA(66) No
Aruba Americas 2.2 19.3 NA No
Australia Oceania 554 21.7 58 (2018)(41) Yes
Austria Europe 168 18.8 117 (2017)(42) Yes
Azerbaijan Asia 80 8.0 NA No
Bahamas Americas 6.6 17.2 NA No
Bahrain Asia 24 15.9 NA No
Bangladesh Asia 199 1.2 NA No
Barbados Americas 3.6 12.7 NA No
Belarus Europe 88 9.3 6.2 (2017)(43) Yes
Belgium Europe 234 20.4 128 (2016)(42) Yes

106 Annex 3. Country E-waste Key Statistics
Country Region E-waste generated (kt) (2019)
E-waste generated (kg per capita) (2019)
E-waste documen-ted to be collected and recycled (kt)
National e-waste le-gislation/policy or regulation in place
Belize Americas 2.4 5.8 NA No
Benin Africa 9.4 0.8 NA No
Bhutan Asia 3.4 4.0 NA No
Bolivia
(Plurinational State of)
Americas 41 3.6 NA Yes
Bosnia and Herzegovina Europe 27 7.8 NA(66) Yes
Botswana Africa 19 7.9 NA No
Brazil Americas 2143 10.2 0.14 (2012)(44) No
Brunei Darussalam Asia 8.7 19.7 NA No
Bulgaria Europe 82 11.7 54.5 (2017)(42) Yes
Burkina Faso Africa 13 0.6 NA No
Burundi Africa 5.3 0.5 NA No
Cabo Verde Africa 2.8 4.9 NA(66) No
Cambodia Asia 19 1.1 NA Yes
Cameroon Africa 26 1.0 0.05 (2018)(45) Yes
Canada Americas 757 20.2 101 (2016)(46) Yes
Central African Republic Africa 2.5 0.5 NA No

107Annex 3. Country E-waste Key Statistics
Country Region E-waste generated (kt) (2019)
E-waste generated (kg per capita) (2019)
E-waste documen-ted to be collected and recycled (kt)
National e-waste le-gislation/policy or regulation in place
Chad Africa 10 0.8 NA No
Chile Americas 186 9.9 5.5 (2017)(47) Yes
China Asia 10129 7.2 1546 (2018)(48) Yes
China, Hong Kong Special
Administrative Region
Asia 153 20.2 55.8 (2013)(49) Yes
China, Macao Special
Administrative Region
Asia 12 18.1 NA Yes
Colombia Americas 318 6.3 2.7 (2014)(46) Yes
Comoros Africa 0.6 0.7 NA No
Congo Africa 18 4.0 NA No
Costa Rica Americas 51 10.0 NA Yes
Côte d'Ivoire Africa 30 1.1 NA Yes
Croatia Europe 48 11.9 36 (2017)(42) Yes
Cyprus Asia 15 16.8 2.5 (2016)(42) Yes
Czech Republic Europe 167 15.7 91 (2017)(42) Yes
Denmark Europe 130 22.4 70 (2017)(42) Yes
Djibouti Africa 1.1 1.0 NA No

108 Annex 3. Country E-waste Key Statistics
Country Region E-waste generated (kt) (2019)
E-waste generated (kg per capita) (2019)
E-waste documen-ted to be collected and recycled (kt)
National e-waste le-gislation/policy or regulation in place
Dominica Americas 0.6 7.9 NA No
Dominican Republic Americas 67 6.4 NA No
Ecuador Americas 99 5.7 0.005 (2017)(43) Yes
Egypt Africa 586 5.9 NA Yes
El Salvador Americas 37 5.5 0.56 (2012)(50) No
Eritrea Africa 3.4 0.6 NA No
Estonia Europe 17 13.1 13 (2017)(42) Yes
Ethiopia Africa 55 0.6 NA No
Fiji Oceania 5.4 6.1 NA No
Finland Europe 110 19.8 65 (2017)(42) Yes
France Europe 1362 21.0 742 (2017)(42) Yes
Gabon Africa 18 8.7 NA No
Gambia (Republic of) Africa 2.7 1.2 NA No
Georgia Asia 27 7.3 NA No
Germany Europe 1607 19.4 837 (2017)(42) Yes
Ghana Africa 53 1.8 NA Yes
Greece Europe 181 16.9 56 (2017)(42) Yes
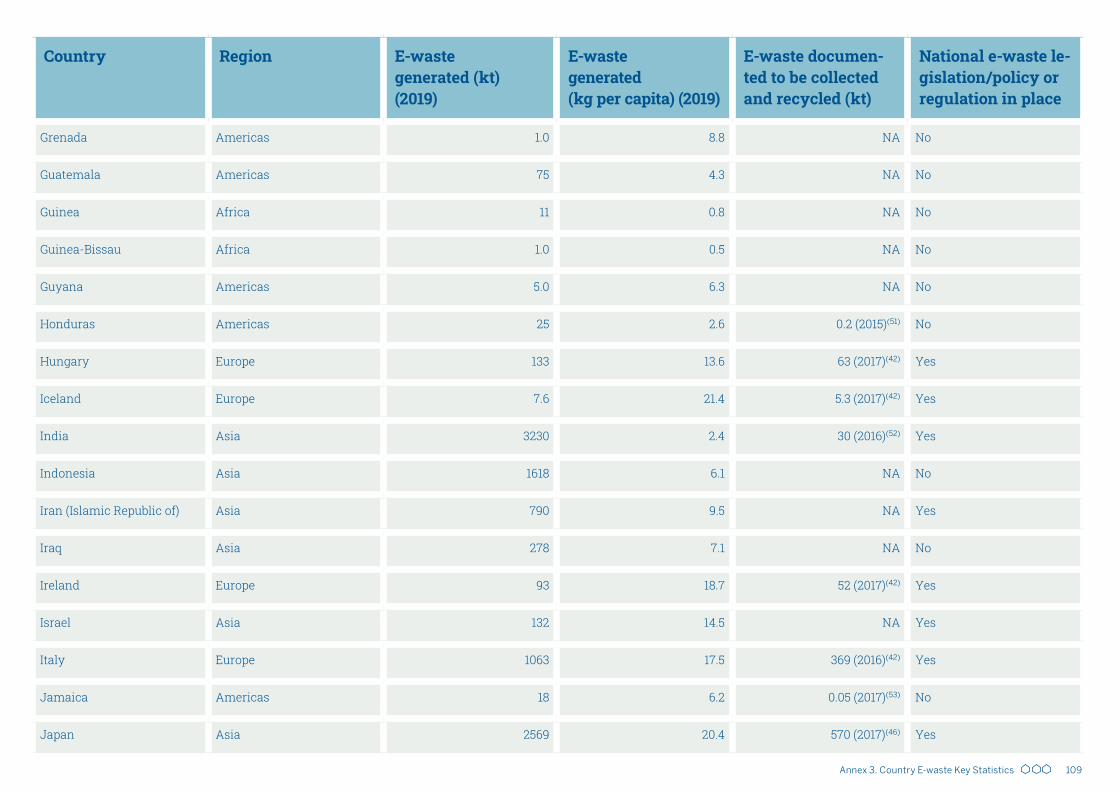
109Annex 3. Country E-waste Key Statistics
Country Region E-waste generated (kt) (2019)
E-waste generated (kg per capita) (2019)
E-waste documen-ted to be collected and recycled (kt)
National e-waste le-gislation/policy or regulation in place
Grenada Americas 1.0 8.8 NA No
Guatemala Americas 75 4.3 NA No
Guinea Africa 11 0.8 NA No
Guinea-Bissau Africa 1.0 0.5 NA No
Guyana Americas 5.0 6.3 NA No
Honduras Americas 25 2.6 0.2 (2015)(51) No
Hungary Europe 133 13.6 63 (2017)(42) Yes
Iceland Europe 7.6 21.4 5.3 (2017)(42) Yes
India Asia 3230 2.4 30 (2016)(52) Yes
Indonesia Asia 1618 6.1 NA No
Iran (Islamic Republic of) Asia 790 9.5 NA Yes
Iraq Asia 278 7.1 NA No
Ireland Europe 93 18.7 52 (2017)(42) Yes
Israel Asia 132 14.5 NA Yes
Italy Europe 1063 17.5 369 (2016)(42) Yes
Jamaica Americas 18 6.2 0.05 (2017)(53) No
Japan Asia 2569 20.4 570 (2017)(46) Yes

110 Annex 3. Country E-waste Key Statistics
Country Region E-waste generated (kt) (2019)
E-waste generated (kg per capita) (2019)
E-waste documen-ted to be collected and recycled (kt)
National e-waste le-gislation/policy or regulation in place
Jordan Asia 55 5.4 1.3 (2018)(54) Yes
Kazakhstan Asia 172 9.2 10 (2017)(43) No
Kenya Africa 51 1.0 NA Yes
Kiribati Oceania 0.1 0.9 NA No
Kuwait Asia 74 15.8 NA No
Kyrgyzstan Asia 10 1.5 NA No
Lao People's Democratic
Republic
Asia 17 2.5 NA No
Latvia Europe 20 10.6 9.3 (2017)(42) Yes
Lebanon Asia 50 8.2 NA No
Lesotho Africa 2.3 1.1 NA No
Libya Africa 76 11.5 NA No
Lithuania Europe 34 12.3 13 (2017)(42) Yes
Luxembourg Europe 12 18.9 6.1 (2017)(42) Yes
Madagascar Africa 15 0.6 NA Yes
Malawi Africa 10 0.5 NA No
Malaysia Asia 364 11.1 NA Yes

111Annex 3. Country E-waste Key Statistics
Country Region E-waste generated (kt) (2019)
E-waste generated (kg per capita) (2019)
E-waste documen-ted to be collected and recycled (kt)
National e-waste le-gislation/policy or regulation in place
Maldives Asia 3.4 9.1 NA No
Mali Africa 15 0.8 NA No
Malta Europe 6.8 14.5 1.7 (2016)(42) Yes
Mauritania Africa 6.4 1.4 NA No
Mauritius Africa 13 10.1 2 (2011)(55) No
Mexico Americas 1220 9.7 36 (2014)(46) Yes
Micronesia (Federated
States of)
Oceania 0.2 1.9 NA No
Mongolia Asia 17 5.2 NA Yes
Montenegro Europe 6.7 10.7 NA Yes
Morocco Africa 164 4.6 NA No
Mozambique Africa 17 0.5 NA No
Myanmar Asia 82 1.6 NA No
Namibia Africa 16 6.4 0.05 (2018)(56) No
Nepal Asia 28 0.9 NA No
Netherlands Europe 373 21.6 166 (2017)(42) Yes
New Zealand Oceania 96 19.2 NA No

112 Annex 3. Country E-waste Key Statistics
Country Region E-waste generated (kt) (2019)
E-waste generated (kg per capita) (2019)
E-waste documen-ted to be collected and recycled (kt)
National e-waste le-gislation/policy or regulation in place
Nicaragua Americas 16 2.5 NA No
Niger Africa 9.3 0.5 NA No
Nigeria Africa 461 2.3 NA Yes
North Macedonia Europe 16 7.9 NA Yes
Norway Europe 139 26.0 99 (2017)(42) Yes
Oman Asia 69 15.8 NA No
Pakistan Asia 433 2.1 NA No
Palau Oceania 0.2 9.1 NA No
Panama Americas 40 9.4 NA No
Papua New Guinea Oceania 9.2 1.1 NA No
Paraguay Americas 51 7.1 NA No
Peru Americas 204 6.3 2.7 (2017)(57) Yes
Philippines Asia 425 3.9 NA No
Poland Europe 443 11.7 246 (2017)(42) Yes
Portugal Europe 170 16.6 70 (2017)(42) Yes
Qatar Asia 37 13.6 NA No
Republic of Korea Asia 818 15.8 292 (2017)(46) Yes

113Annex 3. Country E-waste Key Statistics
Country Region E-waste generated (kt) (2019)
E-waste generated (kg per capita) (2019)
E-waste documen-ted to be collected and recycled (kt)
National e-waste le-gislation/policy or regulation in place
Republic of Moldova Europe 14 4.0 NA Yes
Romania Europe 223 11.4 47 (2016)(42) Yes
Russian Federation Europe 1631 11.3 90 (2014)(58) No
Rwanda Africa 7.0 0.6 0.7 (2018)(59) Yes
Saint Kitts and Nevis Americas 0.7 12.4 NA No
Saint Lucia Americas 1.7 9.7 0.03 (2015)(60) No
Saint Vincent and the Gre-
nadines
Americas 0.9 8.3 NA No
Samoa Oceania 0.6 3.1 NA No
Sao Tome and Principe Africa 0.3 1.5 NA Yes
Saudi Arabia Asia 595 17.6 NA No
Senegal Africa 20 1.2 NA No
Serbia Europe 65 9.4 13 (2015)(61) Yes
Seychelles Africa 1.2 12.6 NA No
Sierra Leone Africa 4.2 0.5 NA No
Singapore Asia 113 19.9 NA Yes
Slovakia Europe 70 12.8 30 (2017)(42) Yes
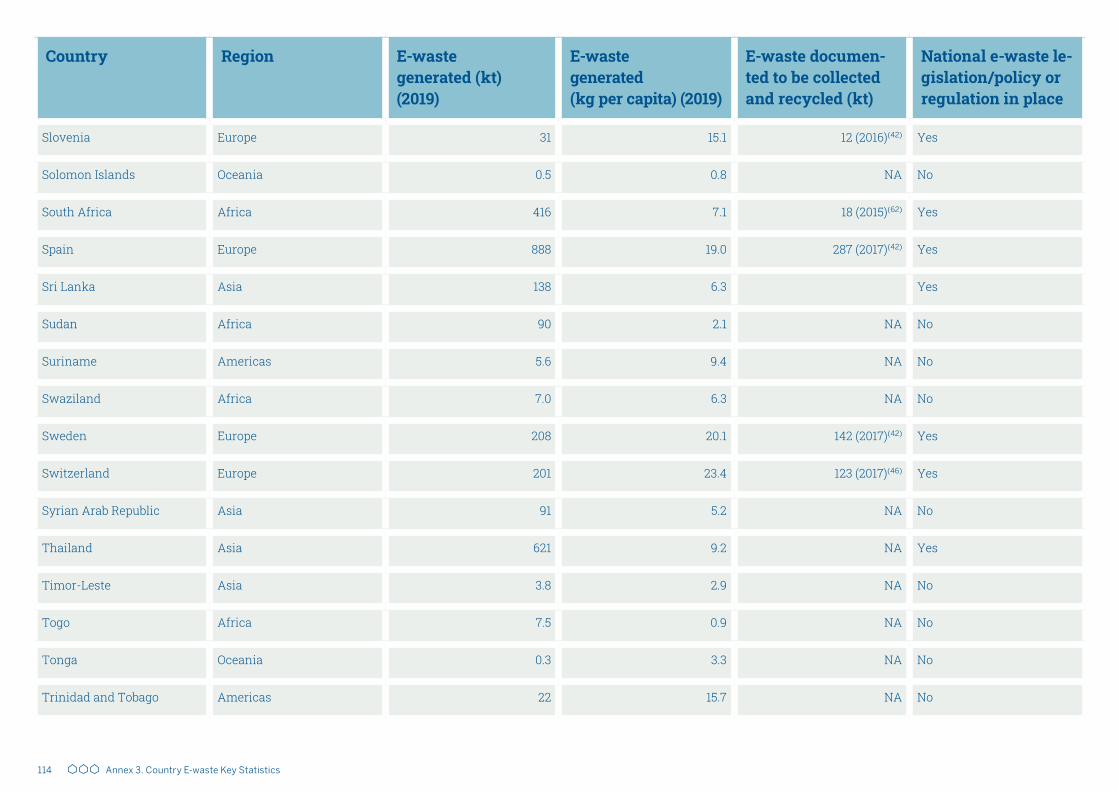
114 Annex 3. Country E-waste Key Statistics
Country Region E-waste generated (kt) (2019)
E-waste generated (kg per capita) (2019)
E-waste documen-ted to be collected and recycled (kt)
National e-waste le-gislation/policy or regulation in place
Slovenia Europe 31 15.1 12 (2016)(42) Yes
Solomon Islands Oceania 0.5 0.8 NA No
South Africa Africa 416 7.1 18 (2015)(62) Yes
Spain Europe 888 19.0 287 (2017)(42) Yes
Sri Lanka Asia 138 6.3 Yes
Sudan Africa 90 2.1 NA No
Suriname Americas 5.6 9.4 NA No
Swaziland Africa 7.0 6.3 NA No
Sweden Europe 208 20.1 142 (2017)(42) Yes
Switzerland Europe 201 23.4 123 (2017)(46) Yes
Syrian Arab Republic Asia 91 5.2 NA No
Thailand Asia 621 9.2 NA Yes
Timor-Leste Asia 3.8 2.9 NA No
Togo Africa 7.5 0.9 NA No
Tonga Oceania 0.3 3.3 NA No
Trinidad and Tobago Americas 22 15.7 NA No
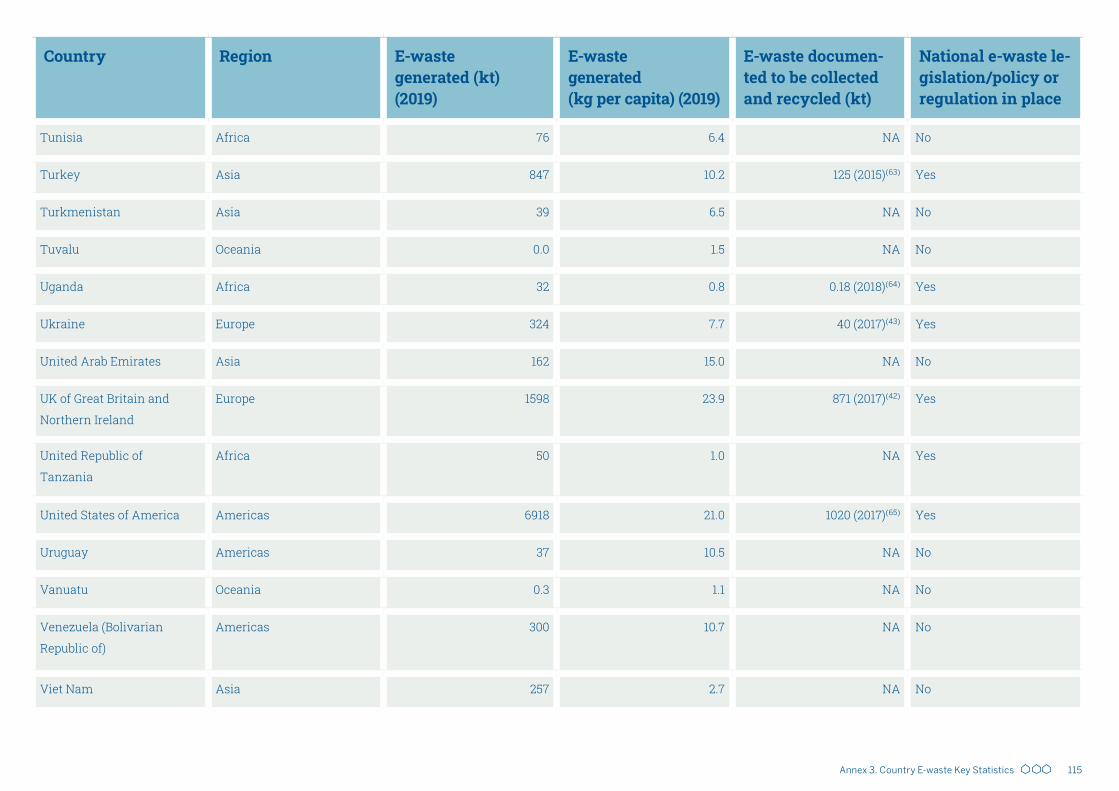
115Annex 3. Country E-waste Key Statistics
Country Region E-waste generated (kt) (2019)
E-waste generated (kg per capita) (2019)
E-waste documen-ted to be collected and recycled (kt)
National e-waste le-gislation/policy or regulation in place
Tunisia Africa 76 6.4 NA No
Turkey Asia 847 10.2 125 (2015)(63) Yes
Turkmenistan Asia 39 6.5 NA No
Tuvalu Oceania 0.0 1.5 NA No
Uganda Africa 32 0.8 0.18 (2018)(64) Yes
Ukraine Europe 324 7.7 40 (2017)(43) Yes
United Arab Emirates Asia 162 15.0 NA No
UK of Great Britain and
Northern Ireland
Europe 1598 23.9 871 (2017)(42) Yes
United Republic of
Tanzania
Africa 50 1.0 NA Yes
United States of America Americas 6918 21.0 1020 (2017)(65) Yes
Uruguay Americas 37 10.5 NA No
Vanuatu Oceania 0.3 1.1 NA No
Venezuela (Bolivarian
Republic of)
Americas 300 10.7 NA No
Viet Nam Asia 257 2.7 NA No

116 Annex 3. Country E-waste Key Statistics
Country Region E-waste generated (kt) (2019)
E-waste generated (kg per capita) (2019)
E-waste documen-ted to be collected and recycled (kt)
National e-waste le-gislation/policy or regulation in place
Yemen Asia 48 1.5 NA No
Zambia Africa 19 1.0 NA Yes
Zimbabwe Africa 17 1.1 0.03 (2017)(43) No
Total Questionnaires(66) 18.4 (~2015)(66)

117Annex 3. Country E-waste Key Statistics

118
The Global E-waste Monitor 2020Quantities, flows, and the circular economy potential

119
Chapter 1 What is EEE and E-waste?
Chapter 4 Measuring E-waste Statistics
Chapter 7 The potential of Circular Economy for E-waste
Chapter 2 Global E-waste Key Statistics
Chapter 3 How E-waste Data Contribute to the SDGs
Chapter 5 Worldwide Harmonisation by the Global E-waste Statistics Partnership
Chapter 8 E-waste Impact on the Health of Workers and Children
Chapter 6 Legislation on E-waste and the Issue of Transboundary Movement
Chapter 9 Regional E-waste Key Statistics

ISBN Digital: 978-92-808-9114-0