the global burnt area 2000 initiative gba-2000 mapping, from spot-vegetation s1 imagery, of the...
TRANSCRIPT

The Global Burnt Area 2000 initiative
GBA-2000
Mapping, from SPOT-VEGETATION S1 imagery, of the areas burnt globally during the year 2000
Final results
J-M. Grégoire & K. Tansey
with
E. Binaghi, L. Boschetti, P.A. Brivio, D. Ershov, S. Flasse, R. Fraser, D. Graetz, M. Maggi, P. Peduzzi, J.M.C. Pereira, J.M.N. Silva, A. Sousa and D. Stroppiana
March 2003

GBA-2000 Product definition
a binary map (burnt-unburnt)
monthly non-accumulative global burn scar map, at 1 km resolution
statistics of burnt areas
area burnt in 2000 per country, per month, and
per main types of vegetation cover
Global burned area estimates for each month of the year 2000
0
100,000
200,000
300,000
400,000
500,000
600,000
Jan
uar
y
Feb
ruar
y
Mar
ch
Ap
ril
May
Jun
e
July
Au
gu
st
Sep
tem
ber
Oct
ob
er
No
vem
ber
Dec
emb
er
Bu
rned
Are
a (k
m2)
% of total burned area per month in the year 2000
January13%
February4%
March3%
April7%
May6%
June9%
July10%
August9%
September10%
October7%
November7%
December15%
% of burned area in the year 2000 in six continents
16.0%
13.6%
1.1%
64.3%
3.2%
1.8%
Australasia
Asia incl. Russia
Europe
Africa
South America
North Americaincl. C. America
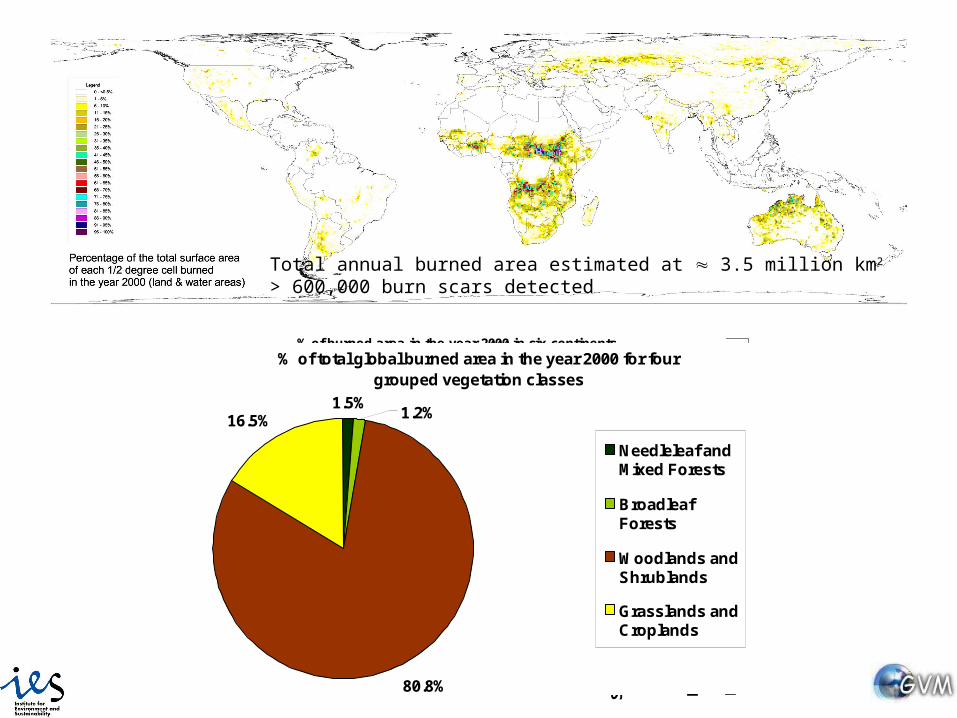
Total annual burned area estimated at 3.5 million km2
> 600,000 burn scars detected
% of total global burned area in the year 2000 for four grouped vegetation classes
1.5%
80.8%
16.5% 1.2%
Needleleaf andMixed Forests
BroadleafForests
Woodlands andShrublands
Grasslands andCroplands

Africa:Total annual burned area estimated at 2.6 million km2
> 300,000 burn scars detected
Seasonal distribution of burning activity in Africafor the Year 2000
Monthly estimates of burned areas in Africa for three grouped vegetation classes in the year 2000
0 100,000 200,000 300,000 400,000 500,000 600,000
January
February
March
April
May
June
July
August
September
October
November
December
Burned Area (km2)
Broadleaf Forests
Woodlands andShrublands
Grasslands andCroplands

More on GBA2000
Tansey K., 2002,Implementation of regional burnt area algorithms for the GBA2000 initiativePublications of the European Commission, EUR 20532, December 2002, pp. 159
Tansey K., J-M. Grégoire, I. Marengo, L. Boschetti, P.A. Brivio, D. Ershov, R. Fraser,M. Maggi, P. Peduzzi, J.M.C. Pereira, J.M.N. Silva and D. Stroppiana , 2002, A global mapof burnt vegetation at 1km resolution for the year 2000 derived from SPOT VGT dataQuantifying Terrestrial Carbon Sinks, Wengen, Switzerland, Sep. 25 - 27, 2002.Climatic Change, review phase, March 2003
Grégoire J-M., K. Tansey, and J.M.N. Silva, 2003, The GBA2000 initiative: Developinga global burned area database from SPOT-VEGETATION imageryInt. J. Remote Sensing, Volume 24, Number 6/March 20, 2003, 1369 - 1376.
Tansey K. et al., 2003,Vegetation burning in the year 2000: Global burned areaestimates from SPOT VEGETATION data, J. of Geophysical Research, special Issue onGlobal Trace Gaz Emissions from Biomass Burning, submitted, March 2003.
http://www.gvm.jrc.it/fire/gba2000/index.htm
http://www.grid.unep.ch/activities/earlywarning/preview/ims/gba/
Perspectives
A selection of GBA2000 algorithms
ESA initiativeglobal land products 1998-2003• fire products• FAPAR & LAI• .....