the global burden of cancer - international agency for ... · the global burden of cancer cancer is...
TRANSCRIPT

The global burden of cancer The global burden of cancer The global burden of cancer
Cancer is a major disease burden worldwide but there aremarked geographical variations in incidence overall and atspecific organ sites. Reliable estimation of the number of newcases (incidence) requires population-based cancer registra-tion. Compilation of worldwide age-standardized cancer ratesallows the identification of countries and regions where par-ticular tumour types are most common. Such differences usu-ally reflect exposure to distinct causative environmental fac-tors. In addition to providing data on the distribution of neo-plastic disease, descriptive epidemiology provides the basisfor prevention, health service planning and resource alloca-tion.
111
011 A 019 WORLD CANCER 17/06/03 15:08 Page 1

Cancer afflicts all communities.Worldwide, the burden of diseaseimpinges on the lives of tens of millionsannually. Based on the most recent inci-dence and mortality data available, therewere 10.1 million new cases, 6.2 milliondeaths and 22.4 million persons livingwith cancer in the year 2000 [1]. Thisrepresents an increase of around 19% inincidence and 18% in mortality since1990.
Cancer involves a pathological break-down in the processes which control cellproliferation, differentiation and death ofparticular cells. Most commonly, themalignant cells which form a tumourarise from epithelial tissue (i.e. tissuewhich has a secretory or lining function)and are termed “carcinoma”. In manyorgans (breast, lung, bowel, etc.), mostcancers are carcinomas. While havingcertain characteristics in common, dif-ferent types of cancer have very differentcauses and show widely differingresponse to treatment. The biologicalbasis of malignant transformation, theinfluence of environmental factors andoptions for prevention, screening andtreatment are addressed in this Report.This chapter delineates the burden ofcancer in numerical terms by referenceto incidence, mortality and prevalence(Box: Terms used in cancer epidemiolo-gy, p18) on the basis of data generatedthrough cancer registries and vital statis-tics systems (death registration).
The major cancer typesIn terms of incidence, the most commoncancers worldwide (excluding non-mela-noma skin cancers) (Fig. 1.2) are lung(12.3% of all cancers), breast (10.4%) andcolorectum (9.4%). For any disease, therelationship of incidence to mortality is anindication of prognosis, similar incidenceand mortality rates being indicative of anessentially fatal condition. Thus, lung can-cer is the largest single cause of deathsfrom cancer in the world (1.1 million annu-ally), since it is almost invariably associat-ed with poor prognosis. On the otherhand, appropriate intervention is ofteneffective in avoiding a fatal outcome fol-lowing diagnosis of breast cancer. Hencethis particular cancer, which ranks secondin terms of incidence, is not among thetop three causes of death from cancer,which are respectively cancers of the lung(17.8% of all cancer deaths), stomach(10.4%) and liver (8.8%).The most conspicuous feature of the dis-tribution of cancer between the sexes is
THE GLOBAL BURDEN OF CANCER
SUMMARY
> Worldwide, approximately 10 millionpeople are diagnosed with cancer annu-ally and more than 6 million die of thedisease every year; currently, over 22 million people in the world are cancerpatients.
> All communities are burdened with can-cer, but there are marked regional differences. The total cancer burden ishighest in affluent societies, mainly dueto a high incidence of tumours associat-ed with smoking and Western lifestyle,i.e. tumours of the lung, colorectum,breast and prostate.
> In developing countries, up to 25% oftumours are associated with chronicinfections, e.g. hepatitis B virus (livercancer), human papillomaviruses (cervi-cal cancer), and Helicobacter pylori(stomach cancer).
> Differences in the regional distributionof cancer and its outcome, as docu-mented by a worldwide network of pop-ulation-based cancer registries, help toidentify causative factors and thoseinfluencing survival.
> In some Western countries, cancer mor-tality rates have recently started todecline, due to a reduction in smokingprevalence, improved early detectionand advances in cancer therapy.
Fig. 1.1 Mortality rates in men for all cancer sites combined, excluding non-melanoma skin cancer. Thehighest rates are recorded in affluent countries.
< 272.3< 165.1< 133.3< 112.2< 85.8
Age-standardized rate /100,000 population
12 The global burden of cancer
011 A 019 WORLD CANCER 17/06/03 15:08 Page 2

13
the male predominance of lung cancer(Fig. 1.2). Stomach, oesophageal andbladder cancer are also much more com-mon in males. For the most part, differ-ences in distribution between the sexesare attributable to differences in exposureto causative agents rather than to varia-tions in susceptibility. For other tumourtypes, including cancers of the colorec-tum and pancreas, there is little differencein the sex distribution. Generally speaking,the relationship of incidence to mortalityis not affected by sex. Thus, for example,the prognosis following diagnosis of liveror pancreatic cancer is dismal for bothmales and females. Many other tumourtypes are more responsive to therapy, sothat cancers of breast, prostate and uter-
ine cervix, for example, are the cause ofdeath in only a minority of patients diag-nosed. The burden of cancer is distributedunequally between the developing anddeveloped world, with particular cancertypes exhibiting different patterns of dis-tribution (Fig. 1.7). All of Europe, Japan,Australia, New Zealand and North Americaare classified here as more developedregions, whilst Africa, Latin America andthe Caribbean, Asia (excluding Japan),Micronesia, Polynesia and Melanesia areclassified as developing or less developedregions.As discussed in later chapters, many dif-ferences in the distribution of cancerbetween regions are explicable with refer-
ence to etiological factors. For example,populations in developing countries arevulnerable to cancers in which infectiousagents (and associated non-malignant dis-eases) play a significant role [2] (Chronicinfections, p56). These include cancers ofthe stomach, uterine cervix, liver and pos-sibly oesophagus. Conversely, there areother cancers – exemplified by cancers ofthe colorectum and prostate – where theburden of disease falls disproportionatelyon the developed world. These observa-tions seem to be largely attributable to dif-ferences in lifestyle, with dietary factorsbelieved to be of major significance.
Monitoring The extent of variation in the impact ofcancer between different regions of theworld has been studied for more than 50years. Data permitting such comparisonscome from cancer registries and fromlocal and national health statistics, withrespect to deaths from cancer. The com-pleteness and accuracy of data accumu-lated by cancer registries has progressive-ly increased, as has the proportion of the
Fig. 1.2 Incidence and mortality of the most common cancers worldwide.
Fig. 1.3 In some regions, waters are the source ofchronic Schistosoma haematobium infectionwhich may cause bladder cancer.
The global burden of cancer
011 A 019 WORLD CANCER 17/06/03 15:08 Page 3
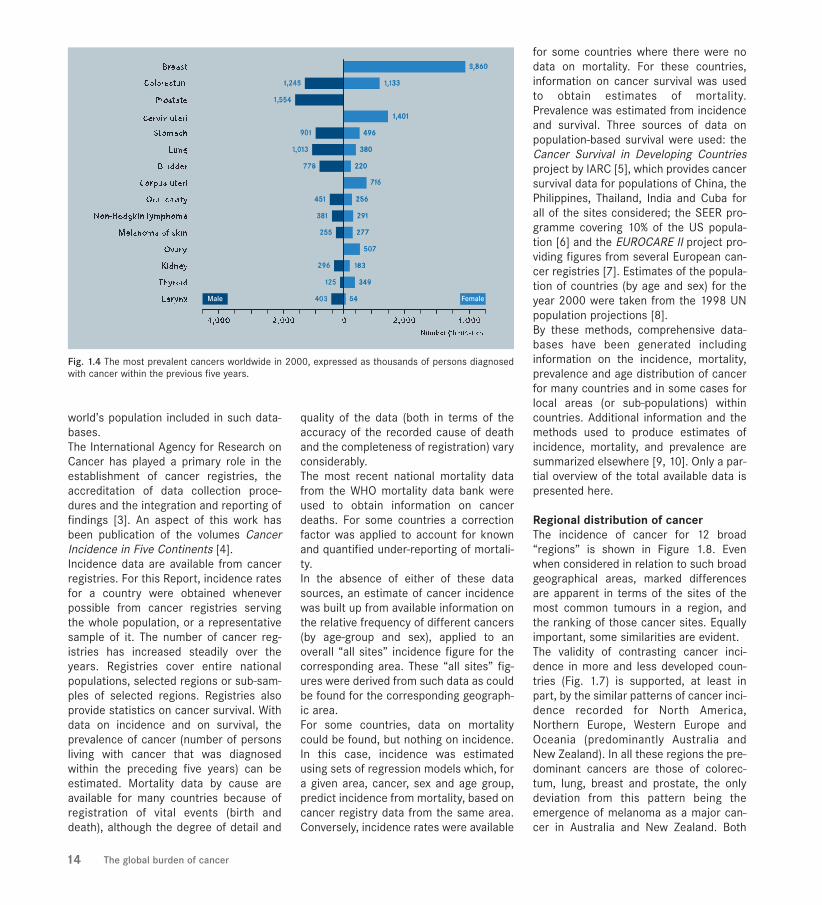
world’s population included in such data-bases. The International Agency for Research onCancer has played a primary role in theestablishment of cancer registries, theaccreditation of data collection proce-dures and the integration and reporting offindings [3]. An aspect of this work hasbeen publication of the volumes CancerIncidence in Five Continents [4].Incidence data are available from cancerregistries. For this Report, incidence ratesfor a country were obtained wheneverpossible from cancer registries servingthe whole population, or a representativesample of it. The number of cancer reg-istries has increased steadily over theyears. Registries cover entire nationalpopulations, selected regions or sub-sam-ples of selected regions. Registries alsoprovide statistics on cancer survival. Withdata on incidence and on survival, theprevalence of cancer (number of personsliving with cancer that was diagnosedwithin the preceding five years) can beestimated. Mortality data by cause areavailable for many countries because ofregistration of vital events (birth anddeath), although the degree of detail and
quality of the data (both in terms of theaccuracy of the recorded cause of deathand the completeness of registration) varyconsiderably. The most recent national mortality datafrom the WHO mortality data bank wereused to obtain information on cancerdeaths. For some countries a correctionfactor was applied to account for knownand quantified under-reporting of mortali-ty. In the absence of either of these datasources, an estimate of cancer incidencewas built up from available information onthe relative frequency of different cancers(by age-group and sex), applied to anoverall “all sites” incidence figure for thecorresponding area. These “all sites” fig-ures were derived from such data as couldbe found for the corresponding geograph-ic area.For some countries, data on mortalitycould be found, but nothing on incidence.In this case, incidence was estimatedusing sets of regression models which, fora given area, cancer, sex and age group,predict incidence from mortality, based oncancer registry data from the same area.Conversely, incidence rates were available
for some countries where there were nodata on mortality. For these countries,information on cancer survival was usedto obtain estimates of mortality.Prevalence was estimated from incidenceand survival. Three sources of data onpopulation-based survival were used: theCancer Survival in Developing Countriesproject by IARC [5], which provides cancersurvival data for populations of China, thePhilippines, Thailand, India and Cuba forall of the sites considered; the SEER pro-gramme covering 10% of the US popula-tion [6] and the EUROCARE II project pro-viding figures from several European can-cer registries [7]. Estimates of the popula-tion of countries (by age and sex) for theyear 2000 were taken from the 1998 UNpopulation projections [8]. By these methods, comprehensive data-bases have been generated includinginformation on the incidence, mortality,prevalence and age distribution of cancerfor many countries and in some cases forlocal areas (or sub-populations) withincountries. Additional information and themethods used to produce estimates ofincidence, mortality, and prevalence aresummarized elsewhere [9, 10]. Only a par-tial overview of the total available data ispresented here.
Regional distribution of cancerThe incidence of cancer for 12 broad“regions” is shown in Figure 1.8. Evenwhen considered in relation to such broadgeographical areas, marked differencesare apparent in terms of the sites of themost common tumours in a region, andthe ranking of those cancer sites. Equallyimportant, some similarities are evident.The validity of contrasting cancer inci-dence in more and less developed coun-tries (Fig. 1.7) is supported, at least inpart, by the similar patterns of cancer inci-dence recorded for North America,Northern Europe, Western Europe andOceania (predominantly Australia andNew Zealand). In all these regions the pre-dominant cancers are those of colorec-tum, lung, breast and prostate, the onlydeviation from this pattern being theemergence of melanoma as a major can-cer in Australia and New Zealand. Both
Fig. 1.4 The most prevalent cancers worldwide in 2000, expressed as thousands of persons diagnosedwith cancer within the previous five years.
14 The global burden of cancer
011 A 019 WORLD CANCER 17/06/03 15:08 Page 4

Central and Southern Europe differ mar-ginally from this pattern as a result of therelatively high incidence of stomach can-cer. Bladder cancer occupies the fifth orsixth position in all these regions (exceptOceania).East Asia, which includes Japan andregions of China, comprises nations andcommunities divided between the “moredeveloped” and “less developed” cate-gories. Accordingly, the distribution ofcancer is evocative of that in more devel-oped regions with regard to lung, colorec-tal and breast cancer, but different insofaras cancers of the stomach, oesophagusand liver are of major concern. In the lessdeveloped world, there is no single group-ing of cancers constituting a clear pattern;rather particular patterns are specific tobroad regions. Breast cancer is of importance to commu-nities in both more and less developedcountries. In contrast, cervical cancer is aparticularly serious problem for much ofthe developing world including SouthCentral Asia, sub-Saharan Africa andSouth America. Otherwise, there are can-cers that are of singular significance tocertain regions. Thus cancer of the oral
cavity ranks high in South Central Asia,liver cancer is of particular relevance tosub-Saharan Africa and parts of Asia,while bladder cancer is a major problemfor Northern Africa and Western Asia.
Possibilities for cancer prevention andtreatmentAs previously indicated, the overview ofcancer in the world presented here repre-sents a superficial examination of thecomprehensive data that are availableconcerning the distribution of cancer.Despite the limitations of the presentassessment, certain principles are clearlyevident. The burden of cancer in the worldvaries according to the community. Theextent of variation when subcontinentalregions are compared is equally apparentat a national level and may be clear evenat the local district level. As this Reportdescribes, variation in cancer incidence isprimarily explicable in terms of, andindicative of, the influence of particularrisk factors. Many established risk factorsoperate as causes of disease, for whichthe relevant biological mechanisms arebeing progressively clarified. For the mostpart, understanding the causes of cancer
provides an opportunity for cancer pre-vention or early detection. This transition
Fig. 1.7 Comparison of the most common cancers in more and less developed countries in 2000. NHL = Non-Hodgkin lymphoma.
Fig. 1.5 Traffic emissions and other sources ofatmospheric, soil and water pollution may accountfor as many as 4% of all cancers.
Fig. 1.6 A young mother from Senegal holding herson wearing a sweatshirt with cigarette industry logo.
The global burden of cancer 15
011 A 019 WORLD CANCER 17/06/03 15:08 Page 5
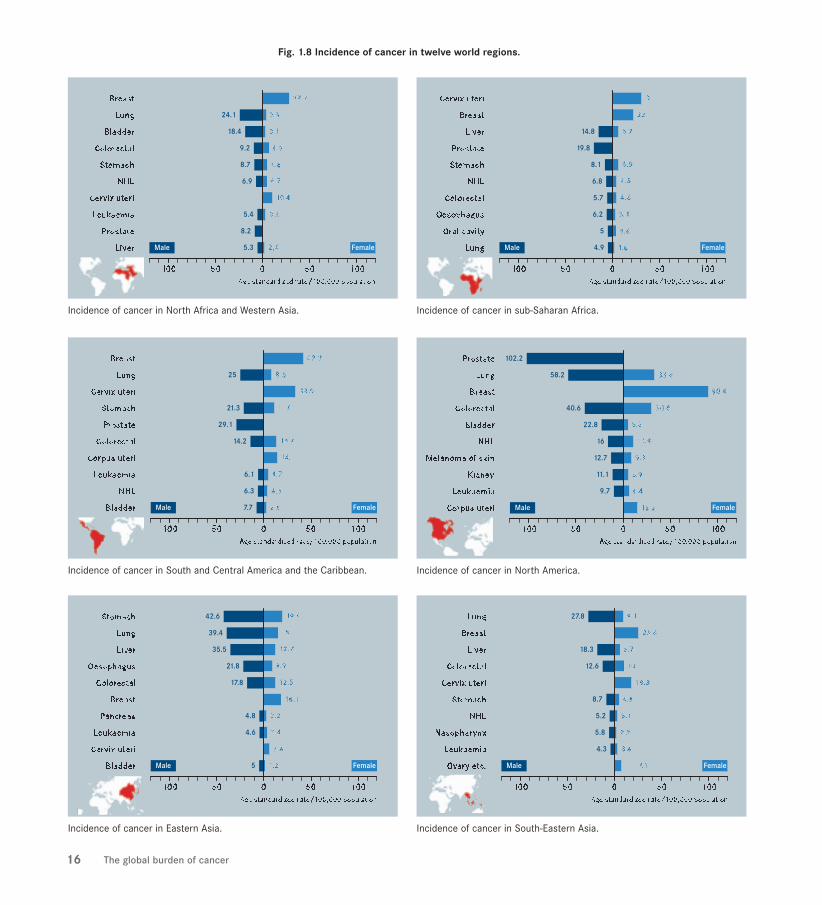
Incidence of cancer in Eastern Asia.
Incidence of cancer in South and Central America and the Caribbean.
Incidence of cancer in North Africa and Western Asia.
Incidence of cancer in North America.
Incidence of cancer in South-Eastern Asia.
Incidence of cancer in sub-Saharan Africa.
Fig. 1.8 Incidence of cancer in twelve world regions.
16 The global burden of cancer
011 A 019 WORLD CANCER 17/06/03 15:08 Page 6

Incidence of cancer in Eastern Europe.
Incidence of cancer in Northern Europe.
Incidence of cancer in Oceania.
Incidence of cancer in Southern Europe.
Incidence of cancer in South Central Asia.
Incidence of cancer in Western Europe.
Fig. 1.8 Incidence of cancer in twelve world regions (continued).
The global burden of cancer 17
011 A 019 WORLD CANCER 17/06/03 15:08 Page 7

There are several statistics that may beused to measure the burden of cancer in agiven community. The following discus-sion is presented specifically in relationto cancer, though in most instances theterms discussed have general application.
Incidence is the number of new caseswhich occur. It can be expressed as anabsolute number of cases per year or as arate per 100,000 persons per year. Thelatter provides an approximation of theaverage risk of developing a cancer, whichis useful in making comparisons betweenpopulations (countries, ethnic groups, ordifferent time periods within a country forexample).
Mortality is the number of deaths occur-ring, and the mortality rate is the numberof deaths per 100,000 persons per year.The number of deaths provides one meas-ure of the outcome, or impact, of cancer.It represents the product of the incidenceand the fatality of a given cancer."Fatality", the inverse of survival, is theproportion of cancer patients who die.Mortality rates therefore measure theaverage risk to the population of dyingfrom a specific cancer, while fatality (1minus survival) represents the probabilitythat an individual diagnosed with cancerwill die from it.
Rate Incidence, mortality and other datamay be presented as rates, most often inrelation to populations of 100,000.
Age-standardized rates (ASR) take intoaccount differences in the age structureof the populations being compared. Thisis necessary because the risk of cancer isvery powerfully determined by age; a pop-ulation containing a high proportion of oldpeople will generally have a higher inci-
dence of cancer than one in which youngpeople predominate. Standardization is aset of techniques used to remove theeffects of differences in age when compar-ing two or more rates. Thus, standardiza-tion may be undertaken to allow compari-son on the basis of populations having thesame age structure for which a “worldstandard population” is commonly used.
Prevalence of cancer indicates the numberof persons in whom the disease has beendiagnosed and who are alive at a particularpoint in time. Thus prevalence may be char-acterized as the number of people livingwith cancer, although a precise meaning ofthis term is not agreed. Some authorsunderstand “living with cancer” to refer toever having been diagnosed, even if thiswas many years ago, and the disease nolonger has any impact on the individual.The latter circumstances may be equatedwith cure. Probably what is sought fromprevalence in most instances is the numberof people being treated for cancer (or, atleast, still needing some sort of medicalsupervision). Such data are not only diffi-cult to obtain, but would certainly varyfrom one place to another, depending onmedical practice. However, since cure isoften but arbitrarily taken to equate withsurvival beyond five years, a useful com-promise is to estimate prevalence as thenumber of people alive who have had acancer diagnosed within the last five years.
Several other measures are used to assessthe impact of disease, and that of cancerspecifically. These include person-years oflife lost (how many years of normal lifespan are lost due to deaths from cancer).Economists often refine this measurement,by giving different values to life-years at dif-ferent ages, so that a year saved at, forexample, age 20, is more “valuable” thanone at age 60. A further refinement is tocalculate quality- or disability-adjusted life-years lost (DALY), by giving a numericalscore to the years lived with a reduced
quality of life between diagnosis anddeath (where quality = 0) or cure (quality= 1). Such estimates require comprehen-sive data on incidence and survival aswell as approximations about quality oflife in different circumstances and cul-tures.
TERMS USED IN CANCER EPIDEMIOLOGY
Fig. 1.10 A cancer registration team in Ho Chi MinhCity, Viet Nam.
18 The global burden of cancer
Fig. 1.9 The Globocan 2000 database is publishedas a CD by IARCPress.
011 A 019 WORLD CANCER 17/06/03 15:08 Page 8
from documentation of disease to a basisfor action may also be pursued in relationto treatment. Thus incidence, mortalityand other data offer insight into prognosisand efficacy of treatment for particularcancer types.
The distribution of cancer changes withtime, and specific assessments generallyrelate to a particular period. Irrespectiveof change in distribution, the burden ofcancer remains. This burden involves thedisruption, by suffering, of the lives of
hundreds of millions of the world’s popu-lation. As will be indicated throughout thisvolume, that burden may be progressivelylessened by appropriate intervention.
1. Ferlay J, Bray F, Parkin DM, Pisani P, eds (2001)Globocan 2000: Cancer Incidence and Mortality Worldwide (IARC Cancer Bases No. 5), Lyon, IARCPress.
2. Parkin DM, Pisani P, Muñoz N, Ferlay J (1998) The glob-al health burden of infection. In: Weiss RA, Beral,V, Newton,R eds, Infections and Human Cancer (Vol. 33, CancerSurveys), Cold Spring Harbor, Cold Spring HarborLaboratory Press.
3. Parkin DM, Hakulinen T (1991) Analysis of survival. In:Jensen OM, Parkin DM, MacLennan R, Muir C, Skeet RGeds, Cancer Registration, Principles and Methods (IARCScientific Publications No. 95), Lyon, IARCPress, 159-176.
4. Parkin DM, Whelan SL, Ferlay J, Raymond L , Young J,eds (1997) Cancer Incidence in Five Continents, Vol. VII(IARC Scientific Publications No. 143 and IARCCancerbase No. 2), Lyon, IARCPress.
5. Sankaranarayanan R, Black RJ, Parkin DM, eds (1998)Cancer Survival in Developing Countries (IARC ScientificPublications, No. 145), Lyon, IARCPress.
6. SEER (1997) SEER Cancer Statistics Review 1973-1994 (NIH Publication No. 92-2789), Bethesda, MD, USA,US Dept. of Health and Human Services, NCI.
7. Berrino F, Sant M, Verdecchia A, Capocaccia R,Hakulinen T, Esteve J, eds (1995) Survival of CancerPatients in Europe: the Eurocare Study (IARC ScientificPublications, No. 132), Lyon, IARCPress.
8. United Nations (1998) World Population Prospects: the1998 Revision, New York, United Nations.
9. Parkin DM, Bray F, Ferlay J, Pisani P (2001) Estimatingthe world cancer burden: Globocan 2000. Int J Cancer, 94:153-156.
10. Pisani P, Parkin DM, Bray F, Ferlay J (1999) Estimates ofthe worldwide mortality from 25 cancers in 1990. Int JCancer, 83: 18-29.
REFERENCESIARC cancer epidemiology databases, including GLOBOCAN 2000 and the WHO Cancer Mortality Database:http://www-dep.iarc.fr/
ICD9 classification of diseases: http://www.cdc.gov/nchs/about/major/dvs/icd9des.htm
WEBSITES
The global burden of cancer 19
011 A 019 WORLD CANCER 27/06/03 12:02 Page 9