the ghost of a visit from christmas past -...
TRANSCRIPT

A Visit From the Ghost of Christmas PastWHAT THE WORLD WOULD HAVE LOOKED LIKE WITHOUT THE GSEs

Hank Paulson statement during Financial Crisis Inquire Committee (FCIC) interview –
“Fannie and Freddie were ‘the only game in town’ once the housing market dried up in the Summer of 2007. And by the Spring of 2008, ‘the (GSEs) more than anyone, were the engine we needed to get through the problem.”
Christmas Past
©2016 PERINI CAPITAL | 2
It could have been a lot worse.
©2016 PERINI CAPITAL | 3
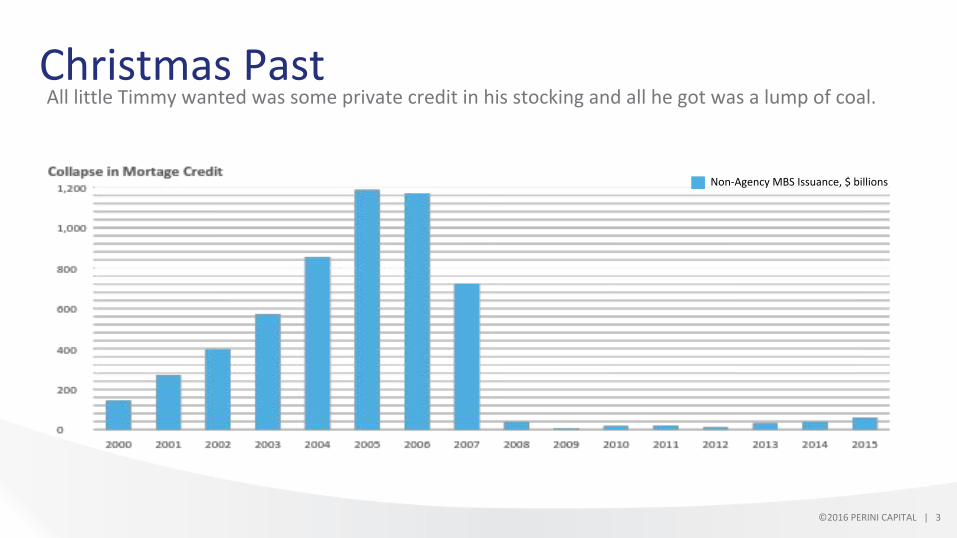
Christmas Past All little Timmy wanted was some private credit in his stocking and all he got was a lump of coal.
Non-Agency MBS Issuance, $ billions

©2016 PERINI CAPITAL | 4
Christmas Past And the marginal provider of mortgage credit was???
Non-Agency MBS
Banks
GSAA 2005-1
GSEs
*Source: Moody’s Analytics “Resurrection of RMBS”

©2016 PERINI CAPITAL | 5
Christmas Past What Non-Agency MBS pricing tells us about the cost of mortgage credit during the financial crisis: Mortgage credit risk anyone??? Anyone???
Capital Structure of GSAA 2005-1 IDC Price as of Dec 2007
IDC Price as of Dec 2008
IDC Price as of Dec 2009
IDC Price as of Dec 2010
IDC Price as of Dec 2011
IDC Price as of Dec 2012
IDC Price as of Dec 2013
AV1 – Senior Bond Paid Off Paid Off Paid Off Paid Off Paid Off Paid Off Paid Off AV2 – Senior Bond Paid Off Paid Off Paid Off Paid Off Paid Off Paid Off Paid Off AF2 – Senior Bond 99.31 90.78 94.59 100.84 Paid Off Paid Off Paid Off AF3 – Senior Bond 98.97 65.28 78.59 86.88 99.47 100.00 Paid Off AF4 – Senior Bond 97.22 95.91 75.41 86.91 94.28 96.38 104.31
AF5 – Senior Bond 99.50 78.59 77.31 94.31 99.03 100.13 101.72
M1 – Subordinate Bond 94.91 32.84 32.13 46.56 58.09 92.00 101.41
M2 – Subordinate Bond 87.22 15.47 23.72 40.25 46.38 61.28 85.66
B1 – Subordinate Bond 97.19 11.81 17.81 33.94 35.47 40.91 78.22
B2 – Subordinate Bond 81.06 10.56 9.31 25.38 28.66 24.00 31.50
B3 – Subordinate Bond 91.44 8.75 6.59 26.03 15.22 6.72 5.56
Market Value of Mortgages 95.63 74.16 68.30 76.99 81.32 84.89 93.39
Implied Cost of Mortgage Credit 6.75% 9.17% 11.12% 9.03% 7.85% 7.06% 6.20%

©2016 PERINI CAPITAL | 6
Christmas Past That ghost is pretty scary.
Implied Mortgage Rate for 667 FICO (based on secondary market Non-Agency MBS pricing)
GSE Rate

©2016 PERINI CAPITAL | 7
Christmas Past Countercyclical: Moving in the opposite direction of the overall economic cycle; rising when the economy is weakening, and falling when the economy is strengthening.
Subsidy provided by GSEs (based on secondary market Non-Agency MBS pricing)
©2016 PERINI CAPITAL | 8
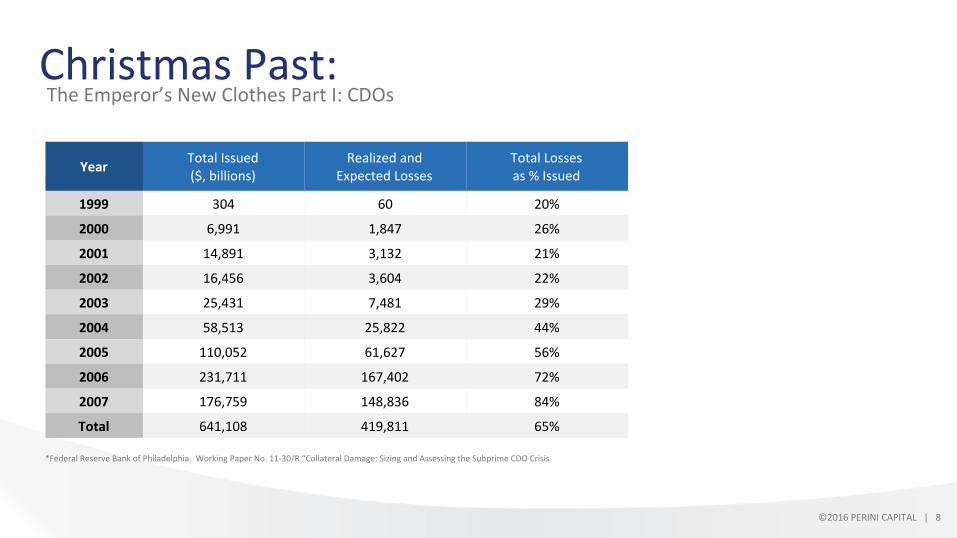
Christmas Past: The Emperor’s New Clothes Part I: CDOs
Year Total Issued ($, billions)
Realized and Expected Losses
Total Losses as % Issued
1999 304 60 20%
2000 6,991 1,847 26%
2001 14,891 3,132 21%
2002 16,456 3,604 22%
2003 25,431 7,481 29%
2004 58,513 25,822 44%
2005 110,052 61,627 56%
2006 231,711 167,402 72%
2007 176,759 148,836 84%
Total 641,108 419,811 65%
*Federal Reserve Bank of Philadelphia. Working Paper No. 11-30/R “Collateral Damage: Sizing and Assessing the Subprime CDO Crisis

©2016 PERINI CAPITAL | 9
Christmas Past The Emperor’s New Clothes Part I: CDOs
Rating Stated CreditEnhancement
Actual Credit Enhancement
AAA 36.00% 4.50%
AAA 19.00% 4.29%
AA 12.85% 4.21%
A 10.24% 4.18%
BBB 4.00% 4.10%
Equity 0.00% 4.05%
• Collateral of a CDO: CMLTI 2006-NC2 M9 had 4.05% credit support 1.25% thickness.
• The only source of additional credit support available to the CDO investors was from tranching (slicing) the credit thickness of the M9 which was 1.25%.
• The AAA “Super Senior” investor was told by the Rating Agencies they had 36% credit support when in reality they had the credit support of the M9, 4.05%, plus 36% of 1.25% or 0.45% for a whopping grand total of 4.50%

©2016 PERINI CAPITAL | 10
Christmas Past The Emperor’s New Clothes Part I: CDOs
Distribution of write-downs by original Rating
Issue Year Senior AAA Junior AAA AA A BBB BB and B Not Rated
1999-2000 4% 10% 88% 66% 93% 67% 82%
2001 6% 9% 64% 11% 74% 81% 91%
2002 13% 20% 64% 65% 78% 91% 78%
2003 16% 44% 61% 63% 64% 93% 93%
2004 26% 71% 84% 95% 84% 99% 97%
2005 44% 83% 94% 94% 93% 97% 99%
2006 67% 94% 99% 97% 96% 97% 99%
2007 76% 93% 98% 99% 98% 96% 99%
NOTE: This table summarizes the distribution of tranche write-downs by original rating/seniority and issue year. Sourced: Intex, Bloomberg, RBS (2011).*Federal Reserve Bank of Philadelphia. Working Paper No. 11-30/R “Collateral Damage: Sizing and Assessing the Subprime CDO Crisis

©2016 PERINI CAPITAL | 11
Christmas Past Worse than the “naughty list” is the “forced deleveraging list”.
1 Calculated as total assets divided by equity.
U.S. Broker Dealer Leverage: Shin, BIS “The bank/capital markets nexus goes global”.
G Gorton and A Metrick, “Securitized banking and the run on the repo”, Journal of Financial Economics, vol 104, no 3, June 2012. The repo-haircut index is the equally-weighted average haircut for all nine asset classes: BB+/A Corporates, AA-AAA Corporates, A-AAA ABS Auto, AA-AAA ABS-RMBS/CMBS, AA ABS-RMBS/CMBS, Unpriced ABS/MBS/All Sup-Prime, AA-AAA CLO, AA-AAA CDO, Unpriced CLO/CDO
1/07 5/07 9/07 1/08 5/08 9/08 1/0996 01 06 11 16
Ratio

©2016 PERINI CAPITAL | 12
Christmas Past Government sponsored execution vs. government sponsored enterprises.
Company Amount borrowed under authority of Section 13(3) of the Federal Reserve Act or from PSPA (GSE bailout)
Amount paid back
Amount still outstanding
Weighted average interest rate
Equity give-up or warrants required to access lending facility
Beginning of lending or “assistance”
Ending of lending or “assistance”
Goldman, Sach & Co. $589 billion $589 billion $0 2.12% None March 2008 February 2010
Morgan Stanley & Co. $1.912 trillion $1.912 trillion $0 0.75% None March 2008 February 2010
Citigroup Incorporated $2.020 trillion $2.020 trillion $0 1.02% None March 2008 February 2010
Fannie Mae $116 billion $147 billion $116 billion 10.00% 79% September 2008 Ongoing
Freddie Mac $72 billion $98 billion $72 billion 10.00% 79% September 2008 Ongoing

©2016 PERINI CAPITAL | 13
Credit Risk Transfers: FHFA August 2015: “Overview of Fannie Mae and Freddie Mac Credit Risk Transfer Transactions”
Christmas Present
Credit risk transferred is the percentage defined as the difference between the attach and detach points. For example, if the attach point is one percent (100 basis points), the Enterprise is responsible for credit losses up to one percent of the UPB of the loan pool. If the detach point is three percent, the Enterprise is responsible for credit losses above three percent of the UPB of the loan pool.

©2016 PERINI CAPITAL | 14
Christmas Present CRT 2014-CO3 2M2: Attach 65bps / Detach 375bps: Credit Risk Transferred: 375-65=3.10bps
% o
f Dea
l Bal
ance
Months Since Issuance
1 11 21 31 41 51 61 71 81 91 101 111 121
Credit Risk Retained by GSEs(detachment point)
Credit Risk Transferred(detachment point minusattachment point)
Credit Risk Retained by GSEs(attachment point)
GSE: GSEs responsible for credit losses
CRT: Investors in CRT responsible for credit losses
GSE: GSEs responsible for credit losses
CRT
GSE
GSE
3.75%
3.10%
0.65%

©2016 PERINI CAPITAL | 15
Christmas Present The Emperor’s New Clothes Part 2: CRT Someone is not sharing!INTEX’s projected attachment and detachment points.
Perc
ent o
f Dea
l
Loan Age
1 11 21 31 41 51 61 71 81 91 101 111 121
Credit Risk Retained by GSEs(detachment point)
Credit Risk Transferred(detachment point minusattachment point)
Credit Risk Retained by GSEs(attachment point)
GSE
GSE
3.75%
3.10%
0.65%
2.47%
1.30%
3.79%
CRT
©2016 PERINI CAPITAL | 16
One of two things:New Worth Sweep
1) Lawless Act: Largest exportation of private property in US History
2) Massive Incompetence: Death spiral argument in court
CONCLUSION: Anyone associated with the Net Worth Sweep at Treasury, FHFA or within the Obama Administration should not be involved in the housing reform debate because they have exhibited one of two things: A) complete disregard for the rule of law or B) massive incompetence.

Happy Holidays
PERINI CAPITAL, LLC1504 West Riverside Drive
Carlsbad, NM 88220
Contact: Michael [email protected]
575-725-1978