the george b. thomas sr. learning academy, inc....2019/04/09 · the george b. thomas sr. learning...
TRANSCRIPT

The George B. Thomas Sr. Learning Academy, Inc.
Montgomery County Board of Education
April 9, 2019

History of Saturday School
• Mu Nu Chapter of Omega Psi Phi Fraternity
o 1985–1986 school year, Housing Opportunities
Commission (HOC) Center in Olney, MD
o 21 children; 19 volunteers
• 1994, Sherwood High School
• By 2005, expanded to 12 centers in impact areas
o Montgomery County Public Schools Strategic
Plan—Our Call to Action: Pursuit of Excellence
2

Current locations
• 2017, Most recent opening, Clarksburg High School
• Northeast Consortium:
o 2000, Paint Branch High School; 1996, Springbrook High School
• Downcounty Consortium:
o 2004, Albert Einstein High School; 2002, Montgomery Blair High School; 2002, Wheaton High School; 2001, John F. Kennedy High School
• Upcounty:
o 2005, Col. Zadok Magruder High School; 2005, Rockville High School; 2004, Watkins Mill High School; 2002, Gaithersburg High School; 2002, Northwest High School
3

Saturday School – 2,655 enrolled
Programs for students
• Aristotle Circle
• Young Scholars Program
• ACES Tutoring – Montgomery College
• Rising Star Pre-K
• SAT/ACT Prep
• Java Programming
• BRIDGE Projects/Credit Recovery
4

Saturday School
Other Programs and Partnerships
• Parent Training Workshops presented by the Office of Student and Family Support and Engagement
• Adult ESOL Classes funded by Montgomery Coalition for Adult English Literacy
•High Achieving Scholarship Awards - $12,000 each year
5

Saturday School
Revenue based programs
• STEM Curiosity Academy
• CODING
• Scholarships available for both programs
6

Saturday School: Racial/Ethnic Groups Served
12.4%
42.7%
8.0%
33.4%
3.2%
16.8%
42.3%
8.5%
27.9%
4.3%
15.6%
44.4%
7.7%
28.3%
3.7%
0.0%
10.0%
20.0%
30.0%
40.0%
50.0%
60.0%
70.0%
80.0%
90.0%
100.0%
Asian African American or Black White Hispanic/Latino Two or More Races
2017 2018 2019
7

Saturday School: Service Groups Served
33.3%
54.6%
13.1%
29.4%
46.5%
13.9%
31.3%
50.4%
12.3%
0.0%
10.0%
20.0%
30.0%
40.0%
50.0%
60.0%
70.0%
80.0%
90.0%
100.0%
Limited English Proficient FARMS Special Ed
2017 2018 2019
8

Research Study
The Office of Shared Accountability, Applied Research Unit, conducted an examination of the impact of the Saturday School program was examined for participants with high attendance compared to a matched group of non-participating. Four questions were examined:
• What are the demographic characteristics?• What percentage of participants had high attendance?• To what extent did Saturday School participants meet Evidence of Learning Outcomes in literacy and math?
• Is there a difference between Saturday School and non-Saturday School participants with comparable demographics and academic achievement?
9

Research Study FindingsMAP-R MAP-M PARCC ELA PARCC Math MPA/GPA
Elementary
Grades 3-5 ♦
FARMS ♦ ♦
Underrepresented Groups
Middle
Grades 6-8 ♦ ♦ ♦ ♦ ♦
FARMS ♦ ♦ ♦ ♦ ♦
Underrepresented Groups ♦ ♦ ♦ ♦ ♦
High
Grades 9-12 ♦ ♦ ♦ ♦ ♦
FARMS ♦ ♦ ♦ ♦ ♦
Underrepresented Groups ♦ ♦ ♦ ♦ ♦
10
Saturday School participants performed significantly higher than nonparticipants.
Saturday School participants performed significantly lower than nonparticipants.
♦ No significant difference between Saturday School participants and nonparticipants.

Current Impact Data
Achieve 3000 pilot
• 4 largest centers utilize assessment tooloMontgomery Blair High SchooloNorthwest High SchooloPaint Branch High SchooloWheaton High School
•Measures pre-post Lexile growth in readingo Grades K–3 showed the greatest growth
September 2018 through January 2019
11

K–8 Lexile Growth (2018–2019)
0
100
200
300
400
500
600
700
800
900
1000
K-1 2 3 4 5 6 7 8
Lexile Growth
1st Semester 2nd Semester
12

Grades 3–8 Lexile Growth
• Lexile changes for participating Saturday School students during the 2016–2017 and 2017–2018 school year
• Examined for students across all Saturday School Sites
• Examined for students in sites not implementing Achieve 3000
13

Lexile Growth: Grades 3 through 8 (All Sites)
0
200
400
600
800
1000
1200
Grade 3 Grade 4 Grade 5 Grade 6 Grade 7 Grade 8
Fall 2016 Spring 2017
14

Lexile Growth: Grades 3 through 8 (All Sites)
0
200
400
600
800
1000
1200
Grade 3 Grade 4 Grade 5 Grade 6 Grade 7 Grade 8
Fall 2017 Spring 2018
15

MCPS In-kind Support
• .5 FTE Administrator, operational and administrative support from staff in OCIP, OSFSE, and OCTO $200,000
• IntraAgency Coordinating Board Fees $84,000
• Transportation (9 buses) $45,000
• Young Scholars Program $30,000
• Instructional Materials and services $19,500
16
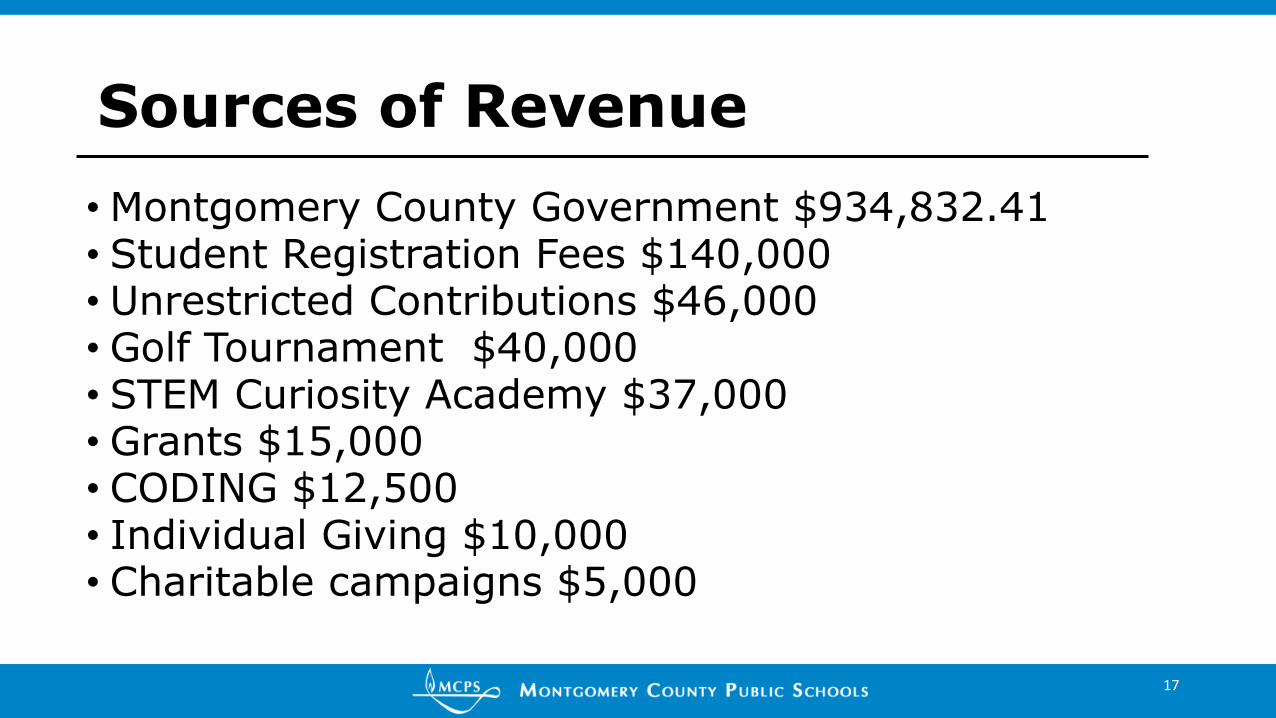
Sources of Revenue
• Montgomery County Government $934,832.41• Student Registration Fees $140,000• Unrestricted Contributions $46,000• Golf Tournament $40,000• STEM Curiosity Academy $37,000• Grants $15,000• CODING $12,500• Individual Giving $10,000• Charitable campaigns $5,000
17

18
Discussion