the geometry and dynamics of the massive 2403 - … · mon. not. r. astron. soc. 000,1–17(2014)...
TRANSCRIPT

Mon. Not. R. Astron. Soc. 000, 1–17 (2014) Printed 23 October 2014 (MN LATEX style file v2.2)
Hubble Frontier Fields: The Geometry and Dynamics of the MassiveGalaxy Cluster Merger MACSJ0416.1−2403
Mathilde Jauzac1,2?, Eric Jullo3, Dominique Eckert4, Harald Ebeling5, Johan Richard6,Marceau Limousin3, Hakim Atek7, Jean-Paul Kneib7,3, Benjamin Clement8, Eiichi Egami8,David Harvey9, Kenda Knowles2, Richard Massey1, Priyamvada Natarajan10,Benoıt Neichel3, M. Rexroth7
1Institute for Computational Cosmology, Durham University, South Road, Durham DH1 3LE, U.K.2Astrophysics and Cosmology Research Unit, School of Mathematical Sciences, University of KwaZulu-Natal, Durban 4041, South Africa3Laboratoire d’Astrophysique de Marseille - LAM, Universite d’Aix-Marseille & CNRS, UMR7326, 38 rue F. Joliot-Curie, 13388 Marseille Cedex 13, France4Astronomy Department, University of Geneva, 16 ch. d’Ecogia, CH-1290 Versoix, Switzerland5Institute for Astronomy, University of Hawaii, 2680 Woodlawn Drive, Honolulu, Hawaii 96822, USA6CRAL, Observatoire de Lyon, Universite Lyon 1, 9 Avenue Ch. Andre, 69561 Saint Genis Laval Cedex, France7Laboratoise d’Astrophysique, Ecole Polytechnique Federale de Lausanne (EPFL), Observatoire de Sauverny, CH-1290 Versoix, Switzerland8Steward Observatory, University of Arizona, 933 North Cherry Avenue, Tucson, AZ, 85721, USA9SUPA, University of Edinburgh, Royal Observatory, Blackford Hill, Edinburgh, EH9 3HJ, UK10Department of Astronomy, Yale University, 260 Whitney Avenue, New Haven, CT 06511, USA
Accepted 2013 XXX. Received 2013 XXX; in original form 2014 October 22nd
ABSTRACTWe use a joint optical/X-ray analysis to constrain the geometry and history of the ongoingmerging event in the massive galaxy cluster MACSJ0416.1−2403 (z=0.397). Our investiga-tion of cluster substructure rests primarily on a combined strong- and weak-lensing massreconstruction based on the deep, high-resolution images obtained for the Hubble FrontierFields initiative. To reveal the system’s dynamics, we complement this lensing analysis witha study of the intra-cluster gas using shallow Chandra data, and a three-dimensional model ofthe distribution and motions of cluster galaxies derived from over 100 spectroscopic redshifts.The multi-scale grid model obtained from our combined lensing analysis extends the high-precision strong-lensing mass reconstruction recently performed to cluster-centric distancesof almost 1 Mpc. Our analysis detects the two well known mass concentrations in the clustercore. A pronounced offset between collisional and collisionless matter is only observed for theSW cluster component, while excellent alignment is found for the NE cluster. Both the lensinganalysis and the distribution of cluster light strongly suggest the presence of a third massivestructure, almost 2 arcmin SW of the cluster centre. Since no X-ray emission is detected inthis region, we conclude that this structure is non-virialised and speculate that it might be partof a large-scale filament almost aligned with our line of sight. Combining all evidence fromthe distribution of dark and luminous matter, we propose two alternative scenarios for thetrajectories of the components of MACSJ0416.1−2403. Upcoming deep X-ray observationsthat allow the detection of shock fronts, cold cores, and sloshing gas (all key diagnostics forstudies of cluster collisions) will allow us to test, and distinguish between these two scenarios.
Key words: cosmology: observations - gravitational lensing - galaxy cluster - large-scalestructure of the Universe
1 INTRODUCTION
In the course of the past decades, gravitational lensing has becomeone of the most powerful tools to map the distribution of dark mat-
? E-mail: [email protected]
ter, starting with the confirmation of gravitational lensing as thecausal origin of the giant arc in the cluster Abell 370 by Sou-cail et al. (1988). The bending of light by foreground clusters canbe observed in two regimes: the strong-lensing regime, limited tothe densest part of the cluster, i.e. its core, and the weak-lensingregime, in its outskirts. Gravitational lensing allows astronomers
c© 2014 RAS
arX
iv:1
406.
3011
v3 [
astr
o-ph
.CO
] 2
2 O
ct 2
014

2 Jauzac et al. 2014
not only to directly measure the distribution of the total gravita-tional mass (dark or luminous), but also to use clusters as ‘cosmictelescopes’ to image very distant galaxies and to constrain the ge-ometry of the Universe (for reviews, see e.g. Massey et al. 2010;Kneib & Natarajan 2011). As the most powerful gravitational tele-scopes, massive clusters are sought-after observational targets.
Occupying the nodes of the Cosmic Web of large-scale fila-ments and sheets (Bond et al. 1996), massive clusters and, specif-ically, massive cluster mergers are of particular interest also in thecontext of structure-formation studies. The case of the Bullet Clus-ter (1E0657−56, z=0.3, Clowe et al. 2004) is exceptional in thiscontext: it shows a merging event of two clusters where the merg-ing direction is perpendicular to the line of sight, maximizing theapparent separation and revealing a clear cone-shaped shock frontahead of the smaller merger component. This rare geometry hasallowed studies to separately investigate the distribution and dy-namics of the baryonic and dark matter components, e.g., by usinga combination of strong- and weak-gravitational lensing (Bradacet al. 2006). This approach is particularly powerful as strong lens-ing constrains precisely the location and shape of the cluster core,while weak lensing maps the mass distribution on larger scales.A similar analysis was performed also on MACSJ0025.4-1222(z = 0.58, Ebeling et al. 2007; Bradac et al. 2008). Although anygiven observation captures no more than a snapshot of the com-plex process of cluster growth, the different dynamical behaviourof collisional (gas) and collisionless matter (dark matter and galax-ies) often observed in merging systems has been used to great effectto constrain the three-dimensional trajectories of the merger com-ponents (e.g., Clowe et al. 2004; Ma et al. 2009; Merten et al. 2011;Jauzac et al. 2012; Hsu et al. 2013). In this paper, we investigate amassive cluster that is both a spectacularly efficient gravitationallens and an active merger.
MACSJ0416.1−2403 (z = 0.397; hereafter MACSJ0416) wasdiscovered by the Massive Cluster Survey (MACS; Ebeling et al.2001) and classified as an actively merging system by Mann &Ebeling (2012) based on its X-ray / optical morphology. Becauseof its large Einstein radius, as revealed in HST (Hubble SpaceTelescope) observations obtained for programme GO-11103 (PI:Ebeling), MACSJ0416 was selected as one of five “high magni-fication” clusters in the Cluster Lensing And Supernova surveywith Hubble (CLASH: Postman et al. 2012). The system’s highlyelongated mass distribution, typical of merging systems, allowednumerous strongly lensed galaxies to be discovered (Zitrin et al.2013; Richard et al. 2014) in these imaging data. More recently,MACSJ0416 was chosen as one of six targets for the Hubble Fron-tier Fields (HFF) initiative. Launched by the Space Telescope Sci-ence Institute in 2013, this observing programme aims to harnessthe gravitational magnification of massive cluster lenses to studythe distant Universe to unprecedented depth. The HFF programmeallocates 140 HST orbits to imaging observations of each clus-ter, split between three filters on the Advanced Camera for Survey(ACS), and four on the Wide Field Camera 3 (WFC3), to reach anunprecedented depth for cluster studies of mAB ∼ 29 in all 7 pass-bands. The HFF observations of MACSJ0416 with ACS, performedin early 2014, allowed us to identify 51 new multiply imaged galax-ies, bringing the total number of lensed images to a record of 194(Jauzac et al. 2014). The resulting strong-lensing mass model con-firmed the bimodal mass distribution of MACSJ0416, and con-strains the mass within the core region to a precision of better than1%.
In this paper, we extend the analysis of Jauzac et al. (2014)by using both strong- and weak-gravitational-lensing constraints to
measure and map the mass distribution of MACSJ0416 to largercluster-centric radii. In addition we use archival Chandra X-raydata as well as radial velocities measured for over 100 cluster galax-ies to investigate the relative motions of collisional and collisionlessmatter in projection, as well as along our line of sight. The result isa model of the three-dimensional geometry and merger history ofthis complex system. Our paper is organised as follows: observa-tions of MACSJ0416 are summarised in Section 2, an overview ofour earlier strong-lensing analysis is provided in Section 3, the con-struction of the weak-lensing catalogue is described in Section 4,our gravitational lensing mass-modeling technique is explained inSection 5, results are presented in Section 6, the dynamical analysisof MACSJ0416 is performed in Section 7, and, finally, a summaryis provided in Section 8. We adopt the ΛCDM concordance cos-mology with Ωm = 0.3, ΩΛ = 0.7, and a Hubble constant H0 = 70km s−1 Mpc−1. Magnitudes are quoted in the AB system.
2 OBSERVATIONS
2.1 Pre-HFF HST Data
MACSJ0416 was first observed with the Hubble Space Telescopeusing the Wide Field Planetary Camera 2 (WFPC2) in 2007 as partof the SNAPshot programme GO-11103 (PI: Ebeling). This ob-servation established MACSJ0416 as a powerful gravitational lenswhich led to its inclusion in the CLASH programme (PI: Postman;Postman et al. 2012). Hence, MACSJ0416 was observed with HSTin 2012 for a total of 20 orbits across 16 passbands, from the UVto the near-IR. Table 1 lists details of these ACS and WFC3 obser-vations, which were used for the pre-HFF analysis of MACSJ0416.All mass models based on pre-HFF data (Johnson et al. 2014; Coeet al. 2014; Richard et al. 2014) are publicly available1.
2.2 Hubble Frontier Fields Data
MACSJ0416 is the second cluster to be observed in the HFF pro-gram (GO/DD 13496). Observations with ACS were performedfrom January 5th to February 9th 2014 in three filters (F435W,F606W, and F814W) for a total exposure time of 20, 12, and 48orbits, respectively. A summary of these observations is providedat the end of Table 1. At the time of this writing, imaging of thecluster with WFC3 for the HFF programme had yet to commence.
We applied basic data-reduction procedures to the HFF/ACSdata, using HSTCAL and the most recent calibration files. Individualframes were co-added using Astrodrizzle after registration to acommon ACS reference image using Tweakreg. After an iterativeprocess, we achieve an alignment accuracy of 0.1 pixel. Our finalstacked images have a pixel size of 0.03′′.
2.3 Chandra X-ray Data
MACSJ0416 was observed with the Advanced CCD Imaging Spec-trometer (ACIS-I) on board the Chandra X-ray Observatory on2009-06-07 for 16 ks (ObsID 10446, PI: Ebeling), and on 2014-06-09 for 37 ks (ObsID 16237, PI: Jones). We process these archivaldata using CIAO v4.6 and CALDB v4.5.9, merging them into a sin-gle 53 ks observation. After examining the light curve of the accu-mulated count rate for periods of enhanced particle background, we
1 http://archive.stsci.edu/prepds/frontier/lensmodels/
c© 2014 RAS, MNRAS 000, 1–17

HFF: Geometry and dynamics of MACSJ0416.1−2403 3
R.A. (J2000) Dec. (J2000) Instrument/Filter Exposure Time (in sec.) Programme ID
04 16 07.2 -24 03 35.7 WFC2/F814W 1200 1110304 16 07.2 -24 03 35.7 WFC2/F606W 1200 11103
04 16 08.4 -24 04 20.0 ACS/F435W 2052 1245904 16 08.4 -24 04 20.0 ACS/F475W 2064 1245904 16 08.4 -24 04 20.0 ACS/F606W 2018 1245904 16 08.4 -24 04 20.0 ACS/F625W 2017 1245904 16 08.4 -24 04 20.0 ACS/F775W 2031 1245904 16 08.4 -24 04 20.0 ACS/F814W 4037 1245904 16 08.4 -24 04 20.0 ACS/F850LP 4086 1245904 16 08.4 -24 04 20.0 WFC3/F105W 2815 1245904 16 08.4 -24 04 20.0 WFC3/F110W 2515 1245904 16 08.4 -24 04 20.0 WFC3/F125W 2515 1245904 16 08.4 -24 04 20.0 WFC3/F140W 2312 1245904 16 08.4 -24 04 20.0 WFC3/F160W 5029 1245904 16 08.4 -24 04 20.0 WFC3/F225W 3634 1245904 16 08.4 -24 04 20.0 WFC3/F275W 3684 1245904 16 08.4 -24 04 20.0 WFC3/F336W 2360 1245904 16 08.4 -24 04 20.0 WFC3/F390W 2407 12459
04 16 08.9 -24 04 28.7 ACS/F435W 52460 HFF-1349604 16 08.9 -24 04 28.7 ACS/F606W 31476 HFF-1349604 16 08.9 -24 04 28.7 ACS/F814W 125904 HFF-13496
Table 1. Summary of HST observations of MACSJ0416. The HFF observations are highlighted in bold.
extract a raw image of the cluster in the 0.7–7 keV band and use theCIAO tool mkexpmap to compute an effective exposure map, takingvignetting effects into account. The raw image, which preserves therecorded photon statistics, is adaptively smoothed using asmooth(Ebeling et al. 2006), requiring 3σ significance of all features withrespect to the local background.
2.4 Spectroscopic and Photometric Redshifts
More than 100 spectroscopic galaxy redshifts are available withinthe field of MACSJ0416. Spectroscopic redshifts from Ebelinget al. (2014) are complemented by redshifts obtained for VLTprogramme 186.A–0798 (Balestra et al., in preparation). We alsomake use of the catalogue of photometric redshifts derived by theCLASH team from HST imaging in 16 passbands (second blockof entries in Table 1) utilising the Bayesian Photometric Redshift(BPZ) programme (Benıtez et al. 2004; Coe et al. 2006). We use ofall of these redshifts to select background galaxies for our weak-lensing catalogue, as well as for the identification (and removal) ofcluster members (see Sect. 4 for details).
3 STRONG-LENSING ANALYSIS: REVISITINGMULTIPLE IMAGES
Since our HFF strong-lensing analysis of MACSJ0416 has alreadybeen presented in (Jauzac et al. 2014, hereafter J14), we here pro-vide only a brief synopsis of the mass model derived and the mainresults.
Before the HFF observations of MACSJ0416, Zitrin et al.(2013) identified 23 multiple-image systems (corresponding to atotal of 70 individual images) in the CLASH data (Postman et al.2012). The identifications of 10 of these (comprising 36 individ-ual images) were considered less robust. In (Richard et al. 2014,
hereafter R14), we included only the most robust systems as wellas a few candidate systems showing clear counter-images at loca-tions predicted by our preliminary strong-lensing analysis. Our fi-nal list contained 17 multiply imaged galaxies (47 individual im-ages). Thanks to the unprecedented depth of the HFF data, J14 wasable to dramatically improve these numbers, by discovering 51 newmultiple-image systems, bringing our final list of identifications to68 multiply imaged galaxies, with a total of 194 individual images.Spectroscopic confirmation, however, has so far been obtained foronly 9 systems. The full list of these systems is given in J14.
Using a subset of the 57 most securely identified multiple-image systems, we built a strong-lensing parametric mass modelusing the publicly available Lenstool2 software. The resulting best-fit model comprises two cluster-scale dark-matter halos and 98galaxy-scale halos. The parameters describing this best-fit massmodel are listed in Table 2. We also provide a mass estimate forboth components within 20′′ (∼100 kpc).
This model predicts image positions to within an RMS errorof 0.68′′, an improvement in precision of almost a factor of twoover pre-HFF models of this cluster. The total mass enclosed inthe multiple-image region is MS L(R < 320 kpc) = (3.26 ± 0.03) ×1014M. This measurement offers a three-fold improvement in pre-cision and drives the statistical mass uncertainty below 1% for thefirst time in any cluster. Finally, the statistical uncertainty in themedian magnification has been lowered to 4%. The resulting high-precision magnification map of this powerful cluster lens immedi-ately improves the constraints on the luminosity function of high-redshift galaxies lensed by this system.
For more details on our HFF strong-lensing analysis ofMACSJ0416, we refer the reader to J14, where the methodologyand mass measurements are described in details.
2 http://projects.lam.fr/repos/lenstool/wiki
c© 2014 RAS, MNRAS 000, 1–17

4 Jauzac et al. 2014
Component C1 C2 L∗ elliptical galaxy
∆ ra -4.5+0.7−0.6 24.5+0.5
−0.4 –∆ dec 1.5 +0.5
−0.6 -44.5+0.6−0.8 –
e 0.7 ±0.02 0.7±0.02 –θ 58.0+0.7
−1.2 37.4±0.4 –rcore (kpc) 77.8+4.1
−4.6 103.3±4.7 [0.15]rcut (kpc) [1000] [1000] 29.5+7.4
−4.3σ (km s−1) 779+22
−20 955+17−22 147.9± 6.2
M (1013 M) 6.02±0.09 6.12±0.09
Table 2. Best-fit PIEMD parameters for the two large-scale dark-matter ha-los. Coordinates are quoted in arcseconds with respect to α=64.0381013deg, δ=− 24.0674860 deg (yellow cross in Fig. 6). Errors correspond to the1σ confidence level. Parameters in brackets are not optimised. The refer-ence magnitude for scaling relations is mF814W = 19.8. Masses are quotedwithin an aperture of 20′′ (∼100 kpc).
4 WEAK-LENSING CONSTRAINTS
In this Section, we summarise our analysis methodology and thendiscuss in particular the enhancements to our technique wroughtby significant improvements in the data quality brought about bythe HFF observations. A more detailed description of the methodused to generate the weak-lensing background-galaxy catalogue ispresented in Jauzac et al. (2012) (hereafter J12).
4.1 The ACS Source Catalogue
Our weak-lensing analysis is based on shape measurements in theACS/F814W band. Following a method developed for the analysisof data obtained for the COSMOS survey, and described in Leau-thaud et al. (2007) (hereafter L07), the SExtractor photometrypackage (Bertin & Arnouts 1996) is used to detect sources withthe ‘Hot-Cold’ method (Rix et al. 2004, L07). It consists of run-ning Sextractor twice: first with a configuration optimised todetect only the brightest objects (the cold step), and then a sec-ond time with a configuration optimised to detect the faint objectsthat contain most of the lensing signal (the hot step). The result-ing catalogue is then cleaned by removing spurious or duplicatedetections using a semi-automatic algorithm that defines polygonalmasks around stars or saturated pixels. Galaxies are distinguishedfrom stars by examining the distribution of objects in the magnitude(MAG AUTO) vs peak surface brightness (MU MAX) plane (seeL07 & J12 for more details). Finally, the drizzling process intro-duces pattern-dependent correlations between neighbouring pixels,which artificially reduces the noise level of co-added drizzled im-ages. Care must be taken to correct for this effect. Because we haveused the same Drizzle pixelfrac and convolution kernel parametersas L07, we apply the same remedy as L07 by simply scaling up thenoise level in each pixel by the same constant FA ≈ 0.316, definedby Casertano et al. (2000). The resulting catalogue comprises 4296sources identified as galaxies and 1171 sources identified as pointsources (stars) within a magnitude limit of mF814W = 29.5. Fig. 1shows the magnitude distribution of the detected galaxies and stars.
Since only galaxies behind the cluster are gravitationallylensed, the presence of cluster members and foreground galaxiesdilutes the observed shear and reduces the significance of all quan-tities derived from it. Identifying and eliminating as many of thecontaminating unlensed galaxies is thus crucial. As a first step, weidentify cluster galaxies with the help of the catalogue of photo-
18 20 22 24 26 28 30magF814W
1
10
100
1000
Num
ber C
ount
s
GalaxiesStars
Figure 1. Magnitude distribution of the sources identified as galaxies(dashed black) and stars (magenta) resulting from our SEXTRACTOR de-tection.
metric redshifts compiled by the CLASH collaboration, and thespectroscopic redshifts mentioned in Sect. 2.4. All galaxies withphotometric redshift 0.35<zphot<0.44 are considered to be clustergalaxies. The spectroscopic cluster membership criterion is definedby
zcluster − dz < z < zcluster + dz,
where z is the spectroscopic redshift of the considered galaxy,zcluster = 0.3979 is the systemic redshift of the cluster, and dz =
0.0104 is the 3σ cut defined by the colour-magnitude selectionspresented in Sect. 5.2. Only 30% of the sources in our ACS ob-ject catalogue have a photometric redshift. Of these 30%, 17% areidentified as cluster members or foreground sources following theaforementioned selection criteria. Due to the large difference indepth between the CLASH and HFF observations, the photomet-ric redshift catalogue is not sufficient to identify all the unlensedcontaminants in our catalogue. Therefore, taking advantage of the3 HFF ACS-band imaging, we use a colour-colour diagram to iden-tify foreground and cluster members (Fig. 2). Using galaxies withphotometric or spectroscopic redshifts, we identify the region incolour-colour space that is dominated by unlensed galaxies (fore-ground galaxies and cluster members) and define its boundaries bymF435W−mF814W < 0.67776 (mF435W−mF606W) + 0.3; mF435W−mF814W
> 0.87776 (mF435W−mF606W) - 0.76; mF435W−mF814W > 0.3. We con-sequently remove all objects within this region from our analysis.Fig. 3 shows the galaxy redshift distribution before and after thisF435W-F606W-F814W colour-colour selection. This selection isvery efficient at removing cluster members and foreground galax-ies at z 60.44 — for the subset of our galaxies that have redshifts,88% of the unlensed population are eliminated.
The final validation of our colour-colour selection is done bypredicting the colours expected from spectral templates at the red-shift of the cluster or in the foreground. We use empirical templatesfrom Coleman et al. (1980) and Kinney et al. (1996) as well astheoretical templates from Bruzual & Charlot (2003) for variousgalaxy types in the Hubble sequences (ranging from Elliptical toSB) and starburst galaxies. The location of the colour-colour tracksat z < 0.44 agree well with our selection region as shown in Fig. 4for the Bruzal & Charlot model.
c© 2014 RAS, MNRAS 000, 1–17

HFF: Geometry and dynamics of MACSJ0416.1−2403 5
−1 0 1 2 3 4MAG
F435W − MAG
F814W
−2
−1
0
1
2
3
4
MA
GF
435W
− M
AG
F606W
ACS selection
All galaxiesForeground galaxies (zphot)Cluster galaxies (zphot)Foreground & Cluster galaxies (zspec)
Figure 2. Colour-colour diagram (mF435W −mF814W) vs (mF435W −mF606W)for objects within the HFF/ACS image of MACSJ0416. Grey dots representall galaxies in the study area. Unlensed galaxies diluting the shear signal aremarked by different colours: galaxies spectroscopically confirmed as clustermembers or foreground galaxies (green); galaxies classified as foregroundobjects because of their photometric redshifts (red); and galaxies classifiedas cluster members via photometric redshifts (yellow). The solid black linesdelineate the colour-cut defined for this work to mitigate shear dilution byunlensed galaxies.
4.2 Shape Measurements & Lensing Cuts
Measurements of galaxy shapes are performed using the RRGmethod (Rhodes et al. 2000). This method has been developedfor the analysis of data obtained from space, featuring a small,diffraction-limited point-spread function (PSF). It decreases thenoise in the shear estimators by correcting each moment of the PSFlinearly and only dividing them at the very end to compute an ellip-ticity. Rhodes et al. (2007) demonstrated that the ACS PSF is not asstable as one might expect from a space-based camera. Its size andellipticity vary considerably on time-scales of weeks due to tele-scope ‘breathing’, which induces a deviation from the nominal fo-cus and thus from the nominal PSF which becomes larger and moreelliptical. To overcome this problem, Rhodes et al. (2007) createda grid of simulated PSF images. From a comparison of the ellip-ticity of ∼20 stars in each image to the ellipticities of these modelimages, the effective focus of the observation can be determined.PSF parameters are then interpolated using the method presentedin Massey et al. (2002). This technique was used in L07 and J12.However, it has since been shown that PSF variations occur evenbetween subsequent exposures, and thus a modeling of the PSF foreach epoch results in a more accurate estimation of the correctionto apply to shear estimations (Harvey et al., in prep.).
In order to handle the multi-epoch images of MACSJ0416we adapted the RRG pipeline (L07) to model the average PSF atthe position of each galaxy in the stacked image (see Harvey atal in prep. for more details). To this end, we first locate the po-sitions of the stars in the reference frame of the drizzled imageusing Sextractor and both the magnitude – size and magnitude
0.5 1.0 1.5 2.0 2.5 3.0z
0
20
40
60
80
100
120
140
Num
ber o
f gal
axie
s
HFF−CLASH Redshift Distribution
before ACS colour−colour selectionafter ACS colour−colour selection
Figure 3. Redshift distribution of all galaxies with mF435W, mF606W, andmF814W photometry from HFF observations, that have photometric or spec-troscopic redshifts (dashed black histogram). The cyan histogram shows theredshift distribution of galaxies classified as background objects using thecolour-colour criterion illustrated in Fig. 2.
– MU MAX diagrams. We measure the second- and fourth-ordermoments of these stars from each exposure and compare them tothe Tiny Tim model for the F814W band. Using the best-fittingTinyTim PSF model, we then interpolate the PSF to the galaxy po-sitions, rotate the moments such that they are in the reference frameof the stacked image, and then take an average over the stack. (Notethat our PSF model thus depends on the number of exposures cover-ing a given area and is not necessarily a continuous function acrossthe field.) Since we know the number of exposures that contribute tothe image of each galaxy, we can discard shear estimates of galax-ies that have fewer than 3 exposures. Doing so removes all galaxiesnear the edge of the field and along chip boundaries.
The RRG method returns three parameters: d, a measure ofthe galaxy size, as well as e1 and e2, the two components of theellipticity vector e = (e1, e2), defined as
d =
√12
(a2 + b2)
e =a2 − b2
a2 + b2
e1 = ecos(2φ)
e2 = esin(2φ).
Here a and b are the major and minor axes of the backgroundgalaxy, and φ is the orientation angle of the major axis. The el-lipticity e is then calibrated by a factor called shear polarisability,G, to obtain the shear estimator γ:
γ = CeG. (1)
c© 2014 RAS, MNRAS 000, 1–17

6 Jauzac et al. 2014
0 1 2 3 4
MAGF435W
− MAGF814W
0.0
0.5
1.0
1.5
2.0
2.5
3.0
MA
GF
435W
− M
AG
F606W
ACS selection
E
Im
Sa
Sb
Sc
S0
0 < z < 0.35
0.35 < z < 0.44
Figure 4. Colour-colour diagram (magF435W −magF814W ) vs (magF435W −
magF606W ) as in Fig. 2. The solid black lines delineate the colour-cut de-fined for this work. The different spectral templates predicted from Colemanet al. (1980) and Kinney et al. (1996) and the theoretical ones from Bruzual& Charlot (2003) are marked by different colours: elliptical galaxies (red);magelanic irregulars (green); spiral Sa galaxies (cyan); spiral Sb (magenta);spiral Sc (yellow); and S0 galaxies (orange). The dash–dot curves corre-spond to a redshift range 0 < z < 0.35 (foreground galaxies), and the solidones to 0.35 < z < 0.44 (cluster members).
We use the same global measurement of the shear susceptibility Gas in L07:
G = 1.125 + 0.04 arctanS/N − 17
4.
Finally, C in Eq.1 is the calibration factor, determined using a setof simulated images similar to those used by STEP (Heymans et al.2006; Massey et al. 2007) for COSMOS images, and is given byC = (0.86+0.07
−0.05)−1 (see L07 for more details).The last step in constructing the weak-lensing catalogue is to
exclude galaxies whose shape parameters are so ill-determined thatincluding them would increase the noise in the shear measurementsmore than the shear signal. These cuts are the same as the ones usedin L07 and J12, and are quoted here for clarity:
• Threshold in the estimated detection significance:
SN
=FLUX AUTO
FLUXERR AUTO> 4.5;
• Threshold in the total ellipticity:
e =
√e2
1 + e22 < 1;
• Threshold in the size, as defined by the RRG d parameter :
3.6 < d < 30 pixels.
As explained in J12, the requirement that the galaxy ellipticitybe less than unity may appear trivial and superfluous. In practice itis meaningful though since the RRG method allows measured el-lipticity values to be greater than 1 due to noise, although ellipticity
22 24 26 28magF814W
0.1
1.0
10.0
Num
ber o
f gal
axie
s per
arc
min
2
HFF WL catalogue (this work)pre−HFF WL catalogue (Richard et al. 2014)
Figure 5. Magnitude distribution of background galaxies selected for ourpre-HFF analysis per arcmin2 (dashed black line, R14), and for this work(orange).
is by definition restricted to e 6 1. The lower limit in the RRG sizeparameter d aims to eliminate sources with uncertain shapes, sincePSF corrections and thus credible shape measurements become in-creasingly difficult as the size of a galaxy approaches that of thePSF. The upper limit in d aims to eliminate sources with a size sim-ilar to large elliptical cluster members. In addition to applying theaforementioned cuts, and in order to ensure an unbiased mass re-construction while combining strong and weak lensing, we also re-move all background galaxies located in the multiple-image (stronglensing) region, which can be approximated by an ellipse alignedwith the cluster elongation as predicted by the strong-lensing model(a = 75′′, b = 36′′, θ = 135 deg, α = 64.0351 deg, δ = −24.0745deg).
Fig. 5 compares the magnitude distribution of selected back-ground galaxies for the pre-HFF data (R14) and the HFF data.The HFF-based catalogue extends to ACS-F814W magnitudes of29, two magnitudes fainter than the pre-HFF dataset. Note thatthe shown distributions differ also at lower magnitudes. Owing tothe greatly increased depth of the HFF data compared to thoseobtained for the CLASH programme, the contamination by faintforeground and cluster galaxies is much increased too. As a con-sequence, our colour-colour selection is more drastic and removesmore objects in the magnitude range 24 < mF814W < 26. 13 galax-ies with mF814W < 24 are still included in our HFF catalogue thatwere removed from the pre-HFF catalogue of R14. The reason isthe different colour-colour selection employed by R14, which wasless efficient and required a magnitude cut at mF814W = 24 to re-move bright objects. The depth of the HFF images also causesmore stars to be saturated, requiring the size of the correspond-ing masks to be increased; in total ∼40% of the ACS surface ismasked out as a result. Our final weak-lensing catalogue is com-posed of 714 background galaxies, corresponding to a density of∼ 100 galaxies.arcmin−2. Compared to the catalogue generated byour pre-HFF analysis (R14), the density of weakly lensed galaxieshas almost doubled.
5 MASS MODELING: COMBINING STRONG- ANDWEAK-LENSING CONSTRAINTS
As, in this study, we aim to detect dark-matter-dominated structuresoutside the strong-lensing region, we add a grid-based model to theparametric lens model described in Sect. 3.
c© 2014 RAS, MNRAS 000, 1–17

HFF: Geometry and dynamics of MACSJ0416.1−2403 7
5.1 Grid Method: Combining Strong & Weak LensingConstraints
In previous work, we modelled the matter distribution with a setof Radial Basis Functions (RBFs) located at the nodes of a mul-tiscale grid, which covered an area slightly larger than observed(Jullo & Kneib 2009; Jauzac et al. 2012; Jullo et al. 2014). We com-plemented this grid-based model with dPIE potentials (Elıasdottiret al. 2007) to account for the lensing contribution of cluster mem-bers.
In this work, we adopt a slightly different approach. We keepthe parametric model described in section 3 fixed at the best-fit val-ues and then estimate the RBF amplitudes from the WL constraints.By doing so, we appropriately weigh the SL constraints and do notaccount for them twice. Indeed, an attempt at optimizing the RBFamplitudes with both strong- and weak-lensing constraints failedto produce physically meaningful results as the strong-lensing sig-nal completely dominated the optimization process and essentiallyoverwhelmed the weak-lensing data. The parametric model con-tains two cluster-scale halos and 146 galaxy-scale halos, as we ex-tend our analysis to the full ACS field of view (see next subsection).We add a uniform grid of RBFs to these main mass components.Each RBF is axi-symetric, fixed in position and size, and only itsamplitude varies, as if they were pixels in an image. The radial pro-file of each RBF is modelled with a dPIE potential (Elıasdottir et al.2009). The core radius s is set to the distance between an RBF andits closest neighbour, and the cut radius t is assumed to be threetimes the core radius Jullo & Kneib (2009).
We tried different prescriptions for the grid resolution. The op-timum solution was achieved using a uniform grid with 2741 RBFsseparated from each other by s = 5.5′′ (see Sect. 6.1.1 for moredetails). In addition, we found it necessary to remove the RBFs inthe central strong-lensing area since, due to a lack of weak-lensingconstraints, the reconstruction in this region was very noisy. Thereconstruction is smooth, thanks to overlapping RBFs.
We sum the contribution of the two components of our modelto the observed ellipticity as follows:
em = Mγvv + eparam + n , (2)
Here the vector v contains the amplitudes of the 2741 RBFs, vec-tor em = [e1, e2] contains the individual shape measurements ofthe weak-lensing sources, eparam is the fixed ellipticity contributionfrom the parametric model. The vector n represents the Gaussiannoise in the shape measurements, i.e., the intrinsic ellipticity ofgalaxies and the noise in our measurements of their shapes. Thetransformation matrix Mγv contains the cross-contribution of eachindividual RBF to each individual weak-lensing source. Each shearcomponent in scaled by the ratio of the distances between each in-dividual source S , the cluster L, and the observer O. The elementsof the Mγv matrix for the two shear components are
∆( j,i)1 =
DLS i
DOS iΓi
1(||θi − θ j||, si, ti), (3)
∆( j,i)2 =
DLS i
DOS iΓi
2(||θi − θ j||, si, ti). (4)
where analytical expressions for Γ1 and Γ2 are given in Elıasdottiret al. (2009, Equation A8). Note that the shear in the cluster canbe large, and the assumption shown in Eq. 3 may not be strictlyvalid. However, since the parametric model accounts for most of thelensing effect, the contribution to the grid-based model originatesprimarily in the weak-lensing regime.
5.2 Modeling of Cluster Members
Complementing our grid of RBFs, we add the contributions from146 cluster member galaxies (presented in Sect. 5.1), modelledagain as dPIE potentials and selected following the method pre-sented in R14. We define cluster members to be those galaxies thatfall within 3σ of a linear model of the cluster red sequence in boththe (mF606W−mF814W) vs mF814W and the (mF435W−mF606W) vs mF814W
colour-magnitude diagrams. The magnitude limit of this sample ismF814W = 23.4.
These galaxies are then inserted in the model as small-scalepertubators. Their cut radius and velocity dispersions are fixed, andscaled from their luminosities in HST/ACS F814W-band. We de-rive L∗ in our filter of observation based on the K∗ magnitudesobtained by Lin et al. (2006) as a function of cluster redshift.Cut radius and velocity dispersion are then scaled relative to anm∗ = 19.76 galaxy with velocity dispersion σ∗ = (119±20) km s−1
and cut radius r∗cut = (85 ± 20) kpc.
5.3 Priors and MCMC sampling
We sample the huge parameter space with the MassInf algorithmimplemented in the Bayesys library (Skilling 1998), itself imple-mented in Lenstool, and described in Jullo et al. (2014). In sum-mary, this algorithm uses the Gibbs sampling approach in which,at each iteration, the most significant RBFs are first identified andthen adjusted in amplitude to fit the ellipticity measurements. Thenumber of significant RBFs is a prior of MassInf, although we haveshown in Jullo et al. (2014) that it has little impact on the recon-struction. We set the initial number of significant RBFs to 2%, andthe algorithm converged to about 4%. In contrast to previous anal-yses, we here do not assume that the resulting mass distributionhas to be positive everywhere. We found that incorporating sucha prior introduces a spurious bias favouring positive values of themass-sheet degeneracy.
The objective function is a standard likelihood function, inwhich noise is assumed to be Gaussian. The algorithm returns alarge number of MCMC samples, from which we can estimatemean values and errors on different quantities (mass density field,amplification field, etc).
5.4 Redshift Estimation for Background Sources
Of the 714 background galaxies in our catalogue, 236 have a pho-tometric redshift estimated from the CLASH data that allow us toisolate background galaxies. We found the following function toprovide a good description of the redshift distribution of these back-ground galaxies:
N(z) ∝ e−(z/z0)β (5)
with β = 1.84 and a median redshift < z > = 1.586 = 0.56 z0
(Gilmore & Natarajan 2009; Natarajan & Kneib 1997).In addition, we split the catalog into a bright and a faint sub-
sample at the median magnitude mF814W = 26.4. Within the uncer-tainties given by the number statistics, the resulting two histogramshave the same slope. Since Lenstool allows each source to have itsown redshift, we randomly draw (during the initialization phase)redshifts from the fitted redshift distribution for all galaxies with-out spectroscopic or photometric redshift.
c© 2014 RAS, MNRAS 000, 1–17

8 Jauzac et al. 2014
X2
X1
S1
S2
25’’
E
N
X-ray emission
Total mass
Optical emission
Figure 6. Composite colour image of the galaxy cluster MACSJ0416 created from HST/ACS images in the F814W, F606W, and F435W passbands. Masscontours from our gravitational-lensing analysis are shown in bold white, contours of the adaptively smoothed X-ray surface brightness in the 0.5–7 keV bandas observed with Chandra are shown in dashed red, while the light distribution is delineated by yellow contours. Substructures S1 and S2 are marked withorange crosses while the two X-ray peaks, labeled X1 and X2, are marked by cyan crosses.
6 RESULTS
We now present our results for the properties of both dark and lu-minous matter in MACSJ0416, beginning with the distribution ofthe total gravitating mass as reconstructed by our lensing analysis.All masses for the cluster, as well as density profiles, are measured
with respect to the position of the brightest cluster galaxy (BCG),i.e., α =04:16:09.144, δ =-24:04:02.95.
c© 2014 RAS, MNRAS 000, 1–17

HFF: Geometry and dynamics of MACSJ0416.1−2403 9
Figure 7. Surface density profile obtained with our comprehensivegravitational-lensing analysis (black). For comparison, we show the sur-face density profile obtained by J14 based exclusively on strong-lensingfeatures (cyan). The shaded light grey area marks the region within whichmultiple-image systems were found. The two dark grey shaded areas markthe region of substructures S1 and S2. The two green lines represent twodifferent slopes: R−1 and R−2.
6.1 Distribution of Total Mass
6.1.1 Grid Resolution
To assess whether the grid of RBFs presented in Sect. 5 is opti-mally suited to describe MACSJ0416, we compared the Bayesianevidence resulting from the optimisation for grids of different res-olution. We remind the reader that the logarithmic Bayesian evi-dence is given by
log(E) =
∫ 1
0< log(L) >λ dλ
, where the average is computed over a set of 10 MCMC realiza-tions at any given iteration step λ, and the integration is performedover all iterations λi from the initial model (λ = 0) to the best-fitresult (λ = 1). The increment dλ depends on the variance betweenthe 10 likelihoods computed at a given iteration, and on a conver-gence rate that we set equal to 0.1 (see Bayesys manual for details).The increment gets larger as the algorithm converges towards 1.
To test the impact of higher resolution, we created a uniformgrid containing 3883 RBFs separated by s = 3.3′′. We found theresulting model added noise where no structures are detected in theoptical. The Bayesian evidence obtained for this high-resolutiongrid is log(E) = −267, compared to log(E) = −251 for the grid de-scribed in Sect. 5. We also explored a low-resolution grid, contain-ing 722 RBFs separated by s = 11.1′′. The optimization using thisgrid resulted in a better Bayesian evidence of log(E) = −229, and asimilar χ2. However, all structures were poorly resolved. Since, inaddition, the signal-to-noise ratios in the sub-structures were equiv-alent, we discarded this low-resolution model.
Figure 8. Surface density profile obtained with our comprehensivegravitational-lensing analysis (black). For comparison, we show the sur-face density profile obtained by Umetsu et al. (2014) based exclusively onweak-lensing features (red) derived thanks to Subaru observations (KeiichiUmetsu private communication).
6.1.2 Comparison with Previous Analyses
Using the grid method described in Sect. 5, we reconstruct the massdistribution of MACSJ0416 within the HFF ACS field of view.Fig. 6 shows contours (white) of the resulting surface mass den-sity overlaid on the ACS colour image. The mass distribution ishighly elongated and features no pronounced substructure at sig-nificant distances from the major axis, which is typical of mergingclusters. We note as well that the mass distribution is more ellipti-cal than with the SL model. This means that the initial SL modelwas not only under predicting the mass density, but also the shearin the outskirts. Mirroring the system’s morphology in the opti-cal and X-ray regime (magenta and cyan contours in Fig. 6) ourlensing reconstruction of the total gravitational mass yields again astrongly bimodal distribution. In order to measure the radial massprofile, we define the global cluster centre at α = 64.0364 degand δ = −24.0718 deg (this is the same centre as used in J14 andmarked by a yellow cross in Fig. 6). As a test of the consistency ofour mass reconstruction techniques we can compare the projectedmass of MSL(R<320 kpc) = (3.26 ± 0.03) × 1014 h−1
70 M measuredby J14 using exclusively strong-lensing features with the value ofMSL+WL(R<320 kpc) = (3.15±0.13)×1014 h−1
70 M obtained by ourjoint strong- and weak-lensing analysis. The precision attained hereis lower since, at this distance from the cluster core, weak-lensingconstraints already contribute to the total mass. Both methods alsoyield very similar maps of the mass distribution within the clustercore region.
Fig. 7 compares the surface density profiles obtained by thisanalysis with the ones reported by J14 based on their strong-lensingmass model. Note the very good agreement at the outer edge ofthe multiple-image region (shaded area). At larger radii (R>250h−1
70 kpc) the predictive power of the model of J14 weakens, due
c© 2014 RAS, MNRAS 000, 1–17

10 Jauzac et al. 2014
Figure 9. Surface density profiles obtained with our complete gravitationallensing analysis (black curve). In orange we show the density profile weobtain in a triangular region designed from the cluster centre and includingS1. We show the same density profile in red but for S2. Finally we designeda triangular region into which there is no apparent sub-structures, and it isshown in grey. The two dark grey shaded areas mark the region of substruc-tures S1 and S2.
to the lack of structure massive enough to induce strong lensing.By contrast, the combined strong- and weak-lensing mass modelremains sensitive to the less pronounced density variations at theoutskirts of the cluster.
Pre-HFF strong+weak lensing mass models were also pub-lished in Gruen et al. (2013), and R14. Gruen et al. (2013) presenta weak-lensing analysis of the Wide-Field Imager SZ Cluster ofGalaxy (WISCy) sample based on data collected with the Wide-Field Imager (WFI, Baade et al. 1999) on the 2.2m MPG/ESOtelescope at La Silla. For MACSJ0416, Gruen et al. (2013) ob-tain mass values that agree well with ours: M(R<200 kpc) =
1.40+0.22−0.23 × 10¹⁴ h−1
70 M (Daniel Gruen private communication)vs. our value of M(R<200 kpc) = (1.66 ± 0.05) × 1014 h−1
70 M.More recently, Umetsu et al. (2014) published results from a weak-lensing analysis of the CLASH cluster sample using SUBARUdata. For MACSJ0416, Umetsu et al. (2014) obtain a mass valueof M(R<950 kpc) = 0.98 ± 0.14 × 10¹⁵ h−1
70 M (Keiichi Umetsu,private communication) that agrees well with our measurementof M(R<950 kpc) = 1.15 ± 0.07 × 10¹⁵ h−1
70 M. Umetsu et al.(2014) reconstructed projected mass density profiles for their clus-ter sample from a joint likelihood analysis of Subaru shear andmagnification measurements. The errors include the estimated con-tribution from uncorrelated large-scale structures projected alongthe line of sight. Their result is shown in Fig. 8 and found tobe in good agreement with the density profile obtained by us forMACSJ0416. Finally, the pre-HFF model presented by our team inR14, which combines strong- and weak-lensing constraints but usesa parametric approach similar to the one presented in J14, yieldsM(R<200 kpc) = (1.63 ± 0.03) × 1014 h−1
70 M.
ID R.A. (deg) Dec. (deg) M(1013h−170 M) σ DC−S (kpc)
S1 64.016542 -24.094906 4.22 ± 0.56 7.5 580S2 64.06097 -24.063636 1.46 ± 0.20 7.3 470
Table 3. Coordinates, mass within a ∼100 kpc aperture, significance of de-tection, and distance to the cluster centre (DC−S ) for the two substructuresdetected in the outskirts of MACSJ0416.
6.1.3 Detection of Substructure
As mentioned previously, the SL-only results from J14 are in ex-cellent agreement with those presented here from an analysis thatcombines strong and weak lensing. The advantages of the lattercome to bear particularly in the outskirts of the region probed bythe HFF images, where any sufficiently massive substructures willreveal their presence by creating weak gravitational shear in theimages of background galaxies.
In the case of MACSJ0416, we detect two new substructures athigh significance in our mass map; their centres are labeled S1 andS2 in Fig. 6. The projected masses of S1 and S2, estimated withinan aperture of ∼100 kpc, are (4.22±0.56) and (1.5±0.20)×1013 h−1
70M, respectively, values typical of galaxy groups. A tentative iden-tification of S1 as a group of galaxies is supported by the presenceof a coinciding galaxy overdensity, clearly visible also as a peak inthe cluster light distribution (Fig. 6). For S2, the association witha galaxy group is much less obvious. Physical characteristics ofS1 and S2 are listed in Table 3. The distribution of cluster light asshown in Fig. 6 is obtained by smoothing a map of the flux in theACS-F814W band from cluster members with a Gaussian kernel(σ=9′′).
The imprint of these minor mass concentrations on the overallmass density profile can be seen in Fig. 7 in the form of enhance-ments at ∼450 h−1
70 kpc (S2), and (much more clearly) at ∼650h−170 kpc
(S1) from the cluster centre. In order to test whether these fea-tures are indeed caused by S1 and S2, we follow the same pro-cedure as used in J12 to confirm the detection of the large-scalefilament in the field of MACSJ0717.5+3745 and define three trian-gular regions, anchored at the global cluster centre and extendingtoward S1, S2, and (for control purposes) a region towards the NWof the field centre that is void of any mass overdensities. Fig. 9presents the resulting surface density profiles in these three regionsand shows indeed that the excess surface mass density can be at-tributed to S1 and S2, while no significant variations are observedin the radial surface mass density profile of the control field.
6.2 Distribution of Stellar Mass
To measure the stellar mass distribution, M∗, across the ACS fieldof view, we use the same method as in J12. We compute the re-lation log(M∗/LK) = az + b, established by Arnouts et al. (2007)for quiescent (red) galaxies in the VVDS sample (Le Fevre et al.2005), and adopt a Salpeter initial mass function (IMF). Here LK
is the galaxy’s luminosity in the K-band, z is its redshift, and theparameters a and b are given by:
a = −0.18 ± 0.03,
b = −0.05 ± 0.03.
We apply this relation to our catalogue of 146 cluster mem-bers used in our mass model (see Sect. 5.2). We estimate the K-
c© 2014 RAS, MNRAS 000, 1–17

HFF: Geometry and dynamics of MACSJ0416.1−2403 11
band luminosity of cluster members observed in the F814W bandusing theoretical models from Bruzual & Charlot (2003) to predictthe typical (mF814W − mK) colours. We assume a passively evolvedgalaxy observed at z = 0.4, with a range of exponentially decayingstar-formation histories within the range τ = 0.1 − 2 Gyr. This pro-vides a typical colour mF814W −mK = 1.14± 0.04 (AB system). Us-ing the public data obtained from GSAOI observations in Ks band(Schirmer et al. 2014), we confirmed this colour for cluster membergalaxies located in the central 100x100 arcmin2 of the cluster. Theresulting projected mass density in stars decreases in proportion tothe total projected mass density depicted in Fig. 7. We measure amass-to-light ratio across the study area of M∗/LK = 0.99 ± 0.03M/L. To compare our results with those obtained by Leauthaudet al. (2012) for COSMOS data, we need to adjust our measure-ments to account for the different IMF used by these authors. Ap-plying a shift of 0.25 dex to our masses to convert from a SalpeterIMF to a Chabrier IMF, we find (M∗/LK)Chabrier = 0.78±0.02 M/Lfor quiescent galaxies at z ∼ 0.4, in good agreement with Leau-thaud et al. (2012).
The fraction of the total mass in stars, f∗, i.e., the ratio betweenthe stellar mass and the total mass of the cluster derived from ourlensing analysis within the ACS field of view, is f∗ = 3.15± 0.57%(assuming a Salpeter IMF). The latter value is slightly higher thanthe one derived by Leauthaud et al. (2012). The difference might bedue to different limiting K-band magnitudes or differences in thegalaxy environments probed (the COSMOS study was conductedfor groups with a halo masses between 1011 and 1014 h−1
70 M, andextrapolated to halos of ∼1015 h−1
70 M). Another cause might be theuse of the analytical Arnouts et al. (2007) relation to estimate thestellar mass. As discussed by Ilbert et al. (2010), the M∗/LK relationused here is only calibrated for massive galaxies, while in practicethis ratio varies with galaxy age and colour. Therefore, the Arnoutset al. (2007) relation overestimates the stellar masses of low-massgalaxies. Although we do not expect our cluster member sample tobe dominated by low-mass galaxies, a bias cannot be firmly ruledout. Finally we compute the total stellar mass within our study areaand find M∗ = (3.10± 0.01)× 1013 h−1
70 M. Upcoming HFF data inF160W will provide more direct estimates of the stellar masses.
6.3 Intra-Cluster Medium
6.3.1 X-ray Morphology
Fig. 6 shows the X-ray contours (in cyan) of the adaptivelysmoothed X-ray emission as observed with Chandra, as describedin Sect. 2.3. The X-ray emission shows two peaks (labelled X1 andX2 in Fig.6), located at R.A.=64.038458 deg, Dec=−24.067361deg (X1) and R.A.=64.029792 deg, Dec=−24.08025 deg (X2), andexhibits a strong elongation in the NE-SW direction. The main peakof the X-ray emission (X1) coincides with the first mass concen-tration detected in the cluster core by our lensing analysis (C1 inTable 2). However, the second peak (X2) located ∼45′′ (∼250 kpc)SW of X1, does not coincide with the mass concentration C2 inTable 2 and is offseted to the SW by ∼15′′. In the following we useseveral models to characterise the gas distribution that gives rise tothe X-ray morphology of MACSJ0416.
Acknowledging that the X-ray emission from MACSJ0416 isclearly neither unimodal nor spherically symmetric, we attemptto model the observed X-ray surface brightness distribution asthe superposition of two elliptical β-models in Sherpa, leavingthe position of the centroids free to vary. This model provides agood description of the data and yields best-fit centroids for the
1 2 5
10ï3
0.01
0.1
norm
aliz
ed c
ount
s sï1
keV
ï1
Energy (keV)
Figure 10. Global Chandra/ACIS-I spectrum of the cluster within 2 ar-cmin radius around the X-ray peak. The solid line shows the best-fit single-temperature APEC model. The red data points indicate the background levelas estimated from a source-free region.
two components of R.A.=64.040604 deg, Dec=−24.06654 deg andR.A.=64.029713 deg, Dec=−24.081072 deg, respectively. The 1σuncertainty of these positions is approximately 2′′. The model re-turns best-fit values of rc1 = 152± 24 kpc and rc2 = 68± 17 kpc forthe core radii of C1 and C2, respectively. The centroid of the maincomponent is thus slightly shifted (by ∼12′′) to the NE of the X-ray peak, which is not surprising given the irregular morphology ofthe X-ray emission. The centroid of the second model component,however, coincides with the X-ray surface-brightness peak X2.
Proceeding to less massive structures identified in our recon-struction of the mass distribution in MACSJ0416 (Fig. 6), we alsosearch for X-ray emission from substructure S1, tentatively identi-fied as a galaxy group in Sect. 6.1.3. No evidence of X-ray emissionfrom S1 is discernible in Fig. 6. In order to obtain a quantitative as-sessment of the X-ray luminosity and thus gas mass of S1, we add athird, group-sized component (rc = 100 kpc, β = 0.7) to our model,tied to the position of S1 as defined in Table 3. We find that the datado not require this third component. The upper limit to the 0.7–7keV photon flux of 3.2 × 10⁻⁶ cm−2 s−1 within a 20′′ radius (90%confidence level) corresponds to an upper limit to the X-ray lumi-nosity and gas mass of mass concentration S1 of LX < 6.2 × 1042
erg s−1 (unabsorbed, 0.1–2.4 keV) and Mgas(<20′′) < 2.9×10¹¹ h−170
M, respectively.
6.3.2 Spectral X-ray Analysis
In order to further constrain fundamental properties of the intra-cluster medium (ICM) of MACSJ0416, we examined the X-rayspectrum of the diffuse cluster emission within a radius of 2 ar-cmin from the primary X-ray peak (see Fig. 10). Obvious pointsources were excised from the event file prior to the spectral extrac-tion, and a source-free region was defined within the same ACIS-Ichip to estimate the local background. We modeled the spectrumwith a single-temperature APEC model (Smith et al. 2001) ab-sorbed by the Galactic hydrogen column density, which we fixedat the 21cm value of NH = 3.05 × 1020 cm−2 (Kalberla et al.2005). Because of the poor photon statistics of the archival ACIS-I observations (∼4500 source counts in the 0.7–7 keV band), we
c© 2014 RAS, MNRAS 000, 1–17

12 Jauzac et al. 2014
grouped the spectral channels to obtain a minimum of 20 countsper bin and used the C-statistic (Cash 1979) for the fitting proce-dure. We obtained an average cluster temperature of 11.0+1.4
−1.3 keVand an Fe abundance of 0.20+0.09
−0.08Z, where the quoted uncertain-ties represent the 1σ confidence level. According to the M-T re-lation of Arnaud et al. (2005), this temperature corresponds to atotal mass of M2500 = (4.8+0.9
−0.7) × 1014 h−170 M. With R2500 corre-
sponding roughly to 400 kpc, this result is consistent with the valueof M(R<400 kpc) = (4.12 ± 0.17) × 1014 h−1
70 M measured by ourlensing analysis. Most studies (e.g., Nagai et al. 2007; Rasia et al.2012; Nelson et al. 2012) predict that the lack of thermalization ofthe gas in violent cluster mergers should lead to an underestimationof the X-ray mass compared to the true mass. However, accordingto our analysis MACSJ0416 lies on the M-T relation, in spite ofongoing merger activity. While not of great significance in its ownright, this result agrees with the low scatter observed around thatrelation in cluster samples (e.g., Mahdavi et al. 2013). This is im-portant for future X-ray surveys (e.g., eROSITA), which will use theX-ray temperature as a proxy for cluster mass.
A region of special interest is the core of the NE cluster whichappears very compact in Fig. 6 and perfectly aligned with the as-sociated Brightest Cluster Galaxy (BCG). To test the hypothesisthat this cluster component might host a cool core, we extracted theX-ray spectrum of the two components of MACSJ0416 separately.We measure kT=10.3+1.1
−0.8 keV and kT=13.6+2.2−1.9 keV for the NE and
SW sub cluster, respectively. Attempts to directly fit an isothermalplasma model to the current archival data within a circle of 10′′
radius of X1 yield unphysical results of either extreme excess ab-sorption of several 1021 cm−2 (equivalent column density of neutralhydrogen) or temperatures well over 20 keV, i.e., far outside therange that can be constrained with Chandra. Given the poor photonstatistics (less than 700 net photons) we do not take these results atface value but rather as indication that an isothermal model is inap-propriate. Although we have thus currently no direct spectroscopicevidence of a cool core of the NE cluster component, the data ap-pear to suggest the presence of multi-phase gas in this region.
6.3.3 Gas Density and Gas Mass
We follow the procedure described in Eckert et al. (2012) to esti-mate the three-dimensional gas-density and gas-mass profiles ofMACSJ0416. Accounting for vignetting effects, we extracted asurface-brightness profile for a set of concentric annuli of 5′′ widthcentered on the primary X-ray peak, and estimated the local back-ground at radii beyond 4′. Cluster emission is detected out to ∼ 3′
(∼1 Mpc). The resulting profile was deprojected assuming spheri-cal symmetry using the method of Kriss et al. (1983). We convertedthe deprojected profile into an emission-measure profile assuminga constant temperature of 7.8 keV (see above), and inferred thegas-density profile by assuming constant density within each radialshell. Finally, the gas-mass profile was calculated by integrating thegas-density profile in concentric shells.
We measure gas masses of Mgas(R<500 kpc) = (3.4 ± 0.2) ×1013 h−1
70 M and Mgas(R<1 Mpc) = (8.6 ± 0.7) × 1013 h−170 M. In
this context, a note is in order regarding systematic effects. Giventhe irregular morphology of the cluster, the assumption of sphericalsymmetry might lead to an incorrect gas mass. However, since themorphology of the system beyond the inner regions appears rela-tively regular, only the gas masses observed in the central regionsare significantly affected. Moreover, as stated in Rasia et al. (2011),gas-mass measurements are relatively unaffected by the presence ofmerging substructures, due to the quadratic dependence of the X-
100 1000R (kpc)
0.01
0.10
f ∗, f g
as, f
b
fb
fgasf∗
(Ωb / Ωm)Mantz et al. 2014
(Ωb / Ωm)Planck
Figure 11. Fraction of stars, f∗, of gas, fgas, and fraction of baryons, fbpresent in MACSJ0416. We also plot the baryon fraction measured byPlanck ( fb = Ωb/Ωm = 0.1551 ± 0.0055), thick black line, and the onemeasured by Mantz et al. (2014) ( fb = Ωb/Ωm = 0.14± 0.02), thick dashedblack line.
ray emissivity on gas density. We thus expect little systematic biasin our measurement, in spite of the unrelaxed morphology of thesystem.
6.4 Baryon Fraction
Fig. 11 shows the fraction of baryons in stars (green asterisks, seeSect. 6.2) and gas (red diamonds, see Sect. 6.3) as a function ofcluster-centric radius. Both profiles exhibit trends typical for mas-sive galaxy clusters, in which energy input from cluster mergers aswell as feedback from active galactic nuclei (Nulsen et al. 2005)and galactic winds (Metzler & Evrard 1994) raise the entropy ofthe intracluster medium. As a result, the hot gaseous atmosphereexpands, and the gas fraction increases significantly with radius(e.g. Ettori & Fabian 1999; Vikhlinin et al. 2006). Conversely, thestars condensate within the massive central galaxies, and the stellarfraction shows the opposite trend.
The total baryon fraction is shown by orange circles in Fig. 11.Within 1 Mpc from the cluster core, we measure a gas fraction of0.072 ± 0.007 and a stellar fraction of 0.027 ± 0.004. The totalbaryon fraction within this aperture is thus fbar = 0.099 ± 0.008.This value is 5σ below the cosmic baryon fraction measured byPlanck Collaboration et al. (2013), fb = Ωb/Ωm = 0.1551 ± 0.0055(black thick line in Fig. 11), and also discrepant with the clustermeasurement of Mantz et al. (2014), fb = Ωb/Ωm = 0.14 ± 0.02, atmore than 4σ confidence (dashed black thick line in Fig. 11).
This tension might be due to several factors. First, our analysismay have missed a significant fraction of the total stellar mass ofthe cluster, since the selection of cluster members considers mainlyred galaxies. The contribution from less massive (and fainter) star-forming cluster galaxies is not taken into account. In addition, intra-cluster light (ICL) can account for 10–40% of the total stellar mass
c© 2014 RAS, MNRAS 000, 1–17
HFF: Geometry and dynamics of MACSJ0416.1−2403 13
(e.g. Gonzalez et al. 2007; Giodini et al. 2009; Lagana et al. 2013).However, we estimate that, overall, the missing stellar content cancontribute at most to 1% of the total cluster mass. Another expla-nation is that a large fraction of the baryons resides outside theregion sampled in our study. Recent studies (e.g. Simionescu et al.2011; Eckert et al. 2013) have shown that the hot gas fraction con-tinues to increase beyond R500 and eventually reaches the univer-sal baryon fraction. It is likely that a significant fraction of thebaryons indeed resides beyond 1 Mpc from the cluster centre, al-though the gas fraction of 7% measured here is still significantlylower than the typical values measured in massive clusters aroundR500 ∼ 400 kpc ( fgas ∼ 0.13, Vikhlinin et al. 2006; Pratt et al. 2009).Finally, the total mass used to derive the baryon fraction could beoverestimated by substructure along the line of sight. Our dynam-ical analysis of the member galaxies indeed revealed a differenceof 800 km s−1 between C1 and C2, and the substructure S1 ap-pears to be largely aligned with our line of sight (see Sect. 6.5).Since all of the aforementioned biases are known to be present butdifficult to account for, we suggest that the deficit of baryons ob-served in Fig. 11 is probably due to a combination of these effects.In particular, it is likely that because of the merging activity a sig-nificant fraction of the baryons reside in the outskirts of the cluster,and given the presence of significant line-of-sight structure the totallensing mass is also likely overestimated by some fraction. Becker& Kravtsov (2011) demonstrated that up to ∼20% scatter can beexpected for weak-lensing mass measurements in the case of mas-sive galaxy clusters, due to the presence of correlated and uncorre-lated large-scale structures. The impact of these effects is, however,largely limited to large cluster-centric distances (>3 Mpc), well be-yond the value of ∼1 Mpc from the cluster centre to which we mapthe mass distribution of MACSJ0416 in this study.
6.5 Radial Velocities of Cluster Galaxies
As reported in Sect. 6.1, the mass map derived by our joint strong-and weak-lensing analysis reveals four significant mass concentra-tions: the two main merger components, as well as two smallercomponents (labeled S1 and S2 in Fig. 6) detected at more than7σ confidence, that are located about 500 kpc (in projection) fromthe overall centre of the cluster.
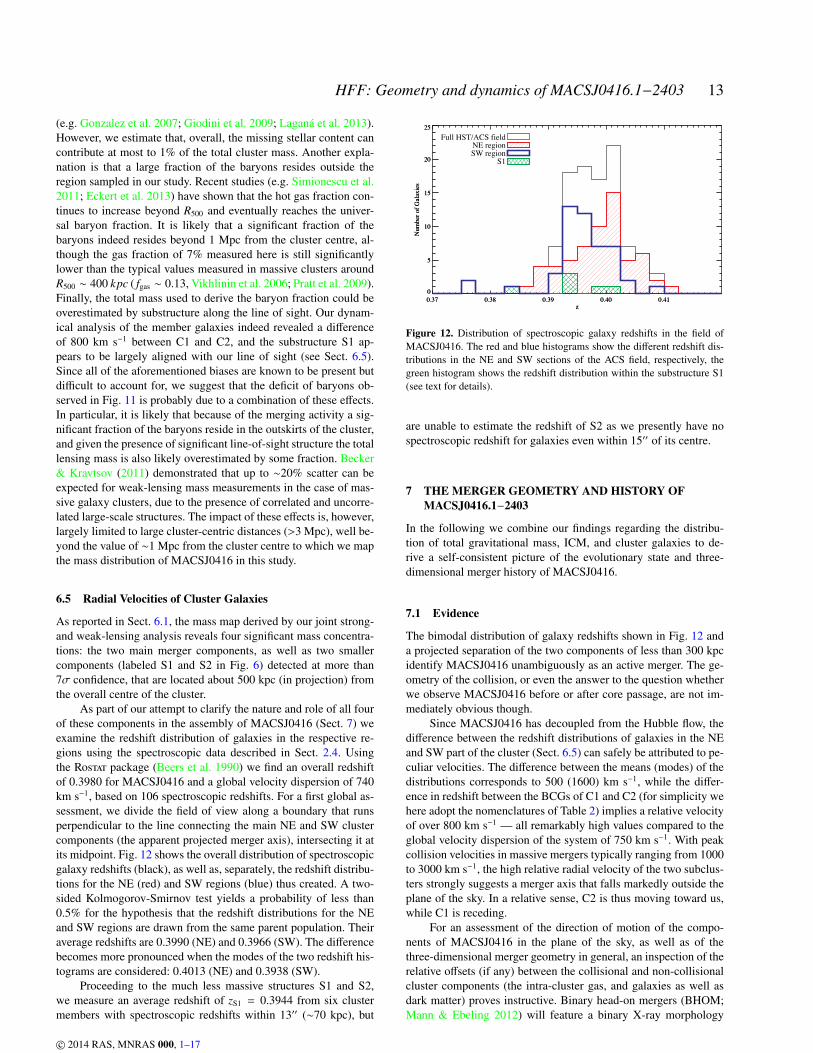
As part of our attempt to clarify the nature and role of all fourof these components in the assembly of MACSJ0416 (Sect. 7) weexamine the redshift distribution of galaxies in the respective re-gions using the spectroscopic data described in Sect. 2.4. Usingthe Rostat package (Beers et al. 1990) we find an overall redshiftof 0.3980 for MACSJ0416 and a global velocity dispersion of 740km s−1, based on 106 spectroscopic redshifts. For a first global as-sessment, we divide the field of view along a boundary that runsperpendicular to the line connecting the main NE and SW clustercomponents (the apparent projected merger axis), intersecting it atits midpoint. Fig. 12 shows the overall distribution of spectroscopicgalaxy redshifts (black), as well as, separately, the redshift distribu-tions for the NE (red) and SW regions (blue) thus created. A two-sided Kolmogorov-Smirnov test yields a probability of less than0.5% for the hypothesis that the redshift distributions for the NEand SW regions are drawn from the same parent population. Theiraverage redshifts are 0.3990 (NE) and 0.3966 (SW). The differencebecomes more pronounced when the modes of the two redshift his-tograms are considered: 0.4013 (NE) and 0.3938 (SW).
Proceeding to the much less massive structures S1 and S2,we measure an average redshift of zS1 = 0.3944 from six clustermembers with spectroscopic redshifts within 13′′ (∼70 kpc), but
0.37 0.38 0.39 0.40 0.41z
0
5
10
15
20
25
Num
ber o
f Gal
axie
s
0.37 0.38 0.39 0.40 0.41z
0
5
10
15
20
25
Num
ber o
f Gal
axie
s
Full HST/ACS fieldNE regionSW region
S1
Figure 12. Distribution of spectroscopic galaxy redshifts in the field ofMACSJ0416. The red and blue histograms show the different redshift dis-tributions in the NE and SW sections of the ACS field, respectively, thegreen histogram shows the redshift distribution within the substructure S1(see text for details).
are unable to estimate the redshift of S2 as we presently have nospectroscopic redshift for galaxies even within 15′′ of its centre.
7 THE MERGER GEOMETRY AND HISTORY OFMACSJ0416.1−2403
In the following we combine our findings regarding the distribu-tion of total gravitational mass, ICM, and cluster galaxies to de-rive a self-consistent picture of the evolutionary state and three-dimensional merger history of MACSJ0416.
7.1 Evidence
The bimodal distribution of galaxy redshifts shown in Fig. 12 anda projected separation of the two components of less than 300 kpcidentify MACSJ0416 unambiguously as an active merger. The ge-ometry of the collision, or even the answer to the question whetherwe observe MACSJ0416 before or after core passage, are not im-mediately obvious though.
Since MACSJ0416 has decoupled from the Hubble flow, thedifference between the redshift distributions of galaxies in the NEand SW part of the cluster (Sect. 6.5) can safely be attributed to pe-culiar velocities. The difference between the means (modes) of thedistributions corresponds to 500 (1600) km s−1, while the differ-ence in redshift between the BCGs of C1 and C2 (for simplicity wehere adopt the nomenclatures of Table 2) implies a relative velocityof over 800 km s−1 — all remarkably high values compared to theglobal velocity dispersion of the system of 750 km s−1. With peakcollision velocities in massive mergers typically ranging from 1000to 3000 km s−1, the high relative radial velocity of the two subclus-ters strongly suggests a merger axis that falls markedly outside theplane of the sky. In a relative sense, C2 is thus moving toward us,while C1 is receding.
For an assessment of the direction of motion of the compo-nents of MACSJ0416 in the plane of the sky, as well as of thethree-dimensional merger geometry in general, an inspection of therelative offsets (if any) between the collisional and non-collisionalcluster components (the intra-cluster gas, and galaxies as well asdark matter) proves instructive. Binary head-on mergers (BHOM;Mann & Ebeling 2012) will feature a binary X-ray morphology
c© 2014 RAS, MNRAS 000, 1–17

14 Jauzac et al. 2014
before the collision, and a more unimodal morphology after (un-less the merger axis falls very close to our line of sight). Offsetsbetween gas and galaxies (and dark matter) will increase through-out the collision, as the non-collisional cluster components proceedunimpeded while the viscous ICM is shocked and slowed duringthe collision. Regardless of the merger axis, these offsets wouldbe apparent in both participants in a BHOM. This is not the casefor MACSJ0416. As shown in Sect. 6.3.1, collisional (gas) andnon-collisional matter (galaxies and dark matter) coincide well forthe NE component (C1 and X1), but are clearly displaced fromeach other (at 7σ significance) for the SW component (C2 andX2). Since non-collisional matter has to lead collisional matter in amerger, we infer that C2 is moving toward C1 (in projection).
An intriguing final piece of evidence is provided by the non-detection of structure S1 by Chandra. The lensing mass of S1 ofMS1(R<110 kpc) = (4.22±0.56)×1013 h−1
70 M (Table 3) is substan-tial, and yet the mass derived for it from the upper limit to its X-rayluminosity of LX<3.9 × 1042 erg s−1 is M2500 < 1013h−1
70 M, basedon the LX–M relation for galaxy groups (Sun et al. 2009; Eckmilleret al. 2011). This apparent conflict, as well as the absence of hotgas in S1 as evinced by our tight upper limit to its gas fraction offgas < 0.007 (see Sect. 6.3.1), are easily explained though if S1 isin fact part of an unvirialised filamentary structure, almost alignedwith our line of sight.
7.2 Tentative merger scenario
From the evidence compiled in the preceding section we concludethat MACSJ0416 is (a) not a BHOM, i.e., the merger proceedsat significant impact parameter, rather than head-on, and (b) thatthe merger axis is greatly inclined with respect to the plane ofthe sky. MACSJ0416 is thus reminiscent of the merging systemMACSJ0358.8−2955 for which Hsu et al. (2013) conclude that thelower-mass component is likely moving along a trajectory that iscurved towards our line of sight. The morphology of MACSJ0416is very similar, except that the offset observed between the gas andthe dark matter in the SW component (X2 and C2) goes in the op-posite way as seen in MACSJ0358.8−2955.
We propose two alternative scenarios for the merger history ofMACSJ0416, both of which are consistent with the present three-dimensional geometry as outlined above3.
Scenario #1: The SW component C2, observed near core pas-sage, moves along a curved trajectory that originates in a large-scale filament, part of which is detected as substructure S1 by ourlensing reconstruction of the mass distribution. Like for C2 itself,the mean redshift of galaxies near S1 of zS1=0.3944 is lower thanthat of the NE cluster C1, implying a radial velocity toward the ob-server of about 1000 km s−1. The SW region of Fig. 6 contains a su-perposition of gas, galaxies, and dark matter from both this putativefilament and C2, and hence the differences between the contours ofgravitational mass, X-ray surface brightness, and cluster light re-flect not only the complex geometry and dynamical history of thissystem, but are also partly the result of the fact that lensing massreconstructions collapse the mass of structures along the entire lineof sight, virialised or not. Since, in this scenario, the merger of C1and C2 resembles a ”fly-by” at the time of observation, the trajec-tory of the SW component has, so far, only grazed the core of the
3 Both of our scenarios are also in qualitative agreement with the one ad-vanced by Diego et al. (2014) who propose that MACSJ0416 is mergingalong an axis that is only mildly inclined with respect to our line of sight.
NE cluster which remains largely undisturbed, while ram pressurecauses a disassociation between the ICM (X2) and the collision-less constituents (C2) of the approaching cluster (as seen in Fig. 6).A sketch of this scenario and of the trajectory of C2 is shown inFig. 13 (dotted line) in a face-on view of the orbital plane.
Scenario #2: The SW component C2 approaches C1 just likein Scenario #1, but it does so for the second time. In this scenario,C2 does not originate in the large-scale filament S1; rather, C2 orig-inally fell toward C1 from the opposite direction, passing the clus-ter core at a significant distance before turning around for its sec-ond approach. The core of C1 has been significantly disturbed bythe earlier passage of C2, but any gas sloshing or shock heating in-duced by this interaction is almost imperceptible from our viewingangle, as the resulting cold fronts or shock fronts are not viewededge-on, but are mainly projected onto the core of C1. The trajec-tory of C2 in this scenario is shown by the solid line in Fig. 13. InScenario #2, filament S1 may be just behind the cluster (along ourline of sight), as indicated in Fig. 13, or far in front of MACSJ0416,well outside the virial regime. The X-ray evidence of multiphasegas in the core region of component C1 (Section 6.3.2) supportsScenario #2 which we thus presently favour.
More speculatively, and based largely on the apparent lack ofa well formed X-ray core, we further propose that the SW compo-nent of MACSJ0416 is undergoing its own (minor) merger event.This second merger in the MACSJ0416 system proceeds again athigh inclination with respect to the plane of the sky, is in the post-collision phase, and greatly disturbed the ICM, leading to the (un-resolved) flat profile around X2. While this potential merger withinthe SW component of MACSJ0416 can be accommodated by eitherof our merger scenarios, it would fit more naturally into Scenario #2in which tidal forces during the first core passage may have aidedthe disruption of C2.
Although the currently available data do not allow us to clearlydistinguish between these speculative scenarios, the tantalisingevidence of shock-heated gas in component C1 (Section 6.3.2)strongly supports Scenario #2. An opportunity to discriminate be-tween Scenarios #1 and #2 will be provided by upcoming deepChandra/ACIS-I observations of MACSJ0416. Ultimately reach-ing a cumulative exposure time of over 300 ks, these observationswill be able to detect the presence of shocked gas near X1, as wellas between X1 and C2 (clear sign of a previous interaction of thetwo components), as well as of cold fronts created by sloshing gasnear X1. Dramatically improved photon statistics will yield ICMdensity and temperature maps also around X2 and stand to revealthe true dynamical history of this complex system.
8 SUMMARY & CONCLUSION
We present a combined X-ray and optical analysis of the massivegalaxy cluster MACSJ0416. Using the deep, high-resolution imag-ing data obtained by the HFF initiative, we model the mass dis-tribution of the cluster over the HST/ACS field of view using agrid-based method that combines both strong- and weak-lensingconstraints. This lensing analysis is complemented by a study ofthe diffuse intra-cluster medium, based on archival (16ks + 37ks)Chandra ACIS-I observation. Finally, we probe the distribution ofmass along the line of sight using spectroscopic redshifts of 106cluster members. We measure the following global properties: anoverall galaxy velocity dispersion of 741 km s−1 and compellingevidence of bulk motions of ∼1000 km s−1 along the line of sight;a total mass of M(R<950 kpc) = (1.15 ± 0.07) × 1015 h−1
70 M; an
c© 2014 RAS, MNRAS 000, 1–17

HFF: Geometry and dynamics of MACSJ0416.1−2403 15
line of sight
C1
C2
S1
Figure 13. Schematic sketch of our hypothesised merger scenarios in a face-on view of the plane of the collision. The dotted red line marks the trajectory ofC2 in our first scenario, in which the system is observed before its first core passage. The solid red line represents the second (preferred) scenario, in which C2has passed C1 and is viewed after turn-around as it approaches the more massive cluster component for the second time. In this second scenario, filament S1plays no significant role in the ongoing merger and may be positioned well before the cluster (along our line of sight), outside the area covered by this sketch.
average mass-to-light ratio of M∗/LK = 0.99 ± 0.03; a gas mass ofMgas(R<1 Mpc) = (8.6±0.7)×1013 h−1
70 M; an ICM temperature ofkT = 11.0+1.4
−1.3 keV; an Fe abundance in the ICM of 0.20+0.09−0.08 Z; and
a baryon fraction of fb(R<1 Mpc) = 0.099 ± 0.008 (5σ below thecosmological value estimated by the Planck mission). Importantly,our multi-wavelength study also constrains the spatial distributionof dark and luminous matter in MACSJ0416 and reveals the pres-ence of a massive (M = (4.22±0.56)×1013 h−1
70 M) but X-ray darkstructure that we associate with a line-of-sight filament.
Using all observational evidence, we attempt to unravel thedynamical state and merger history of MACSJ0416. Central to ourinterpretation is the large offset in radial velocity between the twomain cluster components, the fact that only the SW componentshows a clear offset between collisional and non-collisional mat-ter, and – possibly – our discovery of the aforementioned putativeline-of-sight filament. We propose two alternative merger scenar-ios, the general geometry of which resembles that advanced byHsu et al. (2013) for MACSJ0358.8−2955. Our two scenarios forMACSJ0416 differ from one another primarily with regard to thepre- or post-collision state of the system. In either case, we assume
that the NE component of MACSJ0416 is the more massive one.In our first merger scenario, the trajectory of the approaching SWcomponent is slingshot-like, possibly originating in the aforemen-tioned filament and passing the NE component at a significant im-pact parameter during the imminent first core passage. In our sec-ond scenario, the referred-to filament plays no role in the merger,which is much farther advanced than in our first scenario and infact observed after turnaround of the SW component which nowapproaches the dominant NE component for the second time. Thefirst passage significantly disturbed the core of the NE component,triggering gas sloshing of a modest cool core and shock heating ofthe gaseous ambient ICM. Since our spectral analysis of the ICMin the core region of the NE component finds tentative evidence ofmulti-phase gas, we currently favour this second scenario. Travel-ing along a vector that is highly inclined with respect to the planeof the sky, the SW component appears internally disturbed and maybe undergoing a minor merger of its own, regardless of the chosenscenario.
Our competing hypotheses regarding the merger history ofMACSJ0416 make clear and testable predictions for the X-ray sur-
c© 2014 RAS, MNRAS 000, 1–17

16 Jauzac et al. 2014
face brightness and ICM temperature distribution around the NEcomponent and for the region between the two subclusters. Forth-coming deep Chandra ACIS-I observations of MACSJ0416, ca-pable of detecting the signature of sloshing gas and of tempera-ture variations characteristic of ICM-ICM collisions thus hold greatpromise for a dramatically improved understanding of the forma-tion history of this complex cluster lens.
ACKNOWLEDGMENTS
We thank Stephane Arnouts, Olivier Hilbert, and ChristopheAdami for fruitful discussions. MJ thanks Ian Smail, and JohnStott for their suggestions. We thank Keiichi Umetsu and DanielGruen for sharing some of their results with us for comparison.This work was supported by the Leverhulme Trust (grant num-ber PLP-2011-003) and Science and Technology Facilities Coun-cil (grant number ST/L00075X/1). MJ, ML, and EJ acknowl-edge the Mesocentre d’Aix-Marseille Universite (project num-ber: 14b030). This study also benefited from the facilities of-fered by CeSAM (CEntre de donneeS Astrophysique de Marseille(http://lam.oamp.fr/cesam/). ML acknowledges the CentreNational de la Recherche Scientifique (CNRS) for its support. JRacknowledges support from the ERC starting grant CALENDS andthe CIG grant 294074. JPK and HA acknowledge support fromthe ERC advanced grant LIDA. DH is supported by a STFC stu-dentship. PN acknowledges support from the National ScienceFoundation via the grant AST-1044455, AST-1044455, and a the-ory grant from the Space Telescope Science Institute HST-AR-12144.01-A. RM is supported by the Royal Society. Based on ob-servations made with the NASA/ESA Hubble Space Telescope, ob-tained from the data archive at the Space Telescope Science Insti-tute. STScI is operated by the Association of Universities for Re-search in Astronomy, Inc. under NASA contract NAS 5-26555.
REFERENCES
Arnaud M., Pointecouteau E., Pratt G. W., 2005, A&A, 441, 893Arnouts S., Walcher C. J., Le Fevre O., Zamorani G., Ilbert O., Le
Brun V., Pozzetti L., Bardelli S., Tresse L., Zucca E., Charlot S.,[...] 2007, A&A, 476, 137
Baade D., Meisenheimer K., Iwert O., Alonso J., Augusteijn T.,Beletic J., Bellemann H., Benesch W., Bohm A., Bohnhardt H.,Brewer J., [...] 1999, The Messenger, 95, 15
Becker M. R., Kravtsov A. V., 2011, ApJ, 740, 25Beers T. C., Flynn K., Gebhardt K., 1990, AJ, 100, 32Benıtez N., Ford H., Bouwens R., Menanteau F., Blakeslee
J., Gronwall C., Illingworth G., Meurer G., Broadhurst T. J.,Clampin M., Franx M., Hartig G. F., Magee D., Sirianni M.,Ardila D. R., [...] 2004, ApJS, 150, 1
Bertin E., Arnouts S., 1996, A&A, 117, 393Bond J. R., Kofman L., Pogosyan D., 1996, Nature , 380, 603Bradac M., Clowe D., Gonzalez A. H., Marshall P., Forman W.,
Jones C., Markevitch M., Randall S., Schrabback T., Zaritsky D.,2006, ArXiv Astrophysics e-prints
Bradac M., Allen S. W., Treu T., Ebeling H., Massey R., MorrisR. G., von der Linden A., Applegate D., 2008, ApJ, 687, 959
Bruzual G., Charlot S., 2003, MNRAS, 344, 1000Casertano S., de Mello D., Dickinson M., Ferguson H. C.,
Fruchter A. S., Gonzalez-Lopezlira R. A., Heyer I., Hook R. N.,Levay Z., Lucas R. A., Mack J., Makidon R. B., Mutchler M.,
Smith T. E., Stiavelli M., Wiggs M. S., Williams R. E., 2000, AJ,120, 2747
Cash W., 1979, ApJ, 228, 939Clowe D., De Lucia G., King L., 2004, MNRAS, 350, 1038Coe D., Benıtez N., Sanchez S. F., Jee M., Bouwens R., Ford H.,
2006, AJ, 132, 926Coe D., Bradley L., Zitrin A., 2014, ArXiv e-printsColeman G. D., Wu C.-C., Weedman D. W., 1980, ApJS, 43, 393Diego J. M., Broadhurst T., Molnar S. M., Lam D., Lim J., 2014,
ArXiv e-printsEbeling H., Barrett E., Donovan D., Ma C.-J., Edge A. C., van
Speybroeck L., 2007, ApJ, 661, L33Ebeling H., Edge A. C., Henry J. P., 2001, ApJ, 553, 668Ebeling H., Ma C.-J., Barrett E., 2014, ApJS, 211, 21Ebeling H., White D. A., Rangarajan F. V. N., 2006, MNRAS, 368,
65Eckert D., Ettori S., Molendi S., Vazza F., Paltani S., 2013, A&A,
551, A23Eckert D., Vazza F., Ettori S., Molendi S., Nagai D., Lau E. T.,
Roncarelli M., Rossetti M., Snowden S. L., Gastaldello F., 2012,A&A, 541, A57
Eckmiller H. J., Hudson D. S., Reiprich T. H., 2011, A&A, 535,A105
Elıasdottir A., Fynbo J. P. U., Hjorth J., Ledoux C., Watson D. J.,Andersen A. C., Malesani D., Vreeswijk P. M., Prochaska J. X.,Sollerman J., Jaunsen A. O., 2009, ApJ, 697, 1725
Elıasdottir A., Limousin M., Richard J., Hjorth J., Kneib J.-P.,Natarajan P., Pedersen K., Jullo E., Paraficz D., 2007, ArXiv e-prints, 710
Ettori S., Fabian A. C., 1999, MNRAS, 305, 834Gilmore J., Natarajan P., 2009, MNRAS, 396, 354Giodini S., Pierini D., Finoguenov A., Pratt G. W., COSMOS Col-
laboration 2009, ApJ, 703, 982Gonzalez A. H., Zaritsky D., Zabludoff A. I., 2007, ApJ, 666, 147Gruen D., Seitz S., Kosyra R., Brimioulle F., Koppenhoefer J., Lee
C.-H., Bender R., Riffeser A., Eichner T., Weidinger T., Bier-schenk M., 2013, ArXiv e-prints
Heymans C., Van Waerbeke L., Bacon D., Berge J., Bernstein G.,Bertin E., Bridle S., Brown M. L., Clowe D., Dahle H., Erben T.,Gray M., [...] 2006, MNRAS, 368, 1323
Hsu L.-Y., Ebeling H., Richard J., 2013, MNRAS, 429, 833Ilbert O., Salvato M., Le Floc’h E., Aussel H., Capak P., Mc-
Cracken H. J., Mobasher B., Kartaltepe J., Scoville N., SandersD. B., Arnouts S., Bundy K., [...] 2010, ApJ, 709, 644
Jauzac M., Clement B., Limousin M., Richard J., Jullo E., EbelingH., Atek H., Kneib J.-P., Knowles K., Natarajan P., Eckert D.,Egami E., Massey R., Rexroth M., 2014, MNRAS, 443, 1549
Jauzac M., Jullo E., Kneib J.-P., Ebeling H., Leauthaud A., MaC.-J., Limousin M., Massey R., Richard J., 2012, MNRAS, 426,3369
Johnson T. L., Sharon K., Bayliss M. B., Gladders M. D., Coe D.,Ebeling H., 2014, ArXiv e-prints
Jullo E., Kneib J., 2009, MNRAS, 395, 1319Jullo E., Pires S., Jauzac M., Kneib J.-P., 2014, MNRAS, 437, 3969Kalberla P. M. W., Burton W. B., Hartmann D., Arnal E. M., Ba-
jaja E., Morras R., Poppel W. G. L., 2005, A&A, 440, 775Kinney A. L., Calzetti D., Bohlin R., McQuade K., Storchi-
Bergmann T., Schmitt H., 1996, ApJ, 467, 38Kneib J.-P., Natarajan P., 2011, A&A Rev., 19, 47Kriss G. A., Cioffi D. F., Canizares C. R., 1983, ApJ, 272, 439Lagana T. F., Martinet N., Durret F., Lima Neto G. B., Maughan
B., Zhang Y.-Y., 2013, A&A, 555, A66
c© 2014 RAS, MNRAS 000, 1–17

HFF: Geometry and dynamics of MACSJ0416.1−2403 17
Le Fevre O., Vettolani G., Garilli B., Tresse L., Bottini D., LeBrun V., Maccagni D., Picat J. P., Scaramella R., Scodeggio M.,[. . . ] 2005, A&A, 439, 845
Leauthaud A., George M. R., Behroozi P. S., Bundy K., Tinker J.,Wechsler R. H., Conroy C., Finoguenov A., Tanaka M., 2012,ApJ, 746, 95
Leauthaud A., Massey R., Kneib J., Rhodes J., Johnston D. E.,Capak P., Heymans C., Ellis R. S., Koekemoer A. M., Le FevreO., Mellier Y., [...] 2007, ApJS, 172, 219
Lin Y.-T., Mohr J. J., Gonzalez A. H., Stanford S. A., 2006, ApJ,650, L99
Ma C.-J., Ebeling H., Barrett E., 2009, ApJ, 693, L56Mahdavi A., Hoekstra H., Babul A., Bildfell C., Jeltema T., Henry
J. P., 2013, ApJ, 767, 116Mann A. W., Ebeling H., 2012, MNRAS, 420, 2120Mantz A. B., Allen S. W., Morris R. G., Rapetti D. A., Apple-
gate D. E., Kelly P. L., von der Linden A., Schmidt R. W., 2014,MNRAS, 440, 2077
Massey R., Bacon D., Refregier A., Ellis R., 2002, in N. Metcalfe& T. Shanks ed., A New Era in Cosmology Vol. 283 of Astro-nomical Society of the Pacific Conference Series, Cosmic Shearwith Keck: Systematic Effects. p. 193
Massey R., Heymans C., Berge J., Bernstein G., Bridle S., CloweD., Dahle H., Ellis R., Erben T., Hetterscheidt M., High F. W.,Hirata C., [...] 2007, MNRAS, 376, 13
Massey R., Stoughton C., Leauthaud A., Rhodes J., KoekemoerA., Ellis R., Shaghoulian E., 2010, MNRAS, 401, 371
Merten J., Coe D., Dupke R., Massey R., Zitrin A., Cypriano E. S.,Okabe N., Frye B., Braglia F. G., Jimenez-Teja Y., Benıtez N.,[...] 2011, MNRAS, 417, 333
Metzler C. A., Evrard A. E., 1994, ApJ, 437, 564Nagai D., Vikhlinin A., Kravtsov A. V., 2007, ApJ, 655, 98Natarajan P., Kneib J.-P., 1997, MNRAS, 287, 833Nelson K., Rudd D. H., Shaw L., Nagai D., 2012, ApJ, 751, 121Nulsen P. E. J., McNamara B. R., Wise M. W., David L. P., 2005,
ApJ, 628, 629Planck Collaboration Ade P. A. R., Aghanim N., Armitage-Caplan
C., Arnaud M., Ashdown M., Atrio-Barandela F., Aumont J.,Baccigalupi C., Banday A. J., et al. 2013, ArXiv e-prints
Postman M., Coe D., Benıtez N., Bradley L., Broadhurst T., Don-ahue M., Ford H., Graur O., Graves G., Jouvel S., KoekemoerA., Lemze D., Medezinski E., Molino A., Moustakas L., OgazS., [...] 2012, ApJS, 199, 25
Pratt G. W., Croston J. H., Arnaud M., Bohringer H., 2009, A&A,498, 361
Rasia E., Mazzotta P., Evrard A., Markevitch M., Dolag K.,Meneghetti M., 2011, ApJ, 729, 45
Rasia E., Meneghetti M., Martino R., Borgani S., Bonafede A.,Dolag K., Ettori S., Fabjan D., Giocoli C., Mazzotta P., MertenJ., Radovich M., Tornatore L., 2012, New Journal of Physics, 14,055018
Rhodes J., Refregier A., Groth E. J., 2000, ApJ, 536, 79Rhodes J. D., Massey R. J., Albert J., Collins N., Ellis R. S., Hey-
mans C., Gardner J. P., Kneib J.-P., Koekemoer A., LeauthaudA., Mellier Y., Refregier A., Taylor J. E., Van Waerbeke L., 2007,ApJS, 172, 203
Richard J., Jauzac M., Limousin M., Jullo E., Clement B., EbelingH., Kneib J.-P., Atek H., Natarajan P., Egami E., Livermore R.,Bower R., 2014, MNRAS, 444, 268
Rix H.-W., Barden M., Beckwith S. V. W., Bell E. F., Borch A.,Caldwell J. A. R., Haussler B., Jahnke K., Jogee S., McIntoshD. H., Meisenheimer K., Peng C. Y., Sanchez S. F., Somerville
R. S., Wisotzki L., Wolf C., 2004, ApJS, 152, 163Schirmer M., Carrasco R., Pessev P., Garrel V., Winge C., Neichel
B., Vidal F., 2014, ArXiv e-printsSimionescu A., Allen S. W., Mantz A., Werner N., Takei Y., Mor-
ris R. G., Fabian A. C., Sanders J. S., Nulsen P. E. J., GeorgeM. R., Taylor G. B., 2011, Science, 331, 1576
Skilling J., 1998, in G. J. Erickson, J. T. Rychert, & C. R. Smithed., Maximum Entropy and Bayesian Methods Massive Infer-ence and Maximum Entropy. pp 1–+
Smith R. K., Brickhouse N. S., Liedahl D. A., Raymond J. C.,2001, ApJ, 556, L91
Soucail G., Mellier Y., Fort B., Mathez G., Cailloux M., 1988,A&A, 191, L19
Sun M., Voit G. M., Donahue M., Jones C., Forman W., VikhlininA., 2009, ApJ, 693, 1142
Umetsu K., Medezinski E., Nonino M., Merten J., Postman M.,Meneghetti M., Donahue M., Czakon N., [...] 2014, ArXiv e-prints
Vikhlinin A., Kravtsov A., Forman W., Jones C., Markevitch M.,Murray S. S., Van Speybroeck L., 2006, ApJ, 640, 691
Zitrin A., Meneghetti M., Umetsu K., Broadhurst T., BartelmannM., Bouwens R., Bradley L., Carrasco M., Coe D., Ford H., Kel-son D., Koekemoer A. M., Medezinski E., Moustakas J., Mous-takas L. A., [...] 2013, ApJ, 762, L30
c© 2014 RAS, MNRAS 000, 1–17