the gems inquirergraphics8.nytimes.com/packages/pdf/business/20emerge-merrill.pdf · as a result,...
TRANSCRIPT

BofA Merrill Lynch does and seeks to do business with companies covered in its research reports. As a result, investors should be aware that the firm may have a conflict of interest that could affect the objectivity of this report. Investors should consider this report as only a single factor in making their investment decision. Refer to important disclosures on page 25 to 27. Link to Definitions on page 24. 11359679
The GEMs Inquirer Equity Strategy
Pig in the Python – the EM carry trade unwind
Equity Strategy | Global Emerging Markets 18 February 2014
Ajay Singh Kapur, CFA +852 2161 7753 Equity Strategist Merrill Lynch (Hong Kong) [email protected] Ritesh Samadhiya, CFA +852 2161 7907 Equity Strategist Merrill Lynch (Hong Kong) [email protected] Umesha de Silva +852 2161 7306 Equity Strategist Merrill Lynch (Hong Kong) [email protected]
What the Fed giveth, the Fed taketh away
The US Fed’s modus operandi worked through asset prices, and animal spirits. This involved getting stock prices up, getting corporate animal spirits up by issuing cheap debt, buying back stock with cash or cheap debt to raise EPS, lowering government borrowing and mortgage costs, and raising consumer net worth/income ratios. Also, asset bubbles were generated in emerging markets, raising their growth, labor costs and currencies. These policies made plutonomists (rich folks) richer and exacerbated income and wealth inequality. If QE is coming to an end, ideas that worked since end-2008 should be questioned.
QE and the Emerging Markets carry trade The QE channel worked through Emerging Markets too. By lowering the US government bond yields to a bare minimum, and zero–ish at the short end, a search for yield ensued globally. Emerging market banks and corporates have gone on an international leverage binge, yet another carry trade, the third in 20 years. The first one was driven by European banks, financing East Asian capex – that ended in 1997. The second one was global banks and equity-FDI supporting mainly capex in the BRICs. That ended in 2008. This time, it is increasingly non-equity flows: commercial banks and, more importantly, the bond market – undercounted in the BoP and external debt statistics that conventional analysis looks at.
Fed’s cheap money =>external debt binge by EMs=> rise in forex reserves=>base money=>credit/M2 growth=>asset inflation. Possible reversal as QE tapers Since 3Q2008, the US Federal Reserve QE has unleashed a massive USD2tn debt-driven carry trade into emerging markets, disproportionately increasing their forex reserves (by USD2.7tn from end-3Q2008), their monetary bases (by USD3.2tn), their credit and monetary aggregates (M2 up by USD14.9tn), consequently boosting economic growth and asset prices (mainly property and bonds). As the Fed continues to taper its heterodox policy, we believe these large carry trades are likely to diminish, or be unwound. Ext EM debt undercounted by USD318bn (44%) since Sept ’08 Most standard analysis on the balance of payments recognizes external debt as issued by residence, not by the nationality of the issuer. Given the proliferation of EM banks and corporates borrowing in offshore bond and inter-bank markets, and using BIS data, we rectify for this. It makes a huge difference, in our view. For externally-issued bonds, USD1042bn has been raised by the nationality of the EM borrower since 2009, USD724bn by residence of the borrower – a gap of USD318bn, or 44%. This undercount is USD165bn in China, USD100bn in Brazil, and USD62bn in Russia. External bond-issuing EM non-financial corporates are behaving as quasi-financial intermediaries, executors of a vast carry trade.
Confidence is a fragile membrane Not only does the Fed’s balance sheet matter as a source of funds, but so does the attractiveness of the recipient of the carry trade – and trust in its collateral. China is a case in point. We believe carry-trade driven EM asset prices remain at risk, are a global deflationary threat, could drive defensive asset bids, and competitive devaluations.
Un
auth
ori
zed
red
istr
ibu
tio
n o
f th
is r
epo
rt is
pro
hib
ited
.T
his
rep
ort
is in
ten
ded
fo
r am
and
a.le
un
g@
bam
l.co
m.

The GEMs Inqu i re r 18 February 2014
2
Pig in the Python: The EM carry trade unwind
The long-term emerging market equity story is the story of wars. Since 1880, periods of war-driven commodity price escalation were periods of emerging market equity outperformance. Otherwise, EM equities were a disappointment. The 2002-2008 commodity boom driven not by war, but a one-off capex boom in China, is an exception. We believe investors often confuse waves of capital inflows into emerging markets - when global monetary conditions are permissive and the consequent asset inflation and credit booms - with some fundamentally-driven intrinsic “growth” theme in emerging markets. There are many ebullient investment ideas we have heard over the past 25 years: the massive infrastructure theme, the growing middle class, the nutrition/water idea, the urbanization meme, the emergence of this sub-region or the other. We remain skeptical and cynical. Eventually, these glossy investment views have run into tighter global monetary conditions, the inevitable crises, large capital losses and vows of “never again”. Until, of course, the next global monetary easing, when all is forgiven, and a fresh wave of investors wades in again.
In each cycle, risk morphs – we repeat the mistakes of our grandfathers, not our fathers. Here, we highlight the significant role that the US Federal Reserve QE has played in unleashing a massive USD2tn debt-oriented carry trade into emerging markets, disproportionately increasing their forex reserves (by USD2.7tn from end-3Q2008), their monetary bases (by USD3.2tn), their credit and monetary aggregates (M2 up by USD14.9tn), and consequently boosting economic growth and asset prices (mainly property and bonds). As the Fed continues to taper its heterodox policy, these large carry trades are likely to diminish, or be unwound. Everything else being equal, the cycle is likely to go in reverse. Obviously, for those markets with current account deficits and a liquidity/forex mismatch, life will be even tougher. Some EMs – not mainstays among investors – the Ukraine, Argentina, Kazakhstan, Venezuela, Ghana – are already experiencing this.
However, as important recent research from the Bank of England suggests1, it is not only countries with current account deficits that are vulnerable. Even in countries with an external balance, if enough corporates and/or banks play a large enough carry trade, issuing foreign currency debt to invest at home or abroad, this exposes their home government – it is the size of the gross external debt that matters and exposes these carry-trade players to rollover risk. As an example, they cite Germany before the global financial crisis – a current account surplus country with no housing bubble. Still, some German banks were exposed to long-maturity US securitized residential assets, financed by short-term wholesale US funding markets. Most standard analysis on the balance of payments recognizes external debt as issued by residence, not by the nationality of the issuer. That is, if an Indian firm borrows USD debt from a foreign bank branch in Mumbai, that is counted in the BoP, but if it raises a USD bond in London, it is not. Given the proliferation of EM banks and corporates borrowing in
1 1 See “The Role of external balance sheets in the financial crisis”, Yaser Al-Saffar, Wolfgang Ridinger and Simon Whitaker. BOE, Financial Stability Paper No. 24, October 2013.

The GEMs Inqu i re r 18 February 2014
3
offshore bond and inter-bank markets, and using BIS data, we rectify for this.2 It makes a huge difference. For externally-issued bonds, USD1042bn has been raised by the nationality of the EM borrower since 2009, USD724bn by residence of the borrower – a gap of USD318bn, or 44%. This undercount is USD165bn in China, USD100bn in Brazil, and USD62bn in Russia. There is evidence that this bond borrowing overseas by EM non-financial corporates is part of a carry trade, with these corporates acting like financial intermediaries3. EM banks have also been busy issuing bonds overseas, a part of this carry trade. We do not have the breakdown for international bank loans by residence and nationality.
What the Fed giveth, the Fed taketh away
Before we dive into the EM aspect of the Fed’s QE policy, a quick look at the Fed’s objectives, and success so far. As Prof. Bernanke wrote about QE in his Washington Post piece on 5th November 2010: “This approach eased financial conditions in the past and, so far, looks to be effective again. Stock prices rose and long-term interest rates fell when investors began to anticipate this additional action. Easier financial conditions will promote economic growth. For example, lower mortgage rates will make housing more affordable and allow more homeowners to refinance. Lower corporate bond rates will encourage investment. And higher stock prices will boost consumer wealth and help increase confidence, which can also spur spending. Increased spending will lead to higher incomes and profits that, in a virtuous circle, will further support economic expansion.”
The Fed’s reaction function, or modus operandi, worked through asset prices, and animal spirits. This involved getting stock prices up (Figure 1), getting corporate animal spirits up by issuing cheap debt (Figure 2), buying back stock with cash or cheap debt to raise EPS (Figure 3), lowering government borrowing costs and mortgage costs (Figure 4), and raising consumer net worth/income ratios (Figure 5). And generating asset bubbles in emerging markets, boosting growth and appreciating their currencies. Of course, most of these policies made plutonomists (rich folks) richer and exacerbate income and wealth inequality. Figure 6 shows this impact through luxury goods stocks – they have done exceptionally well – thanks to the success of QE, and plutonomists being a key vehicle of this monetary policy transmission. While cynicism abounds about the Fed’s heterodox policies, all these objectives were achieved.
2 See Philip Turner, “The global long-term interest rate, financial risks and policy choices in EEMEs”, BIS working Papers 441, February 2014,pg 5. Also, Hyun Song Shin et. al., Global Liquidity through the lens of Monetary Aggregates, IMF Working Paper, January 2014. 3 See Hyun Song Shin and Laura Zhao “Firms as surrogate intermediaries?: Evidence from emerging economies”, Princeton University, December 2013

The GEMs Inqu i re r 18 February 2014
4
Figure 1: The power of QE I – on US stock prices
Source: BofA Merrill Lynch Global Research, Federal Reserve Board, MSCI
Figure 2: The power of QE – reducing corporate bond spreads…
Source: BofA Merrill Lynch Global Research, Federal Reserve Board
Figure 3: ...driving corporate bond issuance, equity buybacks
Source: BofA Merrill Lynch Global Research, Federal Reserve Board
Figure 4: QE and lower mortgage spreads
Source: BofA Merrill Lynch Global Research, Bloomberg
Figure 5: The revival of US household balance sheets
Source: BofA Merrill Lynch Global Research, Federal Reserve Board
Figure 6: QE’s big winners – plutonomists (rich people) and luxury stocks
Source: BofA Merrill Lynch Global Research, Federal Reserve Board, Factset. Plutonomy stocks refer to luxury stocks e.g. Ferragamo, Hermes, Porsche.
0.00.51.01.52.02.53.03.54.04.5
400600800
1,0001,2001,4001,6001,800
1/95 1/98 1/01 1/04 1/07 1/10 1/13
MSCI US, LS US Fed total assets (USDtr), RS
0.0
1.0
2.0
3.0
4.0
5.0100
200
300
400
500
600
700
1/95 1/98 1/01 1/04 1/07 1/10 1/13
US corporate BAA 10y spread (inverted scale),LS
US Fed total assets (USDtr), RS
-4
-3
-2
-1
0
1
2
3
4
-4
-3
-2
-1
0
1
2
3
4
12/52 12/62 12/72 12/82 12/92 12/02 12/12
Equity Bonds
US nonfinancial corporate, net new issues (4Q sum, US$ tr)
0.0
1.0
2.0
3.0
4.0
5.0
-2.5
-2.0
-1.5
-1.0
-0.5
0.01/95 1/98 1/01 1/04 1/07 1/10 1/13
Spread between yields on 10y Treasuries and Fannie'scurrent-coupon 30y fixed-rate mortgage securities, LSUS Fed total assets (USDtr), RS
0.0
1.0
2.0
3.0
4.0
5.0
500
550
600
650
700
1/95 1/98 1/01 1/04 1/07 1/10 1/13Household net worth as % of disposable personal income,LSUS Fed total assets (USDtr), RS
0.0
1.0
2.0
3.0
4.0
5.0
0100200300400500600700
1/95 1/98 1/01 1/04 1/07 1/10 1/13
Plutonomy stocks, LS
US Fed total assets (USDtr), RS
The GEMs Inqu i re r 18 February 2014
5
QE and the Emerging Markets carry trade
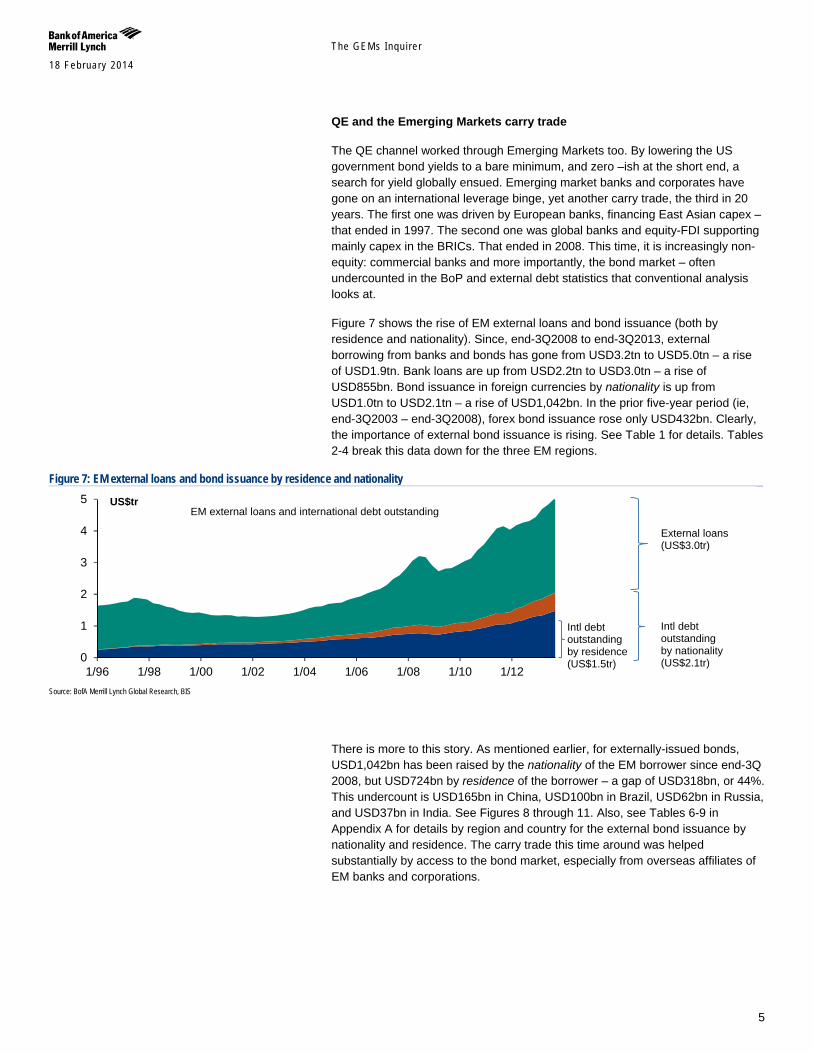
The QE channel worked through Emerging Markets too. By lowering the US government bond yields to a bare minimum, and zero –ish at the short end, a search for yield globally ensued. Emerging market banks and corporates have gone on an international leverage binge, yet another carry trade, the third in 20 years. The first one was driven by European banks, financing East Asian capex – that ended in 1997. The second one was global banks and equity-FDI supporting mainly capex in the BRICs. That ended in 2008. This time, it is increasingly non-equity: commercial banks and more importantly, the bond market – often undercounted in the BoP and external debt statistics that conventional analysis looks at.
Figure 7 shows the rise of EM external loans and bond issuance (both by residence and nationality). Since, end-3Q2008 to end-3Q2013, external borrowing from banks and bonds has gone from USD3.2tn to USD5.0tn – a rise of USD1.9tn. Bank loans are up from USD2.2tn to USD3.0tn – a rise of USD855bn. Bond issuance in foreign currencies by nationality is up from USD1.0tn to USD2.1tn – a rise of USD1,042bn. In the prior five-year period (ie, end-3Q2003 – end-3Q2008), forex bond issuance rose only USD432bn. Clearly, the importance of external bond issuance is rising. See Table 1 for details. Tables 2-4 break this data down for the three EM regions.
Figure 7: EM external loans and bond issuance by residence and nationality
Source: BofA Merrill Lynch Global Research, BIS
There is more to this story. As mentioned earlier, for externally-issued bonds, USD1,042bn has been raised by the nationality of the EM borrower since end-3Q 2008, but USD724bn by residence of the borrower – a gap of USD318bn, or 44%. This undercount is USD165bn in China, USD100bn in Brazil, USD62bn in Russia, and USD37bn in India. See Figures 8 through 11. Also, see Tables 6-9 in Appendix A for details by region and country for the external bond issuance by nationality and residence. The carry trade this time around was helped substantially by access to the bond market, especially from overseas affiliates of EM banks and corporations.
0
1
2
3
4
5
1/96 1/98 1/00 1/02 1/04 1/06 1/08 1/10 1/12
US$tr
Intl debt outstanding by residence (US$1.5tr)
Intl debt outstanding by nationality (US$2.1tr)
External loans (US$3.0tr)
EM external loans and international debt outstanding

The GEMs Inqu i re r 18 February 2014
6
Figure 8: China: Big gap between external bonds issued by nationality and residence
Source: BofA Merrill Lynch Global Research, BIS
Figure 9: Russia: Big gap between external bonds issued by nationality and residence
Source: BofA Merrill Lynch Global Research, BIS
Figure 10: Brazil: Big gap between external bonds issued by nationality and residence
Source: BofA Merrill Lynch Global Research, BIS
0100200300400500600700800900
1/96 1/98 1/00 1/02 1/04 1/06 1/08 1/10 1/12
US$bn
External loans (US$609bn)
China external loans and international debt outstanding
Intl debt outstanding by residence (US$48.6bn)
Intl debt outstanding by nationality (US$239.7bn)
050
100150200250300350400450
1/96 1/98 1/00 1/02 1/04 1/06 1/08 1/10 1/12
US$bn
External loans (US$160.3bn)
Russia external loans and international debt outstanding
Intl debt outstanding by residence (US$123.7bn)
Intl debt outstanding by nationality (US$263.4bn)
050
100150200250300350400450500
1/96 1/98 1/00 1/02 1/04 1/06 1/08 1/10 1/12
US$bn
External loans (US$190.4bn)
Brazil external loans and international debt outstanding
Intl debt outstanding by residence (US$154.6bn)
Intl debt outstanding by nationality (US$296.4bn)

The GEMs Inqu i re r 18 February 2014
7
Figure 11: India: Big gap between external bonds issued by nationality and residence
Source: BofA Merrill Lynch Global Research, BIS
Table 1: EMs – Big rise in external BOND issuance (by nationality) since QE. USD1,042bn from 3Q2008 to 3Q2013 vs USD432bn in prior 5 year period
2009 2010 2011 2012 31-Dec-12 to 30-Sep-13
5 years prior to easing (30-Sep-03 to 30-Sep-
08)
Since Fed began easing (30-Sep-08 to
30-Sep-13)
Outstanding as at 30-Sep-08
Outstanding as at 30-Sep-13
US$bn Bank
lending Bonds
Bank lending
Bonds Bank
lending Bonds
Bank lending
Bonds Bank
lending Bonds Total
Bank lending
Bonds Total Bank
lending Bonds Total
Bank lending
Bonds Bank
lending Bonds
EM (incl. HK and SG) -96 96 470 171 298 180 58 363 375 257 632 1,097 432 1,530 855 1,042 1,898 2,152 1,019 2,992 2,051 Banks -85 0 388 47 165 55 2 132 239 68 307 733 107 841 497 296 794 1,459 170 1,949 465 Corp, govt, other fin. -11 96 81 124 133 124 56 230 136 189 325 364 325 689 358 746 1,104 693 849 1,043 1,585
Asia ex-Japan -26 42 383 64 251 91 66 151 340 151 491 624 194 818 819 484 1,304 1,360 434 2,163 921 Banks -39 1 302 11 151 33 8 46 229 45 275 480 48 527 482 132 614 1,085 89 1,556 221 Corp, govt, other fin. 13 41 81 52 100 58 58 105 110 106 216 144 147 291 337 353 690 275 345 607 699
EMEA -56 16 12 53 -7 26 -13 108 36 43 79 369 196 566 -63 241 178 537 336 474 568 Banks -36 -5 38 16 -15 6 -8 51 15 10 25 205 55 260 -36 78 42 265 58 233 135 Corp, govt, other fin. -20 21 -26 37 8 19 -5 57 21 33 54 164 142 306 -27 163 136 272 277 240 433
LatAm -14 38 74 54 54 63 5 104 -1 63 63 104 41 145 99 317 416 255 249 356 562 Banks -11 3 49 19 28 16 3 35 -6 13 7 49 5 54 51 87 138 108 23 160 109 Corp, govt, other fin. -4 34 26 35 25 47 2 69 5 50 55 55 37 92 48 231 278 147 226 196 453
Source: BofA Merrill Lynch Global Research, BIS
There are a lot of moving parts in the balance of payments that finally affect the change in international reserves at any EM central bank – eg, the current account, portfolio equity investment and direct equity investment, and debt flows – both from the bond market and lending from banks. We focus on the link between these debt flows and the international reserves in emerging markets. As Table 1 above shows, the EM external debt – from bond issuance and forex borrowing from banks – rose USD1.9tn during 3Q08-3013. We posit that this large rise was in part driven by the carry trade offered up by QE – EM banks and corporates issued substantial forex-denominated bonds, and borrowed straight loans from international banks. We recognize the caveat that correlation does not imply causation. The USD1.9tn rise in EM debt issuance is highly correlated to the Fed’s balance sheet since late-2008. As Figure 12 shows, the rise in EM debt issuance of USD 1.9tn is in line with the rise in their international reserves of USD2.7tn since late-2008 (of course, we recognize that many different factors affect the BOP, and the level of international reserves apart from debt flows). Also, as Figure 12 shows, the USD2.7tn rise in EM international reserves mirrors the rise of USD3.2tn in the EM monetary base. It’s as if the rise of net foreign assets on the asset side of EM central banks translated one-for-one with the monetary base – a liability item on their balance sheet, and the rest of the
0
50
100
150
200
250
1/96 1/98 1/00 1/02 1/04 1/06 1/08 1/10 1/12
US$bn
External loans (US$171.7bn)
India external loans and international debt outstanding
Intl debt outstanding by residence (US$23.2bn)
Intl debt outstanding by nationality (US$74.2bn)

The GEMs Inqu i re r 18 February 2014
8
balance sheet items cancelled each other out. Lastly, the rise of the EM monetary base of USD3.2tn correlates well with the USD14.9tn rise in EM broad money expansion.
So, to summarize: the Fed’s QE policy reduced USD interest rates across the curve. This compelled EM borrowers – banks, non-bank financials, and corporates – to engage in a large carry trade, borrowing in foreign currencies at low rates, and re-investing domestically at higher local rates. Of course, they could simply have used the borrowed forex proceeds offshore to make real investments overseas, or to hedge forex receivables. Our experience tells us to be suspect of this innocent use of funds: we believe EM entities execute carry trade opportunities with a ferocity that only becomes clear when the carry reverses. The rise in EM debt issuance correlates well with the rise in EM international reserves, the EM monetary base, and in EM M2 from 3Q2008 to 2013. See Table 5 for details by emerging markets regions.
Table 2: Asia: Big rise in external bond issuance (by nationality) since QE, mainly China and Thailand
Asia ex-Japan 2009 2010 2011 2012 Jan - Sept 2013 5 years prior to
easing (30-Sep-03 to 30-Sep-08)
Since Fed began easing (30-Sep-08 to
30-Sep-13)
Outstanding as at 30-Sep-08
Outstanding as at 30-Sep-13
US$bn
Ban
k le
ndin
g
Bon
ds
Ban
k le
ndin
g
Bon
ds
Ban
k le
ndin
g
Bon
ds
Ban
k le
ndin
g
Bon
ds
Ban
k le
ndin
g
Bon
ds
Tota
l
Ban
k le
ndin
g
Bon
ds
Tota
l
Ban
k le
ndin
g
Bon
ds
Tota
l
Ban
k le
ndin
g
Bon
ds
Ban
k le
ndin
g
Bon
ds
Asia ex-Japan 10.4 1.0 128.0 24.8 250.6 90.9 66.2 150.9 339.7 151.2 490.8 624.1 194.4 818.5 819.4 484.4 1,303.8 1,359.9 434.1 2,162.8 920.6 Banks 9.7 0.0 102.0 4.3 151.0 32.6 8.2 46.1 229.4 45.3 274.6 479.6 47.7 527.4 482.2 131.8 614.0 1,085.2 88.7 1,555.7 221.4 US$bn 0.7 1.0 26.1 20.5 99.6 58.3 58.0 104.8 110.3 105.9 216.2 144.5 146.6 291.1 337.1 352.6 689.7 274.6 345.5 607.1 699.2
China 10.4 1.0 128.0 24.8 121.3 45.6 30.3 54.7 220.3 65.1 285.4 92.6 28.1 120.7 464.2 190.8 655.0 161.0 46.0 609.0 239.7 Banks 9.7 0.0 102.0 4.3 69.4 14.1 -10.7 17.4 152.2 20.5 172.8 59.1 2.9 62.0 285.5 56.1 341.6 111.1 5.5 384.8 62.4 Corp, govt, other fin. 0.7 1.0 26.1 20.5 51.9 31.5 41.0 37.3 68.1 44.6 112.6 33.4 25.3 58.7 178.7 134.6 313.4 49.9 40.5 224.3 177.3
Hong Kong 4.5 10.2 103.5 7.8 42.2 0.6 -8.5 26.6 54.0 4.9 59.0 121.2 24.5 145.7 177.9 48.6 226.5 287.4 68.5 461.6 117.1 Banks 3.8 1.9 82.9 0.8 24.2 -0.2 -12.5 1.1 34.1 0.9 35.1 83.9 2.9 86.8 120.7 4.6 125.2 223.0 4.6 342.4 9.3 Corp, govt, other fin. 0.7 8.3 20.6 6.9 18.0 0.8 4.0 25.5 19.9 4.0 23.9 37.3 21.7 58.9 57.2 44.0 101.3 64.4 63.9 119.2 107.8
India -2.7 2.8 40.6 3.4 20.9 6.3 5.6 5.2 -4.1 13.0 8.9 84.3 35.9 120.2 53.6 31.4 85.0 117.3 42.8 171.7 74.2 Banks -3.2 -0.5 23.0 2.6 9.7 4.1 -9.0 5.8 0.1 3.4 3.5 53.4 14.0 67.4 13.2 15.1 28.3 71.5 16.5 86.3 31.6 Corp, govt, other fin. 0.4 3.3 17.6 0.8 11.2 2.2 14.6 -0.6 -4.1 9.6 5.4 30.8 21.9 52.8 40.4 16.3 56.6 45.8 26.3 85.4 42.6
Indonesia 1.9 10.6 9.9 4.3 6.1 4.0 3.7 11.5 5.3 16.2 21.4 10.5 14.4 24.9 21.9 46.3 68.2 43.0 23.4 63.8 69.6 Banks 0.6 0.1 4.7 0.0 1.7 0.0 -8.1 1.0 2.2 0.6 2.8 8.3 -1.3 6.9 -2.5 1.6 -0.9 21.9 0.6 20.0 2.2 Corp, govt, other fin. 1.2 10.5 5.2 4.3 4.4 4.0 11.7 10.5 3.1 15.5 18.6 2.3 15.8 18.0 24.4 44.7 69.1 21.1 22.7 43.8 67.4
Korea 13.8 18.5 -9.2 7.7 9.4 20.1 -21.7 17.3 7.2 12.4 19.6 101.5 50.8 152.4 -49.4 67.8 18.4 171.5 113.0 121.1 178.6 Banks 9.6 4.6 -9.6 0.6 6.8 6.8 -9.7 6.6 2.7 7.2 9.9 86.9 18.1 105.0 -44.7 22.9 -21.8 146.6 36.7 101.1 59.3 Corp, govt, other fin. 4.2 13.9 0.3 7.1 2.5 13.4 -12.0 10.7 4.5 5.2 9.7 14.7 32.7 47.4 -4.7 44.9 40.2 24.9 76.2 20.1 119.3
Malaysia 0.3 0.6 2.6 5.6 6.5 0.9 -0.5 10.0 12.1 3.7 15.8 6.6 10.4 17.0 12.1 20.2 32.3 34.5 33.2 47.7 52.8 Banks -0.3 -1.1 1.4 -0.1 3.7 1.1 7.4 3.4 10.4 0.5 10.9 4.8 1.9 6.8 16.0 3.7 19.6 23.1 3.6 38.4 7.3 Corp, govt, other fin. 0.6 1.6 1.2 5.7 2.9 -0.2 -7.9 6.6 1.7 3.1 4.8 1.8 8.5 10.3 -3.9 16.6 12.7 11.4 29.5 9.2 45.5
Philippines -0.3 4.3 6.6 3.4 0.2 1.6 2.7 3.5 1.4 1.1 2.6 -0.9 6.1 5.3 9.3 13.7 23.0 15.2 32.0 24.1 45.9 Banks -0.1 0.2 4.7 0.5 0.3 -0.2 2.2 0.9 -1.0 -0.1 -1.1 -1.8 0.6 -1.2 5.5 1.1 6.6 6.9 1.4 12.0 2.6 Corp, govt, other fin. -0.2 4.1 1.9 2.9 -0.1 1.8 0.4 2.6 2.4 1.2 3.6 0.9 5.5 6.5 3.8 12.6 16.4 8.3 30.5 12.1 43.3
Singapore -54.1 -0.4 63.6 3.9 37.1 8.9 47.1 15.5 1.2 13.9 15.0 190.4 26.6 217.1 50.1 40.4 90.5 454.2 51.0 506.4 93.0 Banks -58.8 -2.2 62.2 1.6 32.1 7.0 35.5 7.0 -6.0 11.1 5.0 172.1 7.6 179.7 20.4 23.8 44.3 422.4 15.0 443.3 39.3 Corp, govt, other fin. 4.6 1.9 1.4 2.3 5.0 1.9 11.6 8.6 7.2 2.8 10.0 18.3 19.0 37.4 29.6 16.6 46.2 31.8 36.1 63.1 53.7
Taiwan -2.9 -4.2 26.5 1.4 8.1 1.7 -5.9 0.2 33.0 3.3 36.3 21.0 -2.0 19.0 43.9 0.3 44.2 59.1 15.1 104.4 15.5 Banks -2.8 -0.7 22.7 0.2 5.2 -0.2 -1.5 0.0 31.1 0.5 31.5 15.7 0.8 16.4 41.8 -0.3 41.5 48.6 1.8 91.6 1.6 Corp, govt, other fin. -0.1 -3.5 3.8 1.2 2.9 1.8 -4.4 0.2 2.0 2.8 4.8 5.3 -2.8 2.5 2.1 0.6 2.7 10.5 13.3 12.9 14.0
Thailand 3.6 -1.2 11.0 1.2 -1.2 1.1 13.5 6.4 9.2 17.6 26.9 -3.2 -0.6 -3.8 35.8 24.8 60.6 16.7 9.3 52.9 34.4 Banks 2.9 -0.9 7.8 0.6 -2.2 0.1 14.6 2.9 3.6 0.5 4.1 -2.8 0.3 -2.5 26.3 3.2 29.4 10.2 2.8 35.8 5.9 Corp, govt, other fin. 0.7 -0.3 3.2 0.6 1.0 1.1 -1.1 3.5 5.6 17.1 22.8 -0.4 -0.9 -1.3 9.5 21.6 31.1 6.6 6.5 17.0 28.5
Source: BofA Merrill Lynch Global Research, BIS
The GEMs Inqu i re r 18 February 2014
9
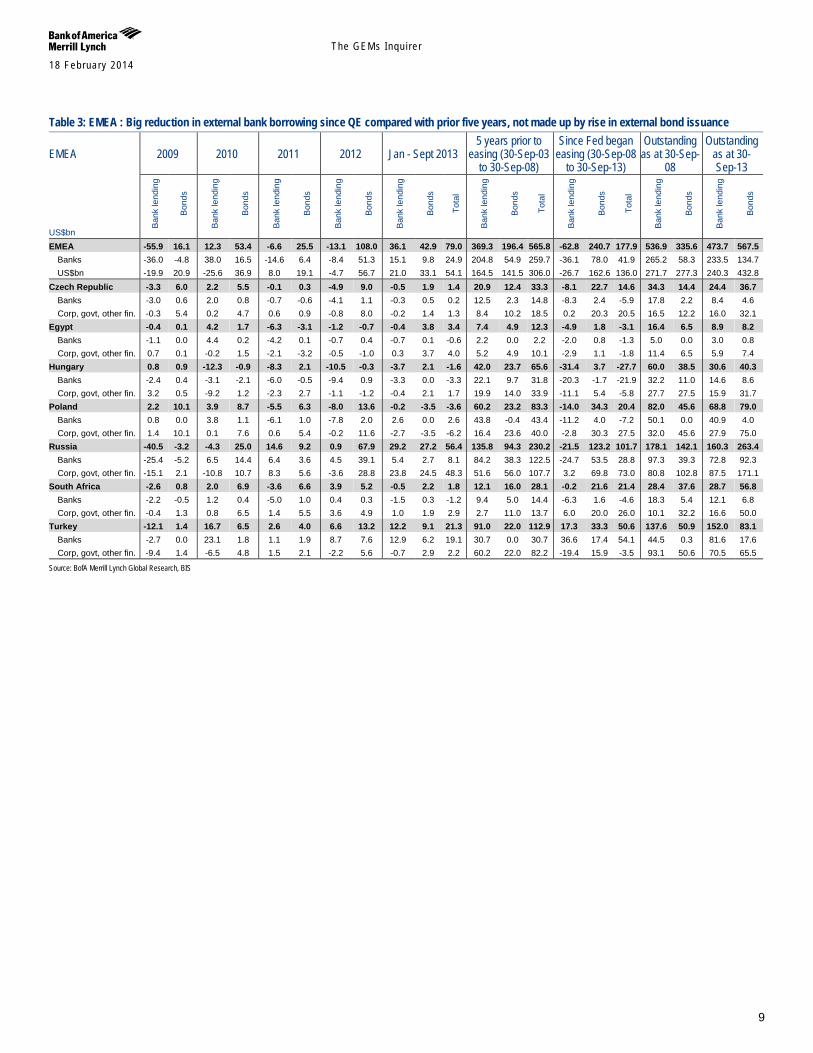
Table 3: EMEA : Big reduction in external bank borrowing since QE compared with prior five years, not made up by rise in external bond issuance
EMEA 2009 2010 2011 2012 Jan - Sept 2013 5 years prior to
easing (30-Sep-03 to 30-Sep-08)
Since Fed began easing (30-Sep-08
to 30-Sep-13)
Outstanding as at 30-Sep-
08
Outstanding as at 30-Sep-13
US$bn
Ban
k le
ndin
g
Bon
ds
Ban
k le
ndin
g
Bon
ds
Ban
k le
ndin
g
Bon
ds
Ban
k le
ndin
g
Bon
ds
Ban
k le
ndin
g
Bon
ds
Tota
l
Ban
k le
ndin
g
Bon
ds
Tota
l
Ban
k le
ndin
g
Bon
ds
Tota
l
Ban
k le
ndin
g
Bon
ds
Ban
k le
ndin
g
Bon
ds
EMEA -55.9 16.1 12.3 53.4 -6.6 25.5 -13.1 108.0 36.1 42.9 79.0 369.3 196.4 565.8 -62.8 240.7 177.9 536.9 335.6 473.7 567.5 Banks -36.0 -4.8 38.0 16.5 -14.6 6.4 -8.4 51.3 15.1 9.8 24.9 204.8 54.9 259.7 -36.1 78.0 41.9 265.2 58.3 233.5 134.7 US$bn -19.9 20.9 -25.6 36.9 8.0 19.1 -4.7 56.7 21.0 33.1 54.1 164.5 141.5 306.0 -26.7 162.6 136.0 271.7 277.3 240.3 432.8
Czech Republic -3.3 6.0 2.2 5.5 -0.1 0.3 -4.9 9.0 -0.5 1.9 1.4 20.9 12.4 33.3 -8.1 22.7 14.6 34.3 14.4 24.4 36.7 Banks -3.0 0.6 2.0 0.8 -0.7 -0.6 -4.1 1.1 -0.3 0.5 0.2 12.5 2.3 14.8 -8.3 2.4 -5.9 17.8 2.2 8.4 4.6 Corp, govt, other fin. -0.3 5.4 0.2 4.7 0.6 0.9 -0.8 8.0 -0.2 1.4 1.3 8.4 10.2 18.5 0.2 20.3 20.5 16.5 12.2 16.0 32.1
Egypt -0.4 0.1 4.2 1.7 -6.3 -3.1 -1.2 -0.7 -0.4 3.8 3.4 7.4 4.9 12.3 -4.9 1.8 -3.1 16.4 6.5 8.9 8.2 Banks -1.1 0.0 4.4 0.2 -4.2 0.1 -0.7 0.4 -0.7 0.1 -0.6 2.2 0.0 2.2 -2.0 0.8 -1.3 5.0 0.0 3.0 0.8 Corp, govt, other fin. 0.7 0.1 -0.2 1.5 -2.1 -3.2 -0.5 -1.0 0.3 3.7 4.0 5.2 4.9 10.1 -2.9 1.1 -1.8 11.4 6.5 5.9 7.4
Hungary 0.8 0.9 -12.3 -0.9 -8.3 2.1 -10.5 -0.3 -3.7 2.1 -1.6 42.0 23.7 65.6 -31.4 3.7 -27.7 60.0 38.5 30.6 40.3 Banks -2.4 0.4 -3.1 -2.1 -6.0 -0.5 -9.4 0.9 -3.3 0.0 -3.3 22.1 9.7 31.8 -20.3 -1.7 -21.9 32.2 11.0 14.6 8.6 Corp, govt, other fin. 3.2 0.5 -9.2 1.2 -2.3 2.7 -1.1 -1.2 -0.4 2.1 1.7 19.9 14.0 33.9 -11.1 5.4 -5.8 27.7 27.5 15.9 31.7
Poland 2.2 10.1 3.9 8.7 -5.5 6.3 -8.0 13.6 -0.2 -3.5 -3.6 60.2 23.2 83.3 -14.0 34.3 20.4 82.0 45.6 68.8 79.0 Banks 0.8 0.0 3.8 1.1 -6.1 1.0 -7.8 2.0 2.6 0.0 2.6 43.8 -0.4 43.4 -11.2 4.0 -7.2 50.1 0.0 40.9 4.0 Corp, govt, other fin. 1.4 10.1 0.1 7.6 0.6 5.4 -0.2 11.6 -2.7 -3.5 -6.2 16.4 23.6 40.0 -2.8 30.3 27.5 32.0 45.6 27.9 75.0
Russia -40.5 -3.2 -4.3 25.0 14.6 9.2 0.9 67.9 29.2 27.2 56.4 135.8 94.3 230.2 -21.5 123.2 101.7 178.1 142.1 160.3 263.4 Banks -25.4 -5.2 6.5 14.4 6.4 3.6 4.5 39.1 5.4 2.7 8.1 84.2 38.3 122.5 -24.7 53.5 28.8 97.3 39.3 72.8 92.3 Corp, govt, other fin. -15.1 2.1 -10.8 10.7 8.3 5.6 -3.6 28.8 23.8 24.5 48.3 51.6 56.0 107.7 3.2 69.8 73.0 80.8 102.8 87.5 171.1
South Africa -2.6 0.8 2.0 6.9 -3.6 6.6 3.9 5.2 -0.5 2.2 1.8 12.1 16.0 28.1 -0.2 21.6 21.4 28.4 37.6 28.7 56.8 Banks -2.2 -0.5 1.2 0.4 -5.0 1.0 0.4 0.3 -1.5 0.3 -1.2 9.4 5.0 14.4 -6.3 1.6 -4.6 18.3 5.4 12.1 6.8 Corp, govt, other fin. -0.4 1.3 0.8 6.5 1.4 5.5 3.6 4.9 1.0 1.9 2.9 2.7 11.0 13.7 6.0 20.0 26.0 10.1 32.2 16.6 50.0
Turkey -12.1 1.4 16.7 6.5 2.6 4.0 6.6 13.2 12.2 9.1 21.3 91.0 22.0 112.9 17.3 33.3 50.6 137.6 50.9 152.0 83.1 Banks -2.7 0.0 23.1 1.8 1.1 1.9 8.7 7.6 12.9 6.2 19.1 30.7 0.0 30.7 36.6 17.4 54.1 44.5 0.3 81.6 17.6 Corp, govt, other fin. -9.4 1.4 -6.5 4.8 1.5 2.1 -2.2 5.6 -0.7 2.9 2.2 60.2 22.0 82.2 -19.4 15.9 -3.5 93.1 50.6 70.5 65.5
Source: BofA Merrill Lynch Global Research, BIS

The GEMs Inqu i re r 18 February 2014
10
Table 4: Latin America: External bond issuance since QE explodes ( mainly Brazil, also Mexico)
LatAm 2009 2010 2011 2012 Jan - Sept 2013 5 years prior to
easing (30-Sep-03 to 30-Sep-08)
Since Fed began easing (30-Sep-08
to 30-Sep-13)
Outstanding as at 30-Sep-
08
Outstanding as at 30-Sep-13
US$bn
Ban
k le
ndin
g
Bon
ds
Ban
k le
ndin
g
Bon
ds
Ban
k le
ndin
g
Bon
ds
Ban
k le
ndin
g
Bon
ds
Ban
k le
ndin
g
Bon
ds
Tota
l
Ban
k le
ndin
g
Bon
ds
Tota
l
Ban
k le
ndin
g
Bon
ds
Tota
l
Ban
k le
ndin
g
Bon
ds
Ban
k le
ndin
g
Bon
ds
LatAm -14.1 37.6 74.2 54.4 53.7 63.3 5.0 103.7 -0.8 63.3 62.5 104.0 41.4 145.4 98.7 317.4 416.1 255.0 249.1 355.6 562.5 Banks -10.6 3.4 48.5 19.3 28.3 16.3 2.7 35.0 -5.5 12.9 7.4 48.9 4.7 53.6 51.0 86.6 137.7 108.2 22.9 159.7 109.1 US$bn -3.6 34.1 25.7 35.1 25.4 47.0 2.3 68.7 4.8 50.4 55.1 55.1 36.7 91.8 47.6 230.8 278.4 146.8 226.3 195.9 453.4
Brazil -13.7 19.6 50.8 33.3 41.6 34.4 -2.1 62.6 8.3 28.1 36.4 47.8 17.4 65.2 74.1 176.0 250.1 115.8 122.9 190.4 296.4 Banks -15.2 3.6 34.0 16.1 20.5 13.1 -3.7 30.1 -1.6 8.7 7.1 25.2 3.8 29.0 25.8 70.9 96.8 62.6 19.8 88.5 90.3 Corp, govt, other fin. 1.6 16.0 16.8 17.2 21.2 21.3 1.6 32.6 9.9 19.4 29.3 22.5 13.6 36.2 48.3 105.0 153.3 53.1 103.1 101.9 206.1
Chile 8.7 1.2 0.5 5.0 4.0 4.4 0.4 5.6 -4.5 5.8 1.3 15.5 0.1 15.6 6.7 21.9 28.7 35.8 10.0 42.8 32.0 Banks 5.8 0.0 0.4 0.5 1.3 0.0 -0.5 1.9 -2.3 2.7 0.4 10.7 -0.2 10.5 3.0 5.1 8.1 16.5 0.2 19.8 5.3 Corp, govt, other fin. 2.9 1.2 0.1 4.5 2.7 4.4 0.9 3.7 -2.2 3.1 0.9 4.8 0.3 5.1 3.8 16.8 20.6 19.3 9.8 23.0 26.7
Colombia -2.6 5.0 4.5 1.2 3.2 4.4 1.8 4.1 4.8 7.1 11.9 4.0 5.0 9.1 10.3 21.8 32.1 11.7 17.9 22.0 40.0 Banks -1.3 0.0 3.5 0.8 1.8 2.1 0.4 1.7 3.7 1.0 4.8 2.4 0.4 2.8 7.4 5.6 13.1 4.5 0.4 11.9 6.0 Corp, govt, other fin. -1.3 5.0 1.0 0.4 1.4 2.3 1.4 2.3 1.1 6.1 7.2 1.6 4.6 6.2 2.9 16.1 19.0 7.2 17.5 10.1 34.0
Mexico -7.0 9.2 14.0 9.8 2.5 18.0 -0.6 25.4 -7.3 18.6 11.3 26.6 13.5 40.1 -1.5 78.2 76.7 76.6 87.4 76.6 163.7 Banks -0.9 -0.5 8.5 0.5 4.2 -0.3 2.4 0.2 -3.6 0.0 -3.6 4.3 0.4 4.6 9.9 0.2 10.1 16.9 2.0 26.8 2.2 Corp, govt, other fin. -6.1 9.7 5.5 9.3 -1.7 18.3 -2.9 25.2 -3.7 18.6 14.9 22.3 13.1 35.4 -11.4 78.0 66.6 59.7 85.3 49.8 161.5
Peru 0.4 2.6 4.5 5.2 2.4 2.1 5.4 6.0 -2.1 3.8 1.6 10.1 5.4 15.5 9.0 19.5 28.5 15.0 10.9 23.8 30.3 Banks 1.1 0.4 2.2 1.4 0.5 1.4 4.1 1.1 -1.8 0.5 -1.3 6.2 0.4 6.6 4.9 4.8 9.6 7.6 0.4 12.6 5.2 Corp, govt, other fin. -0.7 2.2 2.3 3.8 1.9 0.7 1.3 4.9 -0.3 3.3 2.9 3.9 5.0 8.8 4.1 14.7 18.8 7.4 10.5 11.2 25.2
Source: BofA Merrill Lynch Global Research, BIS

The GEMs Inqu i re r 18 February 2014
11
Figure 12: US QE and EM debt binge correlate; EM debt increase correlates with EM forex rise; which correlates with EM monetary base increase; which correlates with EM M2 expansion; which drives asset price (property/bond) inflation. We expect the Pig in the Python to be expelled, as sequence reverses
Source: BofA Merrill Lynch Global Research, BIS
As the Fed tapers, and the size of its balance sheet stabilizes/contracts, we should expect this sequence to reverse. Confidence is a fragile membrane4. Not only does the Fed’s balance sheet matter as a source of funds, but we believe so does the attractiveness of the recipient of the carry trade – and the trust in its collateral. As Gary Gorton puts it...
The output of banks is money, in the form of short-term debt which is used to store value or used as a transaction medium. Such money is backed by a portfolio of bank loans in the case of demand deposits, or by collateral in the form of a specific bond in the case of repo. The backing is designed to make the bank debt as close to riskless as possible — in fact, so close to riskless than nobody wants to really do any due diligence on the money, just transact with it. But the private sector cannot produce riskless debt and so it can happen that the backing collateral is questioned. This typically happens at the peak of the business cycle. If its value is questioned, it loses its “moneyness” so no one wants it, and cash is preferred. But as we know, if everyone wants their cash at the same moment, their demands cannot be satisfied. In this sense, the financial system is insolvent. (interview with the FT, cited below). 4 Gary Gorton, “Misunderstanding Financial Crises: Why we don’t see them coming”, Oxford University Press, 2012. For the time starved, see a good summary in http://ftalphaville.ft.com/2012/10/25/1223861/misunderstanding-financial-crises-a-qa-with-gary-gorton/
0.2
1.2
2.2
3.2
4.2
1.0
2.0
3.0
4.0
5.0
6.0
1/96 1/99 1/02 1/05 1/08 1/11 1/14
EM external loans and intl securities (by issuer'snationality) US$tr, LS
US Reserve Bank credit (USDtr), RS
Correlation = 0.97 Correlation = 0.60
0
2
4
6
8
0
2
4
6
8
1/96 1/99 1/02 1/05 1/08 1/11 1/14
EM external loans and intl securities (by issuer'snationality) US$tr
EM foreign reserves (US$tr)
0
5
10
15
20
25
30
0.01.02.03.04.05.06.07.0
1/96 1/99 1/02 1/05 1/08 1/11 1/14
EM monetary base (US$tr), LS EM M2 (US$tr), LS
0
2
4
6
8
0
2
4
6
8
1/96 1/99 1/02 1/05 1/08 1/11 1/14
EM foreign reserves (US$tr)
EM monetary base (US$tr)

The GEMs Inqu i re r 18 February 2014
12
What makes sense for an individual carry trade - borrow low, invest at higher rates - falls prey to the fallacy of composition, when too many engage in the same carry trade. And eventually question the underlying collateral, now huge, and potentially suspect. China is a case in point. If our colleagues David Cui and Bin Gao are right, the trust sector in China could create rollover risks that reverse a gluttonous carry trade within China, but partly financed overseas. In China's case, this trade was between low global interest rates, low Chinese deposit rates, expectations of perpetual RMB appreciation on the one hand, and higher investment returns promised by Trusts on the other. A part of the debt funds raised overseas, we suspect were put to work in this Trust carry trade. The HK-based banks are big participants in intermediating the China carry trade - as Figure 13 shows, their net lending to China went from 18% of HK GDP in 2007 to 148% in late-2013. There are always fancy names given to carry trades – financial liberalization of capital accounts, the Bangkok International Banking Facility, currency internationalization, etc. We remain skeptics of these buzzwords.
Table 5: EMs – The rise of external debt, forex, base money and M2 since QE was launched
Change (US$bn) 2009 2010 2011 2012 31-Dec-12 to 30-Sep-13
5 years prior to easing (30-Sep-03 to 30-Sep-08)
Since Fed began easing (30-Sep-08
to 30-Sep-13) US Fed assets 1.8 186.5 505.5 -18.8 826.7 470.6 2,522.2 EM (incl. HK and SG)
External loans and intl securities (by issuer's nationality) 2,929 3,570 4,038 4,438 632 1,530 1,898 Foreign reserves 839 782 559 360 336 3,072 2,729 Monetary base 435 1,102 771 619 215 1,826 3,233 M2 3,147 3,451 2,930 3,255 2,096 7,874 14,938
Asia ex-Japan External loans and intl securities (by issuer's nationality) 1,624 2,088 2,433 2,624 491 818 1,304 Foreign reserves 748 652 429 238 324 2,199 2,383 Monetary base 341 813 788 554 245 1,402 2,915 M2 2,622 2,930 2,829 2,839 2,087 5,923 13,691
EMEA External loans and intl securities (by issuer's nationality) 798 846 855 957 79 566 178 Foreign reserves 35 40 15 62 -1.5 644 16 Monetary base 38 74 -13 104 -11 296 151 M2 223 258 28 258 0.1 1,225 563
LatAm External loans and intl securities (by issuer's nationality) 507 636 750 858 63 145 416 Foreign reserves 55 89 115 60 14 229 330 Monetary base 56 216 -4.0 -38 -19 129 167 M2 302 263 73 159 8.8 726 683
Source: BofA Merrill Lynch Global Research, BIS, Federal Reserve Board, Haver Analytics, Datastream

The GEMs Inqu i re r 18 February 2014
13
Figure 13: HK bank lending to China – part of the carry trade
Source: BofA Merrill Lynch Global Research, HKMA
The consequences of the EM carry unwind
If the EM carry trade diminishes as a consequence of a changed Fed policy and/or less attractive risk-adjusted returns in EMs as collateral quality is questioned, the sources of EM forex reserve accumulation will need to change. Perhaps to bigger current account surpluses, more equity FDI and portfolio investment through privatization and more open equity markets. If that does not happen, expanding the EM monetary base might require EM central banks increasing net lending to the financial system and/or monetizing fiscal deficits (this last part has not worked so well in EMs). Potential asset deflation is a risk, as the carry trades diminish/unwind. Property prices are at risk – the collateral value for EM financial systems. This is not a dire projection – it simply seeks to isolate the US QE as a key driver of EM monetary policy and asset inflation, and highlights the magnitudes involved, and the transmission mechanism. Investors should not imbue stock-price movements and property price inflation in EMs with too much EM flavor – this is mainly a US QE-driven story, in our view.
Does the EM-wide story we have told hold for the three EM regions – Asia, EMEA and Latin America? We think so. Check Appendix B. Figure 22 tells the story for Asia. We think the correlations (not implying causation) are robust and similar to what we saw for EMs overall. Likewise for EMEA (Figure 23) and Latin Americas. (Figures 24).
To appreciate the power of the Fed balance sheet since 2009 and its impact on asset prices, see Figures 14 to 17. The US biotech, tech stocks, EM gaming stocks, and EM internet stocks, all moved in line with the Fed’s balance sheet. So did property prices in HK, Indonesia, South Africa, Malaysia, Sydney and London (the latter two, reflecting some spillover EM demand). See Figures 18 to 21.
020406080100120140160
020406080
100120140160
3/94 3/97 3/00 3/03 3/06 3/09 3/12
Hong Kong claims on banks and non-bank customers in China, %GDP

The GEMs Inqu i re r 18 February 2014
14
Figure 14: The Power of QE on US biotech stocks
Source: BofA Merrill Lynch Global Research, Federal Reserve Board, Factset
Figure 15: The Power of QE on the NASDAQ
Source: BofA Merrill Lynch Global Research, Federal Reserve Board, Factset
Figure 16: The Power of QE on Galaxy (Macau gaming)
Source: BofA Merrill Lynch Global Research, Federal Reserve Board, Bloomberg
Figure 17: The Power of QE on Tencent (China internet)
Source: BofA Merrill Lynch Global Research, Federal Reserve Board, Bloomberg
Figure 18: : The Power of QE on HK property prices
Source: BofA Merrill Lynch Global Research, Federal Reserve Board, CEIC
Figure 19: The Power of QE on Malaysia property prices
Source: BofA Merrill Lynch Global Research, Federal Reserve Board, BIS
1.9
2.4
2.9
3.4
3.9
4.4
200300400500600700800900
1/09 1/10 1/11 1/12 1/13 1/14
MSCI US Biotech, LS
US Fed total assets (USDtr), RS
Correlation since Fed easing (30 Sep 2008) = 0.92
Correlation from Jan 1995 to Sep 2008 = 0.70
1.9
2.4
2.9
3.4
3.9
4.4
1,000
2,000
3,000
4,000
5,000
1/09 1/10 1/11 1/12 1/13 1/14
Nasdaq Index, LS
US Fed total assets (USDtr), RS
Correlation since Fed easing (30 Sep 2008) = 0.94 Correlation from Jan 1995 to Sep 2008 = 0.35
1.9
2.4
2.9
3.4
3.9
4.4
01020304050607080
1/09 1/10 1/11 1/12 1/13 1/14
Galaxy Entertainment, LS
US Fed total assets (USDtr), RS
Correlation since Fed easing (30 Sep 2008) = 0.96 Correlation from Jan 1995 to Sep 2008 = 0.71
1.9
2.4
2.9
3.4
3.9
4.4
0
100
200
300
400
500
600
1/09 1/10 1/11 1/12 1/13 1/14
Tencent, LS US Fed total assets (USDtr), RS
Correlation since Fed easing (30 Sep 2008) = 0.94 Correlation from Jan 1995 to Sep 2008 = 0.81
1.8
2.3
2.8
3.3
3.8
4.3
100
125
150
175
200
225
250
1/09 1/10 1/11 1/12 1/13 1/14
Hong Kong property price index, LS
US Fed total assets (USDtr), RS
Correlation since Fed easing (30 Sep
Correlation from Jan 1995 to Sep 2008 = -0.36
1.8
2.3
2.8
3.3
3.8
4.3
140
160
180
200
220
240
1/09 1/10 1/11 1/12 1/13 1/14
Malaysia property price index, LS
US Fed total assets (USDtr), RS
Correlation since Fed easing (30 Sep 2008) = 0.90 Correlation from Jan 1995 to Sep 2008 = 0.54

The GEMs Inqu i re r 18 February 2014
15
Figure 20: The Power of QE on Sydney property prices
Source: BofA Merrill Lynch Global Research, Federal Reserve Board, CEIC
Figure 21: The Power of QE on London property prices
Source: BofA Merrill Lynch Global Research, Federal Reserve Board, CEIC
Could the party go on? Yes, if for some reason – a significant deterioration in the US labor market, or a deflationary shock from China, or any other surprise that could lead to a cessation of the US tapering could prolong this carry trade. This is not the house base case. We believe it is better to start preparing for a post-QE world. As one of our smartest clients told us: “the main theme in the past five years was QE. If that is coming to an end, investments and themes that worked in the past five years must therefore be questioned.” We agree.
1.8
2.3
2.8
3.3
3.8
4.3
80
90
100
110
120
1/09 1/10 1/11 1/12 1/13 1/14
Sydney property price index, LS
US Fed total assets (USDtr), RS
Correlation since Fed easing (30 Sep 2008) = 0.88 Correlation from Jan 1995 to Sep 2008 = 0.13
1.8
2.3
2.8
3.3
3.8
4.3
350370390410430450470490510530
1/09 1/10 1/11 1/12 1/13 1/14
London property price index, LS
US Fed total assets (USDtr), RS
Correlation since Fed easing (30 Sep 2008) = 0.87

The GEMs Inqu i re r 18 February 2014
16
Appendix A
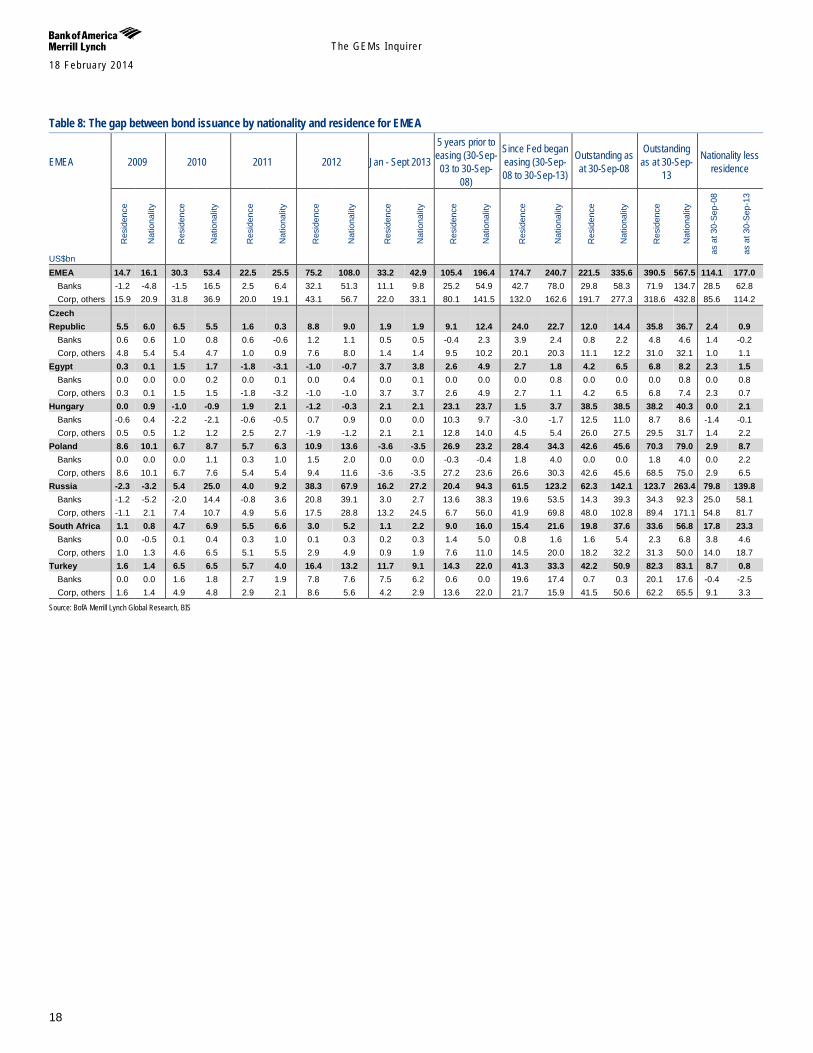
Table 6: The gap between bond issuance by nationality and residence
2009 2010 2011 2012 31-Dec-12 to
30-Sep-13
5 years prior to easing (30-Sep-03 to 30-Sep-08)
Since Fed began easing (30-Sep-08 to 30-Sep-13)
Outstanding as at 30-Sep-08
Outstanding as at 30-Sep-13
Nationality less
residence
US$bn
Res
iden
ce
Nat
iona
lity
Res
iden
ce
Nat
iona
lity
Res
iden
ce
Nat
iona
lity
Res
iden
ce
Nat
iona
lity
Res
iden
ce
Nat
iona
lity
Res
iden
ce
Nat
iona
lity
Res
iden
ce
Nat
iona
lity
Res
iden
ce
Nat
iona
lity
Res
iden
ce
Nat
iona
lity
as a
t 30-
Sep
-08
as a
t 30-
Sep
-13
EM (incl. HK and SG) 75.1 95.9 120.8 171.3 139.3 179.8 235.2 362.6 171.2 257.4 252.1 432.2 724.2 1,042.5 756.2 1,018.9 1,472.5 2,051 262.7 578.1
Banks 4.6 0.1 28.2 46.9 46.6 55.4 79.4 132.4 54.5 68.0 66.6 107.3 206.4 296.4 144.2 169.8 350.4 465.2 25.6 114.8 Corp, others 70.5 95.7 92.7 124.5 92.7 124.4 155.8 230.2 116.7 189.3 185.4 324.9 517.8 746.0 612.0 849.1 1,122.1 1,585.4 237.1 463.3
Asia ex-Japan 24.9 42.2 33.9 63.5 63.6 90.9 100.3 150.9 98.0 151.2 141.6 194.4 308.3 484.4 349.2 434.1 658.8 920.6 85.0 261.8 Banks -1.9 1.5 11.2 11.1 27.7 32.6 36.4 46.1 37.1 45.3 41.9 47.7 105.3 131.8 99.4 88.7 205.4 221.4 -10.7 16.1 Corp, others 26.9 40.8 22.7 52.4 35.9 58.3 63.9 104.8 60.9 105.9 99.7 146.6 203.0 352.6 249.8 345.5 453.5 699.2 95.7 245.8
EMEA 14.7 16.1 30.3 53.4 22.5 25.5 75.2 108.0 33.2 42.9 105.4 196.4 174.7 240.7 221.5 335.6 390.5 567.5 114.1 177.0 Banks -1.2 -4.8 -1.5 16.5 2.5 6.4 32.1 51.3 11.1 9.8 25.2 54.9 42.7 78.0 29.8 58.3 71.9 134.7 28.5 62.8 Corp, others 15.9 20.9 31.8 36.9 20.0 19.1 43.1 56.7 22.0 33.1 80.1 141.5 132.0 162.6 191.7 277.3 318.6 432.8 85.6 114.2
LatAm 35.4 37.6 56.7 54.4 53.2 63.3 59.7 103.7 40.0 63.3 5.1 41.4 241.2 317.4 185.4 249.1 423.2 562.5 63.7 139.3 Banks 7.6 3.4 18.4 19.3 16.4 16.3 10.8 35.0 6.2 12.9 -0.5 4.7 58.4 86.6 14.9 22.9 73.1 109.1 7.9 36.0 Corp, others 27.8 34.1 38.2 35.1 36.8 47.0 48.9 68.7 33.8 50.4 5.6 36.7 182.8 230.8 170.5 226.3 350.1 453.4 55.8 103.4
Source: BofA Merrill Lynch Global Research, BIS

The GEMs Inqu i re r 18 February 2014
17
Table 7: The gap between bond issuance by nationality and residence for Asia ex-Japan
Asia ex-Japan 2009 2010 2011 2012 Jan - Sept
2013
5 years prior to easing (30-
Sep-03 to 30-Sep-08)
Since Fed began easing (30-Sep-08 to 30-Sep-13)
Outstanding as at 30-Sep-
08
Outstanding as at 30-Sep-13
Nationality less
residence
US$bn
Res
iden
ce
Nat
iona
lity
Res
iden
ce
Nat
iona
lity
Res
iden
ce
Nat
iona
lity
Res
iden
ce
Nat
iona
lity
Res
iden
ce
Nat
iona
lity
Res
iden
ce
Nat
iona
lity
Res
iden
ce
Nat
iona
lity
Res
iden
ce
Nat
iona
lity
Res
iden
ce
Nat
iona
lity
as a
t 30-
Sep
-08
as a
t 30-
Sep
-13
Asia ex-Japan 24.9 42.2 33.9 63.5 63.6 90.9 100.3 150.9 98.0 151.2 141.6 194.4 308.3 484.4 349.2 434.1 658.8 920.6 85.0 261.8 Banks -1.9 1.5 11.2 11.1 27.7 32.6 36.4 46.1 37.1 45.3 41.9 47.7 105.3 131.8 99.4 88.7 205.4 221.4 -10.7 16.1 Corp, others 26.9 40.8 22.7 52.4 35.9 58.3 63.9 104.8 60.9 105.9 99.7 146.6 203.0 352.6 249.8 345.5 453.5 699.2 95.7 245.8
China 1.5 1.0 0.7 24.8 4.2 45.6 11.3 54.7 9.4 65.1 10.6 28.1 25.6 190.8 21.9 46.0 48.6 239.7 24.0 191.1 Banks 1.3 0.0 -0.8 4.3 -1.7 14.1 2.7 17.4 0.3 20.5 1.0 2.9 1.8 56.1 2.9 5.5 4.9 62.4 2.7 57.5 Corp, others 0.2 1.0 1.5 20.5 5.9 31.5 8.6 37.3 9.1 44.6 9.6 25.3 23.8 134.6 19.1 40.5 43.8 177.3 21.4 133.6
Hong Kong -1.0 10.2 14.3 7.8 23.7 0.6 33.6 26.6 32.6 4.9 5.3 24.5 104.1 48.6 45.9 68.5 150.4 117.1 22.6 -33.4 Banks -1.6 1.9 9.5 0.8 13.9 -0.2 13.1 1.1 10.5 0.9 1.4 2.9 45.5 4.6 20.8 4.6 66.5 9.3 -16.2 -57.2 Corp, others 0.6 8.3 4.8 6.9 9.7 0.8 20.4 25.5 22.1 4.0 3.9 21.7 58.6 44.0 25.1 63.9 84.0 107.8 38.8 23.8
India 1.3 2.8 -2.2 3.4 -2.4 6.3 -6.6 5.2 3.9 13.0 24.6 35.9 -5.4 31.4 28.3 42.8 23.2 74.2 14.5 51.0 Banks 0.1 -0.5 -0.1 2.6 -0.1 4.1 -2.5 5.8 0.8 3.4 7.1 14.0 -2.1 15.1 7.7 16.5 5.8 31.6 8.8 25.8 Corp, others 1.2 3.3 -2.1 0.8 -2.3 2.2 -4.1 -0.6 3.1 9.6 17.6 21.9 -3.3 16.3 20.6 26.3 17.4 42.6 5.6 25.1
Indonesia 7.5 10.6 3.6 4.3 6.5 4.0 13.3 11.5 15.6 16.2 11.1 14.4 46.2 46.3 13.8 23.4 59.8 69.6 9.6 9.8 Banks -0.2 0.1 -0.1 0.0 0.0 0.0 0.5 1.0 0.6 0.6 -0.5 -1.3 0.7 1.6 0.9 0.6 1.6 2.2 -0.3 0.7 Corp, others 7.7 10.5 3.7 4.3 6.5 4.0 12.8 10.5 14.9 15.5 11.6 15.8 45.5 44.7 12.9 22.7 58.2 67.4 9.8 9.2
Korea 19.1 18.5 7.8 7.7 19.2 20.1 15.8 17.3 10.8 12.4 51.9 50.8 66.3 67.8 107.8 113.0 172.0 178.6 5.2 6.5 Banks 4.1 4.6 0.6 0.6 6.9 6.8 6.3 6.6 6.0 7.2 17.8 18.1 21.2 22.9 36.8 36.7 57.7 59.3 -0.1 1.6 Corp, others 15.0 13.9 7.3 7.1 12.2 13.4 9.5 10.7 4.8 5.2 34.0 32.7 45.0 44.9 70.9 76.2 114.3 119.3 5.3 5.0
Malaysia -1.0 0.6 2.7 5.6 0.5 0.9 5.5 10.0 3.3 3.7 3.8 10.4 10.4 20.2 25.3 33.2 35.8 52.8 7.9 17.0 Banks -0.8 -1.1 0.0 -0.1 1.3 1.1 3.3 3.4 0.6 0.5 1.4 1.9 4.1 3.7 3.0 3.6 7.1 7.3 0.6 0.2 Corp, others -0.3 1.6 2.7 5.7 -0.8 -0.2 2.2 6.6 2.7 3.1 2.4 8.5 6.3 16.6 22.3 29.5 28.7 45.5 7.2 16.8
Philippines 4.3 4.3 2.7 3.4 1.7 1.6 3.9 3.5 0.6 1.1 7.2 6.1 13.0 13.7 31.7 32.0 44.9 45.9 0.3 1.0 Banks 0.2 0.2 0.5 0.5 -0.2 -0.2 0.9 0.9 -0.1 -0.1 0.6 0.6 1.1 1.1 1.4 1.4 2.6 2.6 0.0 0.0 Corp, others 4.1 4.1 2.3 2.9 1.9 1.8 2.9 2.6 0.7 1.2 6.7 5.5 11.9 12.6 30.2 30.5 42.3 43.3 0.3 1.0
Singapore -2.4 -0.4 3.7 3.9 8.8 8.9 21.0 15.5 19.4 13.9 33.2 26.6 47.8 40.4 55.0 51.0 103.9 93.0 -4.0 -11.0 Banks -4.3 -2.2 2.3 1.6 7.9 7.0 12.0 7.0 17.9 11.1 12.8 7.6 34.2 23.8 23.1 15.0 57.7 39.3 -8.2 -18.4 Corp, others 1.8 1.9 1.4 2.3 1.0 1.9 9.1 8.6 1.6 2.8 20.4 19.0 13.6 16.6 31.9 36.1 46.2 53.7 4.2 7.5
Taiwan -3.7 -4.2 1.2 1.4 2.0 1.7 0.0 0.2 1.5 3.3 -5.7 -2.0 -0.7 0.3 11.1 15.1 10.5 15.5 4.0 5.1 Banks -0.5 -0.7 0.0 0.2 0.0 -0.2 0.0 0.0 0.5 0.5 -0.2 0.8 0.0 -0.3 0.8 1.8 0.8 1.6 1.0 0.8 Corp, others -3.2 -3.5 1.2 1.2 2.0 1.8 0.0 0.2 1.0 2.8 -5.5 -2.8 -0.7 0.6 10.3 13.3 9.6 14.0 3.0 4.3
Thailand -0.6 -1.2 -0.7 1.2 -0.5 1.1 2.4 6.4 0.9 17.6 -0.5 -0.6 1.1 24.8 8.4 9.3 9.7 34.4 0.8 24.7 Banks -0.3 -0.9 -0.6 0.6 -0.3 0.1 0.0 2.9 0.0 0.5 0.5 0.3 -1.2 3.2 1.9 2.8 0.7 5.9 0.8 5.2 Corp, others -0.3 -0.3 -0.1 0.6 -0.2 1.1 2.4 3.5 0.9 17.1 -1.0 -0.9 2.3 21.6 6.5 6.5 9.0 28.5 0.0 19.5
Source: BofA Merrill Lynch Global Research, BIS
The GEMs Inqu i re r 18 February 2014
18
Table 8: The gap between bond issuance by nationality and residence for EMEA
EMEA 2009 2010 2011 2012 Jan - Sept 2013
5 years prior to easing (30-Sep-03 to 30-Sep-
08)
Since Fed began easing (30-Sep-08 to 30-Sep-13)
Outstanding as at 30-Sep-08
Outstanding as at 30-Sep-
13
Nationality less residence
US$bn
Res
iden
ce
Nat
iona
lity
Res
iden
ce
Nat
iona
lity
Res
iden
ce
Nat
iona
lity
Res
iden
ce
Nat
iona
lity
Res
iden
ce
Nat
iona
lity
Res
iden
ce
Nat
iona
lity
Res
iden
ce
Nat
iona
lity
Res
iden
ce
Nat
iona
lity
Res
iden
ce
Nat
iona
lity
as a
t 30-
Sep
-08
as a
t 30-
Sep
-13
EMEA 14.7 16.1 30.3 53.4 22.5 25.5 75.2 108.0 33.2 42.9 105.4 196.4 174.7 240.7 221.5 335.6 390.5 567.5 114.1 177.0 Banks -1.2 -4.8 -1.5 16.5 2.5 6.4 32.1 51.3 11.1 9.8 25.2 54.9 42.7 78.0 29.8 58.3 71.9 134.7 28.5 62.8 Corp, others 15.9 20.9 31.8 36.9 20.0 19.1 43.1 56.7 22.0 33.1 80.1 141.5 132.0 162.6 191.7 277.3 318.6 432.8 85.6 114.2
Czech Republic 5.5 6.0 6.5 5.5 1.6 0.3 8.8 9.0 1.9 1.9 9.1 12.4 24.0 22.7 12.0 14.4 35.8 36.7 2.4 0.9
Banks 0.6 0.6 1.0 0.8 0.6 -0.6 1.2 1.1 0.5 0.5 -0.4 2.3 3.9 2.4 0.8 2.2 4.8 4.6 1.4 -0.2 Corp, others 4.8 5.4 5.4 4.7 1.0 0.9 7.6 8.0 1.4 1.4 9.5 10.2 20.1 20.3 11.1 12.2 31.0 32.1 1.0 1.1
Egypt 0.3 0.1 1.5 1.7 -1.8 -3.1 -1.0 -0.7 3.7 3.8 2.6 4.9 2.7 1.8 4.2 6.5 6.8 8.2 2.3 1.5 Banks 0.0 0.0 0.0 0.2 0.0 0.1 0.0 0.4 0.0 0.1 0.0 0.0 0.0 0.8 0.0 0.0 0.0 0.8 0.0 0.8 Corp, others 0.3 0.1 1.5 1.5 -1.8 -3.2 -1.0 -1.0 3.7 3.7 2.6 4.9 2.7 1.1 4.2 6.5 6.8 7.4 2.3 0.7
Hungary 0.0 0.9 -1.0 -0.9 1.9 2.1 -1.2 -0.3 2.1 2.1 23.1 23.7 1.5 3.7 38.5 38.5 38.2 40.3 0.0 2.1 Banks -0.6 0.4 -2.2 -2.1 -0.6 -0.5 0.7 0.9 0.0 0.0 10.3 9.7 -3.0 -1.7 12.5 11.0 8.7 8.6 -1.4 -0.1 Corp, others 0.5 0.5 1.2 1.2 2.5 2.7 -1.9 -1.2 2.1 2.1 12.8 14.0 4.5 5.4 26.0 27.5 29.5 31.7 1.4 2.2
Poland 8.6 10.1 6.7 8.7 5.7 6.3 10.9 13.6 -3.6 -3.5 26.9 23.2 28.4 34.3 42.6 45.6 70.3 79.0 2.9 8.7 Banks 0.0 0.0 0.0 1.1 0.3 1.0 1.5 2.0 0.0 0.0 -0.3 -0.4 1.8 4.0 0.0 0.0 1.8 4.0 0.0 2.2 Corp, others 8.6 10.1 6.7 7.6 5.4 5.4 9.4 11.6 -3.6 -3.5 27.2 23.6 26.6 30.3 42.6 45.6 68.5 75.0 2.9 6.5
Russia -2.3 -3.2 5.4 25.0 4.0 9.2 38.3 67.9 16.2 27.2 20.4 94.3 61.5 123.2 62.3 142.1 123.7 263.4 79.8 139.8 Banks -1.2 -5.2 -2.0 14.4 -0.8 3.6 20.8 39.1 3.0 2.7 13.6 38.3 19.6 53.5 14.3 39.3 34.3 92.3 25.0 58.1 Corp, others -1.1 2.1 7.4 10.7 4.9 5.6 17.5 28.8 13.2 24.5 6.7 56.0 41.9 69.8 48.0 102.8 89.4 171.1 54.8 81.7
South Africa 1.1 0.8 4.7 6.9 5.5 6.6 3.0 5.2 1.1 2.2 9.0 16.0 15.4 21.6 19.8 37.6 33.6 56.8 17.8 23.3 Banks 0.0 -0.5 0.1 0.4 0.3 1.0 0.1 0.3 0.2 0.3 1.4 5.0 0.8 1.6 1.6 5.4 2.3 6.8 3.8 4.6 Corp, others 1.0 1.3 4.6 6.5 5.1 5.5 2.9 4.9 0.9 1.9 7.6 11.0 14.5 20.0 18.2 32.2 31.3 50.0 14.0 18.7
Turkey 1.6 1.4 6.5 6.5 5.7 4.0 16.4 13.2 11.7 9.1 14.3 22.0 41.3 33.3 42.2 50.9 82.3 83.1 8.7 0.8 Banks 0.0 0.0 1.6 1.8 2.7 1.9 7.8 7.6 7.5 6.2 0.6 0.0 19.6 17.4 0.7 0.3 20.1 17.6 -0.4 -2.5 Corp, others 1.6 1.4 4.9 4.8 2.9 2.1 8.6 5.6 4.2 2.9 13.6 22.0 21.7 15.9 41.5 50.6 62.2 65.5 9.1 3.3
Source: BofA Merrill Lynch Global Research, BIS

The GEMs Inqu i re r 18 February 2014
19
Table 9: The gap between bond issuance by nationality and residence for LatAm
LatAm 2009 2010 2011 2012 Jan - Sept 2013
5 years prior to easing (30-Sep-03 to 30-
Sep-08)
Since Fed began easing (30-Sep-08 to 30-Sep-13)
Outstanding as at 30-Sep-08
Outstanding as at 30-Sep-
13 Nationality
less residence
US$bn
Res
iden
ce
Nat
iona
lity
Res
iden
ce
Nat
iona
lity
Res
iden
ce
Nat
iona
lity
Res
iden
ce
Nat
iona
lity
Res
iden
ce
Nat
iona
lity
Res
iden
ce
Nat
iona
lity
Res
iden
ce
Nat
iona
lity
Res
iden
ce
Nat
iona
lity
Res
iden
ce
Nat
iona
lity
as a
t 30-
Sep
-08
as a
t 30-
Sep
-13
LatAm 35.4 37.6 56.7 54.4 53.2 63.3 59.7 103.7 40.0 63.3 5.1 41.4 241.2 317.4 185.4 249.1 423.2 562.5 63.7 139.3 Banks 7.6 3.4 18.4 19.3 16.4 16.3 10.8 35.0 6.2 12.9 -0.5 4.7 58.4 86.6 14.9 22.9 73.1 109.1 7.9 36.0 Corp, others 27.8 34.1 38.2 35.1 36.8 47.0 48.9 68.7 33.8 50.4 5.6 36.7 182.8 230.8 170.5 226.3 350.1 453.4 55.8 103.4
Brazil 12.7 19.6 26.7 33.3 21.5 34.4 16.2 62.6 2.4 28.1 -8.1 17.4 77.3 176.0 79.6 122.9 154.6 296.4 43.4 141.9 Banks 4.2 3.6 11.8 16.1 10.8 13.1 1.8 30.1 0.6 8.7 -0.6 3.8 28.2 70.9 12.8 19.8 40.7 90.3 7.1 49.6 Corp, others 8.4 16.0 14.8 17.2 10.7 21.3 14.4 32.6 1.8 19.4 -7.4 13.6 49.1 105.0 66.8 103.1 113.9 206.1 36.3 92.3
Chile 1.8 1.2 7.3 5.0 5.2 4.4 6.6 5.6 5.9 5.8 -0.6 0.1 26.9 21.9 12.9 10.0 39.8 32.0 -2.9 -7.8 Banks 0.4 0.0 2.6 0.5 0.4 0.0 2.4 1.9 3.2 2.7 0.3 -0.2 9.0 5.1 0.9 0.2 9.9 5.3 -0.7 -4.6 Corp, others 1.4 1.2 4.8 4.5 4.7 4.4 4.2 3.7 2.7 3.1 -0.9 0.3 17.9 16.8 12.0 9.8 29.9 26.7 -2.2 -3.2
Colombia 4.6 5.0 0.7 1.2 4.5 4.4 4.9 4.1 5.6 7.1 4.4 5.0 20.4 21.8 17.1 17.9 37.8 40.0 0.8 2.2 Banks 0.0 0.0 0.6 0.8 2.1 2.1 2.0 1.7 1.3 1.0 0.4 0.4 6.0 5.6 0.4 0.4 6.4 6.0 0.0 -0.4 Corp, others 4.6 5.0 0.1 0.4 2.4 2.3 3.0 2.3 4.3 6.1 4.0 4.6 14.4 16.1 16.7 17.5 31.4 34.0 0.8 2.5
Mexico 13.1 9.2 15.8 9.8 20.5 18.0 25.8 25.4 20.9 18.6 5.1 13.5 94.7 78.2 65.8 87.4 159.2 163.7 21.5 4.6 Banks 2.6 -0.5 1.3 0.5 2.0 -0.3 2.7 0.2 0.0 0.0 -0.8 0.4 8.6 0.2 0.6 2.0 9.2 2.2 1.4 -7.0 Corp, others 10.5 9.7 14.5 9.3 18.5 18.3 23.2 25.2 20.9 18.6 5.9 13.1 86.2 78.0 65.2 85.3 150.0 161.5 20.1 11.6
Peru 3.2 2.6 6.1 5.2 1.5 2.1 6.1 6.0 5.2 3.8 4.4 5.4 21.8 19.5 10.0 10.9 31.8 30.3 0.9 -1.5 Banks 0.4 0.4 2.1 1.4 1.0 1.4 2.0 1.1 1.2 0.5 0.2 0.4 6.7 4.8 0.2 0.4 6.9 5.2 0.2 -1.7 Corp, others 2.8 2.2 4.0 3.8 0.5 0.7 4.1 4.9 4.0 3.3 4.2 5.0 15.2 14.7 9.8 10.5 24.9 25.2 0.7 0.2
Source: BofA Merrill Lynch Global Research, BIS

The GEMs Inqu i re r 18 February 2014
20
Appendix B
Figure 22: US QE and Asia ex-Japan debt binge correlate; Asia ex-Japan debt increase correlates with Asia ex-Japan forex increase; which correlates with Asia ex-Japan monetary base increase; which correlates with Asia ex-Japan M2 expansion; which drives asset price (property/bond) inflation.
Source: BofA Merrill Lynch Global Research, BIS, Federal Reserve Board, Haver Analytics, Datastream
0.20.71.21.72.22.73.23.74.2
0.5
1.0
1.5
2.0
2.5
3.0
3.5
1/96 1/99 1/02 1/05 1/08 1/11 1/14
AxJ external loans and intl securities (by issuer'snationality) US$tr, LS
US Reserve Bank credit (USDtr), RS
Correlation = 0.97
Correlation = 0.38
0.01.02.03.04.05.06.07.08.0
0.01.02.03.04.05.06.07.08.0
1/96 1/99 1/02 1/05 1/08 1/11 1/14
AxJ external loans and intl securities (by issuer'snationality) US$tr
AxJ foreign reserves (US$tr)
0
5
10
15
20
25
30
0.0
1.0
2.0
3.0
4.0
5.0
6.0
1/96 1/99 1/02 1/05 1/08 1/11 1/14
AxJ monetary base (US$tr), LS
AxJ M2 (US$tr), LS
0.01.02.03.04.05.06.07.0
0.01.02.03.04.05.06.07.0
1/96 1/99 1/02 1/05 1/08 1/11 1/14
AxJ foreign reserves (US$tr)
AxJ monetary base (US$tr)
The GEMs Inqu i re r 18 February 2014
21
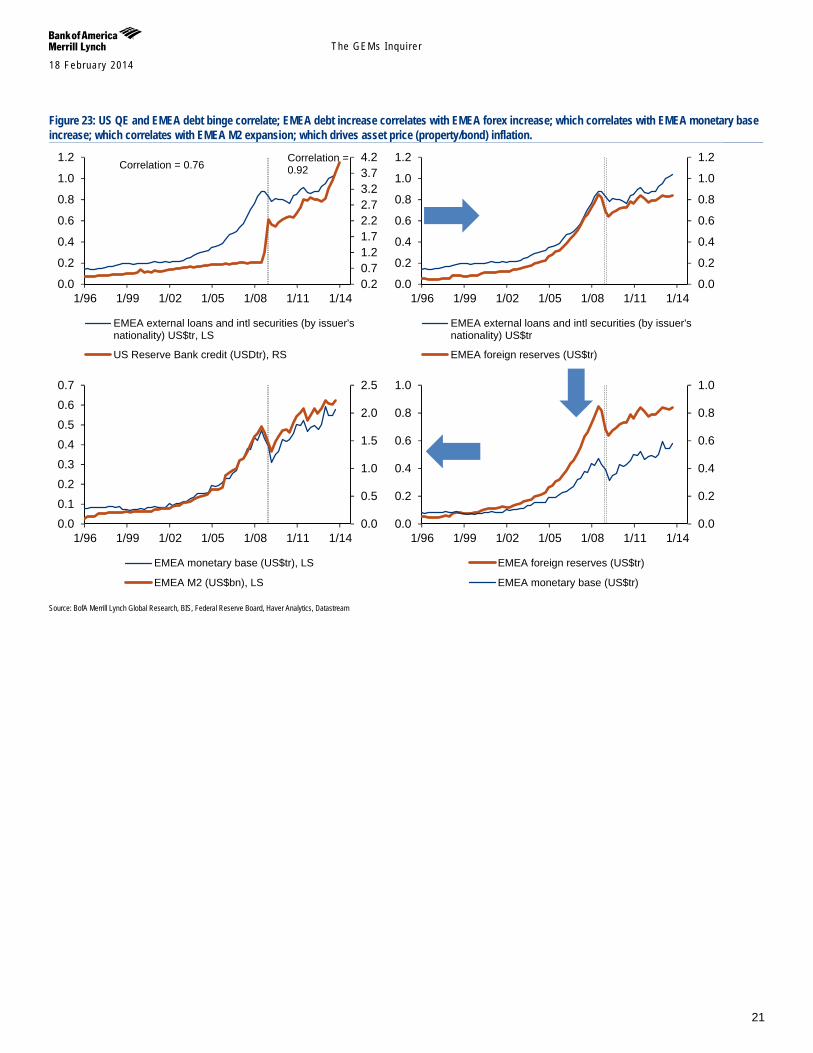
Figure 23: US QE and EMEA debt binge correlate; EMEA debt increase correlates with EMEA forex increase; which correlates with EMEA monetary base increase; which correlates with EMEA M2 expansion; which drives asset price (property/bond) inflation.
Source: BofA Merrill Lynch Global Research, BIS, Federal Reserve Board, Haver Analytics, Datastream
0.20.71.21.72.22.73.23.74.2
0.0
0.2
0.4
0.6
0.8
1.0
1.2
1/96 1/99 1/02 1/05 1/08 1/11 1/14
EMEA external loans and intl securities (by issuer'snationality) US$tr, LS
US Reserve Bank credit (USDtr), RS
Correlation = 0.92 Correlation = 0.76
0.0
0.2
0.4
0.6
0.8
1.0
1.2
0.0
0.2
0.4
0.6
0.8
1.0
1.2
1/96 1/99 1/02 1/05 1/08 1/11 1/14
EMEA external loans and intl securities (by issuer'snationality) US$tr
EMEA foreign reserves (US$tr)
0.0
0.5
1.0
1.5
2.0
2.5
0.00.10.20.30.40.50.60.7
1/96 1/99 1/02 1/05 1/08 1/11 1/14
EMEA monetary base (US$tr), LS
EMEA M2 (US$bn), LS
0.0
0.2
0.4
0.6
0.8
1.0
0.0
0.2
0.4
0.6
0.8
1.0
1/96 1/99 1/02 1/05 1/08 1/11 1/14
EMEA foreign reserves (US$tr)
EMEA monetary base (US$tr)

The GEMs Inqu i re r 18 February 2014
22
Figure 24: US QE and LatAm debt binge correlate; LatAm debt increase correlates with LatAm forex increase; which correlates with LatAm monetary base increase; which correlates with LatAm M2 expansion; which drives asset price (property/bond) inflation.
Source: BofA Merrill Lynch Global Research, BIS, Federal Reserve Board, Haver Analytics, Datastream
0.20.71.21.72.22.73.23.74.2
0.0
0.2
0.4
0.6
0.8
1.0
1/96 1/99 1/02 1/05 1/08 1/11 1/14
LatAm external loans and intl securities (by issuer'snationality) US$tr, LS
US Reserve Bank credit (USDtr), RS
Correlation = 0.94
Correlation = 0.66
0.0
0.2
0.4
0.6
0.8
1.0
0.0
0.2
0.4
0.6
0.8
1.0
1/96 1/99 1/02 1/05 1/08 1/11 1/14
LatAm external loans and intl securities (by issuer'snationality) US$trLatAM foreign reserves (US$tr)
0.0
0.5
1.0
1.5
2.0
2.5
0.0
0.1
0.2
0.3
0.4
0.5
1/96 1/99 1/02 1/05 1/08 1/11 1/14
LatAm monetary base (US$tr), LS
LatAm M2 (US$bn), LS
0.00.10.20.30.40.50.60.70.8
0.00.10.20.30.40.50.60.70.8
1/96 1/99 1/02 1/05 1/08 1/11 1/14
LatAM foreign reserves (US$tr)
LatAm monetary base (US$tr)

The GEMs Inqu i re r 18 February 2014
23
Appendix C
Table 10: Market Intelligence table 14-Feb-2014 Market
cap (U$m) US$ perf (%) PE (x) PB (x) Div yield (%) EPSg (%) ROE (%)
Region/Country (# Co) 2013 YTD CY12 CY13E CY14E CY12 CY13E CY14E CY12 CY13E CY14E CY12 CY13E CY14E CY12 CY13E CY14E North America (705) 18,596,655 27.6 -0.4 14.8 16.9 15.6 2.3 2.6 2.4 2.1 2.0 2.1 5.0 5.9 8.9 15.4 15.2 15.4
Canada (96) 1,305,410 3.3 -0.4 15.1 16.4 15.1 1.9 1.9 1.8 2.8 2.8 2.9 -0.4 2.3 8.5 12.2 11.6 12.0 US (609) 17,291,245 29.9 -0.4 14.7 17.0 15.6 2.3 2.6 2.5 2.0 1.9 2.1 5.6 5.8 9.0 15.8 15.6 15.8
Europe (432) 8,913,175 21.7 0.7 13.5 15.7 14.1 1.6 1.8 1.7 3.6 3.3 3.6 -3.2 1.4 11.4 11.8 11.4 11.9 Austria (8) 39,531 10.9 2.6 12.1 16.5 11.7 1.0 1.0 1.0 2.9 2.6 3.1 67.6 -10.9 40.8 8.5 6.3 8.5 Belgium (11) 155,227 24.6 -1.4 16.0 19.0 16.1 1.8 2.0 1.9 3.1 2.8 3.2 47.5 -6.0 17.9 11.5 10.6 12.0 Denmark (11) 173,179 23.4 11.3 19.5 20.8 17.7 2.6 3.0 2.8 1.9 2.0 2.3 34.3 12.3 18.0 13.5 14.2 15.6 Finland (13) 119,589 41.6 -0.2 19.4 19.3 16.7 1.7 2.2 2.0 4.1 3.4 3.8 -30.3 33.0 15.5 8.6 11.5 11.8 France (72) 1,336,545 23.3 0.4 14.2 16.0 13.8 1.3 1.5 1.4 3.7 3.3 3.6 -12.8 3.2 16.4 8.9 9.2 10.3 Germany (55) 1,259,795 28.2 0.1 11.6 15.2 13.4 1.5 1.8 1.6 3.4 2.7 2.8 14.4 -5.4 12.9 12.6 11.6 12.2 Ireland (4) 42,385 38.9 10.8 28.7 71.5 22.9 1.8 1.8 1.7 2.2 1.7 1.7 -12.6 -10.4 212.5 6.3 2.5 7.3 Italy (24) 320,415 16.9 7.1 10.5 17.7 13.6 0.7 1.0 1.0 4.0 3.1 3.5 12.7 -10.8 30.2 7.0 5.6 7.0 Netherlands (23) 356,258 28.5 -1.4 14.1 17.3 14.6 1.5 1.9 1.8 2.8 2.4 2.6 -14.0 3.9 18.6 10.5 10.8 12.4 Norway (10) 105,553 5.3 -2.0 11.3 12.6 11.2 1.5 1.5 1.4 4.9 5.1 5.2 3.9 -3.8 12.8 13.7 11.7 12.6 Portugal (5) 24,110 7.5 3.3 14.7 20.6 19.7 1.3 1.4 1.4 4.5 3.5 3.6 3.1 -14.7 4.5 8.8 7.0 7.1 Spain (22) 452,971 27.7 1.3 18.2 17.3 14.9 1.1 1.4 1.3 5.5 5.3 5.4 -40.1 43.3 16.2 6.1 7.9 8.9 Sweden (31) 428,270 21.4 -0.3 15.6 16.3 16.0 2.2 2.2 2.1 3.7 3.7 3.9 1.4 8.8 1.9 14.5 13.7 13.5 Switzerland (38) 1,206,739 23.8 2.2 17.0 17.0 15.9 2.5 2.6 2.4 3.2 2.9 3.2 0.5 14.0 7.2 14.4 15.3 15.4 UK (105) 2,892,606 16.2 -0.4 12.3 14.2 13.3 1.8 1.9 1.7 3.7 3.6 3.9 -4.2 -3.9 6.9 14.6 13.3 12.9
Israel (9) 61,330 8.0 4.0 8.2 9.4 10.0 1.4 1.4 1.4 3.0 3.2 3.2 2.9 -9.5 -6.3 17.6 15.6 14.0 Asia Pac (1003) 6,454,032 9.3 -4.2 16.1 14.0 12.4 1.5 1.4 1.3 2.6 2.6 2.8 7.1 22.2 13.6 9.4 10.3 10.9
Japan (320) 2,594,549 24.9 -6.5 21.4 15.8 13.4 1.2 1.3 1.2 2.0 1.9 2.1 15.0 61.9 17.7 5.8 8.0 8.9 Australia (69) 995,839 -0.3 0.8 15.5 15.6 14.3 2.0 2.0 1.9 4.2 4.5 4.7 -0.6 3.9 8.8 13.0 13.0 13.4 New Zealand (5) 16,307 6.2 6.7 18.5 19.3 17.8 1.9 2.1 2.0 4.9 3.9 4.1 -3.7 10.3 8.3 10.1 10.7 11.2
Asia Pac ex-Japan (683) 3,859,483 0.5 -2.6 14.0 13.0 11.7 1.7 1.6 1.5 2.9 3.2 3.4 4.3 7.6 11.3 12.3 12.1 12.5 Asia ex-Japan (609) 2,847,337 0.7 -3.9 13.5 12.3 11.0 1.6 1.5 1.3 2.4 2.7 2.9 6.0 8.7 12.0 12.1 11.9 12.3
China (138) 712,262 0.4 -5.4 11.1 9.2 8.5 1.6 1.4 1.2 2.9 3.5 3.8 5.5 16.6 8.4 14.7 15.0 14.6 Hong Kong (39) 362,182 8.1 -3.9 17.2 15.5 14.4 1.4 1.3 1.2 2.6 2.9 3.1 -8.2 6.2 7.4 8.1 8.2 8.4 India (71) 226,464 -5.3 -4.3 16.0 16.3 14.1 2.5 2.6 2.3 1.5 1.6 1.7 7.9 9.4 15.4 15.5 15.7 16.0 Indonesia (30) 91,409 -25.0 9.9 17.5 15.3 13.8 3.9 3.2 2.8 2.3 2.6 2.8 6.7 2.0 10.8 22.3 21.2 20.5 Korea (104) 579,701 3.1 -5.3 10.9 10.8 8.9 1.3 1.1 1.0 1.1 1.2 1.3 11.9 0.1 21.4 11.6 10.2 11.4 Malaysia (44) 141,885 4.2 -3.8 15.3 16.9 15.6 2.0 2.1 2.0 3.5 2.9 3.1 11.2 1.4 8.6 13.4 12.7 12.8 Philippines (19) 33,955 -4.3 3.1 22.5 19.4 17.9 3.3 2.8 2.6 1.9 2.3 2.2 14.2 -0.5 8.1 14.8 14.3 14.4 Singapore (30) 185,537 -1.8 -4.7 13.6 14.5 13.3 1.5 1.4 1.3 3.4 3.7 3.8 9.9 -13.4 8.9 11.2 9.4 9.7 Taiwan (106) 431,294 6.6 -2.7 19.4 15.7 14.3 1.8 1.8 1.7 2.9 3.1 3.3 -0.9 30.9 9.6 9.3 11.5 11.8 Thailand (28) 82,648 -16.9 1.3 14.9 12.3 11.2 2.5 2.0 1.8 2.9 3.5 3.8 18.1 4.8 9.6 16.9 15.9 15.8
EMEA (139) 648,661 -8.0 -4.6 8.6 9.0 8.6 1.3 1.2 1.1 3.6 3.7 3.9 -0.5 1.9 4.5 14.7 12.9 12.2 Czech Republic (3) 9,596 -14.9 3.7 9.4 10.7 12.0 1.4 1.4 1.4 7.9 6.8 6.3 7.2 -12.0 -11.0 15.1 13.0 11.3 Egypt (4) 7,943 6.2 7.0 10.5 13.7 10.3 1.5 1.6 1.4 3.9 2.7 3.0 15.6 6.1 33.2 13.3 11.4 14.0 Greece (10) 20,241 46.2 13.0 11.5 nm 32.7 2.3 1.4 1.3 2.9 0.6 1.4 -9.7 -69.2 477.0 20.1 0.7 4.1 Hungary (3) 8,933 -9.0 -7.5 9.2 10.7 9.6 0.9 0.8 0.8 3.9 2.6 3.0 12.0 -11.8 11.4 9.5 8.0 8.4 Poland (22) 66,939 -1.7 3.9 9.9 14.2 14.0 1.3 1.4 1.3 5.2 4.6 4.2 -13.9 -20.8 1.3 12.8 9.6 9.3 Russia (22) 214,575 -2.6 -7.5 5.4 5.1 5.1 0.8 0.7 0.6 3.6 4.4 4.7 -6.0 2.7 0.3 14.7 13.0 11.8 South Africa (50) 266,614 -8.8 -5.4 14.7 15.8 13.9 2.3 2.5 2.3 3.3 3.2 3.5 8.1 7.8 13.4 15.8 15.7 16.3 Turkey (25) 53,819 -28.1 -6.0 11.9 9.3 9.1 1.8 1.3 1.2 2.5 3.0 3.4 38.0 7.4 1.3 15.3 13.9 12.8
Latin America (143) 675,938 -15.7 -6.9 15.7 13.9 11.9 1.7 1.6 1.5 3.1 3.2 3.2 -18.4 10.0 16.7 10.9 11.3 12.3 Brazil (75) 372,089 -18.7 -8.2 13.1 11.3 9.8 1.3 1.3 1.2 3.8 3.9 4.2 -26.6 16.9 15.3 10.2 11.2 12.1 Chile (21) 58,028 -23.0 -4.8 25.0 18.7 14.9 2.3 1.7 1.5 2.5 2.6 2.9 -13.5 24.5 25.3 9.2 8.9 10.4 Colombia (15) 35,972 -23.7 -8.7 19.7 14.8 13.5 2.0 1.5 1.3 2.5 4.0 3.9 5.6 0.5 9.9 10.2 10.1 10.1 Mexico (29) 192,861 -2.0 -5.8 21.4 21.2 17.7 3.1 2.8 2.5 1.6 1.9 1.5 20.0 -5.5 19.9 14.4 13.1 14.1 Peru (3) 16,987 -31.0 6.4 13.5 16.5 13.7 2.9 2.2 2.0 4.4 2.1 1.8 -7.2 -34.3 20.0 21.8 13.6 14.5
Developed Markets (1609) 31,725,574 24.1 -0.7 14.8 16.4 14.9 1.9 2.1 2.0 2.6 2.4 2.6 2.5 7.3 10.3 12.7 12.7 13.1 Emerging Markets (822) 3,624,217 -5.0 -4.5 12.4 11.5 10.3 1.6 1.4 1.3 2.7 2.9 3.1 0.3 8.6 11.5 13.0 12.6 12.8 World (2431) 35,349,790 20.3 -1.1 14.4 15.7 14.2 1.8 2.0 1.9 2.6 2.5 2.7 2.3 7.3 10.5 12.7 12.7 13.1 Source: BofA Merrill Lynch Global Research, MSCI, Factset estimates

The GEMs Inqu i re r 18 February 2014
24
Link to Definitions Macro Click here for definitions of commonly used terms.

The GEMs Inqu i re r 18 February 2014
25
Important Disclosures
FUNDAMENTAL EQUITY OPINION KEY: Opinions include a Volatility Risk Rating, an Investment Rating and an Income Rating. VOLATILITY RISK RATINGS, indicators of potential price fluctuation, are: A - Low, B - Medium and C - High. INVESTMENT RATINGS reflect the analyst’s assessment of a stock’s: (i) absolute total return potential and (ii) attractiveness for investment relative to other stocks within its Coverage Cluster (defined below). There are three investment ratings: 1 - Buy stocks are expected to have a total return of at least 10% and are the most attractive stocks in the coverage cluster; 2 - Neutral stocks are expected to remain flat or increase in value and are less attractive than Buy rated stocks and 3 - Underperform stocks are the least attractive stocks in a coverage cluster. Analysts assign investment ratings considering, among other things, the 0-12 month total return expectation for a stock and the firm’s guidelines for ratings dispersions (shown in the table below). The current price objective for a stock should be referenced to better understand the total return expectation at any given time. The price objective reflects the analyst’s view of the potential price appreciation (depreciation). Investment rating Total return expectation (within 12-month period of date of initial rating) Ratings dispersion guidelines for coverage cluster*
Buy ≥ 10% ≤ 70% Neutral ≥ 0% ≤ 30%
Underperform N/A ≥ 20% * Ratings dispersions may vary from time to time where BofA Merrill Lynch Research believes it better reflects the investment prospects of stocks in a Coverage Cluster.
INCOME RATINGS, indicators of potential cash dividends, are: 7 - same/higher (dividend considered to be secure), 8 - same/lower (dividend not considered to be secure) and 9 - pays no cash dividend. Coverage Cluster is comprised of stocks covered by a single analyst or two or more analysts sharing a common industry, sector, region or other classification(s). A stock’s coverage cluster is included in the most recent BofA Merrill Lynch Comment referencing the stock.
BofA Merrill Lynch Research personnel (including the analyst(s) responsible for this report) receive compensation based upon, among other factors, the overall profitability of Bank of America Corporation, including profits derived from investment banking revenues.
Other Important Disclosures
Officers of MLPF&S or one or more of its affiliates (other than research analysts) may have a financial interest in securities of the issuer(s) or in related investments.
BofA Merrill Lynch Global Research policies relating to conflicts of interest are described at http://www.ml.com/media/43347.pdf. "BofA Merrill Lynch" includes Merrill Lynch, Pierce, Fenner & Smith Incorporated ("MLPF&S") and its affiliates. Investors should contact their BofA
Merrill Lynch representative or Merrill Lynch Global Wealth Management financial advisor if they have questions concerning this report. "BofA Merrill Lynch" and "Merrill Lynch" are each global brands for BofA Merrill Lynch Global Research.
Information relating to Non-US affiliates of BofA Merrill Lynch and Distribution of Affiliate Research Reports: MLPF&S distributes, or may in the future distribute, research reports of the following non-US affiliates in the US (short name: legal name): Merrill Lynch (France):
Merrill Lynch Capital Markets (France) SAS; Merrill Lynch (Frankfurt): Merrill Lynch International Bank Ltd., Frankfurt Branch; Merrill Lynch (South Africa): Merrill Lynch South Africa (Pty) Ltd.; Merrill Lynch (Milan): Merrill Lynch International Bank Limited; MLI (UK): Merrill Lynch International; Merrill Lynch (Australia): Merrill Lynch Equities (Australia) Limited; Merrill Lynch (Hong Kong): Merrill Lynch (Asia Pacific) Limited; Merrill Lynch (Singapore): Merrill Lynch (Singapore) Pte Ltd.; Merrill Lynch (Canada): Merrill Lynch Canada Inc; Merrill Lynch (Mexico): Merrill Lynch Mexico, SA de CV, Casa de Bolsa; Merrill Lynch (Argentina): Merrill Lynch Argentina SA; Merrill Lynch (Japan): Merrill Lynch Japan Securities Co., Ltd.; Merrill Lynch (Seoul): Merrill Lynch International Incorporated (Seoul Branch); Merrill Lynch (Taiwan): Merrill Lynch Securities (Taiwan) Ltd.; DSP Merrill Lynch (India): DSP Merrill Lynch Limited; PT Merrill Lynch (Indonesia): PT Merrill Lynch Indonesia; Merrill Lynch (Israel): Merrill Lynch Israel Limited; Merrill Lynch (Russia): OOO Merrill Lynch Securities, Moscow; Merrill Lynch (Turkey I.B.): Merrill Lynch Yatirim Bank A.S.; Merrill Lynch (Turkey Broker): Merrill Lynch Menkul Değerler A.Ş.; Merrill Lynch (Dubai): Merrill Lynch International, Dubai Branch; MLPF&S (Zurich rep. office): MLPF&S Incorporated Zurich representative office; Merrill Lynch (Spain): Merrill Lynch Capital Markets Espana, S.A.S.V.; Merrill Lynch (Brazil): Bank of America Merrill Lynch Banco Multiplo S.A.; Merrill Lynch KSA Company, Merrill Lynch Kingdom of Saudi Arabia Company.
This research report has been approved for publication and is distributed in the United Kingdom to professional clients and eligible counterparties (as each is defined in the rules of the Financial Conduct Authority and the Prudential Regulation Authority) by Merrill Lynch International and Bank of America Merrill Lynch International Limited, which are authorized by the Prudential Regulation Authority and regulated by the Financial Conduct Authority and the Prudential Regulation Authority, and is distributed in the United Kingdom to retail clients (as defined in the rules of the Financial Conduct Authority and the Prudential Regulation Authority) by Merrill Lynch International Bank Limited, London Branch, which is authorised by the Central Bank of Ireland and subject to limited regulation by the Financial Conduct Authority and Prudential Regulation Authority - details about the extent of our regulation by the Financial Conduct Authority and Prudential Regulation Authority are available from us on request; has been considered and distributed in Japan by Merrill Lynch Japan Securities Co., Ltd., a registered securities dealer under the Financial Instruments and Exchange Act in Japan; is distributed in Hong Kong by Merrill Lynch (Asia Pacific) Limited, which is regulated by the Hong Kong SFC and the Hong Kong Monetary Authority (note that Hong Kong recipients of this research report should contact Merrill Lynch (Asia Pacific) Limited in respect of any matters relating to dealing in securities or provision of specific advice on securities); is issued and distributed in Taiwan by Merrill Lynch Securities (Taiwan) Ltd.; is issued and distributed in India by DSP Merrill Lynch Limited; and is issued and distributed in Singapore to institutional investors and/or accredited investors (each as defined under the Financial Advisers Regulations) by Merrill Lynch International Bank Limited (Merchant Bank) and Merrill Lynch (Singapore) Pte Ltd. (Company Registration No.’s F 06872E and 198602883D respectively). Merrill Lynch International Bank Limited (Merchant Bank) and Merrill Lynch (Singapore) Pte Ltd. are regulated by the Monetary Authority of Singapore. Bank of America N.A., Australian Branch (ARBN 064 874 531), AFS License 412901 (BANA Australia) and Merrill Lynch Equities (Australia) Limited (ABN 65 006 276 795), AFS License 235132 (MLEA) distributes this report in Australia only to 'Wholesale' clients as defined by s.761G of the Corporations Act 2001. With the exception of BANA Australia, neither MLEA nor any of its affiliates involved in preparing this research report is an Authorised Deposit-Taking Institution under the Banking Act 1959 nor regulated by the Australian Prudential Regulation Authority. No approval is required for publication or distribution of this report in Brazil and its local distribution is made by Bank of America Merrill Lynch Banco Múltiplo S.A. in accordance with applicable regulations. Merrill Lynch (Dubai) is authorized and regulated by the Dubai Financial Services Authority (DFSA). Research reports prepared and issued by Merrill Lynch (Dubai) are prepared and issued in accordance with the requirements of the DFSA conduct of business rules.
Merrill Lynch (Frankfurt) distributes this report in Germany. Merrill Lynch (Frankfurt) is regulated by BaFin. This research report has been prepared and issued by MLPF&S and/or one or more of its non-US affiliates. MLPF&S is the distributor of this research report in
the US and accepts full responsibility for research reports of its non-US affiliates distributed to MLPF&S clients in the US. Any US person receiving this research report and wishing to effect any transaction in any security discussed in the report should do so through MLPF&S and not such foreign affiliates.

The GEMs Inqu i re r 18 February 2014
26
General Investment Related Disclosures: Taiwan Readers: Neither the information nor any opinion expressed herein constitutes an offer or a solicitation of an offer to transact in any securities or other
financial instrument. No part of this report may be used or reproduced or quoted in any manner whatsoever in Taiwan by the press or any other person without the express written consent of BofA Merrill Lynch.
This research report provides general information only. Neither the information nor any opinion expressed constitutes an offer or an invitation to make an offer, to buy or sell any securities or other financial instrument or any derivative related to such securities or instruments (e.g., options, futures, warrants, and contracts for differences). This report is not intended to provide personal investment advice and it does not take into account the specific investment objectives, financial situation and the particular needs of any specific person. Investors should seek financial advice regarding the appropriateness of investing in financial instruments and implementing investment strategies discussed or recommended in this report and should understand that statements regarding future prospects may not be realized. Any decision to purchase or subscribe for securities in any offering must be based solely on existing public information on such security or the information in the prospectus or other offering document issued in connection with such offering, and not on this report.
Securities and other financial instruments discussed in this report, or recommended, offered or sold by Merrill Lynch, are not insured by the Federal Deposit Insurance Corporation and are not deposits or other obligations of any insured depository institution (including, Bank of America, N.A.). Investments in general and, derivatives, in particular, involve numerous risks, including, among others, market risk, counterparty default risk and liquidity risk. No security, financial instrument or derivative is suitable for all investors. In some cases, securities and other financial instruments may be difficult to value or sell and reliable information about the value or risks related to the security or financial instrument may be difficult to obtain. Investors should note that income from such securities and other financial instruments, if any, may fluctuate and that price or value of such securities and instruments may rise or fall and, in some cases, investors may lose their entire principal investment. Past performance is not necessarily a guide to future performance. Levels and basis for taxation may change.
This report may contain a short-term trading idea or recommendation, which highlights a specific near-term catalyst or event impacting the company or the market that is anticipated to have a short-term price impact on the equity securities of the company. Short-term trading ideas and recommendations are different from and do not affect a stock's fundamental equity rating, which reflects both a longer term total return expectation and attractiveness for investment relative to other stocks within its Coverage Cluster. Short-term trading ideas and recommendations may be more or less positive than a stock's fundamental equity rating.
BofA Merrill Lynch is aware that the implementation of the ideas expressed in this report may depend upon an investor's ability to "short" securities or other financial instruments and that such action may be limited by regulations prohibiting or restricting "shortselling" in many jurisdictions. Investors are urged to seek advice regarding the applicability of such regulations prior to executing any short idea contained in this report.
Foreign currency rates of exchange may adversely affect the value, price or income of any security or financial instrument mentioned in this report. Investors in such securities and instruments, including ADRs, effectively assume currency risk.
UK Readers: The protections provided by the U.K. regulatory regime, including the Financial Services Scheme, do not apply in general to business coordinated by BofA Merrill Lynch entities located outside of the United Kingdom. BofA Merrill Lynch Global Research policies relating to conflicts of interest are described at http://www.ml.com/media/43347.pdf.
Officers of MLPF&S or one or more of its affiliates (other than research analysts) may have a financial interest in securities of the issuer(s) or in related investments.
MLPF&S or one of its affiliates is a regular issuer of traded financial instruments linked to securities that may have been recommended in this report. MLPF&S or one of its affiliates may, at any time, hold a trading position (long or short) in the securities and financial instruments discussed in this report.
BofA Merrill Lynch, through business units other than BofA Merrill Lynch Global Research, may have issued and may in the future issue trading ideas or recommendations that are inconsistent with, and reach different conclusions from, the information presented in this report. Such ideas or recommendations reflect the different time frames, assumptions, views and analytical methods of the persons who prepared them, and BofA Merrill Lynch is under no obligation to ensure that such other trading ideas or recommendations are brought to the attention of any recipient of this report.
In the event that the recipient received this report pursuant to a contract between the recipient and MLPF&S for the provision of research services for a separate fee, and in connection therewith MLPF&S may be deemed to be acting as an investment adviser, such status relates, if at all, solely to the person with whom MLPF&S has contracted directly and does not extend beyond the delivery of this report (unless otherwise agreed specifically in writing by MLPF&S). MLPF&S is and continues to act solely as a broker-dealer in connection with the execution of any transactions, including transactions in any securities mentioned in this report.
Copyright and General Information regarding Research Reports: Copyright 2014 Merrill Lynch, Pierce, Fenner & Smith Incorporated. All rights reserved. iQmethod, iQmethod 2.0, iQprofile, iQtoolkit, iQworks are service marks
of Bank of America Corporation. iQanalytics®, iQcustom®, iQdatabase® are registered service marks of Bank of America Corporation. This research report is prepared for the use of BofA Merrill Lynch clients and may not be redistributed, retransmitted or disclosed, in whole or in part, or in any form or manner, without the express written consent of BofA Merrill Lynch. BofA Merrill Lynch Global Research reports are distributed simultaneously to internal and client websites and other portals by BofA Merrill Lynch and are not publicly-available materials. Any unauthorized use or disclosure is prohibited. Receipt and review of this research report constitutes your agreement not to redistribute, retransmit, or disclose to others the contents, opinions, conclusion, or information contained in this report (including any investment recommendations, estimates or price targets) without first obtaining expressed permission from an authorized officer of BofA Merrill Lynch.
Materials prepared by BofA Merrill Lynch Global Research personnel are based on public information. Facts and views presented in this material have not been reviewed by, and may not reflect information known to, professionals in other business areas of BofA Merrill Lynch, including investment banking personnel. BofA Merrill Lynch has established information barriers between BofA Merrill Lynch Global Research and certain business groups. As a result, BofA Merrill Lynch does not disclose certain client relationships with, or compensation received from, such companies in research reports. To the extent this report discusses any legal proceeding or issues, it has not been prepared as nor is it intended to express any legal conclusion, opinion or advice. Investors should consult their own legal advisers as to issues of law relating to the subject matter of this report. BofA Merrill Lynch Global Research personnel’s knowledge of legal proceedings in which any BofA Merrill Lynch entity and/or its directors, officers and employees may be plaintiffs, defendants, co-defendants or co-plaintiffs with or involving companies mentioned in this report is based on public information. Facts and views presented in this material that relate to any such proceedings have not been reviewed by, discussed with, and may not reflect information known to, professionals in other business areas of BofA Merrill Lynch in connection with the legal proceedings or matters relevant to such proceedings.
This report has been prepared independently of any issuer of securities mentioned herein and not in connection with any proposed offering of securities or as agent of any issuer of any securities. None of MLPF&S, any of its affiliates or their research analysts has any authority whatsoever to make any representation or warranty on behalf of the issuer(s). BofA Merrill Lynch Global Research policy prohibits research personnel from disclosing a recommendation, investment rating, or investment thesis for review by an issuer prior to the publication of a research report containing such rating, recommendation or investment thesis.
Any information relating to the tax status of financial instruments discussed herein is not intended to provide tax advice or to be used by anyone to provide tax advice. Investors are urged to seek tax advice based on their particular circumstances from an independent tax professional.
The information herein (other than disclosure information relating to BofA Merrill Lynch and its affiliates) was obtained from various sources and we do not guarantee its accuracy. This report may contain links to third-party websites. BofA Merrill Lynch is not responsible for the content of any third-party website or any linked content contained in a third-party website. Content contained on such third-party websites is not part of this report and is not incorporated by reference into this report. The inclusion of a link in this report does not imply any endorsement by or any affiliation with BofA Merrill Lynch. Access to any third-party website is at your own risk, and you should always review the terms and privacy policies at third-party websites before submitting any personal information to them. BofA Merrill Lynch is not responsible for such terms and privacy policies and expressly disclaims any liability for them.

The GEMs Inqu i re r 18 February 2014
27
Certain outstanding reports may contain discussions and/or investment opinions relating to securities, financial instruments and/or issuers that are no longer current. Always refer to the most recent research report relating to a company or issuer prior to making an investment decision.
In some cases, a company or issuer may be classified as Restricted or may be Under Review or Extended Review. In each case, investors should consider any investment opinion relating to such company or issuer (or its security and/or financial instruments) to be suspended or withdrawn and should not rely on the analyses and investment opinion(s) pertaining to such issuer (or its securities and/or financial instruments) nor should the analyses or opinion(s) be considered a solicitation of any kind. Sales persons and financial advisors affiliated with MLPF&S or any of its affiliates may not solicit purchases of securities or financial instruments that are Restricted or Under Review and may only solicit securities under Extended Review in accordance with firm policies.
Neither BofA Merrill Lynch nor any officer or employee of BofA Merrill Lynch accepts any liability whatsoever for any direct, indirect or consequential damages or losses arising from any use of this report or its contents.