the future of freshwater in shatt al- arab river (southern
TRANSCRIPT
Journal of Geography and Geology; Vol. 9, No. 2; 2017
ISSN 1916-9779 E-ISSN 1916-9787
Published by Canadian Center of Science and Education
24
The Future of Freshwater in Shatt Al- Arab River (Southern Iraq)
Safaa A. R. Al-Asadi1
1 Department of Geography, Collage of Education, University of Basrah, Basrah- Iraq
Correspondence: Safaa A. R. Al-Asadi, Department of Geography, Collage of Education, University of Basrah, Basrah- Iraq. E-mail: [email protected]
Received: May 6, 2017 Accepted: May 16, 2017 Online Published: May 27, 2017
doi:10.5539/jgg.v9n2p24 URL: https://doi.org/10.5539/jgg.v9n2p24
Abstract
This study uses data from the current rate of population growth, agricultural development and effects of climate
change to estimate the future of water demand and the amount of available water in the Shatt Al-Arab River
basin. The Shatt Al-Arab River will be facing a freshwater deficit as a result of the decrease of water received
from its tributaries. Currently, the river receives freshwater from the Tigris only, as a result to dam construction
projects on the tributaries remaining. In 2040, it is expected that the freshwater from the Tigris will not be
available to the Shatt Al-Arab; therefore the intrusion of seawater into the river will increase. This may cause a
gradual change of water quality in the river from freshwater to seawater. When the Shatt Al-Arab River loses freshwater from all its tributaries the seawater will progress further from Persian Gulf towards the upstream.
Keywords: Water deficit, water demand, water quality, seawater intrusion, Tigris and Euphrates, Shatt Al-Arab
1. Introduction
In full Shatt Al-Arab River (SAR) receives freshwater from four main tributaries, which are; The Tigris,
Euphrates, Karkheh and Karun Rivers. Despite the fact that these tributaries originate in the mountains of Turkey
and Iran, Syria and Iraq share the waters of this basin. Therefore, the SARB is considered as a transboundary river basin.
The Basin faces accelerated growth of irrigated area, population and dam construction as well as climate
warming (Jones et al., 2008; Bozkurt & Sen, 2013; Issa et al., 2014). Moreover, in this region water withdrawal
are very high, although the renewal water rate is low because of dominating arid climate (El-Fadel et al., 2012).
There is no doubt that the increasing water demand within watersheds has the potential to greatly impact the
amount of available water flow in their tributaries. Water shortages are affecting the human welfare, economic activity, and political stability (Jones et al., 2008), so, predict the future situation of water is an urgent goal.
Due to the scarcity of other water resources as a result of the arid and semiarid climates, SAR has been
considered as the main water resource in Basrah governorate. The freshwater of the river also plays an important
role in the health of the northern the Persian Gulf ecosystem (Al-Yamani, 2008; UN-ESCWA, 2013). Future
predictions suggest increasing severe shortages of the water resources within the region (UNWWAP, 2009;
Droogers et al., 2012; Al-Ansari, 2013; Abdullah, 2016). Therefore, the expected decline of freshwater discharge in the SAR will severely affect the water quality as a result of the Gulf's seawater intrusion into that river.
The main objectives of this study are (1) to predict the future of freshwater quantity in the Shatt Al- Arab channel
based on the amount of water received from the River's tributaries. (2) to study the spatial and temporal variation
in concentration of the total dissolved solid (TDS) along the river, as an indicator on the marine waters intrusion
from Persian Gulf into the river, and to determine the extent of change in the river's water quality from freshwater to seawater.
2. Method
2.1. General Description of the River and Its Basin
The SAR is created by the confluence of the twin rivers the Tigris and the Euphrates in the city of Qurna in
southern Iraq about 160 Km north of Persian Gulf. It extends to the southwest for around 120 km within Iraqi
lands and 80 km the river constitutes the Iraqi-Iranian boundaries, before running into the Gulf (Figure 1). The
river's total length is about 200 km, its width ranges between 330 m in Qurna to 1250 m in the estuary and its depth varies from 8.5- 24 m (Al-Asdi, 2016).

jgg.ccsenet.org Journal of Geography and Geology Vol. 9, No. 2; 2017
25
Figure 1. Map of Shatt Al-Arab River (Modified from National Geography Maps in ArcGIS)
In addition to the Tigris and the Euphrates, there are several sub-tributaries disemboguing in the SAR, most
importantly the Karkheh and the Karun Rivers. The Karkheh River contributes to feeding Hawizhe marshes,
whose water eventually flow into the main river via joining Al-Suwaib River on the eastern bank of the SAR
about 5 km south of the Tigris- Euphrates confluence. The Karun River joins the eastern bank of that river about 72 km north of Persian Gulf.
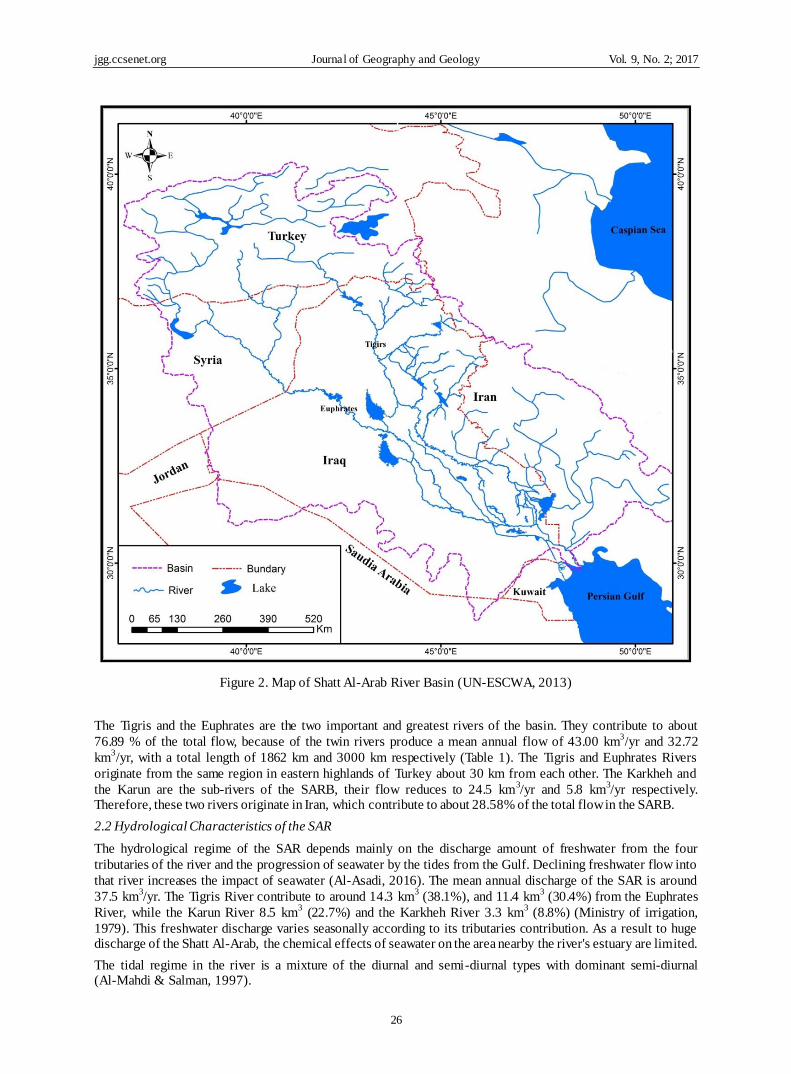
The Shatt Al-Arab River basin (SARB) is considered a transboundary basin, shared by five neighboring
countries to Iraq (Turkey, Iran, Syria, Saudi Arabia and Jordan, in addition to Iraq) (Figure 2). It is total surface
area is around 938,305 km2, 53.16% of which lies in Iraq (Table 1). Therefore, the SARB is the largest basin in
southwest Asia. The total water potential of that basin is around 106.02 km3/yr. Iraq provides 15.81% of the total
water volume of the basin via feeding the Tigris River in about 16.77 km3/yr.
jgg.ccsenet.org Journal of Geography and Geology Vol. 9, No. 2; 2017
26
Figure 2. Map of Shatt Al-Arab River Basin (UN-ESCWA, 2013)
The Tigris and the Euphrates are the two important and greatest rivers of the basin. They contribute to about
76.89 % of the total flow, because of the twin rivers produce a mean annual flow of 43.00 km3/yr and 32.72
km3/yr, with a total length of 1862 km and 3000 km respectively (Table 1). The Tigris and Euphrates Rivers
originate from the same region in eastern highlands of Turkey about 30 km from each other. The Karkheh and
the Karun are the sub-rivers of the SARB, their flow reduces to 24.5 km3/yr and 5.8 km
3/yr respectively.
Therefore, these two rivers originate in Iran, which contribute to about 28.58% of the total flow in the SARB.
2.2 Hydrological Characteristics of the SAR
The hydrological regime of the SAR depends mainly on the discharge amount of freshwater from the four
tributaries of the river and the progression of seawater by the tides from the Gulf. Declining freshwater flow into
that river increases the impact of seawater (Al-Asadi, 2016). The mean annual discharge of the SAR is around
37.5 km3/yr. The Tigris River contribute to around 14.3 km
3 (38.1%), and 11.4 km
3 (30.4%) from the Euphrates
River, while the Karun River 8.5 km3 (22.7%) and the Karkheh River 3.3 km
3 (8.8%) (Ministry of irrigation,
1979). This freshwater discharge varies seasonally according to its tributaries contribution. As a result to huge discharge of the Shatt Al-Arab, the chemical effects of seawater on the area nearby the river's estuary are limited.
The tidal regime in the river is a mixture of the diurnal and semi-diurnal types with dominant semi-diurnal (Al-Mahdi & Salman, 1997).

jgg.ccsenet.org Journal of Geography and Geology Vol. 9, No. 2; 2017
27
Table 1. Riparian countries contribution to the SARB
River Country Basin area
km2
% Discharge
km3
% Length
km
%
Tigris Turkey 45,000 12.00 21.93 51 3 400 21
Iraq 292,000 77.86 16.77 39 3 1418 77
Iran 37,000 9.87 4.30 10 3 0 0.0
Syria 1,000 0.27 0.00 0 44 2
Total 375,000 1 100 43.00
2 100 1862
1 100
Euphrates Turkey 123,200 28.00 29.12 89 3 1230 41
Iraq 206,800 47.00 0.00 0 1060 35
Syria 96,800 22.00 3.60 11 3 710 24
Saudi 13,068 2.97 0.00 0 0 0
Jordan 132 0.03 0.00 0 0 0
Total 440,000 5 100 32.72
2 100 3000
3 100
Karkheh 4
Iran 51,325 100.0 5.8 100 964 100
Karun 5 Iran 71,980 100.0 24.5 100 867 100
Shatt Al-Arab Turkey 168,200 17.93 51.05 48.15 - -
Iraq 498,800 53.16 16.77 15.81 120+80 100
Iran 160,305 17.08 34.60 32.64 80 40
Syria 97,800 10.42 3.60 3.40 - -
Saudi 13,068 1.40 0.00 - - -
Jordan 132 0.01 0.00 - - -
Total 938,305 100 106.02 100 200 - Sources:
1 (UNEP, 2001, Biedler, 2004)
2 (Kangarani , 2006; Al-Ansari et al, 2014)
3 (FAO, 2009; Biedler, 2004 )
4 (Marjanizadeh et al, 2009)
5 (UN-ESCWA, 2013)
2.3 Data Collection
The data used in this study are collected from different resources, such as the population and agriculture of the
SARB. These data are used to estimate the water demand. The population size over the basin's countries (Turkey,
Iran, Syria and Iraq) in 2010 was adopted from UN-ESCWA (2013), and the rate of population growth during the
years 2000 to 2005 was prepared by using tables of the United Nations (2001). A total agriculture area and
irrigated area in 2000 within the main tributaries of the basin (the Tigris, Euphrates, Karkheh and Karun Rivers)
are extracted from different resources (FAO, 2009; Patrick, 2004; Marjanizadeh et al, 2009; sadeghian et al, 2003;
Jaradat, 2002). Agriculture growth rate data during the years 1991- 2000 was provided by Belloumi & Matoussi
(2009). Climate change data is important to the potential available water and evaporation losses, these data are
extracted from Milly et al. (2005), UNWWAP (2009), Republic of Turkey (2009), Terink et al. (2013) and
Bozkurt & Sen (2013). Annual water discharge of the main tributaries was collected from Kangarani (2006),
Marjanizadeh et al. (2009), UN-ESCWA (2013) and Al-Ansari et al. (2014). Total dissolved solid (TDS)
concentration was used in this study to investigate the changes in river water quality during the years 1977- 1978
as a base year to 2010- 2011 based on data availability. The data concerning TDS were compiled from four
important sites along the river from city center (Basrah) to the Fao city (estuary area) (Ministry of Water Resources, 1979; Hussin et al., 1991; Al-Asadi et al., 2015).
The prediction for the future size of the population, irrigated areas, evaporation values and tributaries water
discharge are obtained by applying the following formula in Microsoft Excel 2010 software (Mavron & Phillips, 2000):
Pt = P0 (1 + r) t (1)
Where:
Pt denotes the size of the variables at time t.

jgg.ccsenet.org Journal of Geography and Geology Vol. 9, No. 2; 2017
28
P0 denotes the initial size of the variables.
r denotes the Annual Growth rate of the variable.
It should be noted that there are several economic, cultural and technical factors which contribute to the change
of growth rates. However, these rates are assumed to remain constant over the prediction decades. The end of the
prediction is defined as the year 2040 to coincide with the completion of the operations of the Southeastern Anatolia Project (GAP) in Turkey is expected to last the year 2030 or even 2040 (USAWC, 2001).
The water balance of the main tributaries for four decades (2000- 2040) is predicted based on data that include
the available water and the expected future water demand for agricultural and domestic use that covers about 95%
of the total water withdrawal across the basin (Kangarani, 2006), taking into account the decrease of annual
water discharge and increase of the evaporation losses from lakes surface due to climate changes. The seepage
losses from water bodies and industrial withdrawals are excluded from this study due to the fact that seepage
may be insignificant as a result to dominants of silt and clay sediments across the basin (Aqrawi, 1995), and
inherent difficulty in determining industrial usage. The result of water balance is used to expect freshwater that
could reach the Shatt Al-Arab channel. Water balances are computed with the assumption the growth rate of water utilization is constant for the study horizon. The water balance is computed as (Patrick, 2004):
Water Balance (km3/yr) = Supply – Demand (2)
Where:
Supply = annual water discharge (km3/yr)
Demand = annual water withdrawn (km3/yr).
3. Results
3.1 Factors Affecting Runoff within the SARB
3.1.1 Population Growth in the SARB
Population growth leads to stress on water resources, due to the increase of the demands for freshwater, as well
as the contamination events associated with land uses. Moreover, distribution of population within the region
also plays a major role in the pressure on water resources available (Abughlelesha & Lateh, 2013). Humans
already utilized half of the available runoff, either by consumption and agriculture or indirectly in the form of pollution (Postel, 2000).
Census estimations in the SARB shows that the population was 52.41 million people in 2010 (Table 2), more
than half of the basin’s population (28.60 million, 54.57% of the total) live in Iraq. Of these, 64.33% (18.40
million) live in Tigris River and 35.67% (10.20 million) live in Euphrates River. The mean of water consumption for domestic purposes was 250- 350 liters per capita per day.
The annual population growth rate is 1.3% in Turkey, actual population growth is 1.4% in Iran, and with an
annual demographic growth estimated at 2.5% in Syria (Table 2). Iraq has the highest rate of population growth
among basin's countries; growing at a pace of 2.7% annually in 2000-2005. Population growth is a direct
determinant factor of increases in water demand for domestic uses. So the water demand for domestic uses in the SARB is continuously increasing, especially in Syria and Iraq due to the increase of population.
3.1.2 Agricultural Development Sector on the SARB
Turkey is engaged in utilizing both the Tigris and the Euphrates Rivers by the Southeastern Anatolia Project
whose contents irrigate around 9,100,000 hectares (ha) along the Euphrates basin and 540,000 ha along the
Tigris basin (Table 2). Syria Plans to irrigate around 640,000 ha in the Euphrates River valley, and although it
has only one bank of the Tigris River, it Plans to irrigate range from 150,000 to 372,000 ha (Haddad et al, 2013).
The Iraqi government decides to irrigate an area of about 3,305,000 ha, 2,200,000 ha are in the Tigris River, 1,000,000 ha in the Euphrates River, in addition to 105,000 ha in the SAR (Jaradat, 2002).
The total planned area to be irrigated is around 600,000 ha in the Karkheh River basin. The Iranian government
planned to provide irrigation water for an ultimate development irrigated area of 480,000 ha in the Karun River.
With irrigated land development, the water demand is increasing. Irrigation water needs to vary according to
human and natural factors in the countries of the river basin. For Turkey, Iran and Syria the annual irrigation
water requirement ranges from 10,000 m3/ha to 12,000 m
3/ha, and rise in Iraq between 13,000 m
3/ha to 15,000
m3/ha (Table 2).

jgg.ccsenet.org Journal of Geography and Geology Vol. 9, No. 2; 2017
29
Table 2. Population and irrigated area water demand within countries of SARB
Country River basin
P(MP)
2010 1
WD
(L/P)
PGR 2
00-2005
TAA
(Mha)
IA (ha)
2000
WD 8
(M3/ha)
AGR 9
91-2000
Turkey Tigris 3.47 250 1.3 0.54 3 57,000 10,000-
12,000
5.7% *
Euphrates 7.15 0.91 3 103,000
Total/mean 10.62 1.45 409,655 11,000
Iran Karkheh 4.00 250 1.4 0.60 5 93,900 10,000-
12,000
2.2 %
Karun 3.50 0.48 6 280,000
Total/mean 7.50 1.08 550,000 11,000
Syria Euphrates 5.69 350 2.5 0.64 4 240,000 10,000-
12,000
2.6%
Iraq Tigris 18.40 350 2.7 2.20 7 1,166,880 13,000-
15,000
0.95%
Euphrates 10.20 1.00 7 549,120
Total/mean 28.60 3.20 1,716,00 14,000
Note. P(MP): population (Million people); WD (L/P): water demand (liter/ people); PGR: Population growth rate ; TAA (Mha): Total agriculture area (million hectares) ; IA: Irrigated area; AGR: Agriculture growth rate.
* Calculated of present study.
Sources:
1 (UN-ESCWA, 2013)
2 (UN, 2001)
3 (FAO, 2009)
4 (Patrick, 2004)
5 (Marjanizadeh et al, 2009)
6 (sadeghian et al, 2003)
7 (Jaradat, 2002)
8 (Beaumont, 1998).
9 (Belloumi &Matoussi, 2009)
3.1.3 Hydrological Projects on the SARB
The freshwater in the SAR and hydrological regime have been intensively affected by the development of dam constructions in the countries of the river basin.
Iraq was the first to start utilizing water of the Rivers by constructing irrigation and flood control systems. The
first hydraulic projects were Hindiyah barrage in 1918 on the Euphrates River, and Al Kut barrage in 1939 on the
Tigris River, the total storage capacity of the reservoirs was around 144.46 km3 (Table 3). In 1962, Iran
completed Dez dam on the Karun River, the overall volume of water in the reservoirs in Iran was around 18.35
km3. In 1970, Turkey started to utilize the water of the Tigris and Euphrates Rivers by the Southeastern Anatolia
Project (Guneydogu Anadolu Projesi) otherwise known as GAP. The project includes 13 sub-projects, seven of
which are on the Euphrates River and six on the Tigris. The total capacity storage is around 105 km3. Syria built
three main dams constructed on the Euphrates River with a total storage capacity of 13.69 km3. Tabaka dam is an
important water irrigation project, which was completed in 1975.
3.1.4 Climate Change in the SARB
The flow of tributaries of the Basin depends mainly on winter rains and spring snowmelt in the Turkish and
Iranian mountains. The flow is also influenced by the evaporation process in Syria and Iraq. Therefore, the
climate conditions are dominant factors which determine the flow amount within the catchment area. Though the
SARB lies in a transitional zone between humid Continental in Turkey and Iran, and semi-arid to arid of Syria
and Iraq, the headwaters of tributaries has a sub-tropical Mediterranean climate with cold, wet winters and hot dry summers. The average monthly temperature over the river basin ranges between 6 ◦C in January to 34 ◦C in
July. It decreases towards the north. The annual precipitation ranges from 100 to 1000 mm annually (Issa et al., 2013).

jgg.ccsenet.org Journal of Geography and Geology Vol. 9, No. 2; 2017
30
Table 3. The constructed dams and barrage within the SARB
Country Name of dam River Capacity
Storage km3
Water surface
area km2
Date of
operation
Use *
Turkey Devegecidi Tigris 0.2 32.1 1972 I
Goksu Tigris 0.06 3.9 1991 I
Dicle Tigris 0.60 24 1997 HP,I
Kralkizi Tigris 1.92 57.5 1997 HP
Batman Tigris 1.18 49.2 1998 HP, I
Ilisu Tigris 10.41 299.5 UC HP
Keban Euphrates 31 675 1975 HP
Karakaya Euphrates 9.58 268 1987 HP
Ataturk Euphrates 48.7 817 1992 HP, I
Karkamis Euphrates 0.16 28.4 1999 HP, FC
Birecik Euphrates 1.22 56.3 2000 HP, I
Syria Tabaqa Euphrates 11.7 610 1975 HP, I
Baath Euphrates 0.09 27.2 1988 HP, I, FC
Tishrine Euphrates 1.9 166 1999 HP
Iran Dez Karun 3.46 - 1962 HP, I
Karun Karun 3.14 54.8 1977 HP, I
Marun Karkheh 1.2 25 1998 HP, I
Karkheh Karkheh 7.8 2001 HP, I, FC
Karun-2 Karun 2.75 2001 HP
Karun-3 Karun 2. 97 2004 I, H
Iraq Al-Kut * Tigris 1939 FD
Samarra Tigris 72.8 2170 1956 FD, I, HP
Dokan Tigris 6.8 270 1959 HP,I
Derbendikhan Tigris 3 114 1961 I
Hamrin Tigris 3.56 450 1981 I,FC
Mosul Tigris 11.1 280 1986 HP,I,FC
Al-Adheem Tigris 1.5 - 1999 HP,I
Al-Amarah * Tigris - - 2001 FD
Al Hindiyah Euphrates - - 1918 FD
Raazza Euphrates 26 1810 1951 FC
Habbaniyah Euphrates 3.3 426 1956 FC
Haditha Euphrates 8.2 500 1984 HP, I
Fallujah * Euphrates - 1985 I
Note. HP: hydropower; I: irrigation; FC: flood control; FD: flow diversion; UC: under construction.
* Barrage.
Sources:
1(UNEP, 2001)
2(FAO, 2009)
The mean temperature in the headwaters for the 1941-2007 climatic periods is about 13°C, and annual mean
precipitation for the same climatic periods is about 643 mm. Approximately, 70% of the total precipitation fall during the period between October and April (Republic of Turkey, 2009).
The Middle East is one of the most affected regions by the global climate change. It will suffer from warm and
dry conditions at the end of the 21st century (Bozkurt & Sen, 2013). Climate change in this region results in
greater water scarcity, as rainfall decreases to 25% (regionally) and up to 40% (locally) (UNWWAP, 2009). The
temperature has an increasing trend of 0.64°C/100 years (Republic of Turkey, 2009). The Evaporation also
increases but the increase is small, its maximum rate is about 9% (Terink et al., 2013; Bozkurt & Sen, 2013) the
average increase is around 0.23% per year. Consequently, there will be a reduction of 10- 30% in the annual
surface runoff from the headwaters regions by the year 2050 (Milly et al., 2005), with an average that decreases is about 0.5% per year.

jgg.ccsenet.org Journal of Geography and Geology Vol. 9, No. 2; 2017
31
3.2 Water Availability within the SARB
The total potential flow of the Tigris River reduction and water demand increase with time. Annual mean of
water flow amount is 43.00 km3/yr, whereas the total water withdraw at the basin is 24.56 km
3/yr, so there are
water surpluses of 18.44 km3/yr (Table 4), it can reach the SAR. A water of the river will decrease to 35.19
km3/yr by 2040, in contrast water demand could climb up to 41.69 km
3/yr, and the water balance will be in
deficits of 6.50 km3.
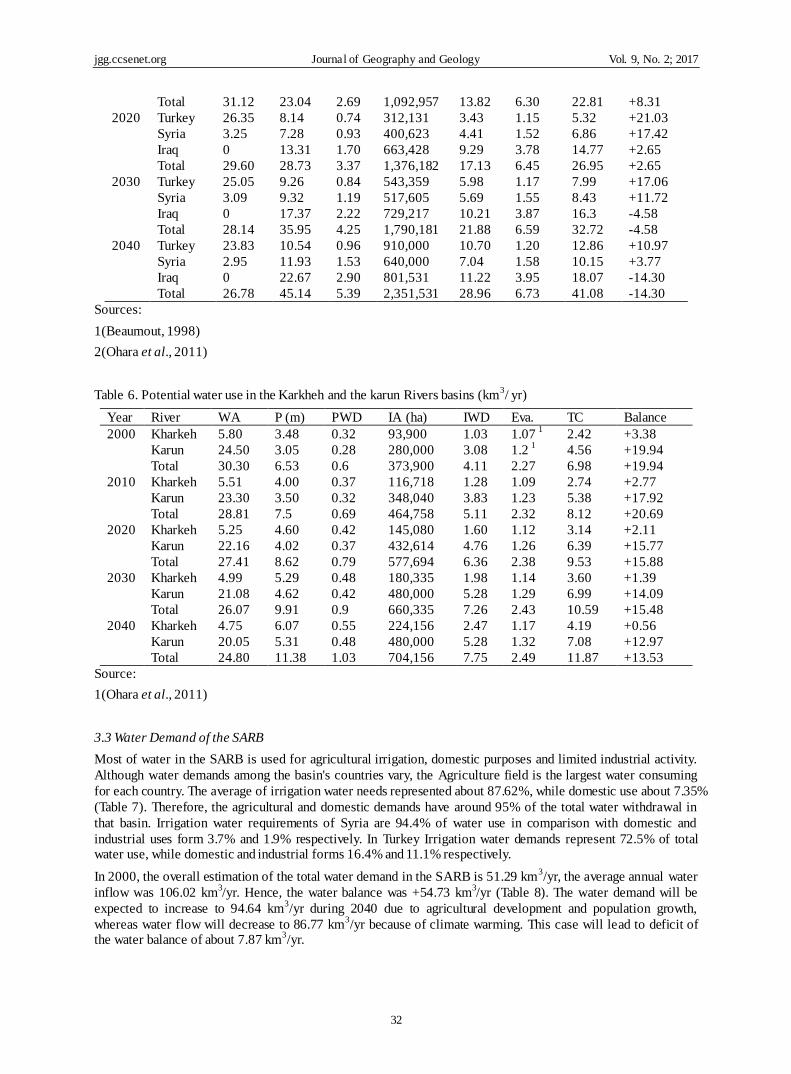
In 2030, the water balance of the Euphrates River will be negative, with a mean deficit of 4.58 km3/yr (Table 5).
Due to decline in the discharge water to 28.14 km3/yr and increase of the water consumption to about 32.72
km3/yr. Furthermore, the water deficit in that river could increase to 14.30 km
3/yr in 2040. The reduction rate of
water flow in the Euphrates River is 0.5665 km3/yr.
Due to decreased water flow in the Tigris and Euphrates Rivers, the water salinity of the two rivers is increasing in place and time (Abdullah, 2016).
Water demand within the Karkheh and Karun Rivers basins is increasing to 4.19 km3/yr and 7.08 km
3/yr
respectively by 2040; in contrast the water discharge in both rivers is decreasing to 4.75 km3/yr and 20.05 km
3/yr.
However, the water balances in two rivers are surplus of 0.24 km3/yr and 12.57 km
3/yr respectively (Table 6).
Table 4. Potential water use in the Tigris River basin (km3/ yr)
Year Country AW P (m) PWD IA (ha) IWD Eva. TC Balance
2000 Turkey 21.93 3.05 0.28 57,000 0.63 0.63 1 1.54 +20.39
Iran 4.30 0 0 0 0 0 0 +4.30
Iraq 16.77 14.10 1.80 1,166,880 16.34 4.88 2 23.02 +18.44
Total 43.00 17.15 2.08 1,223,880 16.97 5.51 24.56 +18.44
2010 Turkey 20.86 3.47 0.32 99,226 1.09 0.65 2.06 +18.80
Iran 4.09 0 0 0 0 0 0 +4.09
Iraq 15.95 18.4 2.36 1,282,595 17.96 4.99 27.37 +11.47
Total 40.90 21.87 2.68 1,381,821 19.05 5.64 29.43 +11.47
2020 Turkey 19.84 3.95 0.36 172,733 1.90 0.67 2.93 +16.91
Iran 3.89 0 0 0 0 0 0 +3.89
Iraq 15.17 24.02 3.07 1,409,785 19.74 5.11 28.13 +7.84
Total 38.90 27.97 3.43 1,582,518 21.64 5.78 31.06 +7.84
2030 Turkey 18.87 4.49 0.41 300,694 3.31 0.69 4.41 +14.46
Iran 3.70 0 0 0 0 0 0 +3.70
Iraq 14.43 31.35 4.01 1,549,588 21.69 5.23 30.93 +1.66
Total 37.00 35.84 4.42 1,850,282 25.00 5.92 35.34 +1.66
2040 Turkey 17.95 5.11 0.47 540,000 5.94 0.71 7.12 +10.83
Iran 3.52 0 0 0 0 0 0 +3.52
Iraq 13.72 41.92 5.37 1,703,253 23.85 5.35 34.57 -6.50
Total 35.19 47.03 5.84 2,243,253 29.79 6.06 41.69 -6.50
Note. AW: Available water; TC: Total consumption.
Sources:
1(Beaumout, 1998)
2(Ohara et al., 2011)
Table 5. Potential water use in the Euphrates River basin (km3/ yr)
Year Country AW P (m) PWD IA (ha) IWD Eva. TC balance
2000 Turkey 29.12 6.28 0.57 103,000 1.13 1.10 1 2.8 +26.32
Syria 3.60 4.45 0.57 240,000 2.64 1.45 2 4.66 +25.26
Iraq 0 7.81 1.00 549,120 7.67 3.62 2 12.29 +12.97
Total 32.72 18.54 2.14 892,120 11.44 6.17 19.75 +12.97
2010 Turkey 27.70 7.15 0.65 179,303 1.97 1.12 3.74 +23.96
Syria 3.42 5.69 0.73 310,080 3.4 1.48 5.61 +21.77
Iraq 0 10.2 1.31 603,574 8.45 3.70 13.46 +8.31
jgg.ccsenet.org Journal of Geography and Geology Vol. 9, No. 2; 2017
32
Total 31.12 23.04 2.69 1,092,957 13.82 6.30 22.81 +8.31
2020 Turkey 26.35 8.14 0.74 312,131 3.43 1.15 5.32 +21.03
Syria 3.25 7.28 0.93 400,623 4.41 1.52 6.86 +17.42
Iraq 0 13.31 1.70 663,428 9.29 3.78 14.77 +2.65
Total 29.60 28.73 3.37 1,376,182 17.13 6.45 26.95 +2.65
2030 Turkey 25.05 9.26 0.84 543,359 5.98 1.17 7.99 +17.06
Syria 3.09 9.32 1.19 517,605 5.69 1.55 8.43 +11.72
Iraq 0 17.37 2.22 729,217 10.21 3.87 16.3 -4.58
Total 28.14 35.95 4.25 1,790,181 21.88 6.59 32.72 -4.58
2040 Turkey 23.83 10.54 0.96 910,000 10.70 1.20 12.86 +10.97
Syria 2.95 11.93 1.53 640,000 7.04 1.58 10.15 +3.77
Iraq 0 22.67 2.90 801,531 11.22 3.95 18.07 -14.30
Total 26.78 45.14 5.39 2,351,531 28.96 6.73 41.08 -14.30
Sources:
1(Beaumout, 1998)
2(Ohara et al., 2011)
Table 6. Potential water use in the Karkheh and the karun Rivers basins (km3/ yr)
Year River WA P (m) PWD IA (ha) IWD Eva. TC Balance
2000 Kharkeh 5.80 3.48 0.32 93,900 1.03 1.07 1 2.42 +3.38
Karun 24.50 3.05 0.28 280,000 3.08 1.2 1 4.56 +19.94
Total 30.30 6.53 0.6 373,900 4.11 2.27 6.98 +19.94
2010 Kharkeh 5.51 4.00 0.37 116,718 1.28 1.09 2.74 +2.77
Karun 23.30 3.50 0.32 348,040 3.83 1.23 5.38 +17.92
Total 28.81 7.5 0.69 464,758 5.11 2.32 8.12 +20.69
2020 Kharkeh 5.25 4.60 0.42 145,080 1.60 1.12 3.14 +2.11
Karun 22.16 4.02 0.37 432,614 4.76 1.26 6.39 +15.77
Total 27.41 8.62 0.79 577,694 6.36 2.38 9.53 +15.88
2030 Kharkeh 4.99 5.29 0.48 180,335 1.98 1.14 3.60 +1.39
Karun 21.08 4.62 0.42 480,000 5.28 1.29 6.99 +14.09
Total 26.07 9.91 0.9 660,335 7.26 2.43 10.59 +15.48
2040 Kharkeh 4.75 6.07 0.55 224,156 2.47 1.17 4.19 +0.56
Karun 20.05 5.31 0.48 480,000 5.28 1.32 7.08 +12.97
Total 24.80 11.38 1.03 704,156 7.75 2.49 11.87 +13.53
Source:
1(Ohara et al., 2011)
3.3 Water Demand of the SARB
Most of water in the SARB is used for agricultural irrigation, domestic purposes and limited industrial activity.
Although water demands among the basin's countries vary, the Agriculture field is the largest water consuming
for each country. The average of irrigation water needs represented about 87.62%, while domestic use about 7.35%
(Table 7). Therefore, the agricultural and domestic demands have around 95% of the total water withdrawal in
that basin. Irrigation water requirements of Syria are 94.4% of water use in comparison with domestic and
industrial uses form 3.7% and 1.9% respectively. In Turkey Irrigation water demands represent 72.5% of total water use, while domestic and industrial forms 16.4% and 11.1% respectively.
In 2000, the overall estimation of the total water demand in the SARB is 51.29 km3/yr, the average annual water
inflow was 106.02 km3/yr. Hence, the water balance was +54.73 km
3/yr (Table 8). The water demand will be
expected to increase to 94.64 km3/yr during 2040 due to agricultural development and population growth,
whereas water flow will decrease to 86.77 km3/yr because of climate warming. This case will lead to deficit of
the water balance of about 7.87 km3/yr.

jgg.ccsenet.org Journal of Geography and Geology Vol. 9, No. 2; 2017
33
Table 7. Percentage of water Consumption by main sectors within countries of SRB
Country
Water withdrawal
agricultural purposes % domestic supplies % industrial use %
Turey 72.5 16.4 11.1
Syria 94.4 3.7 1.9
Iraq 92 3 5
Iran 91.6 6.3 2.1
Mean 87.62 7.35 5.03
Source:
(Kangarani, 2006)
Table 8. Water balance (km3/yr) of whole river basin
Year Total water available Total conception Water balance
2000 106.02 51.29 +54.73
2010 100.83 60.36 +40.47
2020 95.91 67.54 +28.37
2030 91.21 78.65 +12.56
2040 86.77 94.64 -7.87
3.4 Freshwater discharge in the SAR
The mean annual flow of the SAR at Basrah and Mehilla sites during 1977-1978 year was 919 m3/s (28.95
km3/yr). This increased to 1189 m
3/s (37.45 km
3/yr) at Seebah and Fao sites due to the water received from the
Karun River (Table 9). In 1994- 1995 year the average annual discharge decreased to 724 m3/s (22.81 km
3/yr)
and 815 m3/s (25.67 km
3/yr) upstream and downstream Karun River respectively. The mean monthly discharge
gradually increases from January to July. The greatest flow occurred in June and May for the 1978-1979, with an
average of 1506 m3/s and 2465 m
3/s upstream and downstream respectively. In 1994-1995 the maximum flow
occurred in April and February. The average values at Basrah and Fao were 900 m3/s and 2465 m
3/s respectively.
Table 9. Monthly average of water discharge (m3/s) in the SAR at four sites
Months
Year Site Oct. Nov Des Jan. Feb. Mar. Apr. May. Jun. Jul. Aug Sep. Av.
77-1978 1 A 230 317 495 797 916 1082 1191 1313 1506 1463 963 563 919
B 230 317 495 797 916 1082 1191 1313 1506 1463 963 563 919
48-1960 2 C 392 449 565 753 1021 1515 2111 2465 2270 1456 785 486 1189
D 392 449 565 753 1021 1515 2111 2465 2270 1456 785 486 1189
94-1995 3 A 632 616 600 831 891 895 900 729 686 678 612 615 724
B 632 616 600 831 891 895 900 729 686 678 612 615 724
C 834 879 - 1039 1064 - 725 547 - 601 826 - 815
D 834 879 - 1039 1064 - 725 547 - 601 826 - 815
10-2011 3 A 39 36 35 39 51 45 38 50 43 42 45 62 44
B 39 36 35 39 51 45 38 50 43 42 45 62 44
C 39 36 35 39 51 45 38 50 43 42 45 62 44
D 39 36 35 39 51 45 38 50 43 42 45 62 44
Note. A: Basrah; B: Mehilla; C: Seebah; D: Fao.
Sources:
1 (Ministry of Irrigation, 1979)
2 (Al- Mahdi & Salman, 1997)
3 (Al-Asadi et al., 2015)

jgg.ccsenet.org Journal of Geography and Geology Vol. 9, No. 2; 2017
34
In 2010 the hydrological regime of the SAR discharge was almost completely dependent on the freshwater influx
from the Tigris River as a result of diverting flow of the Karkhah and Karun Rivers inside the Iranian boundaries
and cutoff the Euphrates River. Therefore, the mean annual discharge of the SAR dropped to 44 m3/s (1.39
km3/yr), with a monthly variation limited, it's from 35 m
3/s and 62 m
3/s.
3.5 Water quality of the SAR
Water quality of the SAR is influenced by the chemical ions inflow from the main tributaries of the River and the
marine salt from Persian Gulf (Moyel & Hussain, 2015; Abdullah, 2016). The mean TDS concentration at
Basrah site for the 1977-1978 year was 0.71 g/l, increasing to 1.25 g/l at Fao site (Table 10). In 1997-1998 year
the average of TDS values increased to 0.96 g/l at Basrah and 1.84 g/l at Fao in 1994-1995. Due to the loss of
most tributaries the freshwater flow in the river was reduced during 2010-2011 year combined with increases of
the seawater intrusion from Persian Gulf, thus the mean TDS values high increase to 1.77 g/l at Basrah, 2.30 g/l at Mehilla site, 2.27 g/l at Seebah site and the maximum TDS value of 12.21 g/l at the Fao.
Table 10. Average monthly of TDS (g/l) in the SAR at four sites
Months
Year Site Oct. Nov Des Jan. Feb. Mar. Apr. May. Jun. Jul. Aug Sep. Av.
77-1978 1 A 1.1 1.0 0.8 0.6 0.5 0.6 0.5 0.7 0.4 0.4 0.7 1.2 0.71
B 0.63 0.65 0.89 0.94 0.80 0.83 0.78 0.88 - - - 0.85 0.81
C 0.48 1.14 1.15 0.92 0.58 0.42 0.31 0.71 0.35 0.55 1.94 0.26 0.73
D 2 0.98 1.62 1.70 - 0.89 1.12 - 1.16 0.78 0.94 2.20 1.15 1.25
97-1998 3 A 1.44 1.35 1.17 1.00 1.01 1.06 1.08 0.73 0.87 0.89 - 0.29 0.96
B 1.44 1.36 - 0.99 1.07 1.08 1.05 0.71 0.88 1.01 1.02 - 1.06
94-1995 3 C 1.36 0.94 - 0.90 0.83 - 0.95 0.96 - 1.10 1.47 - 1.07
D 1.27 0.83 - 0.96 0.94 - 1.08 0.97 - 2.68 5.99 - 1.84
10-20113 A 1.59 1.94 1.82 1.58 1.70 1.89 2.01 1.89 1.55 1.80 - 1.65 1.77
B - 1.70 2.00 2.07 2.43 2.29 2.45 2.39 - - 2.93 2.46 2.30
C 2.42 1.81 1.93 1.77 2.75 - 1.51 1.19 1.83 1.40 3.05 5.27 2.27
D 9.74 13.39 12.85 17.12 - 9.40 8.36 16.75 8.65 11.45 26.61 33.17 12.21
Note. A: Basrah; B: Mehilla; C: Seebah; D: Fao.
Sources
1 (Hussin et al., 1991)
2 (Ministry of Water Resources, 1979)
3 (Al-Asadi et al., 2015)
4. Discussion and Conclusions
The SARB is a transboundary basin, as is comprised of two main tributaries, namely the Tigris and the Euphrates
Rivers that originate in Turkey, in addition to the Karkheh and the Karun Rivers which originate in Iran. The
potential of the total water flow in the whole basin is 106.02 km3/yr, whereas the mean annual freshwater of the
SAR during 1977-1978 water year was 37.45 km3/yr. This represents about 35.37% of the total available water
of the basin. The Tigris and the Euphrates contribute to about 68.5% of the total freshwater of the SAR, 38.1%
from the Tigris and 30.4% from the Euphrates. The Karkheh and the Karun Rivers contribute to 31.5% of the
mean discharge, with 8.8% from the Karkheh and 30.4% from the Karun. Hydrological regime of the SAR
depends on freshwater from these four tributaries plus the progression of seawater by the tides from Persian Gulf.
In the past (until 2000), the SAR used to receive freshwater from four main tributaries, with average about 37.5
km3/yr. This quantity of freshwater could prevent the progress of seawater in the river and may reach a distance
of about 5 km inside Persian Gulf (Massoud, 1978). Therefore, the annual mean of TDS concentration in the river water ranges from 0.71 g/l at Basrah site to 1.25 g/l at Fao site for the 1977-1978 water year.
The Present data indicate a shift toward water stress at the tributaries of the SAR in the future. Due to the
increasing water demand as a result to growth of population and development of irrigated area, as well as the

jgg.ccsenet.org Journal of Geography and Geology Vol. 9, No. 2; 2017
35
constructed dams within river basin. In addition to the contribution of climate warming in reduce water discharge,
by reducing runoff and increasing water evaporation losses. This expected result will affect the amount of freshwater flowing in the Shatt Al-Arab channel.
The mean annual water discharge of the Tigris River will reduce to 35.19 km3/yr by 2040, whereas the water
withdraw increases to 41.69 km3/yr, so the water balance will be in deficits of 6.50 km
3. After entering Iraq, the
reduction rate of water flow in the Tigris River is 0.26 km3/yr, while this rate increases to 0.62 km
3/yr at the
confluence point (Qurna). This indicates that Iraq is the largest consuming country of water from this river.
In 2030, the water consumption of the Euphrates River will be about 32.72 km3/yr, whereas the expected decline
in the discharge water to 28.14 km3/yr. Hence, the water balance deficit of 4.58 km
3/yr. The early deficit in the
Euphrates River because of extensive water consumption in agricultural irrigated land and domestic uses,
compared with the limited amount of water discharge, in addition great water loss by evaporation from reservoirs.
The reduction rate of water flow in the Euphrates River is 0.5665 km3/yr. SAR is losing freshwater from the
Euphrates; as a result of the dike construction by Iraqi government in 2010 on the river at Basra boundaries about 32 km west the confluence point. Hence, the SAR lost 30.4% of the total freshwater discharge.
It should be noted that in future the surface water shortage within Iraq, eventually lead to decrease irrigated area.
Hence, it cannot be expected that the Tigris and Euphrates flow dries, but the quantity and quality water properties will be unavailable for usage to extreme water flow scarcity.
Though, Turkish developing their water supply projects within the Tigris and the Euphrates Rivers basins, the
overall estimation of water demand is about 7.12 km3/yr and 10.97 km
3/yr in 2040 at the two rivers respectively.
These represent 20.23% and 40.96% of the available water (35.19 km3/yr and 26.78 km
3/yr) of the basins. While
water withdrawals are increasing for Iraq into 34.57 km3/yr and 18.07 km
3/yr in 2040 at the two rivers
respectively, it represents 98.24% and 67.48% of the total water flow. Due to development of agricultural land
and lack of regulatory framework for efficient use of water supply (FAO, 2012). Therefore, Iraq will witness severe shortages in water resources, as a result of the location in the lower part of basin.
The future water balances in the Karkheh and the Karun Rivers are expected to be positive, with a mean surplus
of 0.24 km3/yr and 12.57 km
3/yr respectively. The SAR is not receiving flow from two rivers since 2001 and
2009, as result of the diversion of these rivers by Iran. Hence, the SAR lost 31.5% of the total amount.
Currently, the sources of freshwater in the SAR were limited to the Tigris River, with an annual discharge of 1.39
km3/ yr by Al-Amarah barrage, for that then the river became part of the Tigris and its basin. The freshwater
discharge of the SAR dropped about 96.29% of the total discharge in the water year 1977-1978, this quantity of
freshwater flow can't prevent of seawater progress to the north of Fao city. Thus, the mean TDS values in the
river water were highly increased to 1.86 g/l at Basrah, and the maximum TDS values occurred at the Fao site
with average 12.21 g/l. This high values due to the freshwater flow in the river was reduced during 2010-2011
year, combined with increases of the seawater intrusion from Persian Gulf, especially at the Fao site. Besides,
there was a loss of most river's tributaries, in particular the Karun River which was as a natural dam that blocks or delays the progression of marine waters.
When TDS value for categorizing waters method is used (Hiscock, 2005), the river water within upstream from
Basrah to Fao is considered to be of brackish water, while the downstream section from Fao to Persian Gulf is
considered to be of saline water (seawater). This water is almost similar to the marine water environment at the
north part of Persian Gulf, with ranges of TDS from 21.5-37.6 g/l (Al-Mahdi et al., 2007), and it's unsuitable for
different uses. This could be an indicator fact that the estuary area of the SAR is regression distance of about 30 km in the river from Ras Albisha to the northern Fao city.
In 2040, the freshwater from the Tigris River will not be available to the SAR, as a result to extensive upstream
water developments. Accordingly, it is expected that the TDS concentration in the Shatt Al-Arab water will
record the highest levels, and progress increase of the marine waters towards the north in the river channel to
reach Basrah city. As it occurred in August 2009, the saline marine water intrusion reaches to Basrah city and
increased TDS values to more than 15 g/l as a result of decline freshwater discharge from the Tigris River to around 18 m
3/s. (Ministry of water resources, 2009).
According to the current changes expected, the Shatt Al-Arab channel will be just a waterway for marine waters
flowing by tide phenomenon, or as drainage channel for the wastewater flowing from different uses in the
watershed, especially in the part extended from the city of Basrah to Persian Gulf, with a length is about 110 km.
Therefore, some researchers called for the construction the barrage in the southern part of the Shatt Al-Arab channel to prevent the intrusion of marine waters in to the river.

jgg.ccsenet.org Journal of Geography and Geology Vol. 9, No. 2; 2017
36
5. Recommendations
The study gives forward the following recommendations:
1- Reconsidering the areas irrigated by surface water, irrigation systems and crop plants within Iraq especially in Basrah province.
2- Search for new solution to avoid freshwater scarcity in the SAR by using desalination plants.
3- Dispense with an idea of a construction barrage on southern SAR, due to the fact that in the future marine waters may be the main source of water supply to the peoples.
Acknowledgments
We would like to thank Prof. Dr. Abdul Zahra AL- Hello, Department of Marine Chemistry, Marine Science
Center, University of Basrah, and Assist. Prof. Dr. Alaa Al-Abadi, Department of Geology, College of Science,
University of Basrah, for valuable and very interesting. Many thanks also for Prof. Dr. Ala' Oda, and Assist. Prof.
Mahdi Alasadi, Department of English, College of Education for Human Sciences, University of Basrah for reviewing English language of this manuscript.
References
Abdullah, A. D. (2016). Modelling approaches to understand salinity variations in a highly dynamic tidal river,
the case of the Shatt al-Arab River, dissertation of Delft University of Technology and of the Academic Board of the UNESCO-IHE, 186 p.
Abughlelesha, S. M., & Lateh, H. B. (2013). A Review and Analysis of the Impact of Population Growth on
Water Resources in Libya. World Applied Sciences Journal, 23, 965-971. https://doi.org/10.5829/idosi.wasj.2013.23.07.13102
Al-Ansari, N. A. (2013). Management of Water Resources in Iraq: Perspectives and Prognoses. Engineering, 5, 667-684. https://doi.org/10.4236/eng.2013.58080
Al-Ansari, N., Ali, A. A., & Knutsson, S. (2014). Present Conditions and Future Challenges of Water Resources
Problems in Iraq. Journal of Water Resource and Protection, 6, 1066-1098. https://doi.org/10.4236/jwarp.2014.612102
Al-Asadi, S. A. R. (2016). A study of pH values in the Shatt Al-Arab River (southern Iraq). International Journal of Marine Science, 29, 1-8. https://doi.org/10.5376/IJMS.2016.06.0026
Al-Asadi, S. A., Abdullah S. S., & Al-Mahmood, H. Kh. (2015). Estimation of minimum amount of the net discharge in the Shatt Al- Arab River (south of Iraq). Journal of Adab Al- Basrah, 2, 285-314. (In Arabic)
Al-Mahdi, A. A., Abdullah, S.S., & Hussian, N. A. (2007). Some features of the physical oceanography in Iraqi marine waters. Marina Mesopotamica, 22(2), 209-222.
Al-Mahdi, A., A., & Salman, H. H. (1997). Some Hydrological characteristics of the Shatt Al-Arab River, south of Iraq. Marina Mesopotamica, 12, 63-74.
Al-Yamani, F. (2008). Importance of the freshwater influx from the Shatt-Al-Arab River on the Gulf marine environment. Protecting the Gulf’s Marine Ecosystems from Pollution, springer, pp 207-222.
Aqrawi, A. A. M. (1995). Correction of Holocene sedimentation rates for mechanical compaction: the
Tigris-Euphrates Delta, lower Mesopotamia, Marine and petroleum geology, 12(4), 409- 416. https://doi.org/10.1016/0264-8172(95)96903-4
Beaumont, P. (1998). Restructuring of Water Usage in the Tigris-Euphrates Basin: The Impact of Modern Water Management Policies. Yale School of Forestry and Environmental Studies, Bulletin Series, 103, 168-186.
Belloumi, M., & Matoussi, S. M. (2009). Measuring agricultural productivity growth in MENA countries.
Journal of Development and Agricultural Economics, 4, 103-113. Retrieved from http://www.academicjournals.org/JDAE
Biedler, M. (2004). Hydropolitics of the Tigris-Euphrates River basin with implications for the European Union. Centre Européen de Recherche Internationale et Stratégique (CERIS), Research Papers N° 1, 44 P.
Bozkurt, D., & Sen, O. L. (2013). Climate change impacts in the Euphrates-Tigris Basin based on different
model and scenario simulations. Journal of Hydrology, 480, 149-161. https://doi.org/10.1016/j.jhydrol.2012.12.021
Droogers, P., Immerzeel, W., Terink, W., Hoogeveen, J., Bierkens, M., van Beek, L., & Debele, B. (2012). Water

jgg.ccsenet.org Journal of Geography and Geology Vol. 9, No. 2; 2017
37
resources trends in Middle East and North Africa towards 2050. Hydrology and Earth System Sciences, 16, 3101-3114. Retrieved from http://www.hydrol-earth-syst-sci.net/16/3101/2012/
El-Fadel, M., El-Sayegh,Y., Abou Ibrahim, A., Jamali, D., & El-Fadl, K. (2002). The Euphrates- Tigris basin: A
case study in surface water conflict resolution. Journal of Nat. Resour. Life Sci. Educ., 31, 99-110. Retrieved from http://www.JNRLSE.org
Food and Agriculture Organization (FAO). (2009). Irrigation in the Middle East region in figures: aquastat Survey- 2008, FAO Water Reports 34. Edited by K. Frenken, Rome, 402 p.
Food and Agriculture Organization (FAO). (2012). Iraq: Agriculture sector note, FAO investment center, country highlights, Rome, 72p. Retrieved from http://www.fao.org
Haddad, G., SzéleS I., & ZSarnóczaI, J. S. (2013). Water management development and agriculture in Syria, Bull.
of the Szent István Univ., Gödöllő, 2008, Social Sciences, Szent István University, Gödöllő, Hungary, 183-194.
Hiscock, K. M. (2005). Hydrogeology Principles and Practice, Black Well Publishing, USA., 389 P.
Hussain, N. A., Al-Najar, H. H., Al-Saad, H. T., Yousif, U. H. and Al- Saboonchi, A. A. (1991). Shatt Al-Arab basic scientific studies, Marine Science Centre Publ. Basrah University., 391 p. (In Arabic).
Issa, E., Al-Ansari, N., Sherwany, G., & Knutsson, S. (2014). Expected Future of Water Resources within
Tigris-Euphrates Rivers Basin, Iraq. Journal of Water Resource and Protection, 6, 421-432. https://doi.org/10.4236/jwarp.2014.65042.
Issa, I., Al-Ansari, N., Sherwany, G. & Knutsson, S. (2013). Trends and future challenges of water resources in
the Tigris–Euphrates Rivers basin in Iraq. Hydrol. Earth Syst. Sci. Discuss., 10, 14617-14644. https://doi.org/10.5194/hessd-10-14617-2013
Jaradat, A. A. (2002). Agriculture in Iraq: Resources, Potentials, Constraints, and Research Needs and Priorities ,
NCSC Research Lab, ARS-USDA 803 Iowa Avenue, Morris, MN 56267, Submitted to: Department of State-Middle East Working Group on Agriculture Washington, D. C., USA, 83 P.
Jones, C., Sultan, M., Yan, E., Milewski, A., Hussein,M., Al-Dousari, A., Al-Kaisy, S., & Becker, R. (2008).
Hydrologic impacts of engineering projects on the Tigris–Euphrates system and its marshlands. Journal of Hydrology, 353, 59-75. https://doi.org/10.1016/j.jhydrol.2008.01.029
Kangarani, H. M. (2006). Euphrates and Tigris watershed Economic, social and institutional aspects of forest in
an integrated watershed management, Forestry Outlook Study for West and Central Asia (FOWECA), Working paper, FAO, Rome, 73p.
Marjanizadeh, S., Qureshi, A. S., Turral, H., & Talebzadeh, P. (2009). From Mesopotamia to the third millennium:
the historicaltrajectory of water development and use in the Karkheh River basin, Iran , International Water
Management Institute (IWMI), working paper 135, 43 p. Retrieved from http://www.iwmi.org/Publications/Working_Papers/index.aspx
Massoud, A. H. S. (1978). Seasonal Variations of some PhysicoChemical Conditions of Shatt al -Arab Estuary,
Iraq. Estuarine and Coastal Marine Science, 6, 503-513. 0302-3~24/78/0501-0Jj03 $01.00/O @ Academic Press Inc. (London) Ltd.
Mavron, V. C. & Phillips, T. N. (2000). Elements of mathematics for economics and finance, springer, UK, 311 P.
Milly, P. C. D., Dunne, K. A., & Vecchia, A. V. (2005). Global pattern of trends in streamflow and water
availability in a changing climate. Nature: International weekly journal of science, 438, 347-350. https://doi.org/10.1038/nature04312
Ministry of Irrigation. (1979). Shatt Al-Arab Project, Feas, Rep. Draft, Studies of Salinity Problem, Part A, Text, Polservies Co., Basrah, Iraq.
Ministry of Water Resources. (1979-2009). Directorate of Basra Water Resources, (Un published data).
Moyel, M. S., & Hussain, N. A. (2015). Water quality assessment of the Shatt al-Arab River, Southern Iraq. Journal of Coastal Life Medicine, 3, 459-465. https://doi.org/ 10.12980/JCLM.3.2015J5-26
Ohara, N., Asce, A. M., Kavvas, M. L., Asce, F., Anderson, M. L., Asce, M., Richard Chen, Z. Q., Asce, M., &
Yoon, J. (2011). Water Balance Study for the Tigris-Euphrates River Basin. Journal of hydrologic engineering, 1071-1082. https://doi.org/10.1061/(ASCE)HE .1943-5584.0000209

jgg.ccsenet.org Journal of Geography and Geology Vol. 9, No. 2; 2017
38
Patrick, M. (2004). Water security in the Middle East, growing conflict over development in the Euphrates-Tigris basin, Thesis, M.Phil International Peace Studies, Trinity College, Dublin, Ireland, 79 p.
Postel, S. L. (2000). Entering an era of water scarcity: the challenges ahead. Ecological Applications, 10, 941-948.
Republic of Turkey. (2009). Turkey Water Report, General Directorate of State Hydraulic Works, Turkey, 52 P.
Sadeghian, M. S., Hassunizadeh, H., & McNaughton, A. N. (2003). Optimising the River Karun system, Iran. River Basin Management 11 Transactions on Ecology and the Environment, 60, 109- 118.
Terink, W., Immerzeel, W. W., & Droogers, P. (2013). Climate change projections of precipitation and reference
evapotranspiration for the Middle East and Northern Africa until 2050. international journal of climatology, https://doi.org/10.1002/joc.3650
The United Nations World Water Assessment Programme (UNWWAP). (2009). Climate Changes, Water
Security and Possible Remedies for the Middle East, Scientific Paper, Jon Martin Trondalen, From Potential Conflict to Co-operation Potential, UNESCO-PCCP, 32 P.
U.S. Army War College (USAWC). (2001). The Euphrates-Tigris basin and the southeastern Anatolia project: Is
armed conflict in the offing? Distribution statements approved for public release. Distribution is unlimited, 24p.
United National Environment Programs (UNEP). (2001). The Mesopotamian Marshlands: Demise of an
Ecosystem, Early Warning and Assessment Technical Report, 3, UNEP/DEWA/TR.01–3, UNEP, Geneva, 58p.
United Nations (UN). (2001). Population Division, Department of Economic and Social Affairs, population. Environment and Development.
United Nations Economic and Social Commission for Western Asia (ESCWA). (2013). Inventory of shared water resources in western Asia, New York, 606 P.
Yildiz, D. (2016). Natural Diminishing Trend of the Tigris and Euphrates Stream flows is Alarming for the Middle East Future, World Scientific News, 47, 279-297.
Copyrights
Copyright for this article is retained by the author(s), with first publication rights granted to the journal.
This is an open-access article distributed under the terms and conditions of the Creative Commons Attribution license (http://creativecommons.org/licenses/by/4.0/).