the future of energy technologies: an overview of … · an overview of expert elicitations ......
TRANSCRIPT

The Future of Energy Technologies: An Overview of Expert Elicitations
Working Paper 01 2016
GGKP Research Committee on Technology and Innovation

GGKP Working Paper 01|2016
The Future of Energy Technologies: An Overview of Expert Elicitations
GGKP Research Committee on Technology and Innovation
Valentina Bosetti, Laura Díaz Anadón, Erin Baker, Lara Aleluia Reis, Elena Verdolini
January 2016

The Green Growth Knowledge Platform (GGKP) – a global partnership of leading organizations – identifies and addresses major knowledge gaps in green growth theory and practice. Established by the Global Green Growth
Institute (GGGI), the Organisation for Economic Co-operation and Development (OECD), the United Nations Environment Programme (UNEP) and the World Bank, the GGKP includes over 35 partner organizations. For
more information, visit www.greengrowthknowledge.org.
Copyright © UNEP, 2016
This publication may be reproduced in whole or in part and in any form for educational or non-profit purposes without special permission from the copyright holder, provided acknowledgement of the source is made. UNEP would appreciate receiving a copy of any publication that uses this publication as a source. No use of this publication may be made for resale or for any other commercial purpose whatsoever without prior permission in writing from the United Nations Environment Programme.
Disclaimer
The designations employed and the presentation of the material in this publication do not imply the expression of any opinion whatsoever on the part of the GGKP partners or donors concerning the legal status of any country, territory, city or area or of its authorities, or concerning delimitation of its frontiers or boundaries. Moreover, the views expressed in this document are those of the authors and do not necessarily represent the decision or the stated policy of the GGKP partners or donors, nor does citing of trade names or commercial processes constitute endorsement.

Acknowledgements The GGKP convenes research committees on key green growth themes to identify knowledge gaps and address them through coordinated research. Each committee is made up of experts from across the GGKP partner organizations and Advisory Committee as well as outside experts. The research committees are tasked with assessing the state of knowledge, identifying and prioritizing knowledge gaps and promoting a broader research agenda.
This publication was produced through the GGKP’s Research Committee on Technology and Innovation. It was produced by Valentina Bosetti (Department of Economics, Bocconi University; FEEM - Fondazione Enrico Mattei; CMCC - Euro-Mediterranean Centre on Climate Change), Laura Díaz Anadón (John F. Kennedy School of Government at Harvard University; Department of Science, Technology, Engineering and Public Policy at University College London), Erin Baker (University of Massachusetts - Amherst), Lara Aleluia Reis (FEEM - Fondazione Enrico Mattei; CMCC - Euro-Mediterranean Centre on Climate Change) and Elena Verdolini (FEEM - Fondazione Enrico Mattei; CMCC - Euro-Mediterranean Centre on Climate Change) under the direction of the Research Committee’s Co-Chairs Nick Johnstone (Organisation for Economic Co-operation and Development) and James Seong-Cheol Kang (Global Green Growth Institute). Research committee members include: Jorge Gutierrez García (Istituto Nacional de Ecología y Cambio Climático), Kookie Habtegaber (World Wildlife Fund), Marek Harsdorff (International Labour Office), Usman Iftikhar (United Nation Development Programme), Aage Jorgensen (Nordic Development Fund), Joy Kim (United Nation Environment Programme), Victor Konde (United Nations Economic Commission for Africa), Ahmed Abdel Latif (International Centre for Trade and Sustainable Development), Cosmas Ochieng (African Centre for Technology Studies), Aneta Nikolova (United Nations Economic and Social Commission for Asia and the Pacific), Joëlle Noailly (Graduate Institute of Geneva), David Popp (GGKP Advisory Committee), Shahid Yusuf (Growth Dialogue), Rene van Berkel (United Nations Industrial Development Organisation), Mike Ehst (World Bank) and Dirk Willem te Welde (Climate and Development Knowledge Network / Overseas Development Institute). Past research committee members also included Colin McCormick and Tilmann Liebert.
This study received specific funding from UNEP and the OECD.

Executive Summary
The development of new energy technologies is widely viewed as an essential element in addressing climate change. However, identifying and prioritizing which energy technologies should receive research, development and demonstration (RD&D) funding is a key challenge for policymakers. Particular difficulties arise in estimating the future performance and costs of these technologies. To address these uncertainties, researchers have reached out to technology experts in order to develop probability distributions that can provide an indication of future performance and costs of technologies, and allow for an assessment of how government RD&D spending might affect the future prospects for technological change.
Expert elicitation is a structured process for eliciting subjective probability distributions from scientists, engineers and other analysts who are knowledgeable about an issue of interest (in this case, the costs and performance of clean energy technologies). The data obtained from expert elicitations has been crucial in designing RD&D portfolios and developing better projections of future carbon emissions. This report provides a comprehensive and systematic overview and analysis of expert elicitation studies that have focused on climate mitigation technologies. The report also reviews the literature on modelling and decision-making that has utilized the data produced through expert elicitations.
A number of key knowledge gaps were identified from this work. First, the expert elicitation studies reviewed all assume RD&D spending will remain constant or increase. Given this, there is a lack of understanding related to the impact on technological change if RD&D budgets and programmes are scaled back through tightening government budgets. Second, most expert elicitation studies have focused on developed countries. However, given the significant influence that geographical background plays on how experts estimate future costs, expert elicitations should be expanded to emerging economies, which play an increasingly active role in technology innovation. Third, expert elicitations have largely been undertaken for a limited range of technologies and have not included other key climate mitigation technologies, such as utility-scale energy storage, wind, vehicles, gas turbines, geothermal and energy efficiency technologies.
The review of the expert elicitations also yielded some generalized conclusions related to RD&D expenditures. For instance, most experts believe that increased public RD&D investments will result in cost reductions for future technologies, albeit with diminishing marginal returns. That being said, the elicitations indicate that RD&D investments will often not reduce the uncertainty regarding future energy costs and that in some cases this uncertainty may increase with larger RD&D investments as the range of technologies expands.
In reviewing the range of studies, no single technology consistently stood out from the others in terms of largest cost reductions from increased RD&D spending. Even though no systematic pattern is visible, solar photovoltaic (PV) seems to receive the highest expectations for significant cost reductions. Also, carbon capture storage (CCS) is expected to improve significantly, but opinions are not as consistent as with solar PV.
The review also concluded that technologies with the greatest potential for technological change are not necessarily the best RD&D investments, since a large decrease in cost does not necessarily result in the largest societal benefits. The technological prospects as well as the role and interaction within the broader economy have to be considered. Given this, policymakers have to be careful not to simply focus on the technology that has the strongest cost reduction through RD&D investment.
The overview shows the benefits but also some limitations of using expert elicitations for gaining greater clarity on potential future technology impacts and costs. Many of these limitations could be dealt with through increased research funding to address the knowledge gaps identified.
Contents
The Future of Energy Technologies: An Overview of Expert Elicitations ...................................... 1
1. Introduction ............................................................................................................................. 2
1.1 Expert elicitations ............................................................................................................................... 2
1.2 Elicitation protocol .............................................................................................................................. 5
1.3 Aggregation issues, limitations and qualifications .............................................................................. 9
2. Literature review on expert elicitation of future energy technologies ................................. 11
2.1 Key characteristics of energy technology expert elicitations ........................................................... 11
2.2 Description of the characteristics of existing expert elicitations by technology .............................. 16
2.2.1 Bioenergy surveys ...................................................................................................................... 16
2.2.2 CCS surveys ................................................................................................................................ 18
2.2.3 Nuclear surveys .......................................................................................................................... 19
2.2.4 Solar surveys .............................................................................................................................. 21
2.2.5 Others: batteries for EV; utility storage; alternative vehicles; IGCC; gas turbines .................... 22
2.2.6 Other surveys not focused on R&D ............................................................................................ 24
2.3 Summary of the harmonized expert elicitation data ........................................................................ 26
3. Energy R&D budgets ................................................................................................................. 33
3.1 Energy RD&D budgets: an overview ................................................................................................. 33
3.2 Recommended government energy R&D budgets ........................................................................... 39
3.3 Data on the experts suggested allocation of government R&D ....................................................... 41
3.3.1 Bioenergy and biofuels government RD&D experts suggested allocation ................................ 41
3.3.2 CCS government RD&D experts suggested allocation ............................................................... 44
3.3.3 Nuclear power government RD&D experts suggested allocation ............................................. 44
3.3.4 Solar PV and CSP government RD&D experts suggested allocation .......................................... 45
3.3.5 Light duty vehicles government RD&D experts suggested allocation ....................................... 47
3.3.6 Utility scale energy storage government RD&D experts suggested allocation ......................... 49
4. Meta-analyses of energy technologies expert elicitations ....................................................... 49

4.1 Purpose of and motivation for meta-analyses.................................................................................. 50
4.2 Description of energy elicitation meta-analysis studies ................................................................... 50
4.3 Dependent and independent variables in the meta-analysis studies .............................................. 51
4.3.1. Dependent variables ................................................................................................................. 51
4.3.2. Independent variables .............................................................................................................. 52
4.4 Results ............................................................................................................................................... 53
4.4.1. Summary of results on the median impact of R&D .................................................................. 53
4.4.2. Summary of results on breakthrough costs .............................................................................. 56
4.4.3. Summary of results on the range of uncertainty ...................................................................... 57
4.5 Conclusions ....................................................................................................................................... 59
5. Using expert elicitation data to inform policy analysis ............................................................. 60
5.1 Technology insights from expert elicitation in modelling frameworks ............................................ 62
5.2 Expert elicitations in decision frameworks ....................................................................................... 65
5.3 Summary ........................................................................................................................................... 70
6. Future research needs and conclusions ................................................................................... 72
References .................................................................................................................................... 75
Appendix A: Individual survey data .............................................................................................. 82
Appendix B: Qualitative data from studies including key research areas, technology bottlenecks and impediments to deployment ............................................................................. 96
Appendix C: Data standardization process ................................................................................. 107

Acronyms
ADP Approximate Dynamic Programming
BAU Business as Usual
BNEF Bloomberg New Energy Finance
BP British Petroleum
BRDIS Business Research and Development and Innovation Survey
BRIMCS Brazil, Russia, India, Mexico, China, South Africa
CAES Compressed Air Energy Storage
CCS Carbon Capture and Storage
CMU Carnegie Mellon University
CSP Concentrating Solar Power
DICE Dynamic Integrated Climate-Economic
DOE Department of Energy
EDV Electric Drive Vehicles
EPA Environmental Protection Agency
EU European Union
EV Electric Vehicle
FEEM Fondazione Eni Enrico Mattei
F2F Face to Face
GCAM Global Change Assessment Model
GDP Gross Domestic Product
GHG Greenhouse Gas
GHG MI Greenhouse Gas Management Institute
HD Harmonized Data
HEV Hybrid Electric Vehicle
IAM Integrated Assessment Model
ICE Internal Combustion Engine
IEA International Energy Agency
IGCC Integrated Gasification Combined Cycle
LCOE Levelized Cost of Energy
MAC Marginal Abatement Cost
NRC National Resource Council
O & M Operation & Maintenance
OD Original Data
PHEV Plug-in Hybrid Electric Vehicle
PV Photovoltaic
R & D Research and Development
RD & D Research, Development and Demonstration
REC Expert Recommended RD&D budget
UCL University College London
UMass University of Massachusetts
UNEP United Nations Environment Programme
US United States of America
WITCH World Induced Technical Change Hybrid

GGKP Working Paper 01|2016
2
1. Introduction
The objective of this report is to provide a summary and analysis of multiple expert elicitations on a set of energy technologies that are widely regarded to be very important for addressing climate change. The shared objective of all of the elicitation studies was to collect probabilistic information on future costs or performance of these technologies. Many of the studies were expressly aimed at assessing how public policies (in particular government R&D spending) might affect the future prospects for technological change. Summarizing this information in a coherent way is a significant challenge. Since the studies were carried out by different groups in different periods with different formats, a wealth of scattered and non-comparable data surfaced. Here we report on the first effort to systematically collect, summarize, review and, where possible, compare energy technology elicitation data to draw lessons and insights from the range of studies available. For many of the studies, we present harmonized data to allow comparisons. When harmonization was not possible but the data was available, we reproduced the original data.
Expert elicitation is a structured process for eliciting subjective probability distributions from scientists, engineers and other analysts who are knowledgeable about the metrics of interest – in this case, the costs and performance of energy technologies. Expert elicitation data can provide important insights on future technology development for policymaking, energy portfolio design and the assessment of climate-change mitigation costs. Elicitations provide several advantages with respect to backward-looking approaches, especially when intended to inform R&D decisions, which we discuss below in detail. It should be kept in mind, however, that the future evolution of technological cost is only one piece of the complex set of information needed to design cost-effective, robust public-energy R&D portfolios and other related policies. To this end, we also include a review of energy-economic and decision-focused models that have employed energy expert elicitation data to gain decision-relevant insights.
In the remainder of this section, we introduce the reader to the basics of expert elicitations and provide some background on their applications and potential limitations. Section 2 reviews the expert elicitation surveys that have been carried out so far and presents aggregated distributions of elicited costs for a subset of studies and technologies. The original data by individual experts are reported for many of the studies in Appendix A. Section 3 discusses current energy RD&D investments, as well as the allocations suggested by experts from two sets of studies. Section 4 reports the results from a set of meta-analyses that provide insights on the relationship between elicitation results and characteristics of the studies, such as R&D investment levels, technology-specific characteristics, elicitation design and choice of experts. In Section 5, we review how expert elicitation data can be used to inform models, leading to a more comprehensive evaluation of the impact of R&D and technological change on broader societal outcomes. In Section 6, we conclude with a summary of key findings.
1.1 Expert elicitations Investments in research, development and demonstration (RD&D) as a means to address key environmental, economic, security and access challenges associated with traditional fossil-based energy systems are widely discussed in the literature (see Acemoglu et al. 2012; Jaffe, Newell, and Stavins 2005; Holdren and Baldwin 2001; Anadón, Bunn, and Narayanamurti 2014). Making decisions about RD&D investments in energy technologies requires a careful balance of potential benefits and costs under uncertainty. Over the past eight years, various research groups have attempted to inform these decision by quantifying uncertainty surrounding future technology costs. To this end, they conducted a number of structured expert elicitations on the future costs of key energy technologies.

The Future of Energy Technologies: An Overview of Expert Elicitations
3
Expert elicitation, as we use the term herein, is a structured process for eliciting subjective probability distributions from experts about items of interest to decision-makers (see, for example, Hora and Von Winterfeldt 1997; for a broader definition, see Dewispelare, Herren, and Clemen 1995). Such expert elicitations were pioneered in the 1960s and 1970s, mainly in applications concerning decisions in the face of uncertain natural extreme events (Howard, Matheson, and North 1972; North, Offsend, and Smart 1975), and they were increasingly used to inform policymaking (Hora and Von Winterfeldt 1997; Peerenboom, Buehring, and Joseph 1989; InterAcademy Council 2010; EC 2015; US EPA 2015; Cooke et al. 2007; Krayer von Krauss, Casman, and Small 2004; Morgan 2014). In our context, expert elicitations provide a way to collect information from experienced professionals about the future of specific energy technologies. They can be used to generate a collection of experts’ best estimates of future technology costs, which can be conditional on different levels of public RD&D investment in a particular technology. Most importantly, they provide measures of the uncertainty associated with such estimates, since they can be used to collect information about lower and upper bounds of the cost distribution. A complementary approach to expert elicitation is the “backward-looking” econometric analysis of past trends, as in the learning or experience-curve literature (Wiesenthal et al. 2012; Nagy et al. 2013; Bettencourt, Trancik, and Kaur 2013).
Expert elicitations of future energy technology costs provide several advantages with respect to backward- looking approaches, especially when intended to inform RD&D decisions. Given the different nature of technologies under investigation, and given the presence of discontinuities in the evolution of technologies over time, past trends may not correctly predict the future evolution of costs and performance. More concerning, past trends are unlikely to give much insight into the impact of different R&D funding amounts and allocations on the future of emerging energy technologies (Baker, Chon, and Keisler 2009a; NRC 2007). Hence, tapping the specific knowledge of experts may be the only way to infer what the evolution of costs and performance of emerging technologies might be in the future (using information from experts that may not yet be codified in the literature) and to get a sense of the major technological challenges, and other bottlenecks and challenges.
The main challenge of expert elicitation is that it relies on individuals who are experts in the field under investigation but not necessarily proficient at expressing themselves in terms of probability (Winkler 1967). This, in concomitance with a growing understanding of human biases and heuristics in dealing with uncertainty coming from the psychological literature (e.g., Tversky and Kahneman 1974), led to the development of protocols and methodologies for structured expert elicitations. Table 1, reprinted from Marquard and Robinson (2008) and originally adapted from Hammond, Keeney, and Raiffa (1999), lists a number of psychological traps that may impact expert elicitations and builds on the pioneering work of Tversky and Kahneman (1974). Morgan and Henrion (1990) provide a comprehensive overview of early applications as well as methods, drawbacks and necessary steps in the elicitations to reduce biases. Their work, and the vast literature that has been generated since, point to two critical issues. The first set of issues concerns the elicitation protocol itself and how to properly design it in order to reduce expert biases as much as possible (see Edwards, Miles and von Winterfeldt 2007, Ch. 8 by Hora; O’Hagan et al. 2006). Expert elicitation protocols must be designed to encompass and control every step of the expert elicitation exercise, including a definition of the elicitation objectives, a well-designed questionnaire and survey format, and the correct implementation of the elicitation. The second set of concerns relates instead to the analysis and presentation of the data collected from expert elicitation exercises. Different aggregation methods, including not aggregating at all, present different merits and drawbacks.

GGKP Working Paper 01|2016
4
Table 1: Challenges associated with expert elicitation
Source: Reprinted from Marquard and Robinson, 2008.
Related to biases and heuristics is the question of how to evaluate an elicitation (i.e., how to determine if the elicitation has high validity). This is a very difficult question because subjective probabilities reflect an individual’s degree of belief: unless a probably is 1 or 0, it is impossible to say that an individual probability is “right” or “wrong.” At least in theory, it is possible to evaluate how well-calibrated an expert is. An expert is well calibrated if about p% of the events to which he assigns p% probability actually occur. This can be extended to intervals as well: an expert is well calibrated if about 80% of the time the realized value falls inside the 10-90 percentile range, for example. Calibration is not the only evaluation criteria; we would also like experts to have precise resolution. For example, an expert who always gave the long-term average probability of rain would be perfectly calibrated, but poorly resolved, and therefore he/she would not be very useful. Calibration, however, is considered an important evaluation criterion. Overconfidence is one of the most common (and potentially severe) problems in expert judgment. Overconfidence is reflected in stating probability intervals that are poorly calibrated in terms of being too narrow: the realized value falls outside of the central intervals much more frequently than it should. It has been found that the true values do in fact fall outside the intervals much more frequently than expected. One landmark study (Capen 1976) found that, on average, about 68% of the true values fell outside the interval provided by experts, regardless of what interval the participants were asked for (30%, 90%, 99%). Overconfidence by a group of experts can, in practice, be identified when multiple experts in a study have non-overlapping probability intervals. In the remainder of this
Challenge Description
Anchoring Disproportionately weighting initial information
Status quo trap Bias toward alternatives that perpetuate the current situation
Sunk-cost trap Weighing past decisions, or costs, in the current decision
Confirming-evidence trap Searching for or interpreting information in a way that supports one’s preconceptions
Framing trap Framing of a question or problem to influence the answer (e.g., as gains versus losses or with different reference points)
Overconfidence trap Overconfidence in the accuracy of one’s predictions
Recallability trap Overestimating the probability of memorable or dramatic events
Base-rate trap Neglecting a base-rate in an assessment
Prudence trap Compounding of error due to multiple “safe” judgments
Outguessing randomness trap Viewing patterns in random phenomena
Surprised-by-surprises trap Failure to recognize reality as sometimes surprising
The Future of Energy Technologies: An Overview of Expert Elicitations
5
Section, we will discuss these two issues in detail. We refer the reader to Morgan (2014) for an extensive review of potential issues with expert elicitations applied to public policymaking.
1.2 Elicitation protocol
Structured expert elicitations are aimed at collecting the best available knowledge on the future evolution of some process, device or event from knowledgeable experts. This knowledge is encoded in the form of subjective probability distributions. Elicitations can make use of either verbal or written communication in order to retrieve such knowledge, or in many cases, to help the experts develop the probability distributions that represent their knowledge (Morgan and Henrion 1990; Edwards, Miles, and von Winterfeldt 2007, Ch. 8 by Hora).
Expert elicitations are typically codified in a protocol, which usually follows a set of steps (see, e.g., Kotra et al. 1996; Budnitz et al. 1997; Cooke and Goossens 2000; O’Hagan et al. 2006; Meyer and Booker 1991; Ahn and Apted 2010, Ch. 18 by Jenni and van Luik for an overview):
- Define the objectives and choose an elicitation mode;
- Identify the experts;
- Structure the questions in the assessment;
- Provide the experts with background and training to reduce biases;
- Undertake pre-testing (which involves refining the survey with a subset of experts to fine-tune the questions and language and identify any other additional questions or issues to address);
- Perform an assessment (which may include follow-up interviews or activities);
- Analyze the results and, if desired, aggregate;
- Present the results.
The first step of any elicitation is to define the objective. For many of the expert elicitations described in this report, the objective is to inform public energy technology R&D policy. The specific quantities of interest are metrics defining cost (e.g., levelized cost of electricity or cost of a technology component) and other technological performance parameters (such as efficiencies). A key premise for any elicitation is the availability and selection of experts who have the potential to provide useful information in the quantification of the uncertainty surrounding a specific event or process. In the case of energy technologies, these experts might be scientists and/or engineers in any sector working on the development of the technological components, private sector players who have both a scientific understanding of the technologies and a sense of other factors important to the evolution of future costs (e.g., the role of regulations and policies, or the evolution in the availability and costs of technology subcomponents), or actors from international organizations who are knowledgeable about both the technology and policy-related factors.
A key step in the process is the choice of an elicitation mode. Elicitations can be carried out through in- person interviews, remote conference calls, written surveys or online surveys. It appears to be assumed in the expert elicitation literature that face-to-face (F2F) is the gold standard (Meyer and Booker 1991; O’Hagan et al. 2006). Morgan (2014) argues that during in-person interviews the researcher can more directly control how much time is devoted to “debiasing.” The researcher could, for example, devote significant time to ask follow-up questions that prompt experts to consider a wider range of possible
GGKP Working Paper 01|2016
6
outcomes, thereby reducing overconfidence. It is possible, however, that this interactivity can be achieved in other modes as well, in particular in phone calls and interactive online surveys. Many groups, in fact, have been moving towards other modes (Nordhaus 1994; Curtright, Morgan, and Keith 2008; Chan et al. 2011; Anadón et al. 2012), and there has been work in developing interactive online tools for supporting expert elicitation (James, Choy, and Mengersen 2010; Spaccasassi and Deleris 2011; Speirs-Bridge et al. 2010; Shearer et al. 2014; Dalal et al. 2011). These are motivated by the expense – in terms of time and resources for both the assessment team and the experts – required for in-person
elicitations.1
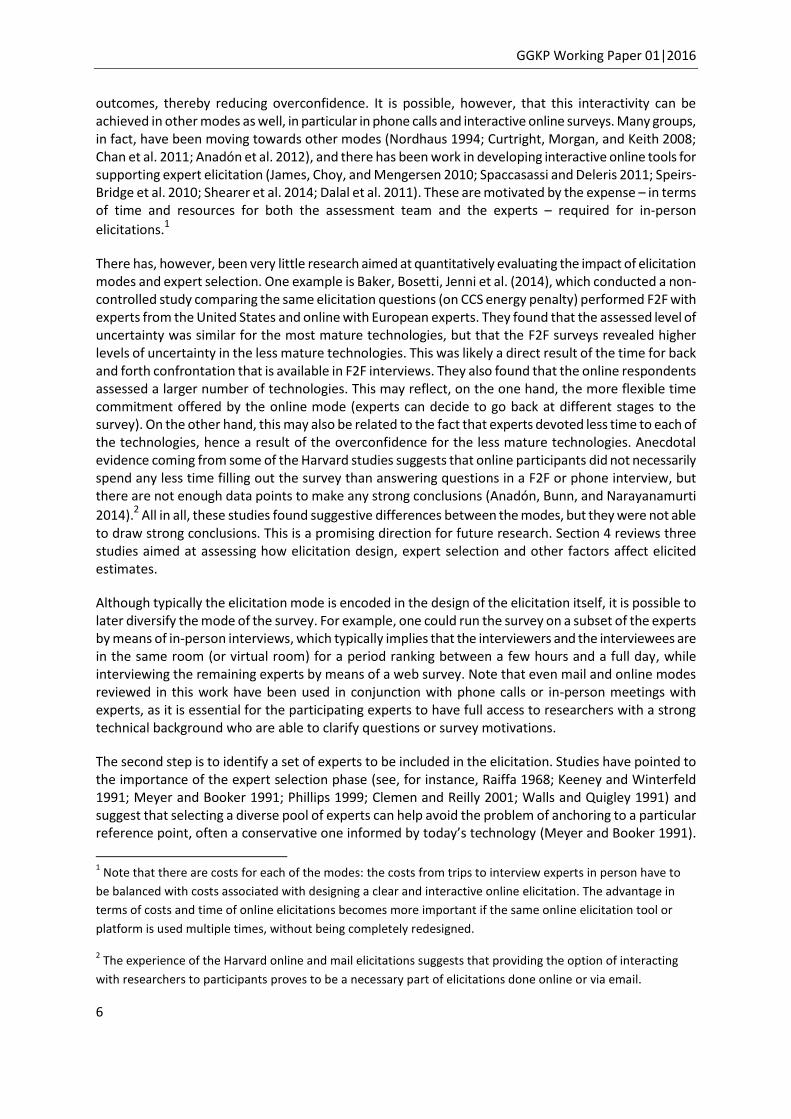
There has, however, been very little research aimed at quantitatively evaluating the impact of elicitation modes and expert selection. One example is Baker, Bosetti, Jenni et al. (2014), which conducted a non-controlled study comparing the same elicitation questions (on CCS energy penalty) performed F2F with experts from the United States and online with European experts. They found that the assessed level of uncertainty was similar for the most mature technologies, but that the F2F surveys revealed higher levels of uncertainty in the less mature technologies. This was likely a direct result of the time for back and forth confrontation that is available in F2F interviews. They also found that the online respondents assessed a larger number of technologies. This may reflect, on the one hand, the more flexible time commitment offered by the online mode (experts can decide to go back at different stages to the survey). On the other hand, this may also be related to the fact that experts devoted less time to each of the technologies, hence a result of the overconfidence for the less mature technologies. Anecdotal evidence coming from some of the Harvard studies suggests that online participants did not necessarily spend any less time filling out the survey than answering questions in a F2F or phone interview, but there are not enough data points to make any strong conclusions (Anadón, Bunn, and Narayanamurti
2014).2 All in all, these studies found suggestive differences between the modes, but they were not able
to draw strong conclusions. This is a promising direction for future research. Section 4 reviews three studies aimed at assessing how elicitation design, expert selection and other factors affect elicited estimates.
Although typically the elicitation mode is encoded in the design of the elicitation itself, it is possible to later diversify the mode of the survey. For example, one could run the survey on a subset of the experts by means of in-person interviews, which typically implies that the interviewers and the interviewees are in the same room (or virtual room) for a period ranking between a few hours and a full day, while interviewing the remaining experts by means of a web survey. Note that even mail and online modes reviewed in this work have been used in conjunction with phone calls or in-person meetings with experts, as it is essential for the participating experts to have full access to researchers with a strong technical background who are able to clarify questions or survey motivations.
The second step is to identify a set of experts to be included in the elicitation. Studies have pointed to the importance of the expert selection phase (see, for instance, Raiffa 1968; Keeney and Winterfeld 1991; Meyer and Booker 1991; Phillips 1999; Clemen and Reilly 2001; Walls and Quigley 1991) and suggest that selecting a diverse pool of experts can help avoid the problem of anchoring to a particular reference point, often a conservative one informed by today’s technology (Meyer and Booker 1991).
1 Note that there are costs for each of the modes: the costs from trips to interview experts in person have to
be balanced with costs associated with designing a clear and interactive online elicitation. The advantage in
terms of costs and time of online elicitations becomes more important if the same online elicitation tool or
platform is used multiple times, without being completely redesigned.
2 The experience of the Harvard online and mail elicitations suggests that providing the option of interacting
with researchers to participants proves to be a necessary part of elicitations done online or via email.

The Future of Energy Technologies: An Overview of Expert Elicitations
7
One study that used the same elicitation tool on different groups of experts was the joint Fondazione Eni Enrico Mattei (FEEM)/Harvard online nuclear survey, which determined that there was a difference between the cost estimates of US and EU experts (Anadón et al. 2012). As we review in Section 4, in a meta-analysis performed using multiple expert elicitations for nuclear power (Anadón, Nemet, and Verdolini 2013) and solar power (Verdolini et al. 2015), the experts find that two expert characteristics stand out as the most influential in determining the assessed costs: the experts’ geographic location and the sector in which they work (namely academia, private sector or government). The country where experts work and live might influence their subjective beliefs as different countries experience very different development of technologies over time. For instance, as argued in Verdolini et al. (2015), governments in Europe subsidized the adoption of solar power much more intensively than did governments in the US over the years 2007-2011. Hence, solar PV deployment was dramatically different in the two regions. While in 2000 cumulative solar TWh installed were comparable, by 2012 the EU had surpassed the US by more than an order of magnitude (BP 2013). Experts may have been influenced by the growth of the PV industry in their local markets, and thus the experience (which shapes the availability heuristic) of experts conducting their professional activities in each region would differ (Tversky and Kahneman 1974; Daniel Kahneman 2011). Similarly, institutional affiliation is likely to affect cost estimates, and elicited data might be subject to availability and anchoring heuristics associated with experts’ environment and experiences, leading to optimism bias where experts tend to have higher expectations for projects they are working on, or motivational bias where experts may attempt to impact the ultimate decisions through their answers in the expert elicitation (Spetzler and Stael Von Holstein 1975; D. Kahneman and Lavallo 1993). In some technologies, such as nuclear power, industry experts could, for example, be more pessimistic as they are more likely to think about potential escalations on labour, materials, licensing and permitting costs than their academic counterparts, since academic experts may tend to be more detached from these less technical costs in some technology areas that, for example, may experience increasing regulatory requirements (Anadón et al. 2012).
There are often questions about the appropriate number of experts in an expert elicitation. In particular, ideas of statistical significance are not appropriate here. First, the views of informed experts are necessarily correlated to some extent, since there is a limited set of literature and results on any technology. Second, the idea of expert elicitation is to derive a representation of the views of the community of experts; it is not a draw from some kind of underlying existing probability distribution. In one example, Clemen and Winkler (1999) found that the marginal value of an additional expert decreases substantially after three-to-four experts. A review of a large number of expert elicitation studies found that the typical elicitation has about 12 participants (US EPA 2015). However, one may expect that the appropriate number of experts would depend on the topic. In some areas, there may be more consensus than in others, which means that the marginal value of each additional expert may be greater. One difficulty in differentiating across areas is that it may be hard to know a priori how much disagreement there is across different experts.
The third step is to structure the elicitation. This can be done by the researchers who are preparing and performing the elicitation; it is done typically in conjunction with a subset of experts. This includes the definition of the uncertain quantity to be assessed and the encoding of the expert judgments as probability distributions, as well as verification of the results through consistency checks and collection of any other relevant information. The definition of the uncertain quantity must be done carefully so that it is clearly and univocally defined. This is often called “the clarity test” (Howard 1988). On this point, there must be a clear quantity that can be universally agreed upon once the event of interest has taken place. For example, a quantity such as “the temperature in Germany in 2020” is not well defined. We need to establish where and when the temperatures will be taken and how they will be averaged. In the case of energy technology metrics, it is necessary to clearly define “when” and “where” (e.g., the 2030 levelized cost of electricity generated by a rooftop solar PV installed in Germany) and “under what conditions.” This is the ideal, however, it is often difficult to achieve in practice.

GGKP Working Paper 01|2016
8
Deciding which conditions will be considered implicitly (thus leaving the experts to make judgements about them) and which will be considered explicitly is a crucial step in the protocol design process. Conditions of interest may include assumptions about future input prices, the characterization of government or private R&D efforts to support a specific technology and/or key energy or environmental policies (e.g., a carbon tax or a mandate on renewable energy technologies, among others) and/or assumptions about the future state of the economy (for instance, business-as-usual conditions for economic growth or current materials input prices). In many of the elicitations covered herein, the explicit government R&D policy is a condition of the elicited variable; many of the other conditions are not explicitly specified, and thus the expert must average over all the possible futures.
There is a tension between fully specifying external conditions (such as economic growth and trade policies, among others) and the time and resources available for an elicitation. If an expert had unlimited time, patience and attention, then the ideal would be to include questions encompassing all relevant conditions. Given time limitations, however, a small number of conditions must be chosen. One may expect that the smaller the number of factors or conditions specified, the larger the uncertainty range provided by an expert, since his/her uncertainty range would have to encompass a wider set of scenarios or possibilities. However, to the best of our knowledge no study has evaluated this in a systematic way.
The fourth step in any elicitation is providing the experts with background material and, especially, with training and information on avoiding biases (Morgan and Henrion 1990). Elicitation protocols will often start with an introduction, which motivates the assessment and provides background information. During the elicitation itself, the elicitor will work with the expert to try to avoid cognitive biases as he/she approaches the elicitation task, a function that sometimes is also played by interactive tools in online elicitations.
The fifth step is to tune the design of the survey, as well as the definition of the metric under investigation and of the hypothetical conditions by means of a pre-test phase. Indeed, choosing a subset of the elicitation experts and involving them at a very early stage to iteratively improve the clarity and coverage of the elicitation is an extremely important part of the process. The pre-test helps researchers: (1) calibrate the survey (e.g., length, clarity, etc.) with the view that the time that the experts devote to the elicitation is precious; (2) make sure that the questions asked cover key areas related to the topic investigated; and (3) provide comprehensive background information. An example of the type of information that can be included in energy technology elicitations can be found in a link in the supplementary information of Anadón et al. (2012), page S3. In this specific case, experts were provided with data on previous cost estimates for different sub-technologies, a discussion about overconfidence and other biases, a description of how to reduce such biases, and data on previous R&D budgets. When designing an elicitation, a key part of the pilot testing stage is to evaluate the time it takes to complete it. In our experience one should aim for 2-4 hours, with 3 hours being an average time to completion. Longer elicitations run the risk of finding no experts able or willing to devote the time necessary to complete the task; they also involve the risk that experts will lose their concentration. Thus, the number of questions may be less relevant than the time taken, with some questions taking more time than others.
In addition to conducting a pre-test phase in the design of the elicitation, it is highly recommended that a technology expert participates in each of the interviews or is available to those experts taking an online or paper elicitation. This helps address any concern or technical question from the participating experts.
The sixth step is to perform the elicitation. This is done by the elicitation team, which will ideally include someone with experience in performing elicitations, someone with some background knowledge of the

The Future of Energy Technologies: An Overview of Expert Elicitations
9
technology, and someone with an understanding of the larger context in which the elicitation data will be used.
Separate from how the survey is carried out, it is often useful to give back to the experts a summary of the survey results before any report or paper is published. In fact, while recruiting experts most groups promised that they would provide a summary of anonymous elicitation results well before a draft of the report was available. This provides the experts with an additional motivation to participate, as they are interested in learning about what other experts in the field see as the future of the technologies they work on. In addition, several studies also conducted follow-up interviews that included clarifying questions and provided feedback to the experts. Sending experts a summary of their own answers to review and double check ensures that researchers are able to capture their thoughts more fully.
The data can be analyzed and reported in a number of ways, including presenting the data itself in raw form, in aggregated form, in harmonized form, and presenting the results of energy-economic and decision models that use the data. There is much current research on how to communicate uncertainty to the public and to decision-makers (Morgan 2014; Morgan 2015; Spieglhalter, Pearson, and Short 2011). This research has great relevance to the presentation of expert elicitation results. In the next subsection, we discuss issues around the aggregation of data.
1.3 Aggregation issues, limitations and qualifications
Elicited metrics can be used to inform policy that represents a wide diversity of views (Morgan 2014; Morgan 2015), or it can be aggregated using various methodologies. There is, however, little agreement on which method is best to aggregate, given the tradeoffs associated with various approaches. Clemen and Winkler (1999) compare a number of methods, including behavioural (where experts agree on an aggregated distribution) and mathematical. Mathematical methods include Bayesian methods (as well as simple averaging over probabilities), which are appealing theoretically but difficult to employ and problematic if experts are not well calibrated.3 Clemen and Winkler conclude that simple averaging is not only the simplest method, but seems to perform as well as the other methods. In particular, they highlight that: “simple combination rules (e.g., a simple average) tend to perform quite well” and that “more complex rules sometimes outperform the simple rules, but they can be somewhat sensitive, leading to poor performance in some instances.” Cooke and Goossens (2008) show that weighting experts based on their answers to some test questions can lead to considerable improvement with respect to the linear average. However, it is not clear which seed questions are appropriate for future predictions, such as those seen in energy technology elicitation studies.
Some more recent work indicates that other mathematical aggregation methods may have some attractive properties. Hora et al. (2013) use the median in order to aggregate distributions and find that this leads to distributions that are better calibrated than mean aggregate distributions when the experts are well calibrated. However, since experts are most often overconfident, it is not clear that this method would be of great value in most cases. Lichtendahl, Grushka-Cockayne, and Winkler (2013) show that averaging quantiles rather than probabilities can be more accurate when experts are either overconfident or underconfident and suggest that this method be considered in place of, or along with, traditional linear averaging of probabilities.
3 Specifically, the aggregated probability distribution will assign a probability of 0 to any event for which any
expert assigned a probability of 0. Since in many studies expert distributions will fail to overlap, this method
will break down.
GGKP Working Paper 01|2016
10
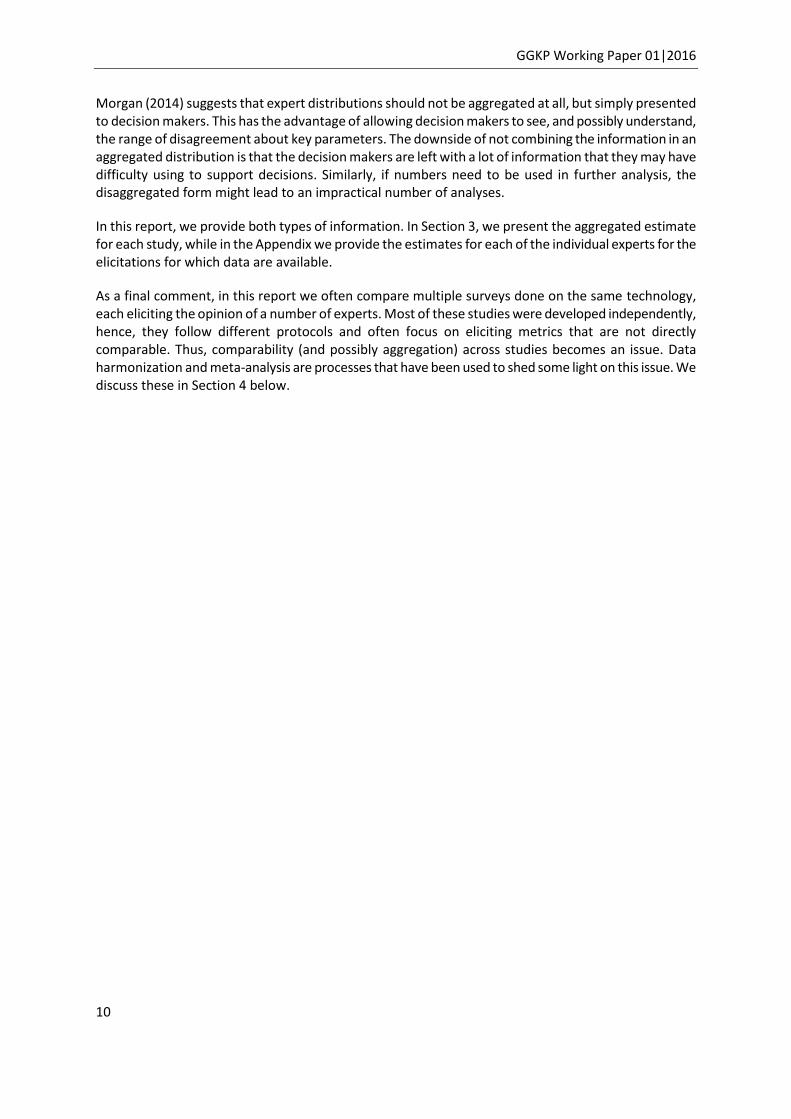
Morgan (2014) suggests that expert distributions should not be aggregated at all, but simply presented to decision makers. This has the advantage of allowing decision makers to see, and possibly understand, the range of disagreement about key parameters. The downside of not combining the information in an aggregated distribution is that the decision makers are left with a lot of information that they may have difficulty using to support decisions. Similarly, if numbers need to be used in further analysis, the disaggregated form might lead to an impractical number of analyses.
In this report, we provide both types of information. In Section 3, we present the aggregated estimate for each study, while in the Appendix we provide the estimates for each of the individual experts for the elicitations for which data are available.
As a final comment, in this report we often compare multiple surveys done on the same technology, each eliciting the opinion of a number of experts. Most of these studies were developed independently, hence, they follow different protocols and often focus on eliciting metrics that are not directly comparable. Thus, comparability (and possibly aggregation) across studies becomes an issue. Data harmonization and meta-analysis are processes that have been used to shed some light on this issue. We discuss these in Section 4 below.
The Future of Energy Technologies: An Overview of Expert Elicitations
11
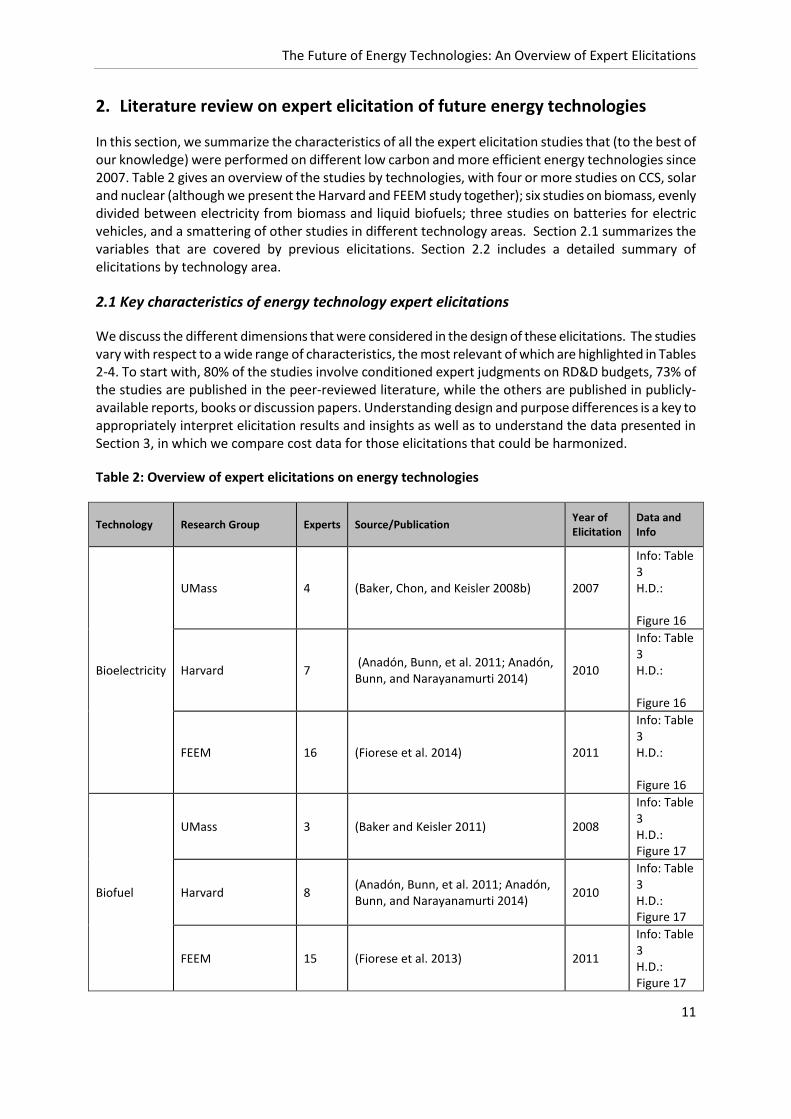
2. Literature review on expert elicitation of future energy technologies
In this section, we summarize the characteristics of all the expert elicitation studies that (to the best of our knowledge) were performed on different low carbon and more efficient energy technologies since 2007. Table 2 gives an overview of the studies by technologies, with four or more studies on CCS, solar and nuclear (although we present the Harvard and FEEM study together); six studies on biomass, evenly divided between electricity from biomass and liquid biofuels; three studies on batteries for electric vehicles, and a smattering of other studies in different technology areas. Section 2.1 summarizes the variables that are covered by previous elicitations. Section 2.2 includes a detailed summary of elicitations by technology area.
2.1 Key characteristics of energy technology expert elicitations
We discuss the different dimensions that were considered in the design of these elicitations. The studies vary with respect to a wide range of characteristics, the most relevant of which are highlighted in Tables 2-4. To start with, 80% of the studies involve conditioned expert judgments on RD&D budgets, 73% of the studies are published in the peer-reviewed literature, while the others are published in publicly-available reports, books or discussion papers. Understanding design and purpose differences is a key to appropriately interpret elicitation results and insights as well as to understand the data presented in Section 3, in which we compare cost data for those elicitations that could be harmonized.
Table 2: Overview of expert elicitations on energy technologies
Technology Research Group Experts Source/Publication Year of Elicitation
Data and Info
Bioelectricity
UMass 4 (Baker, Chon, and Keisler 2008b) 2007
Info: Table 3 H.D.: Figure 16
Harvard 7 (Anadón, Bunn, et al. 2011; Anadón, Bunn, and Narayanamurti 2014)
2010
Info: Table 3 H.D.: Figure 16
FEEM 16 (Fiorese et al. 2014) 2011
Info: Table 3 H.D.: Figure 16
Biofuel
UMass 3 (Baker and Keisler 2011) 2008
Info: Table 3 H.D.: Figure 17
Harvard 8 (Anadón, Bunn, et al. 2011; Anadón, Bunn, and Narayanamurti 2014)
2010
Info: Table 3 H.D.: Figure 17
FEEM 15 (Fiorese et al. 2013) 2011
Info: Table 3 H.D.: Figure 17

GGKP Working Paper 01|2016
12
CCS
UMass 3 (Baker, Chon, and Keisler 2009b) 2007
Info: Table 4 H.D.: Figure 18
Harvard 8 (Chan et al. 2011) 2010
Info: Table 4 H.D.: Figure 18
Duke 5 (Chung, Patiño-Echeverri, and Johnson 2011)
2011 Info: Table 4 O.D.: N/A
UMass (Jenni, Baker, and Nemet 2013)
Info: Table 4 O.D.: Note: The lines range from the 10th to the 90th percentiles and the marker in between represents the 50th percentile.
FEEM 10 (Bosetti and Ricci 2015) 2012
Info: Table 4 O.D.: Figure 25
CMU 10 (Rao et al. 2006) 2006 Info: Table 4 O.D.: N/A
NRC 12 (NRC 2007) 2006 Info: Table 4 O.D.: N/A
UMass 4 (Baker, Chon, and Keisler 2008a) 2007
Info: Table 5 H.D.: Figure 19
Nuclear
Harvard - FEEM 55 (Anadón et al. 2012) 2010
Info: Table 5 H.D.: Figure 19, Figure 20 and Figure 21
CMU 12 (Abdulla, Azevedo, and Morgan 2013)
2011
Info: Table 5 H.D.: Figure 19
UMass 3 (Baker, Chon, and Keisler 2009a) 2007 Info: Table 6 H.D.:

The Future of Energy Technologies: An Overview of Expert Elicitations
13
Figure 22
Solar
Harvard 9 (Anadón, Bunn, et al. 2011; Anadón, Bunn, and Narayanamurti 2014)
2010
Info: Table 6 H.D.: Figure 22
FEEM 13 (Bosetti et al. 2012) 2011
Info: Table 6 H.D.: Figure 22 and Figure 23
Near Zero 22 (Inman 2012) 2011 Info: Table 6 O.D.: N/A
CMU 18 (Curtright, Morgan, and Keith 2008) 2008
Info: Table 6 H.D.: Figure 22 and Figure 23
UMass 7 (Baker, Chon, and Keisler 2010) 2008 Info: Table 7 O.D.: N/A
Vehicles
FEEM 14 (Catenacci et al. 2013) 2012
Info: Table 7 O.D.: Figure 26
Harvard 9 (Anadón, Bunn, et al. 2011; Anadón, Bunn, and Narayanamurti 2014)
2011
Info: Table 7 O.D.: Figure 27
Harvard (utility scale energy storage)
25 (Anadón, Bunn, et al. 2011; Anadón, Bunn, and Narayanamurti 2014)
2011
Info: Table 7 O.D.: Figure 28
Other
NRC (IGCC)
8 (NRC 2007) 2006 Info: Table 7 O.D.: N/A
Stanford (natural gas)
4 (Bistline 2013) YES
Info: Table 7 O.D.: Figure 29
GHG MI (wind)
7 (Gillenwater 2013) 2010 Info: Table 8 O.D.: N/A
UCL (low carbon energy)
25 (Usher and Strachan 2013) 2010 Info: Table 8 O.D.: N/A
Abbreviations: Info –additional information on the characteristics of the survey; H.D. – harmonized data; O.D. – original data from the survey; N/A – original data is not reported in the present report.
Purpose of the studies. At least one of the goals of many of these studies was to provide evidence to support decisions about energy RD&D investments. In some cases, this was explicit, asking experts to judge cost evolution conditional on RD&D budgets; in others (20% of the studies), this was implicit as no
GGKP Working Paper 01|2016
14
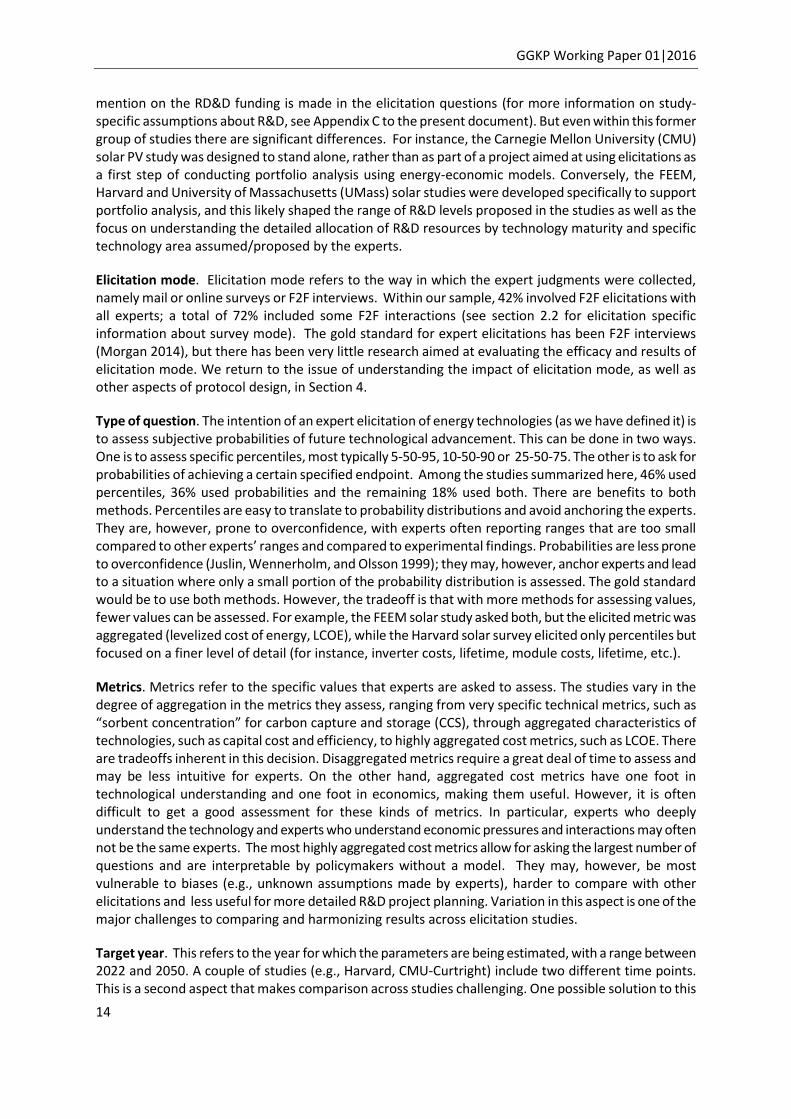
mention on the RD&D funding is made in the elicitation questions (for more information on study-specific assumptions about R&D, see Appendix C to the present document). But even within this former group of studies there are significant differences. For instance, the Carnegie Mellon University (CMU) solar PV study was designed to stand alone, rather than as part of a project aimed at using elicitations as a first step of conducting portfolio analysis using energy-economic models. Conversely, the FEEM, Harvard and University of Massachusetts (UMass) solar studies were developed specifically to support portfolio analysis, and this likely shaped the range of R&D levels proposed in the studies as well as the focus on understanding the detailed allocation of R&D resources by technology maturity and specific technology area assumed/proposed by the experts.
Elicitation mode. Elicitation mode refers to the way in which the expert judgments were collected, namely mail or online surveys or F2F interviews. Within our sample, 42% involved F2F elicitations with all experts; a total of 72% included some F2F interactions (see section 2.2 for elicitation specific information about survey mode). The gold standard for expert elicitations has been F2F interviews (Morgan 2014), but there has been very little research aimed at evaluating the efficacy and results of elicitation mode. We return to the issue of understanding the impact of elicitation mode, as well as other aspects of protocol design, in Section 4.
Type of question. The intention of an expert elicitation of energy technologies (as we have defined it) is to assess subjective probabilities of future technological advancement. This can be done in two ways. One is to assess specific percentiles, most typically 5-50-95, 10-50-90 or 25-50-75. The other is to ask for probabilities of achieving a certain specified endpoint. Among the studies summarized here, 46% used percentiles, 36% used probabilities and the remaining 18% used both. There are benefits to both methods. Percentiles are easy to translate to probability distributions and avoid anchoring the experts. They are, however, prone to overconfidence, with experts often reporting ranges that are too small compared to other experts’ ranges and compared to experimental findings. Probabilities are less prone to overconfidence (Juslin, Wennerholm, and Olsson 1999); they may, however, anchor experts and lead to a situation where only a small portion of the probability distribution is assessed. The gold standard would be to use both methods. However, the tradeoff is that with more methods for assessing values, fewer values can be assessed. For example, the FEEM solar study asked both, but the elicited metric was aggregated (levelized cost of energy, LCOE), while the Harvard solar survey elicited only percentiles but focused on a finer level of detail (for instance, inverter costs, lifetime, module costs, lifetime, etc.).
Metrics. Metrics refer to the specific values that experts are asked to assess. The studies vary in the degree of aggregation in the metrics they assess, ranging from very specific technical metrics, such as “sorbent concentration” for carbon capture and storage (CCS), through aggregated characteristics of technologies, such as capital cost and efficiency, to highly aggregated cost metrics, such as LCOE. There are tradeoffs inherent in this decision. Disaggregated metrics require a great deal of time to assess and may be less intuitive for experts. On the other hand, aggregated cost metrics have one foot in technological understanding and one foot in economics, making them useful. However, it is often difficult to get a good assessment for these kinds of metrics. In particular, experts who deeply understand the technology and experts who understand economic pressures and interactions may often not be the same experts. The most highly aggregated cost metrics allow for asking the largest number of questions and are interpretable by policymakers without a model. They may, however, be most vulnerable to biases (e.g., unknown assumptions made by experts), harder to compare with other elicitations and less useful for more detailed R&D project planning. Variation in this aspect is one of the major challenges to comparing and harmonizing results across elicitation studies.
Target year. This refers to the year for which the parameters are being estimated, with a range between 2022 and 2050. A couple of studies (e.g., Harvard, CMU-Curtright) include two different time points. This is a second aspect that makes comparison across studies challenging. One possible solution to this

The Future of Energy Technologies: An Overview of Expert Elicitations
15
issue is to use some form of experience curve in order to forecast or backcast estimated values (Nagy et al. 2013). This backcasting using experience curves also introduces assumptions, given that experience curves reflect not only the effect of RD&D investments, but also of other developments over time, such as technology deployment subsidies.
Experts. The studies vary on the number of experts assessed, from as few as three in a solar study to as many as 31 in a nuclear study. Some studies have found there are diminishing marginal returns to additional experts (Clemen and Winkler 1999; Clemen and Winkler 1985; Ferrell 1985; Clemen and Winkler 2007). One study (US EPA 2015) reviewed 38 expert elicitation studies and found that 90% used fewer than 12 experts, and 60% had six to eight experts. The 26 studies we review herein appear to be a bit larger than average, with only 44% having fewer than 12 (about 11.5 experts on average). Just over half of these studies had at least one participant from academia, government and the private sector. Academia was missing from three studies, industry was missing from five studies and government was missing from seven studies. The different studies generally had specific reasons for selecting the set of experts, ranging from some of the UMass studies that were most interested in breakthrough technologies (and therefore focused on academia and government) through studies primarily interested in the current state of affairs (and thus focused exclusively on industry).
Technologies covered. Some studies only assess a single specific technology category (e.g., small modular reactors). Other studies ask separate questions about different technologies within a technology area (e.g., large scale Gen III/III+, large-scale Gen IV, and small modular reactors). Other studies aggregate the technologies in some way, either by having experts assess only those specific technologies (e.g., enzymatic hydrolysis for biofuels) they believe will be most commercially viable, or by having the experts assess the future of an entire technology class (e.g., CCS).
Assessment and self-assessment of experts. Some studies ask experts to assess their level of expertise in general or specific technology areas. This has significant appeal, since it allows researchers to determine whether experts are systematically favouring the recommended technologies in which they have the highest expertize (Anadón, Bunn, and Narayanamurti 2014). We are not aware of any methods that have been reliably used to adjust the reporting of elicitation results based on the expertise information. It has generally been found that there is no discernible relationship between an expert’s self-assessment and the assessments by that expert (Bolger and Rowe 2015). There is some evidence that there is value in asking test questions (questions whose exact answer can be actually tested by the researcher) and then weighting experts by how well they answer the test questions (Cooke 1991; Lin and Cheng 2009). However, the experimental evidence is based only on sets of test questions themselves and not results of actual expert elicitations. In other words, when using a set of related test questions it is clear that good performance on a subset of these questions is highly related to good performance on the other test questions. It is not clear, however, what constitutes a “good” test question for a real expert elicitation (for a discussion on this point, see Clement 2008). Only one of the studies considered here used a test question, but it was on an unrelated subject, aimed at generally assessing experts’ overconfidence.
Presentation of R&D budgets constraints. As mentioned above, five of the 26 studies do not specify a public R&D budget (see Appendix C for detail on this). In these cases, it is an implicit part of the expert assessment to think about what future budgets may be. The 21 studies that do specify budgets take a range of approaches to defining the budgets on which the assessments are conditioned. Note that we use the term R&D even if many studies considered research, development and demonstration (RD&D) investments. The Harvard studies (see Anadón et al. 2011; Anadón, Bunn, and Narayanamurti 2014) first provide experts with information about the current budgets and ask them to evaluate future technologies under a Business as usual (BAU) scenario. They then ask each expert to specify a “recommended” budget aimed at increasing the commercial viability of the technology by 2030 and to
GGKP Working Paper 01|2016
16
specify an allocation of the budget for that technology across a matrix of specific sub-technologies and technology maturity stage. Experts were then asked to make an assessment of the cost and performance of the technologies for three R&D scenarios additional to the BAU: ½ their recommended budget, their recommended budget, and 10X their recommended budget. Experts were asked to develop their recommended budget in a bottom-up fashion by physically or virtually allocating funding amounts to very specific research areas within a technology, and to cover the spectrum from basic R&D, to applied R&D and demonstration plants. The UMass studies developed budget amounts for each sub-technology (e.g., purely organic solar cells, and post-combustion CCS). These were also developed in a bottom-up manner in conjunction with a subset of experts. These budgets explicitly did not include demonstration plants and were primarily aimed at inducing scientific breakthroughs that would enable better technologies. Many of the studies defined budgets based on current governmental R&D budgets, including the FEEM studies whose budgets are based on multiples of current EU budgets, the Jenni, Baker, and Nemet (2013) study whose high budget is roughly five times the current Department of Energy (DOE) budget, and the two National Research Council (NRC) studies, which define the budget based on the current DOE budget. Finally, Rao et al. (2006) only specified “modest but steady growth” of the current DOE budget. Four of the studies (Jenni, Baker, and Nemet 2013; Ricci et al. 2014 and two NRC studies) explicitly considered a “no RD&D” scenario. Two studies (Curtright, Morgan, and Keith 2008; Chung, Patiño-Echeverri, and Johnson 2011) used a BAU R&D scenario and a 10X BAU R&D scenario. The ranges of budgets considered vary widely, with the UMass studies generally having the smallest budgets and Harvard generally having the largest (see Section 3 for more details).
In the remainder of this section, we summarize the key information concerning each of the studies available by means of tables.
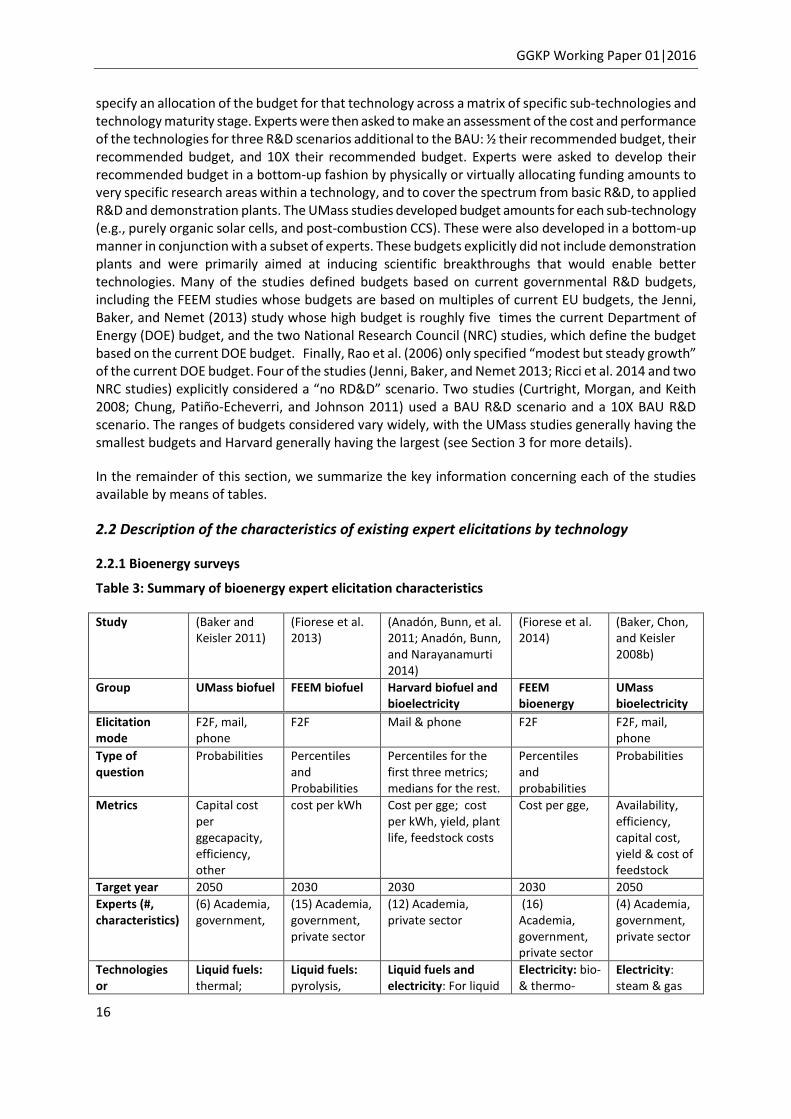
2.2 Description of the characteristics of existing expert elicitations by technology
2.2.1 Bioenergy surveys
Table 3: Summary of bioenergy expert elicitation characteristics
Study (Baker and Keisler 2011)
(Fiorese et al. 2013)
(Anadón, Bunn, et al. 2011; Anadón, Bunn, and Narayanamurti 2014)
(Fiorese et al. 2014)
(Baker, Chon, and Keisler 2008b)
Group UMass biofuel FEEM biofuel Harvard biofuel and bioelectricity
FEEM bioenergy
UMass bioelectricity
Elicitation mode
F2F, mail, phone
F2F Mail & phone F2F F2F, mail, phone
Type of question
Probabilities Percentiles and Probabilities
Percentiles for the first three metrics; medians for the rest.
Percentiles and probabilities
Probabilities
Metrics Capital cost per ggecapacity, efficiency, other
cost per kWh Cost per gge; cost per kWh, yield, plant life, feedstock costs
Cost per gge, Availability, efficiency, capital cost, yield & cost of feedstock
Target year 2050 2030 2030 2030 2050
Experts (#, characteristics)
(6) Academia, government,
(15) Academia, government, private sector
(12) Academia, private sector
(16) Academia, government, private sector
(4) Academia, government, private sector
Technologies or
Liquid fuels: thermal;
Liquid fuels: pyrolysis,
Liquid fuels and electricity: For liquid
Electricity: bio- & thermo-
Electricity: steam & gas

The Future of Energy Technologies: An Overview of Expert Elicitations
17
technological paths
enzymes; gasification
hydrolysis; gasification
fuels, specific technology (various biochemical or thermochemical processes included) specified by expert for three products (gasoline, diesel and jet fuel substitutes). For electricity, specific technology specified by expert based on assessment of commercial viability.
chemical; steam and gas
Feedstock improvement
Self-assessment
No No Yes No No
Budget See solar See solar Four public US RD&D scenarios: Business as usual (2009 levels), and three scenarios based on expert-defined budgets: ½ of expert budget, expert budget, and 10X expert budget.
See solar See solar
Barriers or other issues identified
Technological, deployment
Land use competition with food Environmental externalities
Technological, feedstock, deployment (policy), see Section 4 for more information
Land and water use competition with food Environmental externalities
Peer reviewed Y Y N Y N

GGKP Working Paper 01|2016
18
2.2.2 CCS Surveys
Table 4: Summary of CCS expert elicitation characteristics (United States dollars)
Study (Baker, Chon, and Keisler 2009b)
(Chan et al. 2011)
(Jenni, Baker, and Nemet 2013)
(Ricci et al. 2014)
(Rao et al. 2006)
(NRC 2007)
(Chung, Patiño-Echeverri, and Johnson 2011)
Group UMass Harvard UMass
FEEM & UMass
CMU NRC
Elicitation mode
F2F & survey F2F & survey F2F Online F2F F2F Panel
Survey & F2F or phone
Type of question
Probabilities Percentiles, medians
Percentiles Percentiles Percentiles
Probabilities
Percentiles
Metrics Varied by technology; included energy penalty, capital cost
Capital cost ($/kW) efficiency (HHV), capacity factor, lifetime of gas and coal power plants with w/o CCS
Energy penalty
Energy penalty
Capital cost ($/kW)
Sorbent concentra-tion, regenera-tion heat require-ment, loss, and cost
Percent increase in LCOE
Energy penalty
Target year
2050 2030 2025 2025 2030; 2050
2022 2030
Experts (#, characteristics)
(4) Academia (13) Academia, government, private sector
(11) Academia,govern-ment, private sector
(12) Academia,govern-ment, private sector
(12) Academia, private sector
(12) Academia, private sector
(11) Private sector, govern-ment
Technologies
Pre/post combustion;chemical looping
Expert assessed most promising technology in their view
Pre/post oxy-firing; chemical looping
Pre/post oxy-firing; chemical looping
Absorption
General Amine, chilled ammonia, oxy-firing

The Future of Energy Technologies: An Overview of Expert Elicitations
19
Self-assessment
No Yes No No No No Yes
Budget See solar Four public US RD&D scenarios: business as usual (2009 levels), and three scenarios based on expert-defined budgets: ½ of expert budget, expert budget, and 10X expert budget.
No additional or $250M/yr
No additional or $250M/yr
Steady growth through 2015
$218M/yr, on average
None specified
Other issues
Technological,deployment (policy), see Section 4 for details.
With and without carbon tax
Peer reviewed
Y Y Y Y Y N Y
2.2.3 Nuclear Surveys
Table 5: Summary of nuclear expert elicitation characteristics
Study (Baker, Chon, and Keisler 2008a)
(Anadón et al. 2012) (Abdulla, Azevedo, and Morgan 2013)
Group UMass Harvard & FEEM CMU
Elicitation Mode F2F & mail Online & group workshop
F2F
Type of question Probabilities Percentiles for the first metric; medians for the rest.
Probabilities & percentiles
Metrics Varied by tech:, including safety, efficiency, capital cost, burn rate, water usage
Overnight capital cost, fixed O&M cost, variable O&M cost, fuel cost, thermal burnup
Capital cost; construction duration
Target year 2050 2030 2012
Experts (#, characteristics)
(4) Academia, government;
(61) Academia government; private sector;
(16 from 4 orgs) Government; private sector
Technologies or LWR; feeder Large scale (1GW) Small modular

GGKP Working Paper 01|2016
20
technological paths reactors; fast reactors; small modular reactors
Gen III+ systems, large scale (1 GW) IV systems, and small modular reactors (with capacities up to 300 MWe)
reactors
Self-assessment No Yes Yes
Budget See solar Four public US RD&D scenarios: business as usual (2009 levels), and three scenarios based on expert-defined budgets: ½ of expert budget, expert budget, and 10X expert budget.
None specified
Barriers or other issues identified
Technological, deployment
Technological, deployment (policy), see Section 4 for more.
Deployment scenarios
Peer reviewed N Y Y
Abbreviations: O&M–Operation and Maintenance; LWR–Light Water Reactor.

The Future of Energy Technologies: An Overview of Expert Elicitations
21
2.2.4 Solar Surveys
Table 6: Summary of solar expert elicitation characteristics
Study (Baker, Chon, and Keisler 2009a)
(Anadón, Bunn, et al. 2011; Anadón, Bunn, and Narayanamurti 2014)
(Bosetti et al. 2012)
(Curtright, Morgan, and Keith 2008)
(Inman 2012)
Group UMass Harvard FEEM CMU Near Zero
Elicitation Mode
F2F followed by survey
Online F2F Mail survey Online
Type of question
Probabilities Percentiles for the first two metrics; medians for the rest.
Percentiles, probabilities
Probabilities Percentiles
Metrics Capital cost per m
2,
efficiency; lifetime
Module capital cost per Wp, module efficiency, inverter cost, inverter efficiency, inverter lifetime, O&M costs, other electronic components, etc.
LCOE Module cost per Wp
Module cost per W
Target year 2050 2030 2030 2030; 2050 Year for deployment target defined by expert
Experts (#, characteristics)
(3) Academic (10) Government, private sector, academic
(16) Government, private sector, academic
(18) Government, private sector, academic
(21) Government, private sector,academia
Technologies or technological paths
Purely organic; novel inorganic; 3
rd
generation
Specific PV technology that each expert considers will be most commercially viable in 2030
(27) Technologies
(26) Technologies including multiple categories of crystalline-SI, thin film, concentrator, excitonic, and novel high
General solar PV

GGKP Working Paper 01|2016
22
efficiency
Self-assessment
No Yes Yes Yes No
Budget Conditioned on budgets defined by subset of experts
Four public US RD&D scenarios: business as usual (2009 levels), and three scenarios based on expert-defined budgets: ½ of expert budget, expert budget, and 10X expert budget.
1, 1.5, 2X baseline public RD&D level in EU
BAU R&D
10X BAU R&D
With BAU deployment or 10X BAU deployment
How long it might take for the solar power industry to produce a total of 300 GW and 600 GW of solar modules – roughly 10X & 20X more than up to the end of 2010,respectively; experts were also asked what the average sales price of modules was likely to be at those milestones
Barriers or other issues identified
Technological, deployment
Technological, deployment (policy), see Section 4 for more.
Existing energy capital; unfavourable pricing rules
Research vs market-driven strategies
Needed breakthroughs in semiconductor and encapsulation materials or in installation methodology
Peer Reviewed?
Y N Y Y N
Abbreviations: W – Watt; Wp – Watt Peak ; F2F – face-to-face
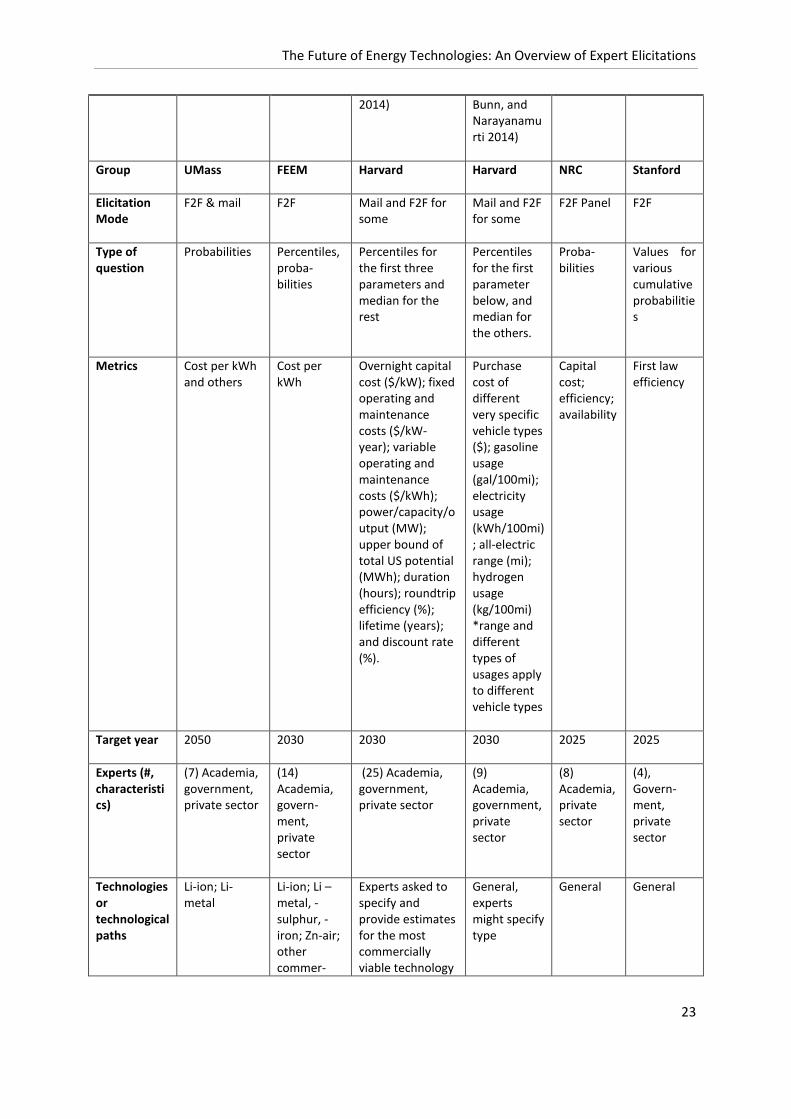
2.2.5 Others: batteries for EV; utility storage; alternative vehicles; IGCC; gas turbines
Table 7: Summary of other (batteries for EV; utility storage; alternative vehicles; IGCC; gas turbines) expert elicitation characteristics
Other Technologies
Batteries for EV
Batteries for EV
Utility-scale storage
Alternative vehicles: HEV, PHEV, EV, and hydrogen, and advanced ICE
IGCC Natural gas turbine efficiencies
Study (Baker, Chon, and Keisler 2010)
(Catenacci et al. 2013)
(Anadón, Bunn, et al. 2011; Anadón, Bunn, and Narayanamurti
(Anadón, Bunn, et al. 2011; Anadón,
(NRC 2007)
(Bistline 2013)
The Future of Energy Technologies: An Overview of Expert Elicitations
23
2014) Bunn, and Narayanamurti 2014)
Group UMass FEEM Harvard Harvard NRC Stanford
Elicitation Mode
F2F & mail F2F Mail and F2F for some
Mail and F2F for some
F2F Panel F2F
Type of question
Probabilities Percentiles, proba-bilities
Percentiles for the first three parameters and median for the rest
Percentiles for the first parameter below, and median for the others.
Proba-bilities
Values for various cumulative probabilities
Metrics Cost per kWh and others
Cost per kWh
Overnight capital cost ($/kW); fixed operating and maintenance costs ($/kW-year); variable operating and maintenance costs ($/kWh); power/capacity/output (MW); upper bound of total US potential (MWh); duration (hours); roundtrip efficiency (%); lifetime (years); and discount rate (%).
Purchase cost of different very specific vehicle types ($); gasoline usage (gal/100mi); electricity usage (kWh/100mi); all-electric range (mi); hydrogen usage (kg/100mi) *range and different types of usages apply to different vehicle types
Capital cost; efficiency; availability
First law efficiency
Target year 2050 2030 2030 2030 2025 2025
Experts (#, characteristics)
(7) Academia, government, private sector
(14) Academia, govern-ment, private sector
(25) Academia, government, private sector
(9) Academia, government, private sector
(8) Academia,private sector
(4), Govern-ment, private sector
Technologies or technological paths
Li-ion; Li-metal
Li-ion; Li –metal, -sulphur, -iron; Zn-air; other commer-
Experts asked to specify and provide estimates for the most commercially viable technology
General, experts might specify type
General General
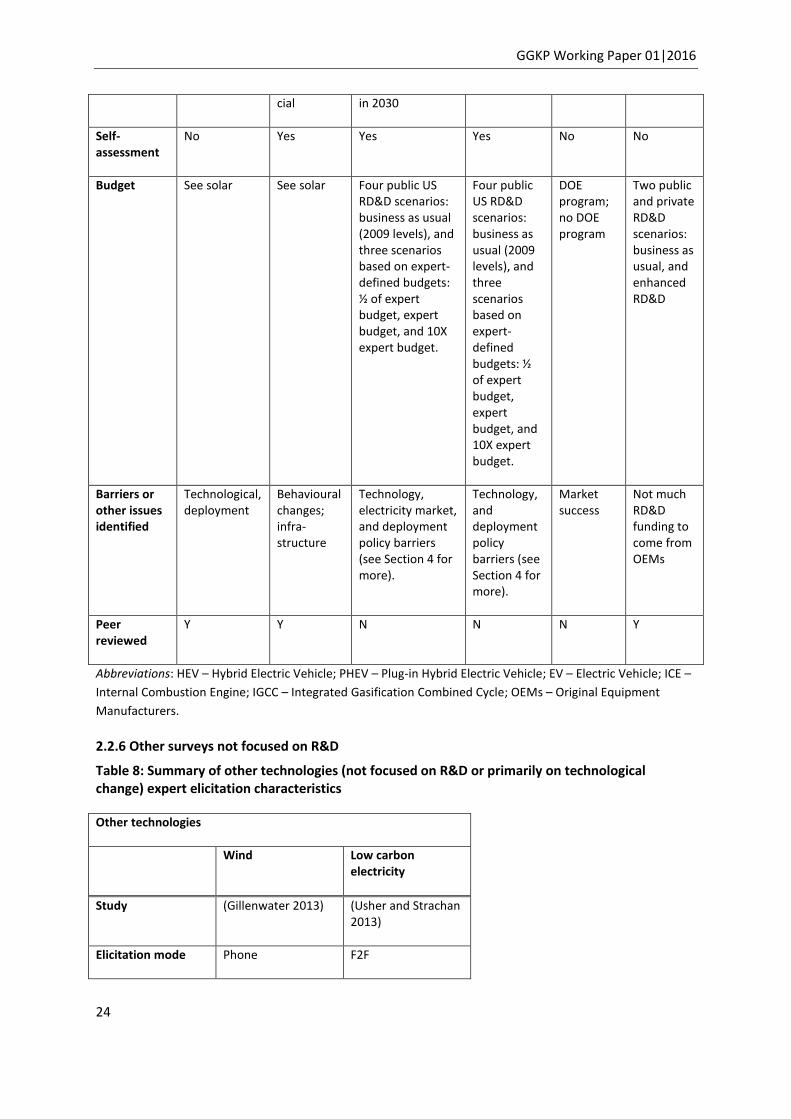
GGKP Working Paper 01|2016
24
cial in 2030
Self-assessment
No Yes Yes Yes No No
Budget See solar See solar Four public US RD&D scenarios: business as usual (2009 levels), and three scenarios based on expert-defined budgets: ½ of expert budget, expert budget, and 10X expert budget.
Four public US RD&D scenarios: business as usual (2009 levels), and three scenarios based on expert-defined budgets: ½ of expert budget, expert budget, and 10X expert budget.
DOE program; no DOE program
Two public and private RD&D scenarios: business as usual, and enhanced RD&D
Barriers or other issues identified
Technological, deployment
Behavioural changes; infra-structure
Technology, electricity market, and deployment policy barriers (see Section 4 for more).
Technology, and deployment policy barriers (see Section 4 for more).
Market success
Not much RD&D funding to come from OEMs
Peer reviewed
Y Y N N N Y
Abbreviations: HEV – Hybrid Electric Vehicle; PHEV – Plug-in Hybrid Electric Vehicle; EV – Electric Vehicle; ICE –
Internal Combustion Engine; IGCC – Integrated Gasification Combined Cycle; OEMs – Original Equipment
Manufacturers.
2.2.6 Other surveys not focused on R&D
Table 8: Summary of other technologies (not focused on R&D or primarily on technological change) expert elicitation characteristics
Other technologies
Wind Low carbon electricity
Study (Gillenwater 2013) (Usher and Strachan 2013)
Elicitation mode Phone F2F

The Future of Energy Technologies: An Overview of Expert Elicitations
25
Type of question Percentiles Percentiles
Metrics Turbine cost; capacity factor; interest rate; electricity price; REC price
LCOE
Target year 2011 2030
Experts (#, characteristics)
(7) Private sector (25) Academia, government, private sector
Technologies or technological paths
1.5MW GE turbine
Varied by expert, included wind, nuclear, CCS
Self-assessment Years of experience in industry
Test question; information on expert sources
Budget None specified None specified
Barriers or other issues identified
Size of project; buyer of electricity
Notes Study focused on prices and RECS, not technology (found strong agreement among experts on tech characteristics)
Also looked at UK population, GDP; GHG prices; oil price; UK heating patterns
Peer reviewed Y Y
Abbreviations: RECS – Residential Energy Consumption Survey

GGKP Working Paper 01|2016
26
2.3 Summary of the harmonized expert elicitation data
We present below a sample of the distributions of elicited costs from a subset of studies to provide an overview of the type of data collected in the expert elicitations. These distributions are aggregated over experts using equal weights. A subset of the original individual expert data is reported in Appendix A to the present document (not all data were available; some data were not compatible with individual expert reporting). As discussed in Section 2.2, elicited metrics were often not directly comparable between studies because survey designs differed in terms of elicited metrics, assumptions, proposed R&D budgets and time frames.
Being able to consistently summarize and compare elicited values is important to assess differences between studies and get a more comprehensive picture about the possible future of energy technologies.
Several researchers have made an attempt to overcome the lack of comparability among elicitation studies through a standardization process (Anadón, Nemet, and Verdolini 2013; Verdolini et al. 2015; Nemet, Anadón, and Verdolini 2015; Baker, Bosetti, Anadón, et al. 2015; Anadón et al. 2015). As we detail below, the standardization process was necessary because of differences across elicitations in terms of: (a) the year of the currency (some elicitations using US dollars in 2008 and others using US dollars in 2010, for instance); (b) the level of granularity in the questions (e.g., some elicitations asked questions about overnight capital costs and others about levelized cost of electricity); and (c) the year for which estimates were requested (e.g., 2030 vs. 2050). The studies that conducted a standardization process describe the assumptions made to derive comparable estimates, such as discount rates, lifetimes and insolation rates, among others. Whenever possible we present data that were standardized. If a study was not included in the standardization summarized in Appendix C, we present the original data, when available, in Appendix A. Details on whether a study was included in the standardization procedure are reported in Table 2, and the reasons to exclude a study are discussed in detail below. All the standardized data presented in Appendix A are sourced from Nemet, Anadón, and Verdolini (2015), which builds on previous contributions. The two standardized variables of interest are the elicited metrics and the R&D levels for the different studies. Below, we summarize briefly the rationale guiding the standardization procedure. For further details, we refer the reader to the original elicitation studies and to Appendix C.
The choice of studies included in the standardization procedure and analyzed in Nemet, Anadón, and Verdolini (2015) was based on three reasons. First, only the studies that asked experts to provide probabilistic estimates in which experts were confronted with R&D budgets were included. Other types of forecasts, such as central estimates and ranges with no probabilities attached, were excluded (and are not shown in this report) because they 1) do not include a process of debiasing which is central to the expert elicitation methodology, and 2) cannot be used to explore the effect of R&D investments, protocol and expert characteristics on different points of the cost distribution (more on this is in Section 4). Second, inclusion in the standardization process often required transforming the elicited metric based on some clearly specified assumptions, as explained in detail in Appendix C. Hence, only the studies for which such assumptions could be made explicit and could be grounded in evidence were included in the standardization process. Finally, there had to be at least two studies on a given technology for them to be included. The list of studies for which comparable elicited metrics were produced is presented in Table 1.
The standardization process (discussed in Nemet, Anadón, and Verdolini 2015; Anadón et al. 2015; Baker, Bosetti, Anadón, et al. 2015 and Anadón, et al. 2015) required addressing differences in technology specificity across and within studies. For instance, some nuclear surveys focused on collecting information on the most commercially-viable, large-scale Gen. IV nuclear system and its future

The Future of Energy Technologies: An Overview of Expert Elicitations
27
cost, while others focused on specific reactor configurations, such as fast reactors and high temperature reactors. The standardization procedure identified the common denominator for technology specificity.
The second issue addressed was that elicitations focused on different elicited metrics. For example, all FEEM surveys, except CCS and nuclear, collected information on the levelized cost of electricity, while Harvard collected data on different components, such as inverter efficiency and cost for solar photovoltaics. In the cases where the technological details of the surveys differed within each technology, it was necessary to construct a model to make the data comparable using common assumptions. This allowed the conversion of elicited estimates into a cost metric of $/kWh in 2030. This common metric represented an LCOE for solar photovoltaics, a non-energy LCOE for bioelectricity, a non-energy levelized cost of fuel for biofuels, a partial levelized cost of electricity for nuclear (including only capital cost), and a levelized additional cost of CCS.
Finally, all studies included in the standardization asked experts to provide technology estimates for 2030, with the exception of the UMass studies, which asked experts about 2050. The UMass studies were interpolated from 2050 to 2030 using a process described in Baker, Bosetti, Anadón, et al. (2015).
All available individual expert elicitation data (standardized and non-standardized) are presented in Appendix A. Given that some experts provided cost estimates for different sub-technologies within each survey for each expert, we show only the lowest cost sub-technology estimate.
Figure 1 shows an overview of the range of elicited non-energy levelized bioelectricity cost values from three studies. Compared to 2014 estimates of costs from Bloomberg New Energy Finance (BNEF) (Chase 2015), which have a median bioelectricity LCOE (including biomass costs) of about 0.12 $/kWh, we can see that UMass and Harvard experts foresee significant cost reductions in 2030, with significant overlap across those studies. FEEM experts seem more pessimistic, with 2030 non-energy levelized costs being in many cases greater than the 2014 full LCOE costs
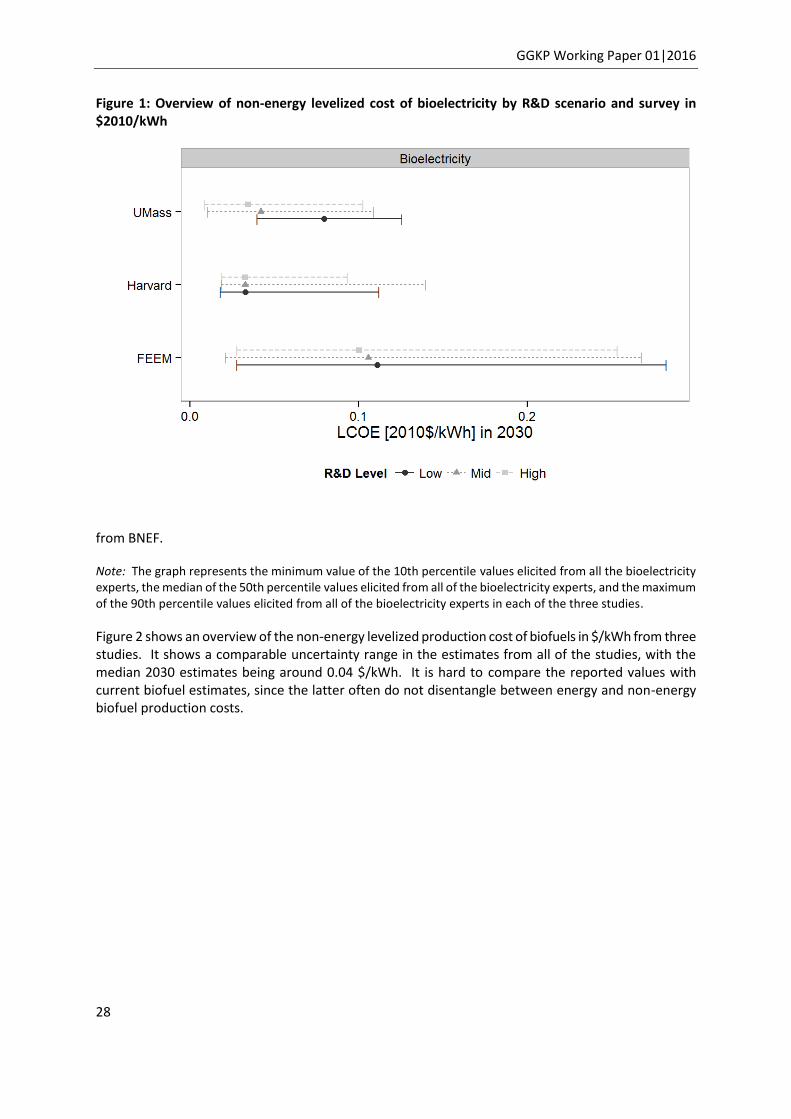
GGKP Working Paper 01|2016
28
Figure 1: Overview of non-energy levelized cost of bioelectricity by R&D scenario and survey in $2010/kWh
from BNEF.
Note: The graph represents the minimum value of the 10th percentile values elicited from all the bioelectricity experts, the median of the 50th percentile values elicited from all of the bioelectricity experts, and the maximum of the 90th percentile values elicited from all of the bioelectricity experts in each of the three studies.
Figure 2 shows an overview of the non-energy levelized production cost of biofuels in $/kWh from three studies. It shows a comparable uncertainty range in the estimates from all of the studies, with the median 2030 estimates being around 0.04 $/kWh. It is hard to compare the reported values with current biofuel estimates, since the latter often do not disentangle between energy and non-energy biofuel production costs.

The Future of Energy Technologies: An Overview of Expert Elicitations
29
Figure 2: Overview of non-energy levelized cost of biofuel production by R&D scenario and survey in $2010/kWh
Note: The graph represents the minimum value of the 10th percentile values elicited from all the biofuel experts, the median of the 50th percentile values elicited from all of the biofuel experts, and the maximum of the 90th percentile values elicited from all of the biofuel experts in each of the three studies.
Figure 3 shows an overview of additional levelized capital costs from coal plants with CCS plants over coal plants without CCS for two studies in $/kWh. Harvard estimates were generally more optimistic than UMass experts. This may be partly due to the process used to convert UMass 2050 estimates to 2030, or it may be related to the specific technologies assessed in the different studies.

GGKP Working Paper 01|2016
30
Figure 3: Overview of levelized additional capital cost for a coal plant with CCS over a coal plant without
CCS per R&D scenario and survey in $2010/kWh.
Note: In this case, we show the 10th,50th and the 90th percentile of the joint distribution of all the CCS experts (Baker, Bosetti, Anadón et al., 2015).
Figure 4 shows the overview of levelized capital cost of nuclear power for four studies in $/kWh. While the median across the studies is somewhat consistent, at about 0.07$/kWh, the upper and lower bounds are quite different. Note that the very large uncertainty bound on the low R&D case for UMass is primarily an artifact of the conversion from probabilities to percentiles. (The two specified endpoints in the UMass study had very close probabilities in the low R&D case. The best fit to a smoothed cubic led to a very high upper bound). BNEF reports the 2014 LCOE (including operations and maintenance and fuel costs, among others, in addition to the overnight capital cost, included in the data reported in Figure 4) in the US and China around 0.12 $/kWh (Chase 2015). While the data presented here is not directly comparable to widely reported numbers, capital cost is often the largest part of the LCOE for nuclear, indicating that some improvement over 2014 numbers is expected by 2030.

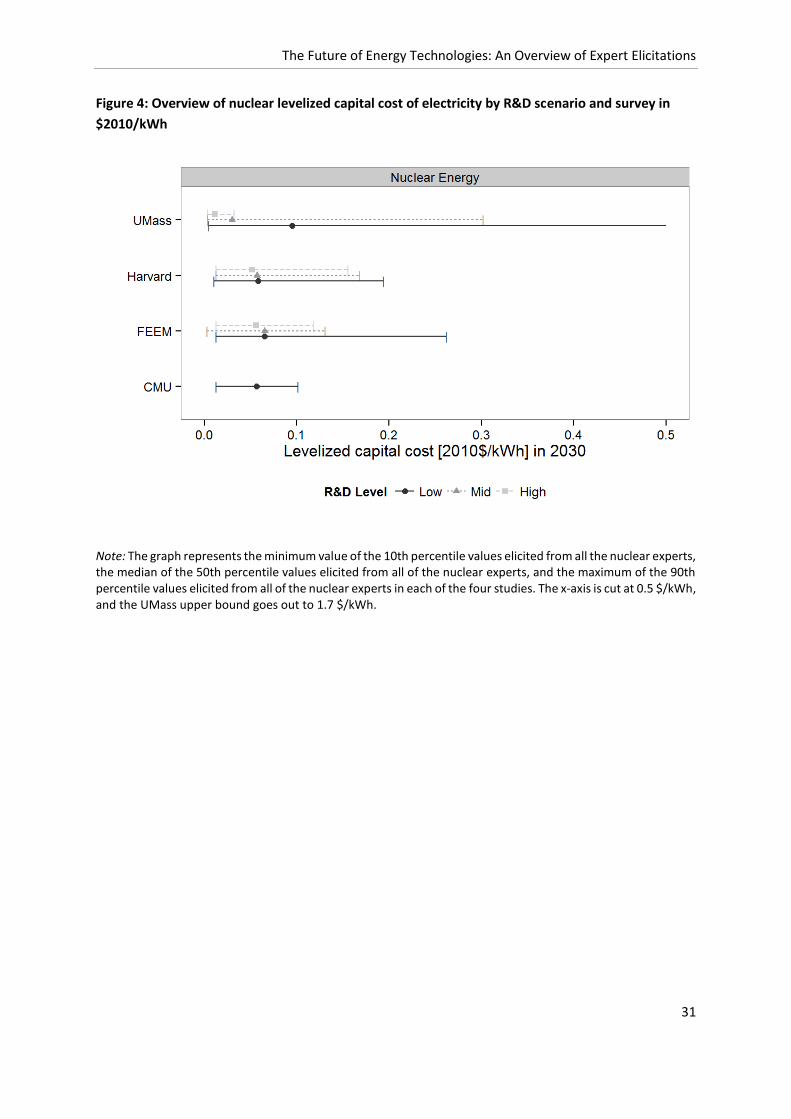
The Future of Energy Technologies: An Overview of Expert Elicitations
31
Figure 4: Overview of nuclear levelized capital cost of electricity by R&D scenario and survey in
$2010/kWh
Note: The graph represents the minimum value of the 10th percentile values elicited from all the nuclear experts, the median of the 50th percentile values elicited from all of the nuclear experts, and the maximum of the 90th percentile values elicited from all of the nuclear experts in each of the four studies. The x-axis is cut at 0.5 $/kWh, and the UMass upper bound goes out to 1.7 $/kWh.
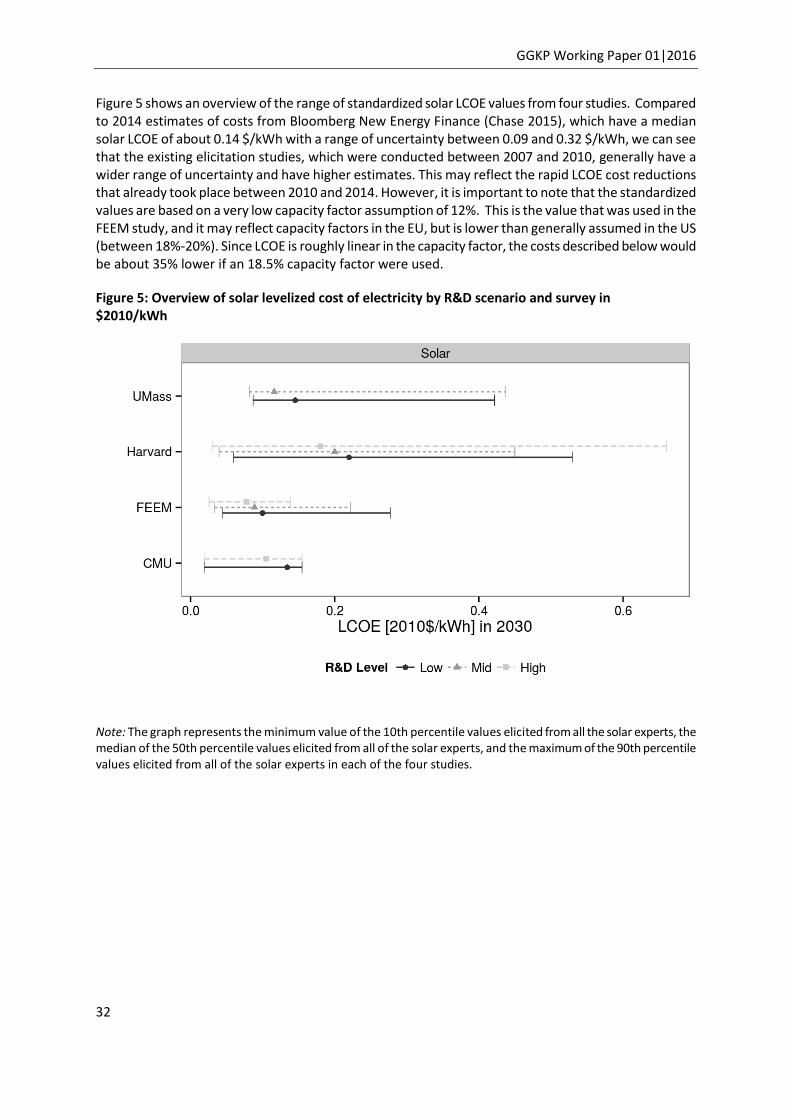
GGKP Working Paper 01|2016
32
Figure 5 shows an overview of the range of standardized solar LCOE values from four studies. Compared to 2014 estimates of costs from Bloomberg New Energy Finance (Chase 2015), which have a median solar LCOE of about 0.14 $/kWh with a range of uncertainty between 0.09 and 0.32 $/kWh, we can see that the existing elicitation studies, which were conducted between 2007 and 2010, generally have a wider range of uncertainty and have higher estimates. This may reflect the rapid LCOE cost reductions that already took place between 2010 and 2014. However, it is important to note that the standardized values are based on a very low capacity factor assumption of 12%. This is the value that was used in the FEEM study, and it may reflect capacity factors in the EU, but is lower than generally assumed in the US (between 18%-20%). Since LCOE is roughly linear in the capacity factor, the costs described below would be about 35% lower if an 18.5% capacity factor were used.
Figure 5: Overview of solar levelized cost of electricity by R&D scenario and survey in $2010/kWh
Note: The graph represents the minimum value of the 10th percentile values elicited from all the solar experts, the median of the 50th percentile values elicited from all of the solar experts, and the maximum of the 90th percentile values elicited from all of the solar experts in each of the four studies.

The Future of Energy Technologies: An Overview of Expert Elicitations
33
3. Energy R&D budgets
In this part of the report, we review data on R&D budgets allocation collected through the expert elicitations. Section 3.1 provides an overview of data on current and past R&D spending in each of the technologies considered. Similar data were included by most studies as background information to the experts. Note that even though many of the studies considered research, development and demonstration (RD&D) investments, we refer to R&D for simplicity. Section 3.2 reports, for those studies that collected them, information on total recommended R&D (in non-probabilistic terms), while Section 3.3 provides information on experts’ recommendations about R&D allocation. Key insights from other qualitative and non-probabilistic information collected through some of the elicitations are summarized in Appendix B. All amounts are in United States dollars unless otherwise specified.
3.1 Energy RD&D budgets, an overview
Most of the expert elicitation studies that include background information about energy R&D budgets provide data on public sector investments, for three main reasons. First, these elicitations seek to inform public investments in energy R&D, and thus, information about current public investments can help experts calibrate what is being achieved with current funding and to project what the impact of any increases may be. Second, information about private sector investments in energy R&D, both overall and for specific energy technology areas, is hard to come by (as we discuss later on in Section 3.1). Third, although this is less relevant for this review, our understanding of the impact of public or private energy R&D investments on each other is not very good. Therefore, many studies that ask experts to evaluate the future of technologies for particular government R&D investments request experts to assume that all other factors (e.g., economic growth and deployment policies) follow a business-as-usual scenario, and that any additional private R&D investments over this scenario they envision must be directly a result of the public R&D investment (for instance, through cost-shared agreements or new areas of research being opened). For instance, the FEEM, Harvard and UMass expert elicitation studies provide background information to the participating experts regarding the public funding for R&D for the technology area evaluated in one particular year and geography (from the U.S. Department of Energy for the Harvard and UMass studies, and from the International Energy Agency (IEA) Energy Technology RD&D budgets database for the FEEM study).
This section provides an overview of data on public and private R&D budgets for energy technologies over time. It integrates and goes beyond (temporally and spatially) the information that the elicitation studies presented since it could serve to inform future efforts.
Public energy RD&D in industrialized countries
The International Energy Agency (IEA) maintains the most comprehensive and inclusive database of public energy R&D investments over time for its 29 member countries: Australia, Austria, Belgium, Canada, Czech Republic, Denmark, Estonia, Finland, France, Germany, Greece, Hungary, Ireland, Italy, Japan, Republic of Korea, Luxembourg, Netherlands, New Zealand, Norway, Poland, Portugal, Slovak Republic, Spain, Sweden, Switzerland, Turkey, United Kingdom and the United States.4
Figure 6 shows overall public energy R&D investments reported by the IEA member countries between 1974 and 2013. Note that given delays in submissions, the most recent complete information available is for 2011, a year in which the combined energy R&D investments for those member countries added to
4 Chile, Iceland and Mexico are OECD members, but are not IEA members.

GGKP Working Paper 01|2016
34
14,500 million euros (2013€). The governments also provide a breakdown into more granular categories (IEA 2015).5
Broadly speaking, the IEA collects data on these large technology categories: Group I: energy efficiency; Group II: fossil fuels; Group III: renewable energy sources; Group IV: nuclear fission and fusion; Group V: Hydrogen and fuel cells; Group VI: other power and storage techs; and Group VII: total other cross-cutting technologies or research. Within each of these categories, governments are asked to provide much more detailed information. For example, one of the categories in Group III is “solar energy,” which is itself divided into “solar heating and cooling,” “PV,” “solar thermal power and high-temperature applications,” and “unallocated solar energy.”
R&D information at more granular levels (i.e., for more specific technologies within nuclear, solar and biofuels, among others) was provided in most of the elicitations that had questions about RD&D or RD&D scenarios. This information was sourced in some cases from the IEA database described above (e.g., FEEM) and in some cases from more granular databases, such as the Harvard US DOE budget authority for energy research, development and demonstration database (DOE 2014), or direct extraction from budget documents, such as the DOE budget justification (note that the Harvard elicitations used a combination of the Harvard DOE database and the budget justification documents). Figure 7 below provides a time trend for investments in various programs from the Harvard database as an example.
5 For details on the countries and technologies covered, see IEA (2015).

The Future of Energy Technologies: An Overview of Expert Elicitations
35
Figure 6: Public energy RD&D investments reported by IEA member countries between 1974 and 2013
Note: The last year with up to date information is 2011. The 2012 and 2013 submissions do not contain information from all countries that report.

GGKP Working Paper 01|2016
36
Figure 7: Example of a subset of data included in Harvard DOE database
Source: Gallagher and Anadón 2014. Note: The database includes more granular information than that shown here.
Private energy R&D
As previously mentioned, information on private energy R&D investments is rather poor. Thus, expert elicitations typically do not provide this information. The few available sources of data in this respect offer a partial picture of investments in the technologies covered in the elicitations. Better information is available for electricity generation technologies, especially renewables. Conversely, information on other technologies, such as vehicles and batteries, is very limited.
The most recent version of the US National Science Foundation Industrial Surveys (see NSF 2015) – the Business Research and Development and Innovation Survey (BRDIS) – described in Anadón, Bunn, and Narayanamurti (2014), covers energy broadly. Before 2008, BRDIS had three broad technology classes (nuclear energy, fossil energy and all other) and only covered about 100 large firms. After 2008, it covered over 11,000 firms and provided a clear definition of “energy”, but it did not provide results disaggregated by technology area. Data are available since 2000, and the most recent available estimate

The Future of Energy Technologies: An Overview of Expert Elicitations
37
(2010) from these sources indicates private energy R&D investments in the US at over $16 billion (in 2010 US dollars) for a total of 11,557 firms.
The EU Joint Research Centre (Wiesenthal et al. 2012) estimates private investments in technologies as part of its Strategic Energy Technology Plan, which covers several energy technologies: wind energy, photovoltaics (PV), concentrating solar power (CSP), CCS, biofuels, hydrogen and fuel cells, smart grids, nuclear fission and nuclear fusion. The authors use a bottom up approach that refines basic data on individual companies taken from the EU Industrial RD&D Investment Scoreboard, companies’ annual reports with other publicly available data, and direct contacts with individual enterprises. Information is presented by technology and country, but not by firm counts. Using this methodology, they estimate that corporate R&D in 2007 for non-nuclear technology areas was around €1.66 billion €2007, with a margin of error of 24%. Given the broader definition of energy R&D used in the NSF BRDIS survey, the EU and US numbers presented are not comparable.
Energy R&D in emerging economies
Public and private energy R&D data in middle- and low-income countries are hard to find – in these types of countries such data are not compiled systematically in any database, and it is typically harder to collect any type of information in these countries. A recent Harvard study demonstrated that their investments in energy technology R&D are important and deserve to be taken into account in an effort to think about the future evolution of technologies. Kempener, Anadón, and Condor (2010) show that, in 2008, the BRIMCS countries (Brazil, Russia, India, Mexico, China and South Africa) invested at least $13.8 billion 2008$ PPP. This estimate includes funding from state-owned enterprises where the government has a majority stake. The data are only available for one year and are broken down by country and into categories compatible with the IEA technology categorization, namely: fossil (including CCS), nuclear, electricity, transmission, distribution and storage, renewable energy sources, energy efficiency, and other. The “at least” caveat mentioned above is important because there were many categories for which data were not available for a particular country, but this does not mean that there was no expenditure in the area. In the same year, governments in IEA member countries reported investing $12.7 billion 2008$ PPP.
A report by the Frankfurt School, UNEP and Bloomberg New Energy Finance (BNEF and Frankfurt School/UNEP Centre 2014) has a global coverage but does not provide a breakdown by country for private RD&D. This report, which has been produced yearly since 2010, only covers renewable power and fuels (thus, it does not include, for example, vehicles, efficiency, nuclear or CCS). Other major limitations of this data source are that the number and size of the firms included in the estimates are not specified, and it is unclear how the renewables R&D budget for big corporations active in both energy and non-energy technology areas is determined and what the criteria are for including firms. Nonetheless, this source indicates a budget of $5 billion 2014$ in corporate RD&D in renewables in 2013, which, according to their estimates, is roughly the same size as the amount of government R&D for clean energy.
The source of the data for this report is the Bloomberg New Energy Finance (BNEF) database (BNEF 2012) . The BNEF database includes data from 2004 but is not freely available. It collects information on private R&D investments, as well as other types of investments, such as venture capital, private equity and asset finance in renewable energy technologies (for details, see, for instance, Rodríguez et al. 2015). As mentioned above, however, it is unclear what the actual coverage of this database is (e.g., how many companies are accounted for in each country and what types of companies are included), which makes it hard to use. With these caveats in mind, estimates of private renewable energy R&D investments from this data source total around $3.7 billion, as detailed in Table 9 and Table 10.

GGKP Working Paper 01|2016
38
Table 9. Private RD&D investment by country class, all renewable technologies (Billions of United States dollars)
Country 2004 2005 2006 2007 2008 2009 2010 2011
Brazil 0.01 0.01 0.02 0.05 0.04 0.05 0.04 0.04
China 0.02 0.02 0.03 0.09 0.20 0.32 0.46 0.32
Europe 1.14 0.75 0.93 0.74 1.16 1.28 1.41 0.97
India 0.00 0.00 0.01 0.01 0.03 0.06 0.06 0.04
United States 2.30 0.75 0.87 0.76 1.01 0.93 1.06 1.03
Other 1.67 0.97 099 1.04 1.46 1.31 1.53 1.28
Total 5.15 2.51 2.87 2.70 3.91 4.01 4.57 3.68
Note: Total may differ slightly due to rounding.
Table 10: Private RD&D investment by technology class, all countries (Billions of United States dollars)
Renewable 2004 2005 2006 2007 2008 2009 2010 2011
Biofuels 0.51 0.20 0.19 0.21 0.32 0.40 0.52 0.40
Biomass & waste 0.60 0.33 0.33 0.00 0.38 0.37 0.41 0.34
Geothermal 0.03 0.05 0.07 0.04 0.08 0.07 0.08 0.07
Marine 0.00 0.00 0.00 0.00 0.02 0.01 0.01 0.01
Small hydro 0.03 0.07 0.09 0.08 0.11 0.14 0.12 0.11
Solar 3.60 1.58 1.76 1.93 2.33 2.28 2.54 2.16
Wind 0.39 0.28 0.45 0.45 0.69 0.76 0.89 0.64
Total 5.16 2.51 2.89 2.71 3.93 4.03 4.57 3.73
Note: Totals may differ slightly due to rounding.

The Future of Energy Technologies: An Overview of Expert Elicitations
39
3.2 Recommended government energy R&D budgets
As described in Section 2, many studies asked experts to estimate future costs based on specified R&D investment levels. The Harvard study combined this approach for the BAU scenario by asking experts for their recommended annual investment levels in R&D between 2010 and 2030 to increase the commercial viability of the technology. When confronted with this question, on average experts in various technology areas recommended increasing public RD&D funding for that technology area by a factor of 2.5 to 11. With the largest average increase of a factor of 11 being recommended for energy storage, and the lowest average increases of a factor of three to fossil energy, solar PV and bioenergy (see also Anadón, Bunn, and Narayanamurti 2014, table ES-1).
Figure 8 includes the exact RD&D funding amounts recommended by the experts by technology area in the Harvard survey. This is the only study that asked experts directly for recommendations about RD&D investments.

GGKP Working Paper 01|2016
40
Figure 8: Recommended budgets from the Harvard studies per expert and technology
The Future of Energy Technologies: An Overview of Expert Elicitations
41
3.3 Data on the experts suggested allocation of government R&D
The Harvard elicitations asked experts to allocate “chips” across various specific technology areas and types of research: basic research, applied research, experiments and pilots, and commercial demonstration. For the mail and in-person surveys experts were asked to physically allocate 100 chips to different boxes in a large board composed of squares that represent a specific technology and type of research. Experts were then instructed to add up the chips in each box and write the number down – each box ends up with a number that corresponds to the percentage of the total budget that the expert would like to allocate to that specific technology and type of research. For the online surveys, experts had a virtual representation of the board game, with 100 chips appearing at the bottom of the screen and disappearing as experts allocated them to the different boxes, with the program adding the chips in each box.
The FEEM experts in all surveys but the CCS one were also endowed with 100 chips and asked to allocate them across the technologies focus of the study. Moreover, they were asked to comment on whether the RD&D investment should target basic research, applied research, or demonstration and deployment.
The rest of this subsection contains a summary of the results from the budget allocations for each of the Harvard and FEEM surveys. All heat maps included below represent average percentage allocations across experts and come from those sources. The reader interested in the detailed data should consult Anadón, Bunn, et al. (2011) and the Appendix in that document, along with Bosetti and Catenacci (2014) from which this section draws heavily.
Note that the experts recommended allocation of funds across technologies and across basic research, applied research, experiments and pilots, and demonstration cannot be directly compared with current programs in the US or the EU because the technology-detailed budget documentations do not use the detailed breakdown, even though the national R&D statistics reporting on all federal R&D investments use a similar construct comprised of basic research, applied research and development (see NSB, National Science Board 2014), with the latter category being arguably a good proxy for the combination of experiments and pilots and demonstration. Keeping this in mind, it is worth noting that the fraction of the 2011 federal R&D budget in the US for all technologies devoted to the basic research, applied research and development in was 32%, 24% and 44% respectively.
3.3.1 Bioenergy and biofuels government RD&D experts suggested allocation
Table 11, below, indicates that, on average, experts participating in the Harvard bioenergy survey – which covered both bioelectricity and biofuels – allocated the largest percentages of their budget to basic research in gasification and commercial demonstration of gasification, hydrolysis and other technologies. Experts were asked to specify what additional research they thought should be conducted and to include it in the “other”’ category. Experts highlighted enhancing biochemical technologies, developing transportation technologies that can use liquid fuels that are not perfect substitutes for conventional fuels, fossil fuel refining and conversion technologies, and feedstock genetics, harvest and transport. On average, experts recommended 47% of the budget to be devoted to conversion technologies, 47% to refining technologies, and 7% to other (e.g., feedstock development).
Table 12 presents similar information for the FEEM experts, who recommend devoting the majority of the R&D budget to conversion processes, both in terms of applied research and development, and about a quarter of the budgeted to both electricity generation and feedstock. Most of the investments suggested are in the later stages of the R&D process in these two groups. Regarding biofuels, FEEM experts suggested that roughly 75% of the budget should be almost equally split among conversion technologies and feedstock, with refining processes attracting the remaining part (Table 13).

GGKP Working Paper 01|2016
42
Table 11: Average allocation of recommended annual U.S. federal bioenergy RD&D budget from 2010-2030 (Percentage of total budget)
Conversion Others
Gasific
ation
Liq
uefa
ction
Hydro
lysis
Pyro
lysis
Cata
lytic r
efo
rmin
g
Hydro
treating
Tra
nseste
rification
Cro
ss-
transeste
rification
Ferm
enta
tion
Mem
bra
ne s
epara
tion
Mic
ro-e
muls
ific
ation
Solv
ent extr
action
Oth
er
Basic Research 4.7% 1.2% 2.0% 2.4% 1.4% 1.2% 0.2% 0.3% 1.9% 1.8% 0.5% 1.1% 1.3%
Applied Research 1.9% 1.6% 3.9% 2.3% 2.1% 1.9% 0.6% 0.5% 2.3% 1.7% 0.6% 1.4% 1.2%
Experiments and
Pilots2.7% 1.6% 3.3% 3.7% 2.3% 2.8% 0.4% 0.6% 3.7% 2.4% 1.0% 1.4% 3.0%
Commercial
Demonstration5.9% 1.7% 4.0% 3.7% 1.1% 1.7% 0.2% 0.5% 1.7% 0.8% 0.5% 0.7% 6.6%
Total
15.2% 6.1% 13.2% 12.1% 6.9% 7.6% 1.4% 1.9% 9.6% 6.7% 2.6% 4.6% 12.1%
Refining
Source: Anadón, Bunn, et al. 2011
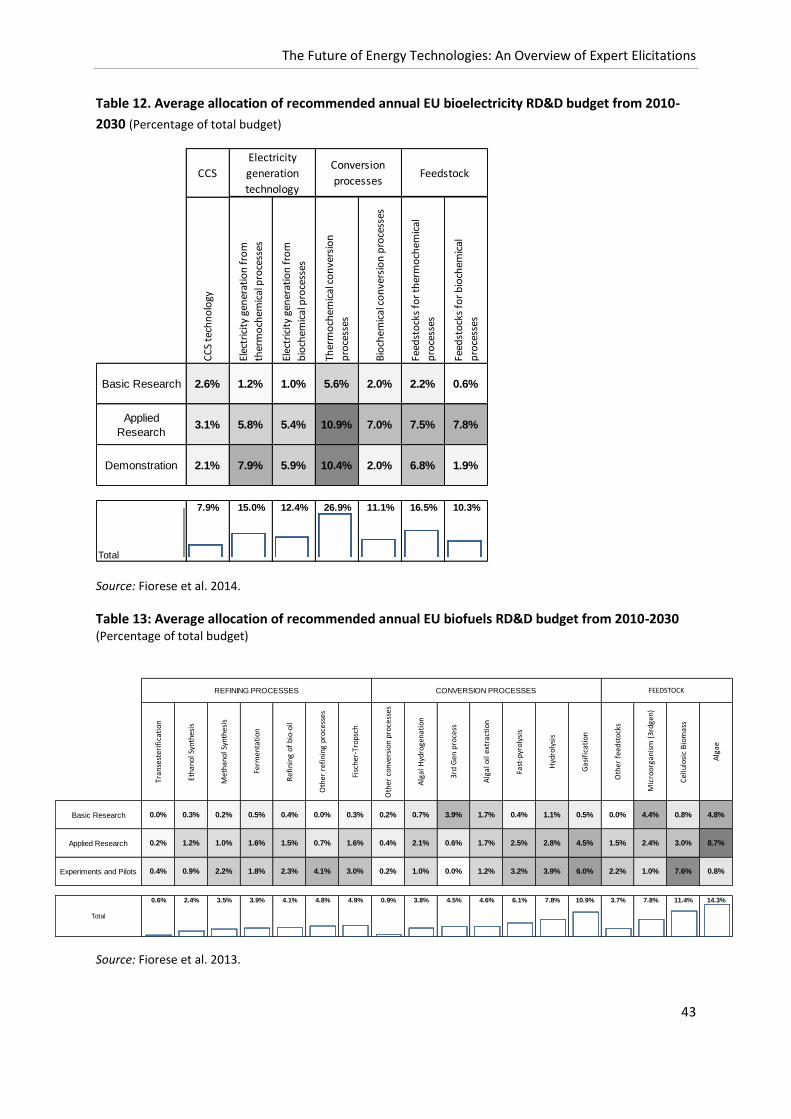
The Future of Energy Technologies: An Overview of Expert Elicitations
43
Table 12. Average allocation of recommended annual EU bioelectricity RD&D budget from 2010-
2030 (Percentage of total budget)
CCS
CC
S te
chn
olo
gy
Elec
tric
ity
gen
erat
ion
fro
m
ther
mo
chem
ical
pro
cess
es
Elec
tric
ity
gen
erat
ion
fro
m
bio
chem
ical
pro
cess
es
Ther
mo
chem
ical
co
nve
rsio
n
pro
cess
es
Bio
chem
ical
co
nve
rsio
n p
roce
sses
Feed
sto
cks
for
ther
mo
chem
ical
pro
cess
es
Feed
sto
cks
for
bio
chem
ical
pro
cess
es
Basic Research 2.6% 1.2% 1.0% 5.6% 2.0% 2.2% 0.6%
Applied
Research3.1% 5.8% 5.4% 10.9% 7.0% 7.5% 7.8%
Demonstration 2.1% 7.9% 5.9% 10.4% 2.0% 6.8% 1.9%
Total
7.9% 15.0% 12.4% 26.9% 11.1% 16.5% 10.3%
Electricity
generation
technology
Conversion
processesFeedstock
Source: Fiorese et al. 2014.
Table 13: Average allocation of recommended annual EU biofuels RD&D budget from 2010-2030 (Percentage of total budget)
Source: Fiorese et al. 2013.
Tran
sest
erif
icat
ion
Etha
nol S
ynth
esis
Met
hano
l Syn
thes
is
Ferm
enta
tion
Ref
inin
g of
bio
-oil
Oth
er r
efin
ing
proc
esse
s
Fisc
her-
Trop
sch
Oth
er c
onve
rsio
n pr
oces
ses
Alg
al H
ydro
gena
tion
3rd
Gen
pro
cess
Alg
al o
il ex
trac
tion
Fast
-pyr
olys
is
Hyd
roly
sis
Gas
ific
atio
n
Oth
er f
eed
stoc
ks
Mic
roor
gani
sm (
3rdg
en)
Cel
lulo
sic
Bio
mas
s
Alg
ae
Basic Research 0.0% 0.3% 0.2% 0.5% 0.4% 0.0% 0.3% 0.2% 0.7% 3.9% 1.7% 0.4% 1.1% 0.5% 0.0% 4.4% 0.8% 4.8%
Applied Research 0.2% 1.2% 1.0% 1.6% 1.5% 0.7% 1.6% 0.4% 2.1% 0.6% 1.7% 2.5% 2.8% 4.5% 1.5% 2.4% 3.0% 8.7%
Experiments and Pilots 0.4% 0.9% 2.2% 1.8% 2.3% 4.1% 3.0% 0.2% 1.0% 0.0% 1.2% 3.2% 3.9% 6.0% 2.2% 1.0% 7.6% 0.8%
Total
0.6% 2.4% 3.5% 3.9% 4.1% 4.8% 4.9% 0.9% 3.8% 4.5% 4.6% 6.1% 7.8% 10.9% 3.7% 7.8% 11.4% 14.3%
REFINING PROCESSES FEEDSTOCKCONVERSION PROCESSES

GGKP Working Paper 01|2016
44
3.3.2 CCS Government RD&D experts suggested allocation
Table 14, below, summarizes the average recommended allocation of US federal RD&D investments in fossil energy. Commercial demonstration of CCS retrofits, integrated gasification combined cycle, oxy-combustion and chemical absorption are the areas that, on average, received the largest recommendation.
Table 14: Average allocation of recommended annual U.S. federal fossil energy (includes CCS technologies) (Percentage of total budget)
Coal PowerGas
Power
Res.
Devel.Others
Chem
- absorp
tion
Phys. A
bsorp
tion
Adsorp
tion
Mem
bra
nes
Pulv
erized/F
luid
ized
bed
IGC
C
Oxy -
com
bustion
UC
G
Chem
ical lo
opin
g
NG
CC
Resourc
e D
evel.
Non-p
ow
er
pro
ducts
Fuel cells
CC
S r
etr
ofit
Sensors
/contr
ols
Non-C
O2 e
nv.
Contr
ol.
Oth
er
Basic Research 0.5% 0.9% 0.6% 1.5% 0.5% 0.7% 0.7% 0.8% 1.3% 0.3% 0.3% 0.4% 0.6% 0.6% 0.3% 0.5% 1.2%
Applied Research 1.3% 1.2% 1.5% 1.5% 0.9% 1.6% 1.6% 1.2% 2.3% 0.8% 0.8% 0.8% 1.8% 1.3% 0.6% 0.6% 1.1%
Experiments and Pilots 1.3% 0.9% 1.0% 1.4% 1.1% 2.6% 2.6% 1.3% 2.5% 1.3% 0.7% 0.9% 1.4% 3.1% 0.6% 0.8% 1.5%
Commercial
Demonstration5.2% 1.4% 1.0% 1.6% 1.2% 8.3% 4.9% 1.2% 2.9% 1.6% 0.8% 1.5% 1.8% 6.7% 0.6% 0.7% 1.2%
Total
8.3% 4.4% 4.1% 6.0% 3.7% 13.2% 9.8% 4.5% 9.0% 4.0% 2.6% 3.6% 5.6% 11.7% 2.1% 2.6% 5.0%
Cross-cutting research areasCapture Technologies
Source: Anadón, Bunn, et al. 2011. Note: RD&D budget from 2010-2030 (percent of total budget).
3.3.3 Nuclear power government RD&D experts suggested allocation
Table 15 shows the average recommended allocation for Harvard nuclear fission experts. Various combinations of technology and types of research stood out, with experiments for sodium-cooled fast reactors and for very high temperature reactors, as well as applied research and pilots in fuel cycle issues receiving the largest share of funding on average.
Since FEEM and Harvard collaborated in the nuclear survey, results are also available for nuclear
European experts (see
Table 16) using the same technology and research categorizations. Comparison of Tables 15 and 16 shows that there is (in general) an agreement with respect to funding need between EU and US nuclear experts.
Table 15: Average allocation of recommended annual US federal nuclear fission RD&D budget from 2010-2030 (Percentage of total budget)

The Future of Energy Technologies: An Overview of Expert Elicitations
45
Source: Anadón, Bunn, et al. 2011.
Table 16: Average allocation of recommended annual EU nuclear fission RD&D budget from 2010-2030 (Percentage of total budget)
Others
GF
R
SF
R
LF
R
SC
WR
MS
R
VH
TR
SM
R
Fuel c
ycle
Fuels
Ris
k a
nd s
afe
ty
Econom
ics
Pro
lif. R
esis
t phys
pro
tect
Non-p
ow
er
pro
ducts
(e.g
.,
H2)
Oth
ers
Basic Research 1.5% 2.6% 1.5% 0.6% 0.7% 1.3% 1.2% 2.4% 3.0% 2.1% 1.3% 1.0% 1.1% 0.4%
Applied
Research1.5% 3.8% 1.6% 0.9% 0.8% 2.3% 2.0% 3.3% 3.8% 2.9% 1.7% 1.8% 2.0% 0.6%
Experiments
and Pilots1.8% 4.8% 1.7% 0.7% 0.5% 3.1% 2.1% 3.6% 3.8% 2.7% 1.3% 1.5% 2.1% 0.5%
Commercial
Demonstration0.9% 3.8% 0.8% 0.4% 0.2% 1.8% 1.9% 2.5% 2.2% 1.5% 1.3% 0.9% 1.8% 0.3%
Total
5.6% 15.0% 5.7% 2.6% 2.1% 8.7% 7.2% 11.7% 12.8% 9.1% 5.5% 5.2% 7.0% 1.8%
Specific reactor systems Cross-cutting areas
Source: Bosetti and Catenacci 2014.
3.3.4 Solar PV and CSP government RD&D experts suggested allocation
Table 17 shows that, on average, Harvard PV experts recommended devoting the largest percentages of the federal solar PV R&D program to basic research on novel efficiency concepts, basic, applied, and
Others
GF
R
SF
R
LF
R
SC
WR
MS
R
VH
TR
SM
R
Fuel c
ycle
Fuels
Ris
k a
nd s
afe
ty
Econom
ics
Pro
lif. R
esis
t phys
pro
tect
Non-p
ow
er
pro
ducts
(e.g
., H
2)
Oth
ers
Basic Research 0.8% 2.3% 1.0% 0.4% 0.7% 2.1% 1.5% 3.0% 2.8% 1.4% 0.7% 0.9% 1.5% 1.5%
Applied
Research0.8% 3.5% 1.2% 0.3% 0.9% 3.6% 2.4% 4.4% 3.7% 2.8% 2.3% 1.8% 1.3% 1.6%
Experiments
and Pilots0.9% 4.5% 1.0% 0.3% 0.7% 4.1% 3.3% 4.3% 2.8% 2.2% 0.8% 1.7% 1.2% 1.3%
Commercial
Demonstration0.6% 3.5% 0.4% 0.1% 0.2% 3.5% 3.0% 2.3% 1.5% 0.8% 0.8% 1.6% 0.0% 1.2%
Total
3.1% 13.8% 3.6% 1.1% 2.5% 13.3% 10.2% 14.0% 10.8% 7.2% 4.6% 6.0% 4.0% 5.6%
Cross-cutting areasSpecific reactor systems
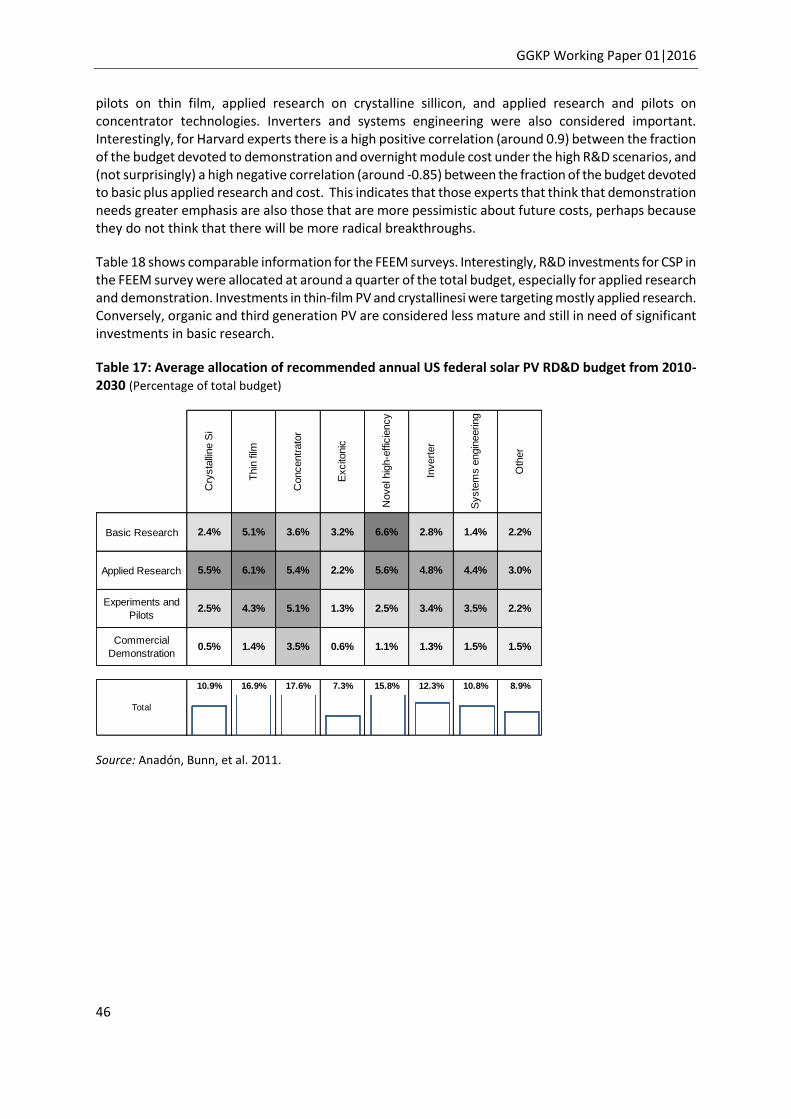
GGKP Working Paper 01|2016
46
pilots on thin film, applied research on crystalline sillicon, and applied research and pilots on concentrator technologies. Inverters and systems engineering were also considered important. Interestingly, for Harvard experts there is a high positive correlation (around 0.9) between the fraction of the budget devoted to demonstration and overnight module cost under the high R&D scenarios, and (not surprisingly) a high negative correlation (around -0.85) between the fraction of the budget devoted to basic plus applied research and cost. This indicates that those experts that think that demonstration needs greater emphasis are also those that are more pessimistic about future costs, perhaps because they do not think that there will be more radical breakthroughs.
Table 18 shows comparable information for the FEEM surveys. Interestingly, R&D investments for CSP in the FEEM survey were allocated at around a quarter of the total budget, especially for applied research and demonstration. Investments in thin-film PV and crystallinesi were targeting mostly applied research. Conversely, organic and third generation PV are considered less mature and still in need of significant investments in basic research.
Table 17: Average allocation of recommended annual US federal solar PV RD&D budget from 2010-2030 (Percentage of total budget)
Cry
sta
lline S
i
Thin
film
Concentr
ato
r
Excito
nic
Novel h
igh-e
ffic
iency
Invert
er
Syste
ms e
ngin
eering
Oth
er
Basic Research 2.4% 5.1% 3.6% 3.2% 6.6% 2.8% 1.4% 2.2%
Applied Research 5.5% 6.1% 5.4% 2.2% 5.6% 4.8% 4.4% 3.0%
Experiments and
Pilots2.5% 4.3% 5.1% 1.3% 2.5% 3.4% 3.5% 2.2%
Commercial
Demonstration0.5% 1.4% 3.5% 0.6% 1.1% 1.3% 1.5% 1.5%
Total
10.9% 16.9% 17.6% 7.3% 15.8% 12.3% 10.8% 8.9%
Source: Anadón, Bunn, et al. 2011.

The Future of Energy Technologies: An Overview of Expert Elicitations
47
Table 18: Average allocation of recommended annual EU solar technologies RD&D budget from 2010-2030 (Percentage of total budget)
Cry
sta
lline-S
i
Thin
-film
PV
Concentr
ating P
V
Org
anic
PV
Third g
enera
tion P
V
CS
P
Basic
Research4.1% 3.0% 2.2% 8.0% 8.8% 4.7%
Applied
Research10.3% 11.8% 4.8% 4.0% 1.6% 11.8%
Demonstration 5.2% 5.9% 2.7% 1.3% 1.6% 8.3%
Total
19.6% 20.7% 9.7% 13.3% 12.0% 24.8%
Specific solar technologies
Source: Bosetti et al. 2012.
3.3.5 Light duty vehicles government RD&D experts suggested allocation
In the Harvard vehicles survey, experts emphasized the need to devote significant amounts of RD&D funds to basic research in novel energy storage concepts for light duty vehicles (Table 19). Basic and applied research in Li-ion batteries, applied research in materials and in electronic controls were also emphasized. The other category, which was also significant, included extending electric ranges and developing HEVs capable of running on ethanol, gasoline or methanol, for example.
In the FEEM surveys, experts recommended that about one fourth of the R&D budget be spent on Li-ion batteries, and especially on applied research and demonstration. Among the other technologies, lithium-air (Li-air) stands out as the one with the lowest perceived level of development, which would require a significant amount of basic R&D investments (Table 20).

GGKP Working Paper 01|2016
48
Source: Anadón, Bunn, et al. 2011.
Table 20: Average allocation of recommended annual EU EDV storage energy RD&D budget from 2010-2030 (Percentage of total budget)
Ni-
MH
Li-i
on
Zn-a
ir
Zebr
a
LMP
Li-S
ulph
ur
Li-a
ir
othe
r
Basic Research 2.7% 6.2% 2.3% 1.4% 2.8% 4.4% 9.6% 4.1%
Applied Research 6.4% 11.2% 2.9% 4.1% 4.1% 2.2% 3.9% 2.7%
Experiments and Pilots 5.5% 11.2% 0.6% 3.4% 3.4% 1.6% 1.9% 1.4%
Total
14.6% 28.6% 5.7% 8.9% 10.3% 8.2% 15.3% 8.2%
Battery Technologies
Source: Catenacci et al. 2013.
Table 19: Average allocation of recommended annual US federal vehicle energy RD&D budget from 2010-2030 (Percentage of total budget)
Cross-Cutting Technologies Hydrogen and Fuel Cells Others
Li-io
n b
atteries
Ni-M
eta
l batteries
Oth
er
conventional
batteries
Ultra
capacitors
Novel concepts
of
energ
y s
tora
ge
Better
manufa
ctu
ring
pro
cess
Mate
rials
Advanced e
ngin
es for
novel fu
els
Ele
ctr
onic
ontr
ols
Solid
-oxid
e, alk
alin
e,
poly
mer
ele
ct.
Mate
rials
for
fuel cells
Hydro
gen s
tora
ge
tech
Oth
er
Basic Research 5.1% 0.6% 0.0% 1.8% 8.9% 3.9% 2.6% 0.9% 1.2% 2.3% 3.4% 3.1% 3.8%
Applied Research 5.3% 0.3% 0.0% 3.6% 3.2% 3.2% 5.7% 0.9% 3.6% 2.1% 1.6% 3.4% 3.7%
Experiments and
Pilots2.7% 0.2% 0.0% 2.4% 0.8% 1.8% 3.3% 0.3% 2.3% 0.7% 0.4% 0.9% 3.6%
Commercial
Demonstration1.9% 0.1% 0.0% 0.6% 0.2% 0.3% 0.8% 0.0% 0.3% 0.4% 0.4% 0.3% 1.0%
Total
15.0% 1.2% 0.0% 8.4% 13.1% 9.2% 12.4% 2.1% 7.4% 5.5% 5.8% 7.7% 12.1%
Battery and Other Energy Storage Technologies
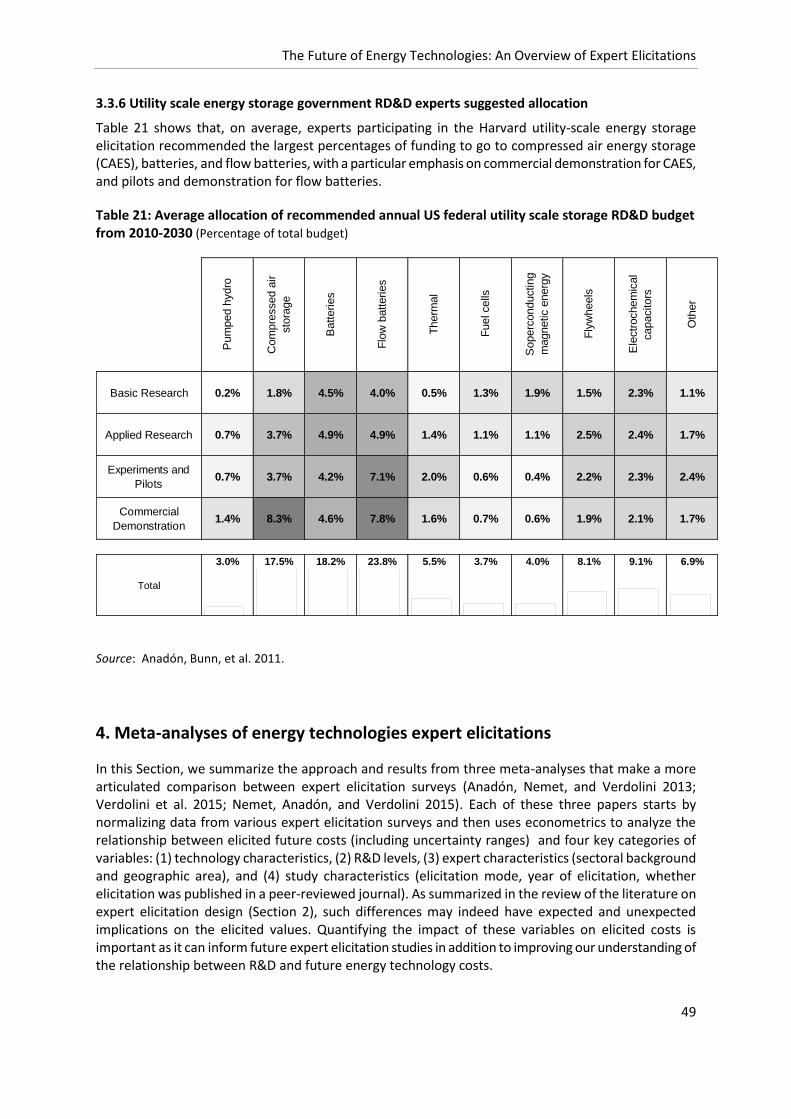
The Future of Energy Technologies: An Overview of Expert Elicitations
49
3.3.6 Utility scale energy storage government RD&D experts suggested allocation
Table 21 shows that, on average, experts participating in the Harvard utility-scale energy storage elicitation recommended the largest percentages of funding to go to compressed air energy storage (CAES), batteries, and flow batteries, with a particular emphasis on commercial demonstration for CAES, and pilots and demonstration for flow batteries.
Table 21: Average allocation of recommended annual US federal utility scale storage RD&D budget from 2010-2030 (Percentage of total budget)
Pum
ped h
ydro
Com
pre
ssed a
ir
sto
rage
Batteries
Flo
w b
atteries
Therm
al
Fuel cells
Soperc
onducting
magnetic e
nerg
y
Fly
wheels
Ele
ctr
ochem
ical
capacitors
Oth
er
Basic Research 0.2% 1.8% 4.5% 4.0% 0.5% 1.3% 1.9% 1.5% 2.3% 1.1%
Applied Research 0.7% 3.7% 4.9% 4.9% 1.4% 1.1% 1.1% 2.5% 2.4% 1.7%
Experiments and
Pilots0.7% 3.7% 4.2% 7.1% 2.0% 0.6% 0.4% 2.2% 2.3% 2.4%
Commercial
Demonstration1.4% 8.3% 4.6% 7.8% 1.6% 0.7% 0.6% 1.9% 2.1% 1.7%
Total
3.0% 17.5% 18.2% 23.8% 5.5% 3.7% 4.0% 8.1% 9.1% 6.9%
Source: Anadón, Bunn, et al. 2011.
4. Meta-analyses of energy technologies expert elicitations
In this Section, we summarize the approach and results from three meta-analyses that make a more articulated comparison between expert elicitation surveys (Anadón, Nemet, and Verdolini 2013; Verdolini et al. 2015; Nemet, Anadón, and Verdolini 2015). Each of these three papers starts by normalizing data from various expert elicitation surveys and then uses econometrics to analyze the relationship between elicited future costs (including uncertainty ranges) and four key categories of variables: (1) technology characteristics, (2) R&D levels, (3) expert characteristics (sectoral background and geographic area), and (4) study characteristics (elicitation mode, year of elicitation, whether elicitation was published in a peer-reviewed journal). As summarized in the review of the literature on expert elicitation design (Section 2), such differences may indeed have expected and unexpected implications on the elicited values. Quantifying the impact of these variables on elicited costs is important as it can inform future expert elicitation studies in addition to improving our understanding of the relationship between R&D and future energy technology costs.
GGKP Working Paper 01|2016
50
In the what follows, we briefly discuss the purpose of meta-analysis in this context. In Section 4.2 we provide a brief overview of the three papers. In Section 4.3 we describe the dependent variables that are the objective of the comparison, the explanatory variables investigated, and the process employed by the three studies to make the elicited values comparable. In Section 4.4 we summarize their insights in terms of median costs, the possibility of breakthroughs and the range of uncertainty. When appropriate, we indicate if specific results are only applicable to one technology area or hold across the five energy technologies covered by the meta-analysis papers (for details on the standardization process, see Anadón, Nemet, and Verdolini 2013; Verdolini et al. 2015; Nemet, Anadón, and Verdolini 2015; Baker, Bosetti, Anadón, et al. 2015; Anadón et al. 2015 and Appendix C of this document) Section 4.5 concludes with key findings.
4.1 Purpose of and motivation for meta-analyses
Despite the increasing use of expert elicitations in science policy contexts, analysts and policymakers have few tools with which to compare the results emerging from different studies. A key question in this respect is whether differences in results between different expert elicitations are driven by protocol design, expert characteristics, or the set of available information at different times and locations. For instance, the expert elicitations listed in Table 2 vary considerably in terms of protocol design (i.e., in metrics collected, year for which the estimate is made, methods for administering the surveys), of the background and geographic area of the experts consulted (Section 2), and of the sub-technology considered. Moreover, different studies confront experts with different assumptions about R&D scenarios (Section 3). Hence, a simple juxtaposition of elicited cost estimates may convey misleading insights, since it does not take into account that study-specific characteristics that might be affecting cost estimates. Even a visual inspection breaking down standardized values into binary categories based on the geographic area of the experts may, for example, hide significant or insignificant effects.
Anadón, Nemet, and Verdolini (2013), Verdolini et al. (2015) and Nemet, Anadón, and Verdolini (2015) use a meta-analytic approach to shed light on whether elicited values are consistently affected by both observed and unobserved characteristics. In the absence of randomized trials testing separately the impact of (for example) an elicitation mode – keeping everything else constant – the meta-analysis approach used by this set of papers gets us closer to isolating the impact of various factors. Using available data, the authors conduct a statistical analysis that shows whether expert or survey observable characteristics, and assumptions about technology granularity and R&D levels, impact elicited values in a statistically significant way while holding all other characteristics fixed.
4.2 Description of energy elicitation meta-analysis studies
We briefly describe the three meta-analysis papers below. The first looks at various nuclear surveys, the second at various solar surveys and the last one pulls together multiple surveys on multiple technologies.
Anadón, Nemet, and Verdolini (2013) focus on future overnight capital costs of the FEEM, Harvard and CMU nuclear expert elicitations. The FEEM and Harvard studies are virtually the same (with the exception of the contents of the background information) in elicitation design and method (both were conducted online). They both include a heterogeneous group of experts in terms of affiliation (industry, academia, public) and nationalities (EU and US), and focus on three classes of nuclear technologies (large-scale Gen III/III+ systems, large-scale Gen. IV systems, or small modular reactors including both Gen. III/II+ and Gen. IV designs). Each expert in the survey is confronted with various RD&D scenarios (see Appendix C). Conversely, the CMU elicitation was administered in-person, but only includes data for large scale Gen. III/III+ systems consistent with a business-as-usual US public RD&D funding scenario. The variation in expert and technologies within and across studies allows exploring the extent to which expert background and geography affect experts’ beliefs about the future of nuclear power and about

The Future of Energy Technologies: An Overview of Expert Elicitations
51
the expected returns to public RD&D measured by decreases in overnight capital cost. Some very preliminary results on whether or not in-person elicitations are associated with statistically significant differences in costs are explored.
Verdolini et al. (2015) harmonize all solar expert elicitations presented in this report (i.e., FEEM, Harvard, UMass, Near Zero and CMU) to the common metric of levelized cost of electricity (LCOE). The choice of LCOE was dictated by the fact that most surveys collected cost estimates on technology components (e.g., at least module costs), while the FEEM survey asked experts to provide LCOE estimates given specific assumptions about insolation rates and discount rates. Using these FEEM assumptions for consistency, Verdolini et al. (2015) generated LCOE estimates from the other surveys. The variation in expert, technology and survey characteristics across solar elicitation studies was significant, and higher than in the case of nuclear (the Harvard and Near Zero surveys were conducted online, while the other three surveys were conducted in- person). As shown in Table 2, the CMU, FEEM, Harvard and UMass surveys asked experts to provide estimates for specific R&D levels and Near Zero asked experts about the costs under different levels of solar panel deployment. All elicitations but UMass elicited cost percentiles (P10, P50, and P90) for these different scenarios, while UMass asked about the probability of various technical and cost parameters being achieved.
Finally, Nemet, Anadón, and Verdolini (2015) harmonize all solar, nuclear, biofuels, bioelectricity and coal with CCS elicitation data presented in Table 2 through Table 6 (except for the Chung et al. study) into a common unit of $/MWh. As explained in Section 2.3, in the case of solar and bioelectricity, this $/MWh metric represents the levelized cost of electricity. In the case of biofuels, the metric represents the levelized cost of fuel production. In the cases of nuclear and CCS, the authors calculate a partial levelized cost (for nuclear the levelized capital cost, and for CCS the levelized additional capital cost over a coal facility without CCS). For bioelectricity and biofuels, the metric stands for levelized non-energy cost of electricity and levelized non-energy production cost, respectively. Nemet, Anadón, and Verdolini (2015) explore the effect of expert and study characteristics on a measure of uncertainty around the elicited costs and on the costs under a breakthrough technology development outcome (measured by P10).
4.3 Dependent and independent variables in the meta-analysis studies
4.3.1. Dependent variables
By comparing standardized metrics, it is possible to exploit variation between and within elicitation studies to explore the role of observed and unobserved characteristics on elicited cost estimates. Anadón, Nemet, and Verdolini (2013), Verdolini et al. (2015) and Nemet, Anadón, and Verdolini (2015) investigate two sets of metrics of interest. The first includes three key percentiles: the 50th percentile or central estimate (P50) provided by experts, which represents the median expected future costs; the 10th percentile cost estimate (P10), which can be interpreted as the value of elicited costs associated with something close to a “best-case scenario”, or breakthrough technology development (Nemet, Anadón, and Verdolini 2015); and the 90th percentile cost estimate (P90), which is the highest cost estimate elicited in many of the probabilistic expert elicitations and can be thought of as being close to the “worst case scenario” in terms of future technology performance. The second metric of interest is a measure of the range of uncertainty. Specifically, all three meta-analysis studies focus on the experts’ “normalized” uncertainty range around future costs. This is defined as the difference between the 10th and 90th percentile of each expert’s estimate divided by their median (P50): Urange = (P90-P10)/P50. Note that since the standardized cost metrics vary by technology (LCOE for solar and bioelectricity, the levelized cost of fuel production for biofuels, levelized capital cost for nuclear and levelized additional capital cost for CCS, as explained in the previous section), cost estimates (P10, P50 and P90) cannot be
GGKP Working Paper 01|2016
52
compared across technologies, but only between sub-technologies. Conversely, the uncertainty range provides a normalized metric, which can also be analyzed for all technologies together.
4.3.2. Independent variables
As discussed above and in Section 2.1, experts’ cost estimates may vary due to a range of differences in study and expert characteristics. The three meta-analysis papers described here complement the standardization process with regression analysis to understand whether and how elicited costs vary with changes in survey design, expert background, sub-technologies or assumptions about R&D investments. The meta-analytic approach allows achieving two goals. The first is to explore whether survey characteristics, expert characteristics and variations in RD&D budgets are associated with statistically significant differences in the elicited standardized metrics. The second is to investigate the relationship between RD&D level and technology costs (and uncertainty). To perform such statistical analyses, the authors collect information on four categories of variables which are likely to impact elicited costs, namely:
(1) the type of technology and sub-technology considered, i.e., whether the nuclear survey looked at Small Modular Reactors or large scale Gen. II/II+ or Gen. IV reactors; whether the solar survey looked at a generic PV technology, or specifically at novel PV, thin-film or concentrating PV, and its market segment (i.e., whether the solar survey considered residential, commercial or utility scale solar systems) (see Table 5 and Table 6);
(2) R&D levels on which the elicited values are conditioned, i.e., either continuous R&D levels, or bins indicating low, medium or high investment (see Appendix C to the present document);
(3) experts’ characteristics, which include background of the expert (industry, academia, public) and geographic location of the expert (EU vs US) (see Table 3 through Table 7 for a summary of information about experts); and
(4) study characteristics, specifically whether the survey was administered in-person, whether results were published in the peer-reviewed literature, and the year when the estimate was collected (see Table 3 through Table 7 for a summary of information about the different studies).
The four categories of variables listed above may affect elicited costs for different reasons. For instance, the data presented in Section 2 and Appendix A of this document show that the range of estimates is significantly different both across and within technologies. That both the level of elicited costs and the cost-reducing potential of R&D investment differ between different technologies (e.g., solar versus nuclear) is not surprising. However, even within a given technology (e.g., nuclear), cost estimates may systematically vary depending on the sub-technology under consideration (e.g., large-scale Gen III/III+, large-scale Gen. IV, or small modular reactors) due to different levels of maturity, complexity, potential for cost reduction, the extent to which learning-by-doing has improved costs in the past, and the physical limits to the performance of each technological path. Uncertainty ranges can also vary across the different technologies (e.g., nuclear) and sub-technologies (e.g., large scale Gen. III/III+, large scale Gen. IV, or small modular reactors) considered. Within the same sub-technology, the specific market in which the technology competes (residential, commercial, utility) may also affect experts’ judgments. For instance, electricity from solar PV generally competes with electricity produced by other sources, sometimes known as “grid” electricity. But the price of grid electricity varies considerably depending on who is buying it, whether retail, commercial or wholesale customers. Similarly, the scale of production, and thus costs, can differ considerably whether at the single-digit kilowatt scale of residences, tens of kilowatts for commercial installations and even thousands of kilowatts for utility scale. While differences of elicited costs within technologies and across technologies and market segments are not

The Future of Energy Technologies: An Overview of Expert Elicitations
53
unexpected, the three meta-analysis papers represent the first attempt at quantifying such differences in a ceteris paribus (all else equal) approach.
The choice of R&D levels, on which the elicited values are conditional, is also expected to affect elicited costs. In fact, quantifying this impact is one of the motivations of some of the expert elicitation studies. The underlying assumption is that as R&D increases, future costs will be reduced. Keeping this in mind, comparing elicited values across surveys which confront experts with different R&D scenarios is not straightforward. In a given survey, elicited costs in 2030 may be lower not simply because the expert is confronted with a much higher R&D investment scenario, but also because of the characteristics of the expert consulted or the design of the survey. Cost estimates from different surveys and different R&D scenarios should hence be compared conditional on (i.e., controlling for) other factors. R&D investment assumptions could also affect expert confidence (uncertainty range), but the size or direction of this effect is not clear a priori. While one could expect more RD&D to reduce uncertainty, it is also possible that by opening more possibilities the uncertainty range will increase.
To explore the role of R&D investment on elicited costs, the three studies collect information about the exact amount of R&D investments on which the cost estimates are conditional. In addition, they code R&D levels in bins indicating low, medium and high investments. The details on R&D levels of the different studies’ bins are included Appendix C. This coding process was carried out for two reasons. First, some studies characterized R&D scenarios with precise dollar amounts, while others did not do so explicitly but assumed business-as-usual high/low R&D scenarios. Second, while dollar amounts can be easily compared across studies, they also can be misleading. In fact, as argued by Kahneman (2011), people typically rely on heuristics when making estimates. Even though each study provided experts with detailed background information on historical levels of public R&D, experts still may find some difficulty in thinking about specific investment levels, and instead may use these levels to think about the outcomes of worst-case and best-case investment scenarios. If the latter, then the exact R&D investment levels would not necessarily reflect the effects of the full range of R&D. Hence, a categorical definition of R&D investments could be a closer representation of the experts’ thinking than the actual R&D levels they are faced with. Thus, the meta-analysis studies evaluated both continuous and binned R&D variables.
Expert characteristics may affect the elicited costs due to differences in availability heuristics between experts of different professional backgrounds or geographical areas. The literature on heuristics suggests the need to consider the possibility that experts in different technology areas, sectors or regions may have different experiences, which may lead them to make different estimates (see Section 2).
Finally, study design may also affect results. For instance, in-person elicitations may allow more interaction and debiasing of the expert with respect to online elicitations (see Section 2).
4.4 Results
In this section, we summarize the results from the three studies for three key variables of interest: median costs, breakthroughs costs (as represented by the 10th percentile), and the range of uncertainty reported by experts. We focus on the main variables of interest, and on those for which estimates are comparable across the different meta-analyses. For instance, the year in which the estimate was elicited was not included in Anadón, Nemet, and Verdolini (2013), but it was found to be insignificant in Verdolini et al. (2015).
4.4.1. Summary of results on the median impact of R&D
Results of the three meta-analysis studies for P50 show that (1) higher R&D investments are (as expected) associated with lower future P50 cost estimates (but the cost-reducing potential of R&D varies

GGKP Working Paper 01|2016
54
by technology); (2) ignoring expert background and survey mode can lead to biased average estimates of the relationship between R&D and costs; (3) a particular expert background (e.g., whether someone is in academia or private) is often associated with different estimates, either more pessimistic or optimistic depending on the technology; and (4) for certain technologies geographic location is associated with statistically significant differences in cost estimates.
R&D levels: Using a simple model where P50 is a function of the continuous R&D investment levels, Anadón, Nemet, and Verdolini (2013) show that on average a doubling of yearly public energy RD&D in nuclear technologies (i.e., a 100% increase) is associated on average with a 7% decrease in the best estimate (P50) of 2030 overnight capital costs. Focusing on the categorical R&D levels (low, medium and high investments), high public RD&D investments are associated with P50 nuclear capital costs that are on average approximately 21% lower than the “low” public R&D investment scenario. Adding expert background, survey design and sub-technology variables as control variables significantly improves the fit of the model and increases the coefficient associated with the continuous R&D variables by roughly 25%. This result suggests that the implied returns to R&D are somewhat higher than in the model with no covariates – a doubling of public R&D yearly budget for nuclear technologies would give rise to an 8% decrease of nuclear costs in 2030, on average and ceteris paribus. Finally, the authors find some evidence of diminishing marginal returns to R&D investment, namely of a higher impact of additional R&D investment at lower budget levels. This is, however, not a strong result and only emerges in a statistically significant way in a subset of models.
Focusing on solar technologies, Verdolini et al. (2015) confirm that the relationship between R&D investment and median cost estimates is negative and statistically significant – the higher the R&D investment, the lower the solar (LCOE) cost estimates. Compared to the low R&D scenario, the medium R&D scenario is associated with solar costs that are roughly 20% lower. Conversely, the high RD&D scenario is associated with solar costs that are roughly 35% lower than the low R&D scenario. This seems to suggest that R&D investment may be associated with diminishing marginal returns, as increasing R&D funding from low to mid has a greater impact on costs than increasing R&D funding from mid to high. Using the continuous R&D variable, the authors show that a 100% increase in investment is expected to lower expected cost by 14%, but, as in the nuclear paper, find no robust evidence of diminishing marginal returns.
Nemet, Anadón, and Verdolini (2015) present similar negative and statistically significant results of R&D on P50 for all five energy technologies in the Supplementary Information to the paper. Most importantly, they suggest that average expert expectations about the impact of R&D vary by technology. Going from a low to a high R&D scenario, median costs drop by roughly 4% for solar, 2% for bioenergy and 1% for nuclear and biofuel. Note, however, that this result rests on the use of categorical variables and does not allow a comparison of the impact of one additional dollar (or per cent increase) by technology. However, the authors present additional results for P10 (see below) that further support the conclusion that the impact of R&D investment varies by technology.
Figure 9 shows that, even without controlling for other covariates, higher R&D levels for a specific sub-technology (in this case biomass-based gasoline-substitutes) are associated with more optimistic P50 estimates.
Figure 9: Standardized elicited P50 levelized non-energy biofuel cost for the five biofuel elicitations
under the low, mid and high R&D scenarios

The Future of Energy Technologies: An Overview of Expert Elicitations
55
Expert background and geographic location: Anadón, Nemet, and Verdolini (2013) show that expert background and geographic location are associated with statistically significant differences in future nuclear cost estimates. In the preferred model (with all covariates) public sector and industry experts’ costs expectations are 14% and 32% higher, respectively than academics. Experts in the US are more optimistic than their EU counterparts: median expected costs are, on average, 22% lower. The results emerging from the solar meta-analysis are somewhat different (Verdolini et al. 2015). Specifically, they do not point to a difference between the elicited costs of experts from different backgrounds, suggesting greater consensus among experts on solar technologies. The coefficient associated with the EU dummy variable is also never statistically significant from zero, suggesting that EU experts are not different from their US counterparts regarding expected solar costs.
As discussed in Verdolini et al. (2015), one possible explanation for the differences between the solar and the nuclear results is that in both technologies industry experts are more familiar with recent construction than are public sector and academic experts. In nuclear, industry experience in 2007-2011 would have created a heightened awareness of the recent challenges, delays and escalating costs, whereas in solar, industry experience would have heightened awareness of rapidly falling costs and expanding markets, partly as a result of the greater public acceptance of solar PV. The information available to private experts (on which their perceptions have been conditioned) could be different to that of other experts due to the availability heuristic (Kahneman 2011).
The results presented in Nemet, Anadón, and Verdolini (2015) generally confirm those presented by the other two papers. With respect to nuclear technologies, a comparison of coefficients suggests that academics are associated with the lowest P50 estimates, while industry experts with the highest. In Nemet, Anadón, and Verdolini (2015), however, the precision of the estimates is lower than in Anadón, Nemet, and Verdolini (2013), and the coefficients are below acceptable levels of significance (although not very far from them). This is attributable to differences in sample size between the two studies. The same holds true with respect to the EU dummy variable, which is in line with results presented above but not statistically significant. Finally, Nemet, Anadón, and Verdolini (2015) show that EU experts have more pessimistic expectations about P50 than US experts on bioenergy and that public experts have the lowest estimates on bioenergy and the highest on biofuels.
Elicitation design: For nuclear power, the P50 cost estimates from F2F interviews are not statistically different from those of online surveys, when controlling also for other factors (Anadón, Nemet, and Verdolini 2013). As discussed by the authors, this result needs to be taken with care given that only a very small per cent of the data included in the nuclear meta-analysis was in fact carried out in-person. In contrast, solar power P50 cost estimates of surveys conducted in-person were on average roughly 60% lower than those of online surveys, suggesting that in-person elicitations lead to more optimistic estimates for solar power (Verdolini et al. 2015). This is in line with what is presented in Nemet, Anadón,

GGKP Working Paper 01|2016
56
and Verdolini (2015): in-person elicitations are associated with significantly more optimistic (lower) elicited costs in solar and biofuels for P50 and P10. For each of the five technology areas analyzed, at least one elicitation was in-person and one over the mail or online. Tables 2-6 show what elicitations were conducted in-person versus using other formats, and detail other survey and expert characteristics.
Sub-technologies: Future overnight capital costs are expected to be higher for both Gen. IV and SMR technologies with respect to Gen. III/III+ technologies by approximately 23% and 24%, respectively (Anadón, Nemet, and Verdolini 2013). In Verdolini et al. (2015), thin-film technologies are associated with lower future median costs than all other solar technologies. Moreover, elicited costs are roughly 46 per cent lower for utility scale technologies than for small-scale solar power and 15 percent lower for commercial scale technologies than for small-scale solar power. As described in the paper, the latter difference is in line with the current difference between wholesale and retail power purchase prices at midday when solar would be used.
4.4.2. Summary of results on breakthrough costs
Here we present the results on P10, interpreted as a breakthrough cost estimate. Taken all together, the results of the three meta-analyses studies indicate that R&D has a different impact on P10 for different technology areas, and that expert background and geographic area are associated with statistically significant differences in a few cases. On average, P10 is also lower in surveys that have been conducted in- person.
R&D levels: Verdolini et al. (2015), show that higher R&D investment not only affects the median outcome of future solar LCOE, but also the probability of breakthroughs, as measured by the P10 estimates. Specifically, a medium R&D scenario is associated with elicited costs that are roughly 30 percent lower than a low R&D scenario and high R&D scenario is associated with elicited costs that are roughly 40 percent lower. Nemet, Anadón, and Verdolini (2015) show that this finding is consistent and statistically significant across all technologies considered, with the exception of CCS. The impact of going from a low to a medium R&D scenario is technology specific. This is likely to be due to two main factors. First, each expert may believe that each technology may have different potential for improvement. Second, R&D medium and high investment levels generally differ by technology. Keeping this in mind, results indicate that when going from a low to a medium R&D scenario the expected P10 drops by between 0.7% for nuclear and 3% for solar. Moreover, moving from a mid to a high R&D scenario roughly doubles the impact of R&D on costs. The technology-specific cost reduction potential of R&D investments is further confirmed by specifications that use the continuous R&D variables.
Expert background: Verdolini et al. (2015) present some evidence that EU experts are more optimistic than their US counterparts about the future P10 costs of solar power, as suggested by Figure 10. However, this difference is statistically significant only when using the continuous R&D variable. In this case, the model indicates that the P10 estimates of EU experts are around one third lower. The study suggests that a higher confidence of EU experts in the future breakthroughs of solar technologies could indeed be plausible given the different developments of solar technologies in the EU and the US over recent years. Moreover, the authors argue that such a difference may depend on the fact that EU experts were the only ones who provided estimates for LCOE, as opposed to solar technology components, such as module capital cost and efficiency. Hence, it is possible that the data conversion process introduced differences in expert estimates. Nemet, Anadón, and Verdolini (2015) further show that EU experts are less optimistic than US experts in terms of the best-case technology development scenario (P10) for both biofuel and bioelectricity.
Focusing on expert background, Nemet, Anadón, and Verdolini (2015) show that results are highly technology specific. For instance, private sector experts are the most optimistic with respect to

The Future of Energy Technologies: An Overview of Expert Elicitations
57
breakthrough costs for biofuel technologies, but they are the least optimistic for nuclear technologies. Public experts are the most optimistic for bioenergy and academics are most optimistic for CCS.
Survey design: Verdolini et al. (2015) show that elicitations conducted in-person were associated with more optimistic responses about non-central solar costs estimates (P10 and P90). This also holds true with respect for P10 for biofuels and nuclear, as shown in Nemet, Anadón, and Verdolini (2015).
Figure 10: Standardized elicited P10 levelized nuclear capital cost for the four nuclear elicitations
Note: Grouped by (a) in-person vs. not in-person elicitations; and (b) EU vs. US experts; and (c) academic vs. industry experts .
4.4.3. Summary of results on the range of uncertainty
The uncertainty range (or confidence) is a very important metric to evaluate for two reasons. First, the future of technology is inherently uncertain, and thus policymakers need to make decisions with a full understanding of the extent of this uncertainty. Second, the literature on expert elicitations (see Morgan 2014) shows that experts are typically overconfident – often reporting uncertainty ranges that are too narrow.
The collective results of Nemet, Anadón, and Verdolini (2015) show that, in contrast to P50 and P10, public R&D investments are not statistically significant predictors of the uncertainty range (Urange), with the exception of solar power. That is, higher levels of investments are not systematically associated with narrower or wider uncertainty ranges (or confidence) in the three studies. But expert background, geographic area and survey mode are associated with statistically significant differences in Urange, with academics expressing more uncertainty than industrialists, EU experts expressing less uncertainty than US experts, and in-person surveys resulting in more uncertainty than online or mail surveys. In some areas, sub-technologies are also associated with different uncertainty ranges.
- R&D levels: The nuclear study (Anadón, Nemet, and Verdolini 2013) shows that R&D levels are not associated with statistically significant differences in Urange. In the solar power meta-analysis paper by Verdolini et al. (2015), higher R&D generally has a positive coefficient in the Urange specifications, meaning that the range of uncertainty increases in the higher R&D scenarios. Hence, increasing the level of R&D with which experts are confronted in the elicitation reduces their confidence. This suggests that R&D has an impact on the whole distribution of costs – shifting the distribution of experts’ predictions lower and expanding them. As the authors discuss in the paper, this could be due to a number of reasons. For instance, medium and high R&D scenarios might mean that funding is also devoted to sub-technologies, which are newer and/or riskier, or that higher total investment allows for the inclusion of more of the riskier R&D, resulting in an increase in the uncertainty around future central estimates. An

GGKP Working Paper 01|2016
58
alternative explanation is that experts confronted with significantly different (higher) R&D scenarios from the business-as-usual might have more difficulty in fully projecting costs as the hypothetical funding scenario is very far away from what they ever experienced. The breadth of technological pathways available in high R&D may improve outcomes in the high-cost outcome, thus reducing the Urange. The “all technology” meta-analysis (Nemet, Anadón, and Verdolini 2015) shows that R&D is not significant when pooling results from all technologies, even though the technology-specific regressions confirm the findings for solar (see Verdolini et al. 2015) and show that higher R&D investment scenarios are associated with narrower uncertainty ranges for the case of biofuels.
- Expert selection: The nuclear meta-analysis paper (Anadón, Nemet, and Verdolini 2013) shows that US experts have significantly wider uncertainty ranges when compared to EU experts, approximately 16% larger. This is not the case for solar technologies, where expert background is not associated with statistically significant differences in Urange (see Figure 11). Pooling all technologies, Nemet, Anadón, and Verdolini (2015) find that academic experts generally provide wider uncertainty ranges, while EU experts provide smaller uncertainty ranges, which is consistent with the nuclear results (Anadón, Nemet, and Verdolini 2013). However, once again, results are technology specific. For instance, the negative and statistically significant coefficient associated with EU experts is largely attributable to biofuels. The nuclear specification confirms that US experts are associated with wider uncertainty ranges (see Figure 11), but the precision of the estimate is low and the coefficient is not statistically significant. Finally, the positive coefficient associated with academia in the pooled regression is attributable to the nuclear observations, where both academia and public are associated with positive and statistically significant coefficients. As in the case of P50, the small differences in terms of significance between the nuclear study (Anadón, Nemet, and Verdolini 2013) and the all technologies study (Nemet, Anadón, and Verdolini 2015) are attributable to differences in sample size.
- Survey mode: The all technologies elicitation showed a very robust result of in-person elicitations resulting in larger uncertainty ranges when compared to online or mail elicitations (when controlling for a range of observable characteristics that further differentiate studies). This suggests that current online methods do not prompt experts as much as the presence of an interviewer to report wider uncertainty ranges.
- Sub-technologies: Sub-technologies are associated with different uncertainty ranges. In the nuclear study (Anadón, Nemet, and Verdolini 2013), the uncertainty range for SMRs is around 14% smaller than that for large scale Gen. III/III+, suggesting that experts are relatively confident about their cost estimates on these systems, which are expected to be delivered to the site fully constructed from the manufacturing facilities even though the current experience is limited and no operating licenses have been issued in either the US or the EU. Market characteristics do not have significant effects on uncertainty range.
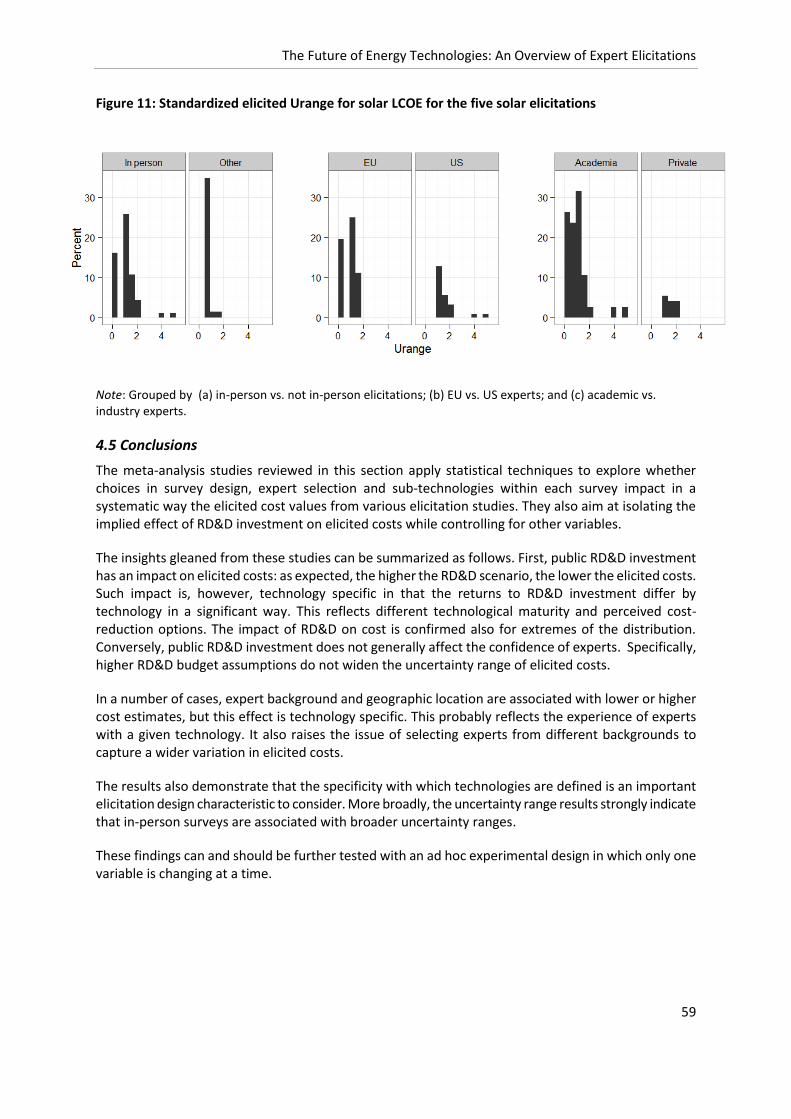
The Future of Energy Technologies: An Overview of Expert Elicitations
59
Figure 11: Standardized elicited Urange for solar LCOE for the five solar elicitations
Note: Grouped by (a) in-person vs. not in-person elicitations; (b) EU vs. US experts; and (c) academic vs. industry experts.
4.5 Conclusions
The meta-analysis studies reviewed in this section apply statistical techniques to explore whether choices in survey design, expert selection and sub-technologies within each survey impact in a systematic way the elicited cost values from various elicitation studies. They also aim at isolating the implied effect of RD&D investment on elicited costs while controlling for other variables.
The insights gleaned from these studies can be summarized as follows. First, public RD&D investment has an impact on elicited costs: as expected, the higher the RD&D scenario, the lower the elicited costs. Such impact is, however, technology specific in that the returns to RD&D investment differ by technology in a significant way. This reflects different technological maturity and perceived cost-reduction options. The impact of RD&D on cost is confirmed also for extremes of the distribution. Conversely, public RD&D investment does not generally affect the confidence of experts. Specifically, higher RD&D budget assumptions do not widen the uncertainty range of elicited costs.
In a number of cases, expert background and geographic location are associated with lower or higher cost estimates, but this effect is technology specific. This probably reflects the experience of experts with a given technology. It also raises the issue of selecting experts from different backgrounds to capture a wider variation in elicited costs.
The results also demonstrate that the specificity with which technologies are defined is an important elicitation design characteristic to consider. More broadly, the uncertainty range results strongly indicate that in-person surveys are associated with broader uncertainty ranges.
These findings can and should be further tested with an ad hoc experimental design in which only one variable is changing at a time.

GGKP Working Paper 01|2016
60
5. Using expert elicitation data to inform policy analysis
This section reviews the work that incorporates expert elicitations data into modelling and decision frameworks. We start by discussing the importance of explicitly including uncertainty into decision frameworks. We go on to discuss different modelling paradigms, with an emphasis on how they are useful to policy decision-makers. We then review examples of the different paradigms that incorporate the elicited data discussed in this report.
While elicited data can be used to calculate means or medians, and can be used in deterministic analysis, its greatest value is that it allows us to explicitly include uncertainty in decision frameworks. Uncertainty is valuable whenever there is non-linearity in a problem, and non-linearity can take different forms. One form that many people are familiar with is risk aversion, namely a preference to avoid risk. A decision maker often prefers to give up some amount of something good (e.g., pleasure or money) in order to avoid some risk. In economic models, risk aversion is represented by a concave (that is, non-linear) utility function (Varian 1992). A second form of non-linearity arises when uncertainty is coupled with learning and the possibility of future options. Often decision makers are faced with the possibility of making decisions in the future after learning about the outcome of uncertainties in the short term. In this case, the best near-term decision could be significantly different from what it would be in a case with no future options. For example, near- term decisions that avoid lock-ins or irreversible effects may be preferred in this case. This was most famously discussed by Dixit and Pindyck (see Dixit and Pindyck 1994). A term that is often used in this regard is “option value.” A near-term alternative has “option value” when it increases the flexibility of a decision maker to react to the outcome of realized uncertainties in the future. Finally, there can simply be non-linearities in the underlying problem itself. In our case, there are non-linearities in the impacts of climate change, in the relationship between R&D investment and outcomes, and in the interactions between technologies. Collectively, these issues make it important to consider the tails of distributions and not just average values. This idea has been characterized by Sam Savage as “the flaw of averages” (Savage 2002), which posits that the best alternative under uncertainty is not necessarily the average of the best alternatives under the range of inputs.
Expert elicitation data can be used in a number of different modelling paradigms to gain different insights (for an overview, see Baker, Olaleye, and Reis 2015).
Most simply, elicitation data can be reduced to a representative number for future technology costs and used to calibrate energy system or climate energy integrated models (we will use the acronym IAMs (integrated assessment models) from now on to refer to both categories) that are commonly used to assess future energy and climate policies or directly to inform policy makers. For example, a modeler might use a mean or median value of future costs. While this is very valuable for the models, and can lead to estimates that are in line with the views of technological experts, this use of the elicitation data does not take advantage of the richness of the probabilistic information collected through the expert elicitations. Here, in order of increasing complexity, we discuss a set of modelling paradigms that take advantage of the richness of the data.
The richer set of probabilistic information collected through elicitations can be used in sensitivity analysis, uncertainty analysis, or models which fully incorporate decision-making under uncertainty .
Elicitation data can be used to inform sensitivity analysis. The range of elicited values can be used to evaluate the extent to which the outputs of a model change with changes in input values. High and low technology values from elicited data can help evaluate projected societal outcomes under extreme assumptions. This has been most typically done by changing one parameter at a time. A recent approach to sensitivity analysis allows all uncertain parameters to change together. Moreover, this method has

The Future of Energy Technologies: An Overview of Expert Elicitations
61
the ability to use the elicited probability distribution for the random draws (Anderson et al. 2014), allowing the sensitivity analysis to focus attention on areas with positive probability. Sensitivity analysis has the benefit of being computationally tractable, and of identifying areas of interest. It is most useful in a descriptive framework and results can easily be presented to final users. It is an important first step to understand robustness of a given strategy or to provide insights on a model to non-experts. It has the weakness, however, of falling prey to the flaw of averages.
Adding a layer of complexity, elicitation data can be used in uncertainty analysis frameworks. By uncertainty analysis we mean analyses that produce probability distributions over the outputs of interest. One prominent example of an uncertainty analysis is the Monte-Carlo type analysis. Here, we use the term “Monte-Carlo type” to include also more sophisticated methods, such as the Latin Hypercube sampling technique (Iman and Conover 1982). In Monte-Carlo type analyses, random draws are taken from an underlying probability distribution (or probability distributions) and used as inputs to a model, often an IAM. This produces a probability distribution over the outputs of interest, such as the cost of a particular stabilization goal, or radiative concentration pathway (RCP), or a specific energy policy. Other methods can also be used to generate such probability distributions (e.g., propagating a probability distribution through a model). Similar to sensitivity analysis, uncertainty analysis is most useful in descriptive frameworks where researchers are interested in understanding what the world might look like in the future. While it provides insights, it does not directly inform near-term decision-making and does not answer certain questions. For instance, it does not answer the question as to what the optimal amount of funding is. This is due to two key limitations of Monte-Carlo type analyses, as discussed in Crost and Traeger (2013). Specifically, (1) each run of the model is deterministic once a draw has been made from the distribution, and (2) optimal short term hedging solutions cannot be calculated. Thus, Monte-Carlo type analyses do not tell us what the best early stage decision is, nor do they give insight into which early stage decisions may have the most option value.
The probability distributions derived from uncertainty analysis, however, can be used as inputs to decision models, providing insights, for example, on how to allocate R&D investments to minimize the probability of a bad outcome, such as a very high carbon price, or to maximize the expected value of good outcome, such as domestic energy production. An approach such as this – using uncertainty analysis to derive probability distributions, which are in turn used in simple decision models – is particularly valuable in cases where there are a number of uncertain variables that must all be considered simultaneously (Chan and Anadón 2015; Anadón, Bunn, and Narayanamurti 2014).
Elicited distributions can also be used in exercises that explicitly model near-term decision-making in the face of uncertainty and apply various criteria to evaluate the impact of these different near-term alternatives. Such models can be divided into single-stage, two-stage and multi-stage models. In a single-stage model, there is a single near-term decision to be taken prior to the realization of an uncertain outcome. The best near-term decision is the one that maximizes the expected utility over the outcomes. In a two-stage model there is a near-term decision, but also a later stage recourse decision that comes after some of the uncertainty has been resolved. Two-stage models have the benefit of identifying near term alternatives that have option value (Dixit and Pindyck 1994). Finally, there are multi-stage models that incorporate a series of downstream decisions. Two methods for implementing multi-stage models are Dynamic Programming (Bellman 1956), with a high dimensionality solution technique, Approximate Dynamic Programming (ADP) gaining considerable traction lately (Powell 2007); and Stochastic Programming (Birge and Louveaux 2011). All multi-stage frameworks face computational challenges due to the “curse of dimensionality.” Stochastic programming problems become quite large with the number of uncertainty outcomes; ADP models become quite large with the number of state variables. It is an open question whether the addition of stages beyond two provides considerable insight (Baker 2006; Webster, Santen, and Parpas 2012).
GGKP Working Paper 01|2016
62
The computational limits of the multi-stage methods, and to some degree even two-stage methods, make it difficult or even impossible to include a significant number of continuous uncertainties simultaneously. Thus, in cases in which uncertainty about several technologies interact in the market it may be necessary to resort to Monte-Carlo methods to understand the impact of these interactions. At the conclusion of this section, we will revisit this issue in light of the specific examples presented below.
In the rest of this section, we review papers that implement the expert elicitation data reviewed in this report into modelling frameworks. We start by looking at work that falls under the categories of sensitivity analysis and uncertainty analysis. This work is descriptive with a focus on understanding the implications of the probability distributions over technological costs and other inputs on the outcomes of IAM. We then go on to review the work that has explicitly included a decision framework in order to suggest insights about the optimal RD&D portfolio. Given the nature of the problem, the following two sections are presented in rather detailed and technical terms. Section 5.3 concludes, summarizing the main insights.
5.1 Technology insights from expert elicitation in modelling frameworks
In this section, we summarize contributions that perform sensitivity analysis and uncertainty analysis, and that do not focus on near-term decisions but rather try to understand connections between inputs and outputs. We discuss the individual studies in order of increasing complexity.
Ricci et al. (2014) perform a simple sensitivity analysis, using the World Induced Technical Change Hybrid (WITCH) model (Bosetti et al. 2006) and best/worst technology development scenarios derived from the CCS elicitation performed jointly by UMass and FEEM to bound the possible future costs and efficiency of CCS technologies. The modelling results indicate that R&D outcomes are likely to dominate incremental demand-side technical change, and that R&D appears to be more efficient than a large, near-term carbon tax.
Barron and McJeon (2015) undertake a sensitivity analysis that is informed by the probability distributions over the parameters. They use a range of technology cost and performance parameters resulting from the TEaM project (including FEEM, UMass, and Harvard surveys in five technology areas harmonized and aggregated.) These parameters are used as an input to the Global Change Assessment Model (GCAM) (Edmonds et al. 2004) to investigate how much a technology would need to improve before it is likely to have a significant effect on the cost of controlling climate change. They find that the capital cost of nuclear has the largest impact on the societal cost of abatement, followed by the costs of biofuels technologies and CCS. The efficiencies of these last two categories, however, played very little role. In addition, they find that the impacts of technologies may vary depending on socioeconomic scenarios.
An important question is how much of the information from the elicitation is key to the results vis-a-vis the other implications embedded in the specific IAMs employed in the analysis. For this reason, Bosetti et al. (2015) perform a multi-model global sensitivity analysis. A global sensitivity analysis considers a large number of parameters simultaneously, rather than one at a time. Specifically, they use the same harmonized and aggregated elicitation data as the paper above, but as input to three different Integrated Assessment Models (GCAM, WITCH and MARKAL-US), and they use covering distributions to regulate the random draws of the parameters. They find that when emissions are unconstrained, assumptions about the cost of nuclear are the most important determinants of societal costs associated with energy production. This result is robust across all three models. Under constrained scenarios (RCP 2.6 and 4.5), in addition to nuclear costs, the costs of biomass technologies gain in importance. Biofuels gain in importance because they provide a key low-carbon alternative in the transportation system, and
The Future of Energy Technologies: An Overview of Expert Elicitations
63
electricity from biomass gains in importance because it can be combined with CCS to produce negative emissions.
Olaleye and Baker (2015) perform both a sensitivity analysis and an uncertainty analysis. They use the UMass elicitation results to do a large-scale scenario analysis using the Dynamic Integrated Climate- Economic (DICE) model (Nordhaus 1994). They run combinations of all the elicited endpoints for six technologies (including biofuels and bioelectricity) through a version of the DICE model that includes uncertainty and learning in climate damages. They look for patterns in the results and find that CCS and bioelectricity are complements, while most of the other energy technology pairs are substitutes. As explained above, the reason that CCS and bioelectricity are complements is that the presence of these two technologies together (often called BECCS) allows for negative emissions. The biomass technology can be carbon neutral, with each new crop absorbing CO2 (the addition of CCS then leads to net negative emissions). This makes very tight stabilization goals much more economic. Their results confirm the importance of nuclear and CCS, given the UMass elicited endpoints. The first part of the paper can be categorized as a kind of sensitivity analysis over technical change. It is quite sophisticated because the researchers do the sensitivity analysis over a stochastic version of a DICE model that explicitly incorporates uncertainty and learning in climate damages. The second part of the paper produces probability distributions over welfare for different R&D portfolios, making it an uncertainty analysis.
Several studies can be considered uncertainty analyses (Baker, Chon, and Keisler 2009a; Baker, Chon, and Keisler 2009b; Baker, Chon, and Keisler 2008a; Baker, Chon, and Keisler 2010). They present the results of expert elicitations, covering nuclear, CCS, solar PV and batteries for vehicles, and then combine those results with a GCAM model to determine the impact of the elicited advancements on the Marginal Abatement Cost curve (MAC). The MAC measures the cost of reducing emissions by an additional tonne of carbon and it is a key determinant of the optimal level of abatement (Weyant 2004; Baker, Clarke, and Shittu 2008). Figure 12 shows how advancements in the different technologies compare in terms of their impact on the MAC curve. The papers, when analyzed together, have a couple of salient results. First, the elicited endpoints for CCS and nuclear have a more significant impact on the MAC for this particular IAM that is larger than that of solar PV and batteries for vehicles. Second, most of the technologies primarily shift the MAC down (i.e., most technologies tend to reduce the MAC by a fixed amount). CCS, however, has a markedly different impact on the MAC: it pivots the curve down, reducing the MAC by a fixed percentage. This means that the non-CCS technologies tend to be better at lower levels of abatement, or lower carbon taxes; CCS tends to have an advantage at very high abatement levels. This set of papers uses deterministic runs of an IAM to derive conditional probability distributions over the impacts of R&D. These distributions can then be used in decision-focused models, providing insight into the impacts of R&D investments.

GGKP Working Paper 01|2016
64
Figure 12: Marginal abatement cost (measured as a percentage of gross domestic product GDP)
Note: Curves of some selected energy scenarios generated by GCAM for the year 2050. Source: Adapted from Olaleye and Baker (2015).
A set of interrelated papers produces probability distributions over the outcomes of R&D investment and other policies, and can be considered uncertainty analyses. Nemet and Baker (2009) use the results of the UMass solar elicitation in a simple model that includes the impacts of both technology RD&D and technology subsidies. They find that, under various assumptions about policy and the cost of grid integration, the outcomes of RD&D generally swamp the incremental technical change coming from subsidies, but that subsides may play an important role in the event that RD&D outcomes are unfavourable. Nemet, Baker, and Jenni (2013) employ the elicitation results in a cost model of CCS and find that the three most mature technologies tend to dominate. More specifically, the minimum cost of capture is determined by one of these technologies in 74% of the cases. On the other hand, there is still a benefit to diversifying further: a full portfolio of CCS technologies doubles the likelihood of achieving a cost target of $60/tCO2 compared to investing in only one technology. Nemet et al. (2015) use these results in a dynamic model comparing RD&D, subsidies and carbon taxes in terms of how much carbon is sequestered by coal CCS. They find that the carbon tax has the largest impact, but that more demonstration plants are needed along with additional research to understand growth constraints and knowledge spillovers.
Some of the results in Anadón, Bunn, et al. (2011) and Anadón, Bunn, and Narayanamurti (2014) can be considered part of an uncertainty analysis. These studies incorporate the Harvard elicitation results in the MARKAL-US model, contingent on RD&D investment. This work included probability distributions of costs and performance over six technology areas: solar PV, advanced vehicles, biofuels and

The Future of Energy Technologies: An Overview of Expert Elicitations
65
bioelectricity, coal and gas (with and without CCS), nuclear technology, and utility-scale energy storage. The researchers break these areas into 25 individual products: three types of solar PV applications, five types of vehicle technologies, three types of biofuel productions, one type of bioelectricity plant, four nuclear technologies, four fossil technologies, and five utility-scale storage technologies. Relying on an additional set of high level experts, researchers selected a pessimistic, a middle-of-the-road, and an optimistic expert for each technology to determine the impact of the differences in expectations about future costs. The study also investigated the impact of demand-side policies, such as cap-and-trade policies and clean-power standards. Results indicate that even the more ambitious public RD&D scenarios will do little to significantly reduce CO2 emissions without complementary demand-side policies. In the absence of any price on carbon, even a 20-fold increase in RD&D will still lead to an increase in emissions between 2010 and 2050 (with about 95% probability, far from the goal of a five-fold reduction). However, the paper concludes that “(t)he median result shows that increasing RD&D funding from the BAU to the expert recommended RD&D scenario with largest investments in all technologies, under a CO2 cap policy, results in an increase in consumer surplus in 2050 of about $35 per dollar invested in energy RD&D.” In addition to the results presented here, this work also incorporates the results of a Monte-Carlo type analysis into a decision model to support R&D portfolio decisions. Thus, it is described in the next section.
5.2 Expert elicitations in decision frameworks
Data from elicitation surveys have also been employed in more complex decision-analysis frameworks to provide insights about optimal policies, typically concerning RD&D investments, but also demand-side policies, such as carbon taxes (see Figure 13). These papers build on the results of both the elicitations and the energy economic models.
We note that almost all of the papers below use a multi-track framework, which employs the IAMs to generate the macro-economic value of different technological outcomes, and then combine these results with a simpler purpose-built decision model.
Figure 13: Representation of the optimal RDD research process
Expert Elicitation
IAM Runs
Optimal RD&D
Decision
Theoretic
Framework

GGKP Working Paper 01|2016
66
Anadón, Bunn, et al. (2011) and Anadón, Bunn, and Narayanamurti (2014), discussed above, also include a decision analysis framework. In this part of their work, the authors use the means of the distributions of selected experts to calibrate a surface-response model to get at the relationship between RD&D and outcome metrics. They use constrained non-linear multivariable optimization to find optimal portfolios, contingent upon policy scenarios. Figure 14 shows an example of their results. The research found that there is significant underinvestment in the current public RD&D budget for utility-scale energy storage, and an indication that RD&D for batteries for vehicles was also underfunded. This last finding surfaced despite the fact that vehicles were expected to have the smallest public-RD&D-induced cost decreases. This result is due to the large number of vehicles available and the general difficulty in reducing emissions from transportation. This illustrates the importance of combining the elicitations about future technological prospects with a model of the economy to estimate the impact on society. Some RD&D investments were found to depend on the policy scenario (e.g., solar PV is important under a cap-and-trade policy scenario and bioenergy is important under a no policy scenario). This work focused on the role of different exogenous policies and used elicitation data to calibrate the model, but it did not explicitly include uncertainty in the analysis.
Figure 14: Fractions of the total RD&D budget
Note: Optimally allocated to technology areas to maximize consumer and produced surplus for a range of total RD&D budget levels for middle-of-the-road experts under a cap-and-trade scenario. Source: Anadón, Bunn, et al. 2011
Chan and Anadón (2015) delve deeper into the methods for optimizing R&D portfolio allocations, using continuous R&D investments and a total of 25 individual technology areas impacted by six technology R&D programs – all covered by the Harvard expert elicitations. The results indicate that (1) while marginal returns to R&D investment decrease, a 10-fold expansion from 2012 levels in the R&D budget for utility-scale energy storage, bioenergy, advanced vehicles, fossil energy, nuclear energy, and solar photovoltaic technologies can be justified by expected returns to economic surplus; (2) the greatest economic returns to public R&D investment are in energy storage, solar photovoltaics, and bioenergy;

The Future of Energy Technologies: An Overview of Expert Elicitations
67
and (3) the 2012 US R&D budget allocation was very different from the optimal allocation to maximize consumer and producer surplus.
The next set of three papers uses stochastic programming in two-stage models to explicitly include the impact of uncertainty and learning on the optimal portfolio. Each of these papers uses the aggregated probability distributions derived from the UMass elicitations, and each uses GCAM to derive economic benefits. Baker and Solak (2011) combine economics and decision analysis, and use elicitation data to inform RD&D policy in response to global climate change. They use the Baker data on solar, CCS, and nuclear, and the MAC curves resulting from GCAM. They calibrate a reduced-form RD&D stochastic programming portfolio model using the DICE model, and implement the stochastic MACs in that model. The researchers explore how the optimal investment in RD&D changes with increases in the risk of climate damages, where “risk” is defined as a mean-preserving spread in damages. They find that, given a budget constraint, the composition of the optimal RD&D portfolio is robust to climate related risk. This is because the elicitation data imply that the individual projects are fairly differentiated, with some having a low cost, high probability of success, and a large impact if successful, while others do not. That is, there are not very many projects that are on the “knife’s edge”, so assumptions about the riskiness of climate damages do not have much impact. The overall optimal investment in technical change, however, does depend on the risk in climate damages, first increasing as the risk increases, then decreasing. This result relates to the role that technical change plays in combatting climate change. The value of technical change is that it reduces the cost of abatement. As damages move from low to medium, abatement increases, but once abatement reaches 100% at about the medium level, it does not increase further, regardless of the damages. Thus, once damages are at about the medium level, the impact of technical change is maxed out. The researchers also look at mean-preserving-spreads that stretch the distribution out and find that as larger and larger catastrophes are considered, their probability gets lower and lower. This combination means that technical change has only a small likelihood of a fixed impact in high risk cases, lowering its value.
Baker and Solak (2014) build on these results, implementing the stochastic MAC curves into a stochastic programming version of the DICE model, and investigating how the optimal RD&D portfolio changes with changes in risk and also with changes in the policy environment. They consider the optimal policy in DICE (“DICE optimal”), a policy based on the Stern report, a policy based on Al Gore’s suggestions, and a policy aimed at constraining temperatures to two degrees. Similar to the above paper, they find the optimal portfolio is quite robust across the policy environments, risk cases and assumptions about opportunity cost. That is, investments in a robust set of technologies will produce a positive payoff whether climate change policy is “go-slow” or more aggressive. Under a lenient climate policy, and in the absence of technological change (similar to a Nordhaus policy), a breakthrough in energy technology tends to significantly increase the amount of abatement, thus improving the environmental outcomes. On the other hand, in a policy where emission reductions are high (such as Stern or Gore) a breakthrough in technology tends to significantly reduce the cost of emissions reductions. This is illustrated in Figure 15. Technological change plays a different but important role in both policy environments.

GGKP Working Paper 01|2016
68
Figure 15: Range of temperature paths and range of total abatement costs for the DICE optimal and Stern policies
Note: The lines range from the 10th to the 90th percentiles and the marker in between represents the 50th percentile.The left-hand side panel shows the sensitivity of temperatures in the DICE optimal policy to technology; the right-hand side panel shows the sensitivity of costs in the Stern policy to technology. Source: Baker and Solak (2014).
McJeon (2012) uses data on CCS, solar and nuclear, along with modelling results from GCAM, in a stochastic dynamic programming model aimed at providing insights into the timing of RD&D investments. In this model, investments can be made either now or in a later stage, when information on the success of earlier investments is available. Results indicate that, given a total RD&D budget constraint, about 60-70% of this budget would be spent in the first period, while 30-40% is reserved for the second stage. He finds that generally the rank ordering of technologies does not change much when comparing a one-stage and two-stage model. There is, however, a slight impact in that highly substitutable programs, such as multiple programs in the same technology category (e.g., solar PV), tend to be diversified across time. Thus, in a one-stage model it may be optimal to invest in all CCS programs before solar programs, but in the two-stage model it may be optimal to invest in at least one solar program in the first stage and wait for at least one CCS program.
Barron, Djimadoumbaye, and Baker (2014) produce results that are similar to the above three papers, but use a simple two-stage decision tree, which is solved using a genetic algorithm. They use the results of the solar, CCS and nuclear elicitations from UMass to explore the importance of assumptions about grid integration when it comes to RD&D policy. Since solar is intermittent and non-dispatchable, it presents some challenges to integrate with the electricity grid. These challenges are on short-term timescales, ranging from minutes, to hours, to seasons. On the other hand, most IAMs are on much longer timescales, with time steps every 5-10 years. This makes it a challenge to model grid integration issues in IAMs. Thus, these models often use broad simplifications to mimic issues like grid integration and intermittency. The paper considered the optimal RD&D portfolio among solar, CCS and nuclear under two assumptions about grid integration: (1) the standard assumption of costly grid integration in the GCAM model; and (2) no-cost grid integration. Using results from GCAM and implementing them in simple optimization models, they find that the importance of grid integration depends on the decision framework. If the decision is how to allocate a fixed budget of RD&D, then the grid integration assumptions have very little impact on the optimal portfolio. If the decision is how much total dollars to spend on RD&D, then the assumptions have a stronger impact, typically leading to larger overall expenditures on solar when grid integration costs are assumed away. The message is that the
The Future of Energy Technologies: An Overview of Expert Elicitations
69
importance of more precise information and modelling of grid integration depends on the problem at hand.
In an overview paper, Baker, Olaleye, and Reis (2015) employ the cost distributions from the expert surveys done by FEEM, Harvard and UMass elicitations, plus the overall aggregated distributions, for five technologies in a study that compares across decision frameworks. They use a decision-tree framework to explicitly incorporate uncertainty about technologies and climate damages, and compare a one-stage model with a two-stage model. The paper provides a brief overview of decision frameworks aimed at incorporating uncertainty. It then provides an extended numerical example that compares (1) across four decision frameworks and (2) four elicitation results – one for each individual team and one for the aggregated results. They consider two traditional Bayesian frameworks (a one-stage and a two-stage) and two frameworks that incorporate ambiguity aversion (both one-stage). In all frameworks, the key near-term decision is over the RD&D investment portfolio. The investment portfolio determines the probability distribution over the outcomes of RD&D. Results from the GCAM model are used to calculate the cost of abatement, given a stabilization scenario (more precisely a Radiative Concentration Pathway, RCP) and the temperature path. In the traditional frameworks, the objective is to minimize three costs: the cost of RD&D plus the cost of abatement plus the cost of climate damages. The ambiguity-averse frameworks use Maximin and MiniMax regret objectives. The one-stage framework is solved for three different emissions targets of increasing stringency. In the two-stage framework the emission target is chosen after the outcomes of RD&D are realized.
They find that it is not enough to look only at the prospects for technological change, or only at the importance of a technology in the economy. Some technologies have great prospects to improve, but the interactions in the economy with the other technologies may not make it a good investment. On the other hand, some technologies may be very important in the economy, and yet the prospects for technological change in comparison to other technologies may make it less interesting. Another important result is that there is value in RD&D even in the absence of any climate policy. The models showed significant investment in some of the technologies even when emissions were unconstrained, particularly when damages were higher. This implies that policymakers do not need to wait for a worldwide agreement on reducing emissions to move forward with RD&D investments.
Similar to McJeon (2012), Baker, Olaleye, and Reis (2015) allows for the comparison of results between a one-stage model and a two-stage model. They find that some technologies have more “option value” than other technologies. That is, some technologies increase the flexibility to move to different emissions pathways in the future. In particular, they find that nuclear has more option value than biofuels. Thus, in a world where the stabilization goal may depend on the technologies available, near term investments in nuclear preserve more flexibility than investments in biofuels.
Finally, they consider two non-Bayesian ambiguity averse frameworks. They find that these frameworks, both of which model maximum ambiguity-aversion, result in very different optimal portfolios. The MaxiMin avoids ambiguity by reducing investments in the technologies with the most disagreement across teams. The MiniMax regret decision rule avoids ambiguity and results in an increase investment into the technologies that have the most potential. Overall, they conclude that frameworks such as these may be best used to indicate where more research into the prospects for the technologies is most valuable (i.e. where there is the most disagreement).
Santen and Anadón (2014) and Santen and Anadón (2016) use a purpose-built model for both an economic value and decision analysis. They focus on one technology, but include multiple stages of uncertainty and learning. They use the emerging method of Approximate Dynamic Programming to solve their model. They present a new comprehensive framework for studying the socially optimal level of generating capacity and public RD&D investments in the electricity sector under decision-dependent

GGKP Working Paper 01|2016
70
RD&D uncertainty and learning. This paper constructs a bottom-up stochastic electricity generation capacity expansion model with uncertain endogenous RD&D-based technical change, focusing on the solar PV RD&D elicitation data from Harvard. The problem is formulated as a four-stage decision under uncertainty problem, representing the opportunities for policymakers to learn and adapt to new information between decision stages. The value of the model is demonstrated by showing that when uncertainty and learning features are omitted, as is often done in practice, the deployment versus development investment strategy can be considerably different from the optimal solution. Similar to the work above, Santen and Anadón show that under a carbon constraint the optimal investment strategy includes lower solar PV RD&D spending upfront and more RD&D spending later ( sometimes higher spending overall) when compared to a strategy under perfect foresight about RD&D outcomes, or based on single-shot decision-making under uncertainty without learning. The paper also shows that when uncertainty is considered without learning, new solar PV capacity investments are depressed. Overall, the paper shows that it is possible to unify several realistic features of the deployment and development problem into one framework, using continuous RD&D levels and probability distributions.
Marangoni, de Maere, and Bosetti (2015) also employ an Approximate Dynamic Programming, using FEEM expert elicitations and the WITCH model to determine the welfare associated with different technology costs combination. The main result is that investment in batteries dominates the RD&D portfolio. The use of batteries in the transportation sector means that the benefits of lower costs of batteries are large, which more than compensates for the fact that probability of success is lower than in other technologies.
5.3 Summary
Given informational constraints and the different strengths and weaknesses of the various paradigms, there is no single approach that is best in all cases. In fact, in most real world problems with their considerable complexity, it is probably best to use a variety of approaches. From this review, we can identify tradeoffs between the approaches and the types of insights that can be gained from each of them.
There is a tradeoff between the number of technologies that can be considered and the decision-making complexity that can be modelled. For example, Chan and Anadón (2015) consider uncertainty about the future of 25 technologies for six R&D technology programs using Monte-Carlo methods, while Santen and Anadón (2016) consider a multi-stage model for a continuous range of R&D investments for one single technology. More generally, the sensitivity and uncertainty analysis papers reviewed in Section 5.1 provide insights that are based on detailed modelling of the technologies, multiple uncertainties and multiple policies. The papers in Section 5.2 tend to have simpler representations of these aspects, but provide decision-relevant insights that cannot be drawn from the other frameworks.
Three of the papers discussed here show the value of explicitly modelling multiple stages (Baker, Olaleye, and Reis 2015; McJeon 2012; Santen and Anadón 2016). These papers all compare simple one-stage models with multi-stage models and provide insights that cannot be found in one stage models. In particular, some technologies and investment strategies have “option value” because they provide future flexibility to react to what is learned.
All the papers presented above explicitly illustrate the importance of considering both technological prospects and economic interactions when choosing an energy technology R&D portfolio. It is, therefore, not enough to simply look at the results in Section 2 of this report and choose R&D investments based on the technologies that have the most potential for technological change. How these technologies compete in the economy and interact with climate policy is also crucial. On the other hand, it is not enough to simply review the results from IAMs. Even though a technology may be very

The Future of Energy Technologies: An Overview of Expert Elicitations
71
important in an economy (such as nuclear, say, in the GCAM model), it may not be the best investment in a portfolio – the efficacy of the R&D investments must also be taken into consideration. Economic theory does indeed say that it may be important to consider both parts of this equation (i.e., the technological potential and the economic interactions). In reality, however, it is often true that one side of the equation swamps the other in importance. The work presented in this report confirms that in the case of energy technology R&D, both pieces are of prime importance. This is relevant to policy because there has been a tendency for policymakers to look at one or the other without integrating them. The work herein underlines the importance of undertaking an explicit R&D portfolio analysis.

GGKP Working Paper 01|2016
72
6. Future research needs and conclusions
There are a number of existing expert elicitation studies on climate-change mitigation energy technologies. The probability distributions and other information gleaned from these studies can play a crucial part in both the design of RD&D portfolios and the development of better projections of future emissions. Our objective was to provide a comprehensive overview of the existing elicitation data and its uses. We reported these data both in their original form and in a modified form that allowed us to compare multiple studies, and we reviewed the literature on modelling and decision-making that has employed the data. As expert surveys differ in many features, we made key harmonizing assumptions (discussed in detail in Appendix C to this document). We hope that this research will compel future researchers to extend our dataset to other technologies and studies, and combine existing and future data with models that can provide decision-relevant insights.
Here we summarize the key lessons learned by pulling together the range of studies in this report. We start by emphasizing the most important gaps in the literature, which should shape future research. First, very little research has been done which considers drastic reductions in current RD&D spending. Indeed, in most of the studies reviewed herein the current level of RD&D is taken to be the lowest level possible. There are four exceptions – Jenni, Baker, and Nemet (2013); Fiorese et al. (2014); Ricci et al. (2014); and NRC (2007) – which considered no or diminished R&D funding. In times of tight governmental budgets, however, it may be important to assess what would happen if entire RD&D programs were scaled down.
Second, as the geography of experts appears to be a key driver of elicited costs, it is important to extend expert elicitation to emerging economies that are now moving (in some cases for a long time) at the frontier of innovation for many of these technologies.
Third, this review of elicitation studies shows that some technology areas, such as utility-scale energy storage, wind, vehicles, gas turbines, geothermal and energy efficiency technologies, have been the subject of few (or no) publicly available expert elicitations. As a result, our ability to analyze these technologies and determine how they fit into energy RD&D portfolios is limited.
Overall, the expert elicitation data show some regularities. Most simply, experts largely believe that increased public R&D investments will result in reductions in future technology costs by 2030, although possibly with diminishing marginal returns. The results also support the notion that RD&D investments (as defined in these studies) will often not reduce the uncertainty surrounding the costs of future technology; rather, uncertainty is likely to stay the same or increase with larger investment in RD&D as the range of technological possibilities expands.
By looking across different studies and various technologies, there is no single technology that consistently stands out from the others in terms of largest cost reductions in percentage terms that might be induced by R&D. Although no systematic pattern emerges, data from Section 2 points to solar PV as the technology that is consistently (across studies and experts) expected to enjoy significant cost reductions. CCS is also expected to improve significantly, albeit with a greater dispersion. Nuclear power, on the other hand, is associated with some of the largest cost decreases in some elicitations (UMass), as well as some of the lowest cost decreases in others (e.g., FEEM and Harvard). This finding, corroborated by the meta-analysis presented in section 4, brings to attention the fact that differences in elicitation design (including choice of experts, mode of elicitation and format of the questions) may lead to differences in estimates.
Some of the studies covered in this report have also asked more qualitative questions using a range of visual and ranking tools. These provide technology-specific insights that go beyond future cost and

The Future of Energy Technologies: An Overview of Expert Elicitations
73
performance, and can provide greater insights on the uncertainty surrounding the costs estimates. For example, these types of questions can help identify promising new fields of energy technology research or describe non-technology barriers that may hamper the diffusion of a technology. Moreover, a great deal of insight can be gained from the expert’s discussions that support quantitative estimates. For example, a common finding in the studies was that experts expressed the importance of funding areas of research that are not traditionally included in programs (e.g., in the case of Harvard bioenergy and Harvard-FEEM nuclear surveys).
A review of decision frameworks confirms that technologies with the greatest potential for technological change are not necessarily the best R&D investments. A large decrease in cost does not necessarily result in the largest societal benefits. This is an important insight, since coupling expert elicitation data with modelling frameworks is quite a challenging and resource-intensive process. These results imply that, nevertheless, they are well worth the effort. Combining elicitations and models allows us to understand the range of future outcomes and how these depend on R&D. It also allows us to identify which near term alternatives most increase our flexibility to act in the future, and it indicates which technologies are (overall) the most important to support, considering both the technology and the economy.
One outcome of this comprehensive analysis is to shed light on how to perform the next generation of expert elicitations. The energy technology expert elicitations covered herein confirm the importance of fully understanding the technological literature and engaging technical experts during the early stages of protocol design.
Moreover, this report confirms that study design matters, and sheds new light on some key questions. A question that has been gaining interest lately is the impact of the elicitation mode – traditional F2F or remote (often online). Some of the studies considered how elicitation mode impacts the range of uncertainty expressed by experts. While, all else being equal, a smaller range of uncertainty is more informative than a larger range of uncertainty, it is well-known that experts tend to be overconfident, expressing ranges of uncertainty that are too small. The initial results from two of the meta-analyses (Verdolini et al. 2015; Nemet, Anadón, and Verdolini 2015) are consistent with the idea that in-person elicitations may be associated with greater uncertainty ranges.
A second aspect of study design centres on the set of experts that participates in the study. It appears that experts as grouped by characteristic have a tendency to answer similarly: experts from industry are similar and different from experts in academia, and Europeans may be different from Americans. However, the size and direction of such impacts varies by technology. For example, the meta-analysis of solar and nuclear elicitations indicated different relationships (or lack thereof) between whether experts were from the EU or the US, or whether experts were from the private sector, academia or a public research organization, and the optimism or pessimism regarding future technology cost and performance. When it came to nuclear, public sector and industry experts expected higher costs than academics, and US experts were more optimistic than their EU counterparts. On the other hand, when it came to solar, central estimates were unaffected by expert affiliation type or nationality, but there were indications that EU experts were more optimistic about breakthroughs. Other studies had similar, albeit mixed results. The main takeaway from these findings is that it is essential to represent a variety of affiliations, expertise and nationalities to truly account for uncertainty.
Future elicitations could experimentally test the ability of experts to calibrate different R&D budgets and systematically test the impact of asking experts about aggregated metrics (e.g., LCOE) versus technology components (Anadón et al. 2015). Most generally, this work indicates that it may be quite valuable to perform randomized, controlled studies to better understand the impacts of elicitation study design. The

GGKP Working Paper 01|2016
74
advantages of using structured and repeated online surveys could be large, but this would require research on how to design these online tools to minimize biases.
Finally, putting all of this work together, the range of results from expert elicitations and from the modelling and decision frameworks indicates that there is considerable remaining uncertainty regarding the future of energy technologies and disagreement regarding the extent of the impact of R&D. Therefore, care should be taken when crafting near-term policy to focus on increasing flexibility by investing in a range of technologies.

The Future of Energy Technologies: An Overview of Expert Elicitations
75
References
Abdulla, A., I. L. Azevedo, and M. G. Morgan. 2013. “Expert Assessments of the Cost of Light Water Small Modular Reactors.” Proceedings of the National Academy of Sciences 110 (24): 9686–91.
Acemoglu, D., P. Aghion, L. Bursztyn, and D. Hemous. 2012. "The Environment and Directed Technical Change." American Economic Review, 102(1): 131-66.
Ahn, J., and M. J. Apted, eds. 2010. Geological Repository Systems for Safe Disposal of Spent Nuclear Fuels and Radioactive Waste. Woodhead Publishing Limited.
Anadón, L. D., E. Baker, V. Bosetti, and L. Aleluia Reis. 2015. “Too Early to Pick Winners: Disagreement across Experts Implies the Need to Diversify R&D Investment.” Submitted.
Anadón, L. D., V. Bosetti, M. Bunn, M. Catenacci, and A. Lee. 2012. “Expert Judgments about RD&D and the Future of Nuclear Energy.” Environmental Science & Technology 46 (21): 11497–504.
Anadón, L. D., V. Bosetti, M. G. Bunn, M. Catenacci, and A. Lee. 2011. “International Workshop on Research, Development, and Demonstration to Enhance the Role of Nuclear Energy in Meeting Climate and Energy Challenges.” Retrieved from http://dash.harvard.edu/handle/1/8160715.
Anadón, L. D., M. G. Bunn, M. Chan, C. A. Jones, R. Kempener, G. Chan, A. Lee, N. J. Logar, and V. Narayanamurti. 2011. “Transforming US Energy Innovation.” Retrieved from http://dash.harvard.edu/handle/1/10594301.
Anadón, L. D., M. G. Bunn, and V. Narayanamurti. 2014. Transforming US Energy Innovation. UK: Cambridge University Press. Retrieved from http://www.cambridge.org/US/academic/subjects/earth-and-environmental-science/environmental-policy-economics-and-law/transforming-us-energy-innovation.
Anadón, L. D., G. Nemet, and E. Verdolini. 2013. “The Future Costs of Nuclear Power Using Multiple Expert Elicitations: Effects of RD&D and Elicitation Design.” Environmental Research Letters 8 (3): 034020.
Anderson, B., E. Borgonovo, M. Galeotti, and R. Roson. 2014. “Uncertainty in Climate Change Modeling: Can Global Sensitivity Analysis Be of Help?” Risk Analysis 34 (2): 271–93.
Baker, E.. 2006. “Increasing Risk and Increasing Informativeness: Equivalence Theorems.” Operations Research 54 (1): 26–36.
Baker, E., V. Bosetti, L. D. Anadón, M. Henrion, and L. Aleluia Reis. 2015. “Future Costs of Key Low-Carbon Energy Technologies: Harmonization and Aggregation of Energy Technology Expert Elicitation Data.” Energy Policy 80: 219-232.
Baker, E., V. Bosetti, K. E. Jenni, and E. Claire Ricci. 2014. “Facing the Experts: Survey Mode and Expert Elicitation.” Nota di Lavoro 1.2014, Milan, Italy: Fondazione Eni Enrico Mattei/.
Baker, E., H. Chon, and J. Keisler. 2009a. “Advanced Solar R&D: Combining Economic Analysis with Expert Elicitations to Inform Climate Policy.” Energy Economics 31: S37–49.
———. 2009b. “Carbon Capture and Storage: Combining Economic Analysis with Expert Elicitations to Inform Climate Policy.” Climatic Change 96 (3): 379–408.
———. 2010. “Battery Technology for Electric and Hybrid Vehicles: Expert Views about Prospects for Advancement.” Technological Forecasting and Social Change 77 (7): 1139–46.
Baker, E., H. Chon, and J. M. Keisler. 2008a. “Advanced Nuclear Power: Combining Economic Analysis with Expert Elicitations to Inform Climate Policy.” Retrieved from http://papers.ssrn.com/sol3/papers.cfm?abstract_id=1407048.
Baker, E., H. Chon, and J. Keisler. 2008b. “Electricity from Biomass: Combining Economic Analysis with Expert Elicitation Data to Inform Climate Policy.” Working Paper. University of Massachusetts, Amherst.
Baker, E., L. Clarke, and E. Shittu. 2008. “Technical Change and the Marginal Cost of Abatement.” Energy Economics 30 (6): 2799–2816.

GGKP Working Paper 01|2016
76
Baker, E., and J. M. Keisler. 2011. “Cellulosic Biofuels: Expert Views on Prospects for Advancement.” Energy 36 (1): 595–605.
Baker, E., O. Olaleye, and L. Aleluia Reis. 2015. “Decision Frameworks and the Investment in R&D.” Energy Policy 80: 275–285
Baker, E., and S. Solak. 2011. “Climate Change and Optimal Energy Technology R&D Policy.” European Journal of Operational Research 213 (2): 442–54.
———. 2014. “Management of Energy Technology for Sustainability: How to Fund Energy Technology Research and Development.” Production and Operations Management 23 (3): 348–65.
Barron, R., N. Djimadoumbaye, and E. Baker. 2014. “How Grid Integration Costs Impact the Optimal R&D Portfolio into Electricity Supply Technologies in the Face of Climate Change.” Sustainable Energy Technologies and Assessments 7 (September): 22–29.
Barron, R., and H. C. McJeon. 2015. “The Differential Impact of Low-Carbon Technologies on Climate Change Mitigation Cost under a Range of Socioeconomic and Climate Policy Scenarios.” Energy Policy 80: 264–74.
Bellman, R. 1956. “Dynamic Programming and Lagrange Multipliers.” Proceedings of the National Academy of Sciences of the United States of America 42 (10): 767.
Bettencourt, L. M. A., J. E. Trancik, and J. Kaur. 2013. “Determinants of the Pace of Global Innovation in Energy Technologies.” PloS One 8 (10): e67864.
Birge, J. R., and F. Louveaux. 2011. Introduction to Stochastic Programming. Springer Science & Business Media.
Bistline, J. E. 2013. “Energy Technology Expert Elicitations: An Application to Natural Gas Turbine Efficiencies.” Technological Forecasting and Social Change 86: 177-187.
BNEF. 2012. “Bloomberg New Energy Finance Database.” BNEF, and Frankfurt School/UNEP Center. 2014. “Global Trends in Renewable Energy Investments
2014.” Frankfurt School of Finance & Management gGmbH 2014. Retrieved from http://fs-unep-centre.org/system/files/globaltrendsreport2014.pdf
Bolger, F., and G. Rowe. 2015. “The Aggregation of Expert Judgment: Do Good Things Come to Those Who Weight?” Risk Analysis 35(1): 5–11.
Bosetti V., C. Carraro, M. Galeotti, E. Massetti and M. Tavoni, (2006), "WITCH: A World Induced
Technical Change Hybrid Model", The Energy Journal, Special Issue. Hybrid Modeling of
Energy-Environment Policies: Reconciling Bottom-up and Top-down, 13-38.
Bosetti, V., and M. Catenacci, eds. 2014. Innovation under Uncertainty: The Future of Carbon-Free
Energy Technologies. Series on Economics, the Environment and Sustainable Development.
Edward Elgar.
Bosetti, V., M. Catenacci, G. Fiorese, and E. Verdolini. 2012. “The Future Prospect of PV and CSP
Solar Technologies: An Expert Elicitation Survey.” Energy Policy 49: 308–17.
Bosetti, V., G. Marangoni, E. Borgonovo, L. D. Anadón, R.Barron, H. C. McJeon, S. Politis, and P. Friley. 2015. “Sensitivity to Energy Technology Costs: A Multi-Model Comparison Analysis.” Energy Policy 80: 244–63.
Bosetti, V., and E. C. Ricci. 2015. “Future Prospects of Carbon Capture Technologies: An Expert Elicitation.” Retrieved from: http://www.internationalenergyworkshop.org/docs/IEW%202013_1A2paperRicci.pdf.
Bosetti, V., M. Catenacci, G. Fiorese, and E. Verdolini. 2011. ICARUS Survey on the Current State and Future Development of Electric Drive Vehicles–Short Technical Report. FEEM. Retrieved from http://www.icarus-project.org/?cat=5
BP. 2013. “Statistical Review of World Energy.” Retrieved from http://www.bp.com/en/global/corporate/about-bp/energy-economics/statistical-review-of-world-energy/statistical-review-downloads.html.

The Future of Energy Technologies: An Overview of Expert Elicitations
77
Budnitz, R. J. et al. 1997. Recommendations for Probabilistic Seismic Hazard Analysis: Guidance on Uncertainty and Use of Experts. Vol. 1. US Nuclear Regulatory Commission Washington, DC. Retrieved from http://205.254.131.150/sites/default/files/nnsa/multiplefiles2/SSHAC%201997%20NUREG%20CR-6372.pdf.
Capen, E.C. 1976. “The Difficulty of Assessing Uncertainty.” Journal of Petroleum Technology 28 (8): 843–50.
Catenacci, M., E. Verdolini, V. Bosetti, and G. Fiorese. 2013. “Going Electric: Expert Survey on the Future of Battery Technologies for Electric Vehicles.” Energy Policy 61: 403–13.
Chan, G., and L. D. Anadón. 2015. “Improving Decision Making for Public RD&D Investments in Energy.” MIMEO.
Chan, G., L. D. Anadón, M. Chan, and A. Lee. 2011. “Expert Elicitation of Cost, Performance, and RD&D Budgets for Coal Power with CCS.” Energy Procedia 4: 2685–92.
Chase, J. 2015. “Levelised Costs of Electricity – PV.” presented at the Bloomberg New Energy Finance. Retrieved from https://www.iea.org/media/workshops/2014/solarelectricity/bnef2lcoeofpv.pdf.
Chung, T. S., D. Patiño-Echeverri, and T. L. Johnson. 2011. “Expert Assessments of Retrofitting Coal-Fired Power Plants with Carbon Dioxide Capture Technologies.” Energy Policy 39 (9): 5609–20.
Clemen, R. T. 2008. “Comment on Cooke’s Classical Method.” Reliability Engineering & System Safety 93 (5): 760–65.
Clemen, R. T., and T. Reilly. 2001. Making Hard Decisions with Decision Tools. CA, Duxbury: Pacific Grove.
Clemen, R. T., and R. L. Winkler. 2007. “Aggregating Probability Distributions.” in: W. Edwards, R. Miles, & D. von Winterfeldt (Eds.) Advances in Decision Analysis . pp. 154-176. Cambridge , UK : Cambridge University Press.
Clemen, R. T., and R. L. Winkler. 1985. “Limits for the Precision and Value of Information from Dependent Sources.” Operations Research 33 (2): 427–42.
———. 1999. “Combining Probability Distributions from Experts in Risk Analysis.” Risk Analysis 19 (2): 187–203.
Cooke, R. M., A. M. Wilson, J. T. Tuomisto, O. Morales, Tainio, M., and Evans, J. S. 2007. “A Probabilistic Characterization of the Relationship between Fine Particulate Matter and Mortality: Elicitation of European Experts.” Environmental Science and Technology 41 (18): 6598–6605.
Cooke, R. M. 1991. Experts in Uncertainty: Opinion and Subjective Probability in Science. Oxford University Press.
Cooke, R. M., and L. H. J. Goossens. 2000. “Procedures Guide for Structural Expert Judgement in Accident Consequence Modelling.” Radiation Protection Dosimetry 90 (3): 303–9.
Cooke, R. M., and L. Goossens. 2008. “TU Delft Expert Judgment Data Base.” Reliability Engineering & System Safety 93 (5): 657–74.
Crost, B., and C.P. Traeger. 2013. “Optimal Climate Policy: Uncertainty versus Monte Carlo.” Economics Letters 120 (3): 552–58.
Curtright, A. E., M. G. Morgan, and D. W. Keith. 2008. “Expert Assessments of Future Photovoltaic Technologies.” Environmental Science & Technology 42 (24): 9031–38.
Dalal, S., D. Khodyakov, R. Srinivasan, S. Straus, and J. Adams. 2011. “ExpertLens: A System for Eliciting Opinions from a Large Pool of Non-Collocated Experts with Diverse Knowledge.” Technological Forecasting and Social Change 78 (8): 1426–44.
Dewispelare, A. R., L. T. Herren, and R. T. Clemen. 1995. “The Use of Probability Elicitation in the High-Level Nuclear Waste Regulation Program.” International Journal of Forecasting 11 (1): 5–24.

GGKP Working Paper 01|2016
78
Dixit, A. K., and R. S. Pindyck. 1994. Investments Under Uncertainty. Princeton University Press. DOE. 2014. “FY 2015 Budget Justification.” U.S. Department of Energy, Washington DC. EC, European Commission. 2015. “Energy Technologies and Innovation [COM(2013) 253].” Retrieved
from https://www.google.com/webhp?sourceid=chrome-instant&ion=1&espv=2&ie=UTF-8#q=EC%2C+European+Commission%2C+(2008)%2C+Energy+Technologies+and+Innovation+%5BCOM(2013)+253%5D%2C.
Edmonds, J., J. Clarke, J. Dooley, S. H. Kim, and S. J. Smith. 2004. “Stabilization of CO 2 in a B2 World: Insights on the Roles of Carbon Capture and Disposal, Hydrogen, and Transportation Technologies.” Energy Economics 26 (4): 517–37.
Edwards, W., Miles, R., and D. von Winterfeldt. 2007. Advances in Decision Analysis: From Foundations to Applications. Cambridge University Press.
Ferrell, W. R. 1985. “Combining Individual Judgments.” In G. Wright, ed. Behavioral Decision Making, 111–45. Springer.
Fiorese, G., M. Catenacci, V. Bosetti, and E. Verdolini. 2014. “The Power of Biomass: Experts Disclose the Potential for Success of Bioenergy Technologies.” Energy Policy 65: 94–114.
Fiorese, G., M. Catenacci, E. Verdolini, and V. Bosetti. 2013. “Advanced Biofuels: Future Perspectives from an Expert Elicitation Survey.” Energy Policy 56: 293–311.
Gallagher, K. S., and L. D. Anadón. 2014. “DOE Budget Authority for Energy Research, Development, & Demonstration Database.” Energy Technology Innovation Policy Research Group, Belfer Center for Science and International Affairs, Harvard Kennedy School, March 2014.
Gillenwater, M.. 2013. “Probabilistic Decision Model of Wind Power Investment and Influence of Green Power Market.” Energy Policy 63: 1111–25.
Hammond, J. S., R. L. Keeney, and H. Raiffa. 1999. Smart Choices: A Practical Guide to Making Better Decisions. Vol. 226. Harvard Business Press.
Holdren, J. P., and S. F. Baldwin. 2001. “THE PCAST ENERGY STUDIES: Toward a National Consensus on Energy Research, Development, Demonstration, and Deployment Policy.” Annual Review of Energy and the Environment 26 (1): 391–434.
Hora, S. C., B. R. Fransen, N. Hawkins, and I. Susel. 2013. “Median Aggregation of Distribution Functions.” Decision Analysis 10 (4): 279–91.
Hora, S. C., and D. Von Winterfeldt. 1997. “Nuclear Waste and Future Societies: A Look into the Deep Future.” Technological Forecasting and Social Change 56 (2): 155–70.
Howard, R. A. 1988. “Decision Analysis: Practice and Promise.” Management Science 34 (6): 679–95. Howard, R. A., J. E. Matheson, and D. W. North. 1972. “The Decision to Seed Hurricanes.” Science
176 (4040): 1191–1202. IEA. 2015. “Energy Technology RD&D Budgets: Beyond 2020 Documentation.” www.iea.org. Iman, R. L., and W. J. Conover. 1982. “A Distribution-Free Approach to Inducing Rank Correlation
among Input Variables.” Communications in Statistics-Simulation and Computation 11 (3): 311–34.
Inman, M. 2012. “How Low Will Photovoltaic Prices Go? An Expert Discussion.” Nearzero. Retrieved from http://www.nearzero.org/reports/pv-learning.
InterAcademy Council. 2010. “Climate Change Assessments, Review of the Processes & Procedures of the IPCC.” Retrieved from https://www.ipcc.ch/pdf/IAC_report/IAC%20Report.pdf
Jaffe, A. B., R. G. Newell, and R. N. Stavins. 2005. “A Tale of Two Market Failures: Technology and Environmental Policy.” Ecological Economics 54 (2): 164–74.
James, A., S. Low Choy, and K. Mengersen. 2010. “Elicitator: An Expert Elicitation Tool for Regression in Ecology.” Environmental Modelling & Software 25 (1): 129–45.
Jenni, K. E., E. Baker, and G. F. Nemet. 2013. “Expert Elicitations of Energy Penalties for Carbon Capture Technologies.” International Journal of Greenhouse Gas Control 12: 136–45.
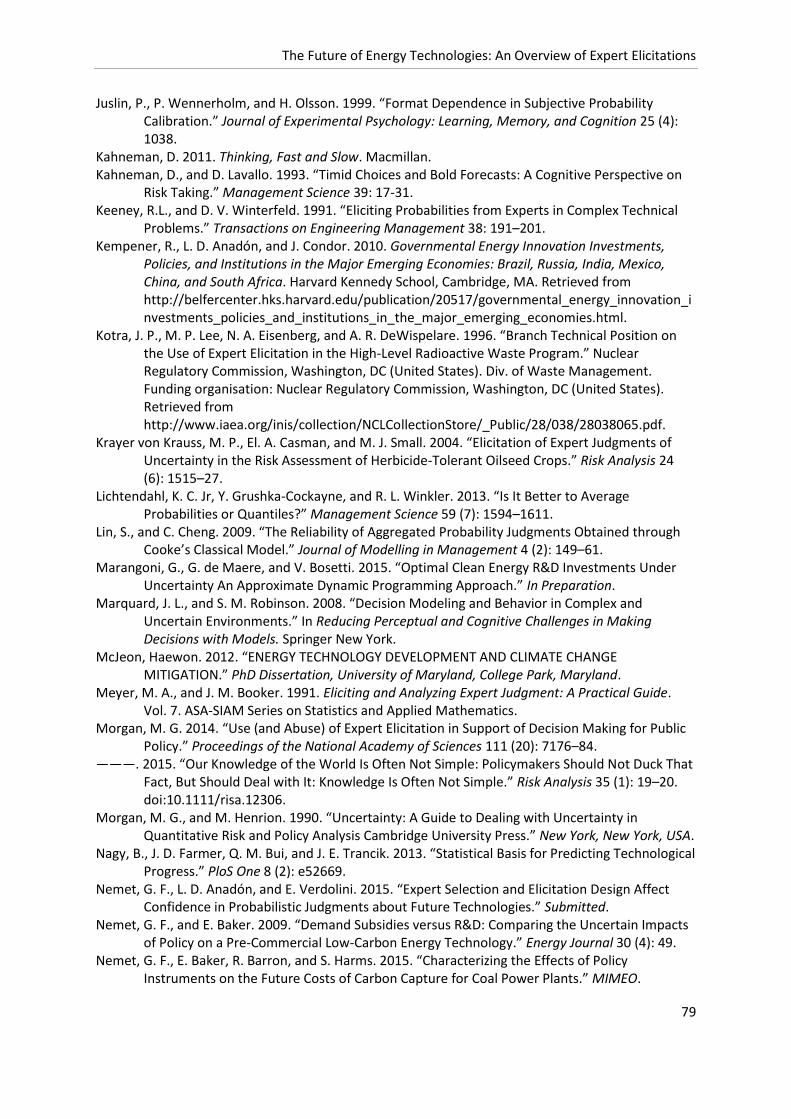
The Future of Energy Technologies: An Overview of Expert Elicitations
79
Juslin, P., P. Wennerholm, and H. Olsson. 1999. “Format Dependence in Subjective Probability Calibration.” Journal of Experimental Psychology: Learning, Memory, and Cognition 25 (4): 1038.
Kahneman, D. 2011. Thinking, Fast and Slow. Macmillan. Kahneman, D., and D. Lavallo. 1993. “Timid Choices and Bold Forecasts: A Cognitive Perspective on
Risk Taking.” Management Science 39: 17-31. Keeney, R.L., and D. V. Winterfeld. 1991. “Eliciting Probabilities from Experts in Complex Technical
Problems.” Transactions on Engineering Management 38: 191–201. Kempener, R., L. D. Anadón, and J. Condor. 2010. Governmental Energy Innovation Investments,
Policies, and Institutions in the Major Emerging Economies: Brazil, Russia, India, Mexico, China, and South Africa. Harvard Kennedy School, Cambridge, MA. Retrieved from http://belfercenter.hks.harvard.edu/publication/20517/governmental_energy_innovation_investments_policies_and_institutions_in_the_major_emerging_economies.html.
Kotra, J. P., M. P. Lee, N. A. Eisenberg, and A. R. DeWispelare. 1996. “Branch Technical Position on the Use of Expert Elicitation in the High-Level Radioactive Waste Program.” Nuclear Regulatory Commission, Washington, DC (United States). Div. of Waste Management. Funding organisation: Nuclear Regulatory Commission, Washington, DC (United States). Retrieved from http://www.iaea.org/inis/collection/NCLCollectionStore/_Public/28/038/28038065.pdf.
Krayer von Krauss, M. P., El. A. Casman, and M. J. Small. 2004. “Elicitation of Expert Judgments of Uncertainty in the Risk Assessment of Herbicide-Tolerant Oilseed Crops.” Risk Analysis 24 (6): 1515–27.
Lichtendahl, K. C. Jr, Y. Grushka-Cockayne, and R. L. Winkler. 2013. “Is It Better to Average Probabilities or Quantiles?” Management Science 59 (7): 1594–1611.
Lin, S., and C. Cheng. 2009. “The Reliability of Aggregated Probability Judgments Obtained through Cooke’s Classical Model.” Journal of Modelling in Management 4 (2): 149–61.
Marangoni, G., G. de Maere, and V. Bosetti. 2015. “Optimal Clean Energy R&D Investments Under Uncertainty An Approximate Dynamic Programming Approach.” In Preparation.
Marquard, J. L., and S. M. Robinson. 2008. “Decision Modeling and Behavior in Complex and Uncertain Environments.” In Reducing Perceptual and Cognitive Challenges in Making Decisions with Models. Springer New York.
McJeon, Haewon. 2012. “ENERGY TECHNOLOGY DEVELOPMENT AND CLIMATE CHANGE MITIGATION.” PhD Dissertation, University of Maryland, College Park, Maryland.
Meyer, M. A., and J. M. Booker. 1991. Eliciting and Analyzing Expert Judgment: A Practical Guide. Vol. 7. ASA-SIAM Series on Statistics and Applied Mathematics.
Morgan, M. G. 2014. “Use (and Abuse) of Expert Elicitation in Support of Decision Making for Public Policy.” Proceedings of the National Academy of Sciences 111 (20): 7176–84.
———. 2015. “Our Knowledge of the World Is Often Not Simple: Policymakers Should Not Duck That Fact, But Should Deal with It: Knowledge Is Often Not Simple.” Risk Analysis 35 (1): 19–20. doi:10.1111/risa.12306.
Morgan, M. G., and M. Henrion. 1990. “Uncertainty: A Guide to Dealing with Uncertainty in Quantitative Risk and Policy Analysis Cambridge University Press.” New York, New York, USA.
Nagy, B., J. D. Farmer, Q. M. Bui, and J. E. Trancik. 2013. “Statistical Basis for Predicting Technological Progress.” PloS One 8 (2): e52669.
Nemet, G. F., L. D. Anadón, and E. Verdolini. 2015. “Expert Selection and Elicitation Design Affect Confidence in Probabilistic Judgments about Future Technologies.” Submitted.
Nemet, G. F., and E. Baker. 2009. “Demand Subsidies versus R&D: Comparing the Uncertain Impacts of Policy on a Pre-Commercial Low-Carbon Energy Technology.” Energy Journal 30 (4): 49.
Nemet, G. F., E. Baker, R. Barron, and S. Harms. 2015. “Characterizing the Effects of Policy Instruments on the Future Costs of Carbon Capture for Coal Power Plants.” MIMEO.

GGKP Working Paper 01|2016
80
Nemet, G. F., E Baker, and K. E. Jenni. 2013. “Modeling the Future Costs of Carbon Capture Using Experts’ Elicited Probabilities under Policy Scenarios.” Energy 56: 218–28.
Nordhaus, W. D. 1994. “Expert Opinion on Climatic Change.” American Scientist, 45–51. Retrieved from http://stephenschneider.stanford.edu/Publications/PDF_Papers/NordhausSM.pdf
North, D. W., F. Offsend, and C. Smart. 1975. “Planning Wildfire Protection for the Santa Monica Mountains.” Fire J 69.
NRC. 2007. “Prospective Evaluation of Applied Energy Research and Development at DOE (phase Two).” National Academies Press, Washington D.C., United States: National Research Council.
NSB, National Science Board. 2014. “Science and Engineering Indicators Digest.” O’Hagan, A., C. E. Buck, A. Daneshkhah, J. R. Eiser, P. H. Garthwaite, D. J. Jenkinson, J. E. Oakley, and
T. Rakow. 2006. Uncertain Judgements: Eliciting Experts’ Probabilities. John Wiley & Sons. Olaleye, O., and E. Baker. 2015. “Large Scale Scenario Analysis of Future Low Carbon Energy
Options.” Energy Economics 49: 203–216. Peerenboom, J. P., W. A. Buehring, and T. W. Joseph. 1989. “OR Practice—Selecting a Portfolio of
Environmental Programs for a Synthetic Fuels Facility.” Operations Research 37 (5): 689–99. Phillips, L. D. 1999. Group Elicitation of Probability Distributions: Are Many Heads Better than One?
Kluwer Academic Publishers. Powell, W. B. 2007. Approximate Dynamic Programming: Solving the Curses of Dimensionality. Vol.
703. John Wiley & Sons.. Raiffa, H. 1968. Decision Analysis: Introductory Lectures on Choices under Uncertainty. Addison-
Wesley. Oxford. Rao, A. B., E. S. Rubin, D. W. Keith, and M. G. Morgan. 2006. “Evaluation of Potential Cost Reductions
from Improved Amine-Based CO< Sub> 2</sub> Capture Systems.” Energy Policy 34 (18): 3765–72.
Ricci, E C., V. Bosetti, E. Baker, and K. E. Jenni. 2014. “From Expert Elicitations to Integrated Assessment: Future Prospects of Carbon Capture Technologies.” FEEM Nota di Lavoro 2014.044
Rodríguez, M. C., I. Haščič, N. Johnstone, J. Silva, and A. Ferey. 2015. “Renewable Energy Policies and Private Sector Investment: Evidence from Financial Microdata.” Environmental and Resource Economics 62 (1): 163–88.
Santen, N., and L. D. Anadón. 2014. “Electricity Technology Investments under Solar RD&D Uncertainty: How Interim Learning and Adaptation Affect the Optimal Decision Strategy.” Discussion Paper 2014-10, Energy Technology Innovation Policy Research Group, Belfer Center for Science and International Affairs, Harvard Kennedy School.
——— 2016. “Balancing solar PV deployment and RD&D: A comprehensive framework for managing innovation uncertainty in electricity technology investment planning.” Renewable & Sustainable Energy Reviews. Accepted.
Savage, S. 2002. “The Flaw of Averages.” Harvard Business Review 4. Retrieved from http://www.mcppremium.com/pdf/Papers/FlawofAverages_article.pdf.
Shearer, C., J. Bistline, M. Inman, and S. J. Davis. 2014. “The Effect of Natural Gas Supply on US Renewable Energy and CO2 Emissions.” Environmental Research Letters 9 (9): 094008.
Spaccasassi, C., and L. Deleris. 2011. “A Web-Based Tool for Expert Elicitation in Distributed Teams.” In Proceedings of the 8th Bayesian Modelling Applications Workshop of UAI. Vol. 2011. Citeseer. Retrieved from http://citeseerx.ist.psu.edu/viewdoc/download?doi=10.1.1.232.3602&rep=rep1&type=pdf#page=128.
Speirs-Bridge, A., F. Fidler, M. McBride, L. Flander, G. Cumming, and M. Burgman. 2010. “Reducing Overconfidence in the Interval Judgments of Experts.” Risk Analysis 30 (3): 512–23.

The Future of Energy Technologies: An Overview of Expert Elicitations
81
Spetzler, C. S., and C. S. Stael Von Holstein. 1975. “Probability Encoding in Decision Analysis.” Management Science 22: 340–58.
Spieglhalter, D., M. Pearson, and I. Short. 2011. “Visualizing Uncertainty About the Future.” Science 333 (6048): 1393–1400.
Tversky, A., and D. Kahneman. 1974. “Judgment under Uncertainty: Heuristics and Biases.” Science 185 (4157): 1124–31.
US EPA, US Environmental Protection Agency. 2015. “Expert Elicitation Task Force White Paper.” Retrieved from https://www.google.com/webhp?sourceid=chrome-instant&ion=1&espv=2&ie=UTF-8#q=US+Environmental+Protection+Agency+(2011)+Expert+elicitation+task+force+white+paper.
Usher, W., and N. Strachan. 2013. “An Expert Elicitation of Climate, Energy and Economic Uncertainties.” Energy Policy 61: 811–21.
Varian, Hal. 1992. Microeconomic Analysis. 3rd ed. New York: Norton. Verdolini, E., L. D. Anadón, G. F. Nemet, and J. Lu. 2015. “The Effects of Expert Selection, Elicitation
Design and RD&D Assumptions on Experts’ Estimates of the Future Costs of Photovoltaics.” Energy Policy 80: 233-243.
Walls, L., and J. Quigley. 1991. “Building Prior Distributions to Support Bayesian Reliability Growth Modelling Using Expert Judgement.” Reliability Engineering and System Safety 74 (2): 117–28.
Webster, M., N. Santen, and P. Parpas. 2012. “An Approximate Dynamic Programming Framework for Modeling Global Climate Policy under Decision-Dependent Uncertainty.” Computational Management Science 9 (3): 339–62.
Weyant, J.P. 2004. “Introduction and Overview.” Energy Economics 26 (4): 501–15. Wiesenthal, T., P. Dowling, J. Morbee, C. Thiel, B. Schade, P. Russ, S. Simoes, et al. 2012. “Technology
Learning Curves for Energy Policy Support.” JRC Scientific and Policy Reports. ftp://ftp.jrc.es/users/publications/public/JRC73231.pdf.
Winkler, R. L. 1967. “The Assessment of Prior Distributions in Bayesian Analysis.” Journal of the American Statistical Association 62 (319): 776–800.

GGKP Working Paper 01|2016
82
Appendix A: Individual Survey Data
In all following graphs, when one expert elicited more than one specific sub-technology category, the values for that expert were aggregated. The aggregation was carried out taking the minimum of the 10th percentile, the median of the 50th percentile and the maximum of the 90th percentile.
Harmonized surveys Figure 16: Experts’ results of the bioelectricity surveys per expert and per R&D scenario
Note: The lines range from the 10th to the 90th percentiles and the marker in between represents the 50th percentile.

The Future of Energy Technologies: An Overview of Expert Elicitations
83
Figure 17: Experts’ results of the biofuel surveys per expert and per R&D scenario
Note: The lines range from the 10th to the 90th percentiles and the marker in between represents the 50th percentile.

GGKP Working Paper 01|2016
84
Figure 18: Experts’ results of the CCS surveys per expert and per R&D scenario
Note: The lines range from the 10th to the 90th percentiles and the marker in between represents the 50th percentile.

The Future of Energy Technologies: An Overview of Expert Elicitations
85
Figure 19: Experts’ results of the nuclear GenIII/III+ surveys per expert and per R&D scenario
Note: The lines range from the 10th to the 90th percentiles and the marker in between represents the 50th percentile.

GGKP Working Paper 01|2016
86
Figure 20: Experts’ results of the nuclear GenIV surveys per expert and per R&D scenario
Note: The lines range from the 10th to the 90th percentiles and the marker in between represents the 50th percentile.

The Future of Energy Technologies: An Overview of Expert Elicitations
87
Figure 21: Experts’ results of the nuclear SMR surveys per expert and per R&D scenario
Note: The lines range from the 10th to the 90th percentiles and the marker in between represents the 50th percentile.
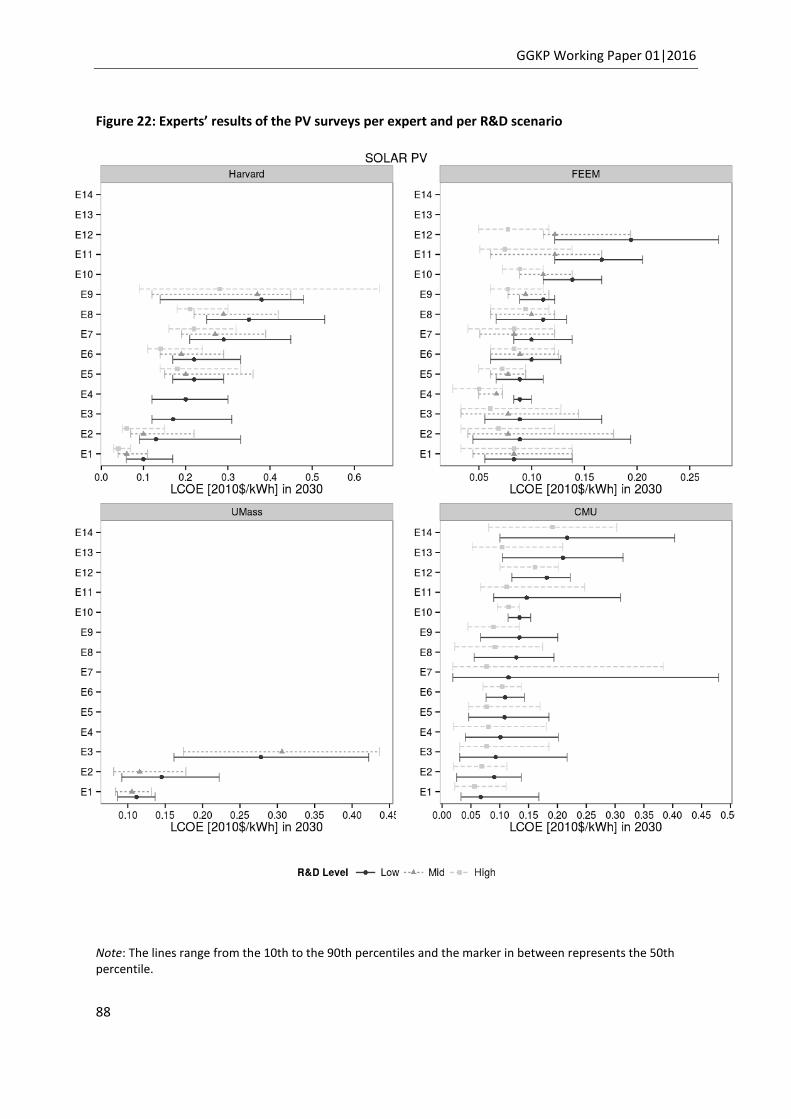
GGKP Working Paper 01|2016
88
Figure 22: Experts’ results of the PV surveys per expert and per R&D scenario
Note: The lines range from the 10th to the 90th percentiles and the marker in between represents the 50th percentile.

The Future of Energy Technologies: An Overview of Expert Elicitations
89
Figure 23: Experts’ results of the CPV surveys per expert and per R&D scenario
Note: The lines range from the 10th to the 90th percentiles and the marker in between represents the 50th percentile.

GGKP Working Paper 01|2016
90
Individual experts Non harmonized surveys
CCS
Figure 24: CCS survey per expert and per R&D scenario
Note: The lines range from the 10th to the 90th percentiles and the marker in between represents the 50th percentile. Source: Experts’ results of the UMass (Jenni, Baker, and Nemet 2013).

The Future of Energy Technologies: An Overview of Expert Elicitations
91
Figure 25: FEEM CCS survey per expert and per R&D scenario
Note: The lines range from the 10th to the 90th percentiles, while the marker in between represents the 50th percentile. R&D level 1 corresponds to no further R&D for the specific capture technology is provided by the EU; R&D level 2 is as level 1 but some type of carbon price is enacted worldwide, beginning in 2015 (under the assumption that whatever form the policy takes, it has the effect of about a $100/tonne CO2 Carbon Tax worldwide); R&D level 3 assumes that the EU increases R&D investments in a specific capture technology substantially, to about $250 million per year, starting in 2015 and continuing at that level through 2025. As a reference, since 2002 annual R&D investments for capture technologies in the EU ranged between 0.6-111.0 Million 2010$, with an average of 41.6 Million 2010$).

GGKP Working Paper 01|2016
92
Vehicles
Figure 26: FEEM vehicle batteries survey per expert and per R&D scenario
Note: The lines range from the 10th to the 90th percentiles, while the marker in between represents the 50th percentile.
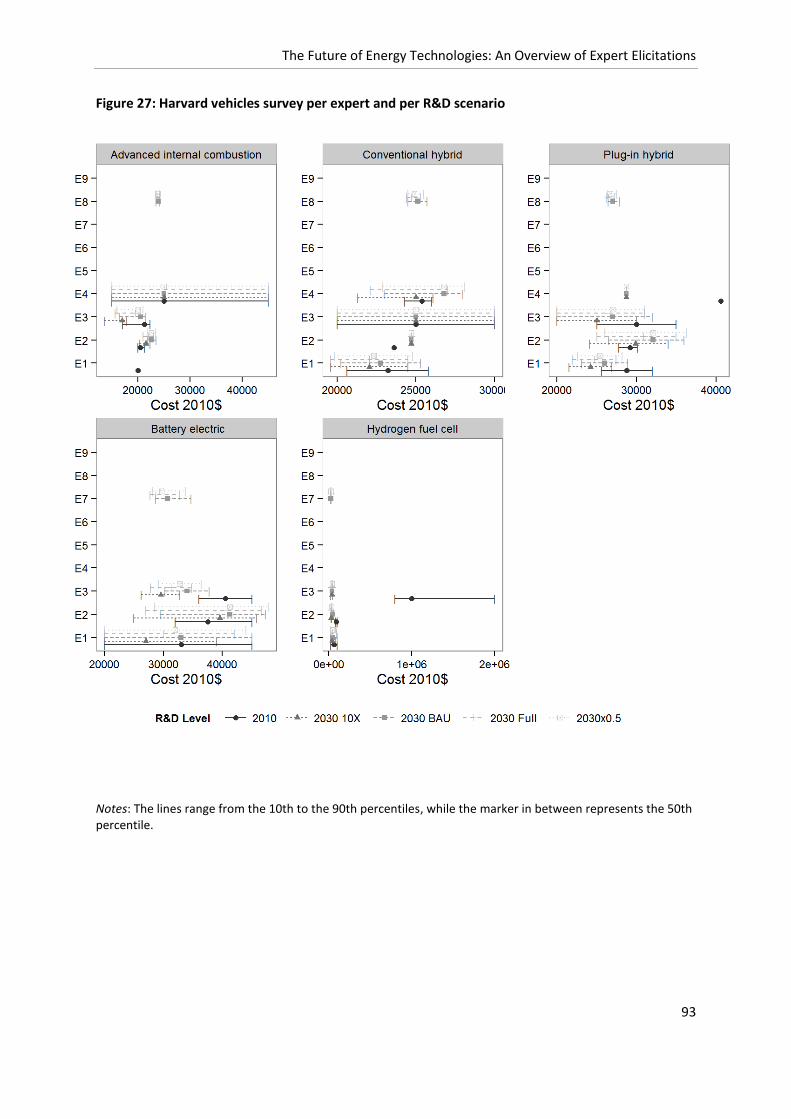
The Future of Energy Technologies: An Overview of Expert Elicitations
93
Figure 27: Harvard vehicles survey per expert and per R&D scenario
Notes: The lines range from the 10th to the 90th percentiles, while the marker in between represents the 50th percentile.
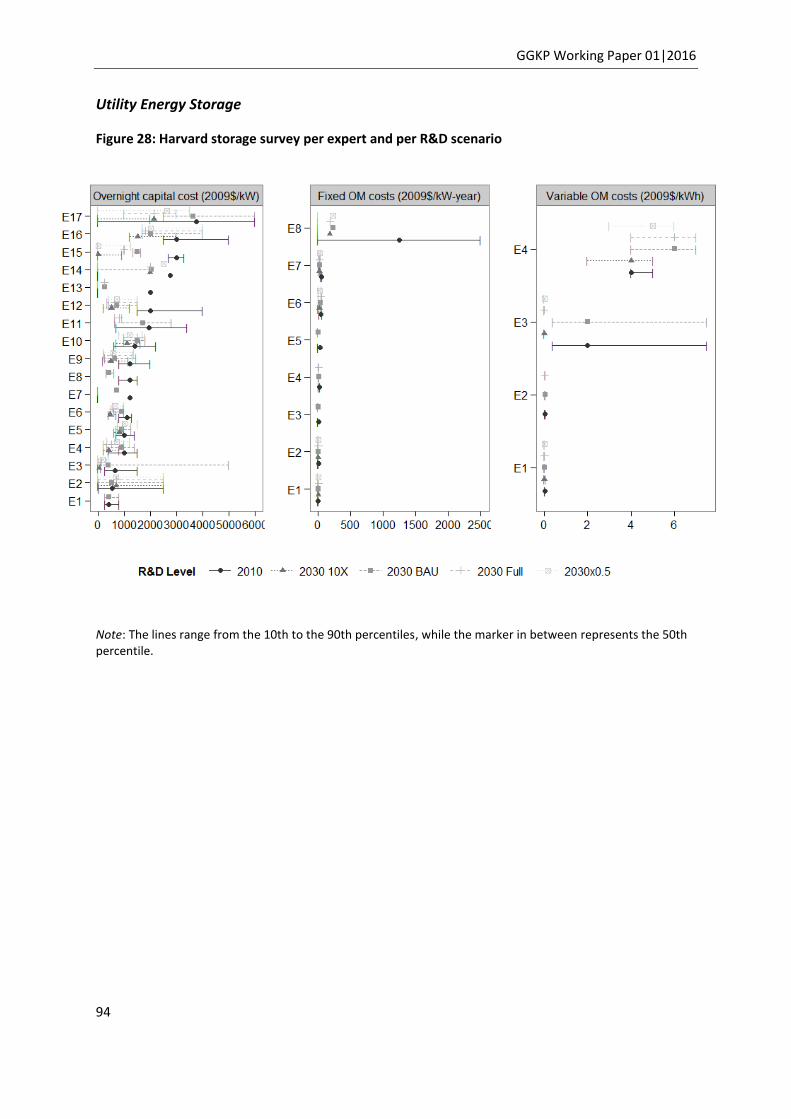
GGKP Working Paper 01|2016
94
Utility Energy Storage
Figure 28: Harvard storage survey per expert and per R&D scenario
Note: The lines range from the 10th to the 90th percentiles, while the marker in between represents the 50th percentile.

The Future of Energy Technologies: An Overview of Expert Elicitations
95
Natural Gas
Figure 29: Experts’ results of the Stanford natural gas survey per expert and per R&D scenario
Source: Bistline 2013 Note: The lines range from the 10th to the 90th percentiles, while the marker in between represents the 50th percentile.

GGKP Working Paper 01|2016
96
Appendix B: Qualitative data from studies, including key research areas, technology bottlenecks and impediments to deployment
Here we summarize some of the key technical barriers and additional areas of research that experts thought were important to make progress on the various technologies considered by the various studies. We present, in turn, information for the technology areas for which information on additional research and policy considerations was available. We further divide each of these technology subsections by study. We conclude Appendix B with a section summarizing results on FEEM experts’ estimates on the probability of various deployment scenarios.
Bioelectricity
Harvard survey (text sourced from Anadón, Bunn and Narayanamurti 2014, p.64).
Experts in the Harvard survey (which covered both bioelectricity and biofuels) identified the need to fur-ther develop: microbiological technology (e.g., for the fermentation of lignocellulosic biomass), biomass pretreatment processes, enzymes, (e.g., ethanologens, and enzyme-based transesterification), and the production of carbohydrate omega-3 oils from biofuel byproducts. Experts also identified the need to support research in feedstock transportation, land use changes, and life-cycle emissions associated with biomass to reduce the uncertainties related to the cost and environmental impacts of bioenergy tech-nologies. Several of the experts were concerned that feedstock RD&D funded by the U.S. Department of Agriculture was insufficient and that the private sector would not address feedstock research needs. They specifically stated that cellulosic feedstocks and algae should be emphasized, that plant genetic en-gineering should continue to be explored, and that better harvesting methods are needed. Experts who recommended increasing the support for feedstock development insisted that feedstock issues would dominate the scale, cost, and environmental impact of bioenergy technologies.
UMass survey (Baker and Keisler 2011)
In the UMass biofuels paper, there was disagreement among the experts as to the importance of government funding to industry (as opposed to academia for more basic science). One expert identified the biofuels agenda as a problem of basic research, and another specifically noted that this problem will not be helped by industry. On the other hand, three other experts specifically mentioned that funding for industry was key. The results of this survey indicated that the highest priority investments are into selective thermal processing, with the top priority on a bio-oils path.
FEEM survey (Fiorese et al. 2014)
Figure 29 below summarizes the bottleneck and proposed solutions that emerged from the interviews of the FEEM bioenergy experts. Almost all experts expressed concern about the sustainability of biomass supply. Competition for land with food crops and with carbon sinks (e.g., forests and grasslands), the extensive use of water , the pollution deriving from the use of fertilizer and the threats to biodiversity and soil productivity are all major concerns linked with biomass technologies diffusion. The majority of experts suggested that most of these issues and externalities can be mitigated with adequate policies, such as a certification system (as already in existence for liquid fuels in the EU) that guarantees the sustainability of resources and controls the origin of feedstocks as well as life cycle emissions of GHG for electricity from biomass. In general, the suggested role for public policy, in addition to investments, is high.

The Future of Energy Technologies: An Overview of Expert Elicitations
97
Figure 30: Barriers and proposed solutions, FEEM survey on bioenergy

GGKP Working Paper 01|2016
98
Biofuels
Harvard biofuels comments are summarized in the bioelectricity section above.
UMass biofuels comments are summarized in the bioelectricity section.
FEEM survey (Fiorese et al. 2013)Experts involved in the FEEM biofuel elicitation indicated that the highest concerns in terms of non-technical barriers were competition of land with food and environmental externalities. These two by far surpassed geographical constraint, which was the third most named non-technical barrier. In all three cases, policy intervention was the factor that experts thought would contribute to additional deployment (see Figure 31).

The Future of Energy Technologies: An Overview of Expert Elicitations
99
Figure 31: Barriers and proposed solutions, FEEM survey on biofuel technologies
GGKP Working Paper 01|2016
100
Nuclear fission
Harvard survey (text sourced from Anadón, Bosetti et al. 2011, p.66)
Most experts highlighted the importance of sensors, digital information and communications technology, prognostics, diagnostics, and system-wide modelling as interdisciplinary technology areas that are very important to the field of nuclear energy. In particular, experts mentioned the importance of advanced digital systems for safety, and remote real-time monitoring of reactors and fuel-cycle facilities. The improvement of manufacturing technologies and the reduction in the size of components to allow fac-tory construction of complete units were also mentioned by many experts as important for the future of nuclear power.
Experts also emphasized the need to fund anticipatory research at the US Nuclear Regulatory Commis-sion, so that the regulatory basis for licensing Gen IV reactors can be developed in parallel with DOE RD&D. A couple of experts felt that Thorium fuel cycles (while partially included in current programs) could be more fully addressed. Similarly, some expressed the need to fund (or at least track the progress of) the Th-U233 fuel cycle, which is being conducted in other countries, and at the very least needs to be tracked.
Also mentioned as areas that need to be funded are (1) the licensing of coupled desalination systems that improve economics and waste heat utilization, (2) high-efficiency dry cooling applications (site placement of nuclear and other thermal technologies will be limited by consumptive water-use constraints), and (3) close coupled siting conditions and requirements for industrial site applications. The integration of MOX fuels into the US regulatory system was also discussed.
In addition, the Harvard and FEEM elicitations evaluated non-technical aspects that could hamper nuclear power deployment. As stated in Anadón, Bosetti et al. (2011), the Harvard and FEEM nuclear elicitations concluded that:
U.S. and E.U. experts largely agree that licensing and construction delays, costs overruns, and insufficient government support result in an increased risk premium for nuclear power facilities over natural gas.
• Most E.U. and U.S. experts are convinced that in the short term the risk premium on nuclear investments will remain higher than the natural gas plant discount rate, but in the long term there will be a progressive decrease in the importance of non-technical factors on the risk premium for nuclear investments.
• Global events like nuclear accidents, major costs overruns, and proliferation from the civilian nuclear energy system could cause a significant decrease in the rate of construction of new nuclear power plants in the E.U. and in the U.S.
• Successful siting and demonstration projects, and failures in the use of fossil fuel and renewable energy technologies would have a positive effect on the deployment of nuclear power Harvard experts.
The aforementioned publication has significantly more detail on barriers related to nuclear fission deployment.
UMass survey (Baker, Chon, and Keisler 2008a)
The Future of Energy Technologies: An Overview of Expert Elicitations
101
Baker, Chon and Keisler (2008a) considered issues other than cost and efficiency, including water usage and proliferation concerns. The experts considered the success of an advanced High Temperature Reactor (HTR) under two water usage conditions. On average, across experts and funding scenarios, they found the likelihood of success with low water usage about 65% of that of success with high water usage. This indicates there is some likelihood of achieving low water, but it is lower. The definition of success for HTRs included a deep burn rate 10 times that of conventional light water reactors.
CMU survey (Abdulla, Azevedo, and Morgan 2013)
Abdulla, Azevedo and Morgan (2013) asked experts for their judgment regarding the areas that have the largest potential for improvement expected from SMRs. Their results indicated that factory fabrication holds the largest potential for improvement, followed by reduced construction time, design simplicity and flexibility in siting options. Experts in the CMU study also exhibited little consensus regarding their expectations of the friendliness to SMRs in the future regulatory environment in the US (e.g., regulations allowing multimodule plant construction, siting SMR plants close to population centres, or exporting SMRs to countries with little or no experience operating nuclear plants).
Experts believed that the risks of loss-of-coolant accidents and the loss of offsite power were likely to be lower for SMRs than for conventional plants. As in the FEEM and Harvard surveys, experts discussed possible benefits in spent fuel management and proliferation risk.
Solar PV and CSP
Harvard survey (text sourced from the Appendix of Anadón, Bunn et al. 2011, p.67).
Experts cited the following areas that could benefit from research in PV technologies: high efficiency lighting and displays; wafer lift-off processes; low cost single crystalline substrates; spectral splitting optical components; power electronics for servers, appliances, EVs, wind turbines; microelectronics; and energy storage and smart grid infrastructure. The experts agreed, in general, that technology challenges in PV are very different than in telecommunications and semiconductors, especially beyond the applied research stage, because PV is exposed to harsh environmental conditions for decades and generates a low-cost commodity, namely electricity, from a diffuse energy source.
FEEM survey (Bosetti et al. 2012)
Figure 32 shows the perceived barriers that emerged from the discussion with the FEEM solar
experts. First, “lock-in” effects, sunk costs and long-lived capital are, according to the experts, major
impediment to switch to solar, unless direct policy intervention accelerates capital turnover. Second,
renewable energy sources feeding into an electric power grid do not receive full credit for the value
of their power unless specific supporting policies are in place. Such unfavourable power pricing rules
need to be overcome by policy intervention. Third, intermittency in the supply of solar power should
be overcome with adequate storage systems and better grid integration. Other non-technical
barriers mentioned by the experts are the availability of rare metals for some specific PV and CSP
systems, as well as land availability and other geographical constraints (e.g., sun irradiation). The
relative importance of these last barriers is low compared to the other three previously mentioned.

GGKP Working Paper 01|2016
102
Figure 32: Barriers and proposed solutions, FEEM survey on solar technologies
Near Zero survey (text sourced from Inman 2012, p.7)
Further process cost reductions would require many aspects of the solar power industry to develop favorably, said Gregory Nemet (University of Wisconsin). These include “reduction in the cost of materials,” “technical advances that improve electrical conversion efficiency,” and “new technical generations of PV.” “If most of these do not occur,” he said, “it is hard to see how [the expected prices] can be attained and then sustained.” For prices to fall substantially below the average expectations in Near Zero’s survey would likely require changes in the solar power industry, according to comments from many of the participants. For example, experts said that reaching much lower prices would require a “breakthrough in BOTH semiconductor and encapsulation materials costs” (Steven Hegedus, University of Delaware), or a “breakthrough in installation methodology” (Danielle Merfeld, GE Global Research).
These responses stress the need for continued research and development in order for prices to continue falling for the long term, beyond the next decade.
The Future of Energy Technologies: An Overview of Expert Elicitations
103
CMU survey (text from Curtright, Morgan and Keith 2008, p.9036)
Even if learning produces cost reductions faster than expected and deployment costs are consequently lower than predicted, absent some dramatic breakthrough resulting from research, the cost differential will remain large because PV is as much as an order of magnitude more expensive than other low-carbon options. Given this, and given the very mixed views of our respondents about the relative effectiveness of expanded RD&D versus expanded deployment, policy makers should think very carefully before endorsing a deployment-based strategy as a vehicle to reduce PV costs if the goal is bulk low-carbon electricity supply.
UMass survey (Baker, Chon and Keisler 2009a)
In the UMass survey there was quite a bit of disagreement across the experts on the efficacy of R&D investments. Some of the experts strongly believed that “cost reduction is a manufacturing-driven issue and that achieving desirable production costs will require much work beyond government-funded lab research.” One expert said “Manufacturing costs will require a significant amount of development which is much more expensive than basic research and I do not believe that $15,000,000/year would be sufficient to meet this cost target with any reasonable probability.”
Others: Batteries
UMass survey (Baker, Chon and Keisler 2010)
In the UMass survey, there was some disagreement over how many cycles a battery would need to achieve to be viable. One expert felt that 1000 cycles was fine, and he ended up having a relatively high probability of success. Another expert felt that achieving 3000 cycles was the key hurdle for success, but was not sure it could be achieved at any level of funding. Another expert noted that achieving 3000 cycles was “not amenable to an Edisonian trial and error approach”, but that it would rather most likely come from independent investments into material science research. This last expert felt additionally, that if the cycling problem were solved, “private investment will address the cost problem.” The experts in general felt that in order to achieve a low cost/high performance outcome it would require a great deal of engineering beyond the science; there was disagreement about the likelihood that this would be provided by the private sector.
FEEM survey (Bosetti et al. 2011)Figure 33 clearly shows that the main concern of experts regarding the diffusion of electric-drive vehicles is the behavior of consumers, and that a combination of marketing, policies and education is considered as the avenue for overcoming those barriers.
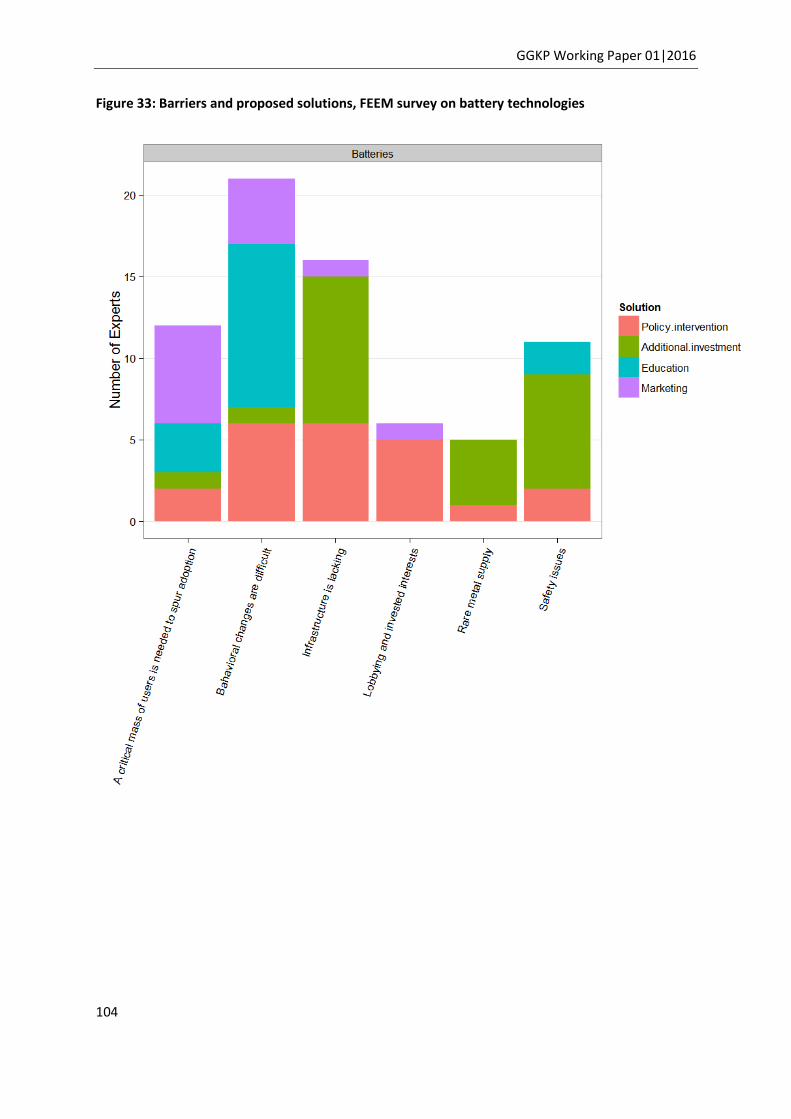
GGKP Working Paper 01|2016
104
Figure 33: Barriers and proposed solutions, FEEM survey on battery technologies

The Future of Energy Technologies: An Overview of Expert Elicitations
105
Others: Utility scale energy storage
Harvard survey (text sourced from the appendix of Anadón, Bunn et al. 2011)
Harvard experts designated the “other” technology category in the allocation as comprising underground modular pumped hydro, storage systems, grid monitoring, smart meters (enabling), CAES with heat storage, liquid air energy storage, thermistor based storage, and mechanical storage systems other those already identified in the elicitation.
Experts responded with many technologies that could be concurrently developed with utility-scale energy storage technologies. These include vehicle technologies in the transportation sector, particularly electric vehicle technologies and fuel cells, concurrently with batteries, flow batteries, and electrochemical capacitors. Flywheels for energy storage could overlap with industrial applications. Personal mobility storage, distributed storage and residential thermal storage could also be developed in parallel. An added benefit of improving residential thermal storage is improvement in building cooling technology and efficiency. Many experts also cited strong overlap with smart grid technologies and systems and efforts to improve grid operations, especially at the substation level and for cyber security. Un-interrupt-ible power supply (UPS), power conversion, and semiconductor switching were other areas of overlap. Heat exchangers and gas compressors (e.g., for industrial gases) overlapped with CAES development. Mining equipment improvements and other battery chemistries, such as advanced lead acid, should also be developed alongside batteries for utility-scale storage.
Many experts responded that there should be interdisciplinary research between storage technologies and transmission and distribution technologies. Experts noted that storage technologies could radically change transmission and distribution system planning needs. This potential needs to be studied through production cost models and mapped in order to reflect the system benefits of storage and make the most optimal investments. Better understanding is needed through improved economic dispatch or market models, and models of load flows (e.g., storage as a sink) and transmission dispatch (e.g., storage as a transmission service) where storage is an integral component of the system.

GGKP Working Paper 01|2016
106
Technology adoption
The FEEM surveys for solar, batteries, bioenergy and biofuel also asked experts to comment on the potential of technology diffusion into the market in different countries (OECD, fast developing, developing). Figure 34 reports the probabilities that each expert associated with three diffusion scenarios, defined as “low”, “medium” and “high” penetration scenarios by 2050. Comparing across technologies, solar is the one where experts were more optimistic about the highest penetration scenario in all three macroregions. Indeed, probabilities of diffusions are comparable across more developed and less developed countries, indicating the high perceived potential of this decentralized electricity-production technology. For bioenergy, experts were consistently putting more probability on the medium penetration scenario. Also, in this case, differences across different world regions seem limited. In the case of biofuels, experts are putting the largest probability on the low penetration scenario. In the case of batteries, more diffusion is expected in developed and fast-developing countries, reflecting their market potential.
Figure 34: FEEM experts’ probability of diffusion of technologies per region

The Future of Energy Technologies: An Overview of Expert Elicitations
107
Appendix C: Data standardization process
C.1 Data cleaning and harmonization.
As noted in the Appendix of Anadón et al., (2015):
“In order to compare and aggregate the values that were elicited in the individual surveys, a set of harmonizing assumptions had to be made to allow a meaningful comparison. For each of the assumptions that differ across studies (i.e., as currencies and currency years, endpoint years, and other underlying technical factors) we had to make a decision on what value to converge to. The harmonization process per se required months of research and discussions between the authors of the different elicitation studies.”
This Appendix briefly summarizes the data on cleaning and harmonization procedures. We refer the interested reader to the original articles (Baker, Bosetti and Jenni, et al., 2014; Anadón et al., 2015; Anadón, Nemet and Verdolini 2013; Verdolini et al., 2015; Nemet, Anadón and Verdolini 2015) for further details. This Appendix borrows heavily from the Appendices and explanations included in these articles.
First, whenever elicitation groups collected different metrics, the harmonization process entailed constructing a model to make the data comparable using common assumptions (e.g., insolation and discount rates). Details in this respect are explained below in subsection C.1 and organized by technology.
Second, all surveys included in the harmonization procedure elicited costs in 2030, with the exception of the UMass studies, which asked experts about 2050. The explanation of how UMass elicited values were adjusted is presented in subsection C.2.
Third, harmonization of the R&D levels with which experts were confronted is explained in subsection C.3.
Section C.1: Harmonization of cost estimates
As explained in Section 2, the harmonization process entailed converting elicited estimates into a cost metric of 2010$/kWh in 2030 for the studies and technologies that were included in the process. This common metric represented an LCOE for solar photovoltaics, a non-energy LCOE for bioelectricity, a non-energy levelized cost of fuel for biofuels, a partial levelized cost of electricity for nuclear (including only capital cost), and a levelized additional cost of CCS. Harmonization assumptions are detailed below for each technology and study.
Table C.1, below, is compiled using information from Anadón et al., (2015); Anadón, Nemet and Verdolini (2013); Baker, Bosetti, Anadón et al. (2015); Nemet, Anadón and Verdolini (2015) and Verdolini et al.(2015) and summarizes the elicited values and key assumptions for the UMass, Harvard, CMU and FEEM harmonized studies.

GGKP Working Paper 01|2016
108
Table C 1. Summary of key assumptions in the harmonization process
Group Biofuels Bioelectricity
CCS Nuclear Solar
UMass (metrics elicited)
Capital cost per gge (gallon of gasoline equivalent) capacity, efficiency, other
Various technical endpoints and cost
Various technical endpoints and cost
Various technical endpoints and cost
Manufacturing cost per m2 efficiency lifetime
FEEM metrics elicited
Cost per gge O&M cost
Cost per kWh O&M cost
N/A
Overnight capital cost
LCOE
Harvard metrics elicited
Cost per gge yield (gge/dry ton Of feedstock) plant life feedstock costs
Cost per kwh yield (gge/dry ton of feedstock) plant life
Overnight capital cost (\$/kW) generating efficiency, (HHV) capacity factor book life
Overnight capital cost (\$/kW) fixed O\M cost variable O\M cost fuel cost thermal burnup
Module capital cost per Wp, module efficiency, inverter cost, inverter efficiency, inverter lifetime
CMU metrics elicited
N/A N/A N/A Overnight capital cost
module prices in $/W for different solar systems
Common Metrics Harmonized
Non-energy levelized cost of fuel
Non-energy LCOE
Levelized capital cost
Levelized capital cost
LCOE
Key Assumptions
0.031 kwh=1gge Calculations assume that the fraction of non-energy costs at the mean is the same across the distribution. See description below about
Calculations assume that the fraction of non-energy costs at the mean is the same across the distribution. See description below about assumptions needed to turn
Interest Rate=0.1 Lifetime=40 Capacity Factor=0.9 See description below needed about assumptions to turn UMass 2050 estimates to 2030 estimates.
Interest Rate=0.1 Lifetime=40 Capacity Factor=0.9 See description below needed about assumptions to turn UMass 2050 estimates to 2030 estimates.
Capacity Factor: 12% Factor Discount rate: 10% Peak Power Insolation (Wp/m2): 1,000 Cost of Power Cond ($/Wp): 0.1 Hours per year: 8760 Lifetime: 20 Moduel Area Costs ($/m2): 350 BOS m2: 75 UMass 250 Harvard See description below

The Future of Energy Technologies: An Overview of Expert Elicitations
109
assumptions needed to turn UMass 2050 estimates to 2030 estimates.
UMass 2050 estimates to 2030 estimates.
about assumptions needed to turn Umass 2050 estimates to 2030 estimates. For CMU solar, Module prices $/W were converted into LCOE $/kWh using the average values from the Harvard study for the other cost components and BOS as well as other assumptions above

GGKP Working Paper 01|2016
110
C.2 Temporal harmonization of UMass data.
As explained in Anadón et al., (2015):
In order to adjust the UMass endpoints from 2050 to 2030, which was the time frame used in the FEEM and Harvard studies, we backcast the UMass 2050 estimates to 2030 using Moore's Law and parameters from (Nagy et al. 2013). (Nagy et al. 2013) analyzed a large dataset for several technologies, and concluded that the estimated costs that used only the parameter time performed approximately as well as the traditional experience curve. Thus, we use the following relation based on Moore's Law:
Where m is a parameter of this model calculated from B, the learning rate, and g, the growth rate of production, as follows.
This method is used to estimate the values for 2030:
The parameter m is calculated using the learning parameters B, taken from the literature, and the growth parameter g provided in (Nagy et al. 2013). A summary for all technologies is reported in Table C 2.
Table C 2.
Source: Reprinted with permission from Baker, Bosetti and Anadón, et al. (2014).
Section C.3: Harmonization of R&D levels
The UMass, Harvard and FEEM experts were confronted with different R&D scenarios. The following text is a quote from the Appendix of Anadón et al. (2015) explaining the different scenarios:
Experts were asked to assess future costs and performance of energy technologies, for three given levels of R&D funding by governments in order to study the effect of government R&D on reducing the costs of clean energy technologies. Each team defined R&D funding levels differently. […] funding levels are grouped into three broad categories, Low (which is consistent with a business-as-usual (BAU) scenario for FEEM, an increase of 50% to 200% over BAU for Harvard, and small investments, independent from the BAU, into specific technologies for UMass), Medium (ranging between an additional 50% to a 16-fold increase over low) and High (ranging between an additional 30% to a 10-fold increase over medium). And, while both Harvard and FEEM included demonstration expenditures, UMass asked questions about smaller R&D scenarios that did not include demonstration expenditures.

The Future of Energy Technologies: An Overview of Expert Elicitations
111
The CMU nuclear cost elicitation made R&D assumptions consistent with a BAU scenario (Low R&D). Conversely, the solar CMU study made assumptions about both R&D investment and specific deployment levels. Specifically, experts were asked for their estimates under four scenarios:
a) Status quo, defined as 2008 government RD&D funding levels for the PV technology being considered and current government incentive levels for deployment of PV technologies in general;
b) 10x RD, defined as 10 times the 2008 RD&D level;
c) 10X deploy, defined as a 2008 RD&D investment level, accompanied by a 10-fold increase in deployment in the United States;
d) 10X deploy and 10X RD&D, defined as a combination of scenarios (b) and (c).
Scenario (a) was categories as “low” RD&D and elicitations, while scenarios (b) as “high” RD&D. Data for scenarios c and d were not used.
Details on the R&D levels in each study and on the coding into low, mid and high RD variables are reported in Table C 3 below.
Table C 3: R&D levels
Technology Group Source/Publication Specified R&D Budget
Level (millions of 2010 United States dollars)
RD levels shown in this study
Bioelectricity UMass Unpublished 15 50 150
Low Medium High
Harvard (Anadón, Bunn, et al. 2011)
BAU: 214 Ave. REC R&D: 585 0.5 REC 10 REC (includes biofuels budget)
Low Medium Not included in this report High
FEEM (Fiorese et al. 2014)
169 254 338
Low Medium High
Biofuel UMass (Baker and Keisler 2011)
13 201 838
Low Medium High
Harvard (Anadón, Bunn, et al. 2011)
BAU: 214 Ave. REC R&D: 585 0.5 REC 10 REC (includes biomass budget)
Low Medium Not included in this report High
FEEM (Fiorese et al. 2013)
168 252 336
Low Medium High
CCS UMass (Baker, Chon, and Keisler 2009b)
13 48 108
Low Medium High

GGKP Working Paper 01|2016
112
Harvard (Chan et al. 2011) BAU: 701 Ave. REC R&D: 2250 0.5 REC 10 REC (includes coal and gas CCS budget)
Low Medium Not included in this report High
Chung et al. (Chung, Patiño-Echeverri, and Johnson 2011)
BAU 10 BAU BAU + deployment 10BAU + deployment
Low High Not included in this report Not included in this report
Nuclear UMass (Baker, Chon, and Keisler 2008a)
40 480 1980
Low Mid High
Harvard (Anadón et al. 2012)
BAU: 466 Ave. REC: 1883 0.5 REC 10 REC (includes Gen III+ and IV, both large-scale and SMRs)
Low Mid Not included in this report High
FEEM (Anadón et al. 2012)
BAU: 800 Ave. REC: 1514 0.5 REC 10 REC (includes Gen III+ and IV, both large-scale and SMRs)
Low Mid Not included in this report High
CMU (Abdulla, Azevedo, and Morgan 2013)
No R&D scenarios explicitly considered, but interpreted as consistent with BAU R&D budget.
Low
Solar Umass (Baker, Chon, and Keisler 2009a)
25 140
Low Mid
Harvard (Anadón, Bunn, et al. 2011)
BAU: 143 Ave. REC: 409 0.5X REC 10X REC.
Low Mid Not included in this report High
FEEM (Bosetti et al. 2012)
171 257 342
Low Medium High
Near Zero (Inman 2012) No R&D scenarios considered, instead scenarios were about global deployment.
Not included in this report
Curtwright (Curtright, Morgan, and Keith 2008)
BAU 10 BAU BAU + deployment 10BAU + deployment
Low High Not included in this report Not included in this report

Green Growth Knowledge PlatformInternational Environment House11-13 chemin des Anémones1219 Geneva Switzerland
Follow us on Twitter: twitter.com/GGKPlatformJoin our LinkedIn Group: bit.ly/linkedinGGKPSubscribe to the GGKP Knowledge Update:bit.ly/KnowledgeUpdate