the future of disease management may 2008. 1 agenda history of disease management don’t drink the...
TRANSCRIPT

The Future of Disease Management
May 2008

2
Agenda
• History of disease management • Don’t drink the Kool-Aid: Why the “let’s do DM”
model has not lived up to expectations (but no one’s noticed)– Actuarial pre-post savings calculations are provably
invalid
• Success is in sight: How to make your health plan work…with an example
• Lessons for you, as a health plan

History of Disease Management: Milestones
Invention of theautomated cigarette roller by John Duke (1896)

History of Disease Management: Milestones
Introduction of Twinkies by Hostess (1953)

History of Disease Management: Milestones
Ray Kroc franchises the McDonald Brothers(1955)

6
History of Disease Management
“We want to make the world safe for DM-ocracy”
Woodrow Wilson

7
-- “Engine Charlie” Wilson
“What’s good for DM is good for the country.”

History of Disease Management: Milestones
Cap’n Crunchsets record for sugar content in a cereal (1972—59%)
History of Disease Management: Milestones
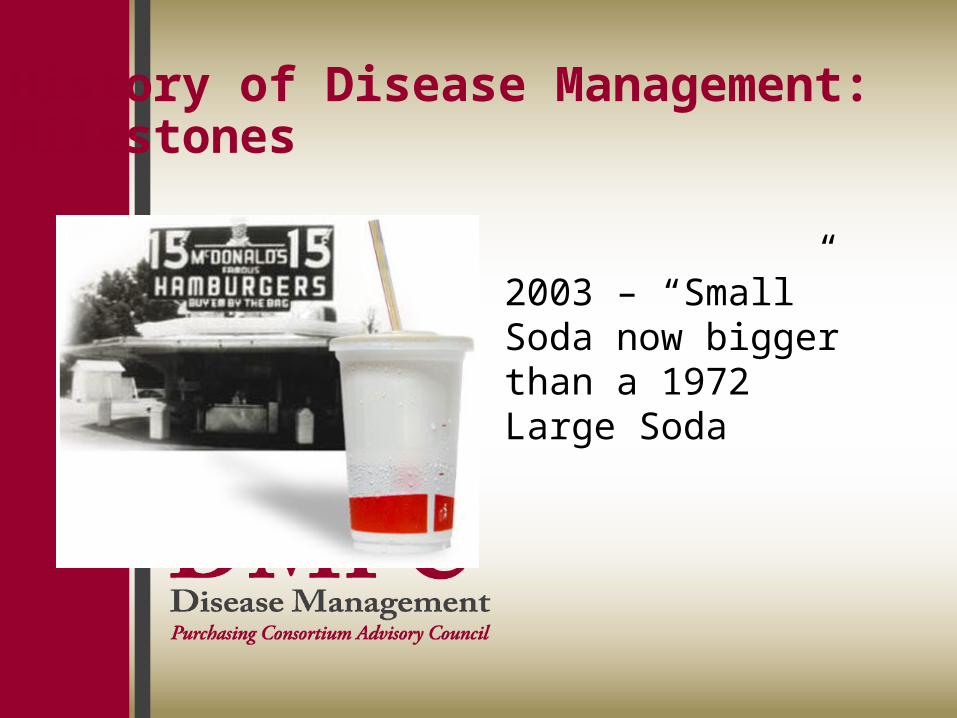
2003 – “Small” Soda now bigger than a 1972 Large Soda

10
Agenda
• History of disease management • Don’t drink the Kool-Aid: Why the classic
model has failed (but no one’s noticed)– Actuarial pre-post savings calculation methodology is
provably invalid
• Success is in sight: New models which really do work
• Lessons for you, as a health plan

11
In this example
• Assume that “trend” is already taken into account correctly
• Focus on the baseline and contract period comparison

12
Base Case: Example from AsthmaFirst asthmatic has a $1000 IP claim in 2005
2005(baseline)
2006(contract)
Asthmatic #1 1000
Asthmatic #2
Cost/asthmatic

13
Example from AsthmaSecond asthmatic has an IP claim in 2006 while first asthmatic goes on drugs (common post-event)
2005(baseline)
2006(contract)
Asthmatic #1 1000 100
Asthmatic #2 0 1000
Cost/asthmaticWhat is the
Cost/asthmaticIn the baseline?

14
Cost/asthmatic in baseline?
2005(baseline)
2006(contract)
Asthmatic #1 1000 100
Asthmatic #2 0 1000
Cost/asthmatic $1000 Vendors don’t count #2 in 2005 bec. he can’t be found

15
Cost/asthmatic in contract period?
2005(baseline)
2006(contract)
Asthmatic #1 1000 100
Asthmatic #2 0 1000
Cost/asthmatic $1000 $550

16
Why Pre-Post Overstates Savings
2005(baseline)
2006(contract)
Asthmatic #1 1000 100
Asthmatic #2 0 1000
Cost/asthmatic $1000 $550
In this case, a “dummy population” falls 45% on its own without DM due to #2 being a “plane on the ground”
17
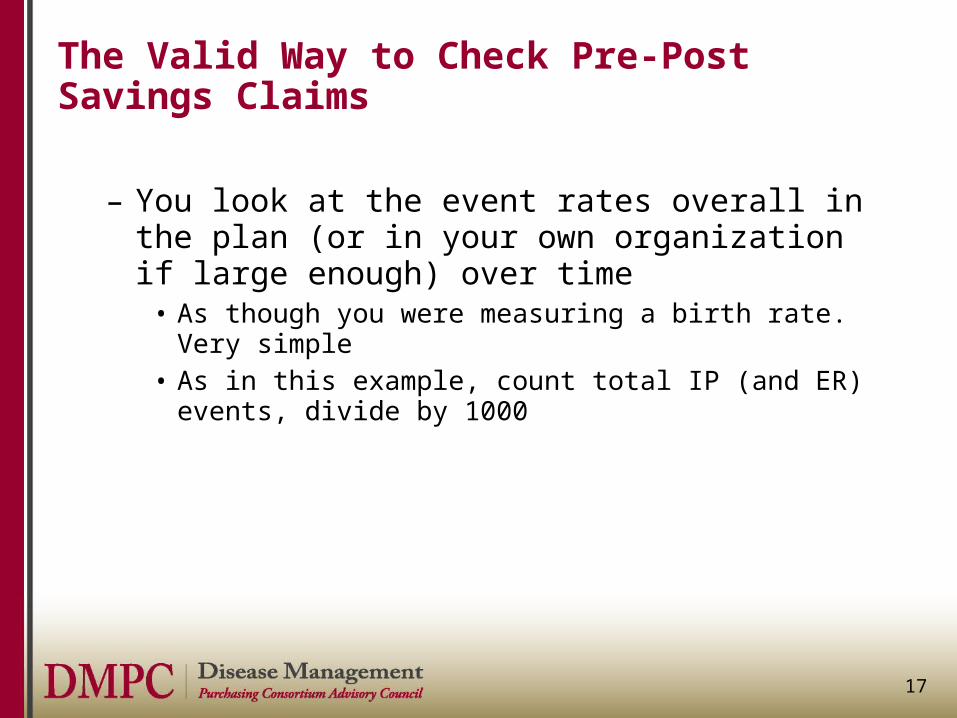
The Valid Way to Check Pre-Post Savings Claims
– You look at the event rates overall in the plan (or in your own organization if large enough) over time
• As though you were measuring a birth rate. Very simple• As in this example, count total IP (and ER) events, divide by
1000

18
Asthma events in the payor as a whole – the plausibility check
2005(baseline)
2006(contract)
Asthmatic #1 1000 100
Asthmatic #2 0 1000
Inpatient events/year
1 1

19
This is called a “plausibility check”
• You use plausibility checks all the time in your everyday life and don’t think twice about them– But for some reason in DM people rely on faith
instead
• Here is one of many real-world examples of actuarial “pre-post” results bearing no relation to reality

20
Program Year One – Clinical IndicatorsProgram Year One – Clinical Indicators
Clinical Outcomes:
Base Post Year 1 Improvement
% of CHD Members with an LDL screen 75.0% 77.0% 2.0%
% of CHD Members with at least one claim for a Statin 69.0% 70.5% 1.5%
% of CHD Members receiving an ACE inhibitor or alternative 43.5% 44.7% 1.2%
% of CHD Members post-MI with at least one claim for a beta-blocker
0.89 0.89 0.0%
Hospitalizations/1,000 CHD Members for a primary diagnosis of Myocardial Infarction*
47.60 24.38 -48.8%
*measure based on total membership, not just "continuously enrolled" membership
Percentage of Continuously Enrolled Members
21
0.00
0.50
1.00
1.50
2.00
2.50
3.00
3.50
2000 2001 2002 2003 2004 2005 2006
Year
Inci
den
ce R
ate
per
1,0
00
ASTHMA
CAD
CHF
COPD
DIABETES
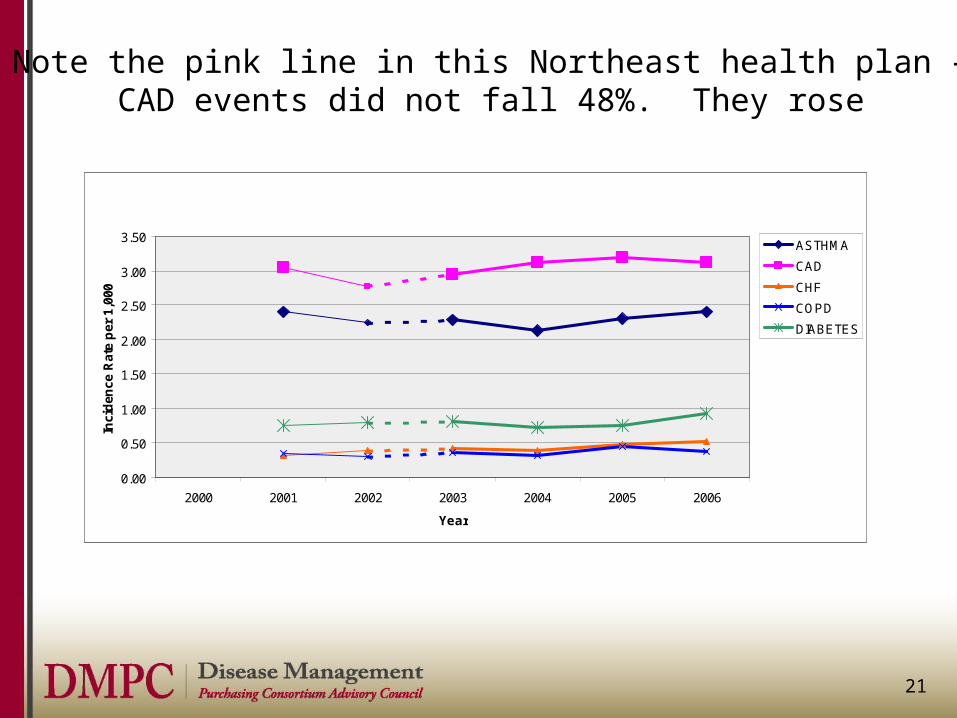
Note the pink line in this Northeast health plan –CAD events did not fall 48%. They rose
0.00
0.50
1.00
1.50
2.00
2.50
3.00
3.50
2000 2001 2002 2003 2004 2005 2006
Year
Inci
den
ce R
ate
per
1,0
00
ASTHMA
CAD
CHF
COPD
DIABETES

22
Agenda
• History of disease management • Don’t drink the Kool-Aid: Why the “let’s do DM”
model has not lived up to expectations (but no one’s noticed)– Actuarial pre-post savings calculations are provably
invalid
• Success is in sight: How to make your health plan work…with an example
• Lessons for you, as a health plan

23
Let’s look at an example of a model of the future which works
• This model is a tight care coordination/DM model in which all “data” coming into the organization is used, not wasted
• This company is not a health plan. They do not pay claims. But they do all the member services services and UM/CM/DM interventions
• As the next slide shows, they are claiming substantial reductions from trend across their population

24
• 4.51% medical/Rx claim trend over past 5 years
• 61% of companies had a reduction in claims/employee in first year
• None of accounts had reduction in benefits (no cost shifting to employees) or network changes
• 92% patient satisfaction
2001
National healthcare trend:
+13-16%
2000 2001 2002 2003
National healthcare trend:
+12-16%
2004 2005
+4.51%-
-
2006
©2007 Quantum Health, Inc. All rights reserved.
This looks promising…is it real?

25
Use a “plausibility test” before deciding it’s best practice
• How would you check the plausibility of this?• Remember, if everything produced its claimed
ROI/savings, you’d have negative medical spending

26
Plausibility test: Is this performance due to good management, luck, or invalidity?
• If it’s “real,” you’d expect– Utilization of the ER and hospital would decline
Let’s check the actuals against the expectations

27
Is it luck or is it real: Plausibility Test
ER Use -15%
Hospital Use -27% (-13% Admissions, -16% ALOS)

28
Plausibility test: Is this performance due to good management, luck, or invalidity?
• If it’s “real,” you’d expect– Utilization of the ER and hospital would decline (but
mostly not be replaced with OP procedures)
Let’s check the actuals against the expectations

29
Is it luck or is it real: Plausibility Test
ER Use -15%
Hospital Use -27% (-13% Admissions, -16% ALOS)
Outpatient Procedures -9%

30
Plausibility test: Is this performance due to good management, luck, or invalidity?
• If it’s “real,” you’d expect– Utilization of the ER and hospital would decline (but
mostly not be replaced with OP procedures)– Specialist visits would decline
Let’s check the actuals against the expectations

31
Is it luck or is it real: Plausibility Test
ER Use -15%
Hospital Use -27% (-13% Admissions, -16% ALOS)
Outpatient Procedures -9%
Specialist Visits -9%

32
What other explanation could there be?

33
OK, so maybe all these things happened because demographics improved?
• Then you would expect everything to decline, not just the expensive things
• But if it’s truly through better prevention, DM, and care coordination, you’d expect to see increases in PCP visits, drugs etc.

34
Plausibility test: Is this performance due to good management, luck, or invalidity?
• If it’s “real,” you’d expect– Utilization of the ER and hospital would decline (but
mostly not be replaced with OP procedures)– Specialist visits would decline– PCP visits and drug use would increase – Use of preventive care resources would be way up
Let’s check the actuals against the expectations

35
Is it luck or is it real: Plausibility Test
ER Use -15%
Hospital Use -27% (-13% Admissions, -16% ALOS)
Outpatient Procedures -9%
Specialist Visits -9%
PCP Visits/Drug Use +7%/+4%
Preventive Care/Diagnostics +32%

36
The secret to future success
• Total comprehensive services from a single vendor– “Plausibility-tested” results, not pre-post– One phone number (see example, next page) – Closely coordinated– Many “touch points”
• Example: A request for an endocrinologist referral triggers a diabetes DM program if Dx already given

37
Is your health plan reducing fragmentation or causing it?
Integrated Customer Service:
Eliminate Plan Fragmentation
Network 2
Network 3
Network 4
Directory
PreCert 1PreCert 3
PreCert 2
Out of State: not sure
what to do
???
Rx
Which one is “Customer Inquiry?”
©Quantum Health, Inc., 2007. All rights reserved.

38
The secret to future success
• Total comprehensive services from a single vendor– “Plausibility-tested” results, not just pre-post– One phone number– Closely coordinated– Reduced “time to contact” from months to days via
many “touch points,” all linked so that if someone calls in for one thing they might be sent somewher else as well (examples to follow)

39
“Time to contact” for this organization (source: Managed Healthcare Executive)
0
20
40
60
80100
120
Days from Dx to DMcontact

40
Examples
• Reducing Time to Contact through data you already receive through “touch points” you already have– “Are diabetic shoes covered?”– “I need a referral to a cardiologist”

41
Lessons for you as a health plan about the future: The future is in using the data you already get, to coordinate care
• The future is not in fancy web-enabled consumer tools or other ways of hoping the consumer looks to the health plan for a role in care– Ain’t gonna happen
• The future is in transforming the huge amounts of your incoming data into light rather than losing it in heat
• The future is in optimzing performance of the whole, rather than of individual silos– That’s what a health plan is. Otherwise, it’s just claims-paying
and contracting

42
Lessons
• Use your data• Don’t be running around inventing new things
when there is plenty of opportunity in what’s already coming in the door

43
Impact of New Model
• Size of ROI from DM: lower • Size of Savings from program: Higher
Note: I don’t want to get into the math but a lower ROI can resultIn higher net savings

44
Impact
• Size of ROI from DM • Size of Savings from
program: Higher
• Credibility of program: Priceless