the future of coal in indonesia study coal dynamics and fileiesr (institute for essential services...
TRANSCRIPT
IESR (Institute for Essential Services Reform) | www.iesr.or.id
Coal Dynamics andEnergy Transition in Indonesia
1
The Future of Coal in Indonesia Study

IESR (Institute for Essential Services Reform) | www.iesr.or.id 2
ForewordCoal has long become an important part of Indonesian economy. In 2016, Indonesia was the world’s fifth-largest coal producer by contributing to 7.2% of global production and the world’s second-largest coal exporter with total export reaching 16.1% of global’s need. Despite a key player in the global coal market, Indonesia has only 2.2% of world’s proven coal reserves, putting the country in the 9th place among countries with the largest coal reserves. China is the major destination for our coal export.
Indonesia energy policy put coal as key fuel for electricity. Clouded with believe that coal is the cheapest source for generating electricity, Although unsustainable, coal still plays a key role in meeting the energy demand in Indonesia. Under the National Energy Policy (KEN), coal is aimed to supply at least 30% of primary energy by 2025. By the end of 2016, the Coal Fired Power Plant (CFPP) installed capacity reached 29.8 GW, accounting for 50% of total capacity in the country. In the latest Electricity Supply Business Plan, PLN plans to add 26 GW of new CFPP by 2027, to make total capacity of CFPP become 57 GW nationally.
Globally, CFPP emits 9,448 million tons greenhouse gas (GHG) emissions annually or equals to 26.3% of world’s total GHG emissions. As the world move towards limiting global temperature below 20C, attention now turns to Indonesia as a coal powerhouse in the region and one of the largest economies in the world. As Indonesia exporting coal, the emission from coal burning is projected to rise significantly by 2030. Under current trajectory, it is unlikely Indonesia will meet its NDC’s target, let alone overall Paris Agreement target.
To understand the dynamics of coal sector in the future Indonesia as the global economy is shifting toward a low carbon economy and as renewable energy becomes more competitive, IESR conducts this study. This study is part of a larger study to understand the coal dynamics in China and Indonesia, which is undertaken together with Global Environmental Institute (GEI) from China. This publication is only part of our findings from the larger study.
Fabby TumiwaExecutive Director

IESR (Institute for Essential Services Reform) | www.iesr.or.id 3
IMPRINT
Coal Dynamics and Energy Transition in Indonesia
This publication is part of the “The Future of Coal” study that conducted in partnership with Global Environmental Institute (GEI) of China.
Authors:Agus Praditya Tampubolon | Deon Arinaldo | Julius Christian Adiatma
Editor:Fabby Tumiwa | Pamela Simamora
Publication: November 2018

IESR (Institute for Essential Services Reform) | www.iesr.or.id 4
Contents
Regulations and policies as guidelines for ministries and agencies to meet National energy targets
Indonesia Coal Sector Overview: resources distribution, national production and coal’s contribution to the economy
Indonesia Power Sector Overview: CFPP development & increased coal consumption. Who will bear the risk?
Coal : misconception, global trend, and meeting the NDC
5
10
15
21

IESR (Institute for Essential Services Reform) | www.iesr.or.id 5
Regulations and policies as guidelines for ministries and agencies to meet National energy target

IESR (Institute for Essential Services Reform) | www.iesr.or.id 6
Law No.30/2007 Article 12 paragraph 2 authorizes the National Energy Council (DEN) to:
(a) design and formulate a national energy policy to be determined by the government with the approval of the House of the Representatives (DPR);(b) establish General Planning on National Energy (RUEN);
Law No.30/2007 mandates the government to compile the National Energy Policy (KEN) as a guideline to manage national energy. This policy was designed and formulated by the National Energy Council (DEN) and determined by the government with the approval of the house of the representatives (DPR).
(c) establish measures to overcome energy crisis and emergency conditions; and (d) oversee the implementation of cross-sectoral energy policies. Whereas Article 17 paragraph states that the government drafts a General Planning on National Energy (RUEN) based on national energy policy (KEN).
Law No.30/2007 as a legal basis and guidelines for National energy sector

IESR (Institute for Essential Services Reform) | www.iesr.or.id 7
National Energy Policy structure
Government Regulation of Republic Indonesia No.79/2014 is derived from Law No.30/2007 about Energy. This regulation defines national energy policy as a policy on energy management based on the principles of fairness, sustainability and environmental sound aimed to create energy independence and national energy security. Structurally, this policy could be divided into main policies and supporting policies.In NEP 2014, the National Energy Council (DEN) developed the national energy development priorities until 2050 as follows:
1. Maximizing the use of renewable energy; 2. Minimizing the use of oil; 3. Optimizing the utilization of natural gas; 4. Using coal as the reliable national energy
source; and 5. Consideration of nuclear as the last option.

IESR (Institute for Essential Services Reform) | www.iesr.or.id 8
Energy targets in Mid-term Development Plan 2015 - 2019
Indonesia long-term development plan, 2005-2025, is divided into four 5-year phases, each is governed by a Mid-term Development Plan (Rencana Pembangunan Jangka Menengah Nasional/ RPJMN) to provide changing governments with programmatic and political flexibility (ADB, 2016).
Mid-term Development Plan 2015-2019 reconfirms Indonesia’s commitments to strengthening its national energy security, by stating government’s energy related priorities.

IESR (Institute for Essential Services Reform) | www.iesr.or.id 9
Government ministries and agencies are involved in various areas of coal and electricity sector
COAL ELECTRICITY
Policy Making MEMR - DG Minerba, DEN CMEA, Bappenas, MOF, MOEF, MOI, MOT, MSOE, DEN
Licensing DG Minerba, Local Government DG Electricity, Local Government
Regulator DG Minerba DG Electricity
Operation SOEs, PSCs, Local companies, Cooperative communities
SOE (PLN), Captive Power, Cooperative communities
CMEA : Coordinating Ministry of Economic Affairs; MOF : Ministry of Finance; MOEF : Ministry of Environment and Forestry; MOI : Ministry of Industry; MOT : Ministry of Transportation; MSOE : Ministry of State-Owned Enterprises; Bappenas : State Ministry of National Development Planning; DG Minerba : Directorate General of Minerals and Coal; SOEs : State-owned Enterprises; PSCs : Production Sharing Contractors; DEN : National Energy Council
Source : ADB, 2015

IESR (Institute for Essential Services Reform) | www.iesr.or.id 10
Indonesia Coal Sector Overview: resource distribution, national production and coal’s contribution to the economy

IESR (Institute for Essential Services Reform) | www.iesr.or.id
4 provinces own 94% of Indonesia’s coal resources, the majority are low to medium quality
Kutai Basin is the largest, followed by South Sumatra and Barito. Among those basins, Ombilin and Bengkulu are the ones with high proportion of high-calorific-value reserves. Kutai, Tarakan, and Barito have mainly medium quality coal, while Central and South Sumatra basins have low quality coal (Rosyid & Adachi, 2016).
11
Quality of Indonesia coal resources
Coal resources distribution (in million tons)
In December 2017, Indonesia coal resources and reserves were 125 and 24 billion tons, respectively. In September 2018, MEMR announced an increase in resources and reserves to 166 and 37 billion tons (Oktaviani, 2018). Indonesia coal resources and reserves are dominated by low and medium quality coal (<5100 kcal/kg and 5100-6100 kcal/kg respectively). In 2016, 50% of Indonesian coal reserves had low calorific value while the other 37% had medium quality (Pusat Sumber Daya Mineral Batubara dan Panas Bumi, 2016). Geologically, coal in Indonesia is distributed in 7 main coal basins: Tarakan, Kutai, and Barito basins in eastern Kalimantan, and Ombilin, Bengkulu, Central Sumatra, and South Sumatra basins in Sumatra. Therefore, the majority of coal resources are located in those provinces (showed in brown and red in map).
IESR (Institute for Essential Services Reform) | www.iesr.or.id
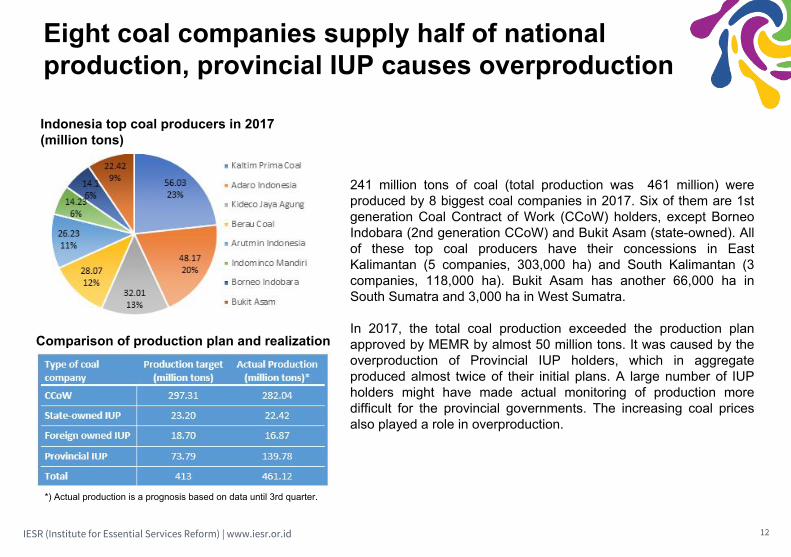
Eight coal companies supply half of national production, provincial IUP causes overproduction
241 million tons of coal (total production was 461 million) were produced by 8 biggest coal companies in 2017. Six of them are 1st generation Coal Contract of Work (CCoW) holders, except Borneo Indobara (2nd generation CCoW) and Bukit Asam (state-owned). All of these top coal producers have their concessions in East Kalimantan (5 companies, 303,000 ha) and South Kalimantan (3 companies, 118,000 ha). Bukit Asam has another 66,000 ha in South Sumatra and 3,000 ha in West Sumatra.
In 2017, the total coal production exceeded the production plan approved by MEMR by almost 50 million tons. It was caused by the overproduction of Provincial IUP holders, which in aggregate produced almost twice of their initial plans. A large number of IUP holders might have made actual monitoring of production more difficult for the provincial governments. The increasing coal prices also played a role in overproduction.
12
*) Actual production is a prognosis based on data until 3rd quarter.
Comparison of production plan and realization
Indonesia top coal producers in 2017 (million tons)

IESR (Institute for Essential Services Reform) | www.iesr.or.id
Coal minings have major contribution to local economy (Case of East Kalimantan Province)
13
With 247 million ton in 2017, East Kalimantan was the biggest coal producing province. This province’s economy has relied heavily on coal industry. Until 2014, the proportion of coal mining to regional GDP had increased steadily, before starting to decline. However, coal still contributed to 1/3 of the economy, while the second highest contributor, processing industry, only shared 20% of GDP in 2017. Consequently, it would be more difficult for this province to shift its economy away from coal since there are no other sectors that are ready to take over.
Source: Bappeda Kaltim

IESR (Institute for Essential Services Reform) | www.iesr.or.id
Coal and mineral mining only contribute to 2% of non-tax state revenue (PNBP)
14
The share of coal and mineral mining in PNBP has increased by threefold over 10 years. With the sudden drop in PNBP from oil and gas sector since 2016, the proportion of coal and mineral mining in PNBP has become higher. However, the contribution of PNBP to total state revenue had been declining from 36% in 2006 to only 14% in 2017. Therefore, the actual contribution of coal industries to state revenue was less than 2% in 2017, and will be even lower following the rapid increase in tax revenue.
According to Law No. 33/2004, the state revenue from natural resources should be distributed to local governments. For coal, the central government will take 20%, 16% goes to provincial government, 32% goes to the city/regency where the coal is extracted, and the rest to other cities/regencies in the same province.
IESR (Institute for Essential Services Reform) | www.iesr.or.id 15
Indonesia Power Sector Overview: CFPP development & increased coal consumption. Who will bear the risk?

IESR (Institute for Essential Services Reform) | www.iesr.or.id
Bottom-up approach in RUPTL formulation resulted in gaps with RUEN targets on installed capacity
16
The formulation process of RUPTL can be summarized as a bottom-up approach. PLN Head Office will supervise the whole RUPTL formulation process. Using data from RUKN, the head office will extract the basic assumption as well as policy on power sector development and impose a derivation of those into PLN Regional, PLN Distribution and PLN P2B. Then PLN regional and Distribution will be in charge of forecasting electricity demand in each province for the next 10 years. In the end, all the provincial electricity demand and plan will be consolidated in a workshop to formulate the RUPTL.
RUPTL Formulation Flow Process (Source: RUPTL, Interview PLN, Authors Compilation)
Comparison of RE Installed capacity of RUEN vs RUPTL
RUEN (bigger vertical bar) has targeted 45 GW of RE installed capacity by 2025, while the latest RUPTL (smaller vertical bar inside) only plans to get as high as 20 GW by 2025. Although PLN may have factored in the difference between past prediction and actual growth of electricity and economy which caused PLN to alter its development plan, it is clear from RUPTL statement that PLN’s objective is to gain economic benefit in short term by applying least cost principle in power plant development. Thus, it is expected that PLN will be increasing the share of “subsidized” CFPP instead of renewables in its development plan as CFPP is deemed as the least-cost power plant to built.

IESR (Institute for Essential Services Reform) | www.iesr.or.id
Government Assignment on Acceleration of Power Plant Development
Apart from the regular planning, PLN could get assigned by the government to accelerate power plant development. So far, there have been three power plant acceleration programs, with each was initiated in different presidential terms:
1. Fast Track Program 1 (2006)Stipulated under presidential regulation No. 71/2006, the government assigned PLN to construct 10 GW of CFPP which is yet to be completed until today.
2. Fast Track Program 2 (2010)The program was stipulated under presidential regulation no 4/2010 and has a total installed capacity of 17.5 GW which consists of 10.5 GW CFPP, 4.9 GW geothermal, 1.8 GW hydro, and 0.3 GW gas fired power plant.
3. 35000 MW Program (2016)This program was stipulated by Presidential regulation no. 4/2016 and amended by Presidential regulation no.14/2017. According to the energy minister on March 2018, around 20 GW of the power plant will be completed by 2019 instead of the initial target of 35 GW. This is also in anticipation of the country’s lower than expected economic and electricity growth rate.
17
Status of the three power plant acceleration program
PLN has reevaluated the programs and redistributed the allocation into 35000 MW and 7000 MW program. Some projects of FTP 2 belong to the 35000 MW program while the rest not included on the program is bundled into 7000 MW program which consists of remaining FTP 1 program, parts of FTP 2 and regular power plant development of PLN. COD target of both programs are adjusted accordingly to the electricity demand growth. According to PLN report on April 2018, 31 GW of 35000 MW program have signed PPA agreements, 17 GW are under construction, and 1.4 GW are in operation while for the 7000 MW program, about 6.4 GW have entered the operational phase.

IESR (Institute for Essential Services Reform) | www.iesr.or.id
Coal Consumption to Generate Electricity has been Increasing Over years
CFPP Renewables
An analysis from PLN statistic of CFPP shows that the coal consumption per electricity production has kept increasing over the last 15 years from 360 tonne/GWh in 2002 to 520 tonne/GWh in 2017, a significant 44% increase. During the same period, PLN has tripled its CFPP fleet capacity from 6.9 GW to 19.5 GW. Some factors that may have caused this inefficiency are the inefficient operation of CFPP and/or the use of lower quality coal than required in the CFPP.A steeper increase of coal consumption is observed between 2009 and 2012 which coincides with COD of most of the FTP-1 projects. Nine out of ten projects of FTP-1 in Java were built by EPC contractor from China and have been reported to have low performance to date.
PT PLN CFPP Coal Consumption per electricity production (Tonne/GWh)
18

IESR (Institute for Essential Services Reform) | www.iesr.or.id
CFPPs from FTP-1 Program are Overshadowed with Low Performance
CFPP in Java built by Chinese EPC have suffered a low performance with the lowest reported EAF at 11%. The performance has seen improvement over the years but the average is still lower than other CFPP (with average EAF > 80%)During its early operational period, most of the power plants built by Chinese contractors faced various technical problems, particularly in supporting components or balance of plant (BOP) such as the boiler fan and motor. This had caused the CFPP performance to drop and disrupted PLN’s general operation.
Equivalent Availability Factor of FTP-1 Projects built by Chinese Contractor
19

IESR (Institute for Essential Services Reform) | www.iesr.or.id
In the future, consumers may have to bear the burden of increasing CFPP cost
Based on RUPTL 2018-2027, PLN will own and finance ~30% of the planned installed capacity for the next 10 years, while 58% of the project are already allocated for Independent Power Producer (IPP) to build, and the remaining 12% is yet to be allocated. The figures for CFPP is even more tilted toward IPP side as almost 84% of the investments for CFPP are expected to come from IPP. Moreover, the mine-mouth CFPP is 100% allocated to IPP. Therefore, most of the PLN electricity generation in the future will be coming from the IPP.
Distribution of IPP an PLN Power Plant Project Allocation 2018-2027
IEEFA forecasted that PLN’s expenses on electricity purchase will increase by YoY 37.1% and 42.4% in 2020 and 2021. The slow growth in electricity sales (7.8% and 7.6%) has resulted in red financial statement that can burden the government budget. Therefore, the electricity subsidy budget will have to increase from IDR 45.7 trillion (USD 3.6 billion USD) in 2017 to as much as IDR 133.7 trillion (USD 9.5 billion) in 2021.The question remains on who will bear the burden of this subsidy increase. Will it be borne by the government (subsidy) or consumers (increase in electricity tariffs)?
20
Forecast of PLN Revenue vs Operational Expenses (Source:IEEFA)

IESR (Institute for Essential Services Reform) | www.iesr.or.id 21
Coal : misconception, global trend and meeting the NDC

IESR (Institute for Essential Services Reform) | www.iesr.or.id
The view of coal as cheap source of electricity is an indifferent view looking only at the end cost of electricity generation. Looking at the upstream level, the coal mining industry received subsidies of 946.1 million USD in 2014 and 644.8 million USD in 2015 through loan guarantee, export tax exemption, and preferential royalties & tax rates (Attwood et al. 2017). Moreover, at downstream level the government regulates the coal price for domestic electricity consumption through Ministerial Decree 1395/30/MEM/2018 at 70 USD per
Coal is considered cheap while renewable is expensive
Comparison of coal vs renewable cost which factors in the external cost
CFPP Renewables
tonne until December 2019, a significant 30% reduction from current market price at around 100 USD. The policy is taken to support the government commitment to not raising electricity tariffs until the end of 2019 (when the presidential election is held) and to save PLN from suffering financial losses due to increasing electricity cost of generation. On the other hand, the renewable energy development suffers from subsidies removal as the feed-in-tariff scheme is replaced by the Ministerial Regulation 50/2017. The MEMR has recently admitted that the regulation has become a hindrance to renewable energy development in the country. Thus, the unlevel playing field for renewables has contributed to the perception of coal as a cheaper energy source.However, there is a significant advantage of renewables over coal as renewables provide lower environment and health impacts. If we factor in these impacts as external costs of coal power, it is estimated that the cost of coal-based generation can be double in value and surpass the renewable cost by around 4 cent USD/kWh.
22

IESR (Institute for Essential Services Reform) | www.iesr.or.id
Key Directives of KEN & RUEN in Power Sector: Increasing Share of Renewables & Efficient CFPP
23
RUEN share of Fossil Fuel vs Renewable Power Plant Installed Capacity (GW)
In 2014, through Government Regulation/Peraturan Pemerintah (PP) No. 79/2014, the National Energy Policy (KEN) was prepared to give narratives on national energy management to fulfill national goal of energy security and independence by means of three principles: equitable, sustainable and environmentally sound. KEN has a purpose to change the paradigm of energy resources utilization in Indonesia, from an export commodity, into asset for national development through industrial development.
The General Planning of National Energy (RUEN) is an elaboration of KEN and reference for formulation of RUKN and RUPTL. RUEN puts renewable energy development in a higher priority compared to fossil fuels. Coal-fired power plant (CFPP) is still projected to have a significant and stable share (~60%) of fossil fuel installed power capacity. However the coal consumption per GW installed capacity in CFPP is expected to decline from 3.2 into 2.8 and 2 million tonnes/GW by 2025 and 2030 as the utilization of Clean Coal Technology is expected to increase.
Ratio of CFPP Coal Consumption to Installed Capacity (Million Tonne/GW)

IESR (Institute for Essential Services Reform) | www.iesr.or.id
Coal share in global energy mix is projected to decline, while renewables grow
Based on International Energy Agency (IEA) 2017 data, coal share in the global energy mix is projected to decline from 5,743 Mtce in 2016 to 5,530 Mtce in 2022, specifically, coal demand will decline in Europe, United States and China, the largest coal consumers by far. On the contrary, in India, Southeast Asia and few other countries in Asia, coal demand will slightly increase (IEA, 2017a).
24
Source: IEA, 2017a Source: IEA, 2017b
Contrary to the coal, renewables-based generation is projected to grow. The share of renewables in power generation will reach 30% in 2022, up from 24% in 2016. The IEA report also indicates that solar PV and wind will contribute the most to the renewable capacity growth by 2022 (IEA, 2017b).

IESR (Institute for Essential Services Reform) | www.iesr.or.id
Climate change influences the economic of all countries, and Indonesia is no exception
25
In Indonesia, climate change is believed to increase the risk for hydro-meteorological disasters, which make up to 80% of disaster occurrences. To reduce its vulnerability against climate change, Indonesia must integrate its adaptation and mitigation efforts in its development planning and implementation.
According to World Resources Institute report, Greenhouse Gas (GHG) emissions in Indonesia from 2000 to 2012 had increased from almost all sectors. Emissions from energy had increased by 70 percent, waste by 60 percent and agriculture by 17 percent.
On average, the energy sector's emissions increased faster than land-based emission, at an average annual rate of 4.5 percent compared to 2.7 percent (World Resources Institute [WRI], 2017b). As the world's fifth-largest emitter of greenhouse gases and the largest contributor of forest-based emissions, Indonesia's success in achieving its national climate commitment will be critical to keeping the planet's temperature rise below 2 degrees as mandated by the Paris Agreement (WRI, 2017a) and to comply with its Nationally Determined Contribution (NDC).

IESR (Institute for Essential Services Reform) | www.iesr.or.id
GHG Emission Level in NDC is too high for reaching the 2°C target, let alone the 1.5°C target
26
Climate Action Tracker (CAT), an independent scientific analysis, reported in mid-2018 that maximum allowed GHG Emission Level (excluding land use, land-use change, and forestry/ LULUCF) for Indonesia in 2030 to be compatible with 2°C target is 1,075 and with 1.5°C is 523 Mt CO2e. In this scenario, the maximum emission levels in 2030 for power plant are 262.5 for 2°C target and 127.7 for 1.5°C target. However, Indonesia’s GHG Emission Level in the NDC is too high for reaching both the values for the 2°C target, let alone the 1.5°C target. To reach the 1.5°C target, there will be 18.4 GW overcapacity of CFPP in 2020, 35.6 GW in 2025 and 41.5 GW in 2030.

IESR (Institute for Essential Services Reform) | www.iesr.or.id
References
27
Attwood, Clem; Bridle, Richard; Gass, Philip; Halimanjaya, Aidy S.; Laan, Tara; Lontoh, Lucky et al. (2017). Financial Supports for Coal and Renewables in Indonesia. GSI Report. IISD-GSI. Retrieved from https://www.iisd.org/sites/default/files/publications/financial-supports-coal-renewables-indonesia.pdf
ADB. (2015). Summary of Indonesia’s Energy Sector Assessment. Retrieved from https://www.adb.org/sites/default/files/publication/178039/ino-paper-09-2015.pdf
ADB. (2016). Indonesia: Energy Sector Assessment: Asian Development Bank. Retrieved from https://www.adb.org/sites/default/files/institutional-document/189713/ino-energy-asr.pdf
Bappeda Kaltim. (n.d.). Kontribusi Sektor terhadap PDRB. Retrieved from http://sidata.kaltimprov.go.id/index.php/dataprofil/dataku/326
DEN, Danish Embassy, Danish Energy Agency. (2017). Technology Data for the Indonesian Power Sector. Catalogue for Generation and Storage of Electricity.
IEA. (2017a). Coal 2017. Retrieved from IEA website: https://www.iea.org/coal2017/
IEA. (2017b). Renewables 2017. Retrieved from IEA website: https://www.iea.org/Textbase/npsum/renew2017MRSsum.pdf
Oktaviani, K. (2018). Rekonsiliasi Data, Sumber Daya Batubara Indonesia Kini 166 Miliar Ton, Cadangan 37 Miliar Ton. Ministry of Energy and Mineral Resources.
Pusat Sumber Daya Mineral Batubara dan Panas Bumi. (2016). Pemutakhiran Data dan Neraca Sumber Daya Energi Tahun 2016.
Rosyid, F. A., & Adachi, T. (2016). Forecasting on Indonesian Coal Production and Future Extraction Cost: A Tool for Formulating Policy on Coal Marketing. Natural Resources, 07(12), 677–696. https://doi.org/10.4236/nr.2016.712054
World Resources Institute. (2017a). Evaluating Indonesia’s Progress on its Climate Commitments.
World Resources Institute. (2017b). How Can Indonesia Achieve Its Climate Change Mitigation Goal? An Analysis of Potential Emissions Reductions from Energy and Land-Use Policies.

IESR (Institute for Essential Services Reform) | www.iesr.or.id
Institute for Essential Services ReformJalan Tebet Barat Dalam VIII No. 20BJakarta Selatan 12810 | IndonesiaT: +62 21 2232 3069 | F: +62 21 8317 073www.iesr.or.id | [email protected]
28