the fundamentals of route development · cost/asm (casm) of $4.85 cents. • when rasm exceeds casm...
TRANSCRIPT

THE FUNDAMENTALS OF
ROUTE DEVELOPMENT
UNDERSTANDING AIRLINES
MODULE 3

asm-global.com
MODULE 3 MODULE 3 OBJECTIVES
• Why are the different airline types?
• What are the different airline costs?
• What is the planning process and how does it differ for different airlines?
asm-global.com
MODULE 3 AIRLINE ISSUES
• Low margins
• Fuel price uncertainty
• Vulnerability to economic downturn
• Unpredictable one-time events
• High profits of airports

asm-global.com
MODULE 3 AIRLINES ISSUES
• Network carriers (single hub)
- Etihad, Emirates
• Network carriers (multiple hubs)
- United, American Airlines
• Point-to-point regionals
- Flybe
• Regional feeder services
- Silk air
• Capacity purchase agreements
- Sky Regional
FSCs
asm-global.com
MODULE 3 UNDERSTANDING AIRLINES
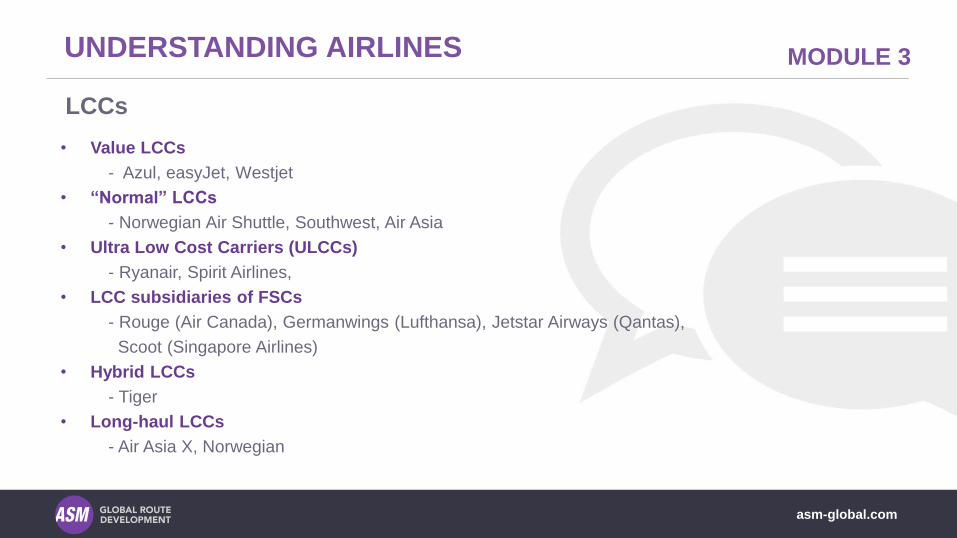
• Value LCCs
- Azul, easyJet, Westjet
• “Normal” LCCs
- Norwegian Air Shuttle, Southwest, Air Asia
• Ultra Low Cost Carriers (ULCCs)
- Ryanair, Spirit Airlines,
• LCC subsidiaries of FSCs
- Rouge (Air Canada), Germanwings (Lufthansa), Jetstar Airways (Qantas),
Scoot (Singapore Airlines)
• Hybrid LCCs
- Tiger
• Long-haul LCCs
- Air Asia X, Norwegian
LCCs

asm-global.com
MODULE 3 UNDERSTANDING AIRLINES
• Vertically integrated carriers
- TUI Group
- Thomas Cook Group: Condor
• Part-vertically integrated carriers
- Air Transat
• Non-vertically integrated carriers
- Enter Air
• ACMI operators (Aircraft, Crew, Maintenance, Insurance)
- Omni Air, Dynamic
CHARTER
asm-global.com
MODULE 3 UNDERSTANDING AIRLINES
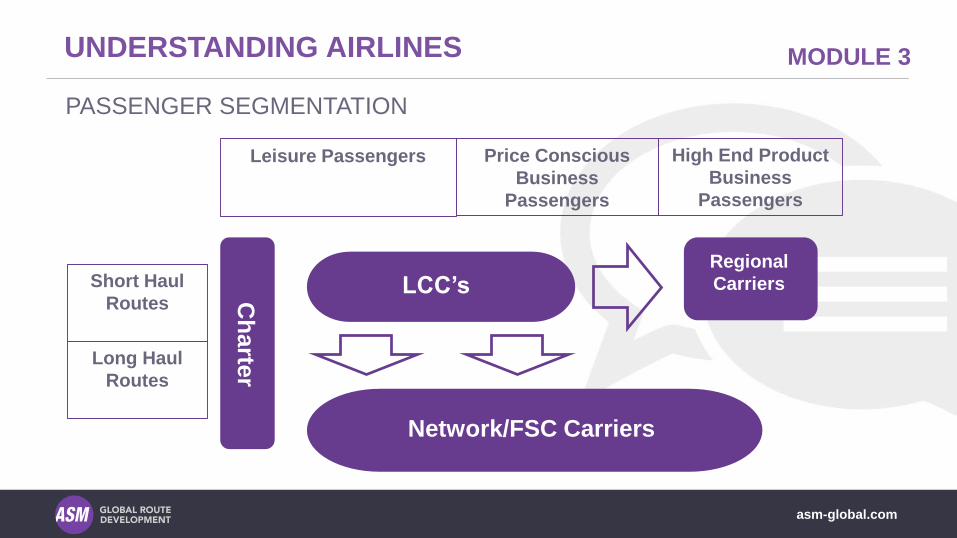
PASSENGER SEGMENTATION
Leisure Passengers Price Conscious
Business
Passengers
High End Product
Business
Passengers
Short Haul
Routes
Long Haul
Routes
LCC’s
Network/FSC Carriers
Regional
CarriersCh
arte
rC
harte
r
asm-global.com
MODULE 3 UNDERSTANDING AIRLINES
Ch
arte
r
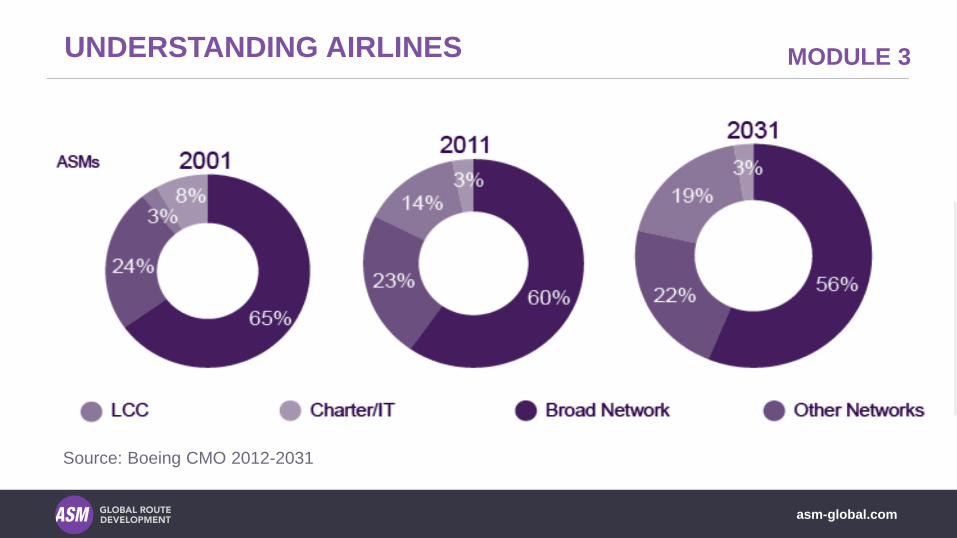
Source: Boeing CMO 2012-2031

asm-global.com
MODULE 3 LCC MARKET SHARE
North Asia LCC Seat only 9.5%
South East Asia 50%
1020 aircraft order from the three
largest LCCs in Asia
Development of Pan Asia LCC brands
% of Low Cost Seats by Region (2013)
Source: Innovata

asm-global.com
MODULE 3 UNDERSTANDING AIRLINES
AIRLINE COSTS
Operating costs + aircraft ownership + overhead costs
VARIABLE
OPERATING
COSTS
AIRCRAFT
OWNERSHIP
OVERHEAD

asm-global.com
MODULE 3 UNDERSTANDING AIRLINES
AIRLINE COSTS
Variable Operating Costs (directly tied to flying)
Fuel Aviation fuel, oil
Direct labour Salaries & benefits of flight crew, airport sales and ramp
staff
Crew cycle expenses Flight and cabin crew layover costs
Maintenance Cycle or block hour driven maintenance costs
Airport & en-route charges Landing fees, handling , navigation fees
Distribution costs GDS charges, commissions
Passenger service Catering, passenger insurance
asm-global.com
MODULE 3 UNDERSTANDING AIRLINES
AIRLINE COSTS
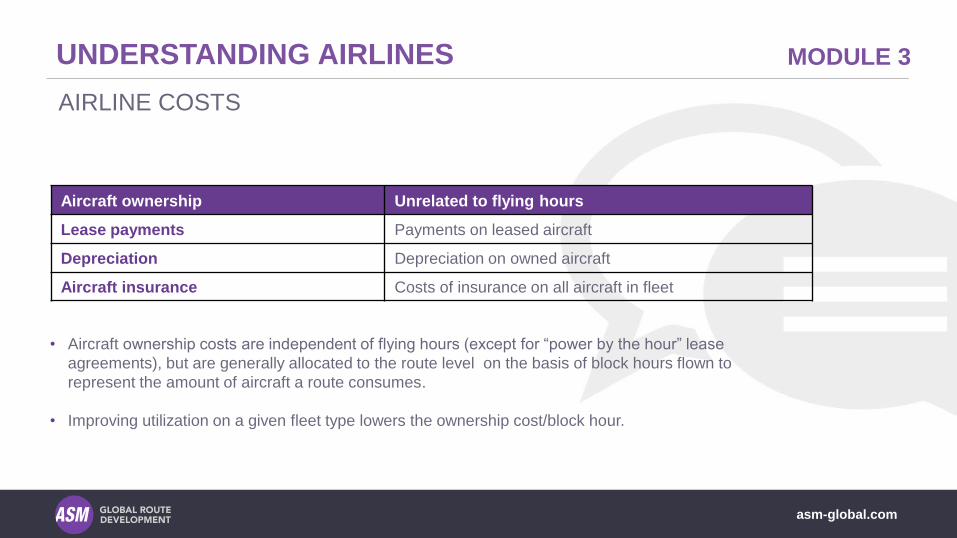
Aircraft ownership Unrelated to flying hours
Lease payments Payments on leased aircraft
Depreciation Depreciation on owned aircraft
Aircraft insurance Costs of insurance on all aircraft in fleet
• Aircraft ownership costs are independent of flying hours (except for “power by the hour” lease
agreements), but are generally allocated to the route level on the basis of block hours flown to
represent the amount of aircraft a route consumes.
• Improving utilization on a given fleet type lowers the ownership cost/block hour.

asm-global.com
MODULE 3 UNDERSTANDING AIRLINES
AIRLINE COSTS
Types of Aircraft Ownership Scenarios Description
Purchase cost depreciation Straight line over 10-15 years
“Wet” leaseAircraft operated under the AOC of the lessor. Includes flight crew,
cabin crew, maintenance, insurance (ACMI)
“Damp” lease Same as wet lease except cabin crews provided by lessee
“Dry” leaseAircraft operated under the AOC of the lessee. Lessor provides
aircraft, lessee provides crew, maintenance & insurance
“Power by the hour” lease
Same as dry lease in that lessee provides crew, maintenance &
insurance but lessee pays lessor only for block hours flown vs. a
monthly lease rate
Operating lease 2-7 years, off balance sheet, ownership remains with lessor
Finance/Capital lease
Typically >75% of aircraft useful working life
Viewed as a purchase on balance sheet
Ownership eventually transferred to airline
asm-global.com
MODULE 3 UNDERSTANDING AIRLINES
AIRLINE COSTS
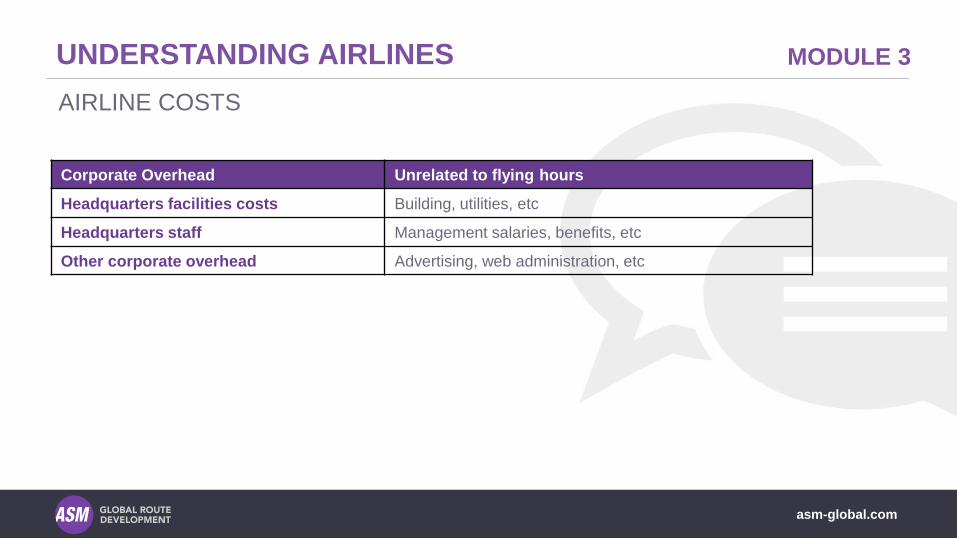
Corporate Overhead Unrelated to flying hours
Headquarters facilities costs Building, utilities, etc
Headquarters staff Management salaries, benefits, etc
Other corporate overhead Advertising, web administration, etc
asm-global.com
MODULE 3 UNDERSTANDING AIRLINES: EXAMPLES
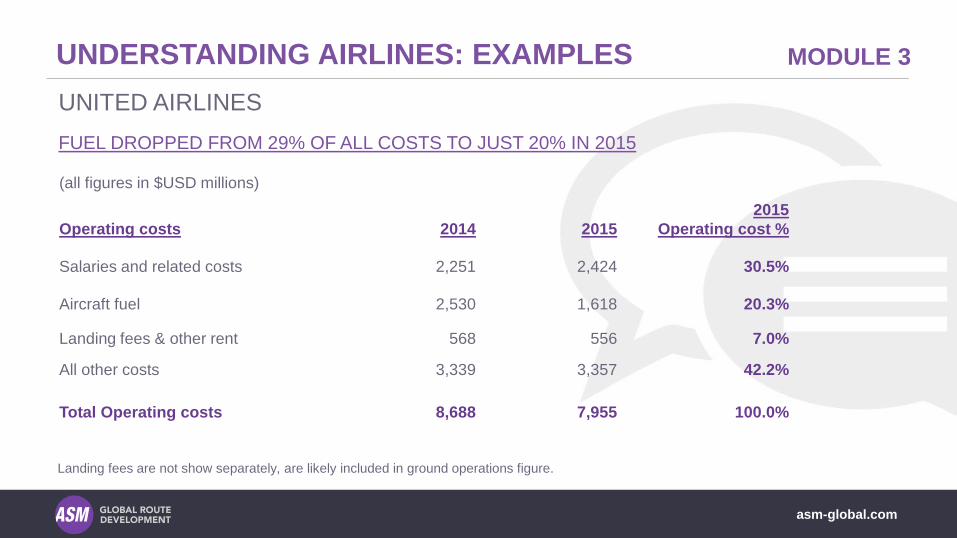
UNITED AIRLINES
Landing fees are not show separately, are likely included in ground operations figure.
(all figures in $USD millions)
Operating costs 2014 2015
2015
Operating cost %
Salaries and related costs 2,251 2,424 30.5%
Aircraft fuel 2,530 1,618 20.3%
Landing fees & other rent 568 556 7.0%
All other costs 3,339 3,357 42.2%
Total Operating costs 8,688 7,955 100.0%
FUEL DROPPED FROM 29% OF ALL COSTS TO JUST 20% IN 2015
asm-global.com
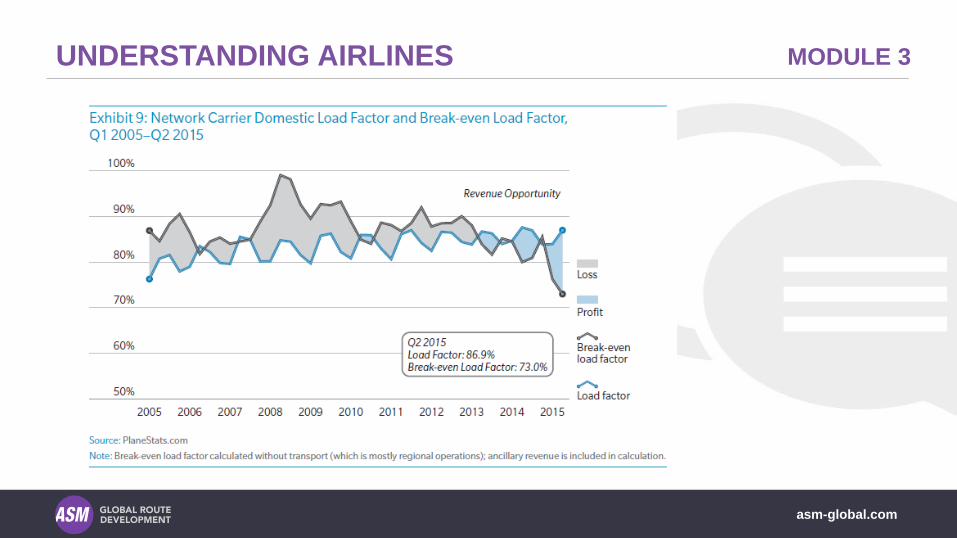
MODULE 3 UNDERSTANDING AIRLINES
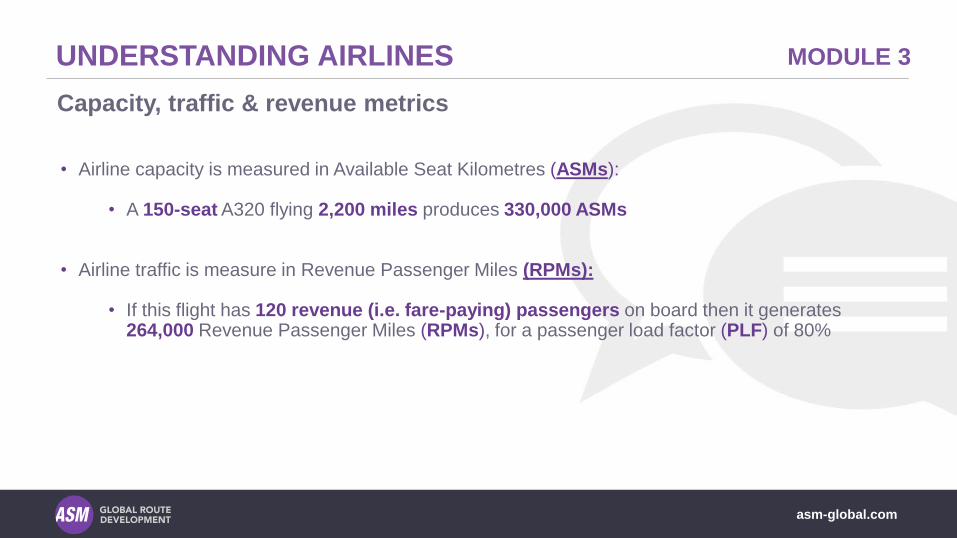
• Airline capacity is measured in Available Seat Kilometres (ASMs):
• A 150-seat A320 flying 2,200 miles produces 330,000 ASMs
• Airline traffic is measure in Revenue Passenger Miles (RPMs):
• If this flight has 120 revenue (i.e. fare-paying) passengers on board then it generates 264,000 Revenue Passenger Miles (RPMs), for a passenger load factor (PLF) of 80%
Capacity, traffic & revenue metrics
asm-global.com
MODULE 3 UNDERSTANDING AIRLINES
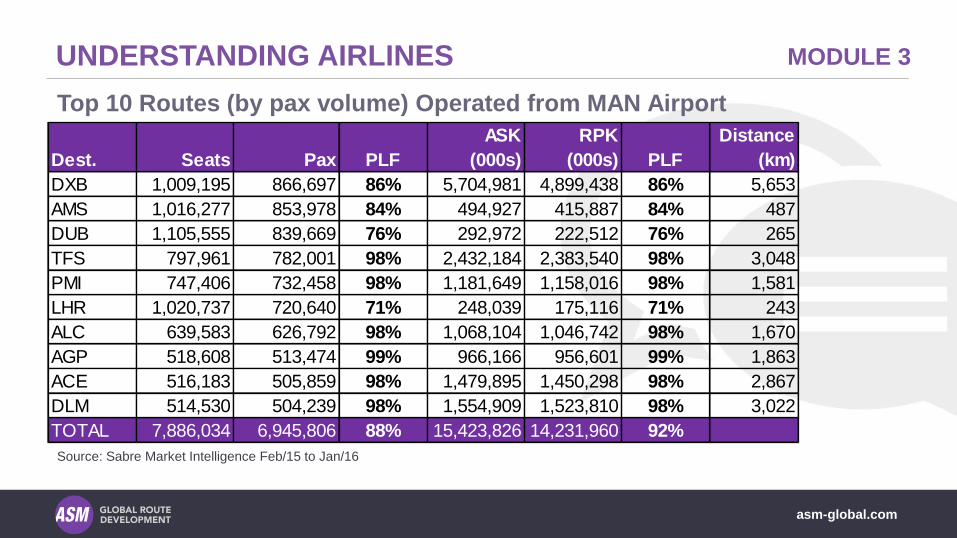
Top 10 Routes (by pax volume) Operated from MAN Airport
Source: Sabre Market Intelligence Feb/15 to Jan/16
Dest. Seats Pax PLF
ASK
(000s)
RPK
(000s) PLF
Distance
(km)
DXB 1,009,195 866,697 86% 5,704,981 4,899,438 86% 5,653
AMS 1,016,277 853,978 84% 494,927 415,887 84% 487
DUB 1,105,555 839,669 76% 292,972 222,512 76% 265
TFS 797,961 782,001 98% 2,432,184 2,383,540 98% 3,048
PMI 747,406 732,458 98% 1,181,649 1,158,016 98% 1,581
LHR 1,020,737 720,640 71% 248,039 175,116 71% 243
ALC 639,583 626,792 98% 1,068,104 1,046,742 98% 1,670
AGP 518,608 513,474 99% 966,166 956,601 99% 1,863
ACE 516,183 505,859 98% 1,479,895 1,450,298 98% 2,867
DLM 514,530 504,239 98% 1,554,909 1,523,810 98% 3,022
TOTAL 7,886,034 6,945,806 88% 15,423,826 14,231,960 92%
asm-global.com
MODULE 3 UNDERSTANDING AIRLINES
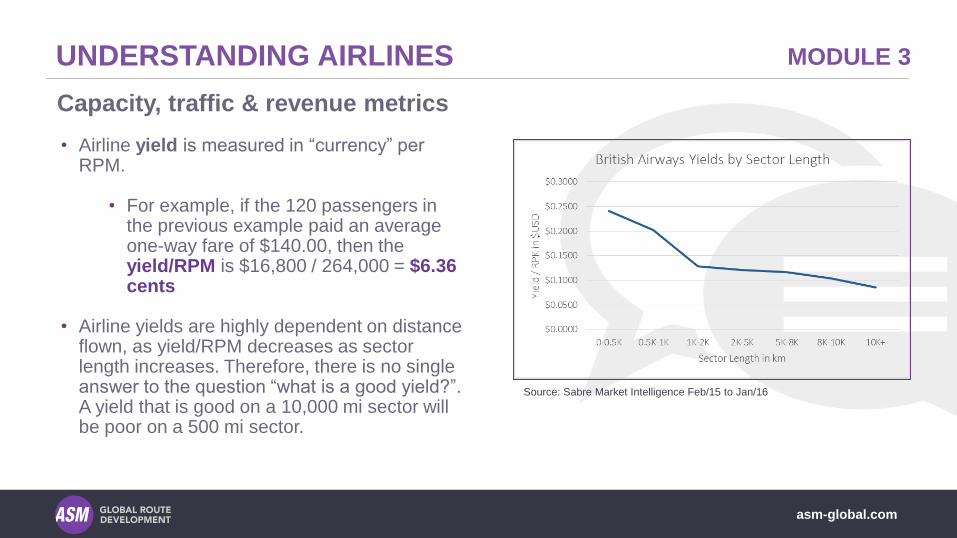
• Airline yield is measured in “currency” per RPM.
• For example, if the 120 passengers in the previous example paid an average one-way fare of $140.00, then the yield/RPM is $16,800 / 264,000 = $6.36 cents
• Airline yields are highly dependent on distance flown, as yield/RPM decreases as sector length increases. Therefore, there is no single answer to the question “what is a good yield?”. A yield that is good on a 10,000 mi sector will be poor on a 500 mi sector.
Capacity, traffic & revenue metrics
Source: Sabre Market Intelligence Feb/15 to Jan/16
asm-global.com
MODULE 3 UNDERSTANDING AIRLINES
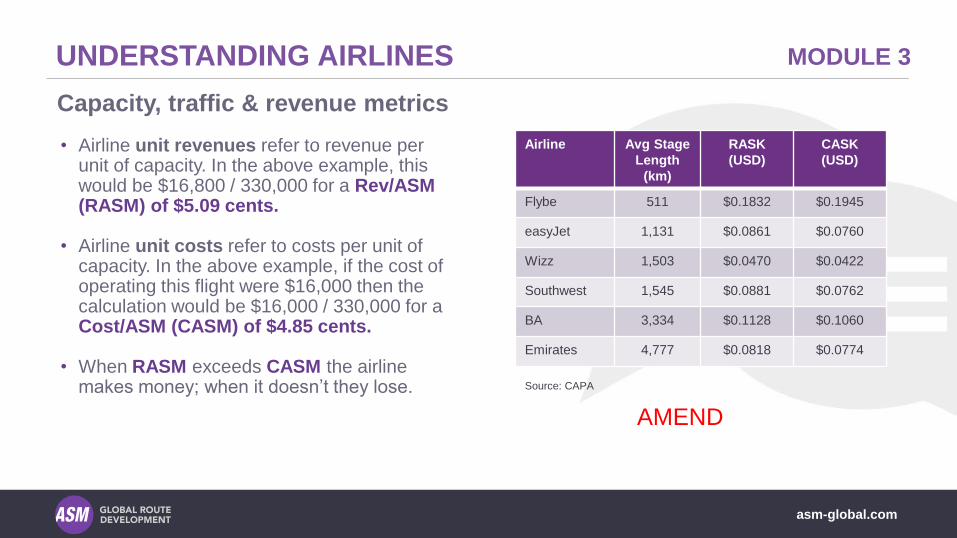
• Airline unit revenues refer to revenue per unit of capacity. In the above example, this would be $16,800 / 330,000 for a Rev/ASM (RASM) of $5.09 cents.
• Airline unit costs refer to costs per unit of capacity. In the above example, if the cost of operating this flight were $16,000 then the calculation would be $16,000 / 330,000 for a Cost/ASM (CASM) of $4.85 cents.
• When RASM exceeds CASM the airline makes money; when it doesn’t they lose.
Capacity, traffic & revenue metrics
Airline Avg Stage
Length
(km)
RASK
(USD)
CASK
(USD)
Flybe 511 $0.1832 $0.1945
easyJet 1,131 $0.0861 $0.0760
Wizz 1,503 $0.0470 $0.0422
Southwest 1,545 $0.0881 $0.0762
BA 3,334 $0.1128 $0.1060
Emirates 4,777 $0.0818 $0.0774
Source: CAPA
AMEND
asm-global.com
MODULE 3 UNDERSTANDING AIRLINES
asm-global.com
MODULE 3 UNDERSTANDING AIRLINES
asm-global.com
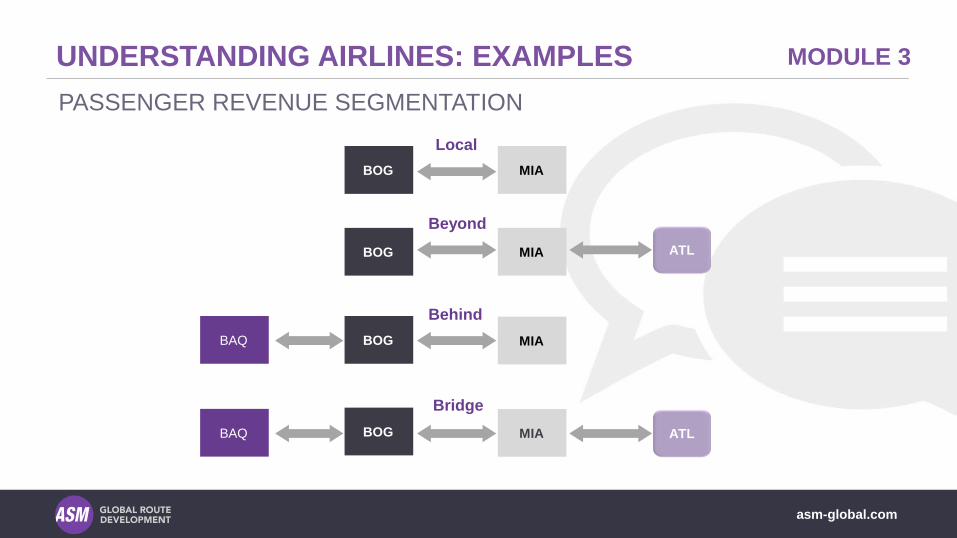
MODULE 3 UNDERSTANDING AIRLINES: EXAMPLES
PASSENGER REVENUE SEGMENTATION
Beyond
ATL
Behind
Bridge
ATL
MIA
MIA
MIA
MIABOG
BOG
BOG
BOG
BAQ
BAQ
Local

asm-global.com
MODULE 3 UNDERSTANDING AIRLINES
• Combination of processes, analysis, techniques to ensure air routes are full, but equally as
important to maximise the revenue
• Highly automated, real-time monitoring and adjustment of sold inventory
• Inelastic demand – certainty of volumes irrespective of costs (within reason). Occurs typically
at peak periods such as holidays, summer peak.
• Elastic demand – price stimulated
• Yield management skill lies in correctly, continually, drawing the inelastic/elastic line
• Leg based yield management systems focus on maximizing revenue at the route/flight
leg level
• O&D based yield management systems focus on maximizing network revenue
REVENUE MANAGEMENT
asm-global.com
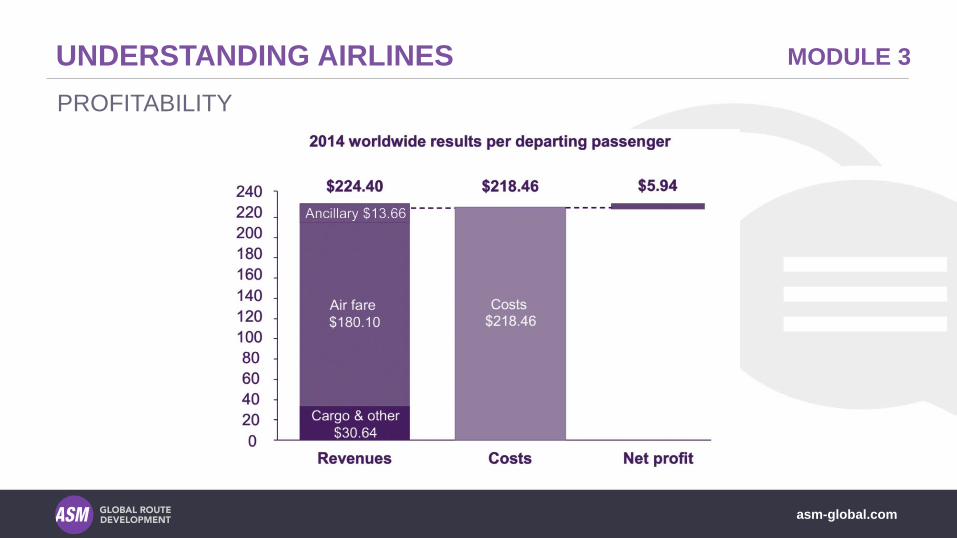
MODULE 3 UNDERSTANDING AIRLINES
PROFITABILITY

asm-global.com
MODULE 3 UNDERSTANDING AIRLINES
MANAGEMENT STRUCTURES
Network Planning
Top Tier –”C” Level
Sales & Distribution
Commercial / Partnership
management
Revenue management
asm-global.com
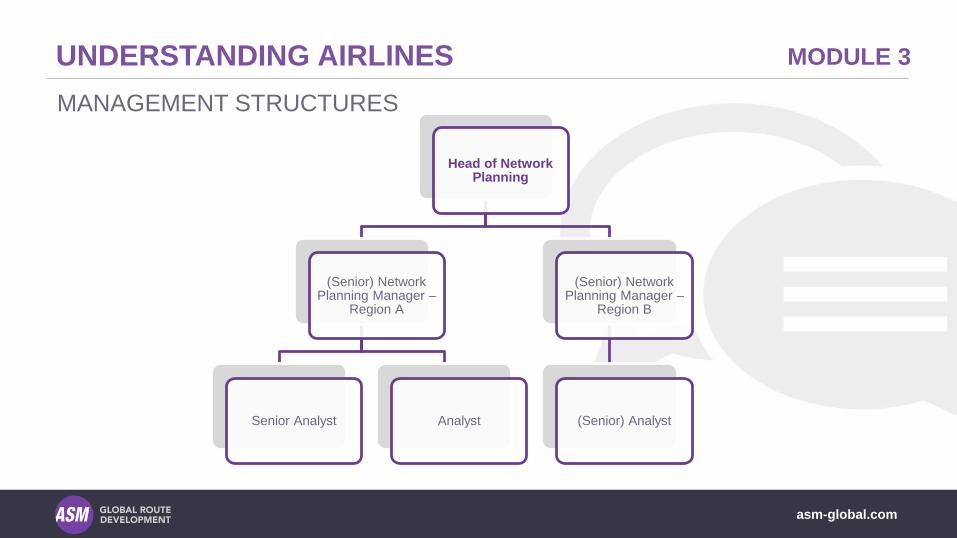
MODULE 3 UNDERSTANDING AIRLINES
MANAGEMENT STRUCTURES
Head of Network Planning
(Senior) Network Planning Manager –
Region A
Senior Analyst Analyst
(Senior) Network Planning Manager –
Region B
(Senior) Analyst
asm-global.com
MODULE 3 UNDERSTANDING AIRLINES
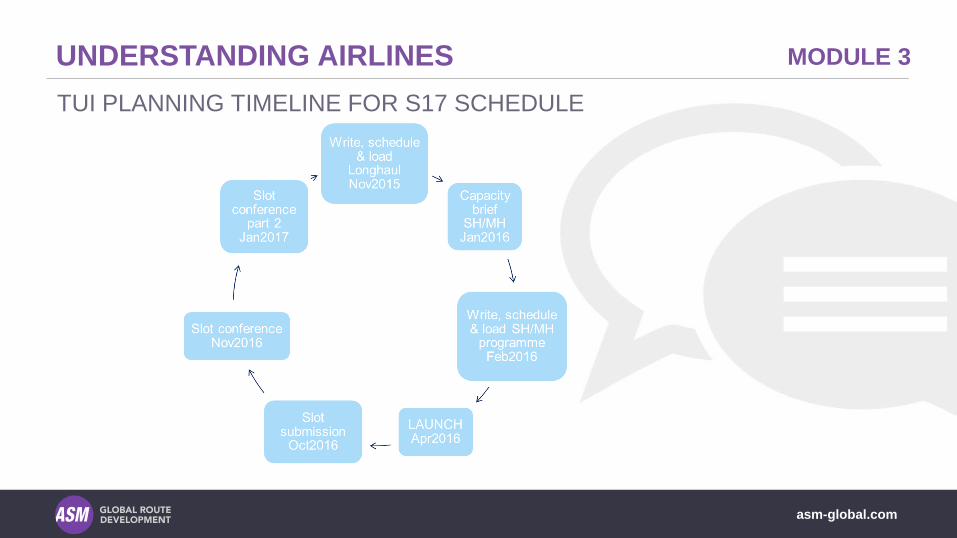
TUI PLANNING TIMELINE FOR S17 SCHEDULE
asm-global.com
MODULE 3 UNDERSTANDING AIRLINES
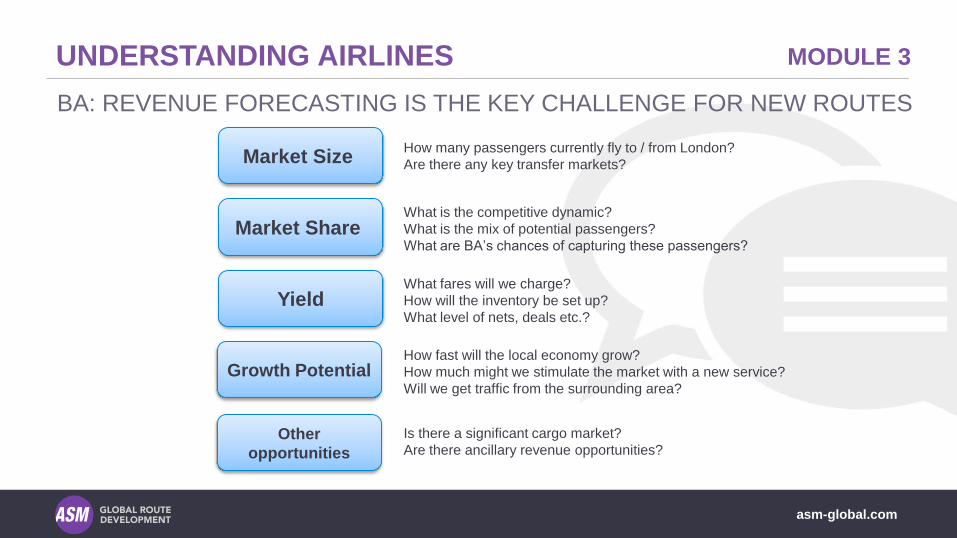
BA: REVENUE FORECASTING IS THE KEY CHALLENGE FOR NEW ROUTES
Market Size
Market Share
Yield
Growth Potential
Other
opportunities
How many passengers currently fly to / from London?
Are there any key transfer markets?
What is the competitive dynamic?
What is the mix of potential passengers?
What are BA’s chances of capturing these passengers?
What fares will we charge?
How will the inventory be set up?
What level of nets, deals etc.?
How fast will the local economy grow?
How much might we stimulate the market with a new service?
Will we get traffic from the surrounding area?
Is there a significant cargo market?
Are there ancillary revenue opportunities?

asm-global.com
MODULE 3 UNDERSTANDING AIRLINES
BA: OPERATIONAL CHALLENGES PLAY A MAJOR ROLE IN FEASIBILITY
CrewingDo we have enough Pilots
and Cabin Crew?
Engineering
Which aircraft need to be
maintained and when?
Airport Infrastructure
Can the airport take the
required aircraft?
Catering
Is there enough galley space
for the length of the flight?
Keeping T5 Working Are we scheduling too many
departures at T5 at the same
time?
Customer ServiceDo we have a ground handling
arrangement in place?
SlotsDo we have the required slots at
both ends of the route?
SchedulingDo we have enough spare
aircraft time on the fleet?
asm-global.com
MODULE 3 SUMMARY
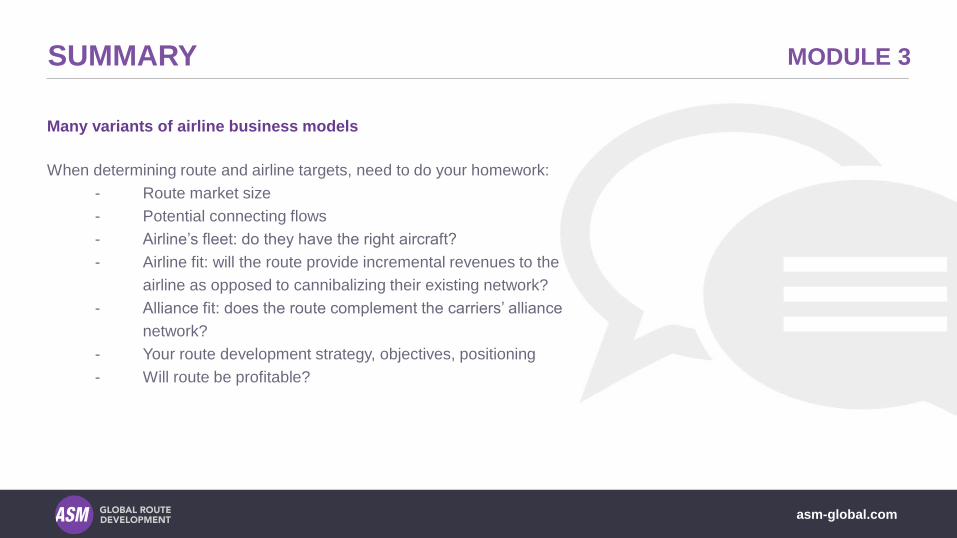
Many variants of airline business models
When determining route and airline targets, need to do your homework:
- Route market size
- Potential connecting flows
- Airline’s fleet: do they have the right aircraft?
- Airline fit: will the route provide incremental revenues to the
airline as opposed to cannibalizing their existing network?
- Alliance fit: does the route complement the carriers’ alliance
network?
- Your route development strategy, objectives, positioning
- Will route be profitable?