the fundamentals of mtf, wiener spectra, and dqe · the fundamentals of mtf, wiener spectra, ......
TRANSCRIPT
The Fundamentals of MTF, Wiener Spectra, and DQE
Robert M Nishikawa
Kurt Rossmann Laboratories for Radiologic Image ResearchDepartment of Radiology, The University of Chicago
Motivation
Goal of radiology: to diagnosis and treat disease by
Role of Medical Physicist: to help maximize patient benefit while minimizing the cost of the diagnostic imaging study
e.g. diagnostic information vs.. radiation dose
comparison of methods or systems
computed radiography vs. plain film
MRI vs. US

Motivation
Two steps in the radiologic process:
1. image production and display
physical measures (MTF, NPS, NEQ, DQE)
2. image interpretation
observer studies (ROC)
Physical Measures of Image Quality
What is a good (or valid) measure of image quality?

image of a mammogram
series of images(rose 1)

Perceived Image Quality is Proportional to SNR
AQSNR = C
where: SNR = signal-to-noise ratioC = image contrast of the objectA = area of the objectQ = number of quanta per unit area
Outline of Talk
Image Quality Metrics
what are they?
what do they mean?
how are they determined?
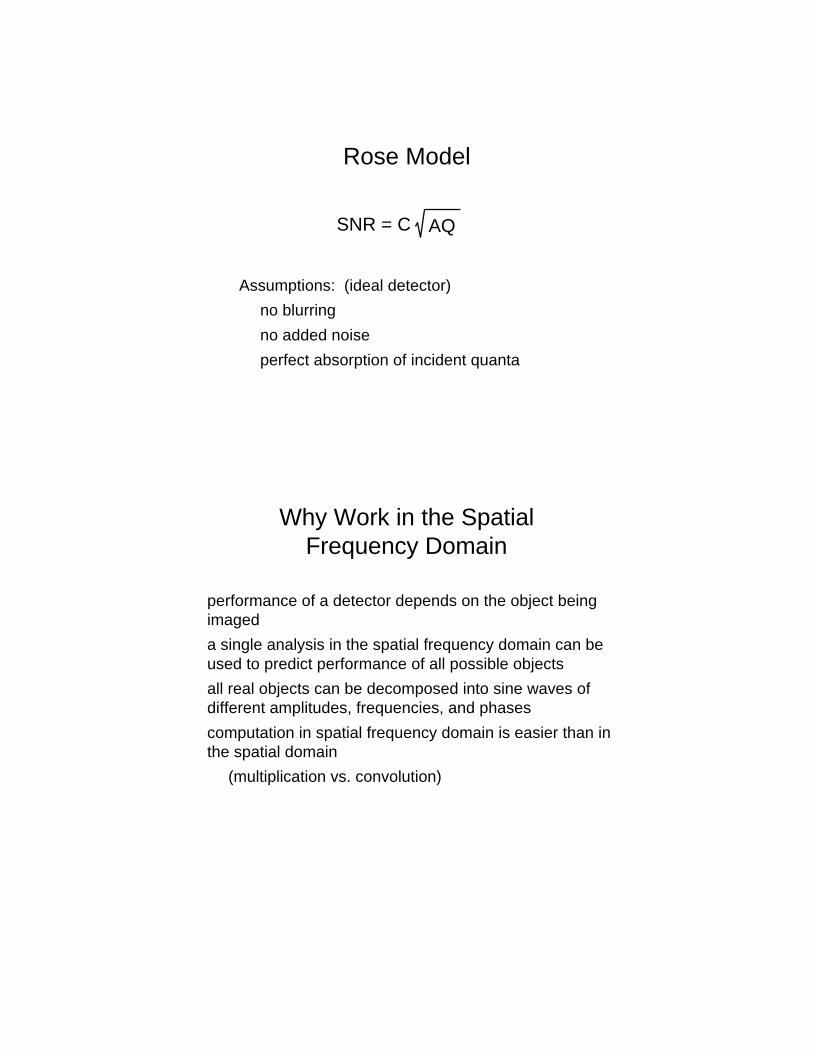
Rose Model
Assumptions: (ideal detector)
no blurring
no added noise
perfect absorption of incident quanta
AQSNR = C
Why Work in the Spatial Frequency Domain
performance of a detector depends on the object being imaged
a single analysis in the spatial frequency domain can be used to predict performance of all possible objects
all real objects can be decomposed into sine waves of different amplitudes, frequencies, and phases
computation in spatial frequency domain is easier than in the spatial domain
(multiplication vs. convolution)

Spatial Resolution
can be characterized by limiting resolution
measured using bar pattern
a more complete description is given by modulation transfer function (MTF)
image
rossmann beads and needles
need MTF for intermediate freq; limiting resolution is for high freq only
Outline of Talk
Image Quality Metrics
what are they?
what do they mean?
how are they determined?
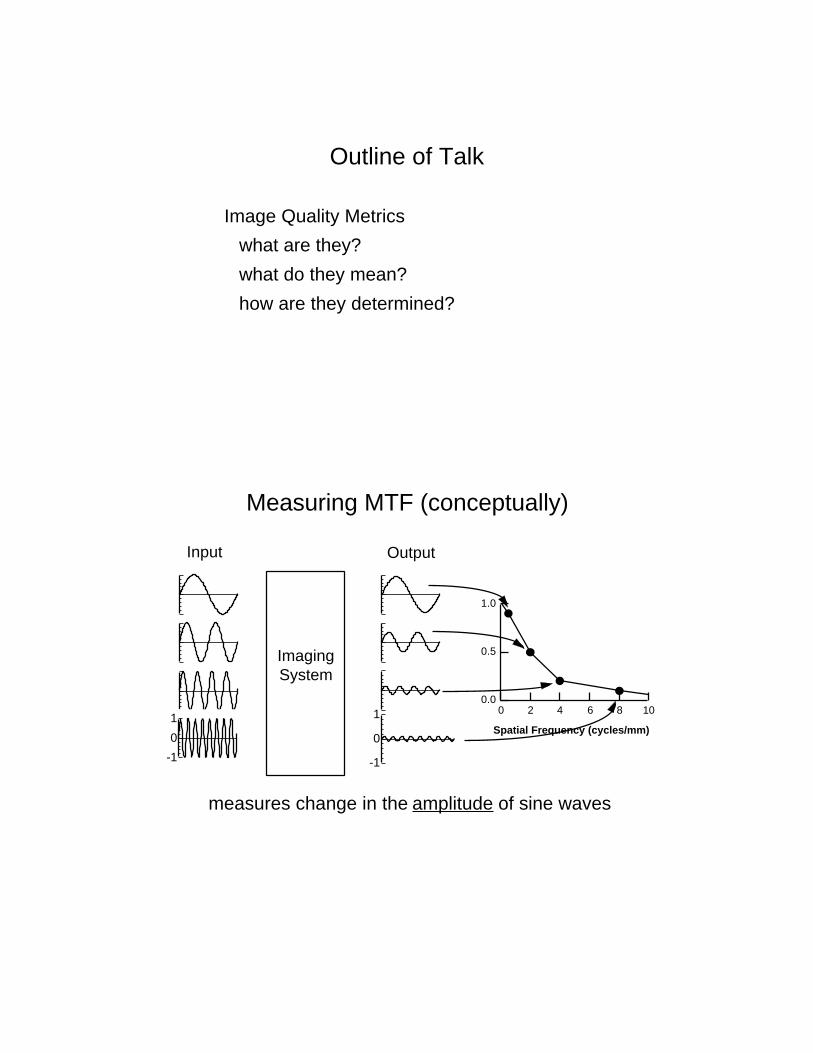
Measuring MTF (conceptually)
ImagingSystem
-1
0
1
Input Output
-1
0
1
1.0
0.5
0.01086420
Spatial Frequency (cycles/mm)
measures change in the amplitude of sine waves

MTF Curves
1.0
0.8
0.6
0.4
0.2
0.01086420
Spatial Frequency (cycles/mm)
Measuring MTF (theoretically)a POINT is composed of all spatial frequencies
a LINE is composed of all spatial frequencies in one direction and zero frequency in the other
1-D FFT 1-D MTF
digitize with anarrow slitaperture in one direction
digitizewith a small
circular aperturein two directions
2-D Hankeltransform 2-D MTF
PSF
LSF
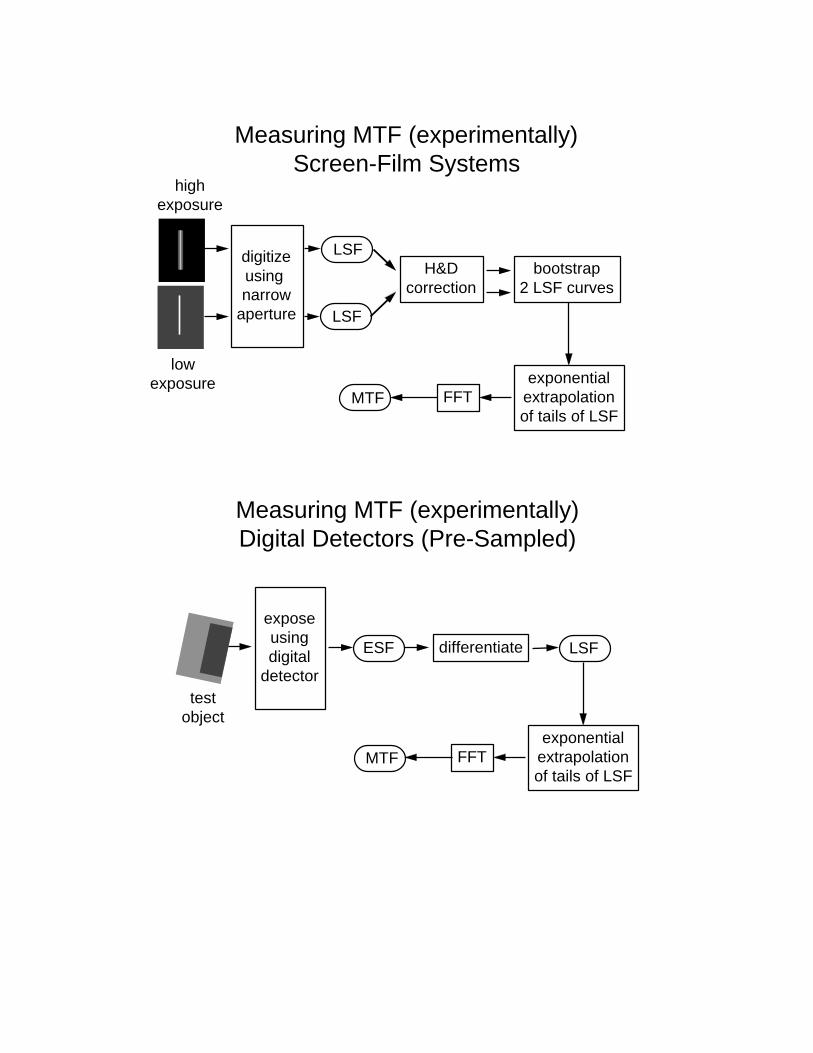
Measuring MTF (experimentally)Screen-Film Systems
highexposure
lowexposure
digitizeusing narrow
aperture LSF
LSFH&D
correctionbootstrap
2 LSF curves
FFTMTFexponential
extrapolationof tails of LSF
Measuring MTF (experimentally)Digital Detectors (Pre-Sampled)
testobject
exposeusingdigital
detector
ESF differentiate
FFTMTFexponential
extrapolationof tails of LSF
LSF

Oversampling the LSF
10
8
6
4
2
00.00
False-Positive Fraction
Am
plitu
de
Distance (mm)
Aliasing
1.0
0.8
0.6
0.4
0.2
0.0-6.38
False-Positive Fraction
Mod
ulat
ion
Tra
nsfe
r F
acto
r
Spatial Frequency (cycles/mm)
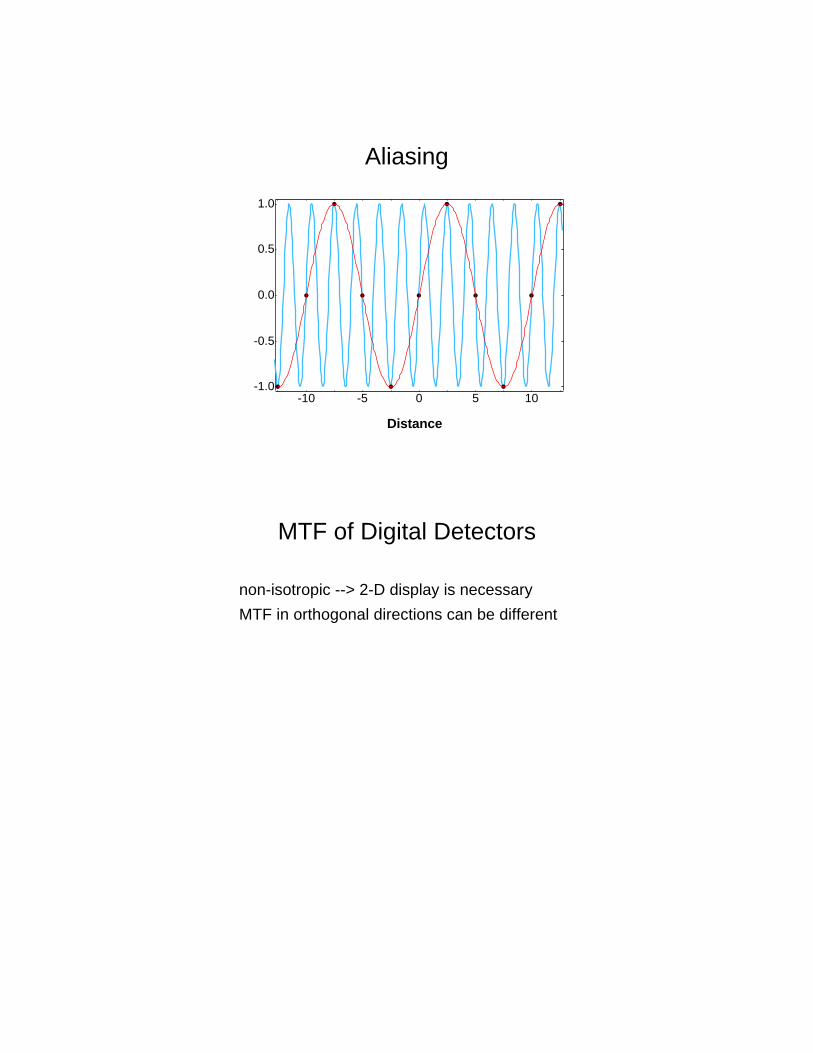
Aliasing
-1.0
-0.5
0.0
0.5
1.0
-10 -5 0 5 10
Distance
MTF of Digital Detectors
non-isotropic --> 2-D display is necessary
MTF in orthogonal directions can be different
Noise
noise can be characterized by standard deviation in the output image
a more complete description is given by the noise power spectrum
noise image
same standard deviation, but different texture

0.1
2
3
4567
1
2 )
0.12 4 6 8
12 4 6 8
10
Spatial Frequency (cycles/mm)
Measuring NPS (conceptually)
ImagingSystem
Input Output
-101
-101
Measure change in thevariation in the amplitude of sine waves
Measuring NPS (theoretically)
a uniform x-ray exposure contains noise at all spatial frequencies
digitizewith a small
circular aperturein two directions
2-D FFT 2-D NPS
digitizewith a long
narrow aperture in one direction
1-D FFT 1-D NPS
uniformlyexposed images
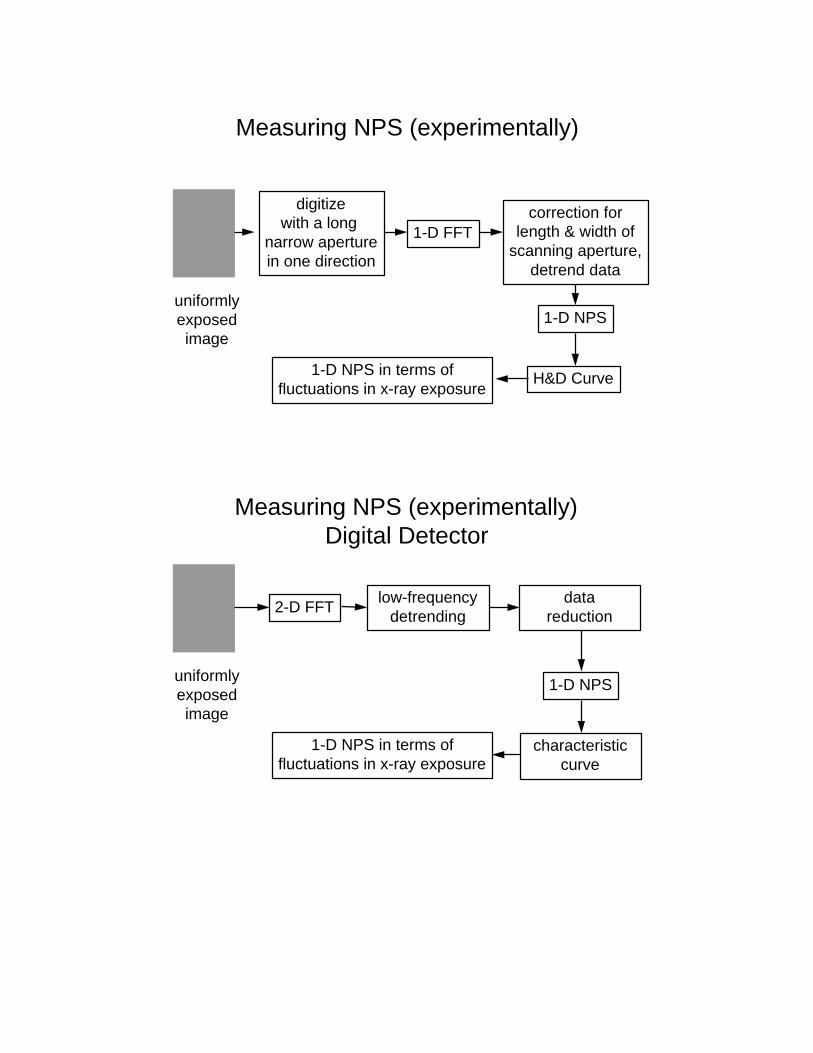
Measuring NPS (experimentally)
uniformlyexposedimage
digitizewith a long
narrow aperturein one direction
1-D FFT
1-D NPS
correction forlength & width of
scanning aperture,detrend data
H&D Curve1-D NPS in terms offluctuations in x-ray exposure
Measuring NPS (experimentally)Digital Detector
2-D FFT
1-D NPS
1-D NPS in terms offluctuations in x-ray exposure
uniformlyexposedimage
low-frequency detrending
data reduction
characteristic curve

Typical NPS
10-6
2
4
68
10-5
2
4
68
10-4
2m
m 2)
0.12 3 4 5 6 7
12 3 4 5 6 7
102
Spatial Frequency (cycles/mm)
Alternate Methods forMeasuring Noise Power Spectra
Fourier Transform of autocovariance function
analog method
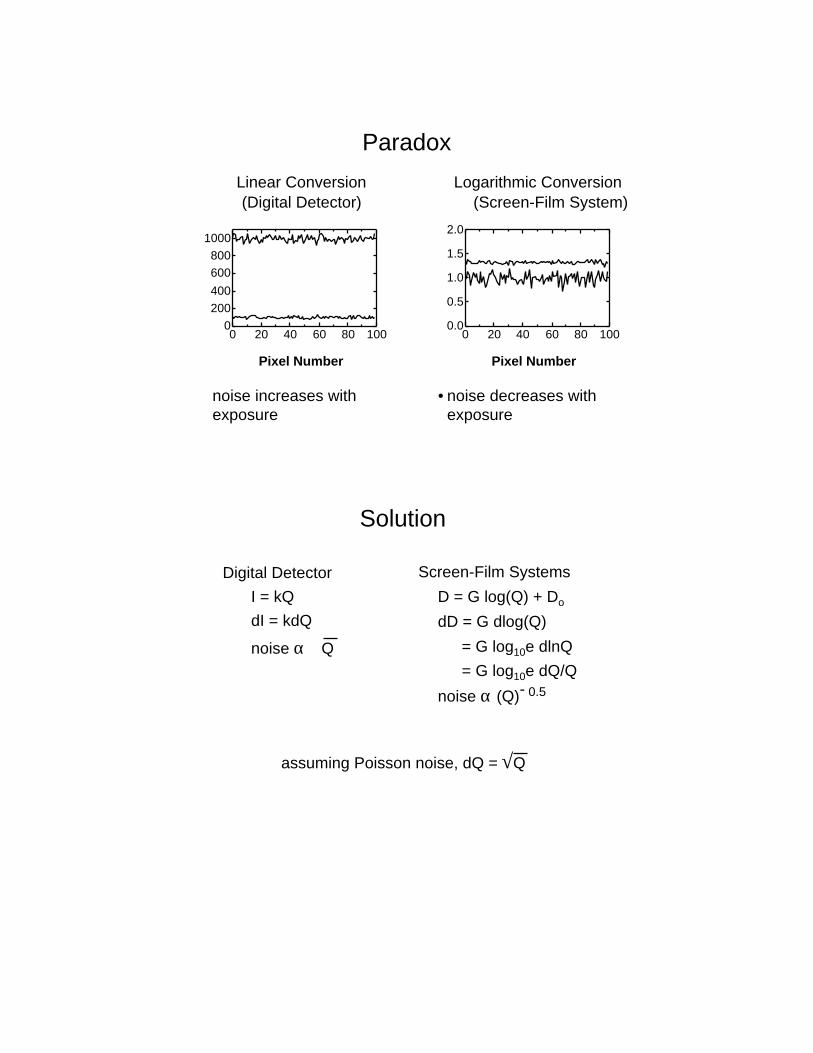
Paradox
Linear Conversion Logarithmic Conversion(Digital Detector) (Screen-Film System)
2.0
1.5
1.0
0.5
0.0100806040200
Pixel Number
1000800600400200
0100806040200
Pixel Number
noise increases with exposure
• noise decreases with exposure
Digital DetectorI = kQdI = kdQ
noise α Q
Solution
Screen-Film Systems
D = G log(Q) + Do
dD = G dlog(Q)
= G log10e dlnQ
= G log10e dQ/Q
noise α (Q)- 0.5
assuming Poisson noise, dQ = √Q

Photon Countingsignal = ∆Q = k∆Q
SNR = ∆Q (Q)- 0.5
= C (Q)0.5
Signal-to-Noise Ratio
Screen-Film Systems
signal = ∆D
= G ∆[log(Q)]
= G log10e ∆Q/Q SNR = ∆Q/Q (Q) 0.5 = C (Q)0.5
where C = ∆Q/Q, the radiation contrast of the object
Signal-to-Noise Ratio
can be characterized
a more complete description is given by NEQ (noise equivalent quanta)
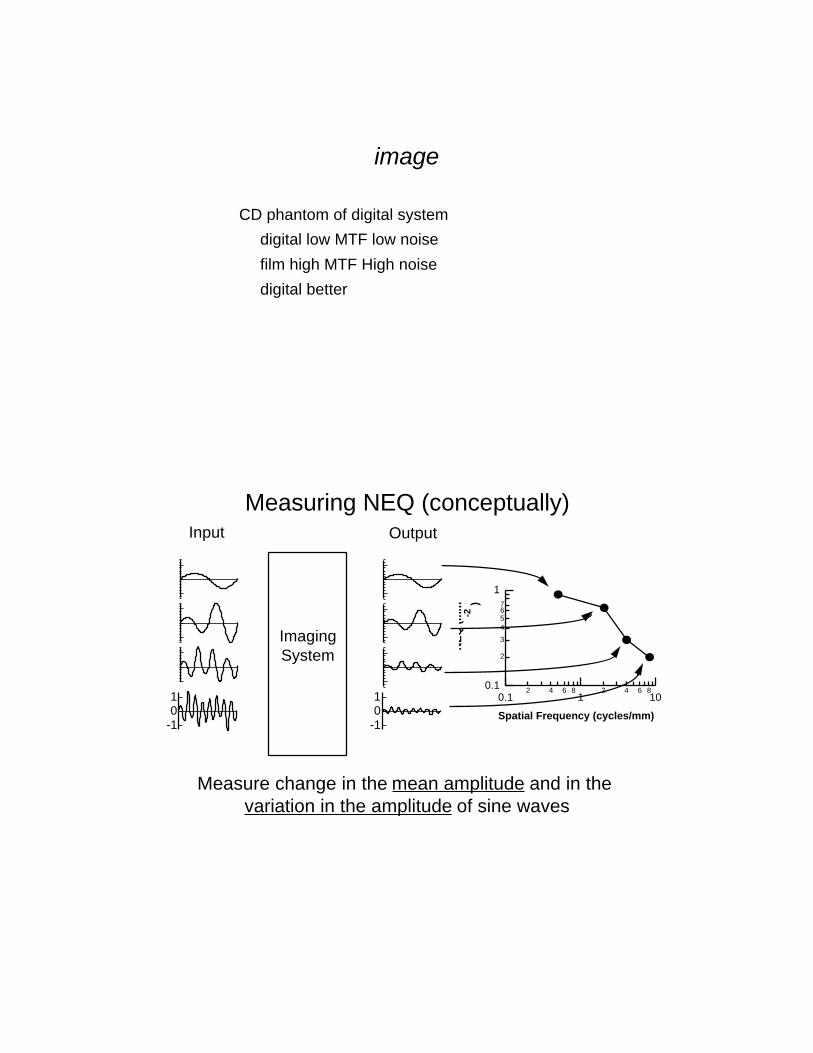
image
CD phantom of digital system
digital low MTF low noise
film high MTF High noise
digital better
0.1
2
3
4567
1
NE
Q (
mm
-2 )
0.12 4 6 8
12 4 6 8
10
Spatial Frequency (cycles/mm)
Measuring NEQ (conceptually)
ImagingSystem
Input Output
-101
-101
Measure change in the mean amplitude and in the variation in the amplitude of sine waves

Noise Equivalent Quanta
0.1 1 10Spatial Frequency (cycles/mm)
10 5
10 4
10 3
NEQ (mm ) -2
Noise Equivalent Quanta (NEQ)
Definition:
=
Q = # of quanta incident on the detector per unit area(assumes unit contrast)
Q DQE( )ωNEQ( )ω
OQ
∆Q2
dQdO
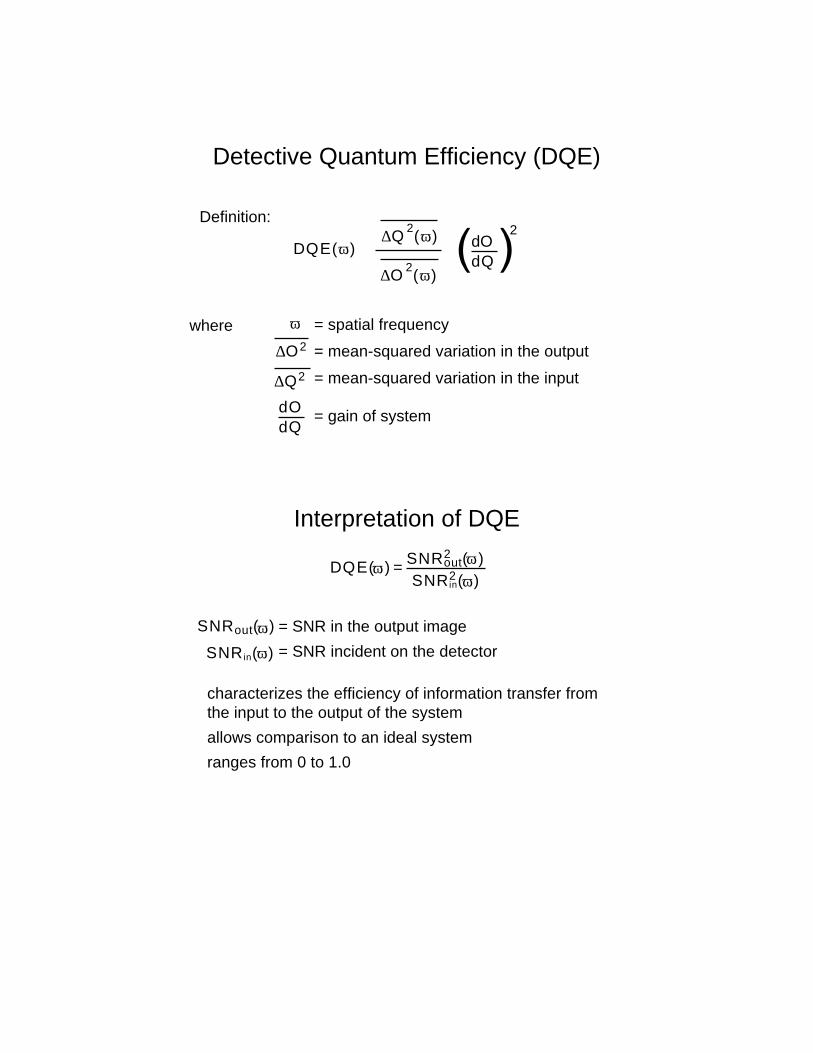
Detective Quantum Efficiency (DQE)
Definition:
DQE(ω) ∆Q 2(ω)
∆O 2(ω)
where ω
∆O2
dd
= spatial frequency
= mean-squared variation in the output
= mean-squared variation in the input
= gain of system
2
Interpretation of DQE
characterizes the efficiency of information transfer from the input to the output of the system
allows comparison to an ideal system
ranges from 0 to 1.0
DQE(ω) = SNRout2 ( )
SNR in2 ( )
SNRout( )
SNR in( )
= SNR in the output image
= SNR incident on the detector
ωω
ω
ω

Interpretation of NEQ
is the number of quanta that an ideal detector would have needed to yield the same SNR
absolute measure of image quality
ranges from 0 to infinity
assumes unit contrast
NEQ( ) = Q DQE( )
For a noise- limited system, SNRin= Q2
NEQ(
ω
) = SNR in( )2ω ω
ω
QdO
How to Calculate DQE (general)
DQE( ) = MTFQ
W( ) ( )2
dOdQ
where = MTF of detector = noise power spectrum of image
= gain of the system
W( )MTF( )
d
ω( )ω
ω
ω
ω
2
d
dQ
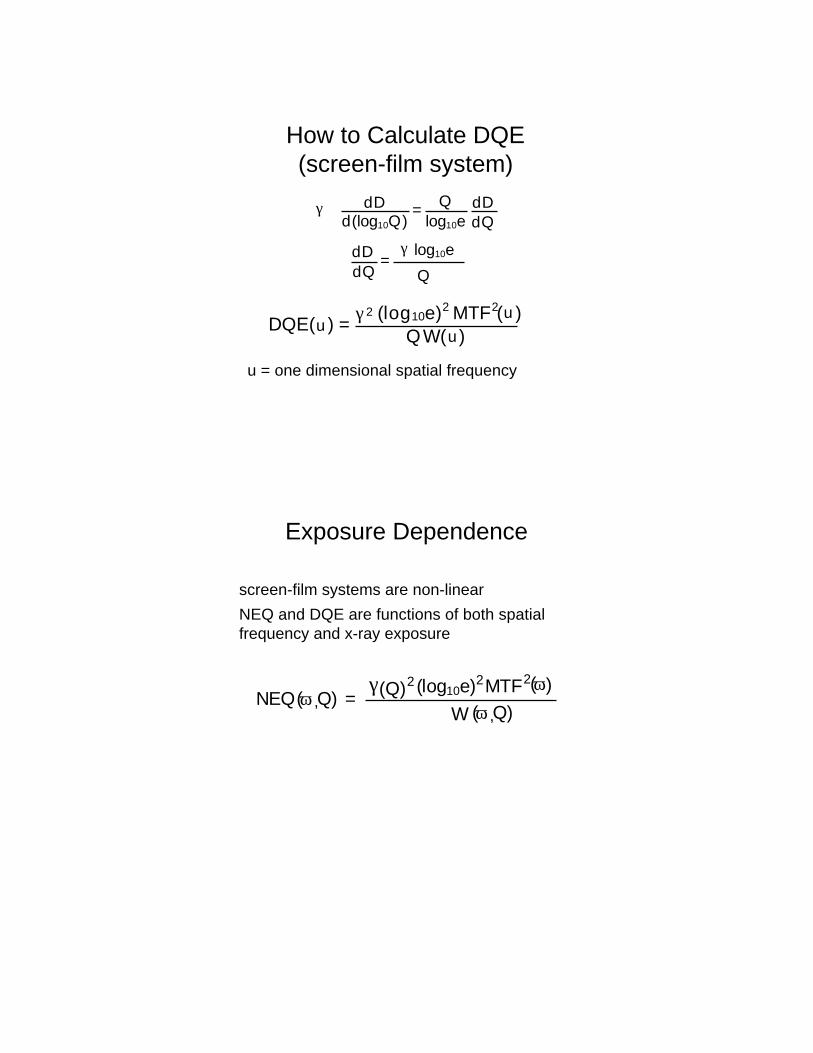
How to Calculate DQE(screen-film system)
DQE( ) = γ 2 (log10e)2 MTF
Q W( )
γ dDd(log10Q)
= Qlog10e
dD
dD
Q =
Q
lγ og10e
uu
( )u
u = one dimensional spatial frequency
2
Exposure Dependence
screen-film systems are non-linear
NEQ and DQE are functions of both spatial frequency and x-ray exposure
NEQ = (log10e)2MTF
W(ω Q) ,
(ω Q) ,
(ω)γ 2(Q) 2

H&D curve
DQE 3d
0.05
0.1
0.15
2
0.2
0.25
4 6.56 68 5.5
DQE
SpatialFrequency
(cycles / mm) Log Q
0

Things to Remember
DQE comparisons assume equal SNRin
may not be true: x-ray exposure, kVp
SNRin = C Q
DQE analysis assumes shift-invariant system
DQE & NEQ are measures of SNR
if image is not noise limited, but contrast limited, a system with higher NEQ may not produce a better image
information
ω
Relationship BetweenSNR and NEQ
[SNR = S( ) 2 NEQ( ) d ω ]1/2
ω ω
where is the spatial frequency spectrum of the objectS ( )
Summary
NEQ and DQE are useful parameters for characterizing and understanding medical imaging systems
NEQ and DQE can serve as a basis for comparing different imaging conditions and modalities
NEQ may be useful in furthering our understanding of image perception
Recommended Reading (1) ICRU Report 41: Modulation transfer function of screen-film systems. (2) BRH Report: MTF's and Wiener spectra of radiographic screen-film systems. (3) J. C. Dainty, R. Shaw: Image Science (Academic Press, London, 1974), Chap. 6, 7, and 8. (4) J. S. Bendat, A. G. Piersol: Random Data: Analysis and Measurement Procedures 2nd
edition, (Wiley, New York, 1986). (5) A Rose, Vision: Human and Electronic (Plenum, New York, 1973). (6) C. E. Metz and K. Doi: Transfer function analysis of radiographic imaging systems.
Phys Med Biol 24: 1079 (1979) (7) R. A. Sones, G. T. Barnes: A method to measure the MTF of digital x-ray systems. Med
Phys 11: 166 (1984). (8) H. Fujita, K. Doi, M. L. Giger: Investigation of basic imaging properties in digital
radiography. 6. MTFs of II-TV digital imaging systems. Med Phys 12: 713 (1985). (9) I. A. Cunningham, A. Fenster: A method for modulation transfer function determination
from edge profiles with correction for finite-element differentiation. Med Phys 14: 533 (1987).
(10) M. Dragnova, J. A. Rowlands: Measurement of the spatial Wiener spectrum of nonstorage imaging devices. Med Phys 15: 151 (1988).
(11) J. A. Rowlands, G. DeCrescenzo: Wiener noise power spectra of radiological television systems using a digital oscilloscope. Med Phys 17: 58 (1990).
(12) I. A. Cunningham and B. K. Reid: Signal and noise in modulation transfer function determinations using the slit, wire, and edge techniques, Med Phys 19(4):1037-1044, 1992.
(13) J.M. Sandrik, R.F. Wagner, Absolute measures of physical image quality: Measurement & application to radiographic magnification, Med. Phys. 9: 540(1982).
(14) R.M. Nishikawa, M.J. Yaffe, Signal-to-noise properties of mammographic film-screen systems, Med. Phys. 12, 32-39 (1985).
(15) PC Bunch, KE Huff, R Van Metter, Analysis of the detective quantum efficiency of a radiographic film-screen combination, J. Opt Soc Am A 4, 902-909 (1987).
(16) J. T. Dobbins, Effects of undersampling on the proper interpretation of modulation transfer function, noise power spectra, and noise equivalent quanta of digital imaging systems, Med Phys 22, 171-81 (1995).
(17) J. T. Dobbins, D.L. Ergun, L. Rutz, et al., DQE(f) of four generations of computed radiography acquisition devices, Med Phys 22, 1581-1593 (1995).
(18) M. L. Giger and K. Doi, Investigation of basic imaging properties of digital radiography. Part 1: modulation transfer function, Med Phys 11, 287-295 (1984).
(19) M. L. Giger, K. Doi and C. E. Metz, Investigation of basic imaging properties of digital radiography. Part 2: noise Wiener spectrum, Med Phys 11, 797-805 (1984).
(20) C. E. Metz, R. F. Wagner, K. Doi, D. Brown, R. M. Nishikawa and K. Myers, Toward consensus on quantitative assessment of medical imaging systems, Med. Phys. 22, 1057-1061 (1995).
