the fundamental antecedents of a brand …...of loyalty and long-term commitment to the brand...
TRANSCRIPT

The fundamental antecedents of a brand relationship:
An exploration of the effect of consumers' personalities on the strength of brand relationships
Christophe Hrant Baygin
A Thesis in the John Molson School of Business
Presented in Partial Fulfillment of Requirements for the
Degree of Master of Science in Administration (Marketing) at
Concordia University
Montreal, Quebec, Canada
July 2015
© Christophe Hrant Baygin, 2015

CONCORDIA UNIVERSITY
School of Graduate Studies
This is to certify that the thesis prepared
By: Christophe Hrant Baygin
Entitled: The fundamental antecedents of a brand relationship: An exploration of the
effect of consumers' personalities on the strength of brand relationships
and submitted in partial fulfillment of the requirements for the degree of
Master of Science in Administration (Marketing)
complies with the regulations of the University and meets the accepted standards with respect to
originality and quality.
Signed by the final examining committee:
___________________________ Chair
___________________________ Examiner
___________________________ Examiner
___________________________ Supervisor
Approved by __________________________________________
Chair of Department or Graduate Program Director
__________________________________________
Dean of Faculty
__________________________________________
Date

iii
ABSTRACT
The fundamental antecedents of a brand relationship:
An exploration of the effect of consumers' personalities on the strength of brand relationships
Christophe Hrant Baygin
The literature on emotional relationships with brands has been steadily growing for the
past decade, however in most cases researchers focus on brand initiated actions in order to test
their effects on the strength of those relationships with their customers. The purpose of this
research is to explore brand relationships from a generally neglected perspective, that of the
consumers with which brands are attempting to build strong emotional bonds. A series of
individual difference variables were added to a model incorporating previously known
antecedents to strong brand relationships in order to examine the added effect that these might
have in encouraging or discouraging consumers to engage in deep emotional relationships with
their favorite brands. Although some of the variables showed significant effects, the overall
results showed that individual difference variables had very little explanatory power when used
in conjunction with the previously established antecedents. Theoretical as well as managerial
implications of these results are discussed as well as potential avenues for future research in
related lines of questioning.

iv
ACKNOWLEDGEMENTS
The past couple of years in the MSc program would not have been possible without the
unwavering love and support of irreplaceable colleagues, friends and family.
First and foremost, I would like to thank all of my professors, not only for sharing their
wealth of knowledge in subject-matter, but even more importantly their passion and dedication
for the field of marketing and marketing research. Most notably, this research project would not
have come to fruition without the considerable support and dedication of my thesis supervisor
Dr. Bianca Grohmann. Her faith in both my ideas and my abilities from the very beginning, as
well as her support and feedback whenever the need arose, was instrumental not only in the
completion of this project but in my successful journey in the MSc. program as a whole.
Next, I would like to thank my family and friends, who understood fully the commitment
I needed to make in order to survive and thrive in the program. They were always there for moral
support during harder times as well as celebration in happier times. I would especially like to
thank Alex, I would never have even considered entering this program without our periodical
engagements in existential discussions and projections of potential futures. I will always consider
you my brother, and for all your friendship and support through good times and bad, thank you.
I am also very thankful to all of my colleagues in the MSc. program, I don't think any of
us could have survived the past few years without each other, the brilliance of a graduate
program such as this one is really in encouraging us to work together and succeed as a result. A
special mention to Zack and Irina, I don't think I could have gotten through the past year without
our weekly meetings and all of your feedback, encouragement and, let's face it, the copious
amount of hilarity resulting from our conversations. You guys really made me feel like all I
could always count on you both to push through with me, and for that I am very grateful.
Finally, and most importantly, thank you Natasha for all your support and understanding
during this crazy time in my life. There is no way I would have gotten where I am without your
unconditional love and unwavering faith in my abilities. Sorry for the mostly sleepless nights and
thank you for sharing in both my struggles and successes with so much enthusiasm. I love you!
Of course, I also have to mention the unwavering love and constant supportive affection
from my furry family: Simba, Princess and Kaya; I am sure your constant presence had nothing
to do with the bag of treats on my desk as I worked.

v
Table of Contents I. INTRODUCTION ..................................................................................................................................... 1
A. Scope and objectives of research ..................................................................................................... 1
B. Expected Contributions ..................................................................................................................... 1
II. CONCEPTUAL BACKGROUND ................................................................................................................ 3
A. Importance of Emotional Relationships with Brands ....................................................................... 3
B. Individual Differences ....................................................................................................................... 4
C. Brand Love ........................................................................................................................................ 5
D. Hypothesized relationships ............................................................................................................... 6
III. RESEARCH METHODOLOGY ............................................................................................................ 13
A. Measures ......................................................................................................................................... 13
1. Individual Difference Variables ................................................................................................... 13
2. Brand-Related Antecedents ........................................................................................................ 14
3. Brand Relationship Measures ..................................................................................................... 16
B. Survey Administration and Preliminary Data Analysis .................................................................... 17
IV. RESULTS........................................................................................................................................... 19
A. Preliminary data analysis ................................................................................................................ 19
B. Factor Analysis and Item-Reduction ............................................................................................... 20
C. Confirmatory Factor Analysis .......................................................................................................... 23
D. Final Reliability Analysis .................................................................................................................. 24
E. Correlation Analysis ........................................................................................................................ 25
F. Main Analysis .................................................................................................................................. 28
1. Model Comparison ...................................................................................................................... 28
2. Analysis of Resulting Path Coefficients ....................................................................................... 30
3. Hypothesis Tests ......................................................................................................................... 32
V. DISCUSSION ......................................................................................................................................... 34
A. Overall Results ................................................................................................................................ 34
B. Individual-Level Variables ............................................................................................................... 34
C. Brand Related Variables .................................................................................................................. 36
VI. LIMITATIONS AND FUTURE RESEARCH ........................................................................................... 41
VII. THEORETICAL IMPLICATIONS .......................................................................................................... 44
VIII. MANAGERIAL IMPLICATIONS .......................................................................................................... 45

vi
IX. CONCLUSION ................................................................................................................................... 46
X. BIBLIOGRAPHY .................................................................................................................................... 47
XI. APPENDICES .................................................................................................................................... 52
A. Full Questionnaire ........................................................................................................................... 52
B. Univariate Statistics ........................................................................................................................ 60
C. Correlation Analysis ........................................................................................................................ 65
D. Discriminant Analysis - Fornell-Lacker Criterion ............................................................................. 66
E. Discriminant Analysis - Hetero-Trait Mono-Trait Ratio .................................................................. 67
F. Full Path Model ............................................................................................................................... 68

vii
LIST OF TABLES
Table 1 - Preliminary Reliability Analysis .................................................................................................... 20
Table 2 - Final Factor Structure - Big Five Indicators of Personality ........................................................... 21
Table 3 - Final Factor Structure - Attachment Style .................................................................................... 21
Table 5 - Brand Romance - Correlation between Factors ........................................................................... 22
Table 4 - Brand Romance 3-Factor Solution ............................................................................................... 22
Table 6 - Confirmatory Factor Analysis Fit Summary .................................................................................. 24
Table 7 - Final Reliability Analysis - All Constructs ...................................................................................... 25
Table 8 - Comparison of R-Square of different models tested ................................................................... 29
Table 9 - Path Coefficients - Full Model ...................................................................................................... 30

viii
LIST OF FIGURES
Figure 1 - Hypothesized Relationships ........................................................................................................ 12
Figure 2 - Simplified path model tested ...................................................................................................... 28

1
I. INTRODUCTION
Research in branding during the past few years has taken increasing interest in the
emotional relationships that consumers build with their brands. Several different measures of
these relationships have emerged, as well as research on their important antecedents, moderators
as well as their potential benefits to brands. However, a major gap in this line of research is the
practical disregard of consumer's willingness to engage in deeply emotional relationships with
non-human entities such as brands as a fundamental antecedent to these relationships. This
project proposes to remedy this by testing the potential impact of well established individual
difference variables while controlling for most of the established brand-level antecedents of
brand relationships.
A. Scope and objectives of research
The focus of this research is to explore the following questions: How does a customer’s
personality play a role in their willingness to engage in deep emotional relationships with a
brand? Which personality traits, extracted for example from the big five framework of
personality dimensions (Costa and McCrae, 1985) among others, will have the most significant
impact on the level of attachment or love felt by customers for their favorite brands?
B. Expected Contributions
The main potential contribution of this research is to help marketers in having a deeper
understanding of how emotional brand relationships are achieved, given their targeted market
segments. By considering a customer’s specific personality profile while accounting for
previously established antecedents of the relationship, this research can give marketing managers

2
a useable tool to evaluate the best ways to bring their specific customers closer to feeling strong
emotional attachment or love towards their brand; which has been shown to be a strong predictor
of loyalty and long-term commitment to the brand (Carroll and Ahuvia 2006; Bergkvist and
Bech-Larsen, 2010).
In terms of potential theoretical contributions, this research's results will be a first step in
a line of questioning which may lead to a deeper understanding of the effects of individual
differences on preferences in terms of branding. Additionally, this project aims to replicate
results from various different studies and quantitatively compare the impact of previously
established antecedents within the same model. Finally, multiple prominent constructs in the
literature of branding and emotional relationships will be used and compared. By using multiple
dependent constructs, this research seeks to account for several facets of the brand relationship in
order to get a fuller understanding of the effect of the different antecedents on each of the
outcome variables, and most importantly if any key differences exist between them.

3
II. CONCEPTUAL BACKGROUND
A. Importance of Emotional Relationships with Brands
In an increasingly competitive worldwide market, it is becoming gradually more
important for brands to differentiate in order to stay competitive. Further, it is also becoming
increasingly difficult to differentiate based on product alone, due to decreasing costs of
production and international competition. As a result, marketing managers have been focusing on
increasingly intangible benefits to customers in order to encourage long-term loyalty and
engagement through the creation of relationships (Gummesson, 1997).
In the past few decades, both marketing practitioners and researchers have shown
growing interest in the concept of emotional relationships between consumers and their brands.
Following Fournier's (1998) lead, several researchers (Thomson, MacInnis and Park, 2005;
Carroll and Ahuvia, 2006) have attempted to describe, define and understand these relationships
in order to uncover their potential antecedents and potential benefits resulting from them.
Importantly, brands have been increasing the focus on creating lasting relationships with
their consumers in an effort to elicit positive behaviors such as loyalty, word-of-mouth etc. Some
important brand-level antecedents to these emotional relationships have been documented, for
example: brands which offer exclusively utilitarian products are less likely to lead to the
establishment of emotional relationships (Carroll and Ahuvia 2006, Malar et al. 2011).
As useful as this and other brand-level antecedents are, there is a lesser explored facet of
the consumer-brand relationship: individual-level factors which may facilitate or hinder efforts
from marketers in establishing emotional relationships with their consumers. In other words,
there may be groups of consumers which are far more likely to engage in emotional relationships

4
with a non-human entity such as a brand; just as there may be groups of consumers who will
never see a brand as more than it's utilitarian function of distinguishing manufacturers on the
basis of quality, price etc.
This research proposes that a perspective which considers both sides of the relationship
may help to paint a more complete picture of consumer-brand relationships, and move away
from a purely brand-based approach to fostering them. Established individual difference
variables are sourced from psychology in order to test whether certain traits are more or less
conducive to the emergence of strong consumer-brand relationships.
B. Individual Differences
The effect of individual differences in interpersonal relationships is well documented.
Attachment theory (Bowlby, 1980) which stipulates that a person's attachment style is formed as
a result of early interactions with their caretakers, is one of the most commonly used theories in
the study of many relationship quality studies (Notfle and Shaver, 2006). Additionally, some
studies have explored links between attachment styles and personality traits taxonomies such as
the Big Five (Brennan and Shaver, 1991; Notfle and Shaver, 2006; Deniz, 2011).
This research proposes to use a similar approach in the field of branding by using a loose
analogy between interpersonal relationships and consumer-brand relationships (Fournier, 1998).
The contention is that just as individual differences have an effect on people's willingness to
engage in interpersonal relationships and the subsequent quality of those relationships, they may
also have an impact on consumer-brand relationships.

5
C. Brand Love
Following Fournier's (1998) first conceptualisation of consumer-brand relationships,
marketing researchers have proposed several constructs which aim to measure the strength of
consumer's bonds with brands. Branding researchers quickly moved away from using the mainly
cognitively-based brand attitude and started to focus on emotional bonds instead. The most
important consumer-brand relationship constructs examined in the literature include brand
attitude strength (Park et al. 2010), brand relationship quality (Fournier 1998), brand love
(Carroll and Ahuvia 2006), brand attachment (Thomson, et al. 2005), brand romance
(Patwardhan and Balasubramanian 2011), attachment-aversion model (Park, Eisenrich and Park
2013); all of these constructs were conceptualized to capture different aspects of the multi-
faceted concept of consumer-brand relationships.
It has been suggested that the aforementioned works resulted in the exploration of
constructs which do not necessarily contradict each other, but rather represent different
perspectives on consumer-brand relationships (Patwardhan and Balasubramanian 2013).
However, only a subset of the constructs were chosen for this research based on a high level of
prior validation and managerial relevance: brand love (Carroll and Ahuvia 2006), brand romance
(Patwardhan and Balasubramanian 2011), romantic brand love (Sarkar, Ponnam and Murthy,
2012), brand attachment (Thomson, MacInnis and Park 2005) and finally brand relationship
quality (Fournier, 1998).
The main focus of the study is built around the concept of brand love, defined as "the
degree of passionate emotional attachment a satisfied consumer has for a particular trade name"
(Carroll and Ahuvia 2006, p.81). It is believed to be the closest analogy to the passionate feelings
experienced by people in interpersonal relationships. Brand love (Carroll and Ahuvia 2006) has

6
also been shown to lead to a number of desirable outcomes such as loyalty (Carroll and Ahuvia,
2006; Batra, Ahuvia and Bagozzi, 2012), resistance to bad reviews (Batra et al., 2012), active
engagement (Bergkvist and Bech-Larsen, 2010) and positive word of mouth (Carroll and Ahuvia
2006; Batra et al., 2012). The additional constructs will be used as benchmarks: the effects of the
consumer's individual difference variables on each construct will be compared, as well as
relevant antecedents sourced from each body of literature in order to test whether the effects can
be generalized to all the dependent constructs or if each dependent construct shows a different
pattern of antecedents.
D. Hypothesized relationships
It is important to note at this point that the current research is of mainly exploratory
nature. It builds on a limited body of research in the area of personality and branding research.
The relationships proposed and tested in this research constitute an initial exploration of the
possible relation between individual difference variables on consumers’ attachment or love felt
for a brand.
Malär et al. (2011) explore the link that congruence between a brand's personality, the
perceived set of human traits attributed to a brand by the consumer (Aaker 1997) and a
consumer's own self image can have on brand attachment. They found that a perceived
congruence between the consumer's self-image and that of the brands led to higher levels of
attachment to that brand. Additionally, this effect was moderated by the consumer's self-esteem,
a measure of a person's positive self-conception (Malär et al. 2011) as well as their rating on
their level of public self-consciousness, conceptualized as "the awareness of the self as a social
object" (Malär et al. 2011). Importantly, a consumer's core willingness to engage in an emotional
relationship is assumed, not explored. On the other hand, a consumer's self-esteem was found to

7
have a positive moderating effect on the level of brand attachment felt by the consumer; which
may be extended in this research.
Hypothesis 1: Consumers with a higher self-esteem will score higher on Brand Love.
Fennis, Pruyn, and Maasland (2005) explore the effects that exposure to certain brand
personalities (Aaker 1997) can have on the salience of certain traits in the consumer's self-
concept. Chang (2006) suggested and found limited support for the hypothesis that responses to
ad-evoked affect may depend on the personality of the viewer, specifically how they score on an
Introversion/Extraversion scale. Both studies support a need for further research into the effects
of a consumer's personality on potential emotional responses to brands.
Moreover, some researchers have identified the potential of using individual differences
in studying consumer-brand attachments. Swaminathan, Stilley, and Ahluwalia's (2008) study
suggests that consumers' interpersonal attachment style may influence the brand personality
(Aaker, 1997) traits they will most be attracted to. Attachment style is a two-dimensional
psychological model of a person's preferences in terms of closeness in long-term relationships
(Hazan and Shaver, 1987). The attachment anxiety dimension refers to a person's self-perception
as being worthy or unworthy of love and the avoidance dimension refers to the individual's view
of others as being worthy or unworthy of trust (Brennan, Clark and Shaver, 1998). They found
that, consumers primed with a high anxiety style responded more positively to a sincere brand
personality rather than exciting personality, particularly if the consumer also exhibits a low
avoidance style.
Johnson and Thomson (2003) found that a positive interaction of the attachment
dimensions (high anxiety and avoidance scores) positively predict satisfaction judgements in
8
both service and brand relationships and negatively in personal relationships, which implies that
consumer relationship satisfaction can be higher than personal relationship satisfaction in certain
individuals.
Proksch, Ortyh and Bethge (2013) studied the effects of the salience of attachment
security or anxiety on the formation of brand attachment. They found that given a level of
consumer-brand identification, the perceived degree of overlap between a customer's self concept
and the brand's characteristics (Bagozzi and Dholakia 2006), a low perceived attachment
security, defined as "the degree to which individuals successfully derive feelings of emotional
security within a specific, current attachment relationship" (Diamond and Hicks, 2005, p.502)
combined with a high attachment anxiety style led to higher attachment to their brands. One
possible explanation was the possibility that people may relate to brands to compensate for a
low-attachment security in other relationships. However, this effect was found with female
respondents only.
Finally, Mende, Bolton, and Bitner (2013) found a significant positive effect of
customer's attachment anxiety on consumer's preference for closeness with their brand as well as
a significant negative effect of attachment avoidance. These results were found by using an
adapted version of attachment styles developped by Mende and Bolton (2011) under the
contention that individuals' general attachment styles, although valuable, do not adequately
predict outcomes in focal relationships. They developed firm-specific measures of customers'
attachment styles by using a firm employee as a target for the focal relationship. The customer
attachment anxiety dimension relates to a customer's worries about the unavailability of the firm
in times of need, and fears of rejection from the firm; whereas the customer attachment
avoidance dimension describes a customer's need for self-reliance distrust of the firm's

9
employee. (Mende and Bolton 2011). Using this adapted measure, Mende et al. (2013) also
found a significant negative effect of both attachment anxiety and avoidance on repurchase
intentions. Additionally, there was an interesting effect, suggesting that maintaining the status
quo by neither increasing nor decreasing the relationship breadth (number of products from same
brand purchased) over time was the preferred response of people scoring high on attachment
anxiety. This provides further support for an analogy between interpersonal relationships and
consumer relationships.
Based on the above findings, the following hypotheses are proposed. It is important to
note that due to conflicting results in previous research, we present conflicting hypotheses
regarding the attachment anxiety factor. Specifically, if the analogy between intepersonal
relationships and brand relationships holds:
Hypothesis 2a: Consumers with a high attachment anxiety will score lower on Brand Love
Conversely, if individuals do in fact tend to compensate for low interpersonal relationship quality
by engaging more strongly with brands, then:
Hypothesis 2b: Consumers with a high attachment anxiety will score higher on Brand love
Hypothesis 3: Consumers with a high attachment avoidance will score lower on Brand Love
Matzler, Pichler, Füller, and Mooradian (2011) found that customers' personality
congruence with the brand is linked to product attachment, which may be analogous to a brand
relationship; which in turn leads to brand loyalty and brand trust. Additionally, they found that
extroverted individuals were more likely to identify with a brand community, “a specialized,
non-geographically bound community, based on a structured set of social relationships among

10
admirers of a brand” (Muniz & O'Guinn, 2001, p. 412) which may lead to a stronger bond with
the brands (Bergkvist and Bech-Larsen 2010).
Hypothesis 4: Consumers who score higher on Extraversion will score higher on Brand
Love.
As discussed, research from this particular perspective is quite scarce and therefore it is
hard to draw many hypotheses from previous work. To complement these, this research draws
from related fields for some additional testable hypotheses.
Haddock, Maio, Arnold, Huskinson (2008) found that individuals with a higher need for
affect, a measure of a person's "general motivation to approach or avoid situations and activities
that are emotion inducing for themselves and others" (Maio and Esses 2001, p.585) responded
more favorably to affect-laden messages; although the setting is different, there may be a
possible extension to branding research.
Hypothesis 5: Consumers with a higher Need for Affect will score higher on Brand Love
Since consumer-brand relationships are often considered analogous to interpersonal
relationships (Fournier et al. 1998, Mende et al. 2013), this research also draws partly from past
research in personality and relationship psychology, however formal hypotheses will not be
advanced due to the lack of previous research in this area. Most importantly, this study advances
that individual differences in personality may have an effect on levels of love felt for brands.
One of the most commonly used framework for describing individual's personalities is the big
five indicators of personality (Costa and McCrae, 1985). This framework relies on five broad,
bipolar dimensions which adequately summarize an individual's overall personality. The five
factors are as follows: Extraversion, usually characterized with high energy, highly social and

11
enthusiastic individuals; Agreeableness usually characterized by a tendency to be helpful, modest
and easy-going; Neuroticism, a propensity to feel a set of negative feelings such as anxiety,
personal insecurity and fear; Conscientiousness, usually portrayed by careful, responsible and
disciplined individuals; and finally Openness to experience, defined as a general willingness to
explore new ideas or new situations (John and Srivastava, 1999; Deniz, 2011).
Studies relating the big five personality scales and relationship quality in interpersonal
romantic relationships have supported that certain traits are more or less conducive to high
relationship quality (See Ozer and Benet-Martinez, 2006 for full review). For example, high
neuroticism and low agreeableness have been shown to lead to relationship dissatisfaction. As
part of the analogy between interpersonal and brand relationships, these may be worth testing.
Shaver and Brennan (1992) studied the relationship between attachment styles and
personality traits and found that a secure attachment style, characterized by low levels of anxiety
and avoidance, was negatively associated with neuroticism and positively with extraversion.
Avoidant attachment styles were negatively associated with agreeableness and positively with
neuroticism. As predictors of relationship variables, attachment styles were found to be much
better predictors, however in the case of relationship length, openness to experience had a
negative effect.
Noftle, and Shaver (2006) also explored links between attachment styles and the big five
personality trait taxonomy as well as their effects on perceived relationship quality. They found
that both attachment factors were negatively related to relationship quality, and that the big five
factor conscientiousness was positively related to relationship quality. Additionally, although
they found some correlations between the big five and the attachment dimensions, when both

12
individual difference variables were analyzed jointly, the big five factors did not add any
explanatory power to the model.
Brand
Love
Self-
Esteem
Attachment
Anxiety
Attachment
Avoidance
Extraversion
Need for
Affect
+
+ / -
+
+
-
Figure 1 - Hypothesized Relationships

13
III. RESEARCH METHODOLOGY
A. Measures
The measurement tool used was a questionnaire consisting of a series of seven-point
Likert-type scales. Respondent were asked to rate their degree of agreement with the statements
presented. The decision to use a uniform seven-point scale across the survey was made in order
to have access to a reasonable degree of possible variability in the data, while reducing the
potential for unnecessary respondent confusion or fatigue due to different scales.
1. Individual Difference Variables
The individual-level measures were sourced from previous research in psychology. The
self-esteem scale was taken from Malar et al.'s study (2011) and consisted of four items. The
original big five indicators of personality (John & Stritavasta 1999) is a 44 item scale, which was
deemed too long for this study; therefore, a short form developed by Gosling, Rentfrow and
Swann (2003) was used. The measure developed consists of ten items, each with two words, for
example: extraverted, enthusiastic. In an effort to clarify the scale items, single adjectives served
as scale items; the result was a 20-item scale. The need for affect scale was first developed by
Maio and Esses (2001) and consisted of 26 total items. For this research, the twelve highest
loading items from the original article were chosen to be included in the study, six for the
motivation to approach emotions factor and six for the motivation to avoid factor.
Attachment Style was measured using the shortened Experiences in Close Relationships
(ECR) scale developed by Wei et al. (2007). The full scale consisted of twelve items, six items
for the anxiety factor, and six for the avoidance factor. Importantly, a related, albeit much more
relevant, domain specific version of this construct was also included. The customer attachment

14
style scale (Mende and Bolton 2011) is composed of eight items, four for each dimension
matching the factors from the ECR. Note however that during analysis, this construct was
grouped with the brand related variables due to the fact the wording of the items were
specifically directed at the respondent's chosen brand. This implies that the responses were most
relevant to that brand, and the measure does not capture a general individual tendency or trait.
A few other constructs developed to describe different facets of individual's personalities
were added to the model in an exploratory fashion. Barak and Stern's (1986) sex-role identity
measure consisting of 40 items was similarly shortened by extracting the highest loading 20
items (i.e., ten per factor). Finally, Lee and Robbins' (1995) social connectedness scale, a
measure of general tendency to easily relate to others in a social setting, was sourced and
shortened to include the top loading items, all loading at above .60 (Lee, Draper and Lee 2001);
for a total of 14 items.
2. Brand-Related Antecedents
When introducing the brand-related questions, a brand had to be presented in order to
introduce a target brand to keep in mind when answering the questions. Instead of presenting a
brand chosen by the researchers, it was decided to let the respondents choose their own brand.
The reasoning for this approach was the concern that if the brand was chosen by the researchers,
each respondent would have different levels of connection and appreciation with the brand due to
their experiences with said brand. This would in turn lead to differences in levels of attachment
which are hinged more on brand related attributes rather than individual-level attributes. The
purpose of the study was to uncover potential individual-level antecedents to brand relationships,
therefore it was decided that each respondent's MOST loved brand would be chosen as the target
for the study. This way, any variance in the level of emotional connection may have more to do

15
with individual preferences rather than the brand. A similar approach was used in Bergkvist and
Bech-Larsen's (2010) study where one of the brands in each category was left for the respondent
to decide on. Respondents reported a wide range of brands and products from the most popular
and widely appreciated tech company Apple Computers to much lesser known Ravelry. There
was a wide variation of types of brands: from the symbolic Harley Davidson to the purely
functional Cheerios; from service brands such as Air Canada to consumer packaged goods
manufacturer General Mills; from the most conspicuous brands such as Rolex and Michael Kors
to the most privately used brands such as Cottonelle; from multinationals such as McDonald's to
private label brands such as President's choice; and from consumer products such as Heinz to
celebrity personality brands such as Bob Dylan and even sports teams. There was also a wide
variation in level of attachment, and love throughout the sample, as can be seen in the univariate
statistics found in appendix (Appendix B.)
In an effort to control for some brand related attributes known to affect the brand
relationship, several brand related antecedents were also included in the study (see Appendix).
These were sourced from previous research in brand relationships. The brand personality
congruence construct is a two item measure from Malar et al. (2011) measuring the congruence
of the consumer's actual self with the personality of the brand. Consumer brand identification
(Bergkvist et al, 2010) is a one item measure consisting of a zipper scale with two rows of circles
which get increasingly close until they overlap. The respondent is asked to imagine that the circle
on the left represents their personal identity and the one on the right represents the personality of
the brand; they are then asked to choose which set of circles best represents the level of overlap
between them. Perception of brand symbolism is a nine item scale sourced from Souiden and
M'Saad (2011) and was used as a proxy measure in order to assess the symbolic (versus

16
utilitarian) nature of the brand chosen by the respondent. Brand anthropomorphization is a two-
item scale which aims to measure the level to which the respondent anthropomorphizes their
chosen brand. Sense of community, a three-item scale, was designed to measure the extent to
which the respondent identifies with other users of their brand. Consumers' preference for
closeness (Mende et al. 2013) with their brand was also measured, using an eight item scale.
Finally, the survey also included Escalas's (2004) self-brand connections seven item scale,
designed to measure the degree to which consumers integrate their brand within their self-
concept.
3. Brand Relationship Measures
Several measures of brand relationships were used as dependent constructs to be tested.
The reason for testing several constructs was that each was originally conceptualized to measure
a slightly different aspect of the brand relationship. The inclusion of several, related dependent
constructs allowed for an examination of the relative impact of antecedents on these consumer-
brand relationship measures. Brand attachment (Thomson et al, 2005) was measured by using the
original ten item scale, as well as Park et al.'s (2010) four item brand attachment scale. The first
is composed of a list of ten adjectives, and the respondents are asked how well the adjectives
describe their feelings about the brand, whereas the second one is composed of four questions
about the consumer's attachment to the brand. Brand love (Carroll & Ahuvia 2006) was
measured using a two-item overall measure used by Batra et al. (2012), as well as the original
ten-item scale developed by Carroll and Ahuvia (2006). Romantic brand love (Sarkar et al.
2012), an eight-item scale, and brand romance (Patwardhan et al. 2011), a twelve-item scale,
were also measured in order to get a full spectrum of the different feelings a consumer can have
for their brands. Finally, Fournier's (1998) brand relationship quality measure was included in
17
order to capture a slightly different aspect than the emotional connection, which includes an
evaluative component. The scale used consisted of nine items and was sourced from Mende et al.
(2013) and was composed of nine items. Finally several brand relationship characteristics such as
the length of the relationship, whether the brand was purchased before, the setting where the
brand is used were included in the study as control variables.
B. Survey Administration and Preliminary Data Analysis
The final questionnaire was composed of a total of 200 questions. First, participants
completed scales measuring different facets of their individual personalities. Next, respondents
were asked to choose and state "the brand [they] love most" and were informed that the
remainder of the survey would pertain to this chosen brand. Subsequently, the respondents were
asked to answer the scales pertaining to their connection to the brand, perceptions of the brand's
identity, and finally their level of emotional connection with the brand, using several different
scales designed to measure different characteristics of the brand-consumer relationship. Finally,
general demographic questions were asked to be used as control variables. The full questionnaire
is included in the appendix.
In an effort to get a representative sample of Canadian consumers and a high response
rate, the survey was administered through an online survey panel provided by Research Now.
Panel members were contacted by e-mail in order to participate in the research project and were
offered a chance to enter a draw to win cash and prizes in lieu of remuneration. The study was
completed during the first week of April 2015, and the median time for completion of the survey
was 20.4 minutes. The original sample included a total of 608 complete responses.

18
After removing data of participants with invariant response patterns, the final sample was
composed of 540 complete responses. The final sample consisted of 47.78% male and 52.22%
female repondents, with a large proportion (69.81%) from a non-Hispanic white or European
cultural background. The mean age of the respondents was 46.46 years and 81.11% of
respondents held at least a high school diploma. The majority of respondents (90.93%) reported
being perfectly fluent in English.

19
IV. RESULTS
A. Preliminary data analysis
As a first step, a univariate analysis was ran, examining normality of each item in order to
assess feasibility of subsequent analyses. Almost all items show Skewness and Kurtosis scores
within the acceptable range of |2| which suggests that assumptions or normality are satisfied.
Only two measures of overall brand love (BL_O) fall outside of the acceptable range and were
thereby eliminated from subsequent analyses. Full univariate statistics are included in the
Appendix.
Although the scales used in this research were sourced from previous literature and were
well validated, the researcher proceeded by evaluating expected factor structures as well as
reliability of each scale prior to the hypothesis tests. The results of this first round of analysis are
summarized in the table 1.

20
Table 1 - Preliminary Reliability Analysis
Table 1 suggests that only a few of the scales (*) performed adequately according to
suggested cutoffs for a Cronbach's Alpha of 0.8 for applied research (Nunally 1978) and with the
expected factor structures in the preliminary analyses. Next, we will discuss steps taken to
improve scale reliabilities for the remaining scales.
B. Factor Analysis and Item-Reduction
In order to diagnose problematic item loadings, multiple factor analyses were performed
on each construct, conducted on a random sub-sample of 50 respondents, starting with the big
five indicators of personality. After eliminating items that did not load as expected and showed
low communality, a stable factor structure was obtained (Table 2). However, the last factor was
dropped due to the fact that only a single indicator loaded adequately.
Standardized
Cronbach's
Alpha
Alpha higher if
item removed?
#Factor
(EFA)
% Variance
Explained
BFI_Extraversion .67 Yes (.723) 1 64.6%
BFI_Agreeableness .56 Yes (.580) 2 72.5%
BFI_Conscientiousness .697 No 1 52.5%
BFI_Neuroticism .691 No 1 52.1%
BFI_Openness .31 Yes (.345) 2 60.4%
ECR_Avoidance .809 No 2 77.5%
ECR_Anxiety .816 Yes (.841) 1 53.0%
Self-Esteem .888 Yes (.938) 1 75.8%
Social Connectedness .943 No 2 69.0%
Need for Affect .865 Yes (.876) 2 62.0%
Sex-Role Identity - Masculinity .88 No 2 62.6%
Sex-Role Identity - Femininity * .941 Yes (.943) 1 66.0%
Brand Anthropomorphization * .921 No 1 92.7%
Brand Personality Congruence * .915 No 1 85.5%
Sense of Community * .867 Yes (.871) 1 79.1%
Perception of Brand Symbolism * .938 No 1 66.8%
Customer AS - Anxiety * .887 No 1 74.8%
Customer AS - Avoidance * .869 No 1 72.0%
Preference for Closeness .71 Yes (.804) 2 64.7%
Self-Brand Connection .928 Yes (.938) 1 70.4%
Brand Love - 10 item .916 Yes (.924) 2 72.5%
"Romantic" Brand Love - 8 item .936 No 1 69.5%
Brand Romance - Unifactorial Solution .892 Yes (.899) 2 67.3%
Brand Attachment - Scale 1 * .909 No 1 78.7%
Brand Attachment - Scale 2 * .963 No 1 75.2%
Brand Attachmnet - Combined Scales * .966 No 1 69.3%
Brand Relationship Quality - Unifactorial Solution .928 Yes (.937) 2 76.5%
Preliminary Analysis

21
Next, the measures of attachment styles were assessed using the same method. It was
found that the reverse-coded items were problematic and seemed to load on a separate third
factor. In order to eliminate this issue, the reverse-coded items were eliminated from subsequent
analyses. The final factor structure is presented in table 3.
Factor1 Factor2 Factor3 Factor4 Factor5
BFI_Extraversion 1 0.701024 0.161962 0.215907 -0.21342 0.17921654
BFI_Extraversion 3 0.854403 -0.08272 -0.08628 0.124806 -0.0373833
BFI_Extraversion 4 0.833999 -0.03416 -0.12206 0.037768 -0.0842705
BFI_Agreeableness 1 -0.0875 0.972248 -0.15319 0.00428 -0.0332914
BFI_Agreeableness 2 0.08169 0.784722 0.167202 0.054088 0.00492236
BFI_Conscientiousness 3 0.066009 -0.06795 0.03103 0.881892 0.05409251
BFI_Conscientiousness 4 -0.03879 0.13382 0.044354 0.839409 0.00290047
BFI_Neuroticism 1 -0.19253 -0.04608 0.847365 0.012751 0.04039701
BFI_Neuroticism 2 0.098163 -0.00678 0.863245 0.058693 -0.1080358
BFI_Openness 2 -0.01591 -0.02785 -0.06206 0.051809 1.00127488
Best Solution - Variance Explained 74.77%
Last 2 factors Eigen 0.997, 0.902
Rotated Factor Pattern (Standardized Regression Coefficients)
Factor1 Factor2
ECR_Anxiety 1 0.87524 -0.16158
ECR_Anxiety 5 0.78821 -0.03946
ECR_Anxiety 3 0.74271 0.08191
ECR_Anxiety 6 0.68761 0.24226
ECR_Anxiety 2 0.59268 0.26746
ECR_Avoidance 4 -0.09901 0.95461
ECR_Avoidance 6 -0.02443 0.89501
ECR_Avoidance 2 0.31306 0.63422
Best Solution
Variance Explained 68.13%
Rotated Factor Pattern (Standardized
Regression Coefficients)
Table 2 - Final Factor Structure - Big Five Indicators of Personality
Table 3 - Final Factor Structure - Attachment Style

22
Table 4 - Brand Romance 3-Factor Solution
The scales for self-esteem, social connectedness, and brand love were also reduced by
removing all reverse-coded items due to the fact that they consistently cross-loaded on separate
factors and attained adequate levels of reliability and expected factor structures as a result.
The item "I am a very emotional person." in the need for affect scale showed low
communality(0.526), cross-loaded moderately on both factors and was suggested as a candidate
for removal from the prior reliability analysis. After its removal, the expected factor structure
was found as well as adequate reliability scores.
Using a similar strategies, problematic items from the other scales were assessed. Several
items were removed from the sex-role identity scale, the preference for closeness scale, the self-
brand connection scale and the romantic brand love scale; improving the factor structures by
reducing cross-loading items and items showing communalities under 0.6.
In their article, Patwardhan et al. (2011) defined brand romance as a three factor
construct, however the findings suggested a two-factor solution. When the factor structure was
forced on three factors, the items loaded correctly, however one of the factors showed a high
correlation with both others, as shown in the following tables (Table 4 and 5).
Factor1 Factor2 Factor3
Factor1 1 -0.4935 0.12258
Factor2 -0.4935 1 -0.54417
Factor3 0.12258 -0.5442 1
Reference Axis Correlations
Table 5 - Brand Romance - Correlation between Factors
Factor1 Factor2 Factor3
Brand Romance 11 0.92216 -0.01797 -0.0773
Brand Romance 9 0.89791 -0.01737 0.03252
Brand Romance 10 0.88524 0.04283 0.01596
Brand Romance 12 0.88184 0.03956 0.0485
Brand Romance 7 -0.11373 0.86987 0.11393
Brand Romance 6 0.13074 0.8319 -0.0363
Brand Romance 5 0.08575 0.77222 0.06507
Brand Romance 3 -0.06322 -0.11123 0.96891
Brand Romance 2 0.05426 0.18828 0.70987
Brand Romance 1 0.06464 0.20221 0.66874
Forced 3-Factor solution
Variance Explained: 78%
Rotated Factor Pattern (Standardized Regression
Coefficients)

23
Since the original scale was developed as a higher-order construct, a forced single factor
solution was also attempted in order to simplify analysis and increase available degrees of
freedom in subsequent analyses. A stable solution was found after removal of three items
showing low communalities as well as low loadings on the factor. This solution, representing the
higher-order brand romance construct was retained for subsequent analysis.
Finally, the brand relationship quality scale presented three items which loaded poorly,
and reduced reliability. Removing them resulted in a strongly loading set of items and a stable
factor structure.
C. Confirmatory Factor Analysis
Confirmatory Factor Analysis was performed on the resulting constructs using the entire
sample (N=540) as a final validation of the factor structures before the final analysis was
performed. The following table presents the results of the CFA. It is important to note that
although all of the constructs failed the chi-square test, it is known that this test is highly
susceptible to sample size, and its failure may be a result of the large sample size. In most cases,
the majority of the fit statistics such as Goodness of fit, Adjusted GFI, Standardized RMSR are
above suggested levels and are deemed acceptable. The results can be seen in table 6.

24
Table 6 - Confirmatory Factor Analysis Fit Summary
D. Final Reliability Analysis
Once satisfactory factor structures were obtained, a final check was performed in order to
assess final average variance extracted, composite reliabilities and Cronbach's alpha for each
construct. The results in the following table show that the large majority of scales perform quite
well with average variance extracted well above 60% in most cases, composite reliabilities, the
reliability of each construct in the tested model, above .80 and Cronbach's alphas well above .80.
Construct
BFI ECR
Social
Connectednes
s
NFASex-Role
Identity
Perception
Brand
Symbolism
Customer
Attachment
Style
Preference
Closeness
Self-Brand
Connection
Brand
Love
Romantic
Brand
Love
Brand
Romance
Brand
AttachmentBRQ
N Observations 540 540 540 540 540 540 540 540 540 540 540 540 540 540
Chi-Square 164.97 100.941 61.779 175.9113 577.8338 350.594 91.9977 8.5847 98.24 124.45 229.44 308.0279 412.569 33.1802
Chi-Square DF 25 19 20 43 89 27 19 2 9 20 20 49 76 9
Pr > Chi-Square <.0001 <.0001 <.0001 <0.0001 <0.0001 <0.0001 <0.0001 0.0137 <0.0001 <0.0001 <0.0001 <0.0001 <0.0001 0.0001
Hoelter Critical N 124 161 275 182 105 62 177 377 93 137 74 117 128 275
Standardized RMSR
(SRMSR)
0.0672 0.0492 0.0177 0.0499 0.0724 0.0451 0.0612 0.0674 0.0268 0.0277 0.0422 0.0744 0.0299 0.0141
Goodness of Fit Index
(GFI)
0.9467 0.9508 0.9727 0.941 0.8659 0.8698 0.9596 0.9921 0.9447 0.9441 0.8904 0.909 0.8964 0.9809
Adjusted GFI (AGFI) 0.8828 0.9067 0.9508 0.9095 0.8192 0.783 0.9235 0.9605 0.871 0.8994 0.8027 0.8552 0.8569 0.9554
RMSEA Estimate 0.1019 0.0894 0.0623 0.0757 0.1009 0.1491 0.0844 0.0782 0.1356 0.0984 0.1394 0.099 0.0906 0.0706
RMSEA Lower 90%
Confidence Limit
0.0874 0.0727 0.045 0.0643 0.0932 0.1354 0.0676 0.0301 0.1122 0.0823 0.1235 0.0886 0.0822 0.0459
RMSEA Upper 90%
Confidence Limit
0.117 0.107 0.0802 0.0875 0.1089 0.1632 0.1021 0.1351 0.1605 0.1154 0.1559 0.1098 0.0993 0.0971
Probability of Close Fit <.0001 <.0001 0.116 0.0002 <0.0001 <0.0001 0.0005 0.1456 <0.0001 <0.0001 <0.0001 <0.0001 <0.0001 0.082
Bentler Comparative Fit
Index
0.8862 0.9585 0.988 0.9545 0.9161 0.9113 0.9688 0.9902 0.9668 0.969 0.9373 0.9358 0.955 0.9911
Bentler-Bonett NFI 0.8706 0.9496 0.9824 0.9409 0.9025 0.9048 0.9611 0.9873 0.9636 0.9634 0.9319 0.9248 0.9455 0.9879
Chi-Square/DF 6.5988 5.31268 3.08895 4.09096 6.492515 12.98496 4.8419842 4.29235 10.915556 6.2225 11.472 6.286284 5.4285395 3.68669
Fit Summary

25
As we can see in table 7, two factors showed reliability scores slightly under the
generally accepted minimum .7 score. However, these were kept in the main analysis for the time
being. The variance extracted for the brand romance construct were also quite low. This may be
due to the fact that a one-dimensional solution was forced.
E. Correlation Analysis
The final step in the preliminary analysis consisted of a correlation analysis between the
main constructs of the study. The objective was two-fold: first, potential patterns between the
variables were examined, in order to inform subsequent analysis; subsequently, discriminant
validity was also assessed by examining correlations that were unusually high.
The results of the correlation analysis (see appendix) show a few interesting patterns.
Firstly, a large portion of the individual level constructs show significant correlations, which is to
Average
Variance
Composite
Reliability
Cronbachs
Alpha
BFI - Agreeableness 0.79 0.88 0.73
BFI - Conscientiousness 0.7 0.82 0.56
BFI - Extraversion 0.8 0.89 0.75
BFI - Neuroticism 0.74 0.85 0.67
Brand Anthropomorphization 0.93 0.96 0.92
Brand Attachment 0.69 0.97 0.97
Brand Love 0.71 0.95 0.94
Brand Personality Congruence 0.86 0.95 0.92
Brand Relationship Quality 0.77 0.95 0.94
Brand Romance 0.47 0.91 0.89
Customer AS - Anxiety 0.74 0.92 0.89
Customer AS - Avoidance 0.79 0.92 0.87
ECR Avoidance 0.75 0.9 0.84
ECR Anxiety 0.61 0.88 0.84
Sex-Role Identity - Femininity 0.66 0.95 0.94
Sex-Role Identity - Masculinity 0.66 0.91 0.88
Need for Affect - Approach 0.64 0.9 0.86
Need for Affect - Avoid 0.62 0.91 0.88
Perception of Brand Symbolism 0.67 0.95 0.94
Preference for Closeness 0.63 0.87 0.8
Romantic Brand Love 0.72 0.95 0.94
Self-Brand Connection 0.76 0.95 0.94
Self Esteem 0.89 0.96 0.94
Sense of Community 0.79 0.92 0.87
Social Connectedness 0.72 0.95 0.94
Table 7 - Final Reliability Analysis - All Constructs

26
be expected since the measures are meant to capture different aspects of an individual's
personality. A noteworthy correlation is between the femininity factor of the sex-role identity
construct and the agreeableness factor of the big five personality indicators (.85). This gives
some weight to the validity of both scales since the femininity factor measures items such as
compassion, gentleness and sympathy all of which are in line with a higher rating on the
agreeableness factor of the big five indicators of personality.
The brand-related independent variables also show significant positive correlations
between each-other as well as a few interesting correlations with the individual-level variables
such as the agreeableness factor of the big five indicators, the anxiety factor of the attachment
styles construct, the motivation to approach factor of the need for affect construct and both sex-
role identity factors. Finally, these variables also show high correlations with the dependent
emotional attachment variables. Once again, these correlations were expected since these
constructs aim to measure different aspects of the brand-self connection as well as perceptions
about the relationship with the brand.
Finally, the dependent variables of the study, measuring different facets of the emotional
relationship between the consumer and their brand all show high correlations between each
other. This was also expected, nevertheless a few of the correlations were worrisome in terms of
attaining discriminant validity. Brand love and romantic brand love show a correlation of .87,
however this was not completely unexpected since both constructs stem from similar concepts of
love, passion and dedication to a brand. Romantic brand love also shows a high correlation with
self-brand connection (.83) and brand attachment (.86). In order to test discriminant validity
further, two additional tests were performed the Fornell-Lacker Criterion was calculated as well
as the Hetero-Trait Mono-Trait Ratio. None of these correlations or discriminant validity

27
statistics are above .85 the suggested cut-off (Vorhees et al. 2015), although a few statistics are
close (see tables in appendix).
At this stage, it was decided to exclude the brand romance construct from further analysis
due to a low average variance extracted combined with high correlations with most of the other
brand-relationship constructs.
Before moving on to the main analysis, a few additional patterns in the correlation matrix
are worthy of mention. First, it is interesting to note that brand personality congruence, sense of
community, perception of brand symbolism and self-brand connection, show high correlations to
most of the brand relationship variables. This was expected since these constructs have been
shown as antecedents of at least one of the dependent variables in previous studies. The
avoidance factor of the customer attachment style construct shows high negative correlations
with the dependent variables, which is also in line with literature. Finally, and perhaps most
interestingly, brand relationship quality seems to stand out as a clearly separate construct from
the four other relationship measures. Although it is significantly correlated to the others, the
correlation statistics are much lower in general and some of the patterns of correlation with
independent constructs are widely different. For example, brand relationship quality seems to be
the only dependent variable significantly correlated with the neuroticism factor of the big five
indicators. It also exhibits lower correlations with the previously mentioned brand-related
independent variables, and even seems to be negatively related to the anxiety factor of the
customer attachment style construct, whereas all the other dependent variables show moderate
positive correlations.

28
F. Main Analysis
The main analysis for this study was a Structural Equation Model performed on a Smart-
PLS platform, which uses a Partial Least Squared algorithm for path estimation and a
bootstrapping method for significance testing. A simplified path model of the study follows and
a full path model can be found in appendix (Appendix F). The path model tested included the
individual-level constructs with hypothesized relationships to brand-relationship constructs such
as brand love and related outcome variables, but also brand-related constructs to control for their
influence on these outcomes.
1. Model Comparison
A path was drawn from each of the independent factors discussed previously, as well as
the control variables included in the study, leading to each of the brand relationship constructs.
In the first round of analysis, two separate models were assessed, one containing only the
Brand Relationship
Constructs
Brand-
Related
Constructs
Individual-
Level
Constructs
Figure 2 - Simplified path model tested

29
individual-level constructs and one containing only the brand related constructs (see Table 8). An
interesting first result is that the brand related constructs performed significantly better in terms
of variance explained, measured by the R-square for each of the dependent constructs. In fact, if
the model with only the brand-related constructs is compared to the full model, we can see that
the variance explained after the addition of the individual-level constructs increases only slightly,
by a total of one to two percent for each dependent variable; this suggests that individual level
variables relate to brand relationships to a lesser degree than brand-related variables.
Table 8 - Comparison of R-Square of different models tested
Another noteworthy result of this first model comparison is that the variance of brand
relationship quality explained by the examined constructs is significantly lower than that of all
the other brand relationship constructs. This may be due to the fact that the quality of the brand
relationship may be attributed to highly personal experiences with the brand or other brand
initiated actions which are not examined herein.
Brand Relationship
Construct R Square
Brand Relationship
Construct R Square
Brand Relationship
Construct R Square
Brand Attachment 0.17 Brand Attachment 0.65 Brand Attachment 0.67
Brand Love 0.16 Brand Love 0.64 Brand Love 0.66
Romantic Brand Love 0.17 Romantic Brand Love 0.76 Romantic Brand Love 0.77
Brand Relationship Quality 0.14 Brand Relationship Quality 0.46 Brand Relationship Quality 0.48
Individual-Level Constructs Model Brand-Related Constructs Model Full Model

30
2. Analysis of Resulting Path Coefficients
The results of the full path analysis are presented in the table 9.
Table 9 - Path Coefficients - Full Model
The results show that the age of the consumer as well as their income have marginally
significant negative effects and the masculinity factor of the sex-role identity has a significant
negative effect on the emotional attachment to brands felt by consumers. Additionally, the
Brand
Attachment Brand Love
Romantic
Brand Love
Brand
Relationship
Quality
Age -0.06* -0.09*** -0.05** -0.02
BFI - Agreeableness 0.03 0 0.02 0.04
BFI - Conscientiousness -0.05 -0.01 -0.03 0.04
BFI - Extraversion 0 0.03 0.03 0
BFI - Neuroticism 0.03 0.07* 0.04 0.07
Brand Anthropomorphization 0.07** 0.02 0.07** 0.02
Brand Personality Congruence -0.03 -0.11*** -0.07* -0.14***
Brand Purchased 0 0.04* -0.01 0.01
Brand Relationship Status 0.02 0.08*** 0.01 0.19***
Brand Used -0.01 0.03 0.03 -0.08***
Customer AS - Anxiety -0.01 -0.13*** -0.04 -0.28***
Customer AS - Avoidance -0.2*** -0.36*** -0.22*** -0.32***
Customer-Brand Identification 0.08*** 0.02 0.04* -0.03
Education 0.03 0.01 0 -0.01
Attachment Style - Avoidance -0.01 0.04 0.03 0.05
Attachment Style - Anxiety 0.03 0.04 0.02 0.09*
Gender -0.04 -0.01 0 0.01
Income -0.04* 0 0.02 -0.01
Length of Relationship -0.03 0.02 -0.01 0.07*
Need for Affect - Approach 0.03 0.02 0.03 -0.06
Need for Affect - Avoid 0.10** 0.04 0.06 -0.02
Perception of Brand Symbolism 0.15*** 0.15*** 0.16*** 0.12**
Preference for Closeness 0.07 0.11** 0.15*** 0.08
Self-Brand Connection 0.34*** 0.28*** 0.39*** 0.14*
Self Esteem 0.01 -0.06 -0.02 0
Sense of Community 0.05 0.04 0.04 0.09
Sex-Role Identity - Femininity 0.06 0.13** 0.04 0.12*
Sex-Role Identity - Masculinity -0.1*** -0.04 -0.06 0.01
Social Connectedness Scale 0 -0.05 -0.02 0.02
Two-tailed test significant at the *p<=0.1 level, **p<=0.05 level, ***p<=0.01 level

31
motivation to avoid emotions factor of the need for affect construct also shows a positive effect.
In the brand-related group, brand anthropomorphization, customer-brand identification and
perception of brand symbolism all seem to drive higher levels of brand attachment. Finally, the
main driver of brand attachment, is the self-brand connection construct.
In the case of brand love, a customer's age shows a highly significant negative effect,
whereas a consumer's feminine identity as well as a higher score on the neuroticism factor of the
big five both show significant positive effects. In the brand related group of constructs,
perception of brand symbolism and self-brand connection once again show strongly positive
effects. However, interestingly brand-personality congruence seems to have a negative effect on
consumer's feelings of love for the brand. Consumers exhibiting high anxiety and avoidance in
their attachment styles in a consumer setting also report lower levels of love towards their brand.
Finally, a customer with a higher preference for closeness with their brand also tends to feel
higher level of love for it. Two of the control variables exhibited the expected pattern: if the
brand had been purchased previously the higher the level of love and similarly if the relationship
with the brand was ongoing.
For romantic brand love, age seems to be the only individual level factor to have a
significant effect. Once again, consumers' perception of brand symbolism, preference for
closeness and high self-brand connection drive higher levels of romantic feelings for the brand.
Customer-brand identification and brand anthropomorphization both show a small positive
effect, however brand personality congruence once again results in a marginally significant
negative effect on romantic brand love. Finally, the avoidance factor of a customer's attachment
style also results in lower levels of romantic involvement with the brand.

32
Finally, the quality of the brand relationship seems to be marginally positively linked to a
customer's feminine sex-role identity. Additionally, and most interestingly, the anxiety factor of
a consumer's relationship attachment style seems to increase a consumer's relationship quality
with their brands. Similarly to the previous dependent variables, perception of brand symbolism
and self-brand connections also positively affect the quality of the brand relationship. Moreover,
once again, brand personality congruence exhibits a negative effect on the quality of the
relationship. Finally, both factors of customer attachment style have a highly significant negative
effect on brand relationship quality. Additionally, a few of the control variables show significant
effects, both the current status of the brand relationship as well as its length have a positive effect
on the perceived quality of the relationship; whereas the setting in which the brand is used results
in a slight negative effect, lower when the brand is used in private.
3. Hypothesis Tests
The results of this model do not support Hypothesis 1 in that self-esteem shows no
significant relationship with any of the dependent brand relationship variables.
Hypothesis 2 is partially supported. Although the individual difference variable
attachment anxiety is not significantly related to brand love, it does present a marginally
significant positive effect on brand relationship quality. Furthermore, the customer attachment
anxiety construct, specifically designed to capture individual preferences in a consumer setting
shows highly significant negative effect on both brand love and brand relationship quality.
Similarly, hypothesis 3 is partially supported. Once more, the individual attachment
avoidance trait had no significant effect on any of the dependent variables, whereas the customer

33
specific version of the construct shows an important, highly significant negative effect on each
one of the brand relationship constructs.
Hypothesis 4 is not supported in the model. Extroversion does not seem to have any
significant effect on any of the dependent constructs.
Finally, hypothesis 5 is not supported, as need for affect does not show any significant
effect on brand love. The avoidance factor does however show a weak, but significant, positive
effect on brand attachment.
In the next section, we will discuss potential explanations to the observed effects, as well
as possible implications in more depth.

34
V. DISCUSSION
A. Overall Results
Contrary to the hypotheses advanced in this research, individual-level variables do not
seem to affect brand relationships significantly. In fact, the average R-Square explained by
individual difference variables after accounting for brand related variables is only between one
and two percent. This is in line with previous findings in consumer behavior research (See
Kassarjian 1971 for a review). However, it is important to note that, as suggested by Kassarjian
(1971), these results may be due to a number of potential issues in measurement and reliability
including but not limited to using measures which are not developped for the purpose of studying
consumer behavior. According to Kassarjian (1971) finding even limited support in this line of
questioning is remarkable.Nonetheless, these result suggests that what is essential in order to
foster successful emotional relationships with customers, is not who marketers are targeting, but
more importantly a clearly symbolic brand, as well as a high level of connection with the target
customer's self concepts. This result is informative for marketers, as it suggests that the initiative
to foster an emotional relationship with consumers is largely within their control.
B. Individual-Level Variables
Despite this, a number of individual factors show significant effects on the dependent
variables, which lead to a number of interesting implications. Firstly, the older a customer, the
less likely they are to engage in a relationship with a brand. This may be due to the fact that older
customers are less interested in investing emotionally with brands. They may simply buy the
brands they have always bought or are accustomed to, without necessarily being emotionally
devoted to that brand. This may be due to a tendency of older customers to be more skeptical

35
(Obermiller and Spangenberg, 2000), and perhaps less inclined to believe in a brand's projected
image (Eisend, and Stokburger-Sauer, 2013).
A higher income bracket shows a similar pattern: as a whole, the higher the income of the
customer, the lower his attachment to the brand. In this case, it is possible that the customer's
choices are more strongly based in more functional features of the products they purchase such
as quality and less so on the brand that creates them. This is in line with findings from Eisend
and Stokburger-Sauer's (2013) meta-analysis which suggests that higher education level, which
may be correlated with higher incomes, may render consumers more skeptical to the brand's
projected personality (Aaker 1997).
Secondly, although the biological gender of the customer does not seem to affect the
level of emotional closeness with their brand, their perception of their sex-role identity certainly
does. Specifically, a feminine identity seems to positively impact both the level of brand love felt
towards the brand as well as the perceived relationship quality with the brand. On the other hand,
a masculine identity reduces the strength of the attachment felt towards a brand. These results
seem to suggest that a more caring, loyal and compassionate personality will extend to higher
levels of involvement with brands, and higher investment into the brand relationship. This is in
line with findings in interpersonal relationships suggesting that individuals with high levels of
agreeableness will experience higher levels of satisfaction in relationships (Ozer and Benet-
Martinez, 2006). As seen previously, a feminine identity seems to be closely related with high
levels of agreeableness.
Additionally, a few of the psychographic variables studied show some interesting effects
as well. A higher score on the neuroticism factor of the big five indicators of personality seems

36
to be linked to higher levels of brand love. This result is more complex to interpret however, a
potential explanation is that a person who is more neurotic, finds solace in a brand that delivers
successfully on its promises and thus suggests that the customer can rely on it time and again. As
brand love's main focus is on how the brand makes the customer feel, we find this a plausible
explanation.
The motivation to avoid emotions factor of the need for affect scale shows a positive
effect on brand attachment. This was surprising due to the fact that attachment is an emotional
response and the expected direction of the effect of avoidance was opposite to the one found. It is
possible however that, as suggested by Proksch et al. (2013), people who are less comfortable in
interpersonal relationships may compensate by relating more strongly to brands. A similar effect
can be seen in the link between higher attachment anxiety and brand relationship quality: the
positive effect witnessed herein supports this hypothesis.
C. Brand Related Variables
One of the secondary goals of this study was to confirm previously established
antecedents of brand relationships as well as compare their effects when studied all at once. To
do so, we introduced several brand-related variables previously shown to affect one or the other
brand relationship constructs into a large model containing several of these dependent constructs.
Overall, it seems that some of the antecedents previously suggested are not as important when
accounting for others, and only a few show very strong effects on the dependent constructs.
Firstly, in the case of consumer-brand identification, previously shown to have a positive
effect on brand attachment (Porksch et al., 2013) and brand love (Bergkvist et al., 2010); only the
effect on brand attachment was replicated herein as well as a marginally significant effect on

37
romantic brand love. The reasoning for this result is that other covariates included in the model
are accounting for the aforementioned effect and thus the consumer-brand identification is
superfluous.
It is highly likely that the inclusion of the self-brand connection construct is partly
responsible for this result. This construct is a much richer concept which encompasses different
facets of the connection between the consumers' actual self and the perceived brand concept. It is
likely that self-brand connection accounts for much of the variation of consumer-brand
identification as can be witnessed from the moderately high correlation between the two
variables. Interestingly, this correlation is higher than any of the correlations observed between
consumer brand identification and the dependent constructs. In turn, self-brand connection shows
by far the largest positive effect on each of the dependent variables, implying that it is in fact one
of the most important antecedents to a successful brand relationship. Conversely, it is remarkable
to note that the effect of self-brand connection on the quality of the brand relationship is only
marginally significant, suggesting that there may be other more important variables to consider
in that case.
Next, brand personality congruence, previously shown to increase emotional brand
attachment (Malär et al., 2011; Swaminathan et al., 2008) was not found to have an effect on
brand attachment in this study. Additionally, and perhaps more importantly, brand personality
congruence showed a highly significant negative effect on both brand love and brand
relationship quality and a marginally significant negative effect on romantic brand love. This
result was highly unexpected and quite difficult to interpret. It is possible that consumers are not
necessarily interested in entering emotional brand relationship with brands that mirror their own
personality too closely. This may point to the importance of brand congruence with an ideal self

38
(Malär et al. 2011); although an exploration of this reasoning is beyond the scope of this study, it
may be worth pursuing in future research. A final potential explanation is that similarly to
customer-brand identification, the effect of brand personality congruence was altered by the
inclusion of more powerful antecedents. It is possible that, after accounting for the effect of other
related variables, such as self-brand connections, increasing levels of congruency between the
brand personality and that of the consumer is detrimental.
Brand anthropomorphization, which was suggested by Fournier and Alvarez (2012) as an
important antecedent to any brand relationship in the "brands as intentional agents" framework,
only shows a significant positive effect on brand attachment and romantic brand love. This
suggests that feelings of deep love and commitment as well as the quality of the brand
relationship do not hinge on an anthropomorphization of the brand in the consumer's minds.
As suggested previously by Carroll and Ahuvia (2006) and Malär et al. (2011), a brand's
symbolic feature, or in this case the perception thereof, is also a crucial element of a meaningful
brand relationship. This result was expected, and can be explained by the contention that if a
brand is purely utilitarian in nature, then it is less likely that the relationship will evolve beyond a
merely practical satisfaction based on the quality of the product purchased. Customer's
preference for closeness with their brand performed as expected, as it had previously been linked
to higher levels of loyalty (Mende et al. 2013), it stands to reason that it could have a positive
effect on loyal customer's feelings for their preferred brands. More specifically, higher
preference for closeness was significantly and positively linked to both brand love and romantic
brand love. This makes sense since closeness with the partner is an integral part of a loving
relationship.
39
As mentioned previously, the effects of both factors of the customer-specific attachment
style construct presented expected patterns of effects since a low score on both factors was
previously linked to higher levels of closeness with the brand as well as improved loyalty
(Mende et al. 2013). In this case, the higher the customer's rating on avoidance and anxiety, the
lower the love felt for the brand and most importantly, the lower the perceived quality of the
relationship with the brand. Conversely, the avoidance factor also seems to affect the attachment
felt towards the brand as well as the level of romantic brand love, whereas the anxiety factor
does not. It is important to note that although a consumer's preferred attachment style in an
interpersonal setting had no notable effects, the domain-specific measure of a customer's
attachment style seems to be important in understanding brand relationships.
Interestingly, a sense of community, previously shown to be an important antecedent to a
brand love relationship (Bergkvist and Bech-Larsen 2010) does not seem to relate significantly
to any of the dependent variables. Once more, this may be partly due to the fact that some of the
variation accounted for by this construct was accounted for by one of the more prominent
variables entered in the model.
Last but not least, some of the relationship-related control variables also showed some
interesting effects. Specifically, the likelihood of falling in love with a brand increased slightly if
the brand was ever purchased before, and the quality of the relationship was rated higher with a
longer relationship. The setting in which the brand is used, specifically when the brand is used
publicly rather than privately, results in a slightly lower quality of brand relationship. This
suggests a closer bond with brands that are used in a private setting, where a more personal
connection can be created. And finally, the current status of the relationship also seems to affect
the level of love felt towards the brand as well as the quality of the relationship. This is also in

40
line with expectations since a continuous relationship is likely one that boasts a certain level of
attachment as well as satisfaction.
One addendum to all the aforementioned effects however is that causality cannot be
established and should not be implied. For example, it cannot be said that a customer with low
attachment avoidance in a consumer setting is more likely to fall in love with a brand. It is just as
likely that the customer in question exhibits lower levels of avoidance towards the brand in
question due to their positive emotional bond with their brand. In fact, this is one of the main
limitations of this study which will be discussed in further detail in the next section.

41
VI. LIMITATIONS AND FUTURE RESEARCH
First and foremost, this research is correlational in nature. One of the main limitations is
therefore that causality cannot be inferred. This is mainly due to the nature of the measurement
materials, notably the survey method. Since all the measurements were taken within a single time
period, it is not possible to isolate the causal factors from their consequences. Future research
can be undertaken in order to solve this issue by undertaking, for example, a longitudinal study
with repeated measures over time in order to answer these questions.
Another significant limitation of the study, is that the customer attachment style construct
was by design specifically aimed at the brand chosen by the customer. Although this construct
performed exceedingly well, the results may have been biased by this fact. Future research
should aim to measure this construct separately from the focal brand of the study in order to
measure its impact as an individual difference variable, in terms of a general preference.
In addition, due to financial and time constraints, the final sample size was somewhat
limited for the extent of the structural model tested. In fact, considering that the total number of
paths tested amounted to 108 paths, the number of observations per path (i.e., five) is well under
the recommended threshold (Muthén & Muthén, 2002).
The quality of some of the data points was also of concern. The data screening procedure
reported earlier led to the elimination of 43 cases, accounting for almost 8% of the final sample.
This raises concerns about the data quality obtained through the use of online panel data. This
may have been due in part to the length of the survey administered. Future replications in a
controlled lab environment involving a more stringent control of data quality (e.g., attention
check questions), ideally with a shorter more focused measurement tool may yield better results.

42
Further, related to the previous issue, some of the measurements performed poorly
compared to expectations. As most of the scales used had previously been well validated, the
expectation was that the majority of scale items would follow the expected patterns.
Unfortunately, a number of items had to be eliminated due to poor fit or unexpected loadings.
Interestingly, the bulk of those items were reverse-coded items. This may have been due to poor
comprehension or inattention or lack of interest. It is possible that an in-lab study could have
helped avoid some of these issues.
On a related note, the worst performing scale in the study was the measurement scale for
the big five personality indicators. This was unfortunate since the central variable in the study
was this multi-dimensional measure of consumer personality. Future studies could make use of
more complete versions of the big five measures in order to get a more reliable test of the
potential effect that these may have on consumer's willingness to engage in an emotional
relationship with a brand.
Finally, due to decisions made in the design stage, there was a wide variation in brands
mentioned by respondents. Although this was a decision based on the necessity of measuring the
highest level of emotional involvement with a brand, it may have resulted in unaccounted
variance from brand-level variables such as brand type (symbolic vs. utilitarian), actions or
positioning. Future research can also compare the effects between different types of brands, for
example commercial vs. non-commercial brands, products vs. services, profit vs. non-profit,
religions, sports teams, celebrities as brands, and so forth.
Further, the actual type of the brand was not entered as a variable since that would have
required coding of this variable by raters blind to the hypotheses. Unfortunately, the costs

43
associated with this procedure was beyond the budget awarded for this study. Future studies
could involve multiple data collections with the same respondents. For example: at time one, a
large sample of respondents could be asked to state their most beloved brands; later these
responses could be grouped by brands and the larger groups re-contacted to do a follow-up study
in order to measure the relevant variables while keeping the brand(s) unchanged.

44
VII. THEORETICAL IMPLICATIONS
The main implication arising from this study is that individual difference variables such
as personality do not seem to affect the level of emotional attachment that consumers can feel for
their favorite brands. In fact, it seems that high levels of attachment or love are much more
heavily reliant on the strength of the connection between a consumer and that brand and the
extent to which consumers have accepted the brand as part of their self-image and everyday
reality.
Additionally, some previously established antecedents of brand love were replicated and
thus supported by this research. These include brand symbolism (Carroll and Ahuvia, 2006) and
self-brand connection, which was previously linked to brand attachment (Malär et al, 2010). This
further highlights the importance of those variables in predicting strong emotional relationships
with brands. On the other hand, consumer brand identification and sense of community,
previously believed to be important antecedents to brand love (Bergkvist and Bech-Larsen,
2010) .
Finally, the overall results of the research also point to the conclusion that although they
are correlated, the different brand relationship constructs are definitely distinct from each other
and measure different facets of that relationship. This is especially true for the brand relationship
quality construct which seems to be a much richer construct with a large portion of the variation
that is yet unaccounted. As interesting as it is to compare how these constructs are related to the
hypothesized antecedents, it would also be educational to compare them in terms of how strongly
they are related to managerially relevant outcomes which may be desirable; and most
importantly which among them is the highest predictor of those positive outcomes.
45
VIII. MANAGERIAL IMPLICATIONS
The main implication for managers, is that building a relationship with their customers is
for the most part all up to the managers of these brands. The reality uncovered in this study is
that anyone can fall in love with a brand and as such, the only obstacle to developing that
relationship lies in the image the brand portrays and the experiences that the consumers have
with it.
More specifically, it is clear that the perception of a symbolic brand is a crucial aspect of
developing a brand relationship. In order to fulfill this condition, a brand should be distinctive,
easily recognizable and self-expressive (Carroll and Ahuvia, 2006, Keller 1993). Additionally,
the brand managers can work towards building a certain amount of prestige attached to their
brand and work towards making it a strong status symbol.
Additionally, it is important for brands to encourage their customers to integrate the
brand within their self image, in order to encourage strong self-brand connections. Through
various marketing messages and actions, managers can build a persona with which their
customers can identify easily, or present the brand as a symbol of what the customers want to be.
It is important however that the goal put forth is attainable by the customer within the target
market, so that it is encouraging instead of distancing.
Finally, brand managers can take steps to reduce customer avoidance behavior. This can
be achieved by making sure that each touch point with their customers or potential customers is
as friendly and positive as possible. The goal is to put forth an image of a brand that is not only
approachable, but also dependable, no matter the situation. A brand that genuinely cares for its
customers will in turn be cared for by its customers.

46
IX. CONCLUSION
Although the results of the study were not completely in line with the hypothesized
relationships, some important antecedents of strong brand relationships were supported and an
important implication for brand managers was brought forth. Every single customer has the
potential to develop a strong emotional connection to a brand, and it is a manager's duty to use
the knowledge contained herein to increase the rate at which these relationships develop.

47
X. BIBLIOGRAPHY
Aaker, Jennifer L. (1997), “Dimensions of Brand Personality,” Journal of Marketing Research,
34 (3), 347–56.
Bagozzi, Richard P., Utpal M. Dholakia (2006), "Antecedents and purchase consequences of
customer participation in small group brand communities," International Journal of Research in
Marketing, 23(1), 45–61.
Barak, Benny, Barbara Stern (1986), " Sex-Linked Trait Indexes Among Baby-Boomers and
Pre-Boomers: A Research Note," Advances in consumer research, 13(1), 204-209.
Batra, Rajeev, Aaron Ahuvia, and Richard P. Bagozzi (2012), "Brand Love," Journal of
Marketing, 76(March), 1–16.
Bergkvist, Lars, and Tino Bech-Larsen (2010), "Two Studies of Consequences and Actionable
Antecedents of Brand Love," Journal of Brand Management 17, 7, 504–518.
Brennan, Kelly A., Catherine L. Clark, and Phillip R. Shaver (1998), “Self-Report Measurement
of Adult Attachment: An Integrative Overview,” in Attachment Theory and Close Relationships,
ed. Jeffry A. Simpson and W. Steven Rholes, New York: Guilford, 46–76.
Bowlby, J. (1980). Attachment and loss, Vol. 3. Loss: Sadness and depression. New York: Basic
Books.
Fennis, Bob M., Ad Th. H. Pruyn, Mascha Maasland (2005), "Revisiting the Malleable Self:
Brand Effects on Consumer Self-Perceptions of Personality Traits," Advances in Consumer
Research, 32, 371-377.
Carroll, Barbara A., Aaron C. Ahuvia (2006), "Some Antecedents and Outcomes of Brand
Love," Marketing Letters, 17, 79–89.
Costa, P. T., Jr., & McCrae, R. R. (1985). The NEO Personality Inventory manual. Odessa, FL:
Psychological Assessment Resources.
Chang, Ching Ching (2006), "Context-Induced and Ad-Induced Affect: Individual Differences as
Moderators," Psychology & Marketing, 23(9), 757–782.
Deniz, M. Engin (2011), "An Investigation of Decision Making Styles and the Five-Factor
Personality Traits with Respect to Attachment Styles," Educational Sciences: Theory & Practice,
11(1), 105-113.

48
Diamond Lisa M., and Angela M. Hicks (2005), "Attachment style, current relationship security,
and negative emotions: the mediating role of physiological regulation," Journal of Social and
Personal Relationships, 22 (4), 499–518.
Eisend, Martin, and Nicola E.Stokburger-Sauer (2013), "Brand personality: A meta-analytic
review of antecedents and consequences," Marketing Letters, 24, 205–216.
Escalas, Jennifer Edson (2004), "Narrative Processing: Building Consumer Connections to
Brands," Journal of Consumer Psychology, 14(1-2), 168-1 80.
Fennis, Bob M., Ad Th. H. Pruyn, and Mascha Maasland (2005), "Revisiting the Malleable Self:
Brand Effects on Consumer Self-Perceptions of Personality Traits", Advances in Consumer
Research, 32, 371-377.
Fournier, Susan (1998), “Consumers and Their Brands: Developing Relationship Theory in
Consumer Research,” Journal of Consumer Research, 24 (March), 343–73.
Fournier, Susan, Claudio Alvarez (2012). "Brands as Relationship Partners: Warmth,
Competence, and In-Between," Journal of Consumer Psychology, 22, 177–185.
Gosling, Samuel D., Peter J. Rentfrow, and William B. Swann Jr. (2003), "A very brief measure
of the Big-Five personality domains," Journal of Research in Personality, 37, 504–528.
Gummesson, Evert (1997), "In Search of Marketing Equilibrium: Relationship Marketing Versus
Hypercompetition," Joumal of Marketing Management, 13, 421-430.
Haddock, Maio, Arnold, Huskinson (2008), "Should Persuasion be Affective or Cognitive? The
Moderating Effects of Need for Affect and Need for Cognition," Personality and Social
Psychology Bulletin, 34(6), 769-778.
Hazan, Cindy and Phillip R. Shaver (1987), "Romantic Love Conceptualized as an Attachment
Process," Journal of Personality and Social Psychology, 67, 430-445.
John, Oliver P., and Sanjay Srivastava, (1999), "The Big Five trait taxonomy: History,
measurement, and theoretical perspectives," in L. A. Pervin, & O. P. John (Eds.), Handbook of
personality: Theory and research (102–138). New York: Guilford Press.
Johnson, Allison R. and Matthew Thomson (2003), "Are Consumer Relationships Different?,"
Advances in Consumer Research, 30, 350-351.
Kassarjian, Harold H. (1971), "Personality and Consumer Behavior: A Review," Journal of
Marketing Research, Vol. 8(November), 409-18.
Keller, Kevin Lane (1993), "Conceptualizing, Measuring, and Managing Customer-Based Brand
Equity," Journal of Marketing, Vol. 57 (January), 1-22.

49
Lee, Richard M., and Steven B. Robbins (1995), " Measuring Belongingness: The Social
Connectedness and the Social Assurance Scales," Journal of Counseling Psychology, 42(2), 232-
241.
Lee, Richard M., Matthew Draper, and Sujin Lee (2001), " Social Connectedness, Dysfunctional
Interpersonal Behaviors, and Psychological Distress: Testing a Mediator Model," Journal of
Counseling Psychology, 48(3), 310-318.
Maio, Gregory R., Victoria M. Esses (2001), "The Need for Affect: Individual Differences in the
Motivation to Approach or Avoid Emotions," Journal of Personality, 69, 583-616.
Malär, Lucia, Harley Krohmer, Wayne D. Hoyer, and Bettina Nyffenegger (2011), "Emotional
Brand Attachment and Brand Personality: The Relative Importance of the Actual and the Ideal
Self," Journal of Marketing, 75 (July), 35 –52.
Matzler, Kurt, Elisabeth Pichler, Johann Füller, and Todd A. Mooradian (2011) "Personality,
person–brand fit, and brand community: An investigation of individuals, brands, and brand
communities," Journal of Marketing Management, 27(9–10), 874–890.
Mende, Martin, and Ruth N. Bolton (2011), "Why Attachment Security Matters: How
Customers' Attachment Styles Influence Their Relationships with Service Firms and Service
Employees," Journal of Service Research, 14 (3), 285-301.
Mende, Martin, Ruth N. Bolton, and Mary Jo Bitner (2013), "Decoding Customer-Firm
Relationships: How Attachment Styles Help Explain Customers' Preferences for Closeness,
Repurchase Intentions, and Changes in Relationship Breadth," Journal of Marketing Research,
50 (February), 125-142.
Muniz, Albert, Thomas O'Guinn (2001), "Brand community," Journal of Consumer Research,
27(March), 412–432.
Muthén, Linda K., and Bength O. & Muthén, (2002). How to use a Monte Carlo study to decide
on sample size and determine power. Structural Equation Modeling, 9(4), 599-620
Noftle, Erik E., Phillip R. Shaver (2006), "Attachment dimensions and the big five personality
traits: Associations and comparative ability to predict relationship quality," Journal of Research
in Personality, 40, 179–208.
Nunnally, J. C. (1978). Psychometric theory (2nd ed.). New York: McGraw-Hill.
Obermiller, Carl, and Eric R. Spangenberg (2000), "On the Origin and Distinctness of
Skepticism toward Advertising," Marketing Letters, 11(4), 311-322.
Ozer, Daniel J. and Veronica Benet-Martinez (2006),"Personality and the Prediction of
Consequential Outcomes," Annual Review of Psychology, 57, 401-421.

50
Park, C.Whan, Deborah J. MacInnis, Joseph Priester, Andreas B. Eisingerich, and Dawn
Iacobucci (2010), "Brand Attachment and Brand Attitude Strength: Conceptual and Empirical
Differentiation of Two Critical Brand Equity Drivers," Journal of Marketing,74(November), 1–
17.
Park, C. Whan, Andreas B. Eisingerich, and Jason Whan Park (2013), "Attachment– aversion
(AA) model of customer–brand relationships," Journal of Consumer Psychology, 23(2), 229–
248.
Patwardhan, Hemant, and Siva K. Balasubramanian (2011), "Brand Romance: A
Complementary Approach to Explain Emotional Attachment Toward Brands," Journal of
Product & Brand Management, 20(4), 297–308.
Patwardhan, Hemant, and Siva K. Balasubramanian (2013), "Reflections on Emotional
Attachment to Brands: Brand Romance and Brand Love," Journal of Customer Behaviour, 12(1),
73-79.
Proksch, Michael, Ulrich R. Orth, and Franziska Bethge (2013), "Disentangling the Influence of
Attachment Anxiety and Attachment Security in Consumer Formation of Attachments to
Brands," Journal of Consumer Behaviour, 12, 318–326.
Sarkar, Abhigyan, Abhilash Ponnam, B. Kinnera Murthy (2012), " Understanding and
Measuring Romantic Brand Love," Journal of Customer Behaviour, 11(4), 325-348.
Shaver, Phillip R., and Kelly A. Brennan(1992), "Attachment Styles and the 'Big Five'
Personality Traits: Their Connections with Each Other and With Romantic Relationship
Outcomes," Personality and Social Psychology Bulletin, 18 (5), 536-545.
Souiden, Nizar, and Bouthaina M'saad (2011), "Adolescent Girls from a Modern Conservative
Culture: The Impact of Their Social Identity on Their Perception of Brand Symbolism,"
Psychology &Marketing, 28(12): 1133–1153.
Swaminathan, Vanitha, Karen M. Stilley, Rohini Ahluwalia (2008), "When Brand Personality
Matters: The Moderating Role of Attachment Styles," Journal of Consumer Research, 35(April),
985-1002.
Thomson, Matthew, Deborah J. MacInnis, and Whan C. Park (2005), "The Ties That Bind:
Measuring the Strength of Consumers’ Emotional Attachments to Brands," Journal of Consumer
Psychology, 15 (1), 77–91.
Voorhees, C.M., Brady, M.K., Calantone, R., Ramirez, E., 2015. Discriminant validity testing in
marketing: an analysis, causes for concern, and proposed remedies. Journal of the Academy of
Marketing Science 1–16.

51
Wei, Meifen, Daniel W. Russell, Brent Mallinckrodt, and David L. Vogel (2007), "The
Experiences in Close Relationship Scale (ECR)-Short Form: Reliability, Validity, and Factor
Structure," Journal of Personality Assessment, 88(2), 187–204.

52
XI. APPENDICES
A. Full Questionnaire
Variable
Type Item Code Construct Items
Independent
Variables BAnthro
Brand
Anthropomorphization
I can easily imagine (brand) as a person.
I have no difficulties in imagining (brand) as a
person.
BPC Brand Personality
Congruence
The personality of (brand) is consistent with
how I see myself
The personality of (brand) is a mirror image of
me
Based on (brand), other people can tell who I
am
CBI Consumer Brand
Identification
Imagine that one of the circles at the left in
each row represents your own personal identity
and the other circle at the right represents
(brand)’s identity. Please indicate which one
case (A, B, C, D, E, F, G or H) best describes
the level of overlap between your and (brand)’s
identities. Circle only one letter on the
following scale:
PBS Perception of brand
symbolism
People use (brand) as a way of expressing their
personality
(brand) is for people who want the best things
in life
A (brand) user stands out in a crowd
Using (brand) says something about the kind of
person you are
Brand is: Symbolic
Prestigious
Exciting
Status symbol
Distinctive vs. Conventional
SoC Sense of Community
Do you feel like you belong to a ‘ club ’ with
other users of (brand)?
Do you identify with people who use (brand) ?
To what extent is (brand) used by people like
yourself?

53
SBC Self-Brand Connection
(brand) reflects who I am.
I can identify with (brand).
I feel a personal connection to (brand).
I (can) use (brand) to communicate who I am
to other people.
I think (brand) (could) help(s) me become the
type of person I want to be.
I consider (brand) to be "me" (it reflects who I
consider myself to be or the way that I want to
present myself to others).
(brand) suits me well.
SE Self-Esteem
On the whole, I am satisfied with myself.
I feel that I am a person of worth.
All in all, I am inclined to think that I am a
failure. (R)
I take a positive attitude toward myself.
PfC Preference for
Closeness
(brand) should contact me from time to time
just to "stay in touch."
In a typical month, I spend a lot of time
reading (brand) material, visiting its website,
interacting with its employees, or thinking
about (brand).
(brand) should actively offer me additional
products/services that fit my needs.
I do not like it when (brand) asks me to
recommend it to other people. (R)
If (brand) asked me, I would discuss my views
about its service quality.
I would like to have a closer relationship with
(brand) than I do right now.
NFA Need for Affect
It is important for me to be in touch with my
feelings.
I think that it is important to explore my
feelings.
I am a very emotional person.
It is important for me to know how others are
feeling.
Emotions help people get along in life.
Strong emotions are generally beneficial.
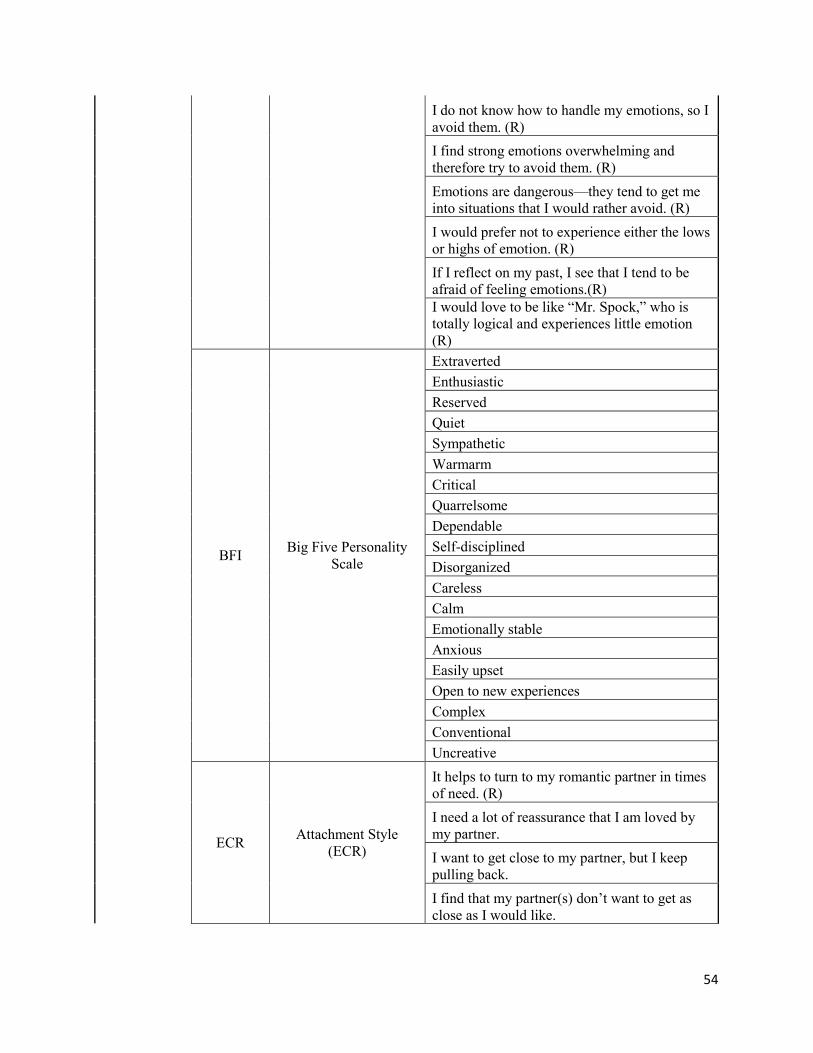
54
I do not know how to handle my emotions, so I
avoid them. (R)
I find strong emotions overwhelming and
therefore try to avoid them. (R)
Emotions are dangerous—they tend to get me
into situations that I would rather avoid. (R)
I would prefer not to experience either the lows
or highs of emotion. (R)
If I reflect on my past, I see that I tend to be
afraid of feeling emotions.(R)
I would love to be like “Mr. Spock,” who is
totally logical and experiences little emotion
(R)
BFI Big Five Personality
Scale
Extraverted
Enthusiastic
Reserved
Quiet
Sympathetic
Warmarm
Critical
Quarrelsome
Dependable
Self-disciplined
Disorganized
Careless
Calm
Emotionally stable
Anxious
Easily upset
Open to new experiences
Complex
Conventional
Uncreative
ECR Attachment Style
(ECR)
It helps to turn to my romantic partner in times
of need. (R)
I need a lot of reassurance that I am loved by
my partner.
I want to get close to my partner, but I keep
pulling back.
I find that my partner(s) don’t want to get as
close as I would like.

55
I turn to my partner for many things, including
comfort and reassurance. (R)
My desire to be very close sometimes scares
people away.
I try to avoid getting too close to my partner.
I do not often worry about being abandoned.
(R)
I usually discuss my problems and concerns
with my partner. (R)
I get frustrated if romantic partners are not
available when I need them.
I am nervous when partners get too close to
me.
I worry that romantic partners won’t care about
me as much as I care about them.
Cust_AS Customer Attachment
Style
I worry about being abandoned by (brand) as a
customer.
(brand) changes how it treats me for no
apparent reason.
I worry that (brand) doesn't really like me as a
customer.
I worry that (brand) doesn't care about me as
much as I care about it.
It is a comfortable feeling to depend on
(brand). ®
I am comfortable having a close relationship
with (brand). (R)
It's easy for me to feel warm and friendly
toward (brand). (R)
It helps to turn to (brand) in times of need. (R)
Masc_Fe
m
Masculinity /
Femininity
Affectionate
Assertive
Strong Personality
Loyal.
Forceful
Sympathetic
Has leadership abilities
Sensitive To Other's Needs
Understanding
Compassionate
Eager To Soothe Other's Feelings

56
Dominant
Warm
Willing To Take A Stand
Tender
Aggressive
Acts as a Leader
Competitive
Ambitious
Gentle
SCS Social Connectedness
Scale
I feel distant from people.
I don't feel related to most people.
I feel like an outsider.
I see myself as a loner.
I feel disconnected from the world around me.
I don't feel I participate with anyone or any
group.
I feel close to people. (R)
Even around people I know, I don't feel that I
really belong.
I am able to relate to my peers. (R)
I catch myself losing a sense of connectedness
with society.
I am able to connect with other people. (R)
I feel understood by the people I know. (R)
I see people as friendly and approachable. (R)
I fit in well in new situations. (R)
Dependent
Variables
BL Brand Love
(brand) is a wonderful brand.
(brand) makes me feel good.
(brand) is totally awesome.
I have neutral feelings about (brand). (R)
(brand) makes me very happy.
I love (brand)!
I have no particular feelings about (brand). (R)
(brand) is a pure delight.

57
I am passionate about (brand).
I’m very attached to (brand).
R_BL Romantic Brand Love
I find (brand) very attractive.
(brand) delights me.
(brand) captivates me.
(brand) really fascinates me.
I feel emotionally close to (brand).
I receive considerable emotional support from
(brand).
There is something special about my
relationship with (brand).
(brand) is warm.
BL_O Simple 2-item
Overall how much do you love [Brand]? (1 Not
at all-10 Very much)
Describe the extent to which you feel love
toward [Brand] (1-7)
BR Brand Romance
I love (brand).
Using (brand) gives me great pleasure.
I am really happy that (brand) is available.
(brand) rarely disappoints me.
I am attracted to (brand).
I desire (brand).
I want (brand).
I look forward to using (brand).
My day-dreams often include (brand).
(brand) often dominates my thoughts
Sometimes I feel I can’t control my thoughts as
they are obsessively on (brand).
(brand) always seems to be on my mind

58
BA_1 Brand Attachment
To what extent is (brand) part of you and who
you are?
To what extent do you feel personally
connected to (brand)?
To what extent are your thoughts and feelings
toward (brand) often automatic, coming to
mind seemingly on their own?
To what extent do your thoughts and feelings
toward (brand) come to your mind naturally
and instantly?
BA_2 Brand Attachment
Affectionate
Friendly
Loved
Peaceful
Passionate
Delighted
Captivated
Connected
Bonded
Attached
BRQ Relationship Quality
I am satisfied with (brand).
I am content with (brand).
I am happy with (brand).
(brand) is trustworthy.
(brand) keeps its promises.
(brand) is truly concerned about my welfare.
I enjoy being a customer of (brand).
I have positive feelings about (brand).
I feel attached to (brand).
Control
Variables Gender
Demographics
Gender
Age Age
B_RelStat Relationship Status
Language Language Skill
Culture Cultural Background
Education Education Level
B_Use Brand Use (Public / Private)

59
B_Purch Brand Purchased previously
Income Income
Rel_Char
Relationship
Characteristics How long have you used (brand)?

60
B. Univariate Statistics
Variable N min max mean std Skewness Kurtosis
Age 540 17 88 46.46667 15.95997 0.0057785 -1.01865
B_Purch 540 0 1 0.922222 0.26807 -3.161801 8.0267
B_RelStat 540 0 1 0.92963 0.256007 -3.368863 9.383978
B_Use 540 0 1 0.372222 0.483845 0.5301395 -1.72536
BA_1_1 540 1 7 4.166204 1.633008 -0.433424 -0.65423
BA_1_2 540 1 7 4.302778 1.604435 -0.476968 -0.43749
BA_1_3 540 1 7 3.717333 1.664434 -0.089238 -0.92065
BA_1_4 540 1 7 3.973926 1.594321 -0.227887 -0.70539
BA_2_1 540 1 7 3.896296 1.746554 -0.123686 -0.72946
BA_2_10 540 1 7 4.438889 1.605292 -0.36439 -0.37455
BA_2_2 540 1 7 4.668519 1.643374 -0.655279 -0.02224
BA_2_3 540 1 7 4.240741 1.750009 -0.327899 -0.60468
BA_2_4 540 1 7 4.207407 1.670863 -0.347759 -0.45151
BA_2_5 540 1 7 4.2 1.728512 -0.313188 -0.6143
BA_2_6 540 1 7 4.67963 1.599847 -0.627266 -0.03386
BA_2_7 540 1 7 4.146296 1.756748 -0.273666 -0.732
BA_2_8 540 1 7 4.581481 1.656726 -0.512275 -0.30127
BA_2_9 540 1 7 4.185185 1.715087 -0.29391 -0.56172
BAnthro_1 540 1 7 3.806759 1.915564 0.0067422 -1.26073
BAnthro_2 540 1 7 3.810278 1.954871 0.0218127 -1.33451
BFI_1 540 1 7 3.544444 1.632198 0.1608083 -0.62798
BFI_10 540 1 7 5.092593 1.3671 -0.469547 -0.27829
BFI_11 540 1 7 3.042593 1.644703 0.4565077 -0.6669
BFI_11R 540 1 7 4.957407 1.644703 -0.456508 -0.6669
BFI_12 540 1 7 2.594444 1.442904 0.8742486 0.151756
BFI_12R 540 1 7 5.405556 1.442904 -0.874249 0.151756
BFI_13 540 1 7 5.005556 1.268268 -0.355501 -0.07611
BFI_14 540 1 7 5.146296 1.394026 -0.712424 0.181853
BFI_15 540 1 7 3.831481 1.680216 0.0717911 -0.8087
BFI_15R 540 1 7 4.168519 1.680216 -0.071791 -0.8087
BFI_16 540 1 7 3.612963 1.594348 0.1778934 -0.75824
BFI_16R 540 1 7 4.387037 1.594348 -0.177893 -0.75824
BFI_17 540 1 7 5.175926 1.257473 -0.632876 0.403038
BFI_18 540 1 7 4.437037 1.547551 -0.353487 -0.43118
BFI_19 540 1 7 4.488889 1.382996 -0.204953 -0.2701
BFI_19R 540 1 7 3.511111 1.382996 0.2049529 -0.2701
BFI_2 540 1 7 4.888889 1.269986 -0.434093 0.20213
BFI_20 540 1 7 2.988889 1.613908 0.5150989 -0.54061
BFI_20R 540 1 7 5.011111 1.613908 -0.515099 -0.54061

61
BFI_3 540 1 7 4.605556 1.491462 -0.432789 -0.34078
BFI_3R 540 1 7 3.394444 1.491462 0.4327889 -0.34078
BFI_4 540 1 7 4.812963 1.556666 -0.527533 -0.28358
BFI_4R 540 1 7 3.187037 1.556666 0.5275328 -0.28358
BFI_5 540 1 7 5.35 1.269632 -0.711938 0.321524
BFI_6 540 1 7 5.218519 1.213877 -0.462554 0.090037
BFI_7 540 1 7 4.201852 1.45495 -0.216681 -0.45607
BFI_7R 540 1 7 3.798148 1.45495 0.216681 -0.45607
BFI_8 540 1 7 2.911111 1.526351 0.4834761 -0.48089
BFI_8R 540 1 7 5.088889 1.526351 -0.483476 -0.48089
BFI_9 540 1 7 5.792593 1.281212 -1.286244 1.779987
BL_1 540 1 7 5.609259 1.198758 -1.079749 1.857936
BL_10 540 1 7 4.712963 1.675154 -0.624248 -0.21394
BL_2 540 1 7 5.066667 1.451504 -0.788736 0.549107
BL_3 540 1 7 5.038889 1.487227 -0.78015 0.528286
BL_4R 540 1 7 4.444444 1.717169 -0.234096 -0.67633
BL_5 540 1 7 5.003704 1.475837 -0.760654 0.515933
BL_6 540 1 7 5.22963 1.501716 -0.910529 0.640722
BL_7R 540 1 7 4.735185 1.761857 -0.39966 -0.7199
BL_8 540 1 7 4.716667 1.601049 -0.595452 -0.0495
BL_9 540 1 7 4.568519 1.712372 -0.533244 -0.37322
R_BL_1 540 1 7 4.577778 1.637758 -0.628273 -0.14854
R_BL_2 540 1 7 4.818519 1.566234 -0.674138 0.162062
R_BL_3 540 1 7 4.261111 1.791644 -0.372985 -0.74383
R_BL_4 540 1 7 4.287037 1.769935 -0.34182 -0.69308
R_BL_5 540 1 7 3.792593 1.824778 -0.139272 -0.97133
R_BL_6 540 1 7 3.275926 1.886328 0.2386195 -1.11442
R_BL_7 540 1 7 3.944444 1.864786 -0.172162 -0.92172
R_BL_8 540 1 7 4.485185 1.69627 -0.523879 -0.33326
BL_O1_1 540 1 10 8.207111 1.509954 -1.416679 3.794885
BL_O2_1 540 1 7 5.462185 1.161108 -1.288787 2.459162
BPC_1 540 1 7 4.241741 1.651318 -0.477556 -0.63262
BPC_2 540 1 7 3.826222 1.665314 -0.176909 -0.93648
BPC_3 540 1 7 3.977093 1.715273 -0.261839 -0.99663
BR_1 540 1 7 4.925926 1.612243 -0.671173 0.011554
BR_10 540 1 7 2.631481 1.733477 0.7717051 -0.4801
BR_11 540 1 7 2.324074 1.748727 1.0488872 -0.10713
BR_12 540 1 7 2.803704 1.7797 0.5898278 -0.82011
BR_2 540 1 7 4.996296 1.495815 -0.771507 0.390906
BR_3 540 1 7 5.483333 1.386959 -1.0563 1.206443
BR_4 540 1 7 4.998148 1.546435 -0.885129 0.472182

62
BR_5 540 1 7 4.090741 1.885672 -0.341368 -0.89544
BR_6 540 1 7 3.953704 1.882367 -0.219362 -0.97965
BR_7 540 1 7 4.590741 1.735023 -0.606776 -0.30778
BR_8 540 1 7 5.244444 1.41535 -0.90355 0.96832
BR_9 540 1 7 2.574074 1.847647 0.8918668 -0.40696
BRQ_1 540 1 7 5.722222 1.133348 -1.089201 1.818306
BRQ_2 540 1 7 5.575926 1.177941 -0.920969 1.350006
BRQ_3 540 1 7 5.675926 1.144712 -0.921108 1.281722
BRQ_4 540 1 7 5.425926 1.293653 -0.90687 1.136702
BRQ_5 540 1 7 5.131481 1.350919 -0.698095 0.753238
BRQ_6 540 1 7 3.718519 1.829066 0.0154468 -0.95126
BRQ_7 540 1 7 5.566667 1.206507 -0.86954 1.074989
BRQ_8 540 1 7 5.52037 1.172328 -0.981864 1.877989
BRQ_9 540 1 7 4.722222 1.595642 -0.551335 -0.14386
CBI 529 1 8 3.833648 2.011972 0.3438556 -0.91656
Culture 540 1 9 2.477778 2.589666 1.5450947 0.921428
Cust_AS_1 540 1 7 2.45 1.634309 0.9275407 -0.14722
Cust_AS_2 540 1 7 2.67963 1.683476 0.5756679 -0.76453
Cust_AS_3 540 1 7 2.394444 1.594857 0.8940086 -0.20364
Cust_AS_4 540 1 7 2.646296 1.677883 0.6564023 -0.63716
Cust_AS_5 540 1 7 4.577778 1.683563 -0.577647 -0.28344
Cust_AS_5R 540 1 7 3.422222 1.683563 0.5776467 -0.28344
Cust_AS_6R 540 1 7 3.481481 1.680851 0.5051103 -0.29884
Cust_AS_7R 540 1 7 3.218519 1.57921 0.731539 0.180386
Cust_AS_8R 540 1 7 4.12963 1.898601 0.1510787 -1.06357
ECR_10 540 1 7 3.42963 1.757215 0.1976994 -0.94515
ECR_11 540 1 7 2.825926 1.614887 0.6106036 -0.51328
ECR_12 540 1 7 3.4 1.850437 0.2417974 -1.03807
ECR_1R 540 1 7 2.624074 1.456026 1.0016679 0.835154
ECR_2 540 1 7 3.607407 1.778437 0.0690314 -1.03222
ECR_3 540 1 7 3.142593 1.704529 0.3337265 -0.90912
ECR_4 540 1 7 3.207407 1.742607 0.3106423 -0.90985
ECR_5R 540 1 7 2.898148 1.538256 0.8130858 0.300742
ECR_6 540 1 7 2.894444 1.6362 0.5069923 -0.62116
ECR_7 540 1 7 2.861111 1.624593 0.5355737 -0.61949
ECR_8R 540 1 7 3.087037 1.780595 0.4936094 -0.77527
ECR_9R 540 1 7 2.92037 1.596364 0.7293785 -0.11634
Education 540 1 7 3.966667 1.417751 -0.089943 -0.66418
Gender 540 0 1 0.522222 0.499969 -0.089225 -1.99946
Income 540 1 7 3.881481 1.888553 0.1765 -1.16996
Masc_Fem_1 540 1 7 5.283333 1.27895 -0.541819 -0.04747

63
Masc_Fem_10 540 1 7 5.433333 1.223305 -0.6719 0.107221
Masc_Fem_11 540 1 7 5.072222 1.382493 -0.370986 -0.27392
Masc_Fem_12 540 1 7 3.853704 1.552688 -0.136804 -0.73956
Masc_Fem_13 540 1 7 5.305556 1.229344 -0.484223 -0.12017
Masc_Fem_14 540 1 7 5.292593 1.264449 -0.624494 0.026632
Masc_Fem_15 540 1 7 5.05 1.28474 -0.409678 -0.10046
Masc_Fem_16 540 1 7 3.342593 1.581209 0.2214966 -0.80488
Masc_Fem_17 540 1 7 4.707407 1.491951 -0.54691 -0.05874
Masc_Fem_18 540 1 7 4.425926 1.495843 -0.30866 -0.36579
Masc_Fem_19 540 1 7 4.714815 1.382424 -0.315903 -0.20163
Masc_Fem_2 540 1 7 4.614815 1.383632 -0.27329 -0.2329
Masc_Fem_20 540 1 7 5.27037 1.215642 -0.461016 -0.11595
Masc_Fem_3 540 1 7 4.816667 1.477632 -0.377721 -0.44418
Masc_Fem_4 540 2 7 5.961111 1.088124 -0.937361 0.345314
Masc_Fem_5 540 1 7 3.707407 1.551689 -0.057479 -0.67948
Masc_Fem_6 540 2 7 5.385185 1.213622 -0.533631 -0.16588
Masc_Fem_7 540 1 7 4.962963 1.471598 -0.616041 -0.0813
Masc_Fem_8 540 1 7 5.353704 1.233005 -0.590497 0.139401
Masc_Fem_9 540 1 7 5.566667 1.128645 -0.66767 0.120906
NFA_1 540 1 7 4.961111 1.427391 -0.411624 -0.29748
NFA_10R 540 1 7 4.459259 1.634566 -0.133228 -0.66584
NFA_11R 540 1 7 4.635185 1.720299 -0.284205 -0.84348
NFA_12R 540 1 7 4.885185 1.78058 -0.467278 -0.75581
NFA_2 540 1 7 5.022222 1.341318 -0.35084 -0.32543
NFA_3 540 1 7 4.394444 1.565504 -0.126825 -0.57082
NFA_4 540 1 7 4.92963 1.358902 -0.482128 0.076001
NFA_5 540 1 7 4.97963 1.299904 -0.496243 0.300714
NFA_6 540 1 7 4.540741 1.302277 -0.170539 -0.03221
NFA_7R 540 1 7 4.968519 1.6325 -0.470529 -0.63158
NFA_8R 540 1 7 4.501852 1.706149 -0.276512 -0.82752
NFA_9R 540 1 7 4.677778 1.712084 -0.292645 -0.87055
PBS_1_1 540 1 7 4.327296 1.631996 -0.524955 -0.47687
PBS_1_2 540 1 7 4.938278 1.400113 -0.760165 0.604019
PBS_1_3 540 1 7 4.166574 1.58121 -0.330976 -0.54469
PBS_1_4 540 1 7 4.649648 1.485139 -0.749548 0.211353
PBS_2_1 540 1 7 4.713722 1.488709 -0.635351 0.031749
PBS_2_2 540 1 7 4.5385 1.551011 -0.466898 -0.38391
PBS_2_3 540 1 7 4.817574 1.469302 -0.700677 0.096492
PBS_2_4 540 1 7 4.252778 1.629256 -0.311225 -0.67439
PBS_2_5 540 1 7 4.960037 1.354046 -0.734455 0.586871
PfC_1 540 1 7 3.437037 1.851069 0.1519336 -1.04731

64
PfC_2 540 1 7 3.205556 1.877601 0.3653126 -0.93538
PfC_3 540 1 7 4.259259 1.706532 -0.361316 -0.55557
PfC_4R 540 1 7 4.842593 1.65796 -0.27999 -0.70103
PfC_5 540 1 7 4.975926 1.628074 -0.761118 0.083418
PfC_6 540 1 7 3.355556 1.714141 0.1339939 -0.84233
Rel_Char1 540 1 5 4.451852 1.020884 -2.200552 4.219785
SBC_1 540 1 7 4.25 1.707372 -0.440694 -0.54341
SBC_2 540 1 7 4.72037 1.634948 -0.638528 -0.08879
SBC_3 540 1 7 4.274074 1.721541 -0.387816 -0.62718
SBC_4 540 1 7 4.05 1.773674 -0.316185 -0.7987
SBC_5 540 1 7 3.72037 1.832897 -0.099845 -1.04288
SBC_6 540 1 7 4.044444 1.743758 -0.367564 -0.70714
SBC_7 540 1 7 5.368519 1.299111 -0.881373 1.004654
SCS_1 540 1 7 3.427778 1.755026 0.226038 -0.9366
SCS_10 540 1 7 3.32963 1.747156 0.249866 -0.99347
SCS_11R 540 1 7 2.857407 1.347037 0.6361211 0.129524
SCS_12R 540 1 7 3.125926 1.486761 0.6294253 -0.04535
SCS_13R 540 1 7 3.159259 1.382574 0.4351499 -0.14485
SCS_14R 540 1 7 3.364815 1.425407 0.376936 -0.20666
SCS_2 540 1 7 3.464815 1.744502 0.224282 -0.96753
SCS_3 540 1 7 3.377778 1.755423 0.2136071 -0.99384
SCS_4 540 1 7 3.768519 1.853675 0.0309478 -1.10208
SCS_5 540 1 7 3.146296 1.764125 0.4379189 -0.81135
SCS_6 540 1 7 3.27037 1.712405 0.3112749 -0.86895
SCS_7R 540 1 7 3.411111 1.512308 0.3177121 -0.41285
SCS_8 540 1 7 3.316667 1.761709 0.2570177 -1.01865
SCS_9R 540 1 7 2.92037 1.368596 0.6628359 0.220138
SE_1 540 1 7 5.156852 1.405641 -0.866822 0.279103
SE_2 540 1 7 5.461741 1.375821 -1.19682 1.255634
SE_3R 540 1 7 5.486222 1.476561 -0.981465 0.11088
SE_4 540 1 7 5.226111 1.371701 -0.92467 0.575039
SoC_1 540 1 7 4.462463 1.713282 -0.523997 -0.62509
SoC_2 540 1 7 4.772981 1.547286 -0.811087 0.156057
SoC_3 540 1 7 5.206704 1.296934 -1.034856 1.417264

65
C. Correlation Analysis
Construct 1 2 3 4 5 6 7 8 9 10 11 12 13 14 15 16 17 18 19 20 21 22 23 24 25 26
1 - BFI_Extraversion 1
2 - BFI_Agreeableness 0.013 1
3 - BFI_Conscientiousness 0.01 -0.208*** 1
4 - BFI_Neuroticism 0.180*** 0.339*** -0.268*** 1
5 - Attachment Style - Avoidance 0.142*** -0.201*** 0.358*** -0.306*** 1
6 - Attachment Style - Anxiety 0.136** -0.129** 0.377*** -0.317*** 0.613*** 1
7 - Self Esteem -0.095* 0.266*** -0.215*** 0.429*** -0.292*** -0.267*** 1
8 - Social Connectedness 0.367*** -0.285*** 0.335*** -0.383*** 0.570*** 0.518*** -0.471*** 1
9 - NFA Motivation to Approach -0.063 0.588*** -0.138** 0.354*** -0.262*** -0.054 0.364*** -0.343*** 1
10 - NFA Motivation to Avoid 0.277*** -0.289*** 0.362*** -0.374*** 0.584*** 0.541*** -0.361*** 0.702*** -0.401*** 1
11 - Sex-Role Identity - Masculinity -0.226*** 0.323*** -0.200*** 0.258*** -0.169*** -0.123** 0.309*** -0.253*** 0.368*** -0.221*** 1
12 - Sex-Role Identity - Femininity 0.062 0.850*** -0.260*** 0.388*** -0.274*** -0.124** 0.280*** -0.285*** 0.625*** -0.300*** 0.365*** 1
13 - Brand Anthropomorphization 0.028 0.116** 0.093* -0.086* 0.106* 0.191*** 0.005 0.097* 0.123** 0.101* 0.062 0.109* 1
14 - Brand Personality Congruence -0.012 0.100* 0.061 -0.037 0.077 0.139*** 0.086* 0.025 0.135** 0.094* 0.188*** 0.141*** 0.633*** 1
15 - Sense of Community -0.001 0.180*** 0.061 -0.017 0.082 0.161*** 0.127** 0.026 0.186*** 0.057 0.169*** 0.188*** 0.461*** 0.642*** 1
16 - Perception of Brand Symbolism 0.011 0.177*** 0.088* 0.022 0.092* 0.169*** 0.132** 0.030 0.201*** 0.098* 0.179*** 0.208*** 0.479*** 0.669*** 0.776*** 1
17 - Customer Attachment Style - Anxiety 0.050 -0.174*** 0.432*** -0.188*** 0.415*** 0.403*** -0.087* 0.335*** -0.083 0.433*** -0.086* -0.176*** 0.250*** 0.275*** 0.178*** 0.237*** 1
18 - Customer Attachment Style - Avoidance -0.082 -0.223*** -0.073 0.018 -0.074 -0.173*** -0.060 -0.077 -0.214*** -0.081 -0.142*** -0.253*** -0.437*** -0.565*** -0.629*** -0.641*** -0.238*** 1
19 - Preference for Closeness 0.062 0.070 0.229*** -0.067 0.201*** 0.273*** 0.029 0.169*** 0.106* 0.257*** 0.098* 0.109* 0.432*** 0.515*** 0.583*** 0.609*** 0.505 -0.620*** 1
20 - Self-Brand Connection 0.055 0.138*** 0.119** -0.017 0.119** 0.210*** 0.098* 0.092* 0.195*** 0.137*** 0.187*** 0.189*** 0.518*** 0.710*** 0.727*** 0.775*** 0.302*** -0.751*** 0.726*** 1
21 - Customer-Brand Identification -0.005 0.073 0.017 -0.024 0.057 0.132** 0.060 0.064 0.092* 0.063 0.162*** 0.117** 0.340*** 0.521*** 0.408*** 0.409*** 0.128** -0.399*** 0.386*** 0.512*** 1
22 - Brand Love 0.055 0.280*** 0.053 0.051 0.050 0.157*** 0.075 0.019 0.260*** 0.046 0.139*** 0.323*** 0.406*** 0.501*** 0.615*** 0.659*** 0.105* -0.734*** 0.570*** 0.721*** 0.397*** 1
23 - Romantic Brand Love 0.051 0.187*** 0.135** -0.032 0.147*** 0.242*** 0.058 0.112** 0.203*** 0.159*** 0.106* 0.220*** 0.514*** 0.612*** 0.694*** 0.742*** 0.289*** -0.765*** 0.702*** 0.833*** 0.467*** 0.870*** 1
24 - Brand Romance 0.052 0.088* 0.272*** -0.057 0.205*** 0.269*** 0.038 0.153*** 0.089* 0.264*** 0.036 0.101* 0.433*** 0.516*** 0.578*** 0.611*** 0.409*** -0.645*** 0.668*** 0.685*** 0.372*** 0.724*** 0.786*** 1
25 - Brand Attachment 0.100* 0.169*** 0.152*** -0.050 0.154*** 0.260*** 0.040 0.156*** 0.165*** 0.208*** 0.045 0.203*** 0.493*** 0.590*** 0.646*** 0.686*** 0.294*** -0.709*** 0.639*** 0.766*** 0.463*** 0.756*** 0.857*** 0.796*** 1
26 - Brand Relationship Quality 0.091* 0.322*** -0.053 0.140** -0.039 0.060 0.119** -0.040 0.240*** -0.064 0.159*** 0.348*** 0.218*** 0.268*** 0.425*** 0.445*** -0.154*** -0.523*** 0.315*** 0.453*** 0.230*** 0.675*** 0.505*** 0.424*** 0.481*** 1
Pearson Correlation Coefficients, N = 540
Individual-level Independent Constructs Brand-Related Independent Constructs Dependent ConstructsTwo-tailed correlation is significant at the *p<0.05 level, **p<0.01 level, ***p<0.001 level.

66
D. Discriminant Analysis - Fornell-Lacker Criterion
Age
BFI -
Agreeablenes
s
BFI -
Conscientious
ness
BFI -
Extraversion
BFI -
Neuroticism
Brand
Anthropomor
phization
Brand
Attachment Brand Love
Brand
Personality
Congruence
Brand
Purchased
Brand
Relationship
Status
Brand
Romance Brand Used
Customer AS -
Anxiety
Customer AS -
Avoidance
Customer-
Brand
Identification
Attachment
Style -
Avoidance
Attachment
Style -Anxiety
Sex-Role
Identity -
Femininity
Length of
Relationship
Sex-Role
Identity -
Masculinity
Need for
Affect -
Approach
Need for
Affect - Avoid
Perception of
Brand
Symbolism
Preference for
Closeness
Romantic
Brand Love
Self-Brand
Connection Self_Esteem
Sense of
Community
Social
Connectednes
s Scale
Age 1
BFI - Agreeableness 0.16 0.89
BFI - Conscientiousness 0.27 0.46 0.83
BFI - Extraversion -0.01 -0.01 -0.21 0.9
BFI - Neuroticism 0.27 0.35 0.52 -0.1 0.84
Brand Anthropomorphization -0.15 0.11 0.02 -0.02 -0.09 0.96
Brand Attachment -0.15 0.17 0.01 -0.1 -0.07 0.49 0.83
Brand Love -0.08 0.28 0.14 -0.05 0.04 0.4 0.76 0.84
Brand Personality Congruence -0.09 0.1 0.01 0.02 -0.04 0.63 0.59 0.5 0.92
Brand Purchased 0.02 0.04 0.04 -0.04 0 0.05 0.07 0.14 0.09 1
Brand Relationship Status 0.09 0.08 0.08 0.04 0.07 0.01 0.07 0.18 0.04 0.36 1
Brand Romance -0.12 0.08 -0.04 -0.05 -0.08 0.43 0.79 0.71 0.52 0.03 0.06 0.72
Brand Used -0.12 0.02 0.03 0.06 -0.05 0.14 0.05 0.08 0.12 0.11 0 0.05 1
Customer AS - Anxiety -0.22 -0.17 -0.23 -0.05 -0.19 0.26 0.3 0.11 0.29 0 -0.08 0.42 0.07 0.86
Customer AS - Avoidance -0.01 -0.24 -0.12 0.09 0.01 -0.43 -0.69 -0.73 -0.56 -0.08 -0.12 -0.6 -0.03 -0.19 0.89
Customer-Brand Identification -0.14 0.08 0 0.01 -0.03 0.34 0.47 0.4 0.52 0.06 0.09 0.37 0.05 0.13 -0.4 1
ECR-Avo -0.23 -0.21 -0.23 -0.14 -0.35 0.12 0.16 0.06 0.09 -0.02 -0.07 0.22 0.04 0.41 -0.04 0.06 0.87
ECR_Anx -0.23 -0.12 -0.2 -0.14 -0.34 0.2 0.27 0.17 0.16 0.01 -0.01 0.28 0.03 0.4 -0.15 0.14 0.6 0.78
Femininity 0.17 0.85 0.48 -0.05 0.38 0.11 0.2 0.33 0.14 0.06 0.07 0.09 0.01 -0.17 -0.27 0.12 -0.27 -0.11 0.81
Length of Relationship 0.24 0.09 0.17 -0.01 0.02 -0.04 0 0.12 -0.01 0.24 0.21 -0.05 0.02 -0.17 -0.12 0.07 -0.09 -0.11 0.08 1
Masculinity 0.17 0.33 0.32 0.23 0.28 0.06 0.06 0.16 0.19 0.02 0.04 0.05 0.09 -0.07 -0.17 0.16 -0.17 -0.12 0.38 0.02 0.81
Need for Affect - Approach 0.07 0.59 0.4 0.07 0.38 0.13 0.17 0.27 0.15 0.05 0.08 0.09 0.01 -0.08 -0.23 0.11 -0.26 -0.04 0.62 0.08 0.38 0.8
Need for Affect - Avoid 0.21 0.3 0.23 0.28 0.43 -0.1 -0.21 -0.04 -0.09 -0.03 0.08 -0.27 0.02 -0.42 0.04 -0.07 -0.59 -0.53 0.31 0.11 0.21 0.4 0.79
Perception of Brand Symbolism -0.06 0.18 0.07 0 0.01 0.47 0.69 0.66 0.67 0.12 0.07 0.61 0.07 0.25 -0.65 0.41 0.1 0.18 0.21 0.04 0.19 0.21 -0.1 0.82
Preference for Closeness -0.11 0.06 -0.02 -0.06 -0.09 0.43 0.64 0.56 0.52 0.01 0.02 0.67 0.04 0.51 -0.58 0.39 0.21 0.28 0.11 -0.03 0.11 0.12 -0.25 0.61 0.79
Romantic Brand Love -0.14 0.19 0.04 -0.05 -0.05 0.51 0.86 0.87 0.61 0.06 0.08 0.79 0.09 0.29 -0.74 0.47 0.15 0.25 0.23 0.02 0.12 0.22 -0.16 0.74 0.7 0.85
Self-Brand Connection -0.09 0.15 0.06 -0.05 -0.04 0.52 0.77 0.72 0.71 0.05 0.07 0.69 0.09 0.3 -0.75 0.51 0.12 0.22 0.2 0.03 0.19 0.21 -0.13 0.78 0.73 0.84 0.87
Self_Esteem 0.12 0.28 0.29 0.1 0.47 -0.01 0.04 0.08 0.08 0.07 0.09 0.03 0.06 -0.09 -0.09 0.06 -0.3 -0.27 0.29 0.02 0.29 0.37 0.36 0.13 0.02 0.06 0.09 0.94
Sense of Community -0.04 0.22 0.14 -0.01 0 0.45 0.64 0.64 0.63 0.1 0.14 0.57 0.04 0.16 -0.65 0.41 0.06 0.15 0.24 0.11 0.19 0.22 -0.04 0.78 0.58 0.69 0.72 0.12 0.89
Social Connectedness Scale -0.28 -0.29 -0.26 -0.35 -0.46 0.1 0.16 0.02 0.03 0 -0.1 0.16 -0.03 0.34 -0.06 0.07 0.57 0.52 -0.28 -0.08 -0.25 -0.34 -0.7 0.03 0.17 0.11 0.09 -0.48 0.02 0.85
Disciminant Validity - Fornell-Lacker Criterion

67
E. Discriminant Analysis - Hetero-Trait Mono-Trait Ratio
Age
BFI -
Agreeablenes
s
BFI -
Conscientious
ness
BFI -
Extraversion
BFI -
Neuroticism
Brand
Anthropomor
phization
Brand
Attachment Brand Love
Brand
Personality
Congruence
Brand
Purchased
Brand
Relationship
Status
Brand
Romance Brand Used
Customer AS -
Anxiety
Customer AS -
Avoidance
Customer-
Brand
Identification
Attachment
Style -
Avoidance
Attachment
Style -Anxiety
Sex-Role
Identity -
Femininity
Length of
Relationship
Sex-Role
Identity -
Masculinity
Need for
Affect -
Approach
Need for
Affect - Avoid
Perception of
Brand
Symbolism
Preference for
Closeness
Romantic
Brand Love
Self-Brand
Connection Self_Esteem
Sense of
Community
Social
Connectednes
s Scale
Age
BFI - Agreeableness 0.19
BFI - Conscientiousness 0.36 0.71
BFI - Extraversion 0.02 0.06 0.34
BFI - Neuroticism 0.26 0.49 0.85 0.25
Brand Anthropomorphization 0.16 0.13 0.08 0.02 0.11
Brand Attachment 0.15 0.19 0.06 0.11 0.08 0.52
Brand Love 0.11 0.34 0.2 0.06 0.08 0.42 0.78
Brand Personality Congruence 0.09 0.12 0.1 0.04 0.05 0.68 0.63 0.53
Brand Purchased 0.02 0.05 0.05 0.04 0.02 0.05 0.07 0.14 0.1
Brand Relationship Status 0.09 0.09 0.11 0.04 0.07 0.01 0.07 0.19 0.05 0.36
Brand Romance 0.17 0.24 0.27 0.07 0.15 0.47 0.86 0.8 0.57 0.07 0.12
Brand Used 0.12 0.03 0.03 0.07 0.07 0.15 0.06 0.08 0.13 0.11 0 0.06
Customer AS - Anxiety 0.25 0.22 0.32 0.07 0.25 0.29 0.31 0.15 0.31 0.02 0.09 0.49 0.07
Customer AS - Avoidance 0.03 0.29 0.18 0.11 0.04 0.48 0.75 0.81 0.63 0.09 0.13 0.7 0.04 0.21
Customer-Brand Identification 0.14 0.09 0.07 0.03 0.03 0.35 0.47 0.4 0.55 0.06 0.09 0.4 0.05 0.14 0.42
ECR-Avo 0.25 0.26 0.33 0.18 0.42 0.13 0.18 0.09 0.1 0.04 0.07 0.25 0.04 0.48 0.05 0.06
ECR_Anx 0.25 0.18 0.29 0.16 0.43 0.22 0.28 0.17 0.16 0.04 0.02 0.3 0.03 0.46 0.15 0.14 0.73
Femininity 0.18 1.02 0.67 0.1 0.5 0.11 0.21 0.35 0.15 0.07 0.07 0.25 0.04 0.2 0.3 0.12 0.31 0.17
Length of Relationship 0.24 0.1 0.22 0.02 0.02 0.05 0.04 0.12 0.01 0.24 0.21 0.16 0.02 0.18 0.13 0.07 0.1 0.12 0.09
Masculinity 0.18 0.41 0.46 0.29 0.33 0.06 0.07 0.16 0.2 0.03 0.06 0.11 0.1 0.11 0.18 0.17 0.21 0.15 0.41 0.02
Need for Affect - Approach 0.09 0.74 0.57 0.09 0.45 0.13 0.17 0.29 0.15 0.05 0.09 0.21 0.03 0.13 0.25 0.11 0.32 0.11 0.69 0.09 0.42
Need for Affect - Avoid 0.22 0.37 0.33 0.34 0.49 0.11 0.22 0.08 0.11 0.03 0.08 0.3 0.03 0.48 0.06 0.08 0.68 0.63 0.34 0.11 0.26 0.48
Perception of Brand Symbolism 0.08 0.22 0.11 0.03 0.06 0.51 0.72 0.7 0.72 0.12 0.07 0.68 0.07 0.26 0.72 0.42 0.11 0.19 0.23 0.05 0.19 0.22 0.11
Preference for Closeness 0.13 0.12 0.16 0.09 0.1 0.5 0.72 0.65 0.6 0.05 0.08 0.78 0.06 0.59 0.69 0.43 0.25 0.33 0.15 0.07 0.13 0.16 0.29 0.7
Romantic Brand Love 0.14 0.22 0.08 0.06 0.06 0.55 0.9 0.92 0.66 0.06 0.08 0.87 0.1 0.31 0.82 0.48 0.17 0.27 0.23 0.04 0.12 0.22 0.17 0.79 0.81
Self-Brand Connection 0.1 0.18 0.11 0.07 0.05 0.56 0.81 0.76 0.77 0.05 0.07 0.76 0.09 0.33 0.83 0.53 0.13 0.23 0.21 0.04 0.2 0.22 0.14 0.83 0.84 0.89
Self_Esteem 0.13 0.32 0.4 0.12 0.53 0.02 0.04 0.08 0.09 0.08 0.09 0.08 0.06 0.09 0.1 0.06 0.33 0.3 0.3 0.02 0.34 0.4 0.4 0.13 0.05 0.06 0.1
Sense of Community 0.05 0.28 0.21 0.04 0.06 0.5 0.69 0.7 0.7 0.11 0.15 0.65 0.04 0.17 0.74 0.44 0.07 0.16 0.27 0.13 0.21 0.25 0.06 0.85 0.69 0.76 0.79 0.13
Social Connectedness Scale 0.28 0.35 0.35 0.43 0.49 0.1 0.16 0.05 0.07 0.03 0.1 0.18 0.04 0.36 0.06 0.07 0.64 0.58 0.3 0.08 0.29 0.39 0.77 0.05 0.19 0.11 0.09 0.51 0.04
Hetero-Trait Mono-Trait Ratio

68
F. Full Path Model