“the full monty” - seswa.memberclicks.net · the full monty + british slang phrase of uncertain...
TRANSCRIPT

Comprehensive Stormwater Management
“The Full Monty”
October 24, 2013

The Full Monty
+ British slang phrase of uncertain origin.
+ It is generally used to mean "everything which is
necessary, appropriate, or possible.”
+ “The Works”

Hilton Head Island
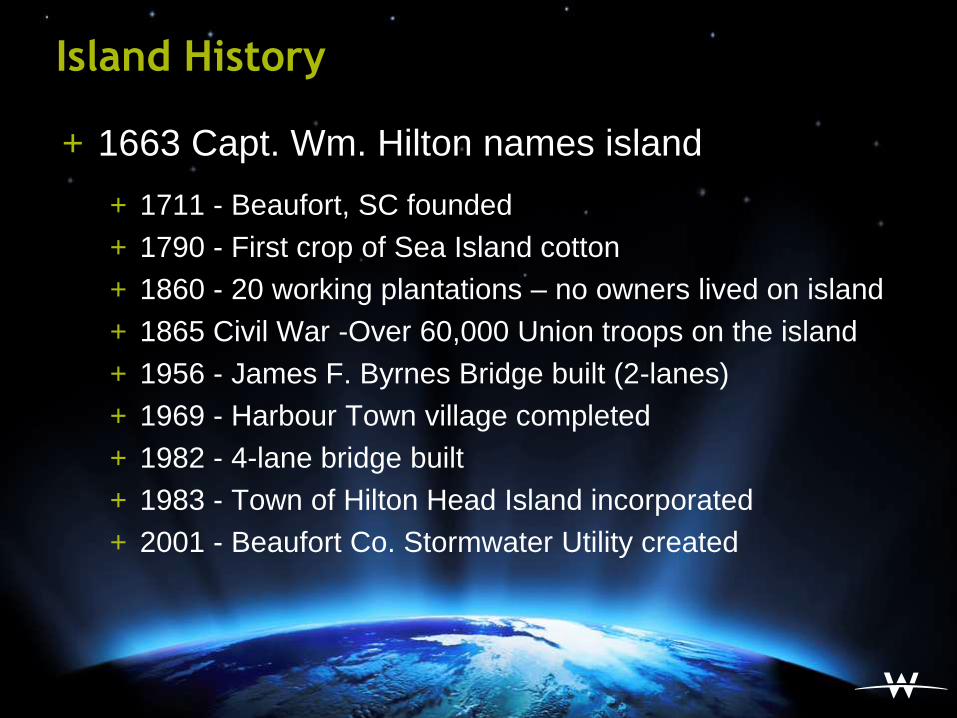
Island History
+ 1663 Capt. Wm. Hilton names island
+ 1711 - Beaufort, SC founded
+ 1790 - First crop of Sea Island cotton
+ 1860 - 20 working plantations – no owners lived on island
+ 1865 Civil War -Over 60,000 Union troops on the island
+ 1956 - James F. Byrnes Bridge built (2-lanes)
+ 1969 - Harbour Town village completed
+ 1982 - 4-lane bridge built
+ 1983 - Town of Hilton Head Island incorporated
+ 2001 - Beaufort Co. Stormwater Utility created

Fun Facts
+ Land Area = 54 square miles
+ Population = Resident 37,000
+ 2.5 million annual visitors
+ Second largest barrier island on US east coast
+ Town government incorporated in 1983
+ 1,318 acres of Town owned land
+ $168 Million spent acquiring Town land
+ SWU Fee = $108. / SFU
+ FY 14 SWU Revenue = $3.5 Million
+ Charging fee since 2001
+ NOT an permitted MS4 (yet…)

Storm Water Management
+ We currently have the following programs/activities
+ Administrative
+ Public Education/Outreach
+ Capital improvements
+ Maintenance
+ Regulatory / Land Development
+ Inventory and Modeling / Asset Management

Implementation Strategy
+ With our current funding and staffing levels, we should have the
entire island inventoried and modeled in 5 years.
+ We have 21 major watershed outfalls, only one of which drains onto
the Atlantic beach.
+ With our agreements in gated communities, we have now taken
responsibility for 97% of the land area of the island.
+ We need the inventory for asset management as much as the
modeling efforts.


Future Pond Maintenance
+ There are approximately 1,155 acres of ponds or lagoons on the
island (over a thousand football fields)
+ Most of these lagoons were dug in the 1970’s and early 80’s
+ Sedimentation over time will require future dredging to maintain the
conveyance and water quality benefits of the ponds

Pond Sedimentation

Aging Infrastructure and the Need for
Pipe Maintenance / Capital Upgrades
+ Many of the systems we have accepted for maintenance were
installed in the 1970’s and early 80’s that will be nearing the end of
its service life over the next decade.
+ The average lifespan of corrugated metal pipe is generally accepted
to be 30 years.
+ Construction inspection was lacking prior to incorporation of the
Town in 1983.
+ There are more than 12 miles of metal pipe in Hilton Head
Plantation alone.
+ Our budgets are often derailed with emergency repairs

We have inherited many unknowns,
some with a high potential for failure

Replacement of Metal Culvert


stormo
ps
Inventory Approach + Purposes for inventory
+ Operation and Maintenance of system
+ H&H modeling
+ WQ modeling
+ Stormwater Master Plans
+ Two pass
+ Initial pass
+ GILware data collection software on tablet
computers
+ Garmin 10 RTD GPS receivers
+ Establish Object IDs
+ Attributes
+ Connectivity
+ Photographs
+ Second pass
+ Combination of conventional and RTK GPS
+ Survey grade X, Y, and Z coordinates


stormo
ps
Hydrologic and Hydraulic Modeling
Approach + Pressure transducers and rain gages for calibration data

stormo
ps
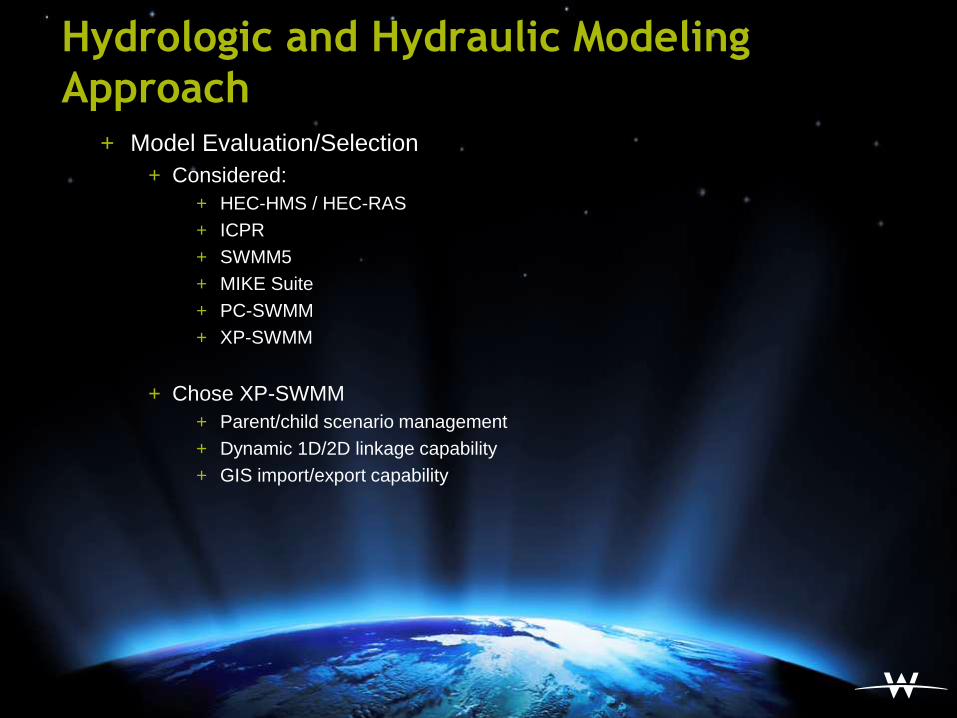
Hydrologic and Hydraulic Modeling
Approach + Model Evaluation/Selection
+ Considered:
+ HEC-HMS / HEC-RAS
+ ICPR
+ SWMM5
+ MIKE Suite
+ PC-SWMM
+ XP-SWMM
+ Chose XP-SWMM
+ Parent/child scenario management
+ Dynamic 1D/2D linkage capability
+ GIS import/export capability

Hydrologic and Hydraulic Modeling
Approach
+ Modeler Field Investigations
+ Development of Hydrologic Parameters
+ Subwatersheds
+ Curve Numbers
+ Times of Concentration
+ Hydrologic and Hydraulic Modeling
+ Calibration/Validation of H&H Models
+ Drainage System Evaluation and Analysis
+ Floodplains
+ GIS Interface


Calibration


stormo
ps
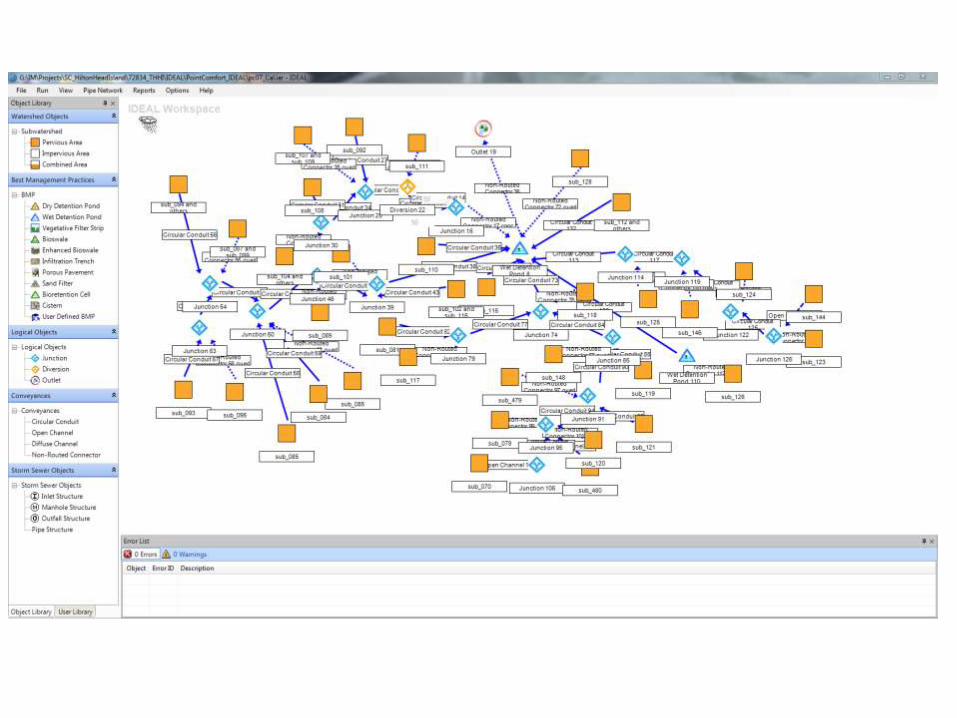
Water Quality Modeling Approach + Model Evaluation/Determination
+ Considered:
+ HSPF
+ IDEAL
+ SWAT
+ SUSTAIN
+ SWMM5
+ XP-SWMM
+ WINSLAMM
+ Graded:
+ Usability
+ Data requirements
+ Technical accuracy
+ Water Quality capabilities
+ BMPs
+ Technical support
+ Stability
+ Reporting capabilities
+ GIS compatibility
+ Cost

Water Quality Modeling Approach
+ IDEAL model
+ Versatile enough for both small and
large watersheds
+ The model utilizes landuse-based
loading for:
+ Sediment
+ Nutrients (N & P)
+ Bacteria
+ Annual Simulations
+ BMP routines based on complex
physical, chemical, and biological
processes
+ Allows for retrofit design and calculation

Water Quality Modeling Approach
+ Review Existing Water Quality Data
+ Modeler Field Investigations
+ Water Quality Model Setup (using H&H model parameters)
+ Water Quality Modeling
+ Water Quality Model Calibration (Quantity and Quality)
+ Water Quality Analysis and Characterization
+ Watershed Prioritization for Potential Retrofits


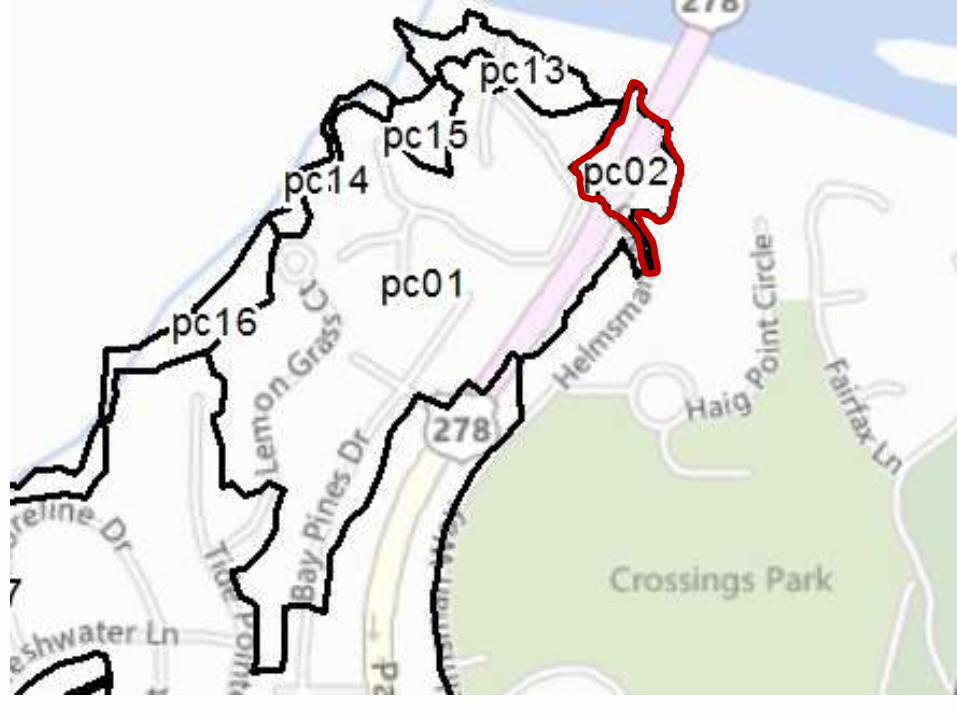
Watershed Area, ac
Total Runoff Volume Per ac-ft/ac/yr
Total Sediment
Discharged lbs/ac/yr
Total Nitrogen
Discharged lbs/ac/yr
Total Phosphorus Discharged lbs/ac/yr
Total Bacteria Discharged Per
cfu/ac/yr pc01 48.5 0.80 801.69 2.91 0.35 8.7E+10 pc02 3.5 1.68 201.47 8.67 1.04 4.9E+11 pc03 72.6 0.64 9.16 1.36 0.16 9.6E+09 pc04 14.7 0.55 2705.44 3.02 0.38 1.0E+11 pc05 3.4 0.55 716.47 2.21 0.34 5.9E+10 pc06 3.0 0.60 710.67 2.87 0.38 9.0E+10 pc07 42.9 0.30 0.66 0.64 0.06 5.8E+09 pc08 27.4 0.16 10.81 0.26 0.04 4.5E+09 pc09 1.9 0.12 80.05 0.58 0.08 2.0E+10 pc10 6.2 0.07 33.69 0.30 0.04 9.4E+09 pc11 5.0 0.08 45.62 0.40 0.06 1.3E+10 pc12 7.9 0.19 170.78 1.02 0.14 3.4E+10 pc13 3.4 0.24 932.06 1.15 0.12 3.3E+10 pc14 1.7 0.15 1153.85 0.78 0.06 2.4E+10 pc15 1.7 0.27 793.60 1.47 0.16 4.5E+10 pc16 3.5 0.14 1801.44 0.73 0.06 2.3E+10 pc17 5.2 0.06 227.41 0.28 0.04 8.2E+09 pc18 2.2 0.05 78.06 0.22 0.03 5.2E+09 pc19 1.6 0.10 319.88 0.55 0.07 1.8E+10 pc20 0.5 0.10 398.43 0.44 0.07 1.2E+10 pc21 2.5 0.16 416.87 0.80 0.08 2.6E+10 pc22 3.3 0.31 1567.96 1.65 0.13 5.3E+10 pc23 17.9 0.14 178.18 0.52 0.09 1.1E+10 pc24 5.8 0.08 128.03 0.41 0.06 1.3E+10 pc25 0.7 0.08 215.74 0.45 0.06 1.5E+10
Area-Weighted Average
11.5 0.45 390 1.4 0.17 3.6E+10

Master Plan Development + Alternatives to Address Flooding
+ Riverine Flooding
+ Level of Service (LOS) analysis
+ Identify Capitol Improvement Projects
+ Prioritization
+ Alternatives to Address Water Quality
+ Annual Loading
+ Identify Target Subwatersheds
+ Identify BMP Retrofit Opportunities
+ Prioritization
+ Real World
+ Apply Budget Constraints
+ Develop Realistic Schedules