the freeman data benchmark study - amazon s3 · benchmark study. this is the first report of its...
TRANSCRIPT
Data Benchmark StudyThe Freeman®

2 2019 FREEMAN® DATA BENCHMARK STUDY
Introduction 3I. A Data-Fueled Marketing Mix Emerges for 2019 4II. Measurement and Analytics: Data Is the DNA of ROI 8III. Event and Experiential Marketing Emerges as a 12
Leading Brand Data Hub
Methodology and About the Respondents 29About Freeman 32
contentsTable of
2019 FREEMAN® DATA BENCHMARK STUDY 3
Are you ready to join the data revolution?Over the last 12 months, corporate marketers have begun to put a much larger focus on data — collecting it, analyzing it, leveraging it, activating it.
Data as a tool. Data as a marketing indicator. Data as a measurement operating system. Data as a strategy planner, budget halo, and brand storyteller.
As insights become the operating system so many marketing departments are running on, data has emerged as the leading catalyst for information — about brands, their customers, and how the two are connected.
Yet many companies are still in the early stages of this transformation.
To gauge this seismic shift across the marketing landscape, Freeman® and Chief Marketer have developed a unique, groundbreaking study — The Freeman® Data Benchmark Study. This is the first report of its kind ever fielded to gauge the role of data across the entire corporate marketing mix, polling marketers that own and control every marketing silo. We surveyed marketers that work in every marketing discipline, from brand marketing to retail marketing to digital/social marketing to direct marketing, shopper, experiential, and more. The goal: Spotlight the rise of data, uncover how brands are leveraging data across the marketing mix, and learn which different marketing channels are being used as data funnels. The analysis in this report will help marketing executives make more informed decisions and improve their data strategies and approaches.
The study received an unprecedented response from brands. More than 650 leading brand marketing executives, representing many of the largest companies in the world, participated. The survey polled marketers across a range of categories, including technology, automotive, medical/pharmaceutical, financial services, consumer products, education, entertainment and media, consumer electronics, consumer packaged goods, beverage, and other important sectors. Freeman and Chief Marketer thank all of the respondents for their invaluable contribution to the study.
© 2018 Freeman and Chief Marketer / Access Intelligence, LLC. All Rights Reserved. No part of this publication can be copied or disseminated without the permission of Freeman and Chief Marketer / Access Intelligence, LLC.
2019 FREEMAN® DATA BENCHMARK STUDY4
Data is the fuel that powers the marketing mix. Nearly all marketers in every industry are focused on more effectively capturing and measuring data to better understand customers and make more informed strategic budget and investment decisions. Data drives or informs an increasing amount of decisions throughout marketing groups and corporations. As the findings throughout the report show, nearly all marketers are serious about data analytics for 2019 and beyond.
Dependence on Data: Secure Budgets, Set Strategy, and Impact the Enterprise
98% of marketers use data to secure budget
97% of marketers say using data is important when communicating with C-Levels about marketing programs and results
89% of marketers use data to make strategic decisions
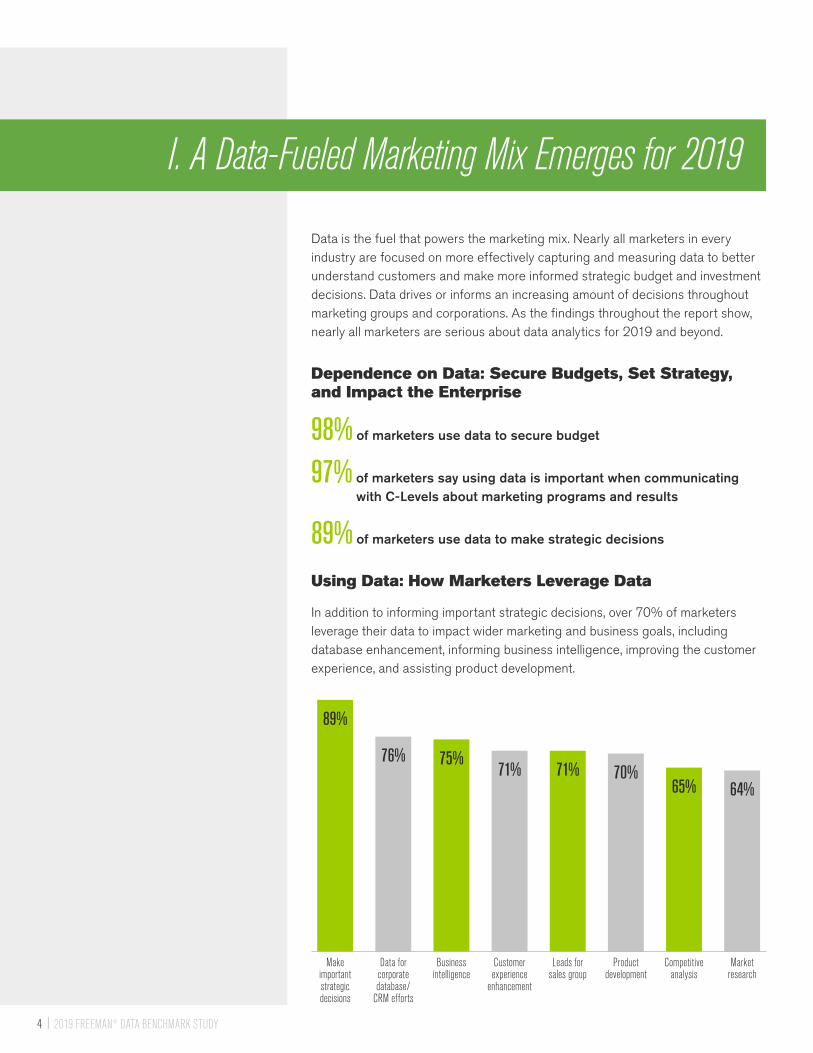
Using Data: How Marketers Leverage Data
In addition to informing important strategic decisions, over 70% of marketers leverage their data to impact wider marketing and business goals, including database enhancement, informing business intelligence, improving the customer experience, and assisting product development.
I. A Data-Fueled Marketing Mix Emerges for 2019
Make important strategic decisions
Data for corporate database/
CRM efforts
Business intelligence
Customer experience
enhancement
Leads for sales group
Product development
Competitive analysis
Market research
89%
76% 75%71% 71% 70%
65% 64%
52019 FREEMAN® DATA BENCHMARK STUDY
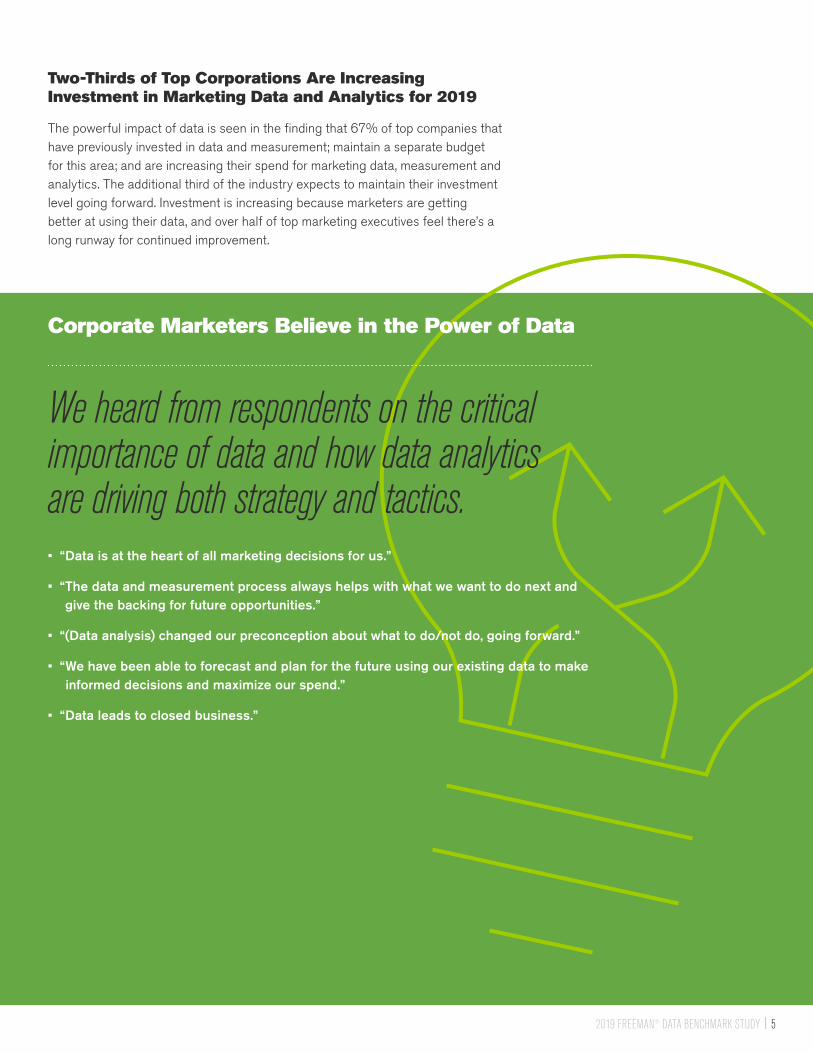
Two-Thirds of Top Corporations Are Increasing Investment in Marketing Data and Analytics for 2019
The powerful impact of data is seen in the finding that 67% of top companies that have previously invested in data and measurement; maintain a separate budget for this area; and are increasing their spend for marketing data, measurement and analytics. The additional third of the industry expects to maintain their investment level going forward. Investment is increasing because marketers are getting better at using their data, and over half of top marketing executives feel there’s a long runway for continued improvement.
• “Data is at the heart of all marketing decisions for us.”
• “ The data and measurement process always helps with what we want to do next and give the backing for future opportunities.”
• “(Data analysis) changed our preconception about what to do/not do, going forward.”
• “ We have been able to forecast and plan for the future using our existing data to make informed decisions and maximize our spend.”
• “Data leads to closed business.”
We heard from respondents on the critical importance of data and how data analytics are driving both strategy and tactics.
Corporate Marketers Believe in the Power of Data
2019 FREEMAN® DATA BENCHMARK STUDY6
Additional Corporate Marketer Findings
The data in this section provides an expanded set of corporate marketer survey findings.
Primary Corporate Marketing Objectives
Survey Question:
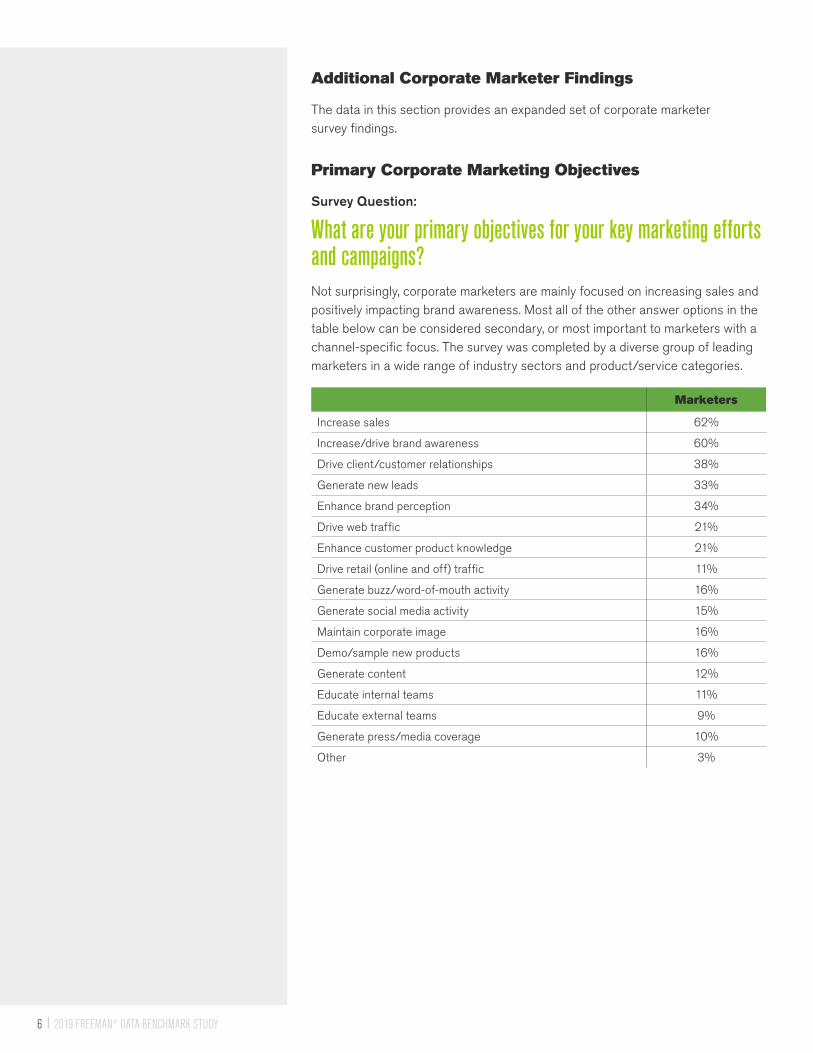
What are your primary objectives for your key marketing efforts and campaigns? Not surprisingly, corporate marketers are mainly focused on increasing sales and positively impacting brand awareness. Most all of the other answer options in the table below can be considered secondary, or most important to marketers with a channel-specific focus. The survey was completed by a diverse group of leading marketers in a wide range of industry sectors and product/service categories.
Marketers
Increase sales 62%
Increase/drive brand awareness 60%
Drive client/customer relationships 38%
Generate new leads 33%
Enhance brand perception 34%
Drive web traffic 21%
Enhance customer product knowledge 21%
Drive retail (online and off) traffic 11%
Generate buzz/word-of-mouth activity 16%
Generate social media activity 15%
Maintain corporate image 16%
Demo/sample new products 16%
Generate content 12%
Educate internal teams 11%
Educate external teams 9%
Generate press/media coverage 10%
Other 3%
2019 FREEMAN® DATA BENCHMARK STUDY 7
Most Important Marketing Data Points Being Collected and Measured
Survey Question:
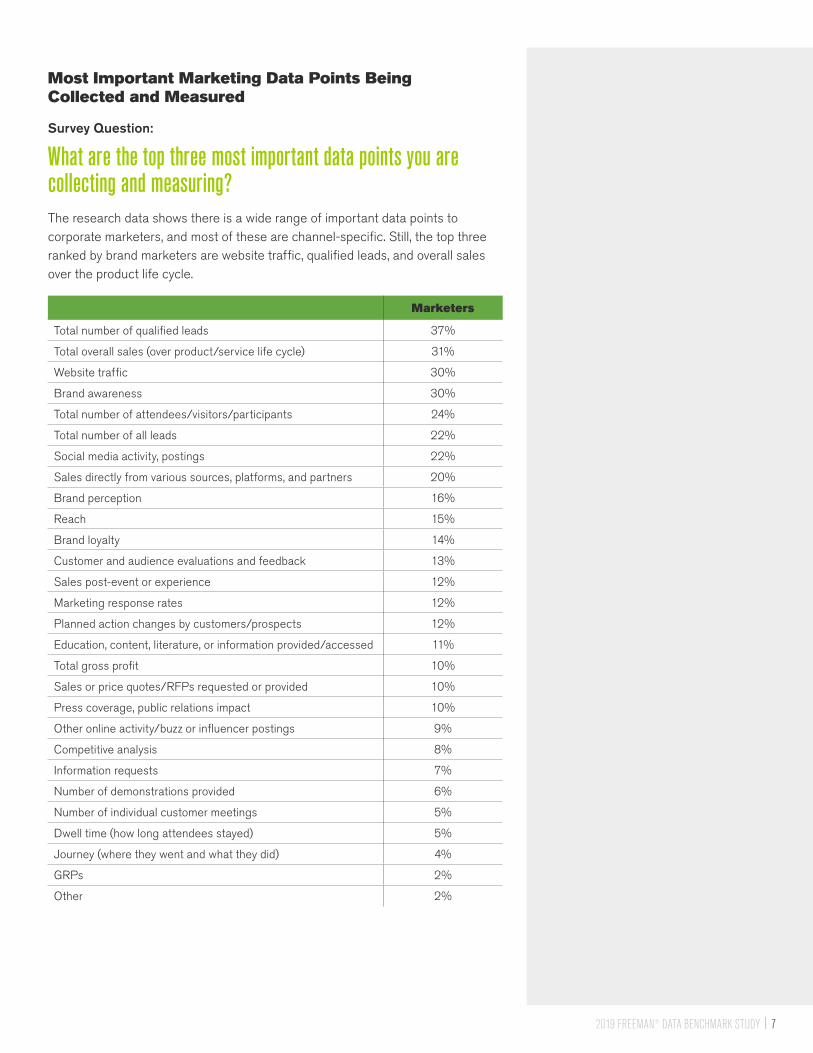
What are the top three most important data points you are collecting and measuring?The research data shows there is a wide range of important data points to corporate marketers, and most of these are channel-specific. Still, the top three ranked by brand marketers are website traffic, qualified leads, and overall sales over the product life cycle.
Marketers
Total number of qualified leads 37%
Total overall sales (over product/service life cycle) 31%
Website traffic 30%
Brand awareness 30%
Total number of attendees/visitors/participants 24%
Total number of all leads 22%
Social media activity, postings 22%
Sales directly from various sources, platforms, and partners 20%
Brand perception 16%
Reach 15%
Brand loyalty 14%
Customer and audience evaluations and feedback 13%
Sales post-event or experience 12%
Marketing response rates 12%
Planned action changes by customers/prospects 12%
Education, content, literature, or information provided/accessed 11%
Total gross profit 10%
Sales or price quotes/RFPs requested or provided 10%
Press coverage, public relations impact 10%
Other online activity/buzz or influencer postings 9%
Competitive analysis 8%
Information requests 7%
Number of demonstrations provided 6%
Number of individual customer meetings 5%
Dwell time (how long attendees stayed) 5%
Journey (where they went and what they did) 4%
GRPs 2%
Other 2%
8 2019 FREEMAN® DATA BENCHMARK STUDY
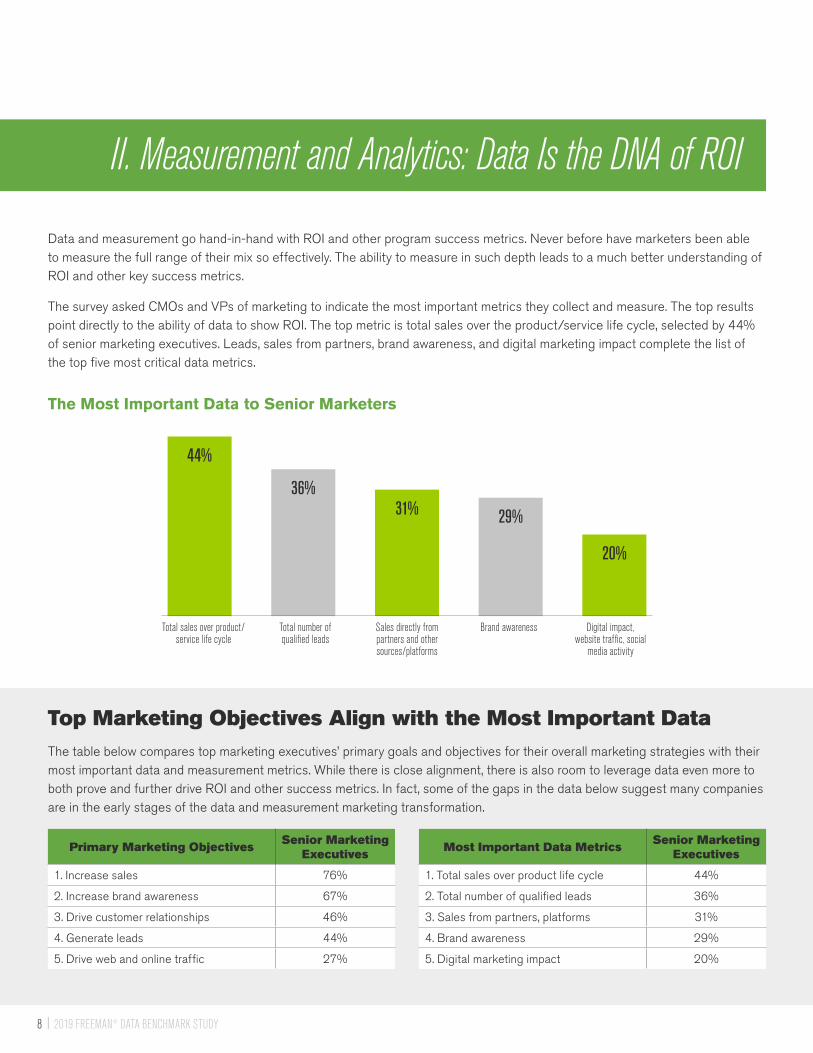
Top Marketing Objectives Align with the Most Important DataThe table below compares top marketing executives’ primary goals and objectives for their overall marketing strategies with their most important data and measurement metrics. While there is close alignment, there is also room to leverage data even more to both prove and further drive ROI and other success metrics. In fact, some of the gaps in the data below suggest many companies are in the early stages of the data and measurement marketing transformation.
Primary Marketing ObjectivesSenior Marketing
ExecutivesMost Important Data Metrics
Senior Marketing Executives
1. Increase sales 76% 1. Total sales over product life cycle 44%
2. Increase brand awareness 67% 2. Total number of qualified leads 36%
3. Drive customer relationships 46% 3. Sales from partners, platforms 31%
4. Generate leads 44% 4. Brand awareness 29%
5. Drive web and online traffic 27% 5. Digital marketing impact 20%
II. Measurement and Analytics: Data Is the DNA of ROI
Total sales over product/service life cycle
Total number of qualified leads
Sales directly from partners and other sources/platforms
Brand awareness Digital impact, website traffic, social
media activity
44%
36%31% 29%
20%
Data and measurement go hand-in-hand with ROI and other program success metrics. Never before have marketers been able to measure the full range of their mix so effectively. The ability to measure in such depth leads to a much better understanding of ROI and other key success metrics.
The survey asked CMOs and VPs of marketing to indicate the most important metrics they collect and measure. The top results point directly to the ability of data to show ROI. The top metric is total sales over the product/service life cycle, selected by 44% of senior marketing executives. Leads, sales from partners, brand awareness, and digital marketing impact complete the list of the top five most critical data metrics.
The Most Important Data to Senior Marketers
2019 FREEMAN® DATA BENCHMARK STUDY 9
How Marketing Program Data Is Used
Survey Question:
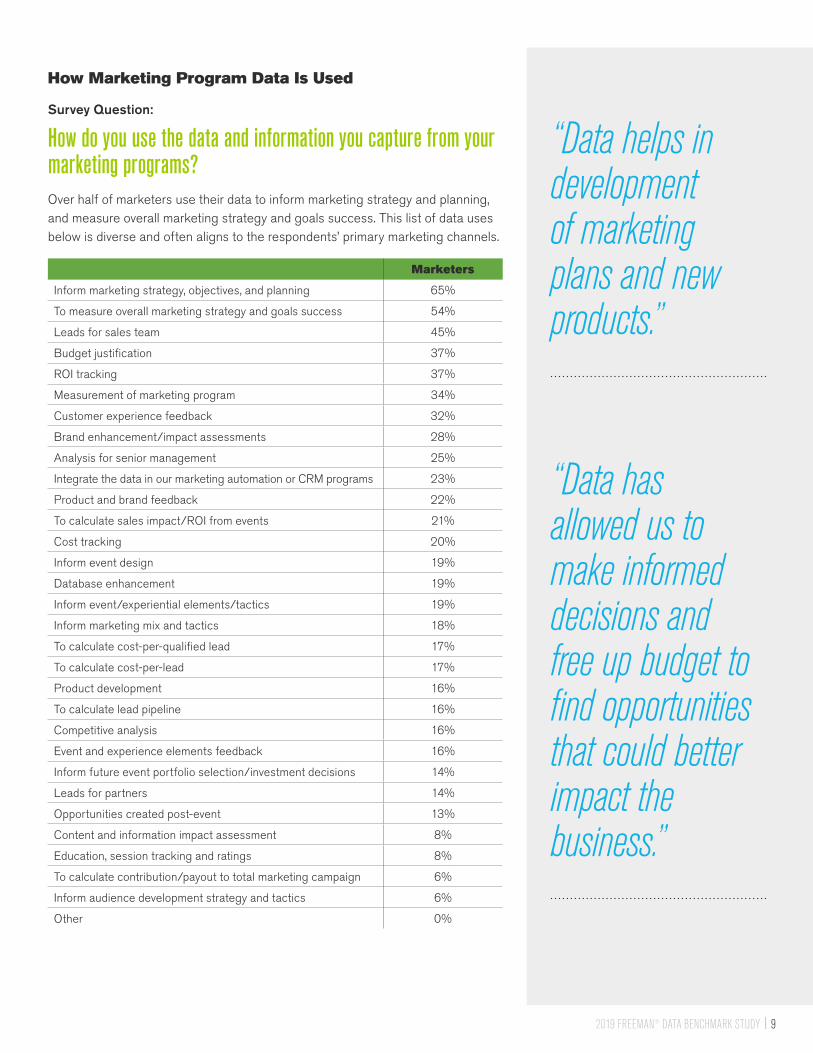
How do you use the data and information you capture from your marketing programs? Over half of marketers use their data to inform marketing strategy and planning, and measure overall marketing strategy and goals success. This list of data uses below is diverse and often aligns to the respondents’ primary marketing channels.
Marketers
Inform marketing strategy, objectives, and planning 65%
To measure overall marketing strategy and goals success 54%
Leads for sales team 45%
Budget justification 37%
ROI tracking 37%
Measurement of marketing program 34%
Customer experience feedback 32%
Brand enhancement/impact assessments 28%
Analysis for senior management 25%
Integrate the data in our marketing automation or CRM programs 23%
Product and brand feedback 22%
To calculate sales impact/ROI from events 21%
Cost tracking 20%
Inform event design 19%
Database enhancement 19%
Inform event/experiential elements/tactics 19%
Inform marketing mix and tactics 18%
To calculate cost-per-qualified lead 17%
To calculate cost-per-lead 17%
Product development 16%
To calculate lead pipeline 16%
Competitive analysis 16%
Event and experience elements feedback 16%
Inform future event portfolio selection/investment decisions 14%
Leads for partners 14%
Opportunities created post-event 13%
Content and information impact assessment 8%
Education, session tracking and ratings 8%
To calculate contribution/payout to total marketing campaign 6%
Inform audience development strategy and tactics 6%
Other 0%
“Data has allowed us to make informed decisions and free up budget to find opportunities that could better impact the business.”
“Data helps in development of marketing plans and new products.”

2019 FREEMAN® DATA BENCHMARK STUDY10
Percentage of Corporations with Strategic Team Member Focused on Marketing Data and Measurement
Survey Question:
Do you have a strategic person/role in your organization focused on data capture and measurement?Fifty-three percent of marketing groups say they currently have a strategic person/role in their organization focused on data capture and measurement.
Marketing Data Capture and Measurement Budget Growth
Survey Question:
Is your budget for data capture and measurement-related activities increasing, staying the same, or decreasing?Twenty-five percent of marketers say their budget for data capture and measurement-related activities is increasing. Eighteen percent say their group doesn’t budget for data and measurement activities.
Don’t budget for data & measurement
53%47%
48%
25%18%
5%
YesNo
Increasing
Staying the same
Decreasing
“Data provides insight to maximize utilization of marketing funds and sales requirements in target universes.”

2019 FREEMAN® DATA BENCHMARK STUDY 11
Biggest Marketing Data Challenges and Pain Points
Survey Question:
What are the biggest challenges and pain points related to your marketing data capture and management process?The top challenge for marketers is analyzing the data effectively, which was selected by 46% of respondents. This is important, as nearly half of marketers feel they may be missing out on key insights which would help their programs be more effective. This is followed by cost and budget constraints, as well as the issue of data quality and completeness.
Marketers
Analyzing the data effectively 46%
Cost/budget restraints 41%
Time/resources required to work with the data and information 37%
Data quality, completeness 37%
Availability of data/right data 34%
Determining what to measure 30%
Relevancy of event metrics/KPIs to overall marketing objectives 28%
Implementing findings 23%
Tracking and compiling data capture information over time 23%
Comparability of results from different channels, parts of marketing mix, and media
21%
Data integration into our internal systems 20%
Privacy issues 15%
Acceptance of results by management 10%
Other 1%

12 2019 FREEMAN® DATA BENCHMARK STUDY
Across all marketing channels and marketing mix silos, event and experiential marketing stands out significantly as an effective sector for data collection, generation, and influence. The study shows events provide a “wider and deeper” range of data and metrics than other channels.
Event marketers are measuring all of the metrics and areas that are most important to brand marketers. In fact, overall, a higher percentage of event marketers are measuring more key marketing metrics — and collecting more data — than brand marketers across other channels. No other marketing channel provides the opportunity to measure nearly the full spectrum of metrics and key customer and consumer interactions.
Data Points: Event and Brand Marketer Comparison
The chart below compares what event marketers and brand marketers typically collect and measure related to their events and other marketing efforts and campaigns. The largest gap is around the total number of leads. The survey finds that 53% of event marketers say tracking the total number of all leads is one of their most important metrics compared to only 17% of brand marketers. Event marketers say both quality and quantity of generated leads are almost equally important, whereas brand marketers indicate they prioritize qualified leads as more important. There is also a wide gap in social media tracking. Fifty-five percent of event marketers track social media activity impact from their events. The low brand marketing finding here (22% tracking social media) is due to the fact that most marketers are channel-specific in their focus.
III. Event and Experiential Marketing Emerges as a Leading Brand Data Hub
Additional data and measurement comparisons between event and brand marketers are provided below.
Social media activity Total number of all leads
■ Event Marketers ■ Brand Marketers
Total number of qualified leads
Brand awareness Website traffic Total sales over product service life
Press coverage Brand perception
55%
22%
53%
17%
49%
31%
41%
28%
41%
32%39%
29%33%
5%
28%
12%
2019 FREEMAN® DATA BENCHMARK STUDY 13
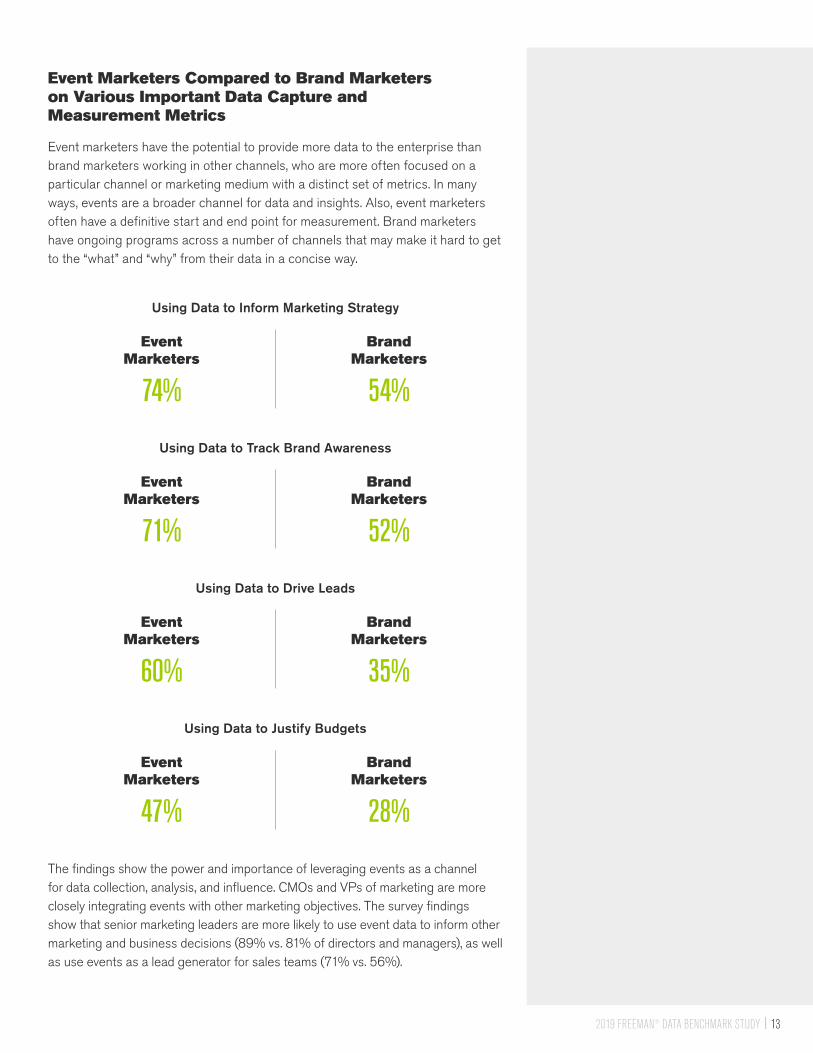
Event Marketers Compared to Brand Marketers on Various Important Data Capture and Measurement Metrics
Event marketers have the potential to provide more data to the enterprise than brand marketers working in other channels, who are more often focused on a particular channel or marketing medium with a distinct set of metrics. In many ways, events are a broader channel for data and insights. Also, event marketers often have a definitive start and end point for measurement. Brand marketers have ongoing programs across a number of channels that may make it hard to get to the “what” and “why” from their data in a concise way.
Using Data to Inform Marketing Strategy
Event Marketers
Brand Marketers
74% 54%
Using Data to Track Brand Awareness
Event Marketers
Brand Marketers
71% 52%
Using Data to Drive Leads
Event Marketers
Brand Marketers
60% 35%
Using Data to Justify Budgets
Event Marketers
Brand Marketers
47% 28% The findings show the power and importance of leveraging events as a channel for data collection, analysis, and influence. CMOs and VPs of marketing are more closely integrating events with other marketing objectives. The survey findings show that senior marketing leaders are more likely to use event data to inform other marketing and business decisions (89% vs. 81% of directors and managers), as well as use events as a lead generator for sales teams (71% vs. 56%).
2019 FREEMAN® DATA BENCHMARK STUDY14
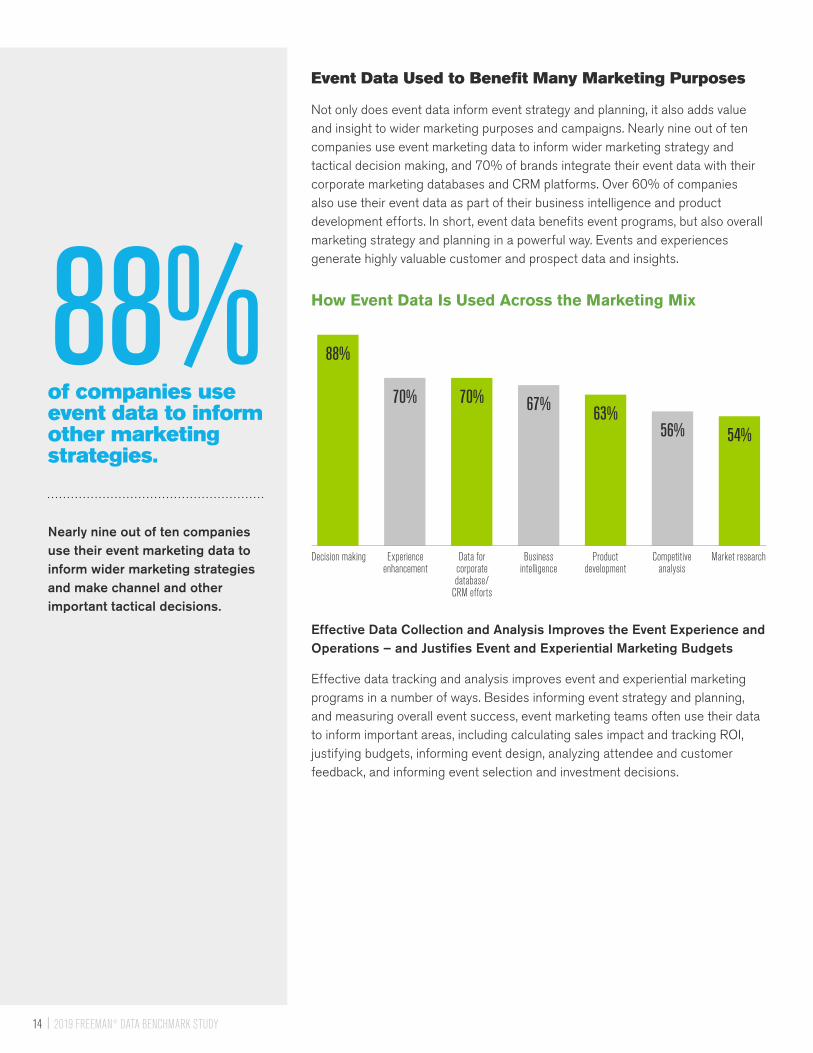
Event Data Used to Benefit Many Marketing Purposes
Not only does event data inform event strategy and planning, it also adds value and insight to wider marketing purposes and campaigns. Nearly nine out of ten companies use event marketing data to inform wider marketing strategy and tactical decision making, and 70% of brands integrate their event data with their corporate marketing databases and CRM platforms. Over 60% of companies also use their event data as part of their business intelligence and product development efforts. In short, event data benefits event programs, but also overall marketing strategy and planning in a powerful way. Events and experiences generate highly valuable customer and prospect data and insights.
How Event Data Is Used Across the Marketing Mix
Effective Data Collection and Analysis Improves the Event Experience and Operations – and Justifies Event and Experiential Marketing Budgets
Effective data tracking and analysis improves event and experiential marketing programs in a number of ways. Besides informing event strategy and planning, and measuring overall event success, event marketing teams often use their data to inform important areas, including calculating sales impact and tracking ROI, justifying budgets, informing event design, analyzing attendee and customer feedback, and informing event selection and investment decisions.
Decision making Experience enhancement
Data for corporate database/
CRM efforts
Business intelligence
Product development
Competitive analysis
Market research
88%
70% 70% 67% 63%56% 54%
Nearly nine out of ten companies use their event marketing data to inform wider marketing strategies and make channel and other important tactical decisions.
of companies use event data to inform other marketing strategies.
88%
2019 FREEMAN® DATA BENCHMARK STUDY 15
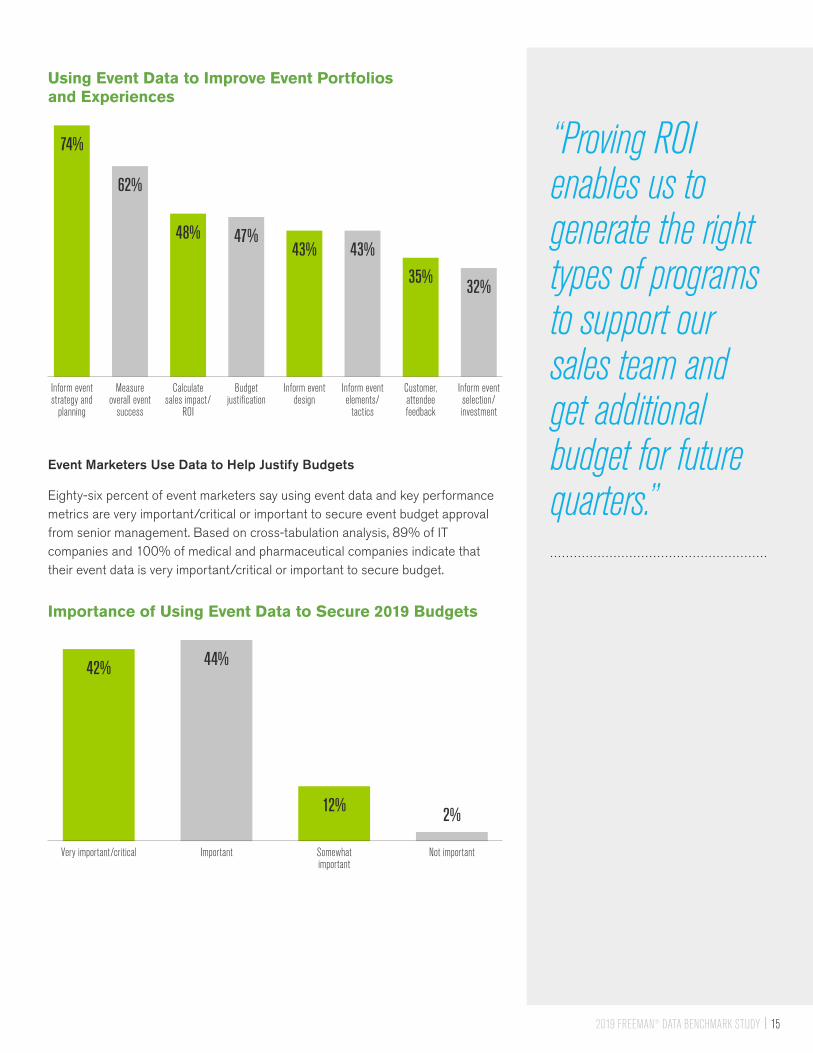
Using Event Data to Improve Event Portfolios and Experiences
Event Marketers Use Data to Help Justify Budgets
Eighty-six percent of event marketers say using event data and key performance metrics are very important/critical or important to secure event budget approval from senior management. Based on cross-tabulation analysis, 89% of IT companies and 100% of medical and pharmaceutical companies indicate that their event data is very important/critical or important to secure budget.
Importance of Using Event Data to Secure 2019 Budgets
Inform event strategy and
planning
Measure overall event
success
Calculate sales impact/
ROI
Budget justification
Inform event design
Inform event elements/
tactics
Customer, attendee feedback
Inform event selection/investment
74%
62%
48% 47%43% 43%
35% 32%
Very important/critical Important Somewhat important
Not important
42% 44%
12% 2%
“Proving ROI enables us to generate the right types of programs to support our sales team and get additional budget for future quarters.”
2019 FREEMAN® DATA BENCHMARK STUDY16
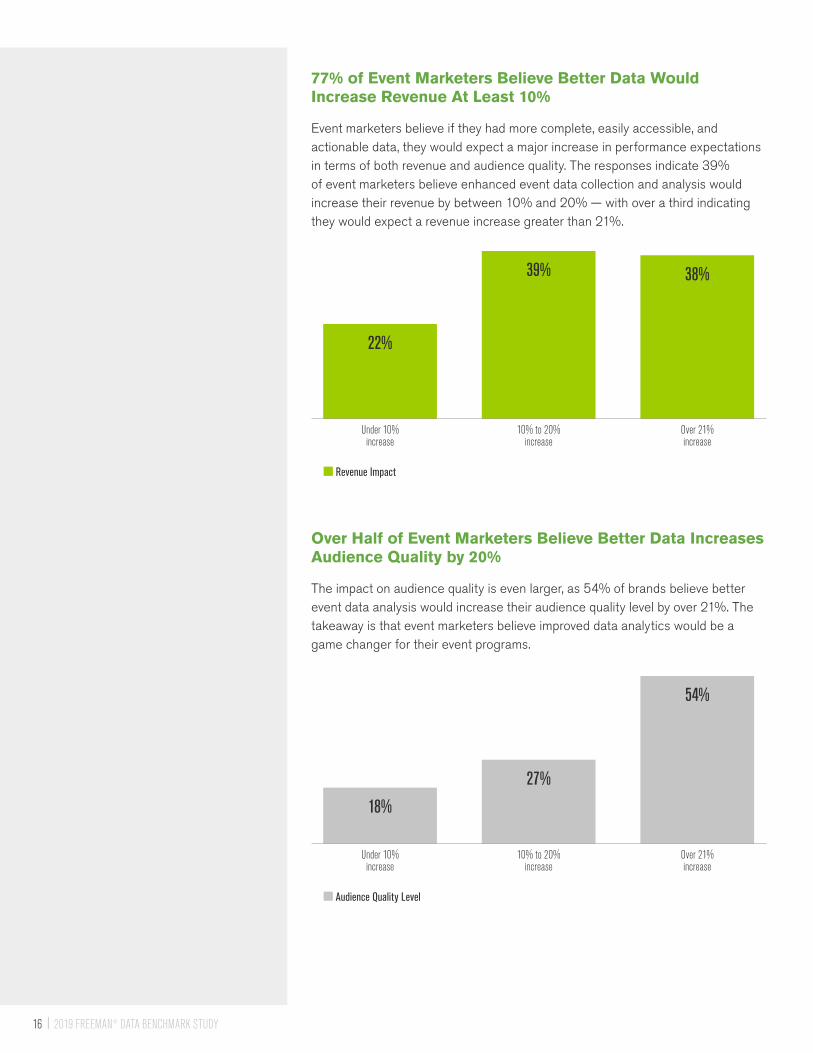
77% of Event Marketers Believe Better Data Would Increase Revenue At Least 10%
Event marketers believe if they had more complete, easily accessible, and actionable data, they would expect a major increase in performance expectations in terms of both revenue and audience quality. The responses indicate 39% of event marketers believe enhanced event data collection and analysis would increase their revenue by between 10% and 20% — with over a third indicating they would expect a revenue increase greater than 21%.
Over Half of Event Marketers Believe Better Data Increases Audience Quality by 20%
The impact on audience quality is even larger, as 54% of brands believe better event data analysis would increase their audience quality level by over 21%. The takeaway is that event marketers believe improved data analytics would be a game changer for their event programs.
■ Revenue Impact
Under 10% increase
10% to 20% increase
Over 21% increase
22%
39% 38%
■ Audience Quality Level
Under 10% increase
10% to 20% increase
Over 21% increase
18%
27%
54%

2019 FREEMAN® DATA BENCHMARK STUDY 17
Event and Experiential Marketing Objectives
Survey Question:
What are your primary objectives for event/experiential marketing campaigns? Event marketers in B-to-B sectors are much more focused on generating new leads compared to consumer-facing event marketers. The difference is 49% of B-to-B event marketers vs. 36% of consumer-facing event marketers.
B-to-B Events B-to-C Events
Increase/drive brand awareness 76% 77%
Increase sales 65% 65%
Drive client/customer relationships 52% 45%
Enhance brand perception 50% 43%
Generate new leads 49% 36%
Enhance customer product knowledge 31% 31%
Generate buzz/word-of-mouth activity 28% 28%
Demo/sample new products 25% 33%
Generate social media activity 23% 25%
Maintain corporate image 21% 22%
Generate content 20% 19%
Drive web traffic 20% 17%
Generate press/media coverage 18% 23%
Educate internal teams 14% 13%
Educate external teams 14% 13%
Drive retail (online and off) traffic 11% 15%
Other 1% 1%
2019 FREEMAN® DATA BENCHMARK STUDY18
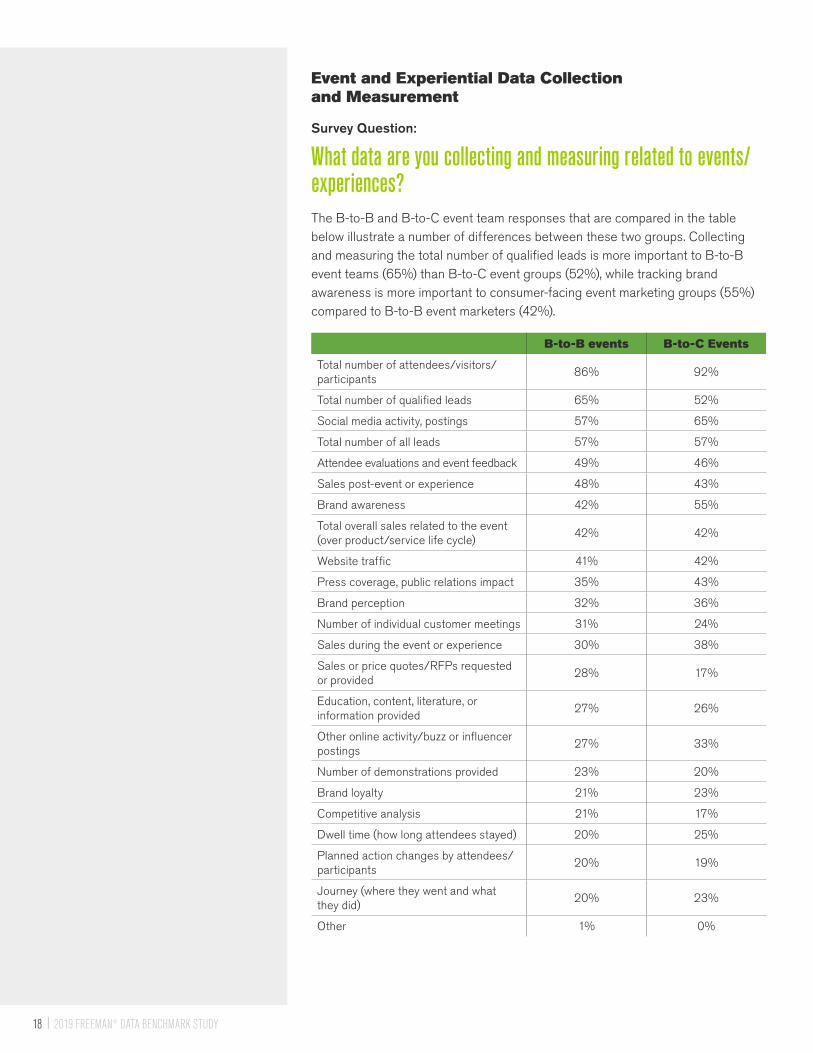
Event and Experiential Data Collection and Measurement
Survey Question:
What data are you collecting and measuring related to events/experiences? The B-to-B and B-to-C event team responses that are compared in the table below illustrate a number of differences between these two groups. Collecting and measuring the total number of qualified leads is more important to B-to-B event teams (65%) than B-to-C event groups (52%), while tracking brand awareness is more important to consumer-facing event marketing groups (55%) compared to B-to-B event marketers (42%).
B-to-B events B-to-C Events
Total number of attendees/visitors/ participants
86% 92%
Total number of qualified leads 65% 52%
Social media activity, postings 57% 65%
Total number of all leads 57% 57%
Attendee evaluations and event feedback 49% 46%
Sales post-event or experience 48% 43%
Brand awareness 42% 55%
Total overall sales related to the event (over product/service life cycle)
42% 42%
Website traffic 41% 42%
Press coverage, public relations impact 35% 43%
Brand perception 32% 36%
Number of individual customer meetings 31% 24%
Sales during the event or experience 30% 38%
Sales or price quotes/RFPs requested or provided
28% 17%
Education, content, literature, or information provided
27% 26%
Other online activity/buzz or influencer postings
27% 33%
Number of demonstrations provided 23% 20%
Brand loyalty 21% 23%
Competitive analysis 21% 17%
Dwell time (how long attendees stayed) 20% 25%
Planned action changes by attendees/participants
20% 19%
Journey (where they went and what they did)
20% 23%
Other 1% 0%

2019 FREEMAN® DATA BENCHMARK STUDY 19
Most Important Event Data Points and Metrics
Survey Question:
What are your most important event data points? The survey finds that 61% of B-to-B event marketers say the total number of qualified leads is one of their most important metrics compared to 44% of consumer event marketers. In addition, 40% of B-to-B event marketers say sales post-event is one of their most important metrics vs. 29% of consumer event marketers.
B-to-B Events B-to-C Events
Total number of qualified leads 61% 44%
Total number of attendees/visitors/participants
50% 56%
Total overall sales related to the event (over product/service life cycle)
40% 44%
Sales post-event or experience 40% 29%
Brand awareness 38% 44%
Total number of all leads 38% 31%
Attendee evaluations and event feedback 32% 27%
Planned action changes by attendees/participants
24% 21%
Sales during the event or experience 24% 23%
Brand perception 23% 31%
Social media activity, postings 19% 28%
Number of individual customer meetings 18% 13%
Sales or price quotes/RFPs requested or provided
18% 10%
Website traffic 17% 21%
Press coverage, public relations impact 17% 23%
Education, content, literature, or information provided
15% 16%
Brand loyalty 14% 16%
Dwell time (how long attendees stayed) 13% 12%
Competitive analysis 13% 12%
Number of demonstrations provided 13% 12%
Journey (where they went and what they did)
10% 13%
Other online activity/buzz or influencer postings
8% 13%

2019 FREEMAN® DATA BENCHMARK STUDY20
How Event and Experiential Data Is Used to Improve Events and the Audience/Customer Experience
Survey Question:
How do you use the data and information you capture from event and experiential marketing programs to improve your events and the audience/customer experience? Effective data tracking and analysis improves event and experiential marketing programs in a number of ways. Besides informing event strategy and planning, and measuring overall event success, event marketers often use their data to inform the following important areas, including, to calculate sales impact and track ROI, justify budgets, analyze attendee and customer feedback, inform event design, and make event selection and investment decisions. The findings show B-to-B and consumer event groups are closely aligned on these areas.
B-to-B Events B-to-C Events
Inform event strategy, objectives and planning
75% 78%
To measure overall success of event 60% 63%
To calculate sales impact/ROI from events
56% 52%
Budget justification 52% 50%
Event and experience elements feedback 41% 40%
Inform event design 40% 44%
Inform event/experiential elements/tactics
40% 49%
Inform future event portfolio selection/investment decisions
38% 35%
Customer experience feedback 37% 39%
Long-term financial ROI 32% 27%
Short-term financial ROI 28% 26%
Content and information impact assessment
24% 18%
Education, session tracking, and ratings 24% 18%
Cost tracking 23% 25%
Inform audience development strategy and tactics
18% 14%
Other 0% 0%
“Data helps us better understand customer motivations and needs.”
2019 FREEMAN® DATA BENCHMARK STUDY 21
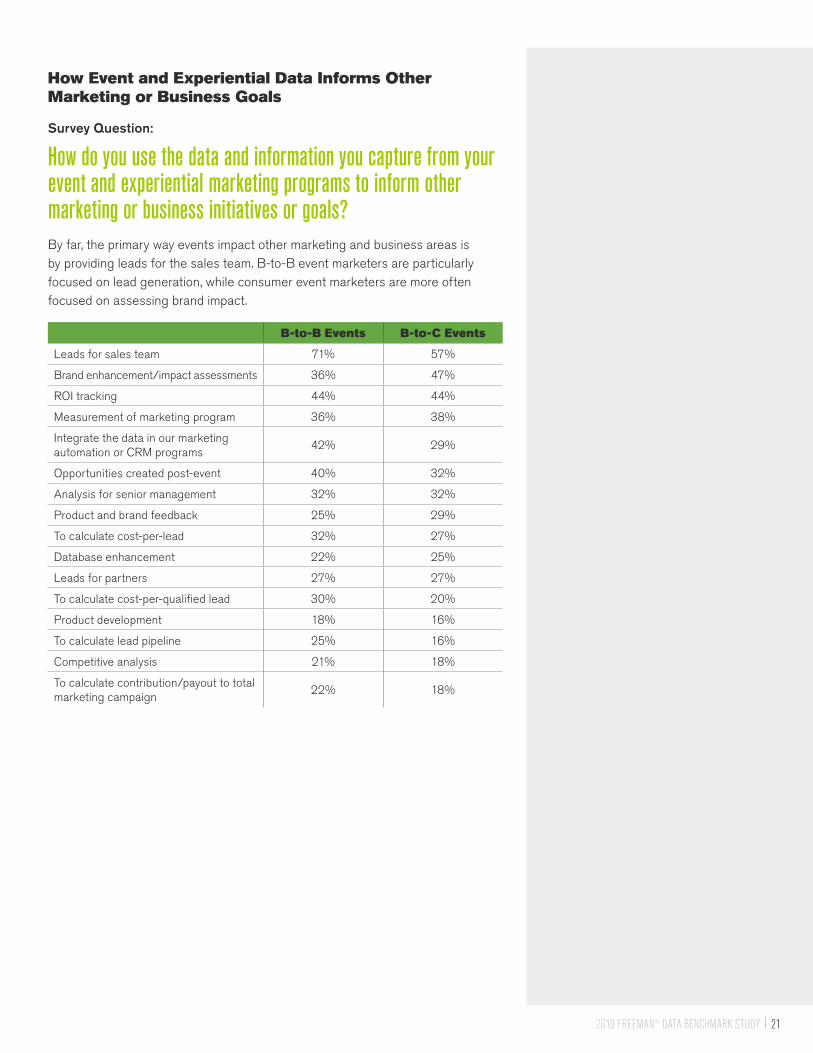
How Event and Experiential Data Informs Other Marketing or Business Goals
Survey Question:
How do you use the data and information you capture from your event and experiential marketing programs to inform other marketing or business initiatives or goals?By far, the primary way events impact other marketing and business areas is by providing leads for the sales team. B-to-B event marketers are particularly focused on lead generation, while consumer event marketers are more often focused on assessing brand impact.
B-to-B Events B-to-C Events
Leads for sales team 71% 57%
Brand enhancement/impact assessments 36% 47%
ROI tracking 44% 44%
Measurement of marketing program 36% 38%
Integrate the data in our marketing automation or CRM programs
42% 29%
Opportunities created post-event 40% 32%
Analysis for senior management 32% 32%
Product and brand feedback 25% 29%
To calculate cost-per-lead 32% 27%
Database enhancement 22% 25%
Leads for partners 27% 27%
To calculate cost-per-qualified lead 30% 20%
Product development 18% 16%
To calculate lead pipeline 25% 16%
Competitive analysis 21% 18%
To calculate contribution/payout to total marketing campaign
22% 18%
2019 FREEMAN® DATA BENCHMARK STUDY22
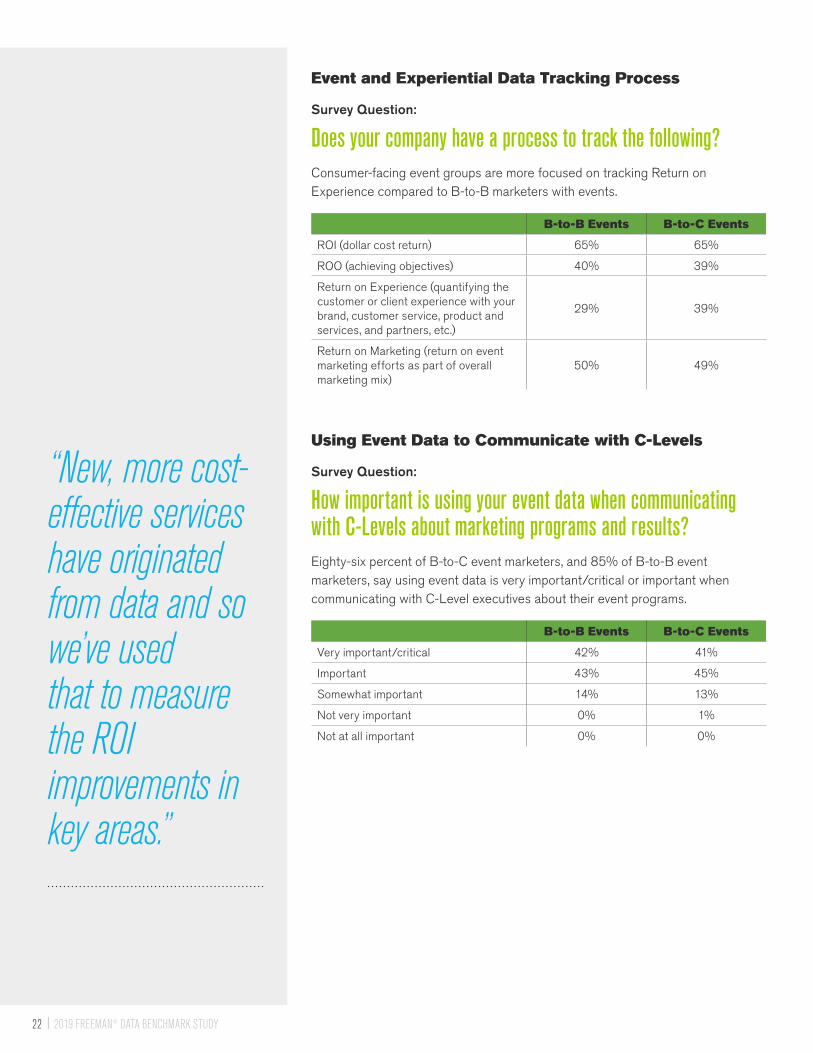
Event and Experiential Data Tracking Process
Survey Question:
Does your company have a process to track the following? Consumer-facing event groups are more focused on tracking Return on Experience compared to B-to-B marketers with events.
B-to-B Events B-to-C Events
ROI (dollar cost return) 65% 65%
ROO (achieving objectives) 40% 39%
Return on Experience (quantifying the customer or client experience with your brand, customer service, product and services, and partners, etc.)
29% 39%
Return on Marketing (return on event marketing efforts as part of overall marketing mix)
50% 49%
Using Event Data to Communicate with C-Levels
Survey Question:
How important is using your event data when communicating with C-Levels about marketing programs and results?Eighty-six percent of B-to-C event marketers, and 85% of B-to-B event marketers, say using event data is very important/critical or important when communicating with C-Level executives about their event programs.
B-to-B Events B-to-C Events
Very important/critical 42% 41%
Important 43% 45%
Somewhat important 14% 13%
Not very important 0% 1%
Not at all important 0% 0%
“New, more cost-effective services have originated from data and so we’ve used that to measure the ROI improvements in key areas.”
2019 FREEMAN® DATA BENCHMARK STUDY 23
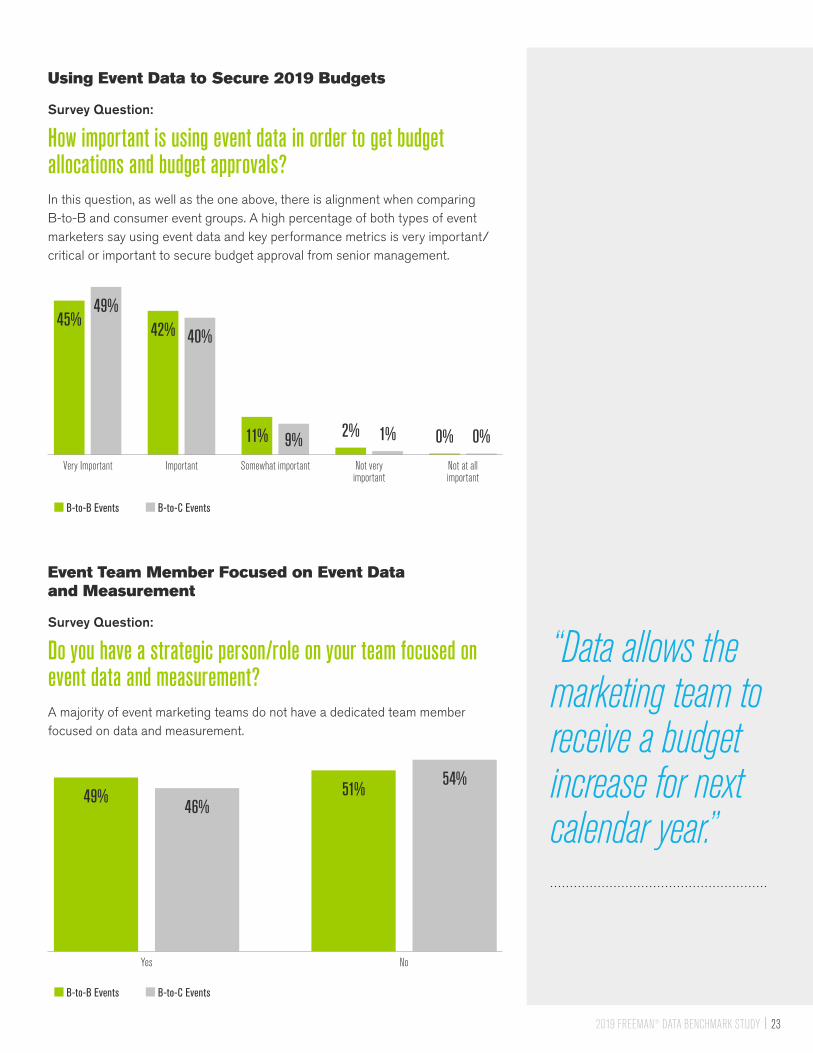
Using Event Data to Secure 2019 Budgets
Survey Question:
How important is using event data in order to get budget allocations and budget approvals?In this question, as well as the one above, there is alignment when comparing B-to-B and consumer event groups. A high percentage of both types of event marketers say using event data and key performance metrics is very important/critical or important to secure budget approval from senior management.
Event Team Member Focused on Event Data and Measurement
Survey Question:
Do you have a strategic person/role on your team focused on event data and measurement?A majority of event marketing teams do not have a dedicated team member focused on data and measurement.
“Data allows the marketing team to receive a budget increase for next calendar year.”
Yes No
■ B-to-B Events ■ B-to-C Events
49%46%
51%54%
Very Important Important
■ B-to-B Events ■ B-to-C Events
Somewhat important Not very important
Not at all important
45%49%
42% 40%
11% 9% 2% 1% 0% 0%
2019 FREEMAN® DATA BENCHMARK STUDY24
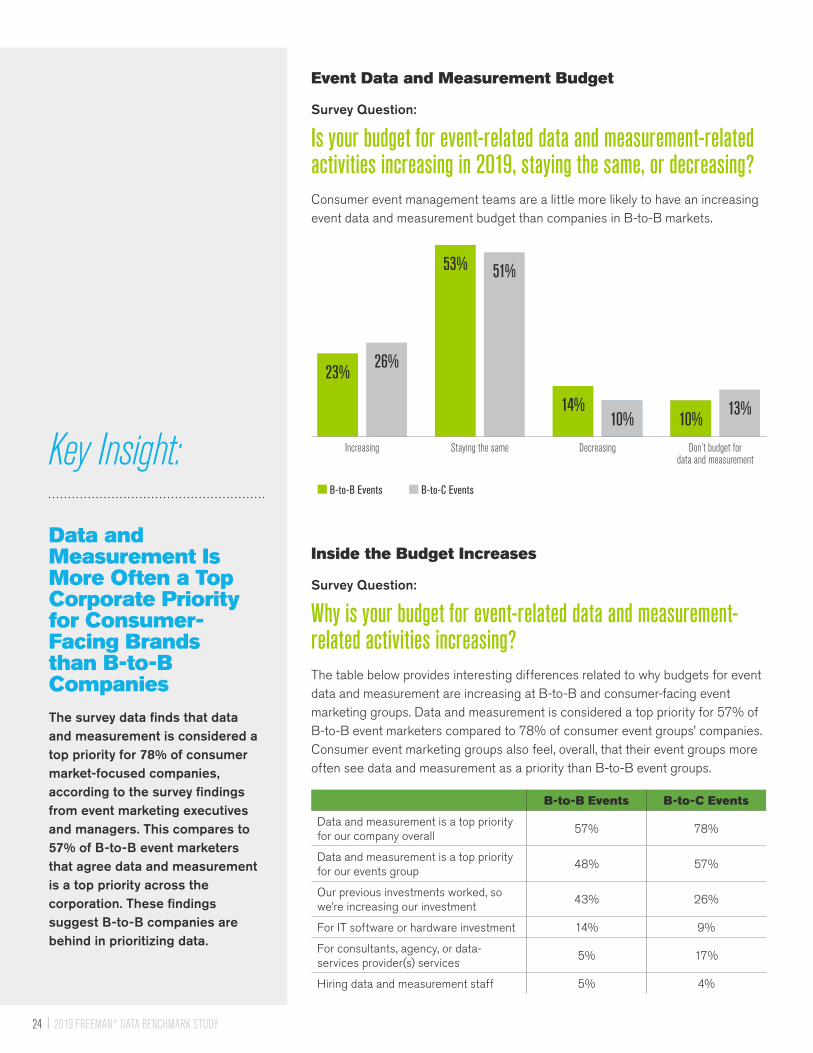
Event Data and Measurement Budget
Survey Question:
Is your budget for event-related data and measurement-related activities increasing in 2019, staying the same, or decreasing?Consumer event management teams are a little more likely to have an increasing event data and measurement budget than companies in B-to-B markets.
Inside the Budget Increases
Survey Question:
Why is your budget for event-related data and measurement-related activities increasing? The table below provides interesting differences related to why budgets for event data and measurement are increasing at B-to-B and consumer-facing event marketing groups. Data and measurement is considered a top priority for 57% of B-to-B event marketers compared to 78% of consumer event groups’ companies. Consumer event marketing groups also feel, overall, that their event groups more often see data and measurement as a priority than B-to-B event groups.
B-to-B Events B-to-C Events
Data and measurement is a top priority for our company overall
57% 78%
Data and measurement is a top priority for our events group
48% 57%
Our previous investments worked, so we’re increasing our investment
43% 26%
For IT software or hardware investment 14% 9%
For consultants, agency, or data-services provider(s) services
5% 17%
Hiring data and measurement staff 5% 4%
Data and Measurement Is More Often a Top Corporate Priority for Consumer-Facing Brands than B-to-B CompaniesThe survey data finds that data and measurement is considered a top priority for 78% of consumer market-focused companies, according to the survey findings from event marketing executives and managers. This compares to 57% of B-to-B event marketers that agree data and measurement is a top priority across the corporation. These findings suggest B-to-B companies are behind in prioritizing data.
Key Insight: Increasing Staying the same
■ B-to-B Events ■ B-to-C Events
Decreasing Don’t budget for data and measurement
23%26%
53% 51%
14%10% 10%
13%

2019 FREEMAN® DATA BENCHMARK STUDY 25
Data Challenges and Pain Points
Survey Question:
What are the biggest challenges and pain points related to your event and experiential marketing data capture and management process? More B-to-B event marketers (58%) say analyzing their data effectively is a challenge, compared to consumer event marketers (46%).
B-to-B Events B-to-C Events
Analyzing the data effectively 58% 46%
Time/resources required to work with the data and information
46% 42%
Data quality, completeness 41% 41%
Cost/budget restraints 37% 45%
Availability of data/right data 37% 31%
Relevancy of event metrics/KPIs to overall marketing objectives
37% 35%
Determining what to measure 34% 36%
Tracking and compiling data capture information over time following the event
33% 28%
Comparability of event results to other marketing results
24% 25%
Data integration into our internal systems 22% 20%
Implementing findings 20% 27%
Privacy issues 19% 19%
Acceptance of results by management 11% 11%
A Higher Percentage of B-to-B Event Marketers Are Challenged to Effectively Analyze Their Data Compared to Consumer-Facing Event MarketersFifty-eight percent of B-to-B event marketers say analyzing their data effectively is a challenge. This compares to 46% of event marketers at consumer brands that agree analyzing their data is a challenge.
Key Insight:
26 2019 FREEMAN® DATA BENCHMARK STUDY
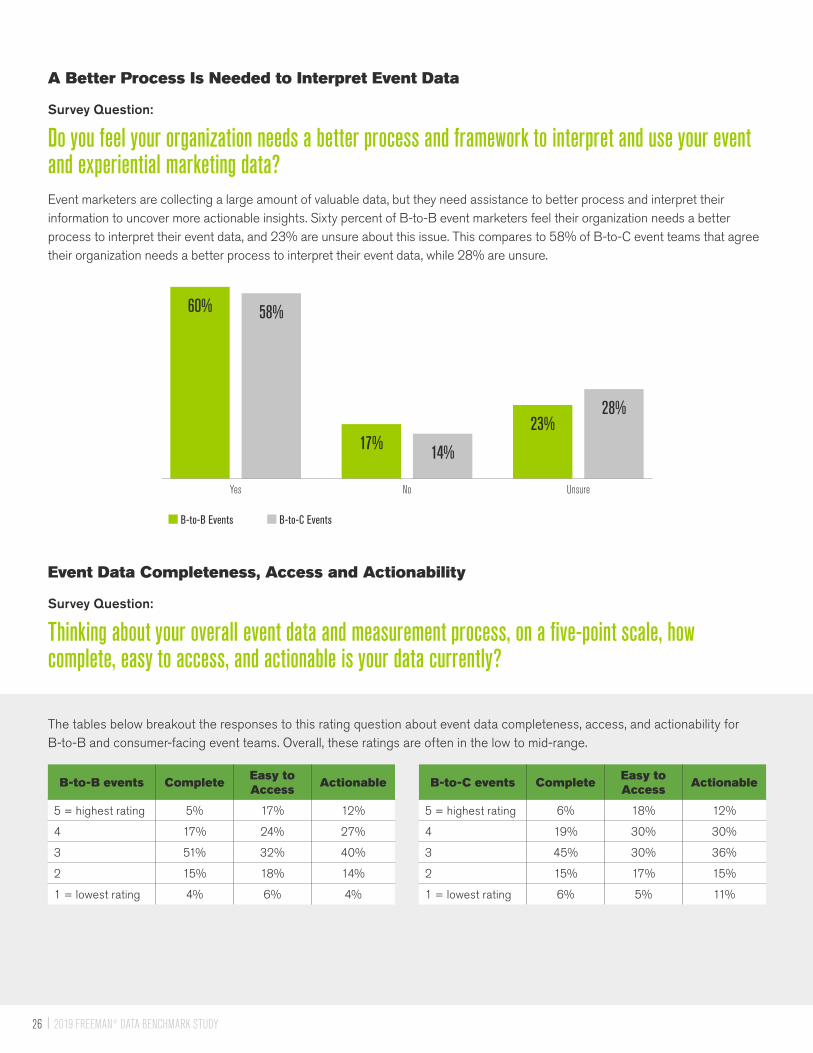
A Better Process Is Needed to Interpret Event Data
Survey Question:
Do you feel your organization needs a better process and framework to interpret and use your event and experiential marketing data?Event marketers are collecting a large amount of valuable data, but they need assistance to better process and interpret their information to uncover more actionable insights. Sixty percent of B-to-B event marketers feel their organization needs a better process to interpret their event data, and 23% are unsure about this issue. This compares to 58% of B-to-C event teams that agree their organization needs a better process to interpret their event data, while 28% are unsure.
Event Data Completeness, Access and Actionability
Survey Question:
Thinking about your overall event data and measurement process, on a five-point scale, how complete, easy to access, and actionable is your data currently?
The tables below breakout the responses to this rating question about event data completeness, access, and actionability for B-to-B and consumer-facing event teams. Overall, these ratings are often in the low to mid-range.
B-to-B events CompleteEasy to Access
Actionable B-to-C events CompleteEasy to Access
Actionable
5 = highest rating 5% 17% 12% 5 = highest rating 6% 18% 12%
4 17% 24% 27% 4 19% 30% 30%
3 51% 32% 40% 3 45% 30% 36%
2 15% 18% 14% 2 15% 17% 15%
1 = lowest rating 4% 6% 4% 1 = lowest rating 6% 5% 11%
Yes No
■ B-to-B Events ■ B-to-C Events
Unsure
60% 58%
17% 14%
23%28%

2019 FREEMAN® DATA BENCHMARK STUDY 27
Why Event Data Is Incomplete, Hard to Access, and Non-Actionable
Survey Question:
Which of the following are reasons why you do not have complete, easy to access, or actionable event data? The table below provides findings from both B-to-B and B-to-C event marketers that, in the previous question, gave low ratings on the level of completeness and accessibility of their data. The top challenge for both of these groups is they don’t have enough resources and time to analyze the data, although this is more of an issue for B-to-B event marketers.
B-to-B Events B-to-C Events
Don’t have enough resources/time to analyze the data
44% 36%
Low data quality, accuracy 31% 27%
Lack of benchmarks 29% 33%
Lack of appropriate organization of data 29% 27%
Lack of qualified staff or team to analyze data effectively
27% 22%
Lack of appropriate performance metrics 22% 27%
Team/business goals do not always align 22% 21%
IT issues, lack of right software 22% 17%
Team/business processes do not always align
22% 21%
Integration issues/data in silos 21% 22%
Too much reporting, not enough insight 17% 19%
Data platform issues 17% 10%
Everyone in team has different goals 14% 17%
Not Applicable 14% 15%
Have a suboptimal data culture 14% 11%
Use data for reporting rather than decision making
12% 15%
Lack of appropriate data visualization 10% 10%
Too much data 10% 7%
Measuring the wrong metrics 8% 7%
Other 0% 4%

2019 FREEMAN® DATA BENCHMARK STUDY28
Impact of Lack of Complete Data
Survey Question:
How does the lack of complete, easy to access, or actionable event data impact your company and/or event group? Nearly half of both B-to-B and B-to-C event marketers believe the lack of having complete, easy to access, or actionable event data limits the effectiveness of their events. B-to-B event groups are particularly concerned about how data issues may reduce the amount of insights they identify for decision making.
B-to-B Events B-to-C Events
Limits effectiveness of our events 47% 46%
Leaves important questions unanswered
38% 32%
Lost revenue potential 36% 27%
Limits effectiveness of our team 39% 33%
Reduces amount of information and insights for decision making
39% 26%
Loss of time 19% 17%
Not Applicable 14% 19%
Other 0% 1%
Event marketers collect more data from more areas than brand marketers, but they need assistance and better frameworks to more effectively analyze and generate insights. A key question for CMOs and senior marketing leaders is:
How can event and brand marketers work together to combine their respective data collection and analytical expertise to be more effective to enhance marketing effectiveness — and add more value to the business?
2019 FREEMAN® DATA BENCHMARK STUDY 29
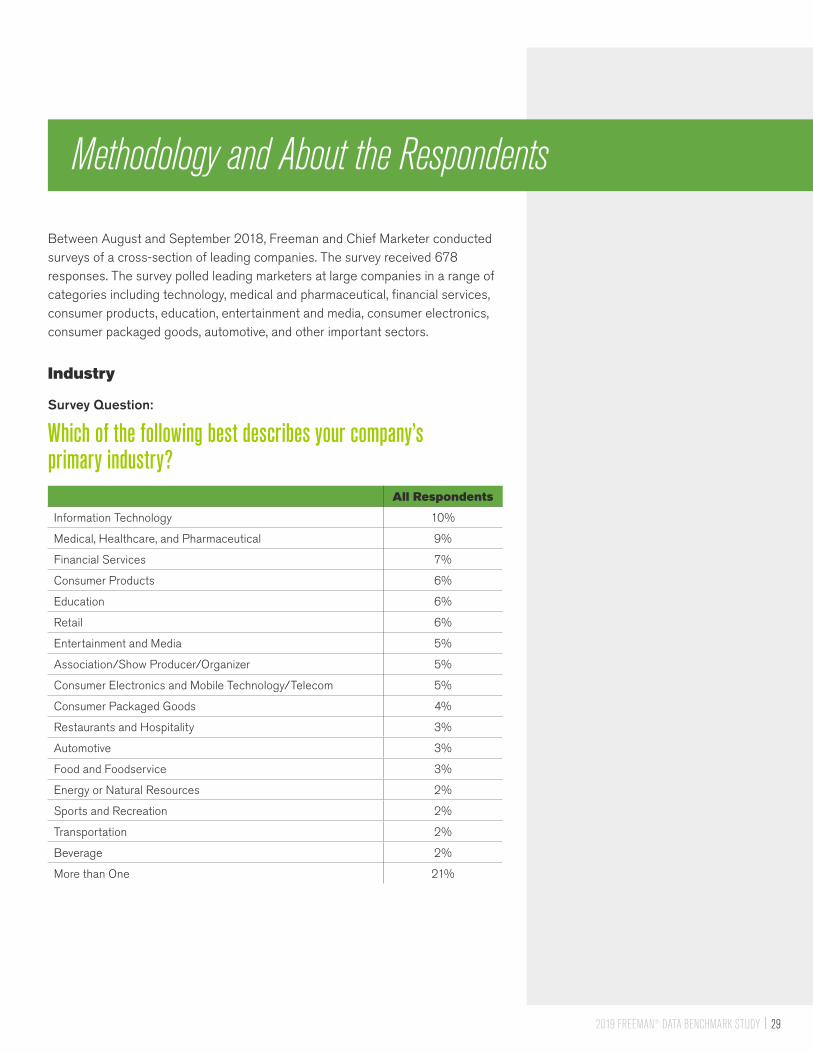
Between August and September 2018, Freeman and Chief Marketer conducted surveys of a cross-section of leading companies. The survey received 678 responses. The survey polled leading marketers at large companies in a range of categories including technology, medical and pharmaceutical, financial services, consumer products, education, entertainment and media, consumer electronics, consumer packaged goods, automotive, and other important sectors.
Industry
Survey Question:
Which of the following best describes your company’s primary industry?
All Respondents
Information Technology 10%
Medical, Healthcare, and Pharmaceutical 9%
Financial Services 7%
Consumer Products 6%
Education 6%
Retail 6%
Entertainment and Media 5%
Association/Show Producer/Organizer 5%
Consumer Electronics and Mobile Technology/Telecom 5%
Consumer Packaged Goods 4%
Restaurants and Hospitality 3%
Automotive 3%
Food and Foodservice 3%
Energy or Natural Resources 2%
Sports and Recreation 2%
Transportation 2%
Beverage 2%
More than One 21%
Methodology and About the Respondents
2019 FREEMAN® DATA BENCHMARK STUDY30
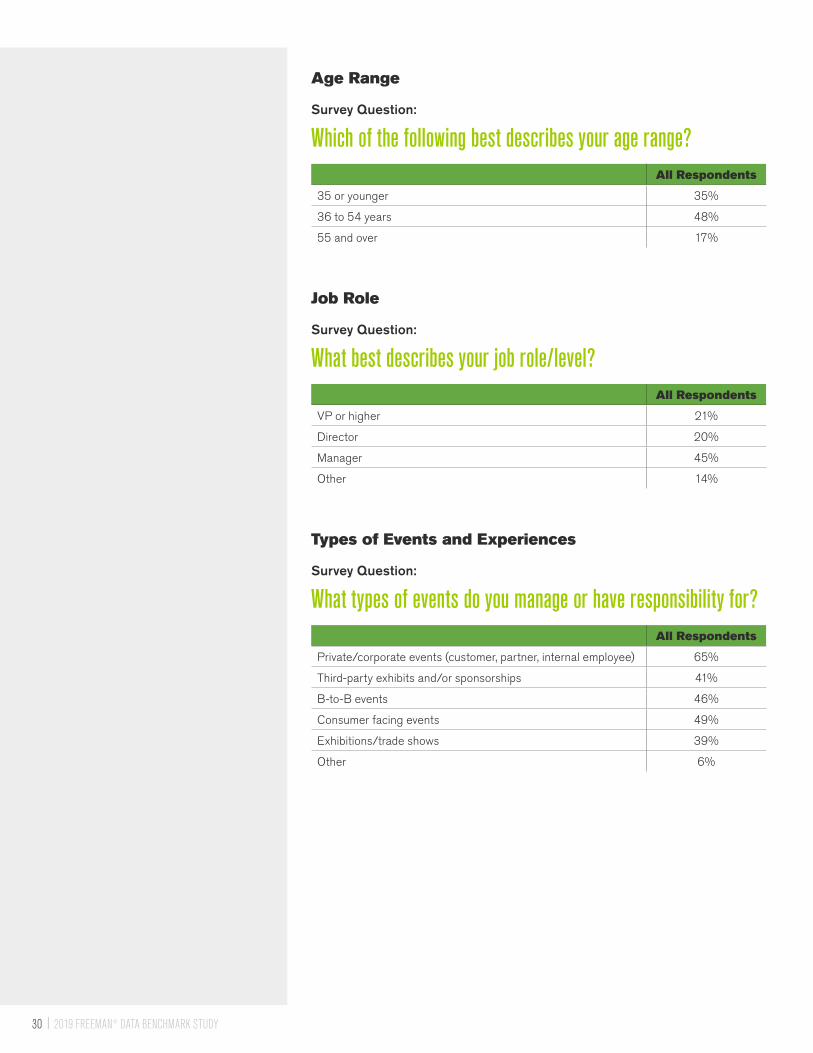
Age Range
Survey Question:
Which of the following best describes your age range?All Respondents
35 or younger 35%
36 to 54 years 48%
55 and over 17%
Job Role
Survey Question:
What best describes your job role/level? All Respondents
VP or higher 21%
Director 20%
Manager 45%
Other 14%
Types of Events and Experiences
Survey Question:
What types of events do you manage or have responsibility for? All Respondents
Private/corporate events (customer, partner, internal employee) 65%
Third-party exhibits and/or sponsorships 41%
B-to-B events 46%
Consumer facing events 49%
Exhibitions/trade shows 39%
Other 6%
312019 FREEMAN® DATA BENCHMARK STUDY
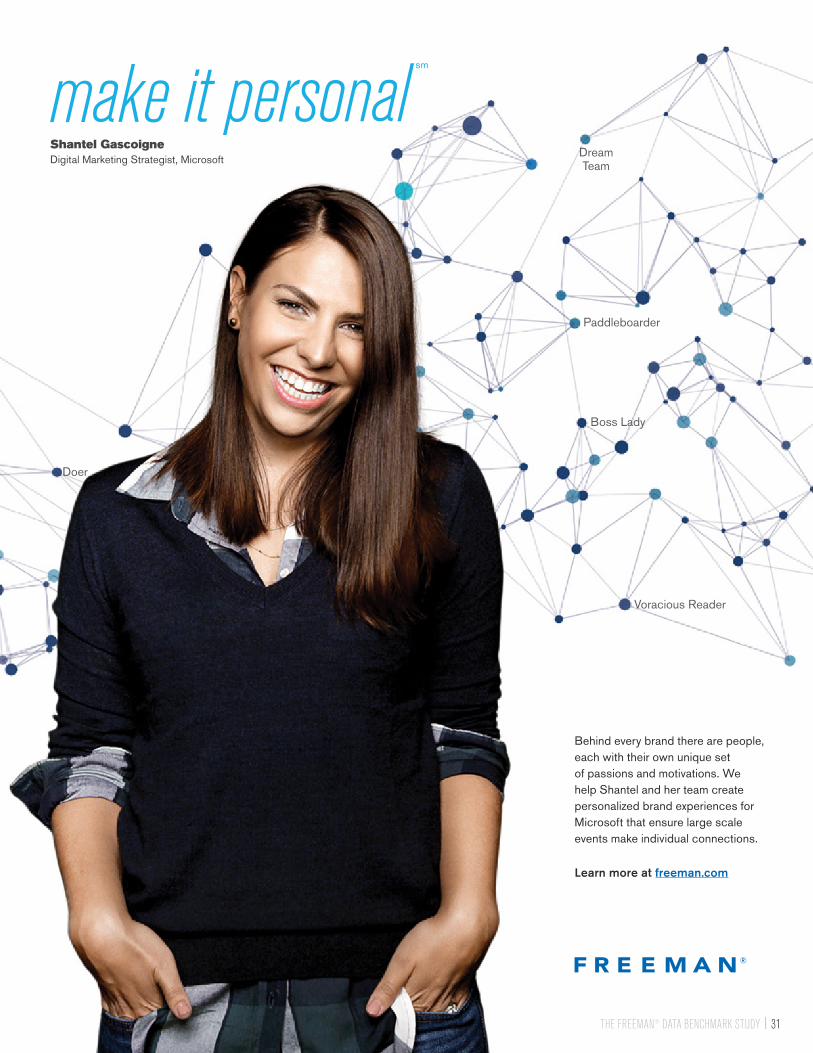
Shantel Gascoigne Digital Marketing Strategist, Microsoft
Behind every brand there are people, each with their own unique set of passions and motivations. We help Shantel and her team create
personalized brand experiences for Microsoft that ensure large scale events make individual connections. Learn more at freeman.com
DreamTeam
Doer
Voracious Reader
Boss Lady
Paddleboarder
THE FREEMAN® DATA BENCHMARK STUDY 31
Behind every brand there are people, each with their own unique set of passions and motivations. We help Shantel and her team create personalized brand experiences for Microsoft that ensure large scale events make individual connections.
Learn more at freeman.com
About Freeman
Freeman® is the world’s leading brand experience company that helps clients design and deliver immersive live experiences for their most important audiences. Through comprehensive offerings including strategy, creative, logistics, digital, and event technology, Freeman helps increase audience engagement and drive business results.
To find out more, contact [email protected], or visit www.freeman.com.
© 2018 Freeman and Chief Marketer / Access Intelligence, LLC. All Rights Reserved. No part of this publication can be copied or disseminated without the permission of Freeman and Chief Marketer / Access Intelligence, LLC.