the formation of surficial geochemical patterns over ... · pdf filechemical components...
TRANSCRIPT
Exploration
Geochemistry
GOT
Author Index
Section Contents
Explor97 Master Page
Explor97 Contents
O Next PaperPrevious PaperPaper 38
The Formation of Surficial Geochemical Patterns Over
Buried Epithermal Gold Deposits in Desert Environments:
Results of a Test of Partial Extraction Techniques
Smee, B.W.[1]
1. Smee & Associates Consulting Ltd., Sooke, British Columbia, Canada
ABSTRACT
A challenge for the geochemist is to develop and test transport theories and near surface sampling techniques for use in areasoverlain by cover of exotic origin, i.e., where the surficial cover is not in any way related to the underlying bedrock.
Selective extraction methods that dissolve certain minerals or attack specific binding sites in soil suppose that some form ofupward migration of ions must be taking place. Chemical components related to mineralization must travel from the bed-rock-overburden interface to the surface, where they are immobilized, or change the surface chemistry in some detectablefashion. Upward migration is likely caused by a combination of diffusion down a concentration gradient, capillary actionor “wicking” from the water table to the dry surface, osmotic action carrying ionic species, vegetation roots carryingelements to the surface portions of the plant, then back to the soil, or electrical fields transporting ions through the soil bycation exchange.
A geochemical orientation survey over two buried epithermal gold deposits at Marigold, Nevada was completed during1994–95 in an attempt to determine the effectiveness of various analytical extractions, and develop a theory to explainobserved geochemical responses. The 5 North deposit is covered by 25–40 m of alluvial fill, and the 8 North deposit is cov-ered by about 100 m of fill. Soil gas, CHIM, vegetation, lag, caliche, and soil samples were included in the survey. The soilsamples were subjected to a variety of chemical attacks and analyses. This report will present some of the results from thesoil samples and propose a theory for the formation of surface geochemical responses.
The pH of the soil in the Marigold area was extremely alkaline, but still produced nearly a 100-fold difference in hydrogenion concentration over the deposits. The alkaline condition suggests that iron and manganese should be stable, but that cal-cium may move in response to a shift in soil pH conditions. Aqua regia soluble calcium, hydroxylamine hydrochloride solublecalcium and strontium, sodium acetate soluble calcium and strontium and enzyme leach soluble strontium produced cleardouble-peak responses to mineralization regardless of overburden thickness. In fact, the type of analytical attack used didnot really affect results. Low detection limit gold in soil was significantly correlated with calcium and strontium.
The proposed geochemical model suggests that the release of H+ during the oxidation of buried sulphide mineralizationmay migrate directly to the surface, or may react with surrounding carbonate, thus producing CO
2 which migrates to the
surface. In either case, a disequilibrium in pH sensitive compounds or elements such as CaCO3, MgCO
3, Fe and Mn will
occur at the soil surface in places of accumulation of H+ or CO2. This disequilibrium will correct itself over time by the
migration of these compounds or elements away from the stimuli toward the ambient pH condition. A precipitation of thesepH sensitive components will occur at the positions where chemical stability is re-established—at the margin of thestimuli—thus producing double-peak patterns over the margins of the underlying mineralization. Co-precipitation ofambient ions in the soil will produce element patterns that may appear to have moved through the overburden column, buthave not. Calcium and magnesium may be the controlling ions in alkaline soils such as are found in desert environments,whereas iron and manganese may control anomaly patterns in acid to neutral soil conditions found in temperate climates.
The use of calcium in closely spaced soil samples in alkaline environments and selected element ratios, together with lowdetection limit gold, arsenic and antimony, is recommended as an exploration method for buried or blind mineral deposits.
In “Proceedings of Exploration 97: Fourth Decennial International Conference on Mineral Exploration” edited by A.G. Gubins, 1997, p. 301–314

302 Exploration Geochemistry
INTRODUCTION
Mineral exploration is extending into geologically prospective areaswhich are overlain by surficial cover. Geochemical methods have beendeveloped for use where this cover has been locally dislocated from itssource, such as down-ice dispersion in areas of glacial till veneer. A farmore challenging problem for the geochemist is to develop and testtransport theories and near surface sampling techniques for use in areasoverlain by cover of exotic origin, i.e., where the surficial cover is not inany way related to the underlying bedrock.
The past ten year period has seen the introduction of severalgeochemical techniques that may detect mineralization through exoticcover. The U.S. Geological Survey (USGS) and others have developedinstrumentation to detect hydrocarbon, sulphur gases, CO
2 and O
2 in
soil which could be related to underlying mineralization (McCarthyet al., 1986; Lovell et al., 1983). These soil gas methods have been usedwith success by the oil exploration industry for some time, but the rela-tionship of soil gas components to sulphide or precious metal depositshas not been widely accepted by mineral explorationists.
The use of chemical reagents or procedures that selectively dissolvecertain minerals or attack specific ion binding sites in soil has been usedfor more than 20 years to enhance the geochemical response from min-eralization (Bradshaw et al., 1974; Chao, 1984). These techniques invari-ably attempt to separate ionic transportation components from the totalgeochemical noise. Recent applications of this simple concept include aphysical collection of the ionic component with an electric field (CHIM)(Shmukin, 1985; Leinz and Hoover, 1993), the use of chemical extrac-tions for various soil absorption sites (enzyme leach for MnO, hydroxy-lamine hydrochloride for FexOy, acetic acid for carbonates) (Clark,1992; Hall et al., 1996; Smee, 1983) and the use of vegetation as an overallnatural ion collector (Brooks et al., 1995).
All of these selective extraction methods suppose that some form ofupward migration of ions must be taking place. Chemical componentsrelated to mineralization must travel from the bedrock-overburdeninterface to the surface, where they are immobilized or change the sur-face chemistry in some detectable fashion. Upward migration has beensuggested to be caused by diffusion down a concentration gradient(Smee, 1983), capillary action or wicking from the water table to the drysurface, osmotic action carrying ionic species (Gray and Lintern, 1994),vegetation roots carrying elements to the surface portions of the plant,then back to the soil, or electrical fields transporting ions through thesoil by cation exchange (Govett, 1972; Bolviken and Logn, 1975). Mostlikely, a combination of mechanisms occur, depending upon overbur-den type and depth, and upon the style of mineralization.
The search for the magic bullet to solve all exploration problems mustbe based on some solid theoretical and observational foundations. Todate, no study has been published which addresses these geochemicalmethods or theories in a comprehensive fashion under controlled condi-tions. There are no data that compare methods directly and that recom-mend field and laboratory techniques. Finally, there are no studies thatshow data to support a particular form of transport through the overbur-den. This is especially surprising considering the amount of explorationfunds that have been allotted to methods such as CHIM or the advertisedselective extraction techniques. The use of these unsubstantiated meth-ods by otherwise conservative companies and explorationists confirmsthe increasing pressure to find new deposits in difficult environments. Italso highlights the sparsity of basic applied geochemical research in uni-versities and governments, particularly in North America.
An orientation program over two buried Au deposits in Nevada, wasundertaken by the author in 1994 to begin to evaluate various geochem-ical sampling and analytical techniques under controlled and compara-tive conditions. The orientation survey consisted of soil, vegetation andsoil gas sampling as well as self potential (SP) geophysical and a CHIMsurvey. The soil samples comprised mineral horizon, pedogenic carbon-ate, and lag, which were analyzed using various extractions. The CHIM,SP and soil gas surveys were undertaken by members of the USGS. Thisresearch was funded by a number of mineral exploration companieswhich had a 12-month proprietary use of the resulting information.
This report presents some of the data concerning the mineral soilsampling and analytical extractions. Space restrictions here permit onlya summary of the observed results. A more complete reporting will bepublished in the near future, however a working hypothesis is givenwhich attempts to explain the observed patterns.
SELECTION OF THE STUDY AREA
Many of the world’s active Au exploration areas occur in arid to semi-arid environments. One of the most prolific Au producing areas is theBasin and Range geological province in the western United States, andNevada in particular, which contains volcanic- and sediment-hostedepithermal Au bodies of multimillion ounce size. Most of the depositsfound to date in Nevada have had some surficial indication of eitherhydrothermal alteration or Au mineralization directly. However, as theranges become thoroughly explored, the focus is shifting toward thealluvial-filled basins. A similar situation exists in Australia and the Mid-dle East. Some type of reliable geochemical tool is needed to augmentgeological extrapolation and geophysical techniques in these coveredareas. The search for an orientation target was therefore restricted to thealluvial-filled basins of Nevada.
Ideally, an orientation area for this study had to possess most of thefollowing characteristics: the geology must be reasonably well known; themineralogy of the buried mineralization must include sulphides, Au of anearly economic grade and Au-pathfinder elements such as As, Sb, Hgand Ba; the deposit must be at least partially oxidized; the pediment covermust comprise alluvial, fluvial or lacustrine material unrelated to the sur-rounding rocks; the depth of overburden must be between 15–120 m soas to form a valid but not impossible test; the present-day surface is undis-turbed, or disturbance must be avoidable; the three-dimensional extentof the mineralization must be outlined by drilling.
The two buried deposits near the Marigold Mine, operated by theMarigold Mining Company in northern Nevada were eventuallyselected as the targets for this study.
MARIGOLD MINE AREA, GEOLOGICAL DESCRIPTION
The Marigold Mine area is located in Nevada, 20 km southeast of thetown of Battle Mountain and 8 km south of the I-80 Valmy exit(Figure 1). The 8 North and 5 North deposits lie beneath alluvial covernorth and west of the Marigold 8 South pit. These mineralized zones donot outcrop, and are defined entirely by drilling.
The geological description of the Marigold area is given in detail byGraney and McGibbon (1991) from which this summary is taken. Goldhas been produced from the old Marigold Mine since the 1930s. A drillprogram was started by Cordex Exploration in 1986 on nearby mineral-ization, which led to the discovery of the 8 South, 8 North and 5 Northmineral zones.

Smee, B.W. GEOCHEMICAL PATTERNS OVER EPITHERMAL GOLD DEPOSITS 303
The Marigold deposits, which roughly line up in a north-southdirection, are hosted by clastic rocks of the Valmy and Antler sequences(Figure 2). The Antler sequence, host to the 8 North and 5 North depos-its, is composed of coarse conglomerates and sandstone which gradeupward into limy mudstone, shales, siltstone and sandstones. Mineral-ization is controlled by north-south–trending basin and range faultingand northwest-striking zones of fracturing.
The 8 North mineralization extends to 300 m in a north-south direc-tion and 170 m east-west. Gold occurs with abundant barite and isanomalous in As, Sb and Hg. The host clastic rocks are calcite-rich, withonly minor silicification noticed in the drill cuttings. Overburden con-sisting of alluvial and fluvial outwash, and interlayered lacustrine clay,covers the 8 North deposit to a depth of 100 m.
The 5 North zone is covered by between 20 m and 50 m of alluviumand is hosted by debris flows and siltstones, with minor limestoneencountered in a few drill holes. The geochemical signature of 5 Northincludes As, Sb and Hg with the Au, but baritization is minor. Iron-oxidestaining is pronounced in the mineralized drill cuttings.
The deposits have been drilled off at 30 m centres. Surficial distur-bance is minimal on the 5 North deposit, but consists of rutted tiretracks and drill fluid run off over portions of the 8 North deposit. Samplelines were positioned to avoid this disturbance. Both deposits are oxi-dized where drilled.
SOIL SAMPLING METHOD
The drill plan and drill sections for the 5 North and 8 North depositswere examined in detail. Sample lines were chosen so as to overlie drillsections which showed subcropping mineralization of significant grade,and minimal surface disturbance. Two sample lines were positioned overeach deposit: lines 1 and 2 over 5 North, and lines 3 and 4 over 8 North.All sample spacings and distance measurements are in Imperial units,matching the mine grid and geological maps. The overburden is between50–110 feet thick over the mineralization on line 1 and 100 feet on line 2.Line 3 is positioned near the north end of the 8 North deposit, where themineralization subcrops beneath about 300 feet of overburden. Line 4was also positioned over subcropping mineralization with 280–300 feetof cover. All lines over mineralization are 1900 feet in length.
Sample lines were centred over the surface projection of the miner-alization with 11 sample stations spaced at 50-foot centres over miner-alization, 100-foot centres for 300 feet on either side of the 50-footcentres, and then 200-foot centres for an additional 400 feet on eachside, producing a total of 21 stations per line. The lines were tied intodrill hole locations, then tight chained between stations. A 1-inch ×2-inch picket with sample location marked in pencil and a scribed alu-minum tag was placed at each station. Hopefully these lines will besemi-permanent and will form a long-term test site for new geochemicalor geophysical techniques.
A pit was dug to a depth of approximately 60 cm at each sample site.A boulder layer was usually found below 50 cm, which prevented furtherhand-sampling. A distinct colour and texture change was noticed atabout 40 cm depth at most sites which usually coincided with a positivereaction to 10% HCl. This layer was undoubtedly the top of a pedogeniccarbonate and was the selected sample medium. A Hubco sand bag wasfilled with about 3 kg of material and allowed to air dry.
QUALITY CONTROL AND ANALYTICAL METHODS
A quality control program designed to estimate sampling and analyticalerrors and determine possible biases or shifts in background duringanalysis was implemented at the start of the sampling program. Twelvesites were selected at random at which duplicate samples were taken inthe field. These duplicates, together with the regular samples, generateda total of 96 samples for the survey. Prior to field work, the samples werenumbered sequentially from 1 to 96, then randomized and placed withthe line and station. Once a sample was taken, the true position of thesample could not be determined without the sampling key.
Samples were sorted in numerical order before being prepared andsent for analysis. The laboratories analyzed the samples in numericalorder. Upon receiving the analytical results, the data were first plotted innumerical order to determine baseline shifts, analytical batch errors, orbiases in analysis. Duplicates were then removed from the analytical
Figure 1: Location map, Marigold Au deposits.
Figure 2: Marigold Mine area, property geology and Au deposits (fromGraney and McGibbon, 1991).
304 Exploration Geochemistry
stream, and bias and precision plots made using the method ofThompson and Howarth (1978). Finally, the data was sorted into lineand station sequence prior to plotting profiles.
Analysis of the mineral soils was performed at a number of commer-cial laboratories, each selected for their expertise or equipment. All min-eral soils were hand-screened to –80 mesh and split into the necessarynumber of bags using a riffle splitter. The excess sample pulp was placedinto storage so that new analytical techniques proposed in the years tocome can be tested under the same controlled conditions.
The analysis of water-soluble anions in “B” soils followed the methoddeveloped by the USGS (R. Leinz, pers. comm., 1995) using a DionexAnion Chromatograph. This analysis included F-, Cl-, NO
3
2-, SO4
2-, Br-
and PO4
3-. Chemex Laboratories of Vancouver donated the analysis tothis study. Bondar Clegg Laboratories of Vancouver analyzed the min-eral soils for pH and conductivity using a high solids pH probe and con-ductivity cell. One gram of soil was slurried with 5 ml of distilled,deionized water for a constant time. Separate samples were used for pHand conductivity. Bondar Clegg donated these analyses. The enzymeleach analytical technique was provided by ACTLABS of Ancaster,Ontario at half the normal cost. Part of this orientation was to ascertainthe effectiveness and specificity of the enzyme leach technique, andtherefore the elements Fe and B were added to the normal element read-out produced by ACTLABS. Iron, which is not normally reported byACTLABS because of an apparent inter-element interference, was nec-essary to determine if the enzyme leach was indeed specific to amor-phous Mn. Boron was added to ascertain if the borosilicate test tubesused in the analysis were exchanging cations with the solution or if theborate anion was mobile under the arid conditions found in Nevada.XRAL Laboratories of Toronto was responsible for providing As and Sbusing hydride generation; Au analysis, with 1 ppb detection limit; plusthe aqua regia (AR) soluble elements, the acetic acid (HOAc) carbonatespecific selective extraction elements and the Fe/Mn specific hydroxy-lamine hydrochloride (HYDHCl) extraction, following the methods ofHall et al. (1996). XRAL donated $5,000 toward the cost of these analy-ses. Unfortunately, few elements were analyzed by XRAL using the ICP-MS analyzer because of inter-element interferences created by a highdissolved solids content in many of the leach solutions. Consequently,many elements do not have sufficiently low detection limits to be useful.This shortcoming will hopefully be resolved in the near future.
1. E= Enzyme Leach; D = Dionex Anions; COND = Soil Conductivity
RESULTS
A geochemical exploration technique must be cost-effective and simpleto use, produce reproducible results and form predictable and interpret-able patterns. The first step in determining the validity of a geochemicalmethod is to measure the precision of the sampling and analyticalsystem, and the validity of the analysis. Should the precision be poor,i.e., the patterns not be reproducible, the technique is of little use to theexplorationist.
Each element of each technique was initially examined using theQuality Control (QC) data. If the data were free of analytical baselineshifts and bias and the precision shown by the blind field duplicates wasacceptable, the element was included in the interpretation.
Water extractable and enzyme leach anions
The use of ion chromatography for anions in soil as an explorationmethod is in its infancy, even though the method has been available fornearly 20 years (Smee et al., 1978). Consequently, the technique is stillbeing developed and is not as precise as it could be. The Dionex tech-nique reported water-soluble F-, Cl-, NO
3
-2, SO4
-2, Br- and P2O
5
-3.A correlation calculation incorporating soil conductivity and both
analytical techniques is shown in Table 1. The only directly comparableelement, Cl-, is almost perfectly correlated between the two methods;however, the enzyme leach Cl- and Br- are also highly correlated withDionex SO
4
-2. This suggests that samples may be exhibiting an accumu-lation of all anions in general, rather than one specific element or com-pound. This is confirmed by the high correlation between soilconductivity and most of the anions. It would appear that a simple soilconductivity measurement is all that is required to track soil anions,regardless of the analytical method used. This conductivity measure-ment could easily be adapted to a field technique.
For the sake of brevity, no profiles will be shown here, for there wasno single anion, by either of the analytical methods, that showed a con-sistent or interpretable response over mineralization.
Soil pH and conductivity
The measurement of pH is perhaps the most important variable ageochemist can use when attempting to understand the processes thatcontrol the distribution of other cations in soil. H+ is extremely reactiveand can mobilize other cations, such as Fe, Mn, Ca and Mg, which aresensitive to changes in pH. It is known that both the 5 North and 8 Northbodies are oxidized, and would have released H+ to the surroundingenvironment during the breakdown of sulphides. H+ diffuses throughcover up to 10,000 times faster than many other cations (Farr et al., 1970).It is therefore prudent to measure H+ concentration in each sample.
The measurement of soil conductivity gives an indirect indication ofthe concentration of soluble anions and cations. A spatial relationshipbetween H+ and conductivity may occur where ions have been mobi-lized and reprecipitated in response to a change in pH (Govett andChork, 1977; Smee, 1983).
The pH range in the B horizon soils was 7.7 to 9.6, almost a 100-folddifference in H+ concentration. This large spread is surprising in that thesurface soils appear to be highly alkaline and should be well buffered.The only explanation for this wide range of H+ concentration on a
Table 1: Anion correlation table [1]
COND ECL EBR EI DCL DNO3 DSO4
ECL 0.67
EBR 0.75 0.82
EI 0.41 0.35 0.53
DCL 0.60 0.95 0.76 0.31
DNO3 0.36 0.39 0.44 0.38 0.43
DSO4 0.75 0.71 0.81 0.52 0.70 0.50
DP2O5 0.41 0.13 0.26 0.23 0.12 0.37 0.40

Smee, B.W. GEOCHEMICAL PATTERNS OVER EPITHERMAL GOLD DEPOSITS 305
1. 1=Aqua Regia; 2=Sodium Acetate/Acetic Acid; 3= Hydroxylamine Hydrochloride
featureless gravel-covered pediment is an introduction of hydrogenfrom the substrate below the soil horizon. Although the H+ concentra-tion range is large, no clear interpretable pattern exists on all lines. Sim-ilarly, the soil conductivity is not a helpful tool by itself, although clearresponses above mineralization occur on line 3. These profiles are notshown here because of this lack of a predictable and interpretable pat-tern on each line.
Aqua regia, acetic acid/sodium acetate, and hydroxylamine hydrochloride extractions
XRAL of Toronto undertook the analysis of mineral soils for Au andits pathfinder elements, and three selective leaches using a combinationof AAS, ICP and ICP-MS instruments. The leaches were aqua regia (AR),acetic acid/sodium acetate (NaOAc) for carbonate-bound elements and
hydroxylamine hydrochloride (HYDHCl) for Fe and Mn-boundelements (Hall, 1996; Hall, pers. comm., 1995). These are listed as attack1, 2 and 3, respectively, on the statistical printouts. Space does not permitinclusion of all analytical results; however, these can be provided tointerested parties by contacting the author.
Correlation coefficients between elements that had sufficient analyt-ical detection limits for the majority of sample sites were calculated andare shown in Table 2. Gold is significantly correlated with As, Sb, Hg andBa, which seems to indicate that the mineralizing elements are respond-ing together in the mineral soils. Gold is also significantly correlated withCa and Sr in all extractions, as is AR Ba. These correlations are strongevidence that Ca is playing a controlling role in the distribution of theseelements in the near surface environment. A negative correlation existsbetween all types of extractions of Ca, and specifically the HYDHCl Rb.The HYDHCl Rb is, in turn, positively correlated with HYDHCl Fe. Anargument can therefore be made that a selective extraction for Fe and Mn
Table 2: AR, HOAC, and HYDHCL Leach correlations[1]
AU AS SB H+ COND CA1 CA2 CA3 FE1 FE3 MN1 MN3 SR1 SR2 SR3 RB1 RB2 RB3 BA1 BA2
AS 0.61
SB 0.62 0.63
H+ 0.03 0.04 0.00
COND 0.13 0.29 0.26 -0.47
CA1 0.55 0.32 0.43 -0.15 0.37
CA2 0.54 0.32 0.44 -0.16 0.38 1.00
CA3 0.56 0.33 0.44 -0.15 0.36 1.00 1.00
FE1 0.43 0.37 0.64 0.14 0.00 0.25 0.26 0.25
FE3 0.18 0.25 0.25 0.23 -0.25 -0.37 -0.38 -0.36 0.35
MN1 0.05 0.09 0.04 0.23 -0.21 -0.05 -0.09 -0.05 0.05 0.36
MN3 0.05 0.14 0.03 0.19 -0.16 -0.07 -0.10 -0.06 -0.08 0.37 0.97
SR1 0.57 0.30 0.45 -0.12 0.35 0.94 0.95 0.94 0.38 -0.28 -0.15 -0.19
SR2 0.52 0.32 0.46 -0.15 0.41 0.95 0.96 0.95 0.36 -0.32 -0.18 -0.21 0.98
SR3 0.56 0.34 0.46 -0.13 0.37 0.95 0.96 0.95 0.37 -0.28 -0.15 -0.17 0.99 0.99
RB1 -0.13 -0.21 0.06 0.08 -0.17 -0.13 -0.12 -0.14 0.35 0.10 -0.24 -0.34 0.00 -0.02 -0.02
RB2 -0.03 -0.17 -0.09 0.15 -0.28 -0.02 -0.02 -0.03 0.12 -0.20 0.03 -0.03 -0.02 -0.02 -0.02 0.14
RB3 -0.33 -0.26 -0.23 0.16 -0.50 -0.59 -0.59 -0.58 0.04 0.50 0.34 0.30 -0.59 -0.62 -0.59 0.20 0.12
BA1 0.66 0.72 0.58 0.02 0.27 0.51 0.51 0.52 0.38 0.23 0.22 0.25 0.52 0.53 0.55 -0.18 -0.17 -0.31
BA2 0.52 0.64 0.51 -0.05 0.34 0.46 0.47 0.47 0.38 0.14 0.11 0.14 0.48 0.52 0.52 -0.16 -0.15 -0.36 0.95
BA3 0.59 0.68 0.52 0.00 0.26 0.45 0.45 0.47 0.35 0.24 0.25 0.29 0.46 0.48 0.50 -0.21 -0.15 -0.28 0.98 0.97
306 Exploration Geochemistry
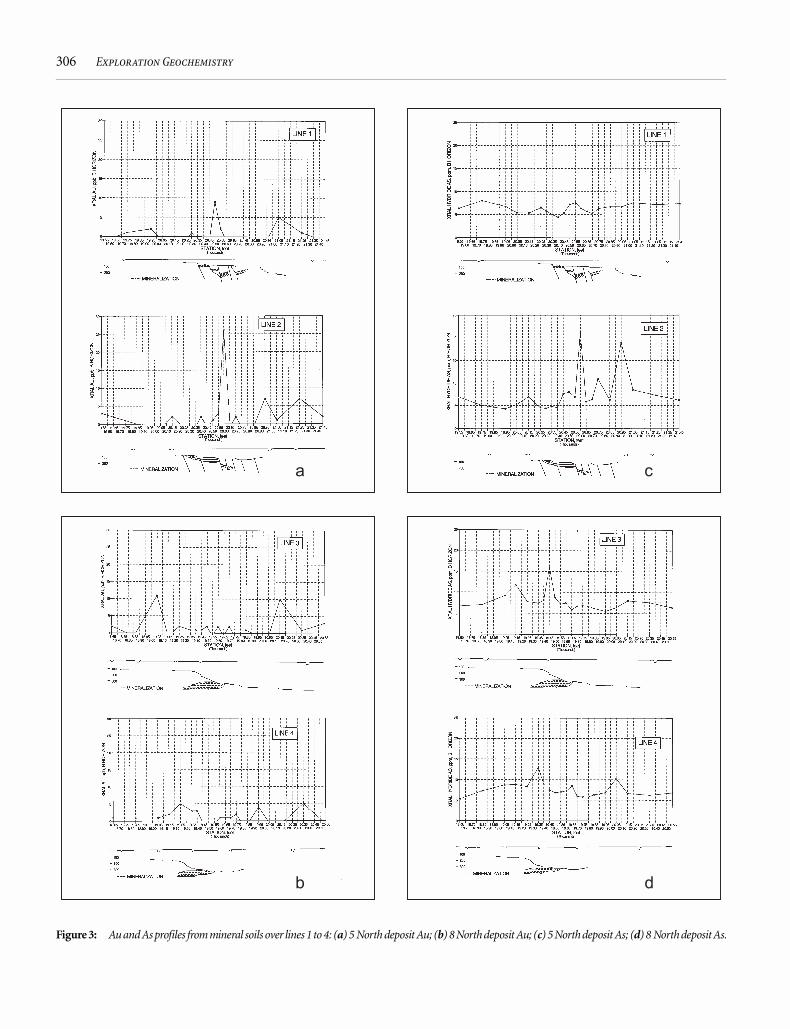
Figure 3: Au and As profiles from mineral soils over lines 1 to 4: (a) 5 North deposit Au; (b) 8 North deposit Au; (c) 5 North deposit As; (d) 8 North deposit As.

Smee, B.W. GEOCHEMICAL PATTERNS OVER EPITHERMAL GOLD DEPOSITS 307
Figure 4: Aqua regia (AR) soluble Ca and Sr from mineral soils over lines 1 to 4: (a) 5 North deposit Ca; (b) 8 North deposit Ca; (c) 5 North deposit Sr;(d) 8 North deposit Sr.
308 Exploration Geochemistry
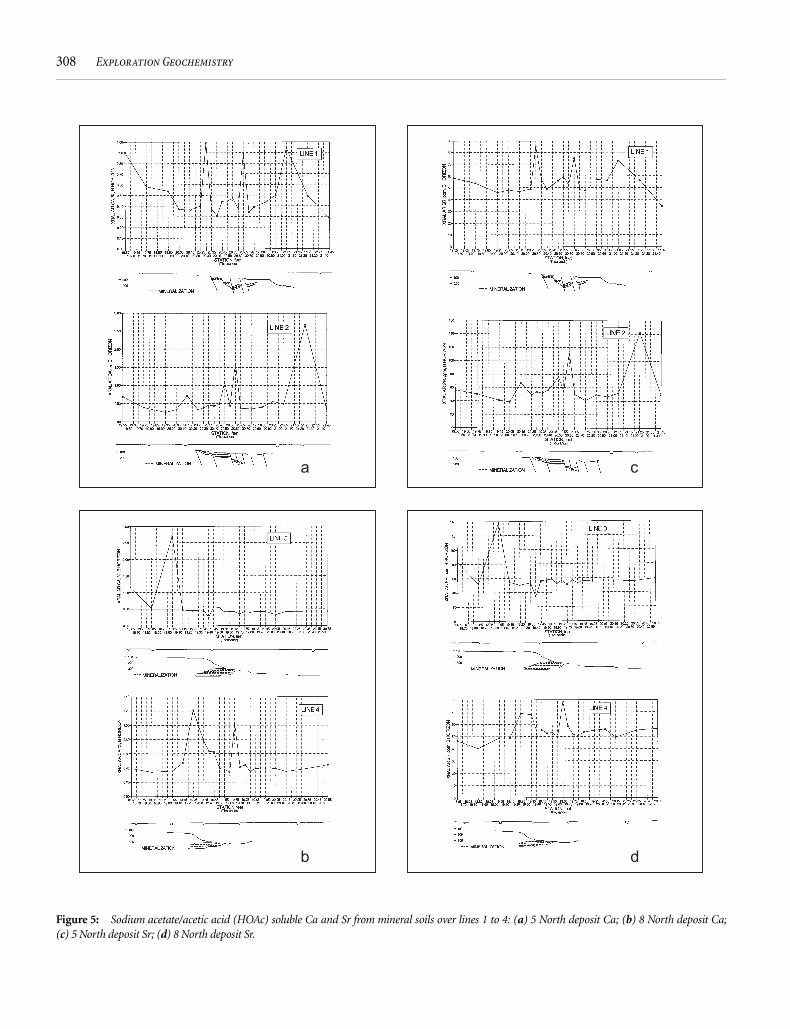
Figure 5: Sodium acetate/acetic acid (HOAc) soluble Ca and Sr from mineral soils over lines 1 to 4: (a) 5 North deposit Ca; (b) 8 North deposit Ca;(c) 5 North deposit Sr; (d) 8 North deposit Sr.
Smee, B.W. GEOCHEMICAL PATTERNS OVER EPITHERMAL GOLD DEPOSITS 309
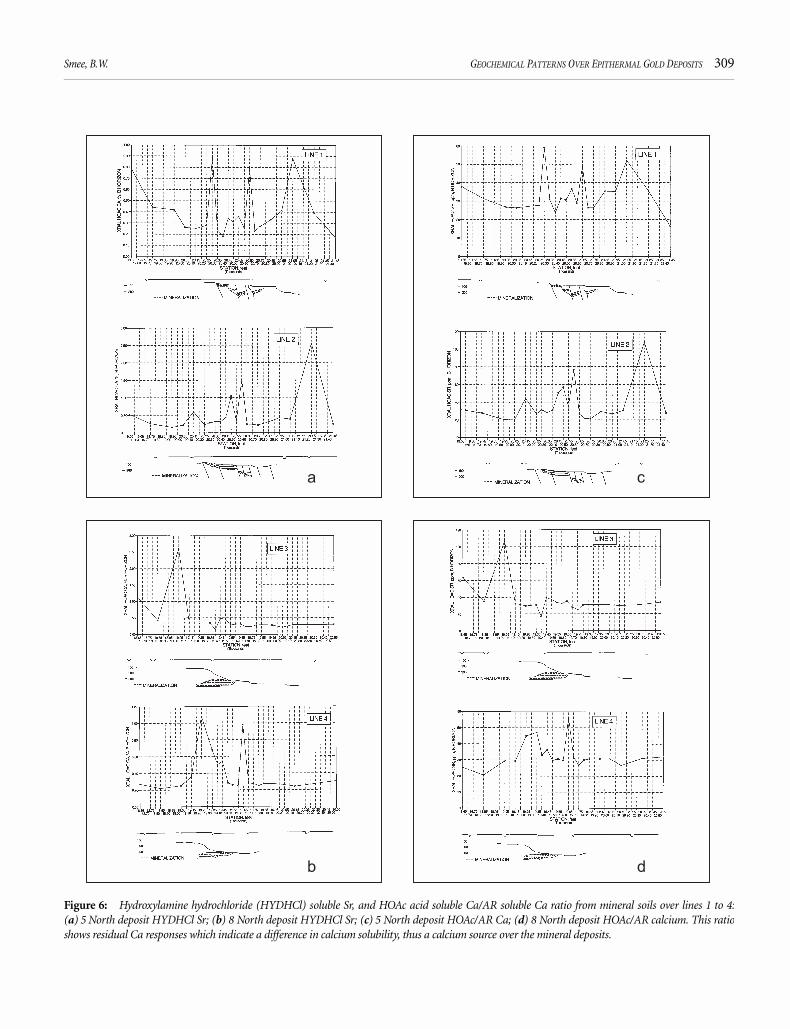
Figure 6: Hydroxylamine hydrochloride (HYDHCl) soluble Sr, and HOAc acid soluble Ca/AR soluble Ca ratio from mineral soils over lines 1 to 4:(a) 5 North deposit HYDHCl Sr; (b) 8 North deposit HYDHCl Sr; (c) 5 North deposit HOAc/AR Ca; (d) 8 North deposit HOAc/AR calcium. This ratioshows residual Ca responses which indicate a difference in calcium solubility, thus a calcium source over the mineral deposits.
310 Exploration Geochemistry
in arid or alkaline environments could actually suppress responses fromAu mineralization, and selectively eliminate the anomalous areas.
Gold and As over the 5 North deposit (Figures 3a and c) show weakpositive responses over mineralization, with Au on line 1 reaching apeak value of 8 ppb, and on line 2, 26 ppb. Arsenic reaches 21 ppm online 2, but does not respond to mineralization on line 1. Lines 3 and 4over the 8 North deposit do not show any interpretable responses in themineralizing elements (Figures 3b and d).
The elements that produce a consistent, interpretable response tomineralization over both deposits, regardless of chemical extractionused, are Ca and its substitute Sr. AR soluble Ca on all but line 3 (Figures4a and b) shows a clear double-peak response over or on the margins ofmineralization. Similar patterns are produced by Sr (Figures 4c and d).HOAc Ca and Sr (Figures 5a to d) produce identical patterns, as doesHYDHCl Sr (Figures 6a and b). The ratios of the weak extraction HOAcCa to AR Ca show positive residuals above the mineralization on all
lines, regardless of depth of burial, which indicates that extra Ca hasbeen mobilized into these areas (Figures 6c and d). Both lines 1 and 2exhibit a strong Ca response at the east end of the lines, where samplespacing was between 100 and 200 feet. Tighter sample spacing may indi-cate a valid anomaly exists to the east of the 5 North mineralization.
Enzyme leach
The use of a carbon-based solution to selectively leach soil of amor-phous Mn-oxide and adsorbed elements has been widely used recentlyby a number of exploration organizations in their search for buried baseand precious metal deposits. This weak extraction, known as enzymeleach, is claimed to be specific to amorphous Mn and to be self-limitingso that other compounds will not go into solution over time (Clark,1992). These claims were to be tested in this study, as it is difficult to
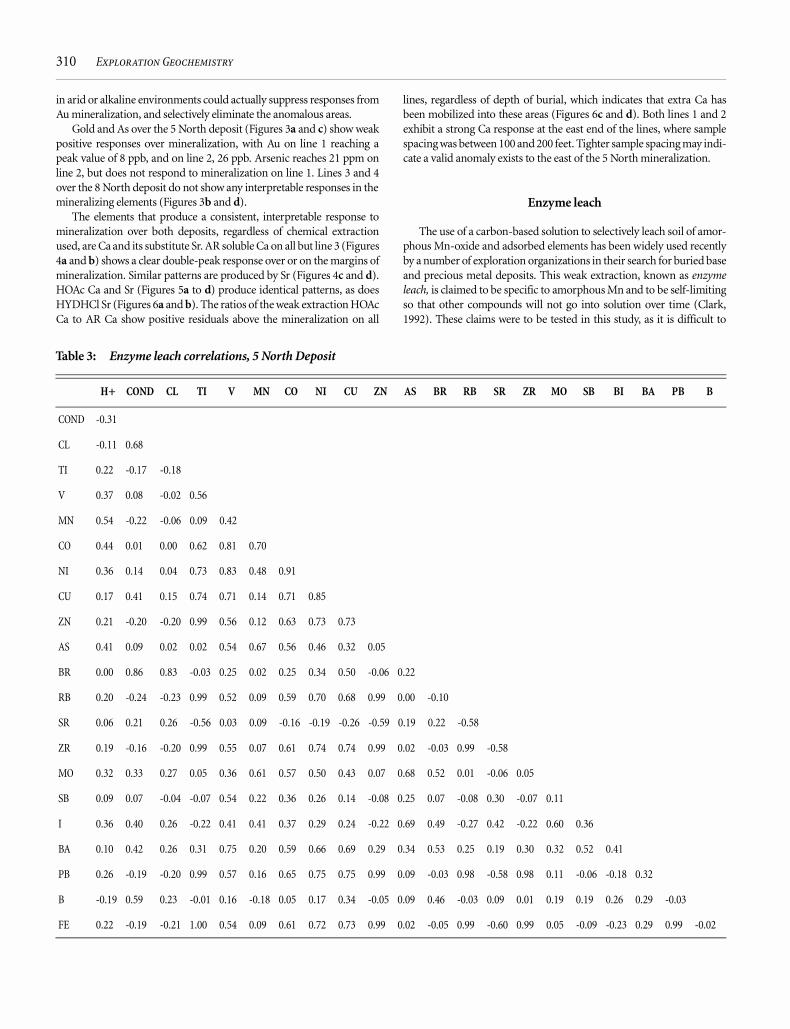
Table 3: Enzyme leach correlations, 5 North Deposit
H+ COND CL TI V MN CO NI CU ZN AS BR RB SR ZR MO SB BI BA PB B
COND -0.31
CL -0.11 0.68
TI 0.22 -0.17 -0.18
V 0.37 0.08 -0.02 0.56
MN 0.54 -0.22 -0.06 0.09 0.42
CO 0.44 0.01 0.00 0.62 0.81 0.70
NI 0.36 0.14 0.04 0.73 0.83 0.48 0.91
CU 0.17 0.41 0.15 0.74 0.71 0.14 0.71 0.85
ZN 0.21 -0.20 -0.20 0.99 0.56 0.12 0.63 0.73 0.73
AS 0.41 0.09 0.02 0.02 0.54 0.67 0.56 0.46 0.32 0.05
BR 0.00 0.86 0.83 -0.03 0.25 0.02 0.25 0.34 0.50 -0.06 0.22
RB 0.20 -0.24 -0.23 0.99 0.52 0.09 0.59 0.70 0.68 0.99 0.00 -0.10
SR 0.06 0.21 0.26 -0.56 0.03 0.09 -0.16 -0.19 -0.26 -0.59 0.19 0.22 -0.58
ZR 0.19 -0.16 -0.20 0.99 0.55 0.07 0.61 0.74 0.74 0.99 0.02 -0.03 0.99 -0.58
MO 0.32 0.33 0.27 0.05 0.36 0.61 0.57 0.50 0.43 0.07 0.68 0.52 0.01 -0.06 0.05
SB 0.09 0.07 -0.04 -0.07 0.54 0.22 0.36 0.26 0.14 -0.08 0.25 0.07 -0.08 0.30 -0.07 0.11
I 0.36 0.40 0.26 -0.22 0.41 0.41 0.37 0.29 0.24 -0.22 0.69 0.49 -0.27 0.42 -0.22 0.60 0.36
BA 0.10 0.42 0.26 0.31 0.75 0.20 0.59 0.66 0.69 0.29 0.34 0.53 0.25 0.19 0.30 0.32 0.52 0.41
PB 0.26 -0.19 -0.20 0.99 0.57 0.16 0.65 0.75 0.75 0.99 0.09 -0.03 0.98 -0.58 0.98 0.11 -0.06 -0.18 0.32
B -0.19 0.59 0.23 -0.01 0.16 -0.18 0.05 0.17 0.34 -0.05 0.09 0.46 -0.03 0.09 0.01 0.19 0.19 0.26 0.29 -0.03
FE 0.22 -0.19 -0.21 1.00 0.54 0.09 0.61 0.72 0.73 0.99 0.02 -0.05 0.99 -0.60 0.99 0.05 -0.09 -0.23 0.29 0.99 -0.02

Smee, B.W. GEOCHEMICAL PATTERNS OVER EPITHERMAL GOLD DEPOSITS 311
understand how a chemical attack that produces weak hydrogen perox-ide could dissolve Mn compounds and not Fe compounds.
The Fe concentration reported by enzyme leach ranges up to105,000 ppb, or 105 ppm. This is 20 times higher in concentration thanthe highest Mn concentration reported. The enzyme leach techniquecan therefore be said to dissolve sesquioxides, with the overwhelminginfluence being Fe.
Inter-element correlations for the enzyme leach data were calculated(Tables 3 and 4) for each of the deposits prior to profile plotting. It isimmediately apparent that Fe is controlling the concentration and distri-bution of Ti, Ni, Cu, Zn, Rb, Zr and Pb. In fact, plotting Fe is virtually thesame as plotting these other elements. Enzyme leachable Mn is positivelycorrelated with H+, Ni, As and Mo on the 5 North area, and with V, Coand Ni on 8 North. H+ appears to be playing a role in the availability ofMn and Fe, which may indicate that the enzyme leach analysis is sensitive
to conditions where the pH may change, such as breaks in slope, seep-ages, varying groundwater conditions, and rock type changes.
Profile plots (not shown here) for the enzyme leach elements directlyrelated to epithermal mineralization, As and Sb, do not show a responseto mineralization on any line, nor does Fe and the correlated elements Cu,Pb, Zn and Ni. The only element to consistently respond to mineralizationwas Sr, as Ca is not reported by the enzyme leach method. The Sr patternsfound by an enzyme leach extraction were almost identical to the previ-ously described methods; i.e., a double-peak or “rabbit ear” response.
DISCUSSION
The results from the Marigold orientation suggest that a transport mech-anism of some type is influencing the distribution of Ca and, in turn,
Table 4: Enzyme leach correlations, 8 North Deposit
H+ COND CL TI V MN CO NI CU ZN AS BR RB SR ZR MO SB BI BA PB B
COND -0.62
CL -0.38 0.71
TI 0.51 -0.51 -0.33
V 0.50 -0.41 -0.29 0.81
MN 0.47 -0.47 -0.30 0.45 0.58
CO 0.46 -0.36 -0.21 0.76 0.79 0.80
NI 0.45 -0.38 -0.23 0.84 0.85 0.68 0.94
CU 0.39 -0.34 -0.17 0.94 0.87 0.43 0.80 0.89
ZN 0.55 -0.52 -0.32 0.99 0.83 0.49 0.79 0.86 0.94
AS 0.16 0.00 0.09 0.36 0.60 0.48 0.53 0.51 0.49 0.39
BR -0.32 0.64 0.80 -0.54 -0.35 -0.32 -0.31 -0.33 -0.35 -0.52 0.13
RB 0.54 -0.52 -0.35 0.99 0.81 0.50 0.79 0.85 0.92 0.99 0.37 -0.56
SR 0.05 -0.22 -0.15 -0.27 -0.22 -0.01 -0.21 -0.22 -0.28 -0.27 -0.10 0.09 -0.26
ZR 0.49 -0.49 -0.33 0.99 0.82 0.45 0.78 0.85 0.95 0.99 0.35 -0.55 0.99 -0.29
MO -0.26 0.56 0.53 -0.37 -0.07 0.20 0.13 0.01 -0.16 -0.33 0.24 0.57 -0.35 -0.25 -0.34
SB 0.08 -0.15 -0.13 0.14 0.28 0.34 0.45 0.41 0.20 0.15 0.21 -0.03 0.19 0.04 0.15 0.11
I -0.10 0.50 0.60 -0.46 -0.14 -0.17 -0.24 -0.26 -0.28 -0.43 0.16 0.76 -0.46 0.16 -0.45 0.55 -0.01
BA -0.02 0.10 0.13 0.09 0.11 -0.05 0.15 0.13 0.17 0.08 0.07 0.17 0.08 0.12 0.09 0.10 0.24 0.05
PB 0.52 -0.50 -0.31 0.99 0.81 0.49 0.79 0.86 0.95 0.99 0.39 -0.53 0.99 -0.29 0.99 -0.32 0.17 -0.45 0.08
B -0.28 0.53 0.44 -0.30 -0.07 -0.33 -0.29 -0.28 -0.18 -0.30 0.07 0.42 -0.29 0.02 -0.29 0.32 -0.01 0.43 -0.02 -0.30
FE 0.53 -0.50 -0.32 1.00 0.81 0.47 0.78 0.85 0.93 0.99 0.36 -0.54 1.00 -0.28 0.99 -0.35 0.16 -0.45 0.07 0.99 -0.31

312 Exploration Geochemistry
Sr over mineralization. This mechanism probably involves several steps,and affects nearly all elements to some degree. In addition, Au forms adetectable anomaly and appears to be influenced by Ca over the 5 Northdeposit, but not the 8 North deposit. The former is overlain by about 100feet of alluvium and the latter by over 300 feet. The typical response tomineralization appears to be double-peak or rabbit-ear shaped anoma-lies, with peaks over the margins of mineralization. This was seen in allanalytical extractions. The peaks were sharply defined and of limitedextent over the margins of the 5 North deposit, but broader over the mar-gins of 8 North. The ratio of HOAc (carbonate specific) soluble Ca to ARsoluble Ca showed clear residual anomalies over the deposit margins.This is hard evidence that two forms of Ca exist in the soil, one of whichis easily dissolved and occurs near mineralization. The soil conditionsare alkaline, with a pH above 8.0 in almost all locations. What type oftransport processes could fit these disparate observations?
First of all, transport processes that cannot possibly be involvedshould be discarded. Obviously, clastic transport from mineralizationthrough to surface is not a factor. Nor is electrogeochemical transport,as described by Bolviken and Logn (1975) and Govett (1972). There areno electrical conductors; no conductor grain-to-grain contact travers-ing a large Eh field; therefore, no self potential (SP) field. Without an
established electrical field (battery) no net movement of ions can occurin response to the battery. If there were natural electrical fields over theBasin and Range precious metal deposits, the best exploration techniquewould be SP, looking for sharp negative electrical potentials. These donot exist over the Marigold study area (D. Hoover, USGS, pers. comm.,1995), or probably any of the other sulphide-poor epithermal deposits.The movement of ions, and their adsorption by Fe or Mn, supposes boththe target ions and adsorption compounds are mobile under the envi-ronmental conditions in and above the deposit. The alkaline nature ofthe desert environment precludes the movement of many cations. Thestability diagrams for Fe and Mn at STP and a pH above 8 as shown byGarrels and Christ (1965) preclude the ionic movement of either of theseelements in the Marigold environment (Figure 7). The formation ofanomalies in Fe or Mn is unlikely. In fact, results in this study suggestthat analyzing the sesquioxide component of soil may actually suppressvalid geochemical responses.
What mechanisms support the element patterns observed at Mari-gold? Recent work by Lintern and Butt (1993) has shown that the sam-pling of a pedogenic carbonate horizon and its analysis for Au has beensuccessful in defining Au mineralization through 40 m of overburden inSouth Australia. However, the origins of the anomalies are not clear. TheAustralians point out that the formation of calcrete is the result of theinteraction of Ca2+ with bicarbonate (HCO
3
-). In turn, HCO3
- is formedby the reaction of water and CO
2 gas; the latter could originate from the
atmosphere, from microbial and root action, or from CO2 released by
the oxidation of mineralization. This correlation of Au and Ca also indi-cates that Au may be transported as an anion, perhaps a bicarbonatecomplex. Gray and Lintern (1994) suggest that the Au distribution incarbonate soils may be partially controlled by evapotranspirative pro-cesses and be aided by biologically generated ligands. If this is in fact thecase, there may be a depth of burial limit beyond the influence of surfaceplants which will prevent the movement of Au to the surface.
This work over the Marigold deposit has shown that, in areas of thickrecent alluvial fill, Ca anomalies can form over mineralization eitherwith or without Au, depending on the depth of overburden. This isstrong evidence that the transport mechanism does not depend on Auat all, but some other factor related to the mineralization. The large vari-ation in H+ concentration observed in the Marigold soils may offer aclue to the formation of Ca anomalies.
Smee (1983) proposed a mechanism for the formation of soil anom-alies through lacustrine clay overburden over massive sulphide depositsin the Canadian Shield. Laboratory experiments using radioisotopedoping showed that ion migration through lacustrine clay was takingplace by a process of cation exchange on soil particle surfaces. Theexchanged and released cation was H+. The resulting change in pH inthe soil mobilized ambient Fe, Mn, Ca and Mg which was then redistrib-uted and precipitated in the soil column. Precipitation of the sesquiox-ides scavenged other ambient cations which produced pseudo-anomalies in a variety of elements. Thus, surficial responses in elementsnot associated with mineralization were possible. The pseudo-anomalous elements appeared as though they travelled through theoverburden, but they did not. This role of H+ and Fe was confirmed byfield studies in northern Québec.
The soil pH in the temperate forest was between 5.5 and 7.0, whichcrosses the stability field of Fe, depending on the Eh (Figure 7). The ratioof weakly bound Fe to total Fe, when corrected for organic carbon, pro-duced rabbit ear patterns through more than 20 m of glaciolacustrinevarved clay over a massive sulphide Cu/Zn body.
Figure 7: Eh-pH diagram for Fe at STP conditions showing conditionsfound in boggy soil in temperate forest in Canada (Smee, 1993) andextrapolated conditions based on pH measurements at Marigold. Note thatthe temperate forest conditions cross the stability boundary for hematite,but the desert conditions do not (adapted from Garrels and Christ, 1965).

Smee, B.W. GEOCHEMICAL PATTERNS OVER EPITHERMAL GOLD DEPOSITS 313
MODEL FOR FORMATION OF SURFACE RESPONSESTO MINERALIZATION
The proposed model which attempts to tie these observations togetheris shown in Figures 8a and b. A mineral deposit contains at least somesulphides and is undergoing oxidation. Over time, an oxide cap willform at the top of the body, which will slow the rate of oxidation directlyaffecting the bedrock-overburden interface. The greatest rate of oxida-tion should therefore be taking place at the margins of the mineraliza-tion. The breakdown of sulphides during oxidation will release H+ andionic species of the elements making up the mineralization. Both H+
and the other elements will diffuse around the deposit and form a con-centration front within the overburden. The release of H+ can result intwo subsequent actions: it can react with surrounding limy rocks, ineither the wall rock or overburden, and produce CO
2, or it can set up an
ion exchange-based diffusion front in the overburden, and diffuseupward toward surface.
The occurrence of CO2 in soil gas above and on the margins of ore
deposits is well documented, particularly in arid environments (Lovellet al., 1983; McCarthy et al., 1986). The mechanism for the formation ofCO
2 in these references is as explained above. Both CO
2 and H+ will
diffuse to the surface along the path of least resistance, which for bothgaseous and ionic diffusion, should be straight up, above their source.
The gradual buildup over time of H+ at the soil-alluvium interfaceshould cause a reaction with ambient CaCO3 in the soil, and the redis-tribution of Ca. The addition of extra CO
2 from below will, in turn, react
with near surface moisture forming HCO3
-. This should then react withthe loose Ca2+ to reform CaCO
3. Given sufficient time, an excess of
nearly pure CaCO3 should form first above, then on the margins of min-
eralization. This CaCO3 will be most easily dissolved by HOAc, produc-
ing a positive Ca anomaly when ratioed against AR Ca. Strontium willmimic Ca.
A change in response pattern should be caused by differing overbur-den thicknesses, or possibly regolith type. Figure 8a shows a hypotheti-cal distribution of Ca, Sr, Au and As where bedrock cover is relativelythin. Gold and As may diffuse directly to the surface or may be taken upby plants, then redeposited to the surface (Lintern and Butt, 1993). Thissuperimposition of transport processes could result in a one-, two-, orthree-peak anomaly pattern as originally suggested by Govett (1976).The Ca and Sr anomalies should form very sharp peaks on either side ofthe mineral body; the short transport distance above mineralization willnot permit any significant lateral dispersion.
The schematic in Figure 8b, where overburden thickness preventsthe direct migration of the ore-forming elements to surface, shows thatonly Ca and Sr should produce a response to mineralization. Plant rootsdo not penetrate to the aureole of elements released by oxidation, thusno detectable Au or As is found in the surface soils. Broad double peaksshould be found for Ca and Sr.
CONCLUSIONS
These geochemical orientation results over the two Marigold Au depos-its have suggested that an element transport mechanism is activethrough overburden thickness exceeding 100 m.
The soils over the Marigold study area are alkaline, the pH rangingfrom 7.8 to 9.5. This is nearly a 100-fold difference in H+ concentration,a surprising fact given the flat topography, high buffering capacity and
thick outwash sequence that comprises the alluvial fill. The only mech-anism that could produce these sharp variations in surface H+ is anintroduction of H+ from the subsurface by oxidation of mineralization.pH alone, however, does not produce interpretable patterns over miner-alization. Some other mechanism, perhaps dependent on pH, is influ-encing the near surface soil chemistry.
There is no repeatable and interpretable pattern developed fromanions measured with a water leach and the Dionex Ion Chromato-graph, or enzyme leach ICP-MS. However, a simple soil conductivitymeasurement produces similar patterns in soil samples, is very muchless expensive and is field portable. The enzyme leach technique is dis-solving up to 20 times more Fe than Mn; it is really an extraction for ses-quioxides rather than Mn alone. The Fe is controlling the distribution ofmost other cations, and as a result, is of little use to exploration in thealkaline environment of the desert. It may be useful in more acidic con-ditions where Fe would be mobile.
Those who invoke an electrogeochemical transport mechanism toexplain surface anomalies should first detect the presence of a naturalbattery by completing an SP survey: no SP anomaly—no electro-geochemical transport. Gold, As and Sb, at very low levels, can show
Figure 8: Conceptual model for the formation of Ca, Sr and ore-formingelement patterns in desert soils: (a) shallow overburden; (b) deep overbur-den. See text for explanation.

314 Exploration Geochemistry
anomalies related to mineralization through 60-70 feet of overburden.The “true” background for Au is less than 1 ppb, and is less than 0.1 ppmfor As and Sb. It is therefore imperative to use analytical methods thatcan produce these low levels of detection for all soil sampling surveys inthe Basin and Range Province.
Gold is strongly correlated with Ca. Calcium, and its accompanyingelement Sr, are the only elements that show a consistent, interpretableresponse to mineralization, regardless of depth of burial or chemicalextraction used. The positive Ca residuals, when AR soluble Ca isratioed to the weak extraction Ca, show that Ca has been mobilized oradded to the soil by some mechanism.
The double-peak responses are close together where overburden isrelatively thin, or the mineralization only partially subcrops, and are far-ther apart where the overburden is thick.
Responses to mineralization from this study indicate that migratingelements are moving vertically; little lateral transport is evident. Analy-sis of closely spaced soils should include pH, ultra low level Au (1 ppb orbetter), As and Sb (0.1 ppm or better) and AR soluble elements includ-ing Ca and Sr. All data should be plotted in profile format so that theycan be easily interpreted.
Conclusions reached in this study are restricted to the pH-Eh envi-ronment found at Marigold, i.e., very alkaline and oxidizing. It is likelythat the controlling element, Ca, would be replaced by Fe in more acidicenvironments, as found in the Canadian Shield by the author. The orga-nizations who use the techniques or hypotheses from this study shouldunderstand the geochemical landscape prior to starting a survey. Inshort, there is no magic bullet.
ACKNOWLEDGEMENTS
This study would not have been possible without the financial supportof the participating companies and the co-operation of Doug McGib-bon of Marigold Mining Corporation. The field work was performedwith the assistance of Andrew Molnar and Otto Paeseler of Vancouver.Laboratory analysis or cost reductions were contributed by BondarClegg, Chemex, XRAL and ACTLABS.
REFERENCES
Bolviken, B., and Logn, O., 1975, An electrochemical model for element distri-bution around sulphide bodies, in I.L. Elliott and W.K. Fletcher, eds., Assoc.Expl. Geochem. Spec. Publ. #2, p. 631-648.
Bradshaw, P.M.D., Thomson, I., Smee, B.W., and Larsson, J.D., 1974, The appli-cation of different analytical extractions and soil profile sampling in explora-tion geochemistry, J. Geochem. Explor. 3: 209-225.
Brooks, R.R., Dunn, C.E., and Hall, G.E.M., 1995, Biological systems in mineralexploration and processing, Ellis Horwood Limited, Hemel Hempstead,538 p.
Chao, T.T., 1984, Use of partial dissolution techniques in geochemical explora-tion, J. Geochem. Explor. 20: 101-135.
Clark, J.R., 1992, Detection of bedrock-related geochemical anomalies at the sur-face of transported overburden, Explore 76.
Farr, E., Vaidanathan, L.V., and Nye, P.H., 1970, The measurement and mecha-nism of ion diffusion in soils. V. Diffusion of hydrogen ions in soils. J. Soil Sci.21: 1-14.
Garrels, R.M., and Christ, C.L., 1965, Solutions, Minerals and Equilibria, Free-man, Cooper & Company publishers, 450 p.
Govett, G.J.S., 1972, Differential secondary dispersion in transported soils andpost-mineralization rocks: an electrochemical interpretation, in M.J. Jonesed., Geochemical Exploration 1972. I.M.M. Publication, 81-91.
Govett, G.J.S., 1976, Detection of deeply buried and blind sulphide deposits bymeasurement of H+ and conductivity of closely spaced surface soil samples,J. Geochem. Explor. 6: 359-382.
Govett, G.J.S., and Chork, C.Y., 1977, Detection of deeply buried sulphide depos-its by measurement of organic carbon, hydrogen ion and conductance in sur-face soils, in Prospecting in Areas of Glaciated Terrain, I.M.M. Publ. p. 49-55.
Graney, J.R., and McGibbon, D.H., 1991, Geological setting and controls on goldmineralization in the Marigold Mine area, Nevada, in Raines G.L. et al., eds.,Geology and Ore Deposits of the Great Basin, Geol. Soc. Nev. Proc. 865-874.
Gray, D., and Lintern, M., 1994, The solubility of gold in soils from semi-aridareas of Western Australia, Explor. Min. Res. News.
Hall, G.E.M., Vaive, J.E., Beer, R., and Hoashi, M., 1996, Selective leachesrevisted, with emphasis on the amorphous Fe oxyhydroxide phase extrac-tion, J. Geochem. Explor. 56: 59-78.
Leinz, R.W., and Hoover, D.B., 1993, The Russian CHIM method—electrically-or diffusion-driven collection of ions? Explore, 79.
Lintern, M., and Butt, C., 1993, Pedogenic carbonate: an important samplingmedium for gold exploration in semi-arid areas, Explor. Res. News, 7: 7-11.
Lovell, J.S., Hole, M., and Webb, J.S., 1983, Soil air carbon dioxide and oxygenmeasurements as a guide to concealed mineralization in semi-arid and aridregions, in G.R. Parslow, ed., Geochemical Exploration 1982. J. Geochem.Explor. 19: 305-317.
McCarthy, J.H. Jr., Lambe, R.N., and Dietrich, J.A., 1986, A case study of soilgases as an exploration guide in glaciated terrain—Crandon massive sul-phide deposit, Wisconsin. Econ. Geol., 81: 408-420.
Smee, B.W., Hall, G.E.M., and Koop, D.J., 1978, Analysis of fluoride, chloride,nitrate and sulphate in natural waters using ion chromatography, J. Geochem.Explor. 10: 257-265.
Smee, B.W., 1983, Laboratory and field evidence in support of the electro-geochemically enhanced migration of ions through glaciolacustrine sedi-ment, in G.R. Parslow, ed., Geochemical Exploration 1982, J. Geochem.Explor. 19: 277-304.
Thompson, M., and Howarth, R.J., 1978, A new approach to the estimation ofanalytical precision, J. Geochem. Explor. 9: 23-20.