the formation of a structural framework in gelled wyoming ...342352/uq342352_oa.pdf · marek s....
TRANSCRIPT
Accepted Manuscript
The formation of a structural framework in gelled wyoming bentonite: Direct
observation in aqueous solutions
Marek S. Żbik, David J. Williams, Yen-Fang Song, Chun-Chieh Wang
PII: S0021-9797(14)00557-8
DOI: http://dx.doi.org/10.1016/j.jcis.2014.08.004
Reference: YJCIS 19735
To appear in: Journal of Colloid and Interface Science
Received Date: 13 June 2014
Accepted Date: 1 August 2014
Please cite this article as: M.S. Żbik, D.J. Williams, Y-F. Song, C-C. Wang, The formation of a structural framework
in gelled wyoming bentonite: Direct observation in aqueous solutions, Journal of Colloid and Interface Science
(2014), doi: http://dx.doi.org/10.1016/j.jcis.2014.08.004
This is a PDF file of an unedited manuscript that has been accepted for publication. As a service to our customers
we are providing this early version of the manuscript. The manuscript will undergo copyediting, typesetting, and
review of the resulting proof before it is published in its final form. Please note that during the production process
errors may be discovered which could affect the content, and all legal disclaimers that apply to the journal pertain.

THE FORMATION OF A STRUCTURAL FRAMEWORK IN GELLED WYOMING BENTONITE: DIRECT OBSERVATION IN AQUEOUS
SOLUTIONS
Marek S. Żbik*,a, David J. Williamsa,Yen-Fang Song*,b Chun-Chieh Wangb
aGeotechnical Engineering Centre, The University of Queensland, St Lucia, Brisbane 4072, Australia
bNational Synchrotron ∗Radiation Research Center, 101 Hsin-Ann Road, Hsinchu Science Park,
Hsinchu 30076, Taiwan, R.O.C.
Hypothesis
Particle space arrangement is a very important factor that determines the physico-mechanical
properties of soil. Formations of three-dimensional (3D) structured networks within gelled or
flocculated suspension may prevent clay particles and aggregates from settling under gravity
force and by encapsulate water within such a network, lead to poor sludge dewatering. To better
understand this phenomenon, a microstructural investigation of a smectite clay (SWy2)
suspension was conducted.
Experiments
SWy-2 was diluted in water and a moderately salty aqueous solution and was studied with the
aid of a synchrotron-powered transmission x-ray microscope (TXM) and cryogenic transmission
electron microscope (Cryo-TEM). Observations of mutual particle arrangement in 3D spaces
were conducted within a natural water environment after vitrification without drying.
Findings
A new type of micro-architecture in particle space arrangement was observed. Smectite flakes
were mostly in edge-to-edge (EE) contact and formed a 3D network, confirming a “net of flakes”
structural model. Clay particles form a complex and multi-hierarchic flocculated structure with
characteristic cellular chained networking. Chained aggregates build cellular elements,
∗Corresponding author. Tel: +61-7-33653912; Fax: +61-7-33654599; E-mail: [email protected], Second Corresponding author. Tel: +886928430782; Fax: +88635783813; E-mail: [email protected] David J. Williams ([email protected]) Chun-Chieh Wang ([email protected])

encapsulating water inside closed voids. Increasing ionic strength results in development of
multi-hierarchic voids categories, with most water retained within nano-pores.
Keywords: transmission x-ray microscope, clay flocculation, smectite flocks, Wyoming
montmorillonite, colloids, clay gelation, clay microstructure.
1. Introduction.
Particle space arrangement is a very important factor that determines the physico-mechanical
properties in soil. These properties play a major role in dams, footings and other engineering
projects in which soil strength or permeability is crucial to the performance of a structure. As
most soil mineral particles cannot be shredded by natural factors beyond a certain size, they are
not present in the soil size fraction below 2 µm. Particles observed below this size limit are
mostly secondary minerals that belong to the sheet silicates and are known as clays. The
structure of clay-rich soils is important to a range of engineering tasks, especially those dealing
with soil dewatering and stabilization. As soil structure depends on the primary particle
aggregating in aqueous suspension, primary aggregating processes are the subject of increasing
research interest. This study focuses on the structure of aggregates and flocks within clay-rich
suspension. To avoid misunderstanding of the terms “structure” and “texture,” we follow the
most recent definition of “soil structure” by Osipov & Sokolov [1] as “space arrangement of all
soil constituents characterized by a set of morphometric, geometric and energy parameters. It is
defined by qualitative composition, quantitative ratio of all soil components and interaction
between them.” However, as soil macroscopic physical behavior is governed by their
constitution on a microscopically small scale, we use the term “soil microstructure” in this study.
Despite numerous studies around the world, the subject is still poorly understood because of
its complexity and the difficulty presented by the minute size. To enrich knowledge in this field,
the present study is dedicated to investigating the microstructure of gelled smectite flocks within
moderately salty aqueous suspensions. The findings from these observations may be used to
improve water recovery technology primarily in mine-tailing dewatering projects.
Kaolinite, illite and smectite are the most common clay minerals in soils. Their presence in
aqueous suspension is the primary cause of slow settling and water clarification problems. Clay
particles are plates of flakes that are generally fine, with equivalent diameters of 200-1000 nm in
kaolinites and 5-200 nm in smectites with a high aspect ratio [2]. Owing to the electric charges
present at the mineral surfaces (basal and edge sites) within an aqueous solution, clay particles
have the ability to form complex aggregates and networks. This behavior depends on water and
clay chemistry as well as the packing density of clay particles [3]. The electric charge on the
mineral interface is compensated by the adsorption of cations from the solution [4]. Smectite, the
most dispersed member of the clay mineral group, represents a 2:1-type layer silicate. The
layered smectite structure consists of an octahedral alumina sheet sandwiched between two
tetrahedral silica sheets. With the expandable structure comprising sheets carrying an excess
negative layer charges are linked by weak van der Waals forces. Because of this they may easily
expand in water and form nanosuspension.
Contemporary approaches to describing the behavior of dilute clay suspensions are based on
the DLVO theory of colloid stability [5, 6], where competing electrostatic and van der Waals
forces generally determine whether particular colloidal clay suspensions will be stabilized (in sol
form) or coagulated (in gel form). Chemical changes in the aqueous environment may reduce the
electric charge at the mineral interface and in consequence collapse the electrical double layer
and allow particles to approach each other closely enough for short-range van der Waals forces
to bond them into larger aggregates. This process significantly increases the settling rate.
Given the size of clay constituents, the electron microscope (EM) was found to be the tool of
choice used by scientists studying the microstructure of clays [7, 8]. Development of concept
about microstructure in clays can be dated back much earlier than the advent of electron
microscopy methods and initiated many ideas [9, 10, 11]. The formation of a fibrillar network of
particles and existence of a structural framework in sols of Wyoming was proposed in 1950's by
McEven and Pratt [12, 13] The first experimental information about clay particle mutual
arrangements was obtained with the advent of the transmission electron microscope (TEM) and
scanning electron microscope (SEM) [14, 15, 16].
In terms of their settling, dewatering and filtration performance, some species of clay are
quite responsive to changes in water quality, exchangeable cations concentration, flocculants

type and dosage, and the treatment procedure adopted, while others remain relatively inert. The
most likely cause of these difference in performance is formation of structured networks within
gelled or flocculated suspension of clay platelets may hinder particles, preventing their
movement when settling in gravity force. Microstructural patterns within clay-rich suspension
and sediments may not only cause settling difficulties but also in some way encapsulate water,
which causes a major problem in clay-rich sludge dewatering [17, 18, 19, 20]. The present study
investigated smectite suspension microstructure in water and a medium salty aqueous
environment to better understand this floccule-building phenomenon.
2. Materials and Methods.
The smectite used in this study was SWy2, which is a well-known Na-bentonite sample from
Wyoming, obtained from the Clay Minerals Society. This bentonite is of the chemical formula
Na0.33[Al1.67Mg0.33(O(OH))2(SiO2)4] with high smectite content (sodium montmorillonite).
SWy2 has been well described [21] and 2.5 wt% suspensions were prepared from this original
clay sample in deionized (DI) water and in 0.1 M NaCl and CaCl2 aqueous solutions. The
suspension was sonicated 5 min with 50 power W prior to investigations. The pH was not
controlled and measured in suspension at around 8.
Electrokinetic potential (Zeta potential or ζ) was measured on the clay samples using
Zetasizer (NanoSeries), manufactured by Malvern Ltd., UK. Samples of diluted suspension (~0.2
wt%) were prepared from the clay fraction and inserted into a disposable measurement cell. Zeta
potential in mV and electric conductivity in mS/cm were measured in DI water and 0.1 M NaCl
and CaCl2 salt suspensions, as described in [22, 23, 24].
X-Ray diffraction (XRD) patterns were recorded with a PANalytical X’Pert Pro, multi-
purpose diffractometer using Fe filtered Ca Ka radiation, auto divergence slit, 2° anti-scatter slit
and fast X’Celerator Si strip detector. The diffraction patterns were recorded in steps of 0.016° 2-
theta with a 0.4-second counting time per step, and logged to data files for analysis.
An EM investigation was conducted using a JEOL-2100 TEM with 200 kV accelerating
potential. The SEM JEOL 6040 was used to investigate a sample coated in platinum film with
accelerating voltage of 15-20 kV. For 3D imaging, the cryogenic transmission electron
microscope (Cryo-TEM) was used with accelerating voltage of 300 kV. The aqueous suspension
samples were vitrified into the liquid nitrogen temperature by rapid plunging samples in an
environment-stable camera (stable temperature and moisture content).
The transmission x-ray microscope (TXM), which was installed on an National Synchrotron
radiation Research Centre (NSRRC) synchrotron in Taiwan [25, 26], proved to be an efficient
instrument in the interior three-dimensional (3D) structure of nano-material owing to its large
penetration depth and superior spatial resolution. The TXM provides two-dimensional (2D)
imaging and 3D tomography at energy 8-11 keV with a spatial resolution of 50–60 nm, and has a
Zernike-phase contrast capability for imaging light material that lacks X-ray absorption contrast.
A photon energy of 8 keV was used to image the clay suspension for maximum X-ray
absorption. The exposure time of a 2D image is from 15 seconds to 4 minutes, depending on the
spot size used. By acquiring a series of 2D images with the sample rotated stepwise, 3D
tomography datasets were reconstructed based on 141 sequential image frames taken in the first-
order diffraction mode with azimuth angle rotating from –70º to + 70º for our lateral plate
specimen.
The imaging and force measurements were conducted using a Nanoscope III atomic force
microscope (AFM), Digital Instruments Santa Barbara, USA, in the force mode, utilizing a scan
head (JA) and standard fluid cell with a scan rate of 1 Hz used for measurements. The AFM
cantilever was triangular, tipples, silicon nitride with a spherical colloidal probe (2.5 µm in
diameter) purchased from NOVASCAN. The spring constant was nominal, 0.12 N/m. To record
forces acting on a spring, the clay-coated flat substrate surface was displaced in a controlled
manner toward and away from the colloidal probe in aqueous solutions.
Images from all microscopy studies were statistically analyzed using the Statistical Image
Analyzing (STIMAN) technique [27, 28, 29, 30], which was adopted for the study of clay
suspensions. This technique can extract integrated information on sample microstructure,
especially on total pore (void) space and the spread of micro-pore sizes. It contains a subroutine
for estimating filtration properties from the void space parameters. Examples of the output
parameters include: number of voids analyzed; porosity (%); total void/particle area (sq. µm);
total void perimeter (µm); average diameter (µm); average perimeter (µm) and the form index
(Kf), which is the ratio of platelet thickness to its diameter. Form index is 1 for perfectly round
isometric particles and near 0 for string-like, elongated particles. In this study we limit the use of

the STIMAN technique to obtaining statistical information about porosity, average diameter of
particles and pore distribution according to their total area from 2D micrographs. The 3D
STIMAN technique was also used to estimate flock size within suspension—two consequent
TXM images with known rotation angle difference, these investigations were able to measuring
structural elements dimension in the 3D arrangement.
TXM micrographs are the space images that carry information about the suspension layer of
about 50 µm in thickness. As all samples are uniform in composition, any differences seen from
consequent images photographed from different angles can provide information about the
packing density of flocks. As density differs from water to particles or flocked aggregates,
information about space particle packing can be transposed from 3D space images to flock
dimension diagrams, as shown in the results.
3. Results and discussion.
3.1. General characterization.
The TEM micrograph in Fig. 1A and the AFM micrograph in Fig. 1B display the morphology
patterns of the smectite sample. It represents relatively large, flexible sheets/flakes of lateral
dimension ∼800–1000 nm and a thickness of ∼1–10 nm. The extreme thinness and flexibility of
the flake-shaped particles accounts for the considerable plasticity of this mineral. Similar
morphology patterns were found in earlier TEM studies [31]. The results of EM morphology
studies and elemental composition show small aggregates of smectite flakes of about 1 µm in
diameter. The flakes are very thin and flexible, displaying numerous wrinkles and rough, highly
transparent edges, as shown in the SEM micrograph in Fig. 1B. In the AFM micrograph (Fig.
1B), smectite flakes of diameters below 1 µm form a “hand-of-card” display, with large flexible
sheets spread in one fundamental unit thick steps (~1 nm). EDX analyses in Fig. 1D show typical
for 2:1 smectitic Al/Si picks ratio and the presence of Na, Al, Si, Ca, and Fe elements.

Fh
qua
12,
larg
wit
alo
sm
Fig. highone
The
artz
,31Å
ger
th d
ong
mect
1 (hly e fu
e X
z. T
Å,
r d-
d-sp
the
tite
(A)-flex
und
XRD
The
and
spa
pac
e d
in w
- TExib
dam
D re
sam
d af
ace
ce 1
d-sp
whi
C
EMle s
ment
esu
mpl
fter
17
15,1
pace
ich
C
M msmetal u
ults
le t
gly
,16
11
e le
the
micrectiuni
in F
trea
yco
6 Å
Å (
eng
e m
ogrte st st
Fig
ated
ol tr
. C
(Fig
gth
mine
raphsheeeps
g. 2
d in
reat
Clay
g. 2
dep
e pe
h ofet ws. (D
sh
n the
tme
y tre
2B)
pen
eak
f a wheD)-
ow
e N
ent t
eate
). In
ndin
is i
smen dED
w alm
NaC
this
ed i
n N
ng
inde
ectidryiDX
mo
Cl s
s pr
in t
Na-
on
epe
ite ingspe
i
st p
olu
rodu
the
satu
the
ende
A
flex. (Cectrinte
pure
ution
uce
Ca
urat
e m
ent
A
xibC)-rumensi
e sm
n (F
es a
aCl
ted
moi
of
le fAF
m shity.
mec
Fig
na
2 so
d sm
stur
the
flakFM how
ctite
g. 2A
arro
olu
mec
re c
e m
ke. (mic
ws la
e co
A)
wer
tion
ctite
con
oist
(B)croarg
om
dis
r an
n p
e, th
nten
ture
- SEgra
ge a
mpos
spla
nd h
rod
he
nt,
e co
EMaphssym
sitio
ays
hig
duce
min
in
onte
M ms shmm
on
a m
her
es a
ne
con
ent
micrhow
metry
wit
maj
r pe
a st
001
ntra
[32
ogrw smy of
th a
or
eak
tron
1 p
ast
2].
raphmecf A
a sm
001
wit
ng
peak
to
h ofctite
Al an
mall
1 pe
th s
and
k m
the
f a e flnd S
l ad
eak
shif
d na
may
e C
D
wriakeSi p
dmi
k at
fts t
arro
y be
Ca-s
D
B
inkes wpea
ixtu
d-s
tow
ow
e m
satu
B
ledwithaks
ure
spa
ward
pe
mobi
urat
d, h
of
ace
d a
eak
ile
ted

0
2000
4000
6000
8000
10000
12000
0 5 10 15 20 25 30
Inte
nsit
y (c
ount
s)
2-Theta Angle (deg)
Natural sample
Glicoked sample
17.16 Å
12.31 Å
A

Fig. 2- The XRD pattern of the SWy-2 clay fraction sample displays smectite composition.
Zeta potential and electric conductivity measurements conducted in DI water and 0.1 M NaCl
and CaCl2 on SWy2 smectite show a gradual reduction of negative value with the increasing
ionic strength of a solution.
Table 1. Zeta potential (ζ), electric conductivity (Ec) in mS/cm and average equivalent diameter
(D) in nm of smectite particles in DI water. 0.1 M NaCl and 0.1 M CaCl2.
ζmV Ec in mS/cm D nm
DI water -61.4 0.00144 18
0.1M NaCl -43.5 12 27
0.1 M CaCl2 -12.3 23.1 32
0
10000
20000
30000
40000
50000
60000
70000
80000
0 5 10 15 20 25 30
Inte
nsit
y (c
ount
s)
2-Theta Angle (deg)
Na saturated
Ca saturated
15.11 Å
12.31 Å
B

Settling tests conducted on 2.5 wt% suspension in water and NaCl show no settling and
suspension looks stable for hours, unlike CaCl2 suspension, which shows coagulation and a
characteristic partition between gelled fraction and clear supernatant.
3.2. Transmission x-ray microscope results.
The TXM results from the smectite sample studied in water and medium salty aqueous
solutions revealed anisotropy in suspension density distribution in the micro-scale (Fig. 3). Areas
of larger density as observed in TXM (white) are mineral particles and aggregates which are
fragments of the larger tubular super-structure (chains and ribbons) described previously in
smectite suspensions [12, 18].

Fig
freq
but
mic
cha
brid
ent
g. 3
Sm
que
t di
cro
aine
dge
tire
3- A
mect
entl
istin
stru
ed
ed a
ob
A 2D
tite
ly f
ncti
uctu
ultr
and
ser
D T
fla
form
ive
ure
ra-m
d ca
ved
TXM
ake
m cl
lin
is
mic
an c
d str
M mM
s w
lose
near
abo
cro
cont
ruc
micrM so
with
ed c
r or
out
agg
tinu
cture
rogolut
hin
cell
rien
10
gre
ue i
e.
A
graption
the
ls. I
ntat
00 n
egat
in d
A
ph on an
ese
In F
tion
nm
tes
dista
of thnd (
rib
Fig.
n is
and
are
anc
he S(C)
bbo
. 3A
s cl
d re
e la
ces
SW-Ca
oned
A, c
ear
epre
arge
of a
Wy-2aCl
d su
chai
rly
ese
er a
a fe
2 W2 0.
upe
ins
visi
nts
and
ew
Wyo.1 M
erst
are
ible
a m
d el
mic
C
omiM so
truc
e fre
e. T
maj
long
crom
C
ing olu
ctur
equ
The
jori
gate
met
smution
res
uent
e av
ity
ed.
ters
mectn; s
see
tly
vera
intr
Ch
s. T
tite scal
em
con
age
ra-a
hain
This
in:le b
to
nne
e vo
agg
ned
s gi
(Abars
be
ectin
oid
greg
d m
ves
A)- Ds 1 µ
in
ng i
dia
gate
micro
s an
DI µm
EE
into
ame
e sp
o a
n or
B
watm.
E c
o a
eter
pace
aggr
rien
B
ter,
conf
spa
r in
e. V
reg
nted
, (B
figu
ann
n th
Voi
gate
d pa
B)-N
urat
ned
he o
ds
s a
atter
NaC
tion
net
obse
bet
are
rn t
Cl 0
n an
two
erv
twe
oft
to t
0.1
nd
ork
ved
een
ten
the

Surprisingly, the flocked smectite samples in water and salt solutions in the 2D TXM images
show similar morphology pattern. This similarity may be due to the linear patterns within
floccules. Major differences were manifested mostly in measured dimension of structural
elements. Porosity measured from the area density of voids within micrograph frames was 27%
in DI water, 25% in the NaCl solution and 36% in the CaCl2 salt solution. The average pore
diameters within the micrographs were ~78 nm in water, 82 nm in the NaCl solution and 113 nm
in the CaCl2 solution. Sample studied in water, shows close to Gaussian pore diameter
distribution (Fig 4) with a maximum void diameter of 250 nm. In the salt solution, voids show a
multimodal distribution, which is narrower in the NaCl solution and shows three maxima of in
void diameters 25, 250 and 500 nm. This distribution widens in the CaCl2 solution and display
maxima in voids diameters 135, 320 and 1100 nm. Most voids (by number) within flocks in
water and in the NaCl solution were below 100 nm in diameter but only a small number of them
had an average void diameter of 200–500 nm occupying 50–65% of the total picture frame area.
Similarly, in CaCl2, a small number of voids ranging from ~530–1500 nm in diameter occupied
75% of the total picture frame area.
0
5
10
15
20
25
30
35
40
45
0 500 1000 1500
Tota
l voi
d ar
ea in
%
Voids diameter in nm
In water
In NaCl
In CaCl2

ultr
voi
net
gel
red
dis
fur
mo
on
the
sm
con
5 g
ana
FiST
A
ra-p
T
ids
two
lled
duce
tinc
rthe
ore
all
e fra
mect
nfir
T
give
agly
A
ig. TIM
All t
por
TXM
dia
ork,
d m
ed
ctiv
er ri
clo
lev
acta
tite
rm t
The
e m
yph
A
4- TMA
thes
es a
M o
ame
vo
micro
(Ta
ve c
ise
osely
vels
al n
slu
this
3D
more
hs a
TheN t
se v
as l
obse
eter
oids
ostr
able
cate
of
y a
s of
natu
urrie
s as
D TX
e inf
avai
e totech
voi
less
erva
r ind
s in
ruct
e 1
ego
the
and
f th
ure
es m
ssum
XM
form
ilab
otal hniq
ids
s tha
atio
dic
an
ture
1) a
orie
e io
bui
he a
of c
may
mpt
M co
mat
ble i
areque
can
an
ons
atin
aq
e. W
and
s, i
nic
ild
aggr
clay
y al
tion
omp
tion
in o
ea de fro
n fi
100
and
ng t
queo
Wit
d pa
intr
str
den
reg
y ag
lso
n; in
put
n ab
onli
distrom
0
it w
0 nm
d m
that
ous
th in
artic
ra-a
reng
nse
ate
ggr
fol
nve
ter r
bou
ine
ribuTX
0.1
with
m, a
mod
t sm
sol
ncr
cles
aggr
gth
er an
hie
rega
low
estig
reco
ut th
and
utioXMM
hin
and
dal d
mec
luti
eas
s s
reg
(li
nd
erar
ates
w th
gati
ons
he m
d in
on o misolu
the
d mi
diff
ctite
ion
sing
tart
gate
ke
stro
rchy
s [3
he f
ions
stru
mic
n su
B
of vicroutio
e w
icro
fere
e pa
of
g io
t to
e an
in 0
ong
y. T
33, 3
frac
s in
uctio
cros
uppo
B
voidograon,
whol
o-p
enti
arti
low
onic
o co
nd
0.1
ger
Thi
34,
ctal
n th
on m
stru
orti
ds aaph(C)
le r
ore
iatio
icle
w io
c str
oag
inte
M
agg
s fo
35
low
is m
mo
uctu
ing
accohs o)- C
rang
es 0
on
es (f
onic
ren
gula
er-a
M Ca
greg
orm
5]. I
w [3
mat
odel
ural
ma
ordof SCaC
ge
.1–
of t
flak
c st
gth
ate
agg
aCl
gate
mati
In a
35]
tter
ls a
arr
ater
dingwy
Cl2 0
of
–10
the
kes)
tren
h (0
int
greg
l2),
es l
ion
a sim
bu
are
and
rang
rials
gly ty-2 s0.1
por
µm
tot
) flo
ngth
0.1 M
to a
gate
wh
leav
of
mil
ut la
e in
in
gem
s).
to tsmeM
re d
m.
tal
occ
h (D
M N
agg
e vo
here
ving
a h
ar w
arge
n pro
3D
men
theiectisol
dim
voi
cula
DI w
NaC
greg
oid
e pa
g la
hier
way
er s
ogr
D mi
nt o
ir dite iluti
men
id d
ate
wat
Cl)
gate
s. T
artic
arge
rarc
y, th
stati
ress
icro
of sm
iamin:ion.
nsio
distr
into
ter)
, el
es,
Thi
cles
er i
chy
he v
istic
s.
ogra
mec
C
mete(A).
n s
ribu
o a
) dis
lect
div
is d
s ca
inte
ma
voi
cal
aph
ctite
C
er, c)- D
size
utio
3D
spla
trok
vidi
divi
an a
er-a
ay b
ids
dat
hs l
e fl
calcDI w
es d
on i
D ne
ay a
kine
ing
isio
app
aggr
be a
hie
ta m
ike
lake
culawat
defi
in f
etw
a m
etic
po
on i
proa
rega
a co
erarc
may
e sh
es a
atedter,
ned
func
work
most
c po
ore
incr
ach
ate
ons
chy
y be
how
and
d u(B)
d in
ctio
k. In
tly
oten
sp
reas
h ea
vo
sequ
y in
e ne
wn in
d flo
sing)- N
n [1
on o
n su
uni
ntia
ace
ses
ach
oid s
uen
n flo
eed
n F
ock
g NaC
1] f
of t
uch
ifor
al w
e in
wi
oth
spa
nce
ock
ded
Figu
s (3
Cl
for
the
h a
rm
was
nto
ith
her
ace
of
ked
to
ure
3D

Fig. 5- TXM 3D micrographs from the SWy-2 Wyoming smectite in: (A)- DI water, (B)- NaCl 0.1 M solution and (C)- CaCl2 M solution; scale bars 2,5 µm.
Flocks morphology in water and in the NaCl solution are similar and display uniform gelling,
where individual smectite flakes and ultra-aggregates of submicron sizes build cells, which may
be the first level of the structural hierarchy. The observed primary cellular structural elements
were up to 1 µm in diameter and formed chains (Fig. 5A & B), which may be the second element
in the structural hierarchy. On this level, the structure displays a strong linear chain orientation,
which seemed to form plaits as the third observed element in the structural hierarchy. Plaits made
of chain benches may form a super-structure of column-like elements of a few microns in
diameter. These structural elements on all the hierarchy levels look similar in DI water and NaCl
with a little smaller cellular and chains diameter were observed in NaCl solution.
The smectite sample in CaCl2 (Fig. 5C) suspension displays a lesser-order in structural
elements orientation and much broader diameter distribution of these structural elements
(particles, their aggregates and voids). The cellular voids are less regular in morphology and
display a broad range of shapes and diameters with most primary voids below 400 nm. Short
chains constituted of more compacted aggregates and a population of large and elongated inter-
aggregate voids can be commonly observed.
The particle/flock dimension, calculated from TXM stereo images using STIMAN technique,
gives interesting comparative data, as seen in Fig. 6. This graph shows that the flock dimension
in the NaCl solution is smaller (median value 312 nm) than in the CaCl2 solution (median value
483 nm). The flock dimension range is wider in the CaCl2 solution (3.4 µm) than in the NaCl
solution (2.35 µm). The slope is similar in both salt solutions. About 10% of measurements
confirmed particles/flocks below 100 nm in diameter in the NaCl solution when the same portion
of particles/flocks in the CaCl2 solution was twice as large and below 200 nm in diameter.

Fig. 6- Comparison of the flock diameters calculated from TXM 3D images of the SWy-2 smectite in the NaCl 0.1 M and CaCl2 0.1 M solutions.
The slope looks low in both solutions, for particles below 200 nm in diameter, which may
testify to primary coagulation from individual particles and aggregates. Larger slope value,
between 200–2000 nm, may indicate a wide range of flock diameters in this division. Visible
undulations on size cumulative curves in Fig. 6 may indicate the hierarchic composition of
flocks.
3.3. Cryogenic transmission electron microscope results.
The resolution in TXM micrographs is about 60 nm or even lower due to particle movement
during the relatively long exposure time when the picture was captured (60–240 secs). This
makes it, in many instances, difficult to judge from the micrographs more detail about contact
between smectite flakes within aggregates, which form the basic structural elements in gelled
clay suspension.
0
10
20
30
40
50
60
70
80
90
100
0.010 0.100 1.000
Per
cent
fin
er
Flock diameter in µm
NaClCaCl2
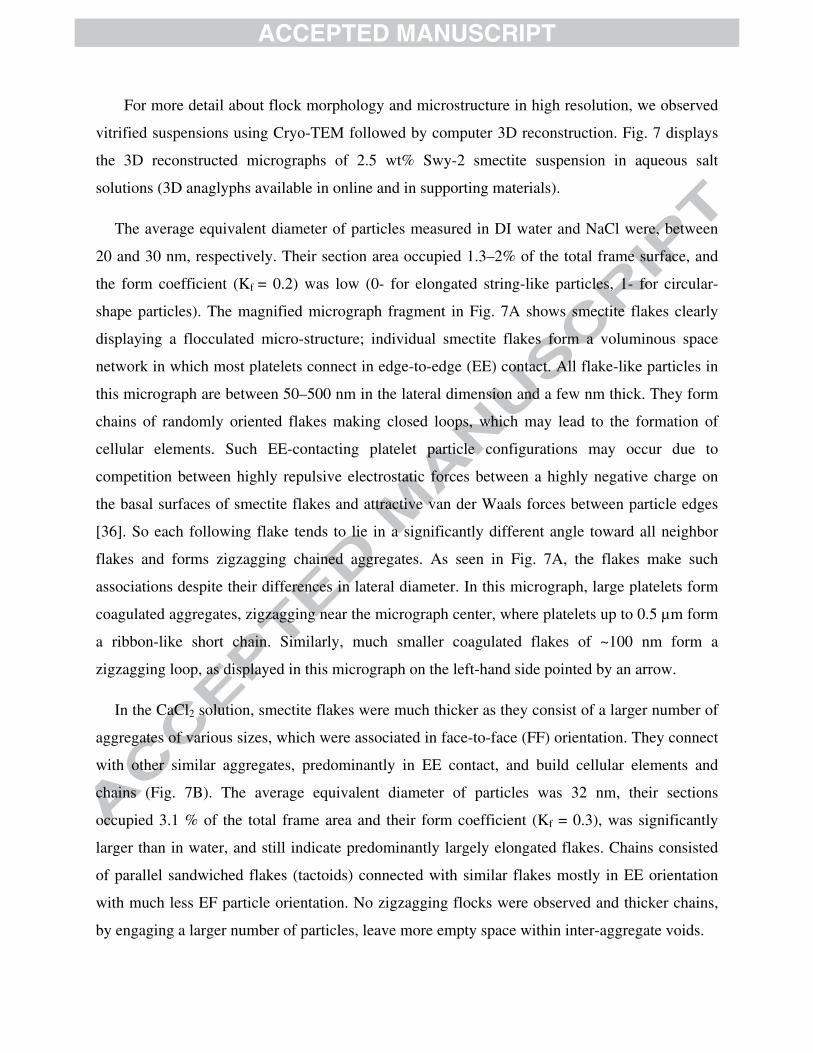
For more detail about flock morphology and microstructure in high resolution, we observed
vitrified suspensions using Cryo-TEM followed by computer 3D reconstruction. Fig. 7 displays
the 3D reconstructed micrographs of 2.5 wt% Swy-2 smectite suspension in aqueous salt
solutions (3D anaglyphs available in online and in supporting materials).
The average equivalent diameter of particles measured in DI water and NaCl were, between
20 and 30 nm, respectively. Their section area occupied 1.3–2% of the total frame surface, and
the form coefficient (Kf = 0.2) was low (0- for elongated string-like particles, 1- for circular-
shape particles). The magnified micrograph fragment in Fig. 7A shows smectite flakes clearly
displaying a flocculated micro-structure; individual smectite flakes form a voluminous space
network in which most platelets connect in edge-to-edge (EE) contact. All flake-like particles in
this micrograph are between 50–500 nm in the lateral dimension and a few nm thick. They form
chains of randomly oriented flakes making closed loops, which may lead to the formation of
cellular elements. Such EE-contacting platelet particle configurations may occur due to
competition between highly repulsive electrostatic forces between a highly negative charge on
the basal surfaces of smectite flakes and attractive van der Waals forces between particle edges
[36]. So each following flake tends to lie in a significantly different angle toward all neighbor
flakes and forms zigzagging chained aggregates. As seen in Fig. 7A, the flakes make such
associations despite their differences in lateral diameter. In this micrograph, large platelets form
coagulated aggregates, zigzagging near the micrograph center, where platelets up to 0.5 µm form
a ribbon-like short chain. Similarly, much smaller coagulated flakes of ~100 nm form a
zigzagging loop, as displayed in this micrograph on the left-hand side pointed by an arrow.
In the CaCl2 solution, smectite flakes were much thicker as they consist of a larger number of
aggregates of various sizes, which were associated in face-to-face (FF) orientation. They connect
with other similar aggregates, predominantly in EE contact, and build cellular elements and
chains (Fig. 7B). The average equivalent diameter of particles was 32 nm, their sections
occupied 3.1 % of the total frame area and their form coefficient (Kf = 0.3), was significantly
larger than in water, and still indicate predominantly largely elongated flakes. Chains consisted
of parallel sandwiched flakes (tactoids) connected with similar flakes mostly in EE orientation
with much less EF particle orientation. No zigzagging flocks were observed and thicker chains,
by engaging a larger number of particles, leave more empty space within inter-aggregate voids.
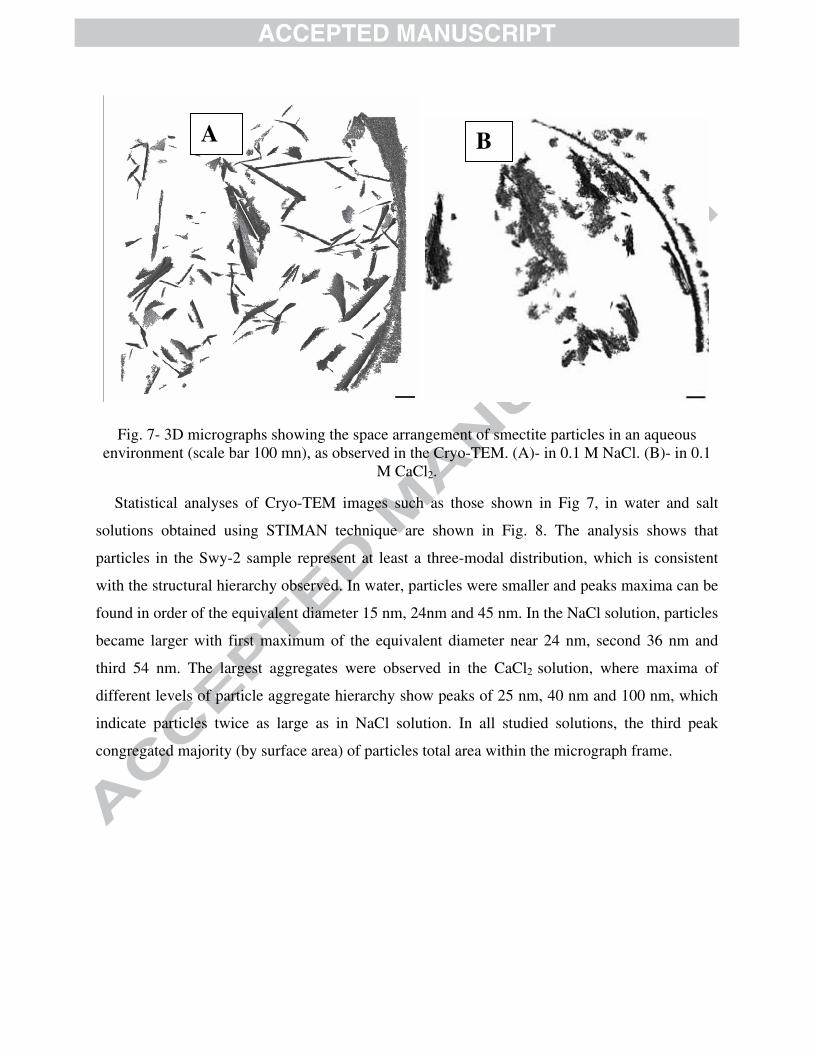
Fig. 7- 3D micrographs showing the space arrangement of smectite particles in an aqueous environment (scale bar 100 mn), as observed in the Cryo-TEM. (A)- in 0.1 M NaCl. (B)- in 0.1
M CaCl2.
Statistical analyses of Cryo-TEM images such as those shown in Fig 7, in water and salt
solutions obtained using STIMAN technique are shown in Fig. 8. The analysis shows that
particles in the Swy-2 sample represent at least a three-modal distribution, which is consistent
with the structural hierarchy observed. In water, particles were smaller and peaks maxima can be
found in order of the equivalent diameter 15 nm, 24nm and 45 nm. In the NaCl solution, particles
became larger with first maximum of the equivalent diameter near 24 nm, second 36 nm and
third 54 nm. The largest aggregates were observed in the CaCl2 solution, where maxima of
different levels of particle aggregate hierarchy show peaks of 25 nm, 40 nm and 100 nm, which
indicate particles twice as large as in NaCl solution. In all studied solutions, the third peak
congregated majority (by surface area) of particles total area within the micrograph frame.
A B
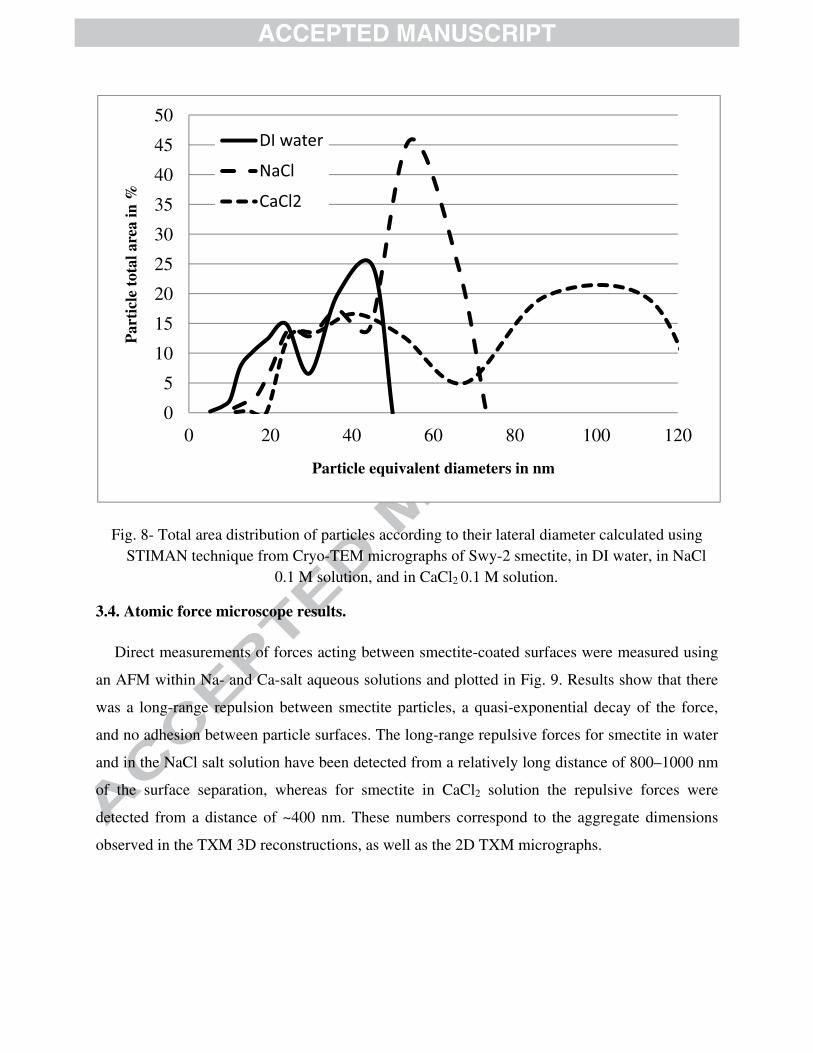
Fig. 8- Total area distribution of particles according to their lateral diameter calculated using STIMAN technique from Cryo-TEM micrographs of Swy-2 smectite, in DI water, in NaCl
0.1 M solution, and in CaCl2 0.1 M solution.
3.4. Atomic force microscope results.
Direct measurements of forces acting between smectite-coated surfaces were measured using
an AFM within Na- and Ca-salt aqueous solutions and plotted in Fig. 9. Results show that there
was a long-range repulsion between smectite particles, a quasi-exponential decay of the force,
and no adhesion between particle surfaces. The long-range repulsive forces for smectite in water
and in the NaCl salt solution have been detected from a relatively long distance of 800–1000 nm
of the surface separation, whereas for smectite in CaCl2 solution the repulsive forces were
detected from a distance of ~400 nm. These numbers correspond to the aggregate dimensions
observed in the TXM 3D reconstructions, as well as the 2D TXM micrographs.
0
5
10
15
20
25
30
35
40
45
50
0 20 40 60 80 100 120
Par
ticl
e to
tal a
rea
in %
Particle equivalent diameters in nm
DI water
NaCl
CaCl2
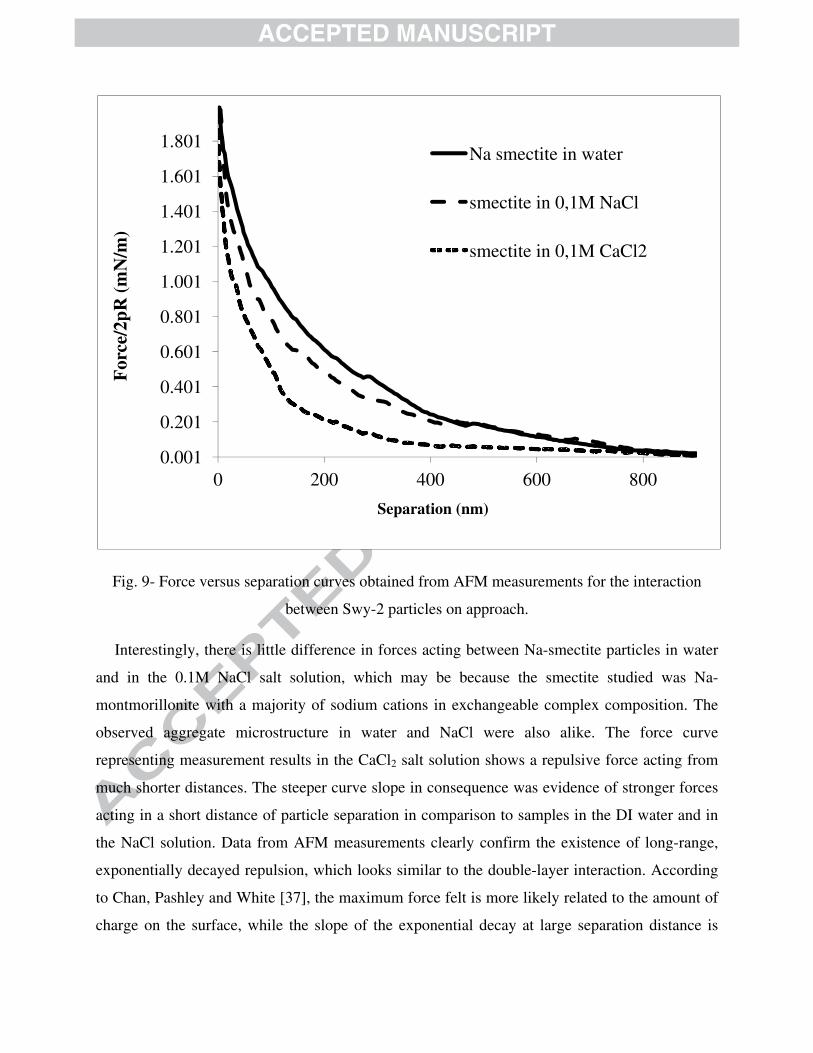
Fig. 9- Force versus separation curves obtained from AFM measurements for the interaction
between Swy-2 particles on approach.
Interestingly, there is little difference in forces acting between Na-smectite particles in water
and in the 0.1M NaCl salt solution, which may be because the smectite studied was Na-
montmorillonite with a majority of sodium cations in exchangeable complex composition. The
observed aggregate microstructure in water and NaCl were also alike. The force curve
representing measurement results in the CaCl2 salt solution shows a repulsive force acting from
much shorter distances. The steeper curve slope in consequence was evidence of stronger forces
acting in a short distance of particle separation in comparison to samples in the DI water and in
the NaCl solution. Data from AFM measurements clearly confirm the existence of long-range,
exponentially decayed repulsion, which looks similar to the double-layer interaction. According
to Chan, Pashley and White [37], the maximum force felt is more likely related to the amount of
charge on the surface, while the slope of the exponential decay at large separation distance is
0.001
0.201
0.401
0.601
0.801
1.001
1.201
1.401
1.601
1.801
0 200 400 600 800
For
ce/2
pR (
mN
/m)
Separation (nm)
Na smectite in water
smectite in 0,1M NaCl
smectite in 0,1M CaCl2

more related to the Debye length. However such long-range forces are hundreds of times larger
than may be expected and cannot be explained on the basis of the Debye length only and was
suggested having rather steric origin [18]. The measured repulsive forces may in fact represent
structural network resistance against compression when smectite-coated surfaces approach each
other in AFM measurements. These distances were also consistent with the dimensions of
primary aggregates observed by the TXM method.
3.5. Discussion of the possible mechanism of the structure-building phenomenon.
Nano-size particles are the most likely cause of this structure-building phenomenon [38]. It
was found that a concentration of only 1 to 1.5 vol.% of nano particles is required to produce a
space-filling, gel network. The presence of extremely small particles in a suspension, which is
associated with smectites as observed in TEM, our morphology characterization, and STIMAN
calculation, may enhance flocculation of the sample. It has been observed [39, 40] that larger
particles were arrested within a voluminous network of nano-clays in gelled suspension or
flocks. The consequence of reducing the zeta potential within dense, clay-rich suspension is the
generation of a gel with a high water-holding capacity. Within fractions containing particles of
diameters less than 200 nm, suspended in 0.1 M NaCl solution, gelatin was instantaneous. Such
gelled suspensions are most likely preventing particles from free settling.
From our TXM results on smectite clay suspension (SWy2), in water and in the NaCl solution,
we found that 10% of particles have approximately 100 nm dimension, which placed them
within nano size particles. In the CaCl2 solution, particles build larger aggregates and only about
3% fall into 100 nm size, which is enough for initiating spontaneous and almost instant
flocculation within suspension. About 10% of the particles have a dimension below 200 nm,
which also triggers almost instant flocculation in the salt solution. Thus, our samples, under a
size fraction condition, did have the ability to form a space network and subsequently gels.
Though this structure-building phenomenon has been studied in numerous contributions, it is
still poorly understood in colloid science. It is also affecting electrokinetic phenomena, where
particles involved lose their mobility within suspension. Such an effect, virtually unknown in
colloid science, was described by Dukhin [41] when observing clear transformation from sol to
gel in dilute carbon nano-tubes suspension during electroacoustic measurements.

The mechanism responsible for the observed structure formation in aqueous suspension of
dispersed smectite has been observed before [12, 13] and may originate of competition between
repulsive electric repulsion forces and attractive van der Waals forces as predicted by DVLO
theory. Smectite flakes carry high electric potential as the zeta potential measurements show
values of -61 mV in DI water and -44 mV in NaCl solution (Table 1). The flakes experienced
strong electric repulsion forces when approaching each other in FF orientation.
The high particle aspect ratio make edge surface contribution toward the total surface area
insignificant. The small surface area of smectite thin flake edges cause relatively low
electrostatic repulsion in EE particles orientation. Therefore, the van der Waals attractive forces
may prevail and EE contacts between smectite thin flakes become favorable in such a colloidal
system. In such an arrangement, particle forms spanned a 3D network of maximum space
between particles. Such a network stays stable as platelets support each other with electrostatic
force and their own flake elasticity against a much weaker gravity force. In effect the suspension
in which such a network was formed resists settling.
Larger aggregates mostly in FF-oriented sheets observed in the CaCl2 solution in Fig. 8B
display in higher magnification face to edge (FE) coagulation contacts within aggregates.
Distances up to 15-45 nm were measured between individual parallel-oriented flakes which build
tactoid. Such aggregate microstructure was the result of a relatively lower zeta potential (-12.6
mV). In such close proximity between platelets, where observed in Cryo-TEM micrographs,
contacts were FF, EF and EE. Flakes within coagulated aggregates appeared to be in FF contact,
in a similar way to that proposed by Weiss and Frank [42] in the “Bander-model.”
The nature of the observed large-scale flake orientation through full suspension in DI water,
and the Na and Ca salt solutions is not yet clear but may originate from the newly discovered
electromagnetic interaction between clay platelets, similar to that displayed in liquid crystals.
This effect in clay suspension was recently described [43, 44, 45, 46, 47, 48], where the liquid–
crystalline character was evidenced by polarized light microscopy in small-angle x-ray scattering
observations. These experiments on smectite clay-based gel samples revealed strong positional
and orientation orders of the particles, proving unambiguously the nematic character of the gel
and thus clearly suggesting the need to revise Goldshmidt’s [11] old ‘‘house of cards’’ structure
model with the “net of flakes” model described here. Having this conclusion in mind, this

general description of the behavior of smectite clay particles within aqueous suspension must be
taken into account and is worthy of further study as a possible industrial application is likely to
follow.
4. Conclusions.
The arrangement of the pores between micro-particles is very important in determining the
physical and mechanical parameters of soils and soil slurries. These parameters play a major role
in dams, footings, colloidal stability, and the dewatering of soil slurries.
The hypothesis is that the formation of structured networks within a gel or flocculated
suspension of clay particles hinders the deformation of particles and encapsulates water within
the cellular structure. This is the prime cause of a suspension’s resistance to settling and
dewatering, particularly for clay mineral-rich slurries [1-4]. Despite much effort being paid to
micro-structural studies worldwide, the settling and dewatering of soil slurries remains poorly
understood. This hypothesis was inspired by the early work of McEwen [12 & 13], in which the
formation of a three-dimensional particle network within a momtmorillonite suspension was
predicted from experimental results.
The current study found the following:
1. The morphology of smectite particles resembled flexible flakes a few nm to µm in
diameter. These particles, spontaneously from a three-dimensional framework when
dispersed in an aqueous solution.
2. A new pattern of particle networking was observed, in which clay flakes in edge-to-edge
contact formed voluminous, rimmed chains zigzagging in 1–3 µm long twisted strings.
This peculiar structural arrangement of smectite flakes formed spiralling short chains
known as ribbons.
3. This particle networking led to the formation of a light gel. A new micro-structural model
of a "Net of Flakes" of flocculated smectite was proposed. The proposed model is based
on direct observations of the clay suspension in an aqueous solution, using X-Ray and
electron microscopes.

4. The light gel can be distinguished from a soil suspension by the presence of a clear
supernatant layer. The light gel can be inert like the soil suspension and unlike the high
viscosity gel that resembles a viscous paste.
5. Porosity measured from TXM micrographs showed an almost uniform void distribution
within the gel in a low ionic strength solution. Increasing ionic strength results in the
decay of pore uniformity and the development of hierarchic voids. The phase separation
became more apparent when the ionic strength of the solution increased.
6. The water-encapsulating voids observed within the gel were mostly well below 1000 nm
in diameter, and most of the water entrained within the network was immobilised.
7. Large micro-aggregates were observed in CaCl2 solution, in which the clay platelets
appeared to be arranged in face-to-face configurations, with edge-to-face coagulation
contacts within the tactoids.
These findings appear to confirm the formation of three-dimensional structured networks
within a gel or flocculated suspension, which may prevent the clay particles and aggregates from
settling under gravity and lead to poor dewatering. In this study, the three-dimensional
arrangement of the clay particles was observed in water and within moderately salty (NaCl)
aqueous solution. The clay micro-aggregate flakes were arranged in a spanned network forming
an elastic framework, mostly or exclusively having edge-to-edge contacts. These smectite flakes
were not in parallel, but were twisted towards each other and formed zigzagging bent chains.
This finding supports the proposed model of a “net of flakes” as a best fit to observations made
of the smectite-rich suspensions. The high content of nano-particles in the smectite suspensions
may enhance flocculation and be an important factor in the formation of the observed structural
arrangement. The network remained stable because the suspension resists settling due to the
platelets supporting each other against the much weaker gravity force. Smectite ultra-micro
aggregated flakes (nano-clays) were small in water and produced larger aggregates in the salt
solution, with the average particle equivalent diameter being ~18–27–32 nm in deionised water–
NaCl–CaCl2 solutions, respectively.
The observed micro-structural model was closely related to the house-of-cards model
proposed by Goldschmidt in 1926 [11], but remarkably different. Goldschmit proposed that for
undisturbed and young clay sediments, the flaky clay minerals are arranged in a "house-of-cards"

structure with edge-to-face contacts. In the proposed model, because of the high aspect ratio of
the smectite flakes, competition between electrostatic repealing forces and attractive van der
Waals forces cause the observed platelet arrangement.
The proposed model differs from the "house-of-cards" model because it applies to an
aqueous suspension rather than a sediment. It represents the first stage of phase separation
(dewatering), in which the water parts from the mineral phase. The suspension forms a weak,
unstable gel, in which the particles resist settling.
The proposed "net of flakes" model also differs from the "honeycomb" structure proposed
by Terzaghi in 1925 and Casagrande 1932 [9, 10], since a complex, non-uniform, multi-
hierarchic flocculated structure, with characteristic cellular chain networking is involved. The
observed chained, ultra-micro aggregates build cellular structural elements that are up to 1 µm in
diameter in water and NaCl solution. These cells enclose the aqueous solution. In CaCl2, these
structural elements were up to 400 nm in diameter and more robust, which may result in a
stronger force.
The water-encapsulating voids observed within the gel were mostly well below 1000 nm in
diameter, and most water retained within the network was immobilised. Despite the broadening
of the larger pores with increasing solution ionic strength, most of the pore water was likely
entrained within the nano-pores. This finding explains why dewatering of such suspensions is a
complex and difficult task. Attempts to destabilise the network to remove water leads to the
mobilisation of the nano-clay particles, which may instantly rebuild the gel. Larger micro-
aggregates were observed in the CaCl2 solution. These were arranged in parallel and are of low
density, with 15-45 nm water layers between flakes. The aggregates appeared to have edge-to-
edge contacts.
Further investigation of the proposed model will focus on the structural transition of the
smectite suspension from a low viscosity gel to a stable, high viscosity gel. The understanding
gained may lead to the development of a comprehensive model of clay suspension behaviour.
Such an understanding is important in facilitating faster settling of particle aggregates,
dewatering and water clarification, which has important implications for the management of clay
mineral-rich mine tailings.
ACKNOWLEDGMENTS: This work was supported by the Australian Synchrotron Research
Program (ASRP) and partly funded by the ACARP Project C20047. The authors acknowledge
the facilities, and the scientific and technical assistance of the Australian Microscopy &
Microanalysis Research Facility at the Centre for Microscopy and Microanalysis, The University
of Queensland. Elite Editing thanks for professional service in spell check, grammar and editing
article text.
References:
[1] Osipov VI, Sokolov VN. Clays and Their Properties. Composition, structure, and formation
of properties – Moscow (in RUSS): GEOS. 2013;576 .
[2] Zbik M, Smart RStC. Nanomorphology of Kaolinites: Comparative SEM and AFM Studies.
Clays and Clay Minerals. 1998;46:2:153-160.
[3] Bowles F A. Microstructure of sediments: Investigation with ultrathin sections. Science
1968;159:1236–1237.
[4] Van Olphen H. An Introduction to Clay Colloid Chemistry; Interscience Publishers: New
York, 1963.
[5] Derjaguin BV, Landau LD. Theory of the Stability of Strongly Charged Lyophobic Sols and
of the Adhesion of Strongly Charged Particles in Solutions of Electrolytes.
ActaPhysicochim. URSS 1941;14:633-652.
[6] Verwey EJW, Overbeek JTG.1948.The Theory of Stability of Lyophobic Colloids, Elsevier,
Amsterdam, Netherlands.
[7] Smart P, Tovey NK. Electron Microscopy of Soils and Sediments: Techniques. Clarendon
Press, Oxford, 1982.
[8] Żbik M, Smart RStC, Morris GE. Kaolinite flocculation structure. Journal of Colloid and
Interface Science 2008;328:73–80.
[9] Terzaghi K. Erdbaummechanik auf BodenphysikalischerGrundlage; Franz Deuticke Press:
Leipzig 1925.
[10] Casagrande AJ. The structure of clay and its importancein foundation engineering. Boston
Soc. CiVil Eng. 1932;19:168–208.
[11] Goldshmidt VM. Undersokelser over lersedimenter. Nord.Jordbrugsforsk 1926;4-7:434–
445.
[12] McEwen M.B. The Gelation of Montmorillonite. Amer. Min. 1950; 35:166-172.
[13] McEwen M.B., Pratt M.I. The Gelation of Montmorillonite Part 1.- The Formation of a
Framework in Sols of Wyoming Bentonite. Trans. Faraday Soc. 1957; 53:535-547.
[14] Bowles FA. Microstructure of sediments: Investigation with ultrathin sections. Science
1968;159:1236–1237.
[15] Pusch R. Clay Microstructure. National Swedish Building Research, Document D8, 1970.
[16] O’Brien NR. Fabric of kaolinite and illite floccules. Clays Clay Miner. 1971;19:353–359.

[17] Kotlyar LS, Sparks BD, LePage Y, Woods JR. Effest of particle size on the flocculation
behaviour of ultra-fine clays in salt solution.Clay Minerals 1998;33:103-107.
[18] Zbik MS, Martens W, Frost RL, Song Y-F, Chen Yi-M, Chen J-H. Transmission X-ray
Microscopy (TXM) reveals nano-structure of smectite gel. Langmuir 2008;24:8954-8958.
[19] Morris GE, Żbik MS. Smectite suspension structural behaviour. International Journal of
Mineral Processing 2009;93:20-25.
[20] Żbik MS, Song Y-F, Frost R.L, Wang Ch-Ch. Transmission X-ray Microscopy—A New
Tool in Clay Mineral Floccules Characterization. Minerals 2012;2:283-299.
[21] Van Olphen H, Fripiat J J. 1979. Data Handbook for Clay Materials and Other Non-Metallic
Minerals.Pergamon Press: Oxford, UK; 183.
[22] Hunter RJ. Zeta Potential in Colloids Science, Academic Press, NY 1981.
[23] Lyklema J. Lyotropic sequences in colloid stability revisited. Colloids and Surfaces A:
Physicochem. Eng. Aspects 2003;222:5-14
[24] Minor M, van der Linde AJ, Leeuwen HP, Lyklema J. Aspects of Electrophoresis and
Electroosmosis: A New Fast Method for Measuring Particle Mobilities. J. colloid and
interface sci. 1997;189:370–375.
[25] Attwood D. Nanotomography comes of age. Nature 2006;442:642–643.
[26] Yin G C, Tang MT, Song YF, Chen FR, Liang KS, Duewer FW, Yun W, Ko DH, Shieh H-
PD. Energy-tunable transmission x-ray microscope for differential contrast imaging with
near 60 nm resolution tomography. Appl. Phys. Lett. 2006;88:241115- 1–241115-3.
[27] Sergeev YM, Spivak GV, Sasov AY, Osipov VI, Sokolov VN, Rau EI. Quantitative
morphological analysis in a SEM microcomputer system I Quantitative shape analysis of
single objects. J. Microsc. 1983;135:1–12.
[28] Sergeev YM, Spivak GV, Sasov AY, Osipov VI, Sokolov VN, Rau EI. Quantitative
morphological analysis in a SEM microcomputer system II. Morphological analysis of
complex SEM images. J. Microsc. 1983;135:13–24.
[29] Sokolov VN, Yurkovets DI, Ragulina OV, Mel’nik VN. Study of characteristicks of rocks
microstructure with aid of SEM micrographs analyse. Bull. Russ. Acad. Sci. Phys.
2004;68:1491–1497.

[30] Sokolov VN, Razgulina OV, Yurkovets DI, Chernov MS. Quantitative Analysis of Pore
Space of Moraine Clay Soils by SEM. Journal of Surface Investigation. X-ray, Synchrotron
and Neutron Techniques, 2007;1:4:417–422.
[31] Beutelspacher H, van der Marel HW. Atlas of Electron Microscopy of Clay Minerals amd
their Admixtures. A Picture Atlas. Elsevier Publishing Company. Amsterdam-London_New
York.1968.
[32] Ferrage E, Lanson BL, Sakharov BA, Drits VA. Investigation of smectite hydration
properties by modelling experimental X-ray diffraction patterns: Part I. Montmorillonite
hydration properties. American Mineralogist 2005; 90:1358-1374.
[33] Zhang Li-M. Fractal characteristics of granularity distributions of aqueous bentonite and
bentonite–polymer muds. Colloid and Surfaces A: Physicochemical and Engineering
Aspects 2002;202:1–7.
[34] Yongfu Xu, Xiaohe Xia. Fractal model for virgin compression of pure clays. Mechanics
Research Communications 2006;33:206–216
[35] Benna-Zayani M, Mgaidi A, Stambouli M, Kbir-Ariguib N, Trabelsi-Ayadi M, Grossiord
JL. Fractal nature of bentonite–water–NaCl gel systems evidenced by viscoelastic
properties and model of gels. Applied Clay Science 2009;46:260–264
[36] Dathe A, Eins S, Niemeyer J, Gerold G. The surface fractal dimension of the soil–pore
interface as measured by image analysis. Geoderma 2001;103:203–229
[37] Żbik MS, Williams DJ, Song Y-F, Wang Ch-Ch. Smectite Clay Flocculation Structure the
Direct Observation in Moderate Concentration Salt Solutions. (Submitted)
[38] Chan DYC, Pashley RM, White LR. A Simple algorithm for the calculation of the
electrostatic repulsion between identical charged surfaces in electrolyte. J. Colloid Interface
Sci.1980;77:283-285.
[39] Kotlyar LS, Sparks BD, Schutte R. Effect of salt on the flocculation behavior of nano
particles in oil sand fine tailings. Clay and Clay Minerals. 1996;44:1:121-131.
[40] Kotlyar LS, Sparks BD, LePage Y, Woods JR. Effect of particle size on the flocculation
behaviour of ultra-fine clays in salt solutions. Clay Minerals 1998;33:103-107
[41] Dukhin AS. Observation of sol–gel transition for carbon nanotubes using electroacoustics:
Colloid vibration current versus streaming vibration current. Journal of Colloid and Interface
Science 2007;310:270–280

[42] Weiss A, Frank R. Uber den Bau der Geriiste in thixotropen Gelen. Naturforsch
1961;16:141.
[43] Paineau E, Dozov I, Bihannic I, Baravian Ch, Krapf M-E M, Philippe A-M, Rouzière S,
Michot LJ, Davidson P. In-situ SAXS Study of Aqueous Clay Suspensions Submitted to
Alternating Current Electric Fields. ACS Appl. Mater. Interfaces 2012;4:4296−4301
[44] Michot LJ, Baravian Ch, Bihannic I, Maddi S, Moyne Ch.Duval JeF L, Levitz P, Davidson
P. Sol#Gel and Isotropic/Nematic Transitions in Aqueous Suspensions of Natural
Nontronite Clay. Influence of Particle Anisotropy. 2. Gel Structure and Mechanical
Properties. Langmuir 2009;25:127-139.
[45] Paineau E, Dozov I, Philippe A-M, Bihannic I, Meneau F, Baravian Ch, Michot LJ,
Davidson P. Tailoring Highly Oriented and Micropatterned Clay/Polymer Nanocomposites
by Applying an a.c. Electric Field. J. Phys. Chem. B 2012;116:13516−13524.
[46] Paineau E, Antonova K, Baravian C, Bihannic I, Davidson P, Dozov I, Impe´ror-Clerc M,
Levitz P, Madsen A, Meneau F, Michot LJ. Liquid-Crystalline Nematic Phase in Aqueous
Suspensions of a Disk-Shaped Natural Beidellite Clay. J. Phys. Chem. B 2009;113:15858–
15869.
[47] Dozov I, Paineau E, Davidson P, Antonova K, Baravian C, Bihannic I, Michot LJ. Electric-
Field-Induced Perfect Anti-Nematic Order in Isotropic Aqueous Suspensions of a Natural
Beidellite Clay. J. Phys. Chem. B. 115 (2011) 7751–7765.
[48] Gabriel J-ChP, Sanchez C, Davidson P. Observation of Nematic Liquid-Crystal Textures in
Aqueous Gels of Smectite Clays. J. Phys. Chem. 1996;100:11139-11143.

FIGURE CAPTIONS
Fig. 1 (A)- TEM micrograph of a smectite flexible flake. (B)- SEM micrograph of a wrinkled,
highly flexible smectite sheet when drying. (C)- AFM micrographs show smectite flakes with
one fundamental unit steps. (D)- EDX spectrum shows large asymmetry of Al and Si peaks
intensity.
Fig. 2- The XRD pattern of the SWy-2 clay fraction sample displays smectite composition.
Fig. 3- A 2D TXM micrograph of the SWy-2 Wyoming smectite in: (A)- DI water, (B)-NaCl 0.1
M solution and (C)-CaCl2 0.1 M solution; scale bars 1 µm.
Fig. 4- The total area distribution of voids accordingly to their diameter, calculated using
STIMAN technique from TXM micrographs of Swy-2 smectite in: (A)- DI water, (B)- NaCl 0.1
M solution, (C)- CaCl2 0.1 M solution.
Fig. 5- TXM 3D micrographs from the SWy-2 Wyoming smectite in: (A)- DI water, (B)- NaCl
0.1 M solution and (C)- CaCl2 M solution; scale bars 2,5 µm.
Fig. 6- Comparison of the flock diameters calculated from TXM 3D images of the SWy-2
smectite in the NaCl 0.1 M and CaCl2 0.1 M solutions.
Fig. 7- 3D micrographs showing the space arrangement of smectite particles in an aqueous
environment (scale bar 100 mn), as observed in the Cryo-TEM. (A)- in 0.1 M NaCl. (B)- in 0.1
M CaCl2.
Fig. 8- Total area distribution of particles according to their lateral diameter calculated using
STIMAN technique from Cryo-TEM micrographs of Swy-2 smectite, in DI water, in NaCl 0.1 M
solution, and in CaCl2 0.1 M solution.
Fig. 9- Force versus separation curves obtained from AFM measurements for the interaction
between Swy-2 particles on approach.
CONTENTS:
Abstract
1. Introduction.
2. Materials and Methods.

3. Results and discussion.
3.1. General characterization.
3.2. Transmission x-ray microscope results.
3.3. Cryogenic transmission electron microscope results.
3.4. Atomic force microscope results.
4. Conclusions.
Acknowledgment
References
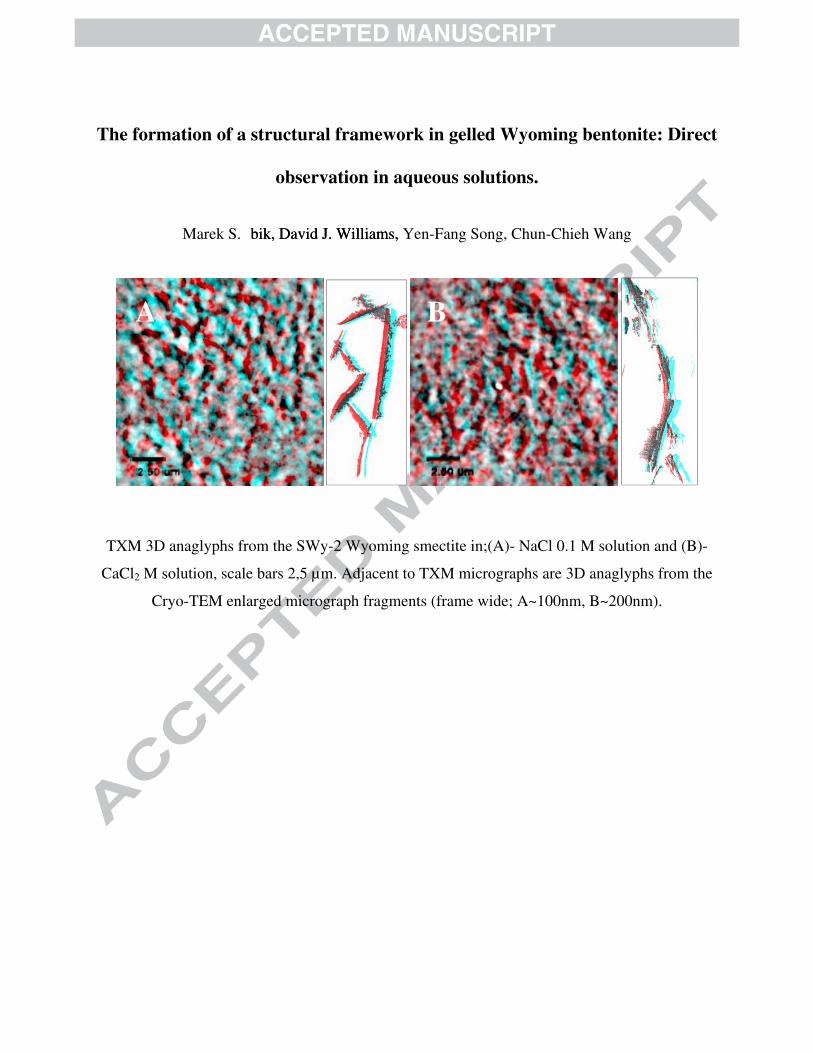
The formation of a structural framework in gelled Wyoming bentonite: Direct
observation in aqueous solutions.
Marek S. bik, David J. Williams,bik, David J. Williams, Yen-Fang Song, Chun-Chieh Wang
TXM 3D anaglyphs from the SWy-2 Wyoming smectite in;(A)- NaCl 0.1 M solution and (B)-
CaCl2 M solution, scale bars 2,5 µm. Adjacent to TXM micrographs are 3D anaglyphs from the
Cryo-TEM enlarged micrograph fragments (frame wide; A~100nm, B~200nm).
BA

Highlights
• Microstructural investigation of smectite clay in aqueous solutions was conducted.
• New type of microstructure model in clay suspension “net of flakes" was proposed.
• Larger aggregates in CaCl2 solution show FF stacking with EF coagulation contacts.
• Most water retained within the network was immobilized resists dewatering attempts.