the flow and mass transfer characteristics of …
TRANSCRIPT
Chemical Industry & Chemical Engineering Quarterly
Available on line at Association of the Chemical Engineers of Serbia AChE www.ache.org.rs/CICEQ
Chem. Ind. Chem. Eng. Q. 27 (1) 57−68 (2021) CI&CEQ
57
HUIBO MENG1
ZHONGGEN LI1 YANFANG YU1
MENGQI HAN1 SHUNING SONG2
XIUHUI JIANG1 ZONGYONG WANG1
JIANHUA WU1 1Engineering and Technology Research Center of Liaoning Province for Chemical Static-
Mixing Reaction, School of Mechanical and Power
Engineering, Shenyang University of Chemical Technology,
Shenyang, P.R. China 2School of Chemistry and Molecular Bioscience, the University of Queensland,
Brisbane, Australia
SCIENTIFIC PAPER
UDC 66.023.3:66.063.8:66.07:004
THE FLOW AND MASS TRANSFER CHARACTERISTICS OF CONCENTRIC GAS-LIQUID FLOW IN AN ADVANCED STATIC MIXER
Article Highlights • The dynamic characteristics of concentric gas-liquid bubbly flow in the FKSM were
studied • The mass transfer and enhancement characteristics in the FKSM were evaluated • The secondary vortexes were distinguished based on the radial holdup and axial
velocity profiles Abstract
The fluid dynamic and mass transfer characteristics of concentric upward gas-–liquid flow were studied in an industrial static mixer with four equally spaced helical inserts (FKSM). The numerical simulations of the gas volume fraction in a Kenics mixer was in good agreement with the numerical and experimental results provided by Rabha et al. The characteristics of radial gas void fraction and local mass transfer coefficients in the FKSM were evaluated under differ-ent operating conditions. The velocity profiles of the concentric air phase accelerated by the bubble forces first became sharp and narrow until z/l == -3.27 and then slowly decreased and stabilized at z/l = -1.5 before entering the first mixing element. Some extra unimodal profile of radial gas holdup gra-dually generated near the rectangle cross-sections of the mixing elements. The αG gradually enlarged from r/R = 0.2 to r/R = 0.55 and then weakened fromr/R = 0.65 to r/R = 0.874. The air void fractions in the bulk flow region dec-reased with the increasing initial uniform bubble diameter. The inlet effect of the first leading edge enhanced the air phase dispersion and local mass trans-fer coefficients sharply increased from 2.04 to 3.69 times of that in the inlet. The local mass transfer coefficients in each mixing group had unimodal profiles.
Keywords: static mixer, multi-helical inserts, upward gas-liquid flow, gas void fraction, local mass transfer coefficients.
Multiphase flows occur in a great variety of nat-ural phenomena and technical processes [1,2]. Dis-tribution and dispersion mixing of fluids as important unit operations of fine chemical, polymerization pro-cesses, pharmaceutical industry, bio-chemical and other chemical production processes play a very imp-ortant role in the success or failure of industrial pro- Correspondence: Y. Yu, Engineering and Technology Research Center of Liaoning Province for Chemical Static-Mixing Reaction, School of Mechanical and Power Engineering, Shenyang Uni-versity of Chemical Technology, Shenyang, P. R. China. E-mail: [email protected] Paper received: 13 December, 2019 Paper revised: 1 June, 2020 Paper accepted: 13 July, 2020
https://doi.org/10.2298/CICEQ191213024M
cesses [3-6]. It is well known that the bubble column, mechanically stirred vessels and static mixers are usually employed in multi-phase mixing unit operat-ions. The dynamic mixing device is typically used in an intermittent production process and the static mixer is used in a continuous production process. The static mixer can complete the mixing task only by much lower energy consumption for pressure drop. They have a number of advantages over dynamic mixers, such as having no moving parts, low cost of installation and operation, easy installation, increas-ing the mass transfer coefficient for gas-liquid mixing. It is widely known that a static mixer could be used in broad operation conditions including laminar flow, creeping flow and turbulent flow [1,6]. Increasing

H. MENG et al.: THE FLOW AND MASS TRANSFER CHARACTERISTICS… Chem. Ind. Chem. Eng. Q. 27 (1) 57−68 (2021)
58
interest in chemical process intensification during the past years improves online static mixers as an attract-ive choice compared to the bubble column and mech-anically stirred tanks [7].
Woven wire meshes have been employed in a multitude of flow operations and more sophisticated operations as static mixers in multiphase reactors/ /contactors [8,9]. In chemical reactors/contactors, screens have been successfully employed to promote multiphase contacting between phases to enhance mass transfer and/or reaction operations [10-13]. Volumetric mass transfer coefficient and oxygen transfer rate in a static mixer with screen-type ele-ments could be as high as 0.44 s-1 and 4.2 kg/kWh when liquid superficial velocity was up to 2.0 m/s and gas holdups as high as 0.15 [10]. Azizi and Al Taweel [11] used population balance model to predict gas-liquid contacting in the screen-type static mixers for the case of industrial streams where the presence of amphiphilic constituents was found to retard coales-cence and result in average interfacial areas as high as 2100 being achieved. Azizi and Al Taweel [12] used the screen static mixers to promote gas-liquid interphase mass transfer in order to improve the sel-ectivity and yield of multiphase reactions. The results showed that the kLa values that surpassed those of most conventional reactors/contactors by an order of magnitude. The ability to reach 98% equilibrium within residence times of less than 800 ms also allowed for the use of static mixing units that were several orders of magnitude smaller than conven-tional mechanically agitated tanks and bubble col-umns. Azizi and Hweij [13] found that the liquid-phase axial dispersion coefficient was consistently lower in all cases than that of gas-liquid pipe flows without STSMs under the same conditions.
The single-phase flow and liquid-liquid swirl flow in the static mixers have been quite extensively investigated by different researchers [1,6,14-19]. They offer many advantages over conventional react-ors (such as packed bed reactors, fluidized bed react-ors) especially when used for gas/liquid systems. Some examples of the application of static mixers for dispersive mixing of the gaseous phase into the liquid phase are ozonation processes in wastewater treat-ment process, and scrubbing ammonia or cyanides with water and hydrogenation of vegetable oils [1,6,7,20]. Tajima and his colleagues [21-23] ana-lytically and experimentally elucidated the effects of flow division, flow reversal and secondary flow ind-uced by the Kenics static mixer on the formation of CO2 hydrate. The liquefied CO2 was transported through a pipeline and mixed with seawater in a KSM
at a depth of 500-1000 m then released into the ocean. More experimental results about the interfacial mass transfer between liquid CO2 and water had been obtained in the horizontal KSM. Rabha et al. used ultrafast electron beam X-ray tomography to measure the dispersive mixing of upward co-current gas-liquid flow and quantitatively analyzed the bubble size distribution and gas holdup in a KSM [7]. During the past years, the physical scale resolved in a CFD simulation has become smaller and smaller because of ever-increasing computer power [24]. The develop-ment of suitable closure models for gaining a full understanding of multiphase flows is still an active research field owing to the complex physics involved and broad range of relevant length scales [2]. Taking into account of the mono-disperse bubble sizes assumption and the dependency of non-drag forces, Zidouni et al. [25] performed an Euler-Euler gas-liquid bubbly flow simulation validated by the literature data of Rabha et al. to predict the gas phase character-istics. Kanizawa and Ribatski [26,27] employed a cap-acitive probe to measure the gas holdup of air-water upward external flow across a triangular tube bundle and presented a review on predictive methods for gas holdup and pressure drop.
In the past years, many experimental studies about turbulent bubbly flows inside the KSM have been carried out to enrich the comprehensive data-bases. The static mixer with four equally spaced heli-cal inserts (FKSM) as a novel gas-liquid mixing equip-ment has been successfully applied in the industrial-ized production of dichloroethane by direct chlorin-ation of ethylene and propylene oxide by chlorohyd-rination in tubular reactor dichloride [4,28]. Adequate further understanding of intensification mechanism of gas-liquid flow in the complex static mixer is indis-pensable. However, there are not adequate literatures on the gas-liquid flow in the FKSM. In this study, the characteristics of velocity field, radial gas void fraction and local mass transfer coefficients of concentric upward gas-liquid flow characteristics in the FKSM were investigated, respectively.
MATHEMATICAL MODEL
Governing equations
Computational fluid dynamics (CFD) is con-sidered the one indispensable tool in resolving prob-lems that involve mass and heat transfer. A widely used approach to model two-phase flows with signific-ant volume fractions of both phases is the Eulerian two-fluid framework of interpenetrating continua [2,25]. The numerical cases of the concentric upward

H. MENG et al.: THE FLOW AND MASS TRANSFER CHARACTERISTICS… Chem. Ind. Chem. Eng. Q. 27 (1) 57−68 (2021)
59
gas-liquid bubble flows in the FKSM was implemen-ted in the ANSYS Fluent V16.1 with multi-fluid Euler- -Euler approach. The continuity equation for phase q is [29]:
( ) ( ) ( )α ρ α ρ=
∂ + ∇ ⋅ = − +∂ u
1
n
q q q q q pq qp qp
m m St
(1)
where αq is the volume fraction of phase q, ρq denotes the density of phase q, uq is the velocity of phase q and mpq characterizes the mass transfer from the pth to the qth phase, and mqp characterizes the mass transfer from phase q to phase p [30].
The momentum conservation for phase q yields:
( ) ( )
( )
( )
α ρ α ρ α τ
α ρ=
∂ + ∇ ⋅ = − ∇ + ∇ ⋅ +∂
+ + + − +
+ + + + +
1
, , , ,
q q q q q q q q q
n
q g pq pq pq qp qpp
q lift q wl q vm q td q
pt
m m
u u u
R u u
F F F F F
(2)
where qτ is the q phase stress-strain tensor, μq and λq denote the shear and bulk viscosity of phase q, Fq is an external body force, Flift,q is a lift force, Fwl,q is a wall lubrication force, Fvm,q is a virtual mass force, and Ftd,q is a turbulent dispersion force (in the case of turbulent flows only) [31,32].
It is well known that the k-ω turbulence model attempts to predict turbulence by two partial differ-ential equations for the turbulence kinetic energy (k) and specific rate of dissipation (ω) [33]. As a result, SST k-ω model is employed as a closure for the RANS equations of Eulerian mode in multiphase turbulent flows. Furthermore, the relative Reynolds number for the primary phase q and secondary phase p is obtained from [34]:
ρμ−
= q p q p
q
u u dRe (3)
Bubble forces The suitable closure model for adiabatic bubbly
flow is achieved once the bubble forces have been expressed in terms of the average flow parameters by means of analytical or empirical correlations [35]. The drag forces also describe the momentum exchange in flow direction and the non-drag forces including a lift-force, a wall-force and a turbulent dispersion-force play an important role for the development of the flow structure in a two fluid approach [36].
Drag force A drag force as the resistance force derives from
the motion of the bubbles through the surrounding water and has the opposite direction of the incoming flow. The interfacial drag force acted on a micro-body traveling through a fluid is given by [25]:
( )ρ α= − − −F u u u u34drag D L G G L G L
B
Cd
(4)
The drag coefficient (CD) is evaluated as sug-gested by Ishii and Zuber in the following format [37]:
( )( )= , , ,max ,min ,D D sphere D ellipse D capC C C C (5)
where
( )+=
0.75
,
24 1 0.1D sphere
ReC
Re (6)
=,23D ellipseC Eo (7)
=, 8 3D capC (8)
The drag coefficient CD depends strongly on the Re and for deformable bubbles also on the Eötvös number Eo but turns out to be independent of the Morton number Mo [25,38]:
( )ρ ρσ
−=
2L G Bgd
Eo (9)
( )ρ ρ μρ σ
−=
4
2 3L G L
L
gMo (10)
where σ denotes the surface tension, g represents gravity, and dB is the diameter of uniform bubbles.
Lift forces The bubbles in a shear flow are subjected to a
lift force which is due to velocity gradients and acts perpendicular to the direction of bubble motion. From Drew and Lahey [39], the lift force acting on a dis-persed phase in a continuous phase could be calculated as:
( ) ( )ρ α= − − × ∇ ×F u u ulift L L G G L LC (11)
For in co-current pipe flow, the lift coefficient CL of spherical bubbles is positive which indicates that the lift force acts in the opposite direction of the velo-city gradient of liquid phase. The original Tomiyama lift model was lightly modified by Frank et al. as follows [40,41]:
D. BOŽIĆ et al.: BIOSORPTION OF LEAD IONS… Chem. Ind. Chem. Eng. Q. 27 (1) 57−68 (2021)
60
( ) ( )( )
⊥ ⊥
⊥ ⊥
⊥
≤= < ≤ − >
min[0.288 tanh 0.12 , ] 44 10
0.27 10L
Re f Eo EoC f Eo Eo
Eo (12)
where
⊥ ⊥ ⊥
⊥
= − −− +
3 2( ) 0.00105 0.01590.0204 0.474
f Eo Eo EoEo
Eo⏊ is a modified Eötvös number based on the long axis of the deformable bubble, d⏊ [42]:
( )ρ ρσ
⊥⊥
−=
2L G gd
Eo (13)
⊥ = + 0.757 1 3(1 0.163 )Bd d Eo (14)
Wall lubrication force In the bubbly upward flow of a vertical pipe, the
wall lubrication force tends to push the gas phases away from walls and results in the dispersed bubbles concentrating in a region near, but not immediately adjacent to, the wall [43]. Complete neglect of the wall force does not give a satisfactory prediction of the void fraction profiles. Therefore, the influence of wall lubrication forces on the bubbles is necessarily inc-luded in the gas-liquid bubbly flows in FKSM. The wall lubrication force has the general form [25]:
ρ α= −
F u u 22wall W L G G L
B
C yd
(15)
The empirical relationship was concluded by Tomiyama et al. [44] and Hosokawa et al. [45].
Numerical aspects
Physical model and fluid properties It is well known that the classical KSM is usually
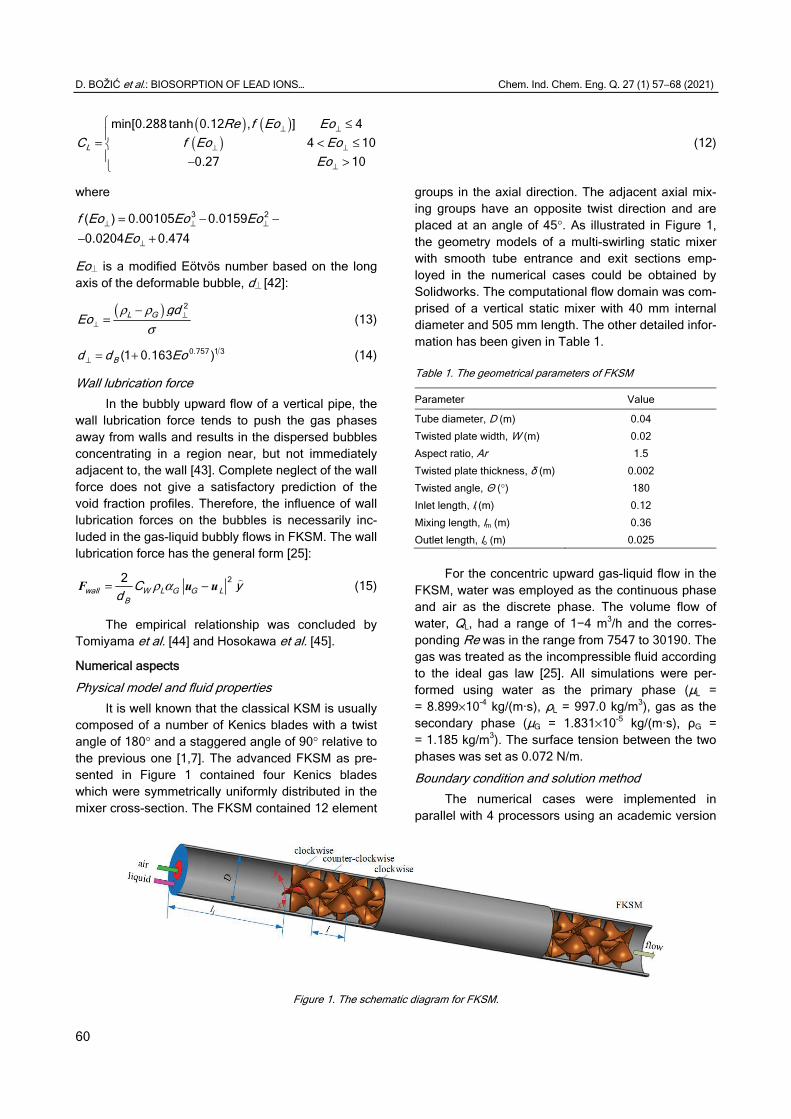
composed of a number of Kenics blades with a twist angle of 180° and a staggered angle of 90° relative to the previous one [1,7]. The advanced FKSM as pre-sented in Figure 1 contained four Kenics blades which were symmetrically uniformly distributed in the mixer cross-section. The FKSM contained 12 element
groups in the axial direction. The adjacent axial mix-ing groups have an opposite twist direction and are placed at an angle of 45°. As illustrated in Figure 1, the geometry models of a multi-swirling static mixer with smooth tube entrance and exit sections emp-loyed in the numerical cases could be obtained by Solidworks. The computational flow domain was com-prised of a vertical static mixer with 40 mm internal diameter and 505 mm length. The other detailed infor-mation has been given in Table 1.
Table 1. The geometrical parameters of FKSM
Parameter Value
Tube diameter, D (m) 0.04
Twisted plate width, W (m) 0.02
Aspect ratio, Ar 1.5
Twisted plate thickness, δ (m) 0.002
Twisted angle, Θ (°) 180
Inlet length, li (m) 0.12
Mixing length, lm (m) 0.36
Outlet length, lo (m) 0.025
For the concentric upward gas-liquid flow in the FKSM, water was employed as the continuous phase and air as the discrete phase. The volume flow of water, QL, had a range of 1−4 m3/h and the corres-ponding Re was in the range from 7547 to 30190. The gas was treated as the incompressible fluid according to the ideal gas law [25]. All simulations were per-formed using water as the primary phase (μL = = 8.899×10⁻⁴ kg/(m·s), ρL = 997.0 kg/m3), gas as the secondary phase (μG = 1.831×10⁻⁵ kg/(m·s), ρG = = 1.185 kg/m3). The surface tension between the two phases was set as 0.072 N/m.
Boundary condition and solution method The numerical cases were implemented in
parallel with 4 processors using an academic version
Figure 1. The schematic diagram for FKSM.

H. MENG et al.: THE FLOW AND MASS TRANSFER CHARACTERISTICS… Chem. Ind. Chem. Eng. Q. 27 (1) 57−68 (2021)
61
of ANSYS Fluent V16.1. A smaller time step size of 1×10⁻³ s was used in the numerical solutions in a Dell workstation T3600 with Intel Xeon Processor E5-1650 and 32.0 GB RAM. A pressure-based solver was chosen with implicit scheme for transient formulations in the static mixers [46]. The pressure-velocity Coup-ling was achieved based on Phase Coupled SIMPLE which had been proven to be robust [47]. The gra-dients were discretized on the basis of the Green- -Gauss cell-based method. The second-order upwind scheme was employed to discretize the momentum, volume fraction, turbulent kinetic energy and specific dissipation rate, respectively.
The ordinate origin of the Cartesian system was set at the cross-section center of the first mixing element’s leading edge [5]. The reference pressure location was at the outlet center of the mixer [4]. The liquid and gas phase inlets were assigned as the velocity inlet, and the outflow outlet was specified. The average axial velocity of the liquid phase ranged from 0.245 to 0.98 m/s in the positive z-direction. The gas was injected through a concentric inlet with 12.5 mm internal diameter. The user-defined functions were adopted to obtain the fully-developed profiles for each phase. The wake region behind the bubbles with a size smaller than the critical bubble diameter dc = = 10 mm is not obvious and its effect on collision and coalescence could be ignored [37]. In view of the comparison with the available experimental data and the simplified treatment, mono-disperse approxim-ation was employed and imposed in all simulations as described by Zidouni et al. [25]. The gas phase had the initial uniformly dispersed bubbles with a diameter dB of 1.0, 3.0, 5.8 and 8 mm, respectively. The volume fraction of the gas phase satisfied for αG ≤ 0.3 so that the resulting flow pattern was in the bubbly flow topology [32].
In order to obtain an initial solution for the prim-ary phase, the Eulerian multiphase calculation was first set up as usual. Secondary, the volume fraction
in the Equations list in the Equations Dialog Box was deselected to compute the flow for the primary phase only. At last, the volume fraction equation was turned back on and the calculation for all phases continued. The residual rules for the mass equation and other conservation equation components satisfied with the absolute criteria of 10-4 and 10-6, respectively.
Model validation In order to compare the gas volume fraction with
literature data provided by Rabha et al. [7], the same model of KSM was employed: a vertical pipe with an inner diameter of 80 mm and 3450 mm length con-sisted of the only three elements with the aspect ratio fixed at 1; the gas inlet injected through a 12.5 mm inner diameter was located at 615 mm upward of the cross-section of the first mixing element. As experi-mental working fluid, the de-mineralized water as the liquid and air as the gas phase were employed in the numerical simulations and the effect of gravity took place in the negative z-direction; a typical cross-sect-ion at z = 75 mm was monitored. The time-averaged distribution of cross-sectional gas holdup were evalu-ated at uG = 0.11 m/s and uL = 0.6 m/s. The numerical prediction of two large-scale zones with higher gas holdup symmetrically separated by the mixing inserts as shown in Figure 2a had a good agreement with the numerical result in Figure 2b and experimental result in Figure 2c provided by Rabha et al. [7,25]. It is well known that the velocity field and flow pattern in the KSM is induced by the helical Kenics inserts [6,8,23]. The FKSM derived from the basic KSM is identically composed of three mixing functions, flow division, flow reversal, and radial mixing. As a result, the used com-putation model as described above is considered to be capable of predicting gas-liquid flow in the FKSM.
Grid independence test Because of the complex mixing elements, the
computational domain was meshed with unstructured grids. A 2D face mesh with quadrilateral cells with a 1
Figure 2. Comparison of gas holdup counter among: a) the numerical result, b) the literature numerical and c) the experimental data.

H. MENG et al.: THE FLOW AND MASS TRANSFER CHARACTERISTICS… Chem. Ind. Chem. Eng. Q. 27 (1) 57−68 (2021)
62
mm interval was generated at the cross-sections of inlet and outlet, and then a 3D volume mesh with tetrahedral cells was generated [46]. The mesh cells near the boundary zones included the inlet, outlet, tube and tapes walls were refined based on boundary adaption [32]. To ensure the accurate prediction of the multiphase flow filed which was independent of the grid system, five grid systems with about 1182872, 623954, 491576, 379049, and 346496 cells were adopted in the numerical simulations of gas-liquid flow in the FKSM.
From Figure 3 under QL = 1 m3/h and αave = = 0.15, it is obviously seen that the average z-dir-ectional velocity of the liquid phase decreased first and then increased with the increasing cell numbers. It was noted that the minimum of average axial velo-city of water approached 0.260 m/s with about 623954 cells. As far as the variable cross-sections is concerned, the theoretical average axial velocity with a value 0.258 m/s could be obtained from the con-tinuity equations at the cross-section of z/l = 0 and 11/2. To our knowledge, the deviation between the theoretical and minimum of numerical average axial velocity was only 0.775%.
From the average mesh quality as presented in Figure 3, both Equiangle Skew (QEAS) and Equi-volume Skew of mesh first increased and then dec-reased with the increasing cell numbers. The mesh quality would be much worse when the QEAS was higher than 0.75. Furthermore, the average QEAS of higher mesh quality system had a value of 0.4 [48]. The average QEAS of the grid system with 623954 cells was closer to 0.4 than that of the other three-dimensional models. In view of the computational accuracy and efficiency, the mesh with a cell number of 623954 was chosen for the following numerical computation process.
Figure 3. Grid quality test and grid independence test for
numerical simulation in FKSM.
RESULTS AND DISCUSSION
Flow field of water and air phase
For further evaluation of the water-air two-phase flow in the FKSM, it was necessary to investigate the velocity profiles of the water and air phases. The pro-files of area-weighted average air and water velocities versus normalized axial position at different cross-sections are shown in Figure 4a. It could be obviously seen that the average air phase velocity profiles gradually became much larger before z/l = 0, because of the mass transfer from the local high velocity air phase with bigger uniform bubble diameter to the sur-rounding low velocity liquid. Furthermore, the inlet length for average air velocity in excess of the primary phase was getting shorter from z/l = -0.333 to z/l = = -0.733 with the increasing uniform bubble diameter. With the increasing axial length, the average air velo-city was improved from 0.467 to 0.825 m/s and the liquid phase reduced slightly from 0.361 to 0.338 m/s.
Figure 4. The profiles of: a) area-weighted average air and water velocities at QL = 1 m3/h and αave = 0.20, and b) pressure drop versus
normalized axial position at different cross-sections at QL = 1 m3/h and αave = 0.15.

H. MENG et al.: THE FLOW AND MASS TRANSFER CHARACTERISTICS… Chem. Ind. Chem. Eng. Q. 27 (1) 57−68 (2021)
63
The periodic effects of static mixing functions induced the average axial air and water velocity had ″W″ pro-files in each segment. Furthermore, the local maxi-mum of air phase velocity in each mixing element was obtained earlier than that of the water phase. The average liquid velocity decreased down to the mini-mum and the average air velocity increased up to the maximum at the transition regions of adjacent mixing elements at the same time. In the mixing sections, the relative velocities between air and water increased from 0.106 to 0.486 m/s with the increasing initial uni-form bubble diameter. At the last ending edge of the mixing group, the average velocities of air and water phases first suddenly decreased, and then the pri-mary phase gradually reduced to the inlet velocity because of the larger cross-section and reduced tur-bulent intensity.
The profiles of pressure drop of gas-liquid flow between the first and end leading edges in the FKSM versus dimensional axial position are illustrated in Figure 4b. It could be seen that the pressure drops for dB 3.0, 5.8 and 8.0 mm had an obvious increasement larger by 18.41−30.53%, 29.86−40.83% and 35.61– –46.04% than that in the FKSM with dB = 1.0 mm, respectively. As a result, a much smaller bubble dia-meter is necessary and expected for larger interface areas and lower energy consumption.
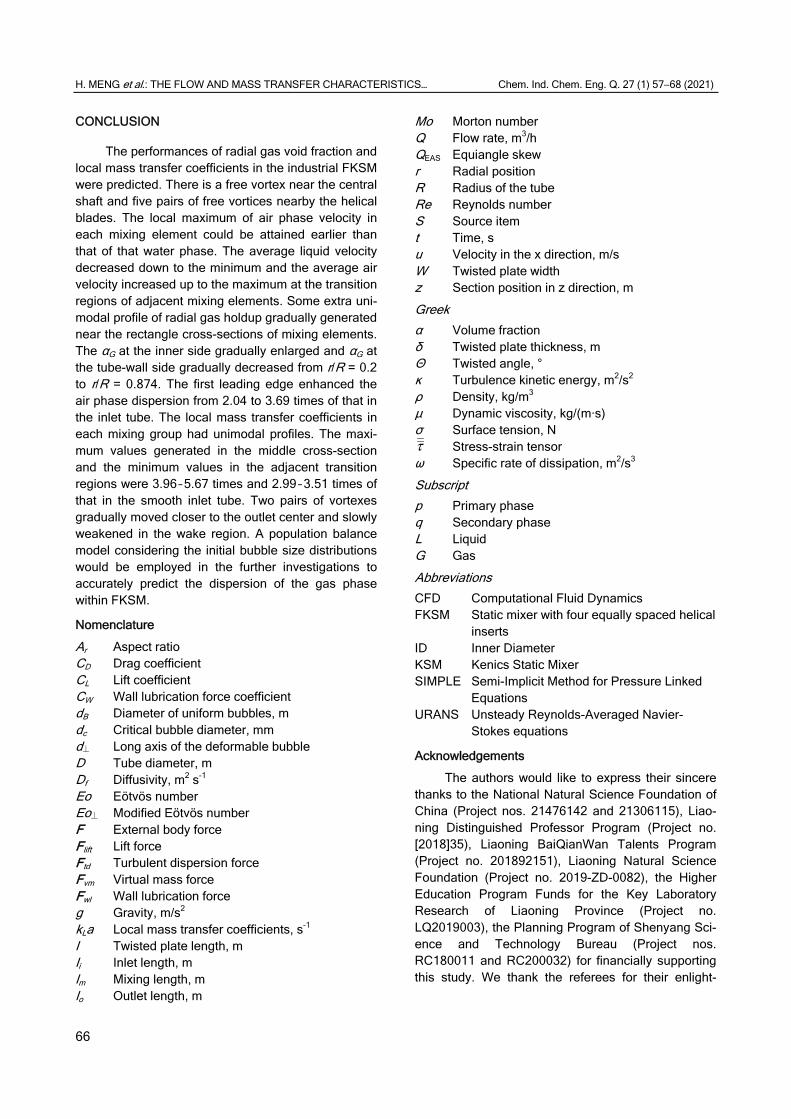
Radial gas fraction distribution The cross-sectional contour and secondary flow
vector of air velocity in the inlet, mixing and outlet wake flow sections are shown in Figure 5. It was noted that the air phase injected in the tube center was gradually dispersed and transferred to the plate wall and tube wall. The secondary flow vectors in Figure 5 show that the bubbles flow first transferred to the tube wall induced by flow division of the leading edge, and then migrated to the tube center with the help of radial mixing function and finally moved to the surrounding fluid derived from the flow reverse func-
tion of the downstream mixing elements. The longi-tudinal vortices of the air phase began to generate from Δz/l = 0.25 which was derived from the swirling flow of the primary phase in each mixing segment. In other words, four pairs of longitudinal vortices gener-ated at the eight helical passages and a much larger in scale longitudinal vortex with a diameter of 8 mm swirled with the central axis in the cross-sections. The number of leading edges in a cross-section at the transition was up to 4 times of that in the KSM, which may play a much more important role in the gas frac-tion distributions, as shown in Figure 5. As a result, much more uniform distributions of the air phase were obtained in the downstream mixing region compared with the smooth inlet tube. The homogeneity of the gas phase was reduced and the longitudinal vortices gradually weakened in the outlet wake region, as shown in the flow map at z/l = 38/3.
It could be clearly seen from Figure 6 that the effect of cross-section geometry of mixing groups on the radial profiles of the air void fraction was obvi-ously intensified. The distributions of gas fraction αG in the smooth inlet were classical symmetrical uni-modal profiles, as shown in Figure 6a. The only differ-ence was that the tails of profiles expanded from r/R = = 0.2 to r/R = 0.6 because of local mass transfer induced by the bubble forces. In the mixing regions, the radial distributions of αG began to shift from the tube center to the tube wall by the coupled effect between the lift force and secondary flow induced by the helical element. The maximum value of αG at z/l = = -4.0 began to shift to the central axis at r/R = 0.2, as shown in Figures 5 and 6a. The maximum values of αG first increased from 0.689 to 0.827 and then dec-reased down to 0.55. Furthermore, a new unimodal profile gradually generated around the rectangle cross-sections of mixing elements at z/l in range 0.25- -0.75 with dB = 3.0 mm. The air void fractions in the bulk flow region decreased with the increasing bubble
Figure 5. The cross-section velocity contour and second flow vector of air phase at QL = 1 m3/h and αave = 0.20.

H. MENG et al.: THE FLOW AND MASS TRANSFER CHARACTERISTICS… Chem. Ind. Chem. Eng. Q. 27 (1) 57−68 (2021)
64
diameter and radius from r/R = 0.2 to r/R = 0.5. The air void fraction αG at the inner side of helical blades was gradually enlarged and αG at the tube-wall side was gradually weakened with the increasing radial positions from r/R = 0.5 to r/R = 0.874. Furthermore, a comparison about the gas holdup dispersion distri-bution could be obtained in the FKSM and KSM, as shown in Figure 6b. It is noted that the area weighted average air void fractions in the FKSM dramatically increased up to 206% by the first four leading edges and then the relative enhancement became smaller and smaller, from 68.22 to 30.64%, compared to that in the KSM with dB = 1.0 mm.
Figure 7 illustrates the radial and axial velocity distributions of the air phase before and after the twelve mixing segments. From the radial and axial comparison of velocity distributions of the air phase in the initial developing inlet sections, as shown in Fig-ure 7a and b, a relative jet flow of the air phase was fully developed with higher velocity. Before entering the first mixing element, the velocity profiles of the concentric air phase accelerated by bubble forces first became sharp and narrow until z/l = -3.27 and then slowly decreased and started to stabilize at z/l = -1.5, because of the new local mass transfer equilibrium. That is to say, some higher turbulent energy of the air phase may be used for radial mass transfer. With the increasing of dimensionless axial length, the axial uG in the near-wall region of r/R > 0.7 gradually dec-reased and the axial uG in the tube center region of r/R ≤ 0.25 increased, as illustrated in Figure 7c. In the wake flow regions, as shown in Figure 7c and d, mul-tiple secondary vortices were induced by static mixing segments with four equally spaced helical inserts. The existence of two pairs of coupled free vortexes after the ending edge of mixing element at z/l = 38/3 in Figure 5 was proved by the radial profiles of the air
phase, as presented in Figure 7d. On the one hand, the vortex core gradually moved closer to the center of the outlet with the increasing weak flow passage. On the other hand, the maximum velocity started to decrease and the velocity of the center bulk zone inc-reased. Therefore, two pairs of free vortexes gradu-ally weakened.
Axial local mass transfer The mass transfer process between air and
liquid was enhanced by the multi-helical segment as shown in Figure 8. On the basis of Higbie’s classical permeability theory and Kolmogorov’s isotropic turbu-lence theory [49], the local mass transfer coefficients, kLa, could be defined as:
( )α α ρ απ μ
− =
1 41 2G G GL L Gf
B L
12 1L
u gDk ad
(16)
where Df is diffusivity, m2 s-1. As shown in Figure 8a, the values of kLa in the
mixing region became much larger than those in the smooth inlet tube with the increasing dimensionless axial mixing length. The intensification ability of the smooth tube at αave = 0.2 could be easily obtained at z/l = -3.5 with the approximate value of kLa = 20.5 s-1 which indicated that the mass transfer process was no longer sensitive to the axial positions. The inlet effect induced by the first leading edge of the mixing segment played an important role on the distribution mixing process, and the intensification of local mass transfer coefficient increased sharply, which was 2.04–3.69 times of that in the inlet tube. In the flow passage generated by the first mixing element, the local transfer coefficient first declined and then inc-reased, and finally decreased, which indicated that a new equilibrium between air and water may be gradu-ally obtained.
Figure 6. The radial gas fraction distributions: a) the radial profiles of αG at different cross-sections in the first mixing element and
b) area weighted average profiles versus axial dimensional mixing length.

H. MENG et al.: THE FLOW AND MASS TRANSFER CHARACTERISTICS… Chem. Ind. Chem. Eng. Q. 27 (1) 57−68 (2021)
65
Periodic varying cross-sections of downstream mixing elements, as shown in Figure 5, induced stronger coupling among bubble forces, flow division, flow reverse and secondary flow functions, and made the local mass transfer profile approach one-humped distribution in Figure 8. The minimum of average kLa were 2.99‒3.51 times of that in the inlet tube, which indicated that the temporary equilibrium may be broken at the transition of adjacent mixing segments induced by the mixing function between flow division and flow reverse. Furthermore, the maximum values of average kLa in the cross-section of the middle mixing element were 3.96‒5.67 times of that in the smooth tube which indicated that the radial mixing
function and lift force made the interface updated frequently. On the one hand, the local mass transfer may be improved by the increasing primary phase velocity for a given αG, as presented in Figure 8a. On the other hand, it was noted in Figure 8b that the effect of intensification on mass transfer between air and water largely weakened with the increase of initial uniform bubble diameter from 1.0 mm to 8.0 mm. The excellent enhancement ability of local mass transfer coefficients could be evaluated between FKSM and KSM as shown in Figure 8c. It is clearly seen that the local mass transfer coefficients in the FKSM are enhanced by 18.41%−30.53% than that in the KSM for QL = 1 m3/h with αave=0.2 and dB=1.0 mm.
Figure 7. The radial and axial velocity distribution of air phase before and after the twelve mixing segments.
Figure 8. The axial profiles of local mass transfer coefficient at different: a) liquid inlet velocity, b) initial uniform bubble diameter and c) comparison between FKSM and KSM.
H. MENG et al.: THE FLOW AND MASS TRANSFER CHARACTERISTICS… Chem. Ind. Chem. Eng. Q. 27 (1) 57−68 (2021)
66
CONCLUSION
The performances of radial gas void fraction and local mass transfer coefficients in the industrial FKSM were predicted. There is a free vortex near the central shaft and five pairs of free vortices nearby the helical blades. The local maximum of air phase velocity in each mixing element could be attained earlier than that of that water phase. The average liquid velocity decreased down to the minimum and the average air velocity increased up to the maximum at the transition regions of adjacent mixing elements. Some extra uni-modal profile of radial gas holdup gradually generated near the rectangle cross-sections of mixing elements. The αG at the inner side gradually enlarged and αG at the tube-wall side gradually decreased from r/R = 0.2 to r/R = 0.874. The first leading edge enhanced the air phase dispersion from 2.04 to 3.69 times of that in the inlet tube. The local mass transfer coefficients in each mixing group had unimodal profiles. The maxi-mum values generated in the middle cross-section and the minimum values in the adjacent transition regions were 3.96‒5.67 times and 2.99‒3.51 times of that in the smooth inlet tube. Two pairs of vortexes gradually moved closer to the outlet center and slowly weakened in the wake region. A population balance model considering the initial bubble size distributions would be employed in the further investigations to accurately predict the dispersion of the gas phase within FKSM.
Nomenclature
Ar Aspect ratio CD Drag coefficient CL Lift coefficient CW Wall lubrication force coefficient dB Diameter of uniform bubbles, m dc Critical bubble diameter, mm d⏊ Long axis of the deformable bubble D Tube diameter, m Df Diffusivity, m2 s-1 Eo Eötvös number Eo⏊ Modified Eötvös number F External body force Flift Lift force Ftd Turbulent dispersion force Fvm Virtual mass force Fwl Wall lubrication force g Gravity, m/s2 kLa Local mass transfer coefficients, s-1 l Twisted plate length, m li Inlet length, m lm Mixing length, m lo Outlet length, m
Mo Morton number Q Flow rate, m3/h QEAS Equiangle skew r Radial position R Radius of the tube Re Reynolds number S Source item t Time, s u Velocity in the x direction, m/s W Twisted plate width z Section position in z direction, m
Greek α Volume fraction δ Twisted plate thickness, m Θ Twisted angle, ° κ Turbulence kinetic energy, m2/s2 ρ Density, kg/m3 μ Dynamic viscosity, kg/(m·s) σ Surface tension, N τ Stress-strain tensor ω Specific rate of dissipation, m2/s3
Subscript p Primary phase q Secondary phase L Liquid G Gas
Abbreviations CFD Computational Fluid Dynamics FKSM Static mixer with four equally spaced helical
inserts ID Inner Diameter KSM Kenics Static Mixer SIMPLE Semi-Implicit Method for Pressure Linked
Equations URANS Unsteady Reynolds-Averaged Navier-
Stokes equations
Acknowledgements
The authors would like to express their sincere thanks to the National Natural Science Foundation of China (Project nos. 21476142 and 21306115), Liao-ning Distinguished Professor Program (Project no. [2018]35), Liaoning BaiQianWan Talents Program (Project no. 201892151), Liaoning Natural Science Foundation (Project no. 2019-ZD-0082), the Higher Education Program Funds for the Key Laboratory Research of Liaoning Province (Project no. LQ2019003), the Planning Program of Shenyang Sci-ence and Technology Bureau (Project nos. RC180011 and RC200032) for financially supporting this study. We thank the referees for their enlight-

H. MENG et al.: THE FLOW AND MASS TRANSFER CHARACTERISTICS… Chem. Ind. Chem. Eng. Q. 27 (1) 57−68 (2021)
67
ening remarks which helped us improve the manu-script.
REFERENCES
[1] A. Ghanem, T. Lemenand, D.D. Valle, H. Peerhossaini, Chem. Eng. Res. Des. 92 (2014) 205–228
[2] R. Rzehak, E. Krepper, Nucl. Eng. Des. 287 (2015) 108– –118
[3] K. Somnuk, N. Soysuwan, G. Prateepchaikul, Renewable Energy 131 (2019) 100–110
[4] H.B. Meng, F. Wang, Y.F. Yu, M.Y. Song, J.H. Wu, Ind. Eng. Chem. Eng. 53 (2014) 4084–4095
[5] H.B. Meng, X.H. Jiang, Y.F. Yu, Z.Y. Wang, J.H. Wu, Korean J. Chem. Eng. 34 (2017) 1328–1336
[6] R.K. Thaku, Ch. Vial, K.D.P. Nigam, E.B. Nauman, G. Djelveh, Chem. Eng. Res. Des. 81 (2003) 787–826
[7] S. Rabha, M. Schubert, F. Grugel, M. Banowski, U. Hampel, Chem. Eng. J. 262 (2015) 527–540
[8] A. Kołodziej, J. Łojewska, M. Jaroszyński, A. Gancarczyk, P. Jodłowski, Int. J. Heat Fluid Flow 33 (2012) 101–108
[9] A.M. Al Taweel, F. Azizi, G. Sirijeerachai, Chem. Eng. Process 72 (2013) 51–62
[10] A.M. Al Taweel, J. Yan, F. Azizi, D. Odedra, H.G. Gomaa, Chem. Eng. Sci. 60 (2005) 6378–6390
[11] F. Azizia, A.M. Al Taweel, Chem. Eng. Sci. 62 (2007) 7436–7445
[12] F. Azizi, A.M. Al Taweel, Ind. Eng. Chem. Res. 54 (2015) 11635–11652
[13] F. Azizi, K.A. Hweij, AIChE J. 63 (2017) 1390–1403
[14] D.M. Hobbs, P.D. Swanson, F.J. Muzzio, Chem. Eng. Sci. 53 (1998) 1565–1584
[15] Z. Jaworski, P. Pianko-Oprych, Chem. Eng. Res. Des. 80 (2002) 910–916
[16] Z. Jaworski, H. Murasiewicz, Chem. Pap. 64 (2010) 182– –192
[17] H.B. Meng, Z.Q. Liu, Y.F. Yu, Q. Xiong, J.H. Wu, Int. J. Chem. React. Eng. 9 (2011) 1–19
[18] E. Lobry, F. Therona, C. Gourdona, N.L. Sauzea, C. Xuereba, T. Lasuyeb, Chem. Eng. Sci. 66 (2011) 5762– –5774
[19] H.B. Meng, Z.Q. Liu, Y.F. Yu, J.H. Wu, Braz. J. Chem. Eng. 29 (2012) 167–182
[20] A. Couvert, C. Sanchez, I. Charron, A. Laplanche, C. Renner, Chem. Eng. Sci. 61 (2006) 3429–3434
[21] H. Tajima, A. Akihiro Yamasaki, F. Kiyono, Energy Fuels 18 (2004) 1451–1456
[22] H. Tajima, A. Yamasaki, F. Kiyono, H. Teng, AIChE J. 50 (2004) 871–878
[23] H. Tajima, A. Yamasaki, F. Kiyono, Energy Fuels 19 (2005) 2364–2370
[24] Y.X. Liao, R. Rzehak, D. Lucas, E. Krepper, Chem. Eng. Sci. 122 (2015) 336–349
[25] F. Zidouni, E. Krepper, R. Rzehak, S. Rabha, M. Schub-ert, U. Hampel, Chem. Eng. Sci. 137 (2015) 476–486
[26] F.T. Kanizawa, G. Ribatski, Int. J. Heat Fluid Flow 65 (2017) 200–209
[27] F.T. Kanizawa, G. Ribatski, Int. J. Heat Fluid Flow 65 (2017) 210–219
[28] J.H. Wu, Chinese Patent CN 200510045606.8 (2007)
[29] A. Sakin, I. Karagoz, Chem. Ind. Chem. Eng. Q., 23 (2017) 483–493
[30] B.K. Dhar, S.K. Mahapatra, S.K. Maharana, A. Sarkar, S.S. Sahoo, J. Comput. Multiphase Flows 8 (2016) 201– –212
[31] M.E. Garmakova, V.V. Degtyarev, N.N. Fedorova and V.A. Shlychkov, AIP Conf. Proc. 1939 (2018) 020037-1– -020037-12
[32] ANSYS, ANSYS Fluent Theory Guide Release 16.0, ANSYS Inc., Canonsburg, 2015, p. 570
[33] R. Taghavi-Zenouz, M.H.A. Behbahani, Aerosp. Sci. Technol. 72 (2018) 409–417
[34] V. Abdolkarimi, H. Ganji, Braz. J. Chem. Eng. 31 (2014) 949–957
[35] R. Rzehak, E. Krepper, C. Lifante, Nucl. Eng. Des. 253 (2012) 41–49
[36] E. Krepper, D. Lucas, H.M. Prasser, Nucl. Eng. Des. 235 (2005) 597–611
[37] M. Ishii, N. Zuber, AIChE J. 25 (1979) 843–855
[38] R. Rzehak, M. Krauß, P. Kováts, K. Zähringer, Int. J. Multiphase Flow 89 (2017) 299–312
[39] D.A. Drew, R.T. Lahey, In particulate two-phase flow, Butterworth-Heinemann, Oxford, 1993, pp. 509–506
[40] A. Tomiyama, Multiphase Sci. Technol. 10 (1998) 369– –405
[41] T. Frank, J. Shi, A.D. Burns, Validation of Eulerian multi-phase flow models for nuclear safety applications, in Pro-ceeding of the 3rd International Symposium on Two- -Phase Flow Modelling and Experimentation, Pisa, Italy, 2004, pp. 1–9
[42] B. Vadlakonda, N. Mangadoddy, Sep. Purif. Technol. 184 (2017) 168–187
[43] D. Lucas, E. Krepper, H. M. Prasser, Int. J. Therm. Sci. 40 (2001) 217–225
[44] A. Tomiyama, A. Sou, I. Zun, N. Kanami, T. Sakaguchi, Adv. Multiphase Flow (1995) 3–15
[45] S. Hosokawa, A. Tomiyama, S. Misaki, T. Hamada, Late-ral migration of single bubbles due to the presence of wall, in Proceedings of ASME FEDSM'02, Montreal, Canada, 2002, pp. 855–860
[46] Y.F. Yu, H.Y. Wang, M.Y. Song, H.B. Meng, Z.Y. Wang, J.H. Wu, Appl. Therm. Eng. 94 (2016) 282–295
[47] ANSYS, ANSYS Fluent User’s Guide Release 16.0, ANSYS Inc., Canonsburg, 2015, p. 1429
[48] FLUENT, Gambit 2.4 User’s Guide, FLUENT Inc., Canonsburg, 2007, p. 3-91
[49] M. Tobajas, E. Garcia-Calvo, M.H. Siegel, S.E. Apitz, Chem. Eng. Sci. 54 (1999) 5347–5354.

H. MENG et al.: THE FLOW AND MASS TRANSFER CHARACTERISTICS… Chem. Ind. Chem. Eng. Q. 27 (1) 57−68 (2021)
68
HUIBO MENG1
ZHONGGEN LI1 YANFANG YU1
MENGQI HAN1 SHUNING SONG2
XIUHUI JIANG1 ZONGYONG WANG1
JIANHUA WU1 1Engineering and Technology
Research Center of Liaoning Province for Chemical Static-Mixing Reaction,
School of Mechanical and Power Engineering, Shenyang University of
Chemical Technology, Shenyang, P. R. China
2School of Chemistry and Molecular Bioscience, the University of
Queensland, Brisbane, Australia
NAUČNI RAD
STRUJNE I MASENO-PRENOSNE KARAKTERISTIKE KONCENTRNOG STRUJANJA GASNO-TEČNO U NAPREDNOM STATIČKOM MEŠAČU
Fluido-dinamičke fluida i maseno-prenosne karakteristike koncentričnog strujanja gasno-tečno nagore proučavane su u industrijskom statičkom mešaču sa četiri jednako raspoređena spiralna umetka (FKSM). Numeričke simulacije sadržaja gasa u Kenikso-vom mešaču dobro su se slagale sa numeričkim i eksperimentalnim rezultatima Rabhe i sar. Karakteristike radijalne frakcije sadržaja gasa i lokalni koeficijenti prenosa mase u FKSM procenjeni su pod različitim radnim uslovima. Profili brzine koncentrične gasne faze ubrzane silama mehura prvo su bili oštri i uski sve do z/l = -3,27, a zatim su polako opadali i stabilizovali se na z/l = -1,5 pre ulaska u prvi element za mešanje. Neki ekstra unimodalni profil radijalnog zadržavanja gasa postepeno se stvara u blizini pravouga-onih poprečnih preseka elemenata za mešanje. AG se postepeno povećavao sa r/R == 0,2 na r/R = 0,55, a zatim je oslabio sa r/R = 0,65 na r/R = 0,874. Udeo vazduhu u regionu glavnog toka smanjuju se sa povećanjem početnog uniformnog prečnika mehu-rića. Ulazni efekat prve vodeće ivice pojačao je disperziju gasne faze i lokalni koeficijenti prenosa mase naglo su porasli sa 2,04 na 3,69 puta u odnosu na one na ulazu. Lokalni koeficijenti prenosa mase u svakoj grupi mešanja imali su unimodalne profile.
Ključne reči: statički mešač, multihelikalni umetci, protok gas-tečnost nagore, sadržaj gasa, lokalni koeficijenti prenosa mase.