the floor traders tools 8.2 trendpro 8
TRANSCRIPT

The Floor Traders Tools™ 8.2 &
TrendPro™ 8.2
Developed by Roy Kelly
ARC Systems
1800 E. Sahara Avenue, Suite 107 Las Vegas, Nevada 89104
(530) 243-8999, Fax: (702) 920-8229 Email: [email protected] Web site: http://trendpro.com
Copyright © ARC Systems, Inc. 1993-2006
Table of Contents
Before You Begin .................................................................................... Page 3
Introduction............................................................................................. Page 4
Installation Instructions ......................................................................... Page 5-10
Identification of Cycles, Turn Points, Swing Points ............................ Page 11-12
TrendLine Plot Statement...................................................................... Page 12
Cycle Strength—Kelly’s ID.................................................................... Page 13
Kelly’s Cycle_ID 2................................................................................... Page 14-15
Filtered Waves, Filtered WavesTL ...................................................... Page 16-17
Cycle Turn Points ................................................................................... Page 18
Swing High & Swing Low ...................................................................... Page 19
Dynamic Cycle Forecaster ..................................................................... Page 20-21
Fib Retracements ................................................................................... Page 22-23
Auto TrendLines ..................................................................................... Page 24-26
Acc/Dist .................................................................................................... Page 27
Kelly’s CCI Expert ................................................................................ Page 28
Kelly’s Trident ........................................................................................ Page 29-31
Cycle Timing............................................................................................ Page 32
Fib Extensions ........................................................................................ Page 33-34
Dynamic Stops......................................................................................... Page 35-36
Price Exhaustion ..................................................................................... Page 37
TrendPro™ Indicators ........................................................................... Page 38-40 Pitchfork .................................................................................................. Page 41 Fib Confluence ........................................................................................ Page 42-44
Kelly’s Cycle Identifier Filtered ........................................................... Page 45-46 Dynamic Trend Filter ............................................................................. Page 47 Trendicator.............................................................................................. Page 48 Floor Pivots.............................................................................................. Page 49 Two Smooth............................................................................................. Page 50 Gartley ..................................................................................................... Page 51 Kelly’s AMA............................................................................................ Page 52 Dynamic Cycles ....................................................................................... Page 53
Copyright © ARC Systems, Inc. 1993-2006 3
Floor Traders Tools™ 8.2 & TrendPro™ 8.2 BEFORE YOU BEGIN Please read the manual before emailing, faxing or calling tech support. The first thing the tech support person will ask you is this: have you read the manual? If you have not, tech. support will ask you to read the manual first, and then if assistance is still needed help will be given. Please follow the step-by-step installation instructions in the manual while you are installing the program or you will run in to major problems. These indicators do not load as normal .els or .eld files. You have to install them step by step as outlined in the manual. How to Maintain a Healthy Computer Our Indicators will run on a166Mhz with 32 Megs of ram. We are recommending the following for TradeStation 2000i®, ProSuite®, and/or Open Platform®. Do not get these recommendations confused with the requirements for running our indicators. Pentium 4, 2.2 GHz or better (Intel Chip recommended) 20 GB hard drive, 6 GB free space or more 512 Megs of Ram or better, there are fewer problems with 1.2 Gigs of Ram Remember this is the minimum requirement needed to avoid problems. Keep in mind minimum means just that. I am not taking into consideration the fact that you will want to open other programs and use them at the same time. Windows XP will handle more than 512 MB of ram. That should tell you where we are headed. You cannot have too much memory or speed—the more the better. To keep your computer up and running you should do the following: Every day after the market closes you should shut down all programs, then turn your computer off, then back on again. Windows®, TradeStation® are known for keeping memory and resources. You should have the latest version of Fix-It 6.0. It would be best to run the All-In-One program weekly. You may want to do this on the weekends, as it takes time. Note: I recommend that you do not run McAfee®, Norton Crash Guard®, Norton Crash Guard Deluxe®, or Norton Utilities® Memory Resident programs. These programs have caused major problems on most computers. In my opinion, Fix-it 6.0 is the best repair-maintenance program currently available, and Nor-ton Virus detection is also a decent program. There have been major problems with McAfee virus pro-grams with TradeStation® and some versions of Windows®. It’s best to delete these off your computer if you are currently running them and replace them with Fix-it 6.0®. If TradeStation Open Platform® is giving you error messages, including User Functions or Indicators not verifying, locking up, and/or other errors, you may need to call TradeStation, Inc. for tech support. When you do so, the tech support people are trained to have you re-name their program folder to “old”. Then they will have you download their latest program. Sometimes this is needed, but in most cases doing this is not necessary. In most cases you can save time, and aggravation, by first deleting your workspace and rebuilding it. This will fix about 95% of all problems in TradeStation Open platform®. If that does not work, then call TradeStation, Inc. and have them help you.
Copyright © ARC Systems, Inc. 1993-2006 3

Floor Traders Tools™ 8.2 & TrendPro™ 8.2
Introduction Floor Traders Tools™ & TrendPro™ are not systems, it is a method of evaluating and trading markets using mechanical buy/sell signals to trade the market and to identify cycle tops and bottoms. While judgment is not eliminated, it is greatly reduced by the methodology of combining time cycles and trend identification. Generally, buy signals are more accurate in an up trending market and less accurate in a down trending market; sell signals are more accurate in a down trending market and less accurate in an up trending market. Determining the direction of trend requires interpretation. One way to determined trend direction is using the dominant cycle in the next longer time frame. For example, when trading a 5-minute chart, trend is determined by the cycle in the 20-minute bar chart. The Filtered Waves, TrendLines and TrendPro™ aid in determining the trend for both time periods. Do not expect to start using the Floor Traders Tools™ & TrendPro™ and immediately begin trading like a market wizard. You must become familiar with the Floor Traders Tools™ & TrendPro™ and the way they, and you, interact in the markets, and also the time periods you choose to trade. Like anything new, your skills will improve with experience. However, using Floor Traders Tools™ & TrendPro™ on historical back data can greatly increase your experience level very quickly. There is no substitute for putting your money on the line, but you will be much better prepared to trade if you have become thor-oughly familiar with the program’s methodology by applying the indicators to historical data to determine situations that present high probability buy/sell signals. Set Up Floor Traders Tools™ & TrendPro™ are powerful programs that may require some assistance setting up. Please follow the set up procedures outlined in this manual before contacting technical support. Technical Support-Free For 30 Days If you are having any problems that prevent the program from working correctly, please call technical support at (530) 243-8999, Monday through Friday, 9:30 AM - 2:30 PM PST. Free technical support is available during the first 30 days you own Floor Traders Tools™ and/or TrendPro™. After the initial 30 days of free technical support there is a $30 technical support fee per call; unless the problem is caused by a defect in your Floor Traders Tools™ & TrendPro™ program. For the most efficient ser-vice, we suggest you fax, or email, your questions to our technical support department and a representa-tive will reply as soon as possible. Please allow 24 hours for a response. If in that time you do not receive a reply, please try again as this means we did not receive your request for assistance. Email address: ([email protected]). Floor Traders Tools™ & TrendPro™ Workshops Trading the markets require experience and skill. Roy Kelly personally conducts several workshops per year on trading active commodities, bonds, stocks, and intra-day trading of the S&P Index. These work-shops are very specific and presented in such a way that both beginning and experienced traders leave with greatly improved trading skills and the ability to use the powerful Floor Traders Tools™ & TrendPro™ indicators and methodology. For a schedule of upcoming workshops please call ARC Systems at (530) 243-8999 or check our web site at: http://www.roykelly.info.
There is a risk of loss trading futures and stocks. Before you begin, make sure you have emptied your recycle bin. If TradeStation Technologies, Inc. has ever had you rename any directories, files, or folders (old or any other name) delete them first. Copyright © ARC Systems, Inc. 1993-2006 4
Installation Instructions
Installing from a CD Insert the CD in your computer CD drive. Note: your CD drive could be D, E, or F depending on how your computer is configured. If you are installing from a downloaded file, you will replace the drive with whatever drive & directory you save the file to. Click on the file you downloaded open it and follow TradeStation® prompts. Then follow the step-by-step instructions below for TradeStation 2000i® or ProSuite®. For TradeStation Open Platform® please skip to page seven.
TradeStation 2000i® & ProSuite®
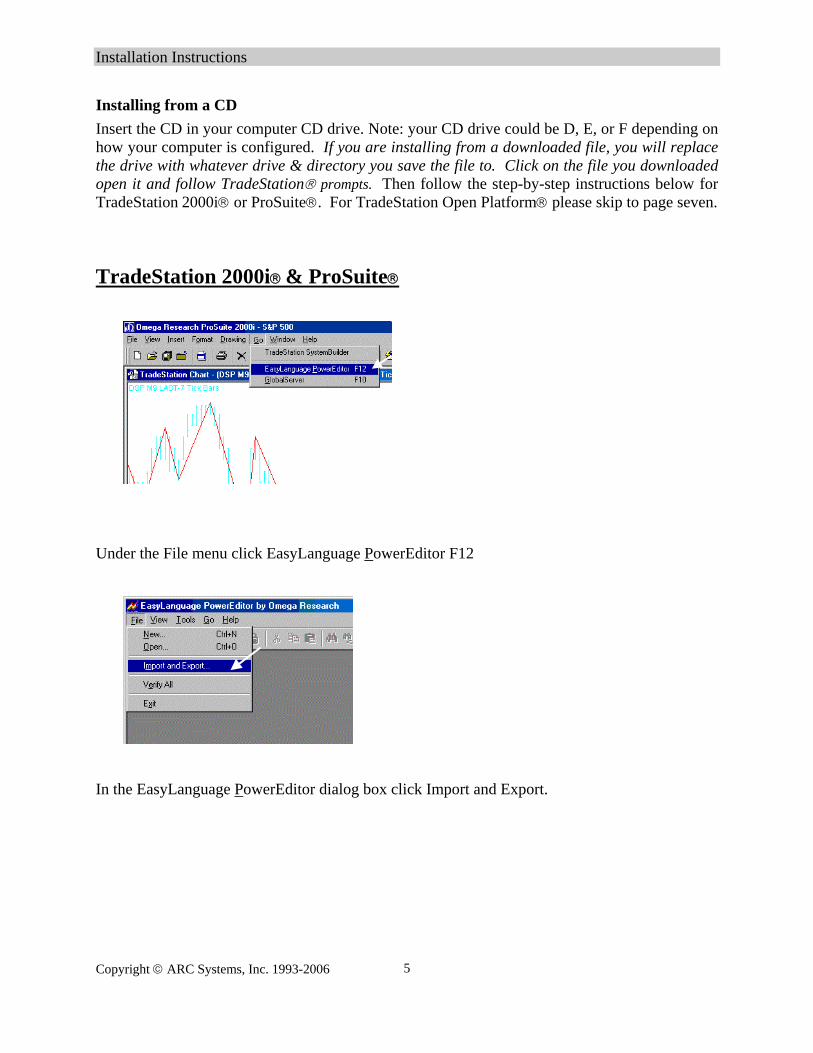
Under the File menu click EasyLanguage PowerEditor F12
In the EasyLanguage PowerEditor dialog box click Import and Export.
Copyright © ARC Systems, Inc. 1993-2006 5
Installation Instructions
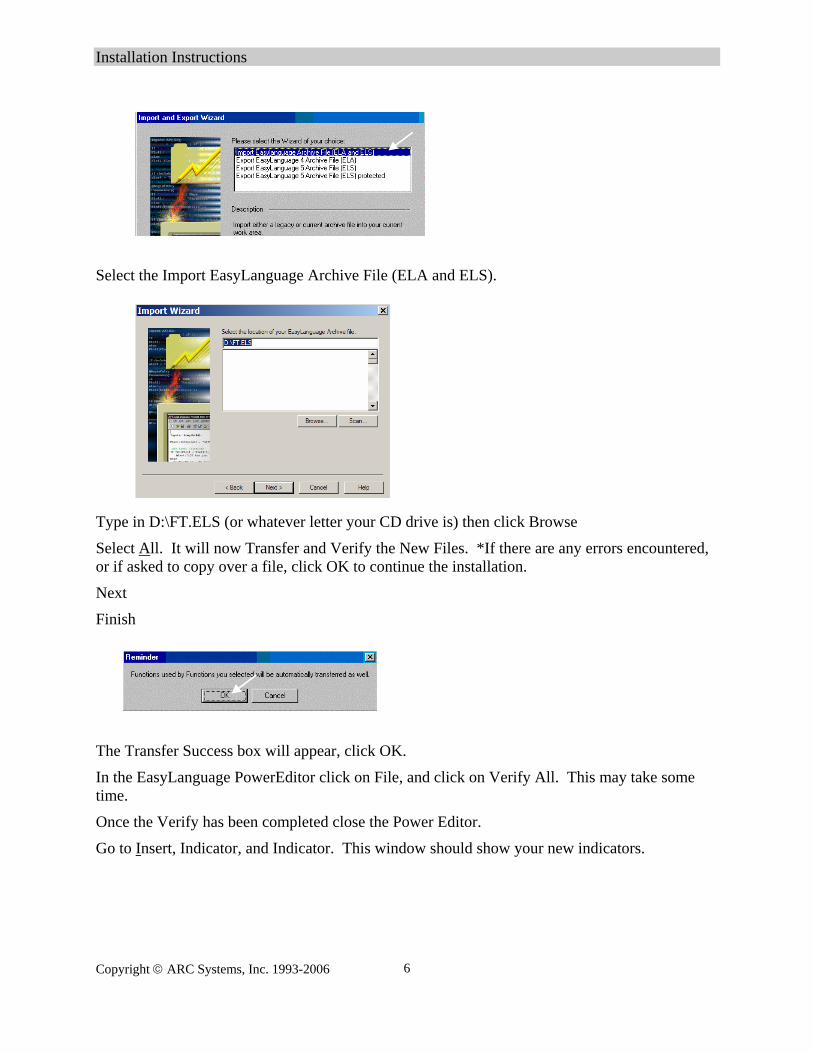
Select the Import EasyLanguage Archive File (ELA and ELS).
Type in D:\FT.ELS (or whatever letter your CD drive is) then click Browse
Select All. It will now Transfer and Verify the New Files. *If there are any errors encountered, or if asked to copy over a file, click OK to continue the installation.
Next
Finish
The Transfer Success box will appear, click OK.
In the EasyLanguage PowerEditor click on File, and click on Verify All. This may take some time.
Once the Verify has been completed close the Power Editor.
Go to Insert, Indicator, and Indicator. This window should show your new indicators.
Copyright © ARC Systems, Inc. 1993-2006 6
Installation Instructions
All indicators should now be available in your Insert Analysis Techniques dialog box. It is recommended that you only plot one Indicator at a time starting with the Kelly’s CCI Ex-pert, etc. After you familiarize yourself with one, then plot another. If this indicator plots, then all the other indicators will plot and work fine. If an indicator doesn’t plot, then it is just a matter of the settings being set incorrectly for this particular indicator. The problem would be one of the following: not enough, or too much, data on the chart and/or the MaxBarsBack setting is incorrect.
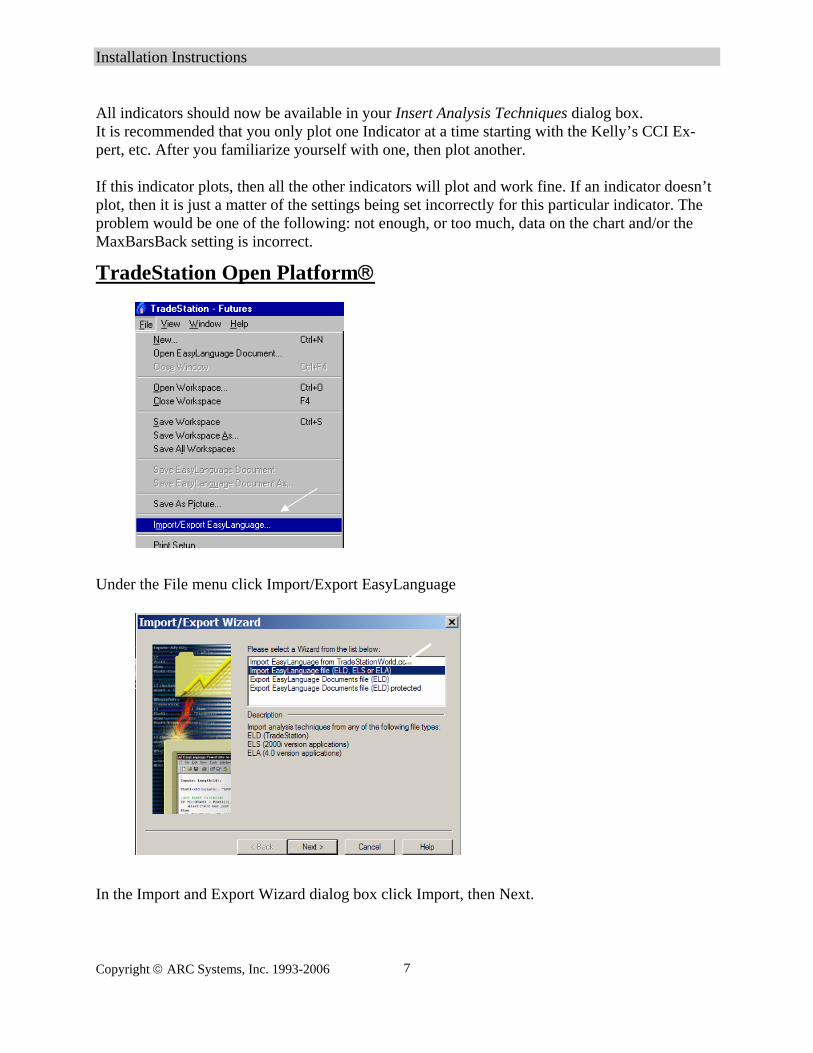
TradeStation Open Platform®
Under the File menu click Import/Export EasyLanguage
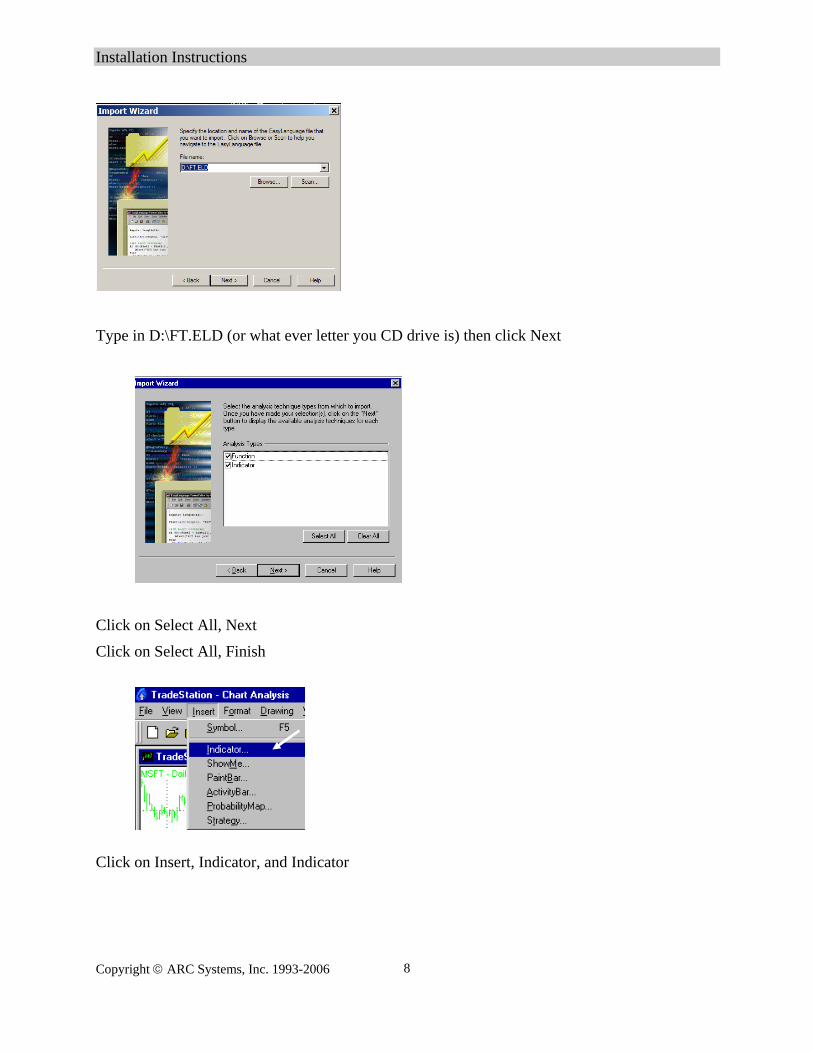
In the Import and Export Wizard dialog box click Import, then Next.
Copyright © ARC Systems, Inc. 1993-2006 7
Installation Instructions
Type in D:\FT.ELD (or what ever letter you CD drive is) then click Next
Click on Select All, Next
Click on Select All, Finish
Click on Insert, Indicator, and Indicator
Copyright © ARC Systems, Inc. 1993-2006 8

Installation Instructions
Click on the indicator to be plotted, and OK It is recommended that you only plot one Indicator at a time starting with the Kelly’s CCI Ex-pert, and so on. After you familiarize yourself with one, then plot another. If this indicator plots, then all the other indicators will plot and work fine. If an indicator doesn’t plot, then it is just a matter of the settings being set incorrectly for this particular indicator. The problem would be one of the following: not enough, or too much, data on the chart and/or the MaxBarsBack setting is incorrect.
Special Notes: If you contact TradeStation, Inc. and speak to one of their Technical Support Personnel concern-ing a problem you are having with TradeStation® you may be told that the problem you are ex-periencing is due to 3rd party software. This would not necessarily be correct information—especially in regards to my indicators. I assure you—my indicators are completely compatible with TradeStation®. They have been tested by TradeStation, Inc. Quality Assurance Department and have cleared all compatibility testing.
If for any reason you get an error message saying, “not verified” on any of our indicators (or user functions), do the following:
Go to File, Open EasyLanguage Document. In the “Select Analysis Type” make sure it says “In-dicator”; if not change it to “Indicator”. Click on %Chg, Open, View, EasyLanguage Prefer-ences, General, Verify All. After the Verify All is done, close down whatever windows are needed to get back to TradeStation Platform®. If you run into any problems doing a “Verify All”, call TradeStation Technologies, Inc. at (800) 822-1072 and ask them for help on how to do a “Verify All”.
Copyright © ARC Systems, Inc. 1993-2006 9
Installation Instructions
Important Information:
If you are having problems with TradeStation Open Platform® giving you error messages, in-cluding User Functions or Indicators not verifying, locking up, and/or other errors, you may need to call TradeStation, Inc. for tech support. When you do so, the tech support people are trained to have you re-name their program folder to “old”. Then they will have you download their lat-est program. Sometimes this is needed, but in most cases doing this is not necessary. If you want to save time and aggravation, first try deleting your workspace and rebuilding it; this will fix about 95% of all problems in TradeStation Platform®. If that does not work, then call TradeStation, Inc. for tech. support.
Copyright © ARC Systems, Inc. 1993-2006 10
Identification of Cycles, Turn Points, Swing Points
Every time chart has a dominant trading cycle of 14-25 bars, with most cycles averaging 15-22 bars from low to low, it’s this cycle that is used to trade the market. The Cycle Strength indica-tor is a spectral analysis program that identifies the dominant trading cycle in any market, and any time frame. Once a cycle length is identified, the Dynamic Cycle Forecaster will forecast the most probable time periods for a cycle to top and bottom. All price activity is comprised of “swings” of various degrees—major, intermediate and minor. Every trading cycle bottom is a swing low, and every trading cycle top is a swing high. But, every swing low is not a tradable cycle bottom; nor is every swing high a tradable cycle top. Be-tween trading cycle tops and bottoms there can be one or more swings. This tool kit is designed to identify the swing highs and lows that are tops and bottoms of the trading cycle. There are several ways of identifying swing highs and lows. In this tool kit we use two major techniques. The first is to identify a swing high as a bar whose high is higher than the high of a given number of bars preceding it and the high of a given number of bars after it. For example, a swing high with strength of 5 would be defined as a bar whose high is higher than the high of the five bars preceding it and the high of the five bars after it. This method does not insure that a 5 swing high will be followed by a 5 swing low; several swing highs or lows of a different strength may be encountered before a 5 swing low, but it is useful in automatically plotting TrendLines. A second method of identifying swing highs and lows is by defining a fixed price reversal in terms of percentage, dollars, or points, which must occur after a suspected swing high or low be-fore that swing turning point can be confirmed. This method assures that a swing high will al-ways be followed by a swing low and is very effective in most dynamic swing analysis studies. Those indicators in this package which have a “Strength” input perimeter will follow the first method of identifying swing highs and lows. The programs in this package that have “CycStren” and “UsePnts” input perimeters utilize the second method for identifying swing highs and lows.
Special Note: There are some stocks, mutual funds, and commodities for which the indi-cators using the “CycStren” as an input will not work. This is because the price range is so small the cycles do not have sufficient amplitude to find the cycle strength. Under the Kelly’s Cycle_ID 2 indicator section we will cover a solution for this and you will need the information below to make the indicators work. Therefore, the sensitivity of the indi-cator is controlled by the input variable “CycStren”. If “CycStren” is set to “0” it is in auto mode. If “CycStren” is set to 1 and “UsePnts” is set to False, a reversal in price of at least 1 percent from the most recent high or low is required to define it as a new swing high or low. Fractional percentages are acceptable. For example, in the S&P a typical percent change on a 1-minute chart may be .10% to .25%, while on a daily chart it may be 1% to 5%. On the other hand, if “UsePnts” is set to True and “CycStren” is set to 0.80 a reversal in price of at least 8 ticks from the most recent high or low is required to define it as a new swing high or low.
Copyright © ARC Systems, Inc. 1993-2006 11
TrendLine Plot Statement
A tick is defined by TradeStation Technologies as “the smallest tradable increment in the price of an instrument.” In most stocks, a tick is 0.01. In the S&P, one tick is 0.10 point—but in the e-mini it is 0.25. If any of the indicators do not plot, decrease the “MaxBarsBack” setting; then try adding more data.
Note: The TrendPro™ Indicators are not part of The Floor Traders Tool™. They are four separate indicators. They can work independently of The Floor Traders Tools™, but preferably they should be used in conjunction with it.
TradeStation® TrendLine Drawing Tools; There are many of my indicators that use a TradeStation® TrendLine plot statement. Here is a list of them: Trident, Filtered WavesTL, TrendLine Up/Dn, Price Exhaustion, Fib Retracements, Fib Extensions, and Dynamic Stops. To change a Color, Style, or Size of the TrendLine plot statement go to the indicator inputs. Some of the indicators are missing “Size” or “Style”—this is due to the way TradeStation® handles the TrendLine plot statement for that indicator. Here is a list of the different settings that can be used. Color: Cyan, Black, Blue, DarkBlue, DarkRed, DarkBrown, DarkMagenta, DarkGreen, Dark-Gray, Green, LightGray, Magenta, Red, White, and Yellow. Size: 0 through 6—This is the thickness of the TrendLine plot. If it is set to any Size over 0, then the Style will only plot a Solid line. Style: 1 (or Tool_Solid), 2 (or Tool_Dashed), 3 (or Tool_Dotted), 4 (or Tool_Dashed2), 5 (or Tool_Dashed3). FOREX Most markets trade in decimal increments of 0.01, the FOREX trades in decimal increments of 0.0001. So any indicator “Input” that works with a price, and has a default price input of two decimal points, would need to be changed to four decimal points for the FOREX markets. For an example let’s use my Fib Confluence indicator the input called “MidPrice” is set to 3.0 (meaning 3 points). That wouldn’t work for the FOREX market; it would need to be changed to 0.0003. To help resolve this issue, I have added some indicators with –FX after them which are pre-set for the FOREX markets; however, some adjustments may still be needed for best performance. Below are few examples of some of the indicators that may need some adjusting. *RK Trident-FX *RK Trident Major-FX *RK Price Exhaustion-FX *RK Pitchfork-FX *RK Confluence-FX Copyright © ARC Systems, Inc. 1993-2006 12

Cycle Strength—Kelly’s ID
Copyright © ARC Systems, Inc. 1993-2006 13
Please Read all of the below. I have included the old Kelly’s Cyc_ID and the Cycle Strength Indicator for the traders who have been using them for some time and still like to use them. Therefore, it is not necessary to use or plot these indicators (unless needed as explained later in this manual).
Please Note: I receive many phone calls from clients who say, “I plotted the Cycle Strength Indicator, and it shows nothing.” The reason for this is that it only plots a number after the indica-tor. An example of this would be (*RK Cycle Strength 4.5) as you can see in the chart. Remember: This Indicator is not needed unless you prefer to plot the Indicators the old way.
Tips & Techniques For those who want to plot it the manual way, we have added an input to the Cycle Strength in-dicator called DecimalPlace. This input moves the decimal over the number of places needed for the market being traded. For most markets the default setting works; however, for markets like the FOREX, you will need to change it from the default setting to 4 to get the correct reading.
Style Default Color Percent Val Yellow Inputs Default Description DecimalPlace 2 The Range is 1- number needed for the
market being traded.
Kelly’s Cycle Identifier 2 *RK Kelly’s Cycle_ID 2
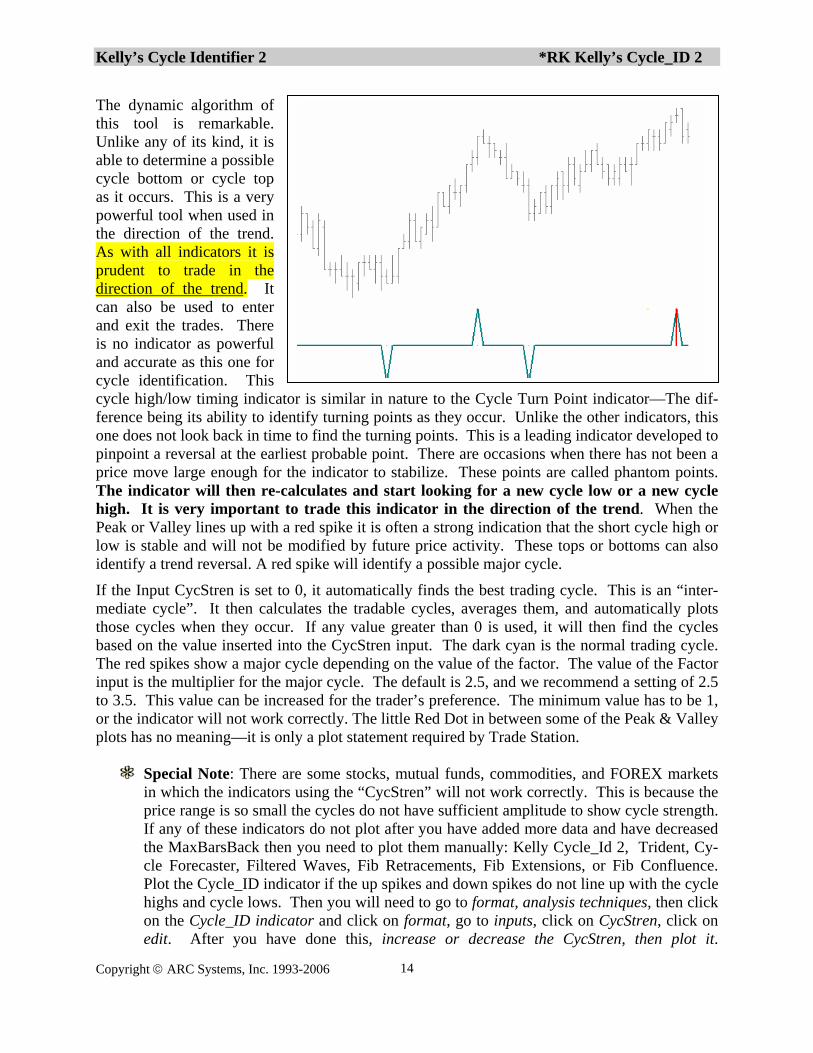
The dynamic algorithm of this tool is remarkable. Unlike any of its kind, it is able to determine a possible cycle bottom or cycle top as it occurs. This is a very powerful tool when used in the direction of the trend. As with all indicators it is prudent to trade in the direction of the trend. It can also be used to enter and exit the trades. There is no indicator as powerful and accurate as this one for cycle identification. This cycle high/low timing indicator is similar in nature to the Cycle Turn Point indicator—The dif-ference being its ability to identify turning points as they occur. Unlike the other indicators, this one does not look back in time to find the turning points. This is a leading indicator developed to pinpoint a reversal at the earliest probable point. There are occasions when there has not been a price move large enough for the indicator to stabilize. These points are called phantom points. The indicator will then re-calculates and start looking for a new cycle low or a new cycle high. It is very important to trade this indicator in the direction of the trend. When the Peak or Valley lines up with a red spike it is often a strong indication that the short cycle high or low is stable and will not be modified by future price activity. These tops or bottoms can also identify a trend reversal. A red spike will identify a possible major cycle.
If the Input CycStren is set to 0, it automatically finds the best trading cycle. This is an “inter-mediate cycle”. It then calculates the tradable cycles, averages them, and automatically plots those cycles when they occur. If any value greater than 0 is used, it will then find the cycles based on the value inserted into the CycStren input. The dark cyan is the normal trading cycle. The red spikes show a major cycle depending on the value of the factor. The value of the Factor input is the multiplier for the major cycle. The default is 2.5, and we recommend a setting of 2.5 to 3.5. This value can be increased for the trader’s preference. The minimum value has to be 1, or the indicator will not work correctly. The little Red Dot in between some of the Peak & Valley plots has no meaning—it is only a plot statement required by Trade Station.
Special Note: There are some stocks, mutual funds, commodities, and FOREX markets in which the indicators using the “CycStren” will not work correctly. This is because the price range is so small the cycles do not have sufficient amplitude to show cycle strength. If any of these indicators do not plot after you have added more data and have decreased the MaxBarsBack then you need to plot them manually: Kelly Cycle_Id 2, Trident, Cy-cle Forecaster, Filtered Waves, Fib Retracements, Fib Extensions, or Fib Confluence. Plot the Cycle_ID indicator if the up spikes and down spikes do not line up with the cycle highs and cycle lows. Then you will need to go to format, analysis techniques, then click on the Cycle_ID indicator and click on format, go to inputs, click on CycStren, click on edit. After you have done this, increase or decrease the CycStren, then plot it.
Copyright © ARC Systems, Inc. 1993-2006 14

Kelly’s Cycle Identifier 2 continued *RK Kelly’s Cycle_ID 2
You will have to repeat this procedure until the Cycle_ID lines up with the cycle highs and cycle lows. For an example we will reference the British Pound. The trading range is so small that we would use a CycStren of 0.025. On a daily Bond chart you would need a CycStren setting of 0.90. There is a learning curve at first. Once you get use to it, it becomes very easy.
*A larger multiple can be used and adjusted for user preference. There is some experimen-tation needed to find the best setting for each chart. Tips & Techniques
You can plot this indicator in the same sub-graph as an RSI or Stochastic.
Style Default Color Cycle_ID Red Cycle_ID Dark Cyan Phantom Yellow Inputs Default Description CycStren 0 The Range is 0-200, for most markets leave at 0 for auto mode. Factor 2.5 This input has to be 1 or greater. The recommended range is between 2.5–5.0. Percent 2.25 This setting should be > 0. Experimentation is needed to find the best setting for the market being traded. MinBars 1 This is the number of bars after a
possible cycle required to make it plot. The range is 1-4. UsePnts True If set to True, it uses a point value, if set to False it will use a percent value to calculate
the cycle high or cycle low. Refer to page 12 of this manual for more information.
Reverse True Flips or reverses the way the indicator plots. The easiest way to see the difference is to plot two indicators with this input set at true for one indicator, and the other set at false. HighPrice Close This setting can be changed to high, low, open, or close. LowPrice Close This setting can be changed to high, low open, or close.
Copyright © ARC Systems, Inc. 1993-2006 15

Filtered Waves *RK Filtered Waves
Copyright © ARC Systems, Inc. 1993-2006 16
The dynamics of this indicator are quite complex. It analyzes past data to determine the cycle patterns and then calculates the overall direction of the trend. This study plots a Filtered Wave pair of parallel dotted lines at a set distance above and below the median price. Standard deviations and a calculated percentage value set the distance from the median price to the wave lines. To calculate the starting point for the Filtered Wave, this study automatically detects the most recent cycle high pivot or cycle low pivot of the price chart. The size of price reversal required defining a major cycle reversal, and therefore, the sensitivity of the indicator, is con-trolled by the input variable CycSten. A Filtered Wave channel will begin whenever a cycle of the magnitude of a given number of points or percentage values occurs. When the channels are in an up trend look for cycle lows for buy setups, when the channels are in a down trend look for cycle highs for sell setups.
Tips & Techniques In a trendy market the price bars in the Filtered Waves begin to compress the data making
it difficult to view the cycles. To view the price bars as normal, change the ShowBoth input setting to false. Then in a downtrend only the upper slope will plot, and in an up trend only the lower slope will plot. Or you can use the one with TL after the name. The ones with an * are for the ones with TL after them. There are two filtered waves’ indica-tors. The only difference in the two is the type of Plot Statement used by the Indicator. The ones with TL after the name uses the TradeStation® TrendLines Plot Statement; whereas, the other one uses the normal plot statement.
Style Default Color
UpperSlope Red LowerSlope Green UpperSlope Yellow LowerSlope Yellow
Filtered Waves continued *RK Filtered Waves
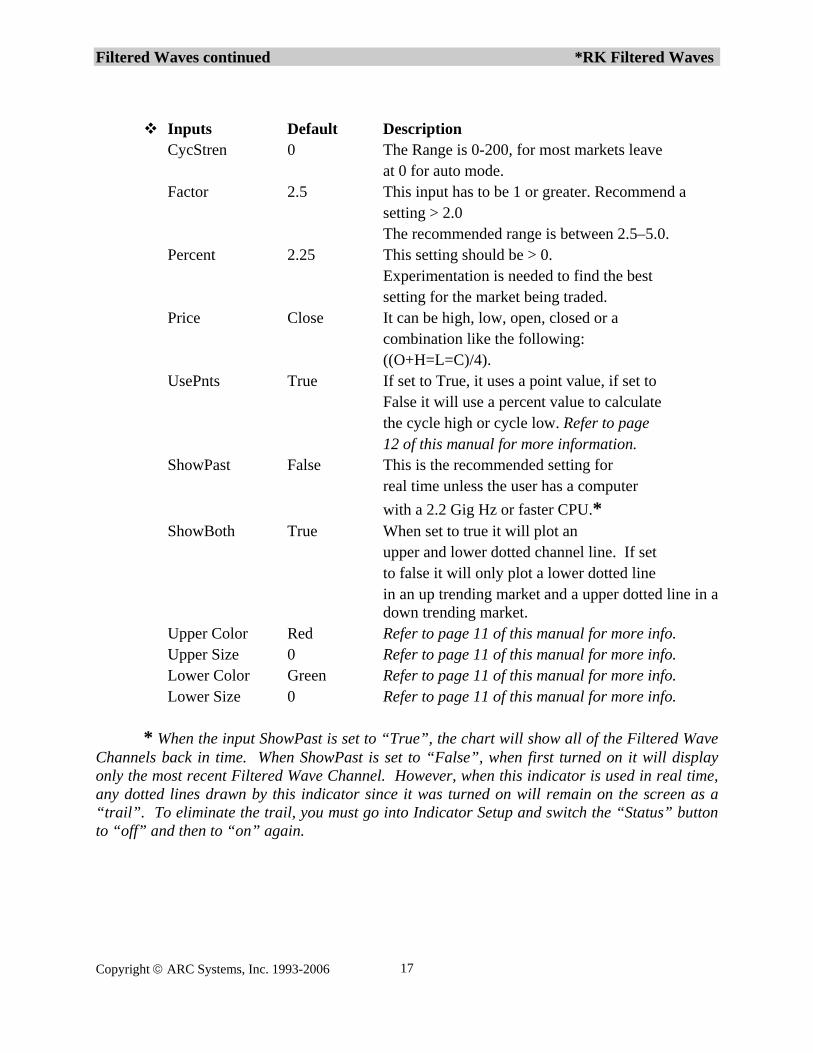
Inputs Default Description
CycStren 0 The Range is 0-200, for most markets leave at 0 for auto mode. Factor 2.5 This input has to be 1 or greater. Recommend a
setting > 2.0 The recommended range is between 2.5–5.0. Percent 2.25 This setting should be > 0. Experimentation is needed to find the best setting for the market being traded. Price Close It can be high, low, open, closed or a combination like the following: ((O+H=L=C)/4). UsePnts True If set to True, it uses a point value, if set to False it will use a percent value to calculate
the cycle high or cycle low. Refer to page 12 of this manual for more information.
ShowPast False This is the recommended setting for real time unless the user has a computer with a 2.2 Gig Hz or faster CPU.*
ShowBoth True When set to true it will plot an upper and lower dotted channel line. If set
to false it will only plot a lower dotted line in an up trending market and a upper dotted line in a down trending market.
Upper Color Red Refer to page 11 of this manual for more info. Upper Size 0 Refer to page 11 of this manual for more info. Lower Color Green Refer to page 11 of this manual for more info. Lower Size 0 Refer to page 11 of this manual for more info.
* When the input ShowPast is set to “True”, the chart will show all of the Filtered Wave Channels back in time. When ShowPast is set to “False”, when first turned on it will display only the most recent Filtered Wave Channel. However, when this indicator is used in real time, any dotted lines drawn by this indicator since it was turned on will remain on the screen as a “trail”. To eliminate the trail, you must go into Indicator Setup and switch the “Status” button to “off” and then to “on” again.
Copyright © ARC Systems, Inc. 1993-2006 17
Cycle Turn Points *RK Turn Points
Copyright © ARC Systems, Inc. 1993-2006 18
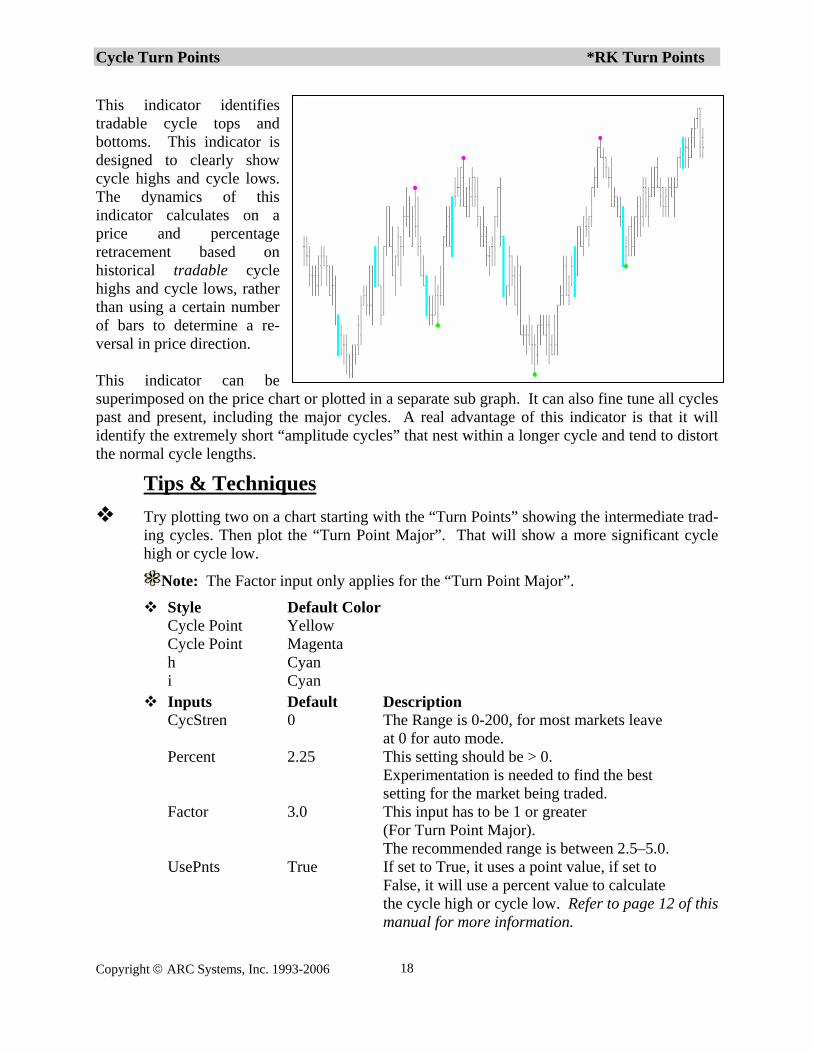
This indicator identifies tradable cycle tops and bottoms. This indicator is designed to clearly show cycle highs and cycle lows. The dynamics of this indicator calculates on a price and percentage retracement based on historical tradable cycle highs and cycle lows, rather than using a certain number of bars to determine a re-versal in price direction. This indicator can be superimposed on the price chart or plotted in a separate sub graph. It can also fine tune all cycles past and present, including the major cycles. A real advantage of this indicator is that it will identify the extremely short “amplitude cycles” that nest within a longer cycle and tend to distort the normal cycle lengths.
Tips & Techniques Try plotting two on a chart starting with the “Turn Points” showing the intermediate trad-
ing cycles. Then plot the “Turn Point Major”. That will show a more significant cycle high or cycle low.
Note: The Factor input only applies for the “Turn Point Major”.
Style Default Color Cycle Point Yellow Cycle Point Magenta h Cyan i Cyan
Inputs Default Description CycStren 0 The Range is 0-200, for most markets leave at 0 for auto mode. Percent 2.25 This setting should be > 0. Experimentation is needed to find the best
setting for the market being traded. Factor 3.0 This input has to be 1 or greater
(For Turn Point Major). The recommended range is between 2.5–5.0.
UsePnts True If set to True, it uses a point value, if set to False, it will use a percent value to calculate
the cycle high or cycle low. Refer to page 12 of this manual for more information.
Swing High & Low *RK Swing H/L
Copyright © ARC Systems, Inc. 1993-2006 19
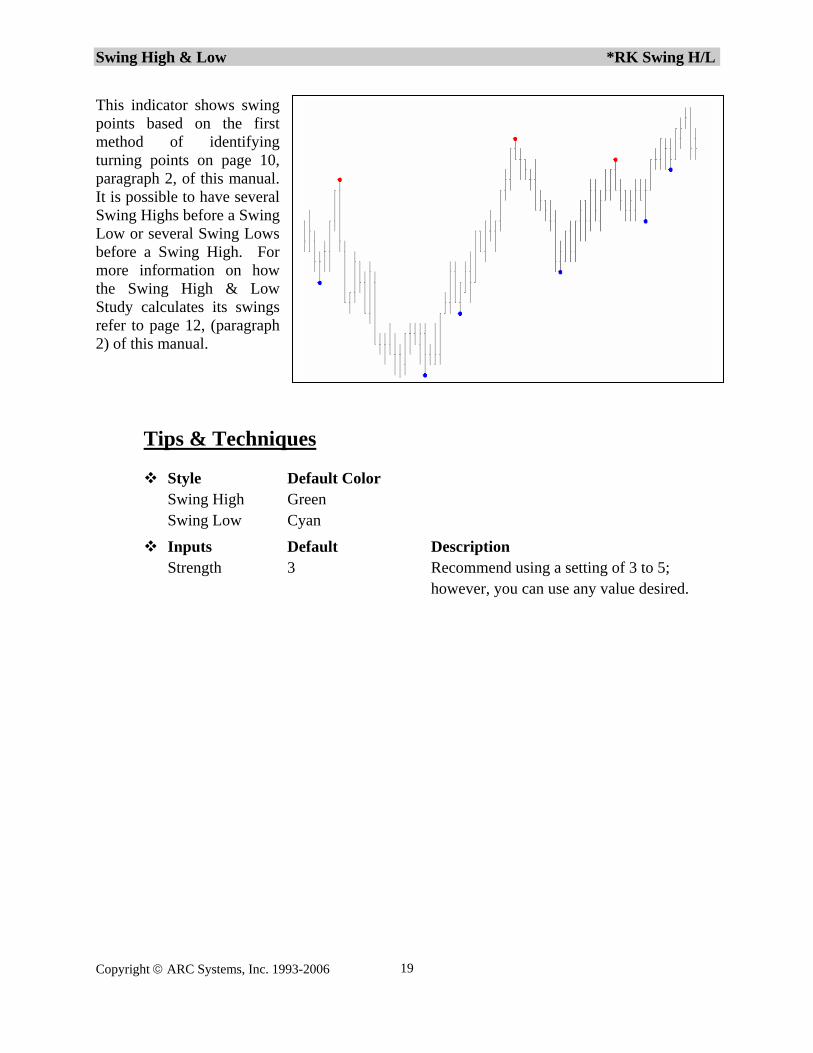
This indicator shows swing points based on the first method of identifying turning points on page 10, paragraph 2, of this manual. It is possible to have several Swing Highs before a Swing Low or several Swing Lows before a Swing High. For more information on how the Swing High & Low Study calculates its swings refer to page 12, (paragraph 2) of this manual.
Tips & Techniques
Style Default Color Swing High Green Swing Low Cyan
Inputs Default Description Strength 3 Recommend using a setting of 3 to 5; however, you can use any value desired.
Dynamic Cycle Forecaster *RK Cycle Forecaster
Copyright © ARC Systems, Inc. 1993-2006 20
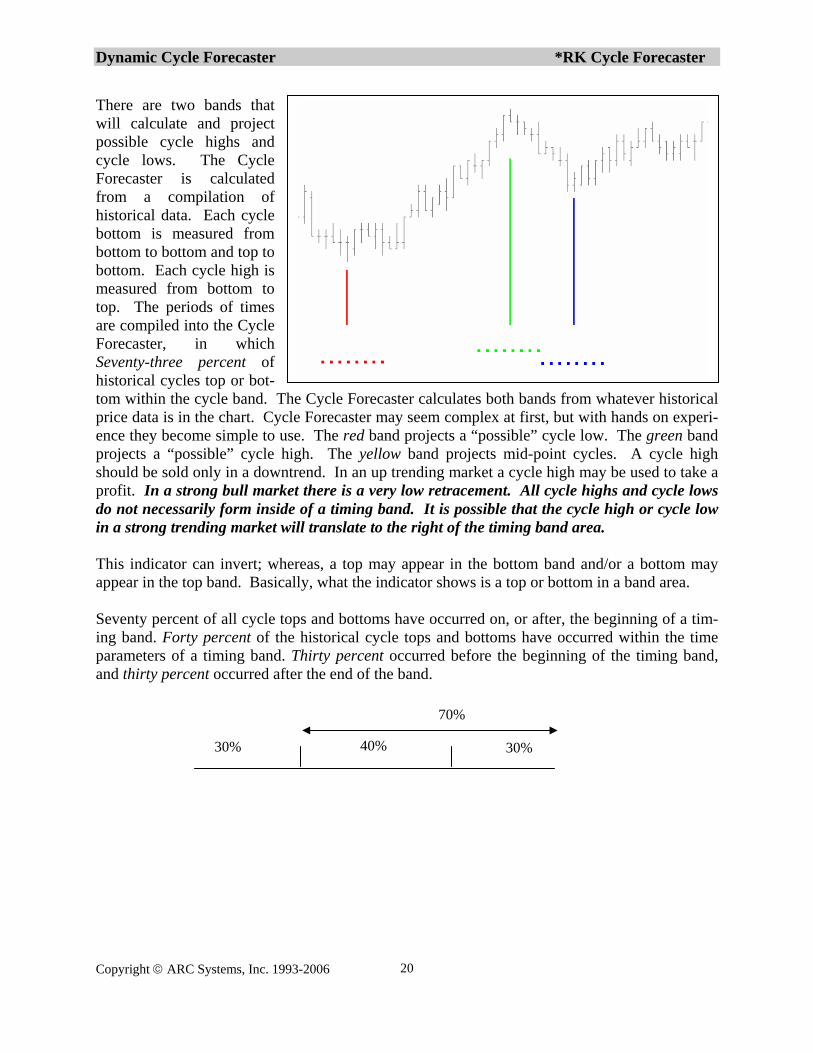
There are two bands that will calculate and project possible cycle highs and cycle lows. The Cycle Forecaster is calculated from a compilation of historical data. Each cycle bottom is measured from bottom to bottom and top to bottom. Each cycle high is measured from bottom to top. The periods of times are compiled into the Cycle Forecaster, in which Seventy-three percent of historical cycles top or bot-tom within the cycle band. The Cycle Forecaster calculates both bands from whatever historical price data is in the chart. Cycle Forecaster may seem complex at first, but with hands on experi-ence they become simple to use. The red band projects a “possible” cycle low. The green band projects a “possible” cycle high. The yellow band projects mid-point cycles. A cycle high should be sold only in a downtrend. In an up trending market a cycle high may be used to take a profit. In a strong bull market there is a very low retracement. All cycle highs and cycle lows do not necessarily form inside of a timing band. It is possible that the cycle high or cycle low in a strong trending market will translate to the right of the timing band area. This indicator can invert; whereas, a top may appear in the bottom band and/or a bottom may appear in the top band. Basically, what the indicator shows is a top or bottom in a band area. Seventy percent of all cycle tops and bottoms have occurred on, or after, the beginning of a tim-ing band. Forty percent of the historical cycle tops and bottoms have occurred within the time parameters of a timing band. Thirty percent occurred before the beginning of the timing band, and thirty percent occurred after the end of the band.
30%
70%
40% 30%
Dynamic Cycle Forecaster continued *RK Cycle Forecaster
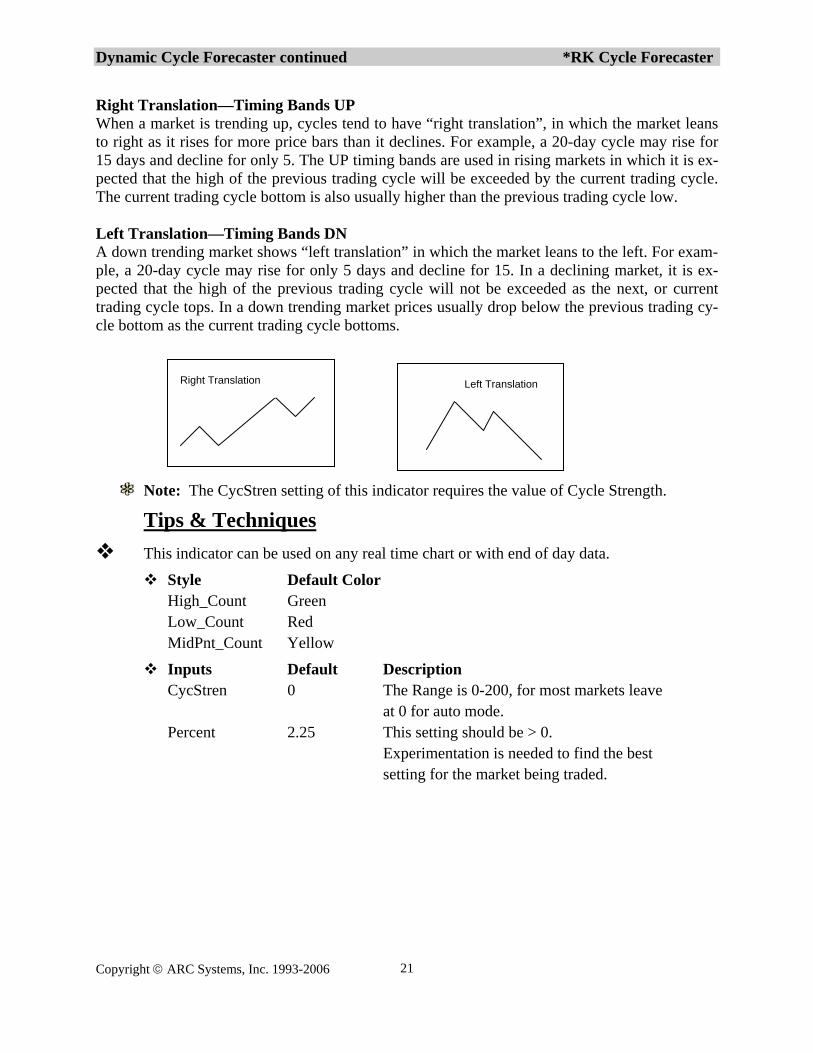
Right Translation—Timing Bands UP When a market is trending up, cycles tend to have “right translation”, in which the market leans to right as it rises for more price bars than it declines. For example, a 20-day cycle may rise for 15 days and decline for only 5. The UP timing bands are used in rising markets in which it is ex-pected that the high of the previous trading cycle will be exceeded by the current trading cycle. The current trading cycle bottom is also usually higher than the previous trading cycle low. Left Translation—Timing Bands DN A down trending market shows “left translation” in which the market leans to the left. For exam-ple, a 20-day cycle may rise for only 5 days and decline for 15. In a declining market, it is ex-pected that the high of the previous trading cycle will not be exceeded as the next, or current trading cycle tops. In a down trending market prices usually drop below the previous trading cy-cle bottom as the current trading cycle bottoms.
Right Translation Left Translation
Note: The CycStren setting of this indicator requires the value of Cycle Strength.
Tips & Techniques This indicator can be used on any real time chart or with end of day data.
Style Default Color High_Count Green Low_Count Red MidPnt_Count Yellow
Inputs Default Description CycStren 0 The Range is 0-200, for most markets leave at 0 for auto mode. Percent 2.25 This setting should be > 0. Experimentation is needed to find the best setting for the market being traded.
Copyright © ARC Systems, Inc. 1993-2006 21
Fib Retracements *RK Fib Retracements
Copyright © ARC Systems, Inc. 1993-2006 22
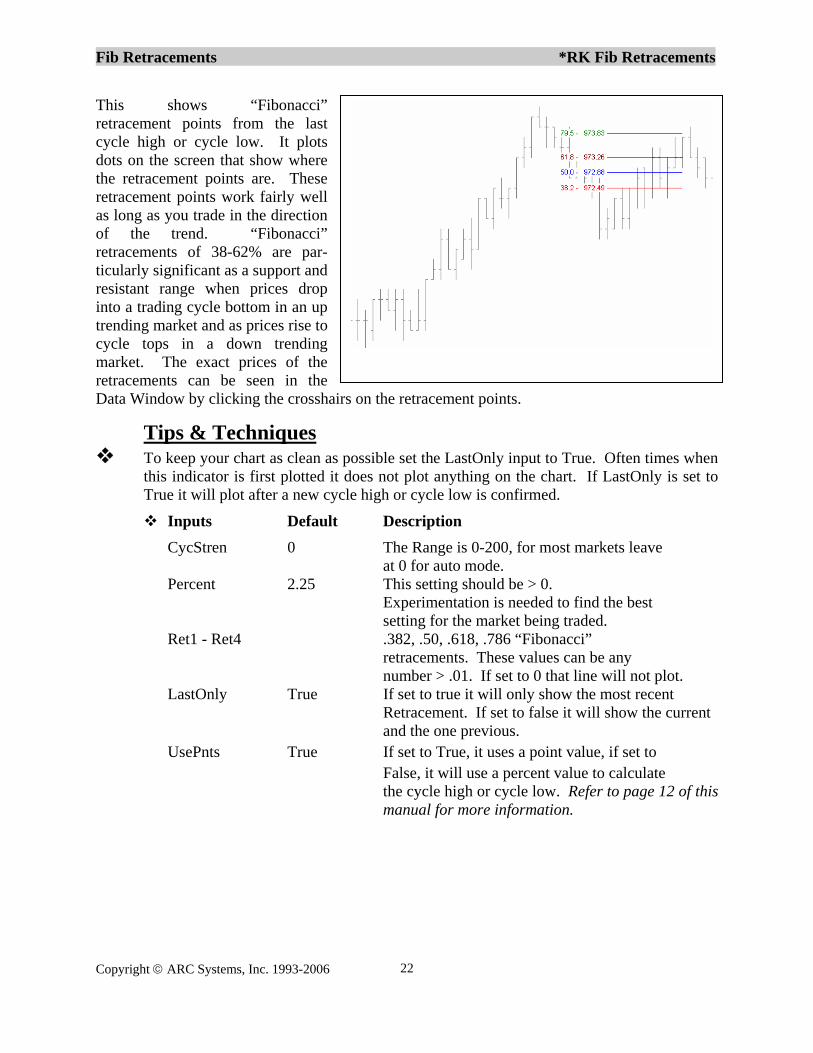
This shows “Fibonacci” retracement points from the last cycle high or cycle low. It plots dots on the screen that show where the retracement points are. These retracement points work fairly well as long as you trade in the direction of the trend. “Fibonacci” retracements of 38-62% are par-ticularly significant as a support and resistant range when prices drop into a trading cycle bottom in an up trending market and as prices rise to cycle tops in a down trending market. The exact prices of the retracements can be seen in the Data Window by clicking the crosshairs on the retracement points.
Tips & Techniques To keep your chart as clean as possible set the LastOnly input to True. Often times when
this indicator is first plotted it does not plot anything on the chart. If LastOnly is set to True it will plot after a new cycle high or cycle low is confirmed.
Inputs Default Description CycStren 0 The Range is 0-200, for most markets leave at 0 for auto mode. Percent 2.25 This setting should be > 0. Experimentation is needed to find the best setting for the market being traded. Ret1 - Ret4 .382, .50, .618, .786 “Fibonacci” retracements. These values can be any
number > .01. If set to 0 that line will not plot. LastOnly True If set to true it will only show the most recent Retracement. If set to false it will show the current and the one previous. UsePnts True If set to True, it uses a point value, if set to False, it will use a percent value to calculate
the cycle high or cycle low. Refer to page 12 of this manual for more information.
Fib Retracements continued *RK Fib Retracements
Inputs Default Color Description Ret1Color Red Refer to page 11 of this manual for more Information. Ret2Color Yellow Refer to page 11 of this manual for more Information. Ret3Color Cyan Refer to page 11 of this manual for more Information. Ret 4Color Green Refer to page 11 of this manual for more Information. LineStyle Solid Refer to page 11 of this manual for more Information.
Copyright © ARC Systems, Inc. 1993-2006 23
Auto TrendLines *RK TrendLineUp *RK TrendLineDn
Copyright © ARC Systems, Inc. 1993-2006 24
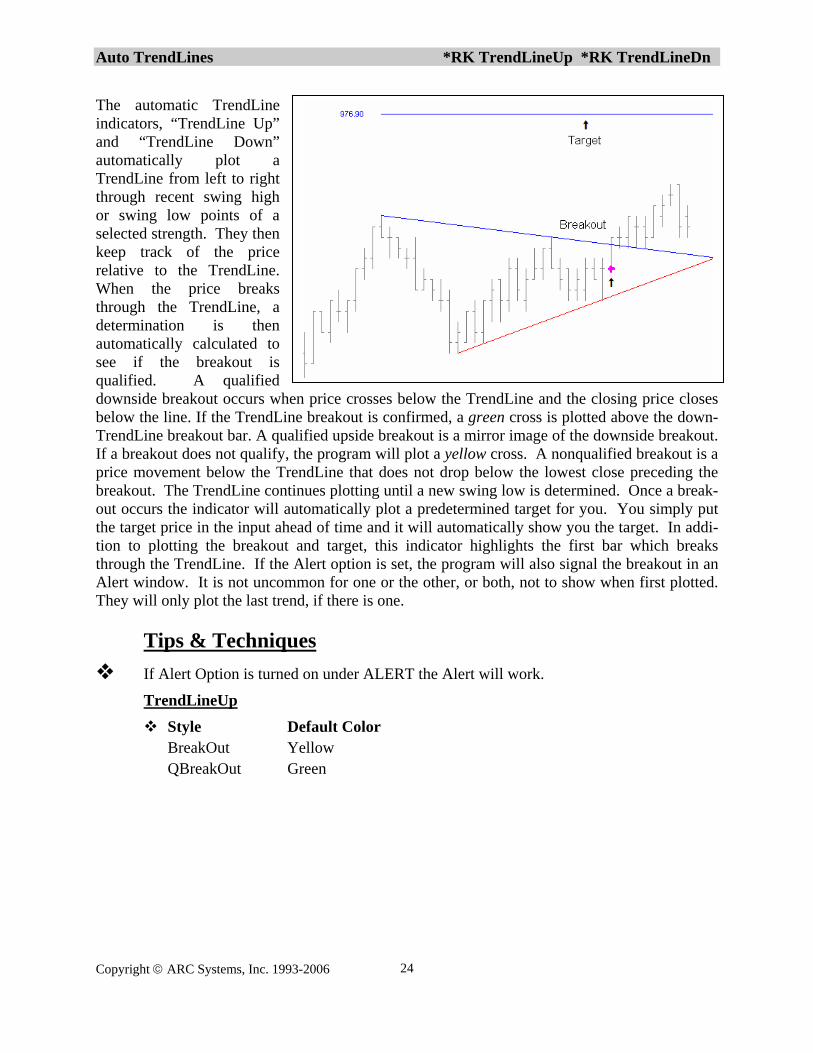
The automatic TrendLine indicators, “TrendLine Up” and “TrendLine Down” automatically plot a TrendLine from left to right through recent swing high or swing low points of a selected strength. They then keep track of the price relative to the TrendLine. When the price breaks through the TrendLine, a determination is then automatically calculated to see if the breakout is qualified. A qualified downside breakout occurs when price crosses below the TrendLine and the closing price closes below the line. If the TrendLine breakout is confirmed, a green cross is plotted above the down-TrendLine breakout bar. A qualified upside breakout is a mirror image of the downside breakout. If a breakout does not qualify, the program will plot a yellow cross. A nonqualified breakout is a price movement below the TrendLine that does not drop below the lowest close preceding the breakout. The TrendLine continues plotting until a new swing low is determined. Once a break-out occurs the indicator will automatically plot a predetermined target for you. You simply put the target price in the input ahead of time and it will automatically show you the target. In addi-tion to plotting the breakout and target, this indicator highlights the first bar which breaks through the TrendLine. If the Alert option is set, the program will also signal the breakout in an Alert window. It is not uncommon for one or the other, or both, not to show when first plotted. They will only plot the last trend, if there is one.
Tips & Techniques If Alert Option is turned on under ALERT the Alert will work.
TrendLineUp
Style Default Color BreakOut Yellow QBreakOut Green
Auto TrendLines continued *RK TrendLineUp *RK TrendLineDn
Copyright © ARC Systems, Inc. 1993-2006 25
Inputs Default Description TL_Target 3.0 This is the point value of the projected target you want to see on the screen. Strength 3 This input is the strength of the indicator.
Recommended setting is 3; however, you can experiment with this from 2-6. Refer to page 12 of this manual for more information.
Length 200 This is simply the length, or number, of bars the indicator will plot.
Recommended setting is the default. Appear 1 Shows historical plots going back starting
2, 3, 4—1 is current, 2 would be the one before it, and so on. Good for back testing. Target_Color Red Refer to page 11 of this manual for more info. Target_Size 0 Refer to page 11 of this manual for more info. Target_Style 1 Refer to page 11 of this manual for more info. TL_Color Green Refer to page 11 of this manual for more info. TL_Size 0 Refer to page 11 of this manual for more info. TL_Style 1 Refer to page 11 of this manual for more info.
ShowBko True If set to true it will show qualified and non-qualified break outs with a small yellow or green cross. ShowTarg False If set to True, it will enable TargPnt value to
plot little red crosses on the screen to show your profit target.
UseDollar False If set to True, it uses a point value for the input of the TargPnt. If set to false then
it uses dollar value for the input of the TargPnt.
TrendLineDn
Style Default Color TrendLineDn Green BreakOut Yellow QBreakOut Green
Inputs Default Description TL_Target 3.0 The point value of the projected target you want to see on the screen. Strength 3 This input is the strength of the indicator.
Recommended setting is 3; however, you can experiment with this from 2-6. Refer to page 12 of this manual for more information.
Length 200 This is simply the length, or number, of bars the indicator will plot.
Recommended setting is the default.

Auto TrendLines continued *RK TrendLineUp *RK TrendLineDn
Copyright © ARC Systems, Inc. 1993-2006 26
Inputs Default Description
Target_Color Green Refer to page 11 of this manual for more info. Target_Size 0 Refer to page 11 of this manual for more info. Target_Style 1 Refer to page 11 of this manual for more info. TL_Color Red Refer to page 11 of this manual for more info. TL_Size 0 Refer to page 11 of this manual for more info. TL_Style 1 Refer to page 11 of this manual for more info.
ShowBko True If set to True, it will show qualified and non-qualified break outs with a small yellow or green cross. ShowTarg False If set to True, it will enable TargPnt value to
plot little red crosses on the screen to show your profit target.
UseDollar False If set to True, it uses a point value for the input of the TargPnt. If set to false then
it uses dollar value for the input of the TargPnt.
Acc/Dist *RK Acc/Dist
Copyright © ARC Systems, Inc. 1993-2006 27
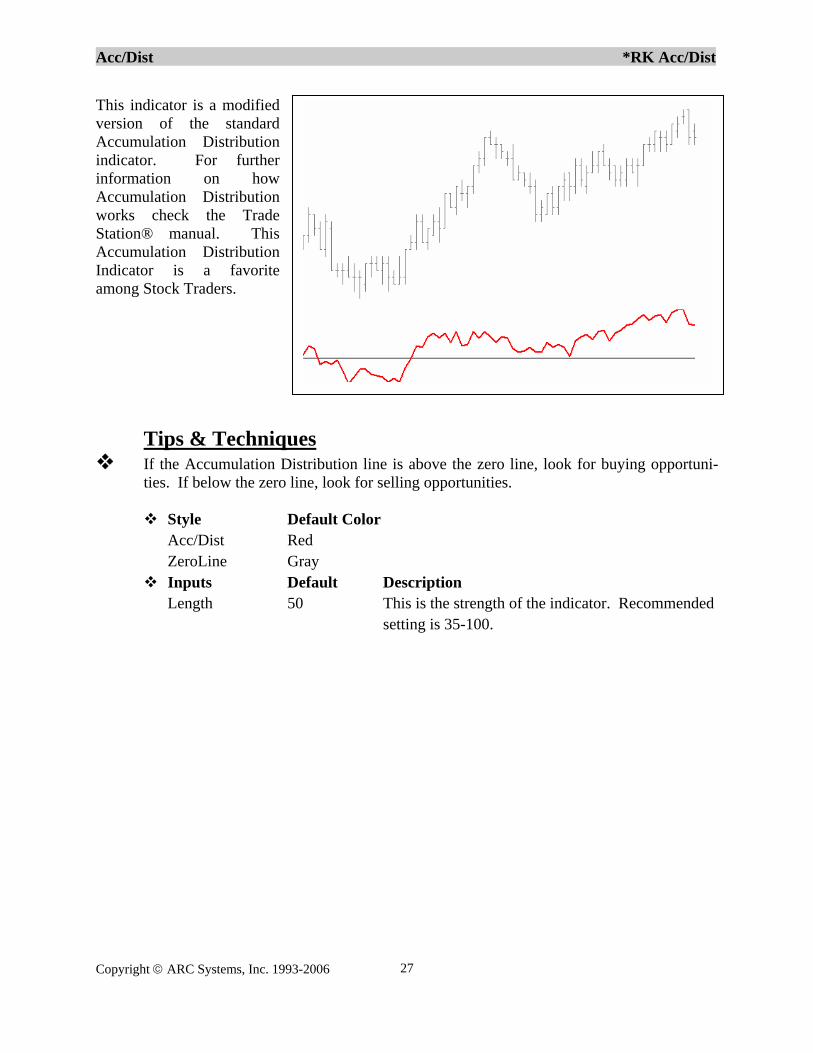
This indicator is a modified version of the standard Accumulation Distribution indicator. For further information on how Accumulation Distribution works check the Trade Station® manual. This Accumulation Distribution Indicator is a favorite among Stock Traders.
Tips & Techniques If the Accumulation Distribution line is above the zero line, look for buying opportuni-
ties. If below the zero line, look for selling opportunities.
Style Default Color Acc/Dist Red ZeroLine Gray
Inputs Default Description Length 50 This is the strength of the indicator. Recommended
setting is 35-100.
Roy Kelly CCI Expert *RK CCI Expert
Copyright © ARC Systems, Inc. 1993-2006 28
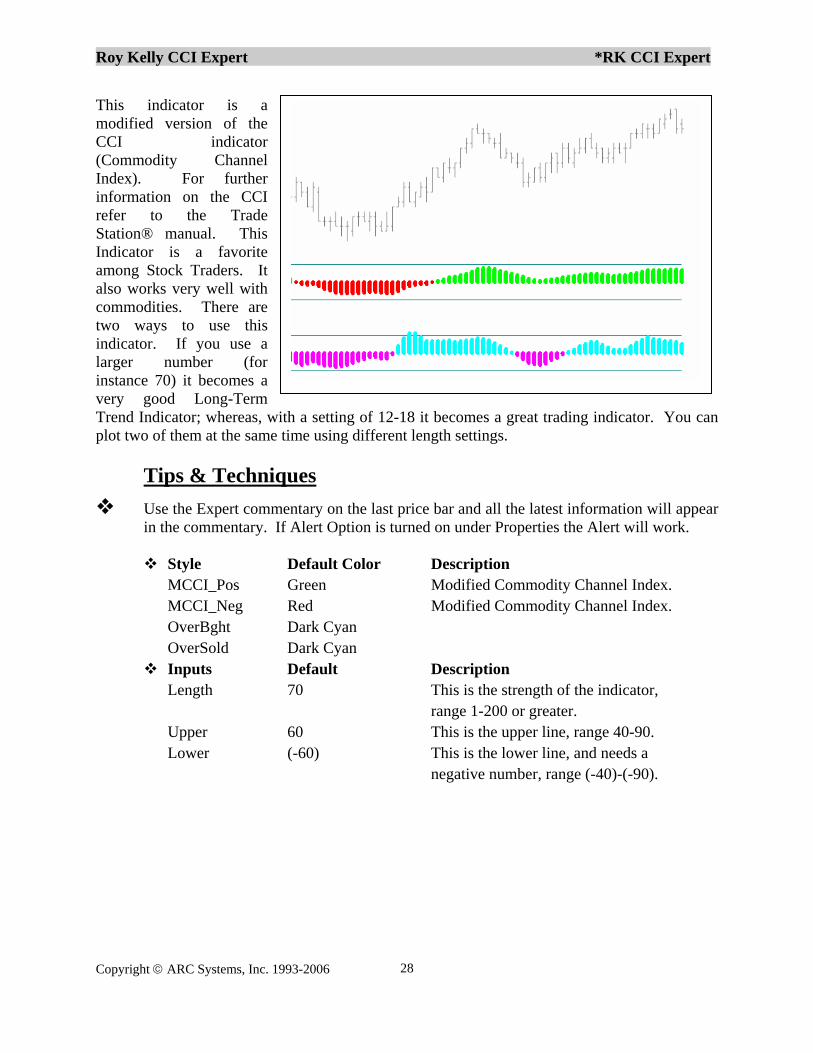
This indicator is a modified version of the CCI indicator (Commodity Channel Index). For further information on the CCI refer to the Trade Station® manual. This Indicator is a favorite among Stock Traders. It also works very well with commodities. There are two ways to use this indicator. If you use a larger number (for instance 70) it becomes a very good Long-Term Trend Indicator; whereas, with a setting of 12-18 it becomes a great trading indicator. You can plot two of them at the same time using different length settings.
Tips & Techniques Use the Expert commentary on the last price bar and all the latest information will appear
in the commentary. If Alert Option is turned on under Properties the Alert will work.
Style Default Color Description MCCI_Pos Green Modified Commodity Channel Index. MCCI_Neg Red Modified Commodity Channel Index. OverBght Dark Cyan OverSold Dark Cyan
Inputs Default Description Length 70 This is the strength of the indicator,
range 1-200 or greater. Upper 60 This is the upper line, range 40-90. Lower (-60) This is the lower line, and needs a negative number, range (-40)-(-90).

Kelly’s Trident *RK Trident
Copyright © ARC Systems, Inc. 1993-2006 29
This confirming indicator identifies the cycle tops and bottoms. This indicator is designed to clearly show and confirm cycle highs and cycle lows. The dynamics of this indicator calculates on a price and percentage retracement based on historical tradable cycle highs and cycle lows, rather than using a certain number of bars to determine a reversal in price direction. This indi-cator will then show the major cycle highs and lows. B2/B6 stands for Price Balance Points. The short term is (B2) and the long term is (B6). This is a very complex method of trading. There are varied degrees of swings: minor, intermediate and major. The minor swings are too hard to trade unless you are in the trading pit on the exchange floor. The buy and sell points are the intermediate and major swings. If B2 was above B6 for the last major swing, and B6 is above B2 for the current major swing, then P3 for the current major swing will be below B6 and the next valley after the current swing will terminate a downtrend.
If B6 was above B2 for the last major swing, and B2 is above B6 for the current swing, then P3 for the current swing major will be above B6 and the next peak after the current swing will terminate an uptrend.
Tips & Techniques If Alert Option is turned on under Properties the Alert will work.
Note: The Factor input only applies for the “Trident Major”.
Style Default Color
Pivot Point Magenta Pivot Point Yellow h Cyan i Cyan
Kelly’s Trident continued *RK Trident
Inputs Default Description CycStren 0 The Range is 0-200, for most markets leave at 0 for auto mode. Factor 2.5 This input has to be 1 or greater. This input is for
the major trident only. The recommended range is between 2.5–5.0. Percent 2.25 This setting should be > 0. Experimentation is needed to find the best setting for the market being traded. Pt_Offset 70 This is the distance between the numbers
that will plot on the chart if Sho_B2B6 is set to True. If the distance is too great try a smaller value. If it is too close to the price bar, increase the value.
UsePnts True If set to True, it uses a point value. If set to False, it will use a percent value to calculate. Sho_B2B6 False If True, it shows the B2/B6 point on the chart. Sho_Pivs False If True, it shows the bar that the indicator
calculates on to plot the pivot point. Com_Pivs False If True, in the expert commentary it will
show the price of Cycle Turn Points. Com_B2B6 False If True, it will show and project the next B2 and B6 prices at P4 and P5. Stop Loss 0.5 If set to 0.5 that would be a ½ point from the last
turn point. DrawStopLoss True This turns on/off the stop loss plots. True=On False=Off StopLoss 0.5 Refer to page 11 of this manual for more info. StopLossColor Red Refer to page 11 of this manual for more info. StopLossStyle Tool_Solid Refer to page 11 of this manual for more info. DrawTarget True Turns on the Target Line. TargetColor Cyan Refer to page 11 of this manual for more info. TargetStyle Tools_Dotted Refer to page 11 of this manual for more info. DrawTrident True Turns on the Trident Target Line. TridentStyle Tool_Dashed3 Refer to page 11 of this manual for more info. DrawEntry True Turns on the Entry Point Line. EntryColor White Refer to page 11 of this manual for more info. EntryStyle Tool_Dotted Refer to page 11 of this manual for more info.
Copyright © ARC Systems, Inc. 1993-2006 30

Kelly’s Trident continued *RK Trident
Using the Expert Commentary. To use the Expert Commentary click on the Expert Commentary Icon, on your chart, click on the last ‘cyan’ bar plotted by the Trident Indicator. This will give you the latest information.
Copyright © ARC Systems, Inc. 1993-2006 31
Cycle Timing *RK Cycle Timing
Copyright © ARC Systems, Inc. 1993-2006 32
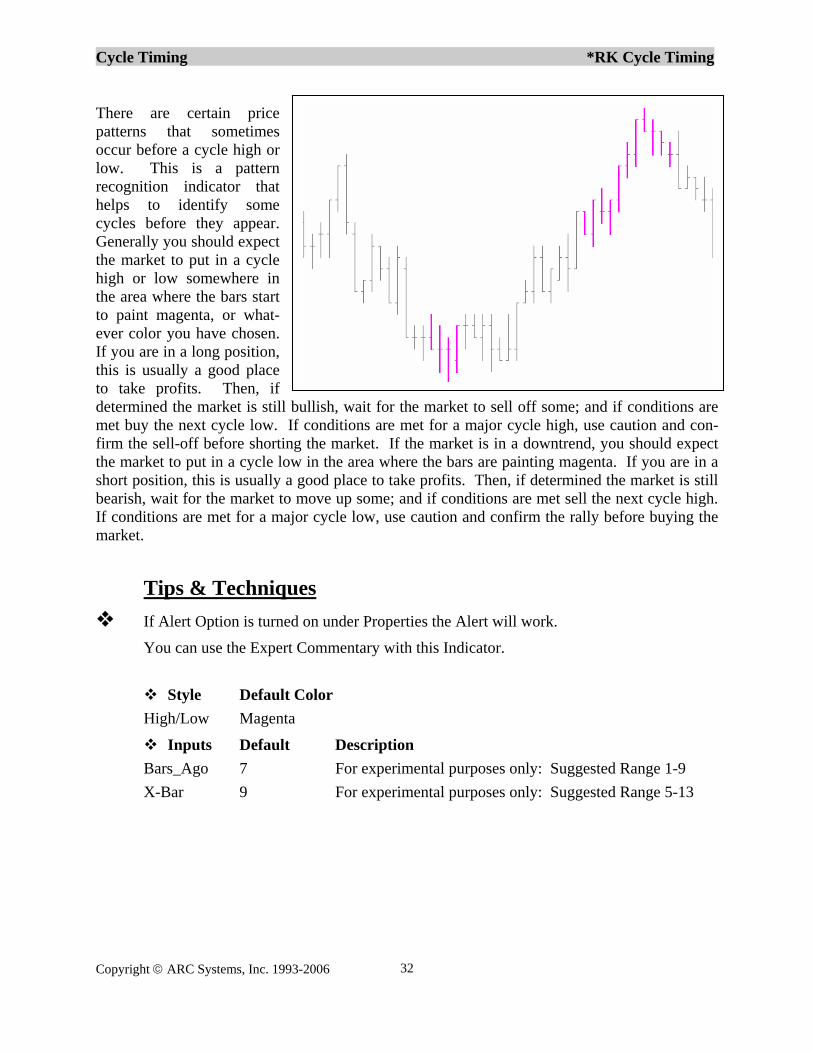
There are certain price patterns that sometimes occur before a cycle high or low. This is a pattern recognition indicator that helps to identify some cycles before they appear. Generally you should expect the market to put in a cycle high or low somewhere in the area where the bars start to paint magenta, or what-ever color you have chosen. If you are in a long position, this is usually a good place to take profits. Then, if determined the market is still bullish, wait for the market to sell off some; and if conditions are met buy the next cycle low. If conditions are met for a major cycle high, use caution and con-firm the sell-off before shorting the market. If the market is in a downtrend, you should expect the market to put in a cycle low in the area where the bars are painting magenta. If you are in a short position, this is usually a good place to take profits. Then, if determined the market is still bearish, wait for the market to move up some; and if conditions are met sell the next cycle high. If conditions are met for a major cycle low, use caution and confirm the rally before buying the market.
Tips & Techniques If Alert Option is turned on under Properties the Alert will work.
You can use the Expert Commentary with this Indicator.
Style Default Color High/Low Magenta
Inputs Default Description Bars_Ago 7 For experimental purposes only: Suggested Range 1-9 X-Bar 9 For experimental purposes only: Suggested Range 5-13
Fib Extension *RK Fib Extention
Copyright © ARC Systems, Inc. 1993-2006 33
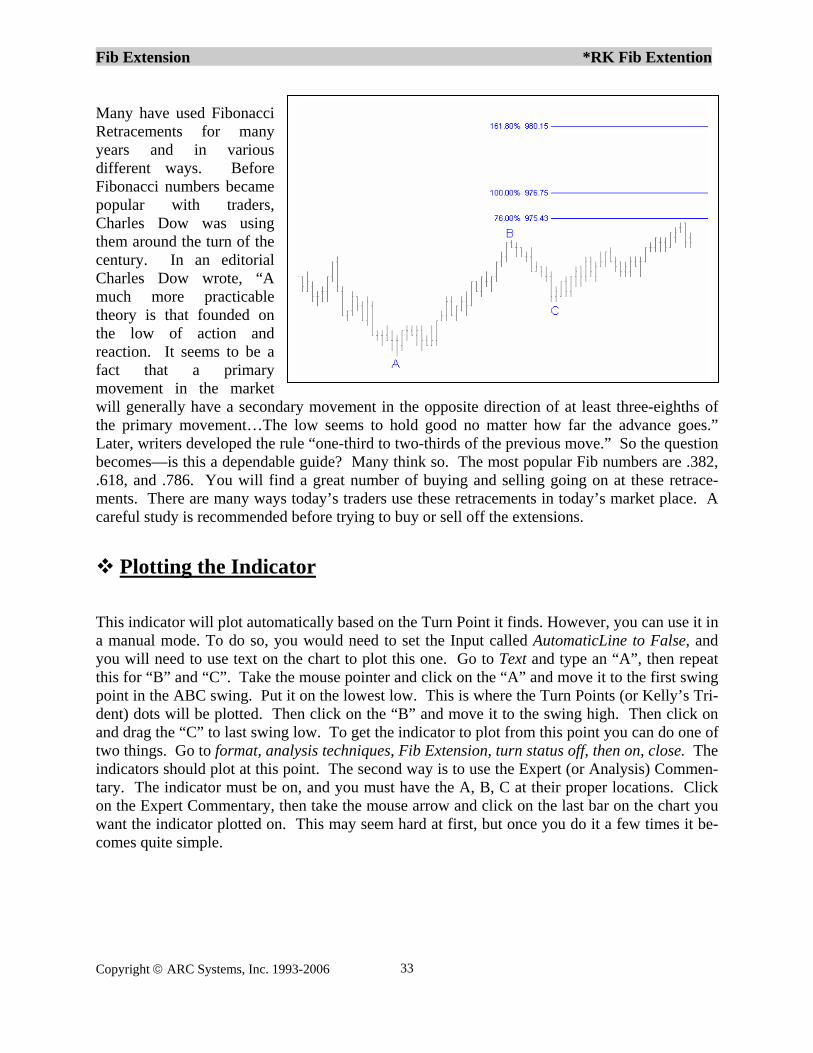
Many have used Fibonacci Retracements for many years and in various different ways. Before Fibonacci numbers became popular with traders, Charles Dow was using them around the turn of the century. In an editorial Charles Dow wrote, “A much more practicable theory is that founded on the low of action and reaction. It seems to be a fact that a primary movement in the market will generally have a secondary movement in the opposite direction of at least three-eighths of the primary movement…The low seems to hold good no matter how far the advance goes.” Later, writers developed the rule “one-third to two-thirds of the previous move.” So the question becomes—is this a dependable guide? Many think so. The most popular Fib numbers are .382, .618, and .786. You will find a great number of buying and selling going on at these retrace-ments. There are many ways today’s traders use these retracements in today’s market place. A careful study is recommended before trying to buy or sell off the extensions.
Plotting the Indicator This indicator will plot automatically based on the Turn Point it finds. However, you can use it in a manual mode. To do so, you would need to set the Input called AutomaticLine to False, and you will need to use text on the chart to plot this one. Go to Text and type an “A”, then repeat this for “B” and “C”. Take the mouse pointer and click on the “A” and move it to the first swing point in the ABC swing. Put it on the lowest low. This is where the Turn Points (or Kelly’s Tri-dent) dots will be plotted. Then click on the “B” and move it to the swing high. Then click on and drag the “C” to last swing low. To get the indicator to plot from this point you can do one of two things. Go to format, analysis techniques, Fib Extension, turn status off, then on, close. The indicators should plot at this point. The second way is to use the Expert (or Analysis) Commen-tary. The indicator must be on, and you must have the A, B, C at their proper locations. Click on the Expert Commentary, then take the mouse arrow and click on the last bar on the chart you want the indicator plotted on. This may seem hard at first, but once you do it a few times it be-comes quite simple.
Fib Extension continued *RK Fib Extension
Tips & Techniques What seems to work extremely well for us is when a cycle is forming at a retracement
area—this is usually a point to enter or exit a trade.
Style Default Color Fib1 – Fib 7 Cyan for a buy setup (L-H-L) Yellow for a sell setup (H-L-H)
Inputs Default Description AutomaticLines True Turns on/off (true/false) the manual/auto mode. CycStren 0 The Range is 0-200, for most markets leave
at 0 for auto mode. Percent 2.25 This setting should be > 0.
Experimentation is needed to find the best setting for the market being traded.
BuyColor Cyan Refer to page 11 of this manual for more information.
BuySize 0 Refer to page 11 of this manual for more information.
BuyStyle 3 Refer to page 11 of this manual for more information.
SellColor Red Refer to page 11 of this manual for more information.
SellSize 0 Refer to page 11 of this manual for more information.
SellStyle 3 Refer to page 11 of this manual for more information.
Fib 1–Fib 7 Fib Numbers This indicator allows up to seven Fib Lines. The values are placed in the inputs Fib 1–Fib 7: If an input is “0”, it is ignored.
Notes: We only allow a maximum of two formulations, a buy setup (L-H-L) or a sell setup (H-L-H). You must use CAPITAL LETTERS for the A, B, C or A1, B1, C1.
Copyright © ARC Systems, Inc. 1993-2006 34

Dynamic Stops *RK Dynamic Stops
Copyright © ARC Systems, Inc. 1993-2006 35
These stops are dynamically adaptive and fully automated; designed to keep you in the market longer with limited risk, allowing for bigger and more profitable moves. They will forecast the stop for the next bar before it forms. These trailing stops give a fixed stop about half a point below the last cycle low or above the last cycle high, allowing the market room to breath before it moves. The fixed stop shows where the maximum stop should be placed, and should be the greatest risk one would take. If the market should whipsaw a little the trader won't get stopped out (as happens with most trailing stop indicators). This indicator does all the work for you. It calculates out the best place to start the trailing stop. After entering a trade you would place a fixed stop below the last cycle low or above the last cycle high. Then after the market moves the trailing stop starts to plot and you would raise your stop and continue to do so until you take profits or get stopped out. It has the capability of being used manually; however, it is fully automated and there is no need to point 'n click or move text around the screen.
There are two ways of viewing the stop; by using the Expert Commentary and clicking on the last bar, or by using the Cross Hairs and clicking on the bars you want the stop for and viewing it in the Data Window.
In the Data Window you can view the stop for the current bar as seen in the Data Window below.
In the Expert Commentary shown below, it forecasts the stop for the next bar.
Dynamic Stops continued *RK Dynamic Stops
Tips & Techniques The preferred method is auto mode.
Dynamic Stops
Style Default Color LongStop Red ShortStop Cyan
Inputs Default Description CycStren 0 The Range is 0-200, for most markets leave
at 0 for auto mode. Percent 2.25 This setting should be > 0.
Experimentation is needed to find the best setting for the market being traded.
Range .02 This input controls trailing stops. The larger the number the larger the stop. This input must be greater than 0. To adjust it, move it in hundreds i.e. 0.03, 0.04. The two settings that work the best for us are 0.02 and 0.15.
X_Bars 70 This is the length of the lines & dots or the number of bars the lines & dots will plot for. Lines True Turns on & off the fixed stop lines. True = on,
False = off. History False If set to False, it will only show the last two
long stops and the last two short stops. L_Color Red Refer to page 11 of this manual for more Info. S_Color Cyan Refer to page 11 of this manual for more Info.
AutoMode True If set to True, it will automatically plot the indicator for you after you put in the Cycle Strength value. If set to False, you will need to enter the date and time into the following inputs for it to work: L_EnDate, L_EnTime, S_EnDate, and S_EnTime.
** Remember to enter the date as follows: year/month/day. For the year 2003 you would enter the year 103; i.e. 2000 = 100, 2001 = 101, 2002 = 102, 2003 = 103, 2004 = 104, etc. For example October 9, 2003 would be entered 1031009. This is due to TradeStation®, it has nothing to do with the way the indicators are programmed.
Copyright © ARC Systems, Inc. 1993-2006 36
Price Exhaustion *RK Price Exhaustion
Copyright © ARC Systems, Inc. 1993-2006 37
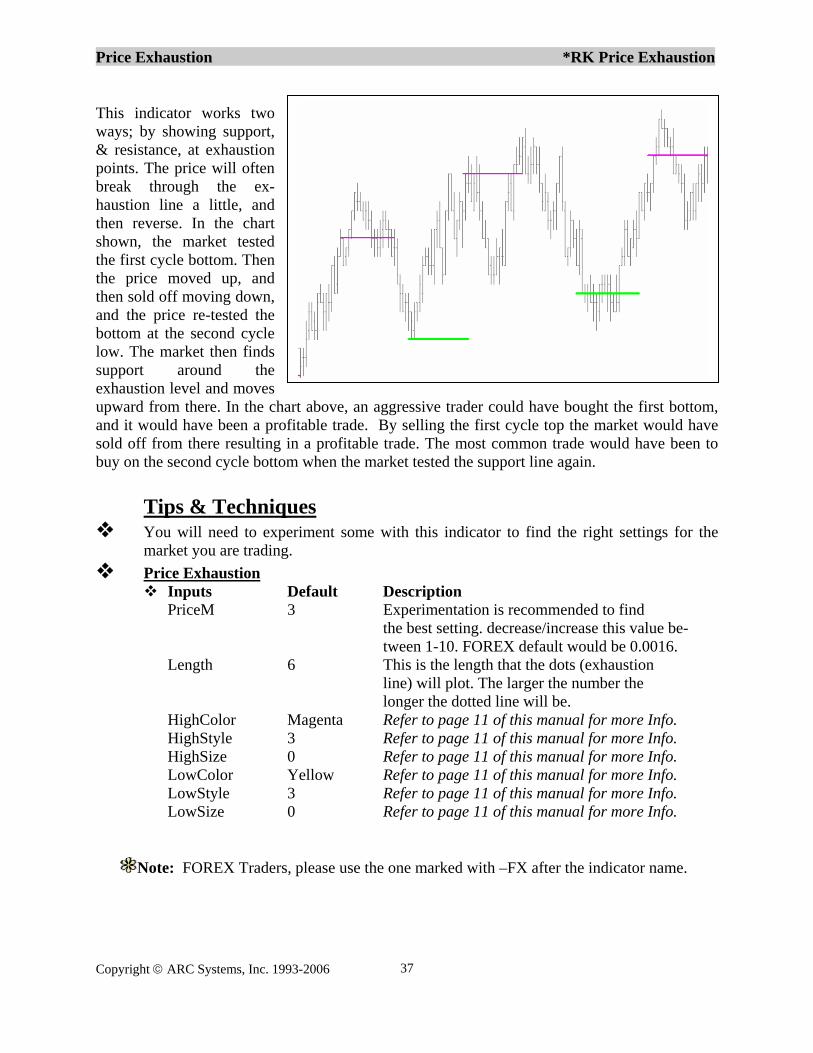
This indicator works two ways; by showing support, & resistance, at exhaustion points. The price will often break through the ex-haustion line a little, and then reverse. In the chart shown, the market tested the first cycle bottom. Then the price moved up, and then sold off moving down, and the price re-tested the bottom at the second cycle low. The market then finds support around the exhaustion level and moves upward from there. In the chart above, an aggressive trader could have bought the first bottom, and it would have been a profitable trade. By selling the first cycle top the market would have sold off from there resulting in a profitable trade. The most common trade would have been to buy on the second cycle bottom when the market tested the support line again.
Tips & Techniques You will need to experiment some with this indicator to find the right settings for the
market you are trading. Price Exhaustion
Inputs Default Description PriceM 3 Experimentation is recommended to find
the best setting. decrease/increase this value be-tween 1-10. FOREX default would be 0.0016.
Length 6 This is the length that the dots (exhaustion line) will plot. The larger the number the
longer the dotted line will be. HighColor Magenta Refer to page 11 of this manual for more Info. HighStyle 3 Refer to page 11 of this manual for more Info. HighSize 0 Refer to page 11 of this manual for more Info. LowColor Yellow Refer to page 11 of this manual for more Info. LowStyle 3 Refer to page 11 of this manual for more Info. LowSize 0 Refer to page 11 of this manual for more Info.
Note: FOREX Traders, please use the one marked with –FX after the indicator name.
TrendPro™ Indicators
Copyright © ARC Systems, Inc. 1993-2006 38
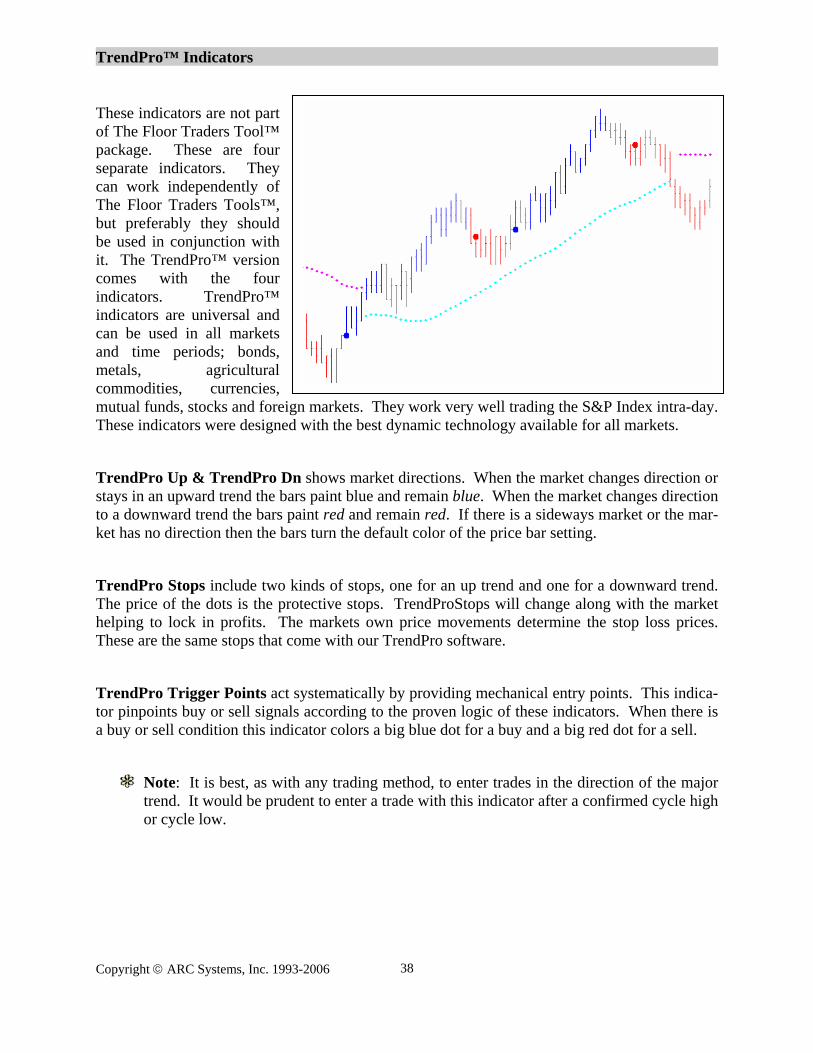
These indicators are not part of The Floor Traders Tool™ package. These are four separate indicators. They can work independently of The Floor Traders Tools™, but preferably they should be used in conjunction with it. The TrendPro™ version comes with the four indicators. TrendPro™ indicators are universal and can be used in all markets and time periods; bonds, metals, agricultural commodities, currencies, mutual funds, stocks and foreign markets. They work very well trading the S&P Index intra-day. These indicators were designed with the best dynamic technology available for all markets.
TrendPro Up & TrendPro Dn shows market directions. When the market changes direction or stays in an upward trend the bars paint blue and remain blue. When the market changes direction to a downward trend the bars paint red and remain red. If there is a sideways market or the mar-ket has no direction then the bars turn the default color of the price bar setting.
TrendPro Stops include two kinds of stops, one for an up trend and one for a downward trend. The price of the dots is the protective stops. TrendProStops will change along with the market helping to lock in profits. The markets own price movements determine the stop loss prices. These are the same stops that come with our TrendPro software.
TrendPro Trigger Points act systematically by providing mechanical entry points. This indica-tor pinpoints buy or sell signals according to the proven logic of these indicators. When there is a buy or sell condition this indicator colors a big blue dot for a buy and a big red dot for a sell.
Note: It is best, as with any trading method, to enter trades in the direction of the major trend. It would be prudent to enter a trade with this indicator after a confirmed cycle high or cycle low.
TrendPro™ Indicators
Tips & Techniques
TrendUp Style Default Color Notes:
hb Blue The hb and lb must be the same color. lb Blue The hb and lb must be the same color.
Inputs Default Description Intensity 3 Recommend using the default setting;
however, for experimentation purposes decrease/increase this value between 1-10.
Shift 0.90 Simply a filter of the strength setting to determine whether or not the bar turns blue. Recommend using the default setting, however, for experimentation purposes the range is between 0 - 3.90.
Price Close Recommend using the default setting, however, for experimentation purposes you can try using high, low, open.
Tips & Techniques TrendDn
Style Default Color Notes: hb Red The hb and lb must be the same color. lb Red The hb and lb must be the same color.
Inputs Default Description Intensity 3 Recommend using the default setting,
however, for experimentation purposes decrease/increase this value between 1-10.
Shift 0.90 Simply a filter of the strength setting to determine whether or not the bar turns
blue. Recommend using the default setting, however, for experimentation purposes the range is between 0 - 3.90.
Price Close Recommend using the default setting, however, for experimentation purposes you can try using high, low, open.
Copyright © ARC Systems, Inc. 1993-2006 39
TrendPro™ Indicators
Tips & Techniques
TP Stops Style Default Color
LongStop Magenta ShortStop Cyan
Inputs Default Description Intensity 3 Recommend using the default setting,
however, for experimentation purposes decrease/increase this value between 1-10.
Tips & Techniques If Alert Option is turned on under Properties the Alert will work.
TP TriggerPoints
Style Default Color BuyTrigPnt Blue SellTrigPnt Red
Inputs Default Description Intensity 3 Recommend using the default setting,
however, for experimentation purposes decrease/increase this value between 1-10.
OffSet 0 Moves (spaces) the Trigger Point dot from the price bar it plots on, see notes below. Method 1 When set to 1, it will show the buy
and sell signal. When set to 2, it will show only the buy stops. Set to 3, it will show only the sell stops.
Notes: The OffSet input for Trigger Points moves (spaces) the dots that indicator plots from the price bar, in some cases this makes it easer to see the Trigger Points dots. Most markets for the OffSet input would be 2 or 2. If you want some spacing between the dots the indicator plots, and the price bar, increase the OffSet value. For the FOREX markets, in most cases, if you want to use this feature, this input would need to be set at 0.0001 to 0.0002.
Copyright © ARC Systems, Inc. 1993-2006 40
Pitchfork
Pitchfork:
Tips & Techniques
Style Default Description tl_Color Blue This is the color that the indicator will plot. See Page 11 for more information.
Inputs Default Description Occur 1 This input determines the turn points that the
indicator will plot on: 01 would show the most current, 02 would identify the one preceding the current plot, 03 would be three plots back. Use the 01 for real time trading; the other settings are for back testing.
Percent 0.25 Default setting of .25 is a quarter of a percent in price movement, (0.50) would be a half of a percent in price movement. The best settings are (0.25) for normal swings, or (0.15) to show the smaller swings. FOREX default is (0.08).
Note: FOREX Traders, please use the one marked with –FX after the indicator name.
Copyright © ARC Systems, Inc. 1993-2006 41
Fibonacci Confluence
Fibonacci Confluence: The best way to use this indicator is to plot it on a one minute chart. The reason for this is be-cause it uses TradeStation “Trend Lines” to plot the Fib Confluence lines, just like Floor Pivots (or any other indicator that plots lines across the chart). TradeStation® calculates all Trend Line plots from a date and time. That’s why it is best to use a minute chart. If you use a tick, or share (volume) bar chart, you may have many bars during a one minute period, or you may not have any tick or share bars over several minutes. Thus, if there is a Turn Point at one of these points, the indicator may not plot right away. With that said, I will say that I have used it on many different tick, and/or share bar charts. But the prudent course would be to build a one minute chart and plot the indicator on it. You can still have other charts open showing the rest of your indicators, and trade from the chart you prefer. However, view the one minute chart for your Fib Confluence areas. With TradeStation this is easy to do, as you can have many charts open simultaneously, sizing them in your own way. For optimum results with this indicator, it is best to trade in the direction of the trend. Some Traders want to sell the very tops and buy the very bottoms; however, this is a very high risk way to trade. It is much easier to buy the bottoms as they find support on these Fib Confluence areas in an up trending market, and sell the tops off these Fib Confluence areas in a down trending market. For optimal accuracy, plot the Turn Point indicator on the chart you intend to plot the Fib Con-fluence indicator on. Make sure the Turn Point indicator plots on the Turn Point you would con-sider tradable (profitable); meaning having enough price movement between Turn Point to Turn Point. If you need to adjust the Turn Point indicator to show the correct Turn Points, dial it in using the Percent input, and then afterwards, use the same input values you found for the Turn Point indicator in the inputs of the Fib Confluence indicator: Percent. Most of the time, the above step is not needed; i.e., the ER, ES, SP, and many other stocks and futures. However, with real money on the line, every available advantage can make a difference. Therefore, the reasonable course would be to check the chart that you plan on using with the Turn Point indicator first, and then plot the Fib Confluence indicator.
Tips & Techniques These are the colors the lines plot, to change a color simply type in the TradeStation color
you prefer. For a list of the colors please see page 11.
Style Default Color Description ABC_Up_TopColor_ Red See page 11 for more information. ABC_Up_BotColor_ Cyan ABC_Down_TopColor_ Yellow ABC_Down_BotColor_ Green
Copyright © ARC Systems, Inc. 1993-2006 42
Fibonacci Confluence continued
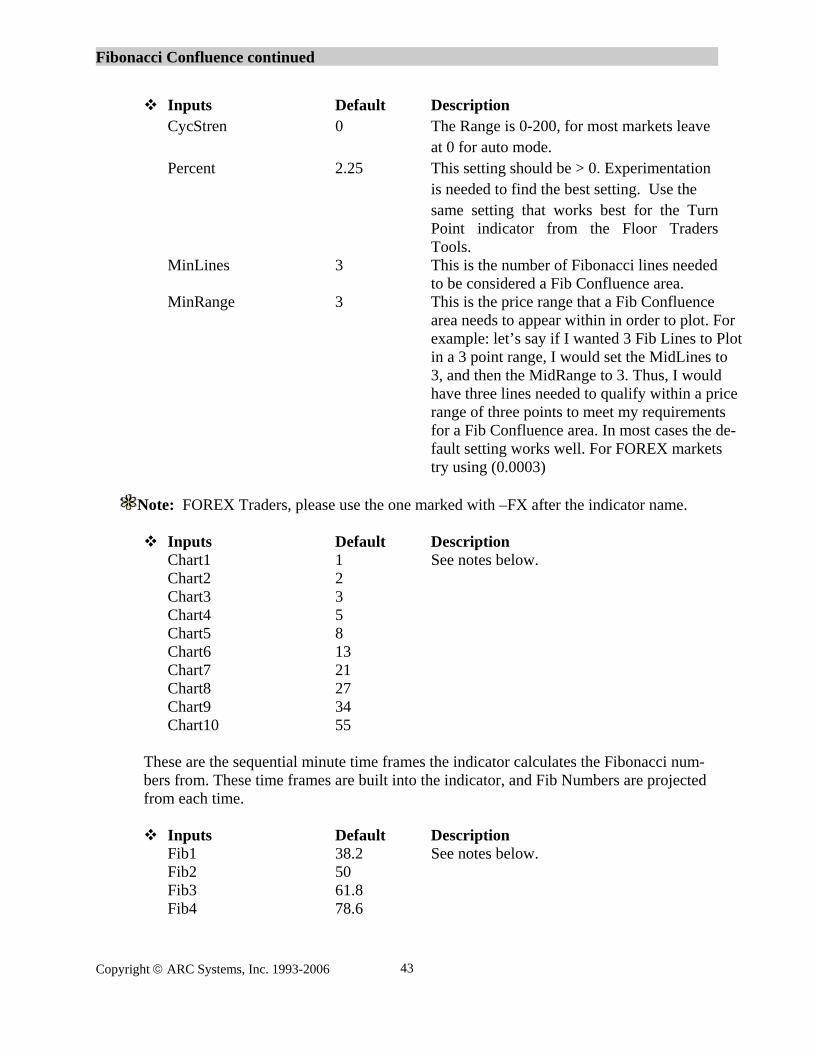
Inputs Default Description CycStren 0 The Range is 0-200, for most markets leave
at 0 for auto mode. Percent 2.25 This setting should be > 0. Experimentation
is needed to find the best setting. Use the same setting that works best for the Turn Point indicator from the Floor Traders Tools.
MinLines 3 This is the number of Fibonacci lines needed to be considered a Fib Confluence area.
MinRange 3 This is the price range that a Fib Confluence area needs to appear within in order to plot. For example: let’s say if I wanted 3 Fib Lines to Plot in a 3 point range, I would set the MidLines to 3, and then the MidRange to 3. Thus, I would have three lines needed to qualify within a price range of three points to meet my requirements for a Fib Confluence area. In most cases the de-fault setting works well. For FOREX markets try using (0.0003)
Note: FOREX Traders, please use the one marked with –FX after the indicator name.
Inputs Default Description
Chart1 1 See notes below. Chart2 2 Chart3 3 Chart4 5 Chart5 8 Chart6 13 Chart7 21 Chart8 27 Chart9 34 Chart10 55
These are the sequential minute time frames the indicator calculates the Fibonacci num-bers from. These time frames are built into the indicator, and Fib Numbers are projected from each time.
Inputs Default Description
Fib1 38.2 See notes below. Fib2 50 Fib3 61.8 Fib4 78.6
Copyright © ARC Systems, Inc. 1993-2006 43

Fibonacci Confluence continued
Fib5 100 Fib6 127.2 Fib7 161.8 Fib8 200 Fib9 261.8 Fib10 423.6
These are the Fibonacci price extensions used inside the indicator for calculations, using the different time frames above (charts 1-10). These calculations are built inside the indi-cator.
Inputs Default Description BarsBack 100 See notes below.
This is the number of bars on the chart that the indicator will plot the Fib lines for. If you have it set to 20, then the lines will only plot for 20 bars, then stop plotting. If it was set to 100, then all the projected lines would only plot for the last 100 bars on the chart.
Copyright © ARC Systems, Inc. 1993-2006 44
Kelly’s Cycle Identifier Filtered
Kelly’s Cycle Identifier Filtered: I hope no one is expecting the Holy Grail. That is not what I was trying to convey on my web site. As it was written, “we all know that nothing works 100%”. By and large, the biggest prob-lem that traders’ encounter when trading is the tendency to sell every top in an up trending mar-ket, and to buy every bottom in a down trending market. To the contrary—this is just the oppo-site of what a trader should do. A trader should be looking to buy (long) bottoms in an up trend-ing market, and sell (short) tops in a down trending market. This is the point that I wanted to make—and I hope there was no misunderstanding about it. This new Cycle Identifier is de-signed to do just that—keep the trader trading in the direction of the trend. Keep in mind, at the end of the trend, the market will reverse; therefore, you would still be trading in the direction of that trend. However, at some point in time, that trend will end and the market will go in the other direction. Please understand, this indicator can still have phantoms—there is no way around it. For in-stance, do all Swing Highs and Lows hold? Do all Fibonacci Support and Resistance lines hold? Do all Floor Support and Resistance lines hold? Do all Trend Lines hold? The answer to each of these questions is NO, and of course it would be the same with this indicator. For trend trading it is an improvement over the original Kelly’s Cycle ID; however, it is still, and always has been, recommended to trade in the direction of the trend. This new leading indicator should be used in conjunction with other indicators for confirmation. It is of the utmost impor-tance that you do not enter a trade based on this indicator alone. Rather, as pointed out above, other indicators need to be used to confirm these turning points. Not all turn points are tradable, so caution is needed. All the inputs in this indicator are the same as the Kelly’s Cycle Identifier 2, with two excep-tions: The Filter, True/False default is True. The Factor input is different as this indicator does not show major cycles. You will still need to use the Kelly’s Cycle Identifier for that. So the Factor input in this indicator is the strength of the filter. It is recommended that you do not use a setting less then 1.0; however, the best setting seems to be between 2.5 – 3.5. Experimentation is needed to find the best setting for the particular market that you are trading. MaxBarsBack continues to be a problem with indicators that use a lot of math in TradeStation. This is NOT an indicator problem; rather, a problem that TradeStation has had since day-one. Their fix was “Auto Detect”, which you turn on under the General Tab of the indicator. How-ever, the problem with that is that it takes a long time for indicators to plot when “Auto Detect” is on. So if the indicator clicks off, and gives a MaxBarsBack error, you will need to go to For-mat, Analysis Techniques, click on the indicator, then click on Status, then format, and under the General tab, go to Maximum Number Bars Study Will Reference, and increase the number of the MaxBarsBack. If the default is 900, then increase it to 1200; likewise, if it is set to 1200, and turns off, then increase it to 1600. There is no concrete rule for this—just continue increasing it a few hundred at a time until TradeStation no longer has a problem reading the math in the indi-cator.
Copyright © ARC Systems, Inc. 1993-2006 45
Kelly’s Filtered Cycle ID continued
Tips & Techniques
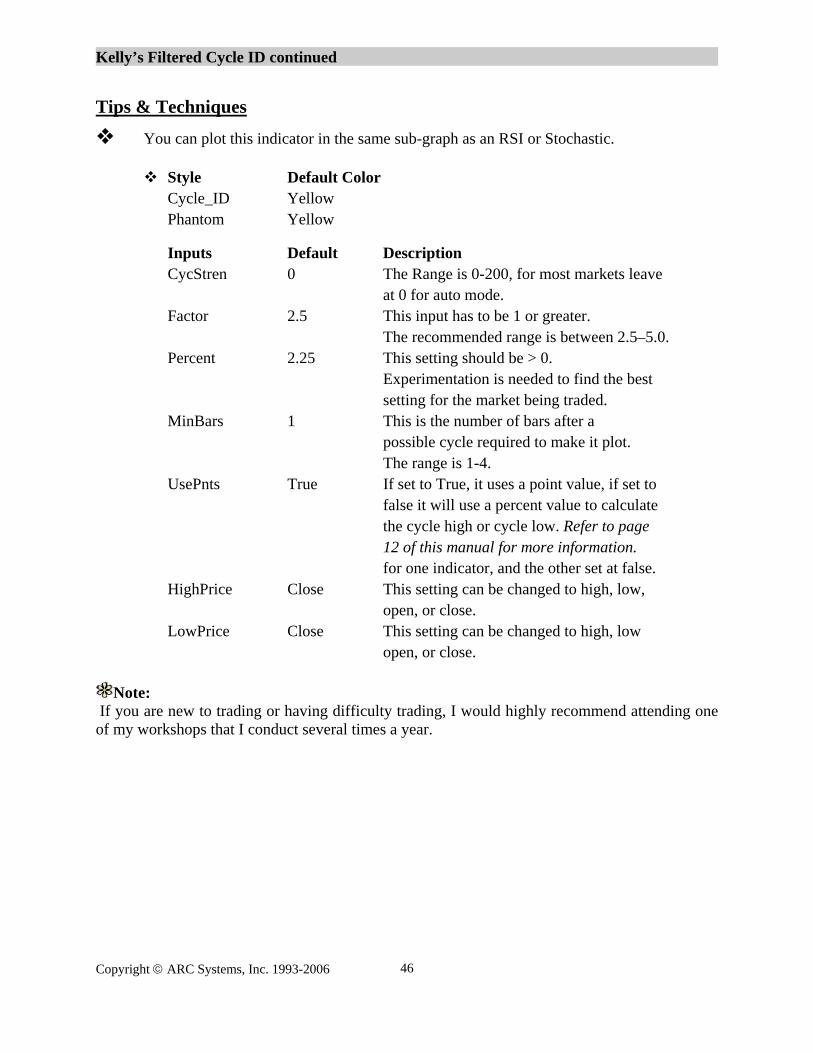
You can plot this indicator in the same sub-graph as an RSI or Stochastic.
Style Default Color Cycle_ID Yellow Phantom Yellow Inputs Default Description CycStren 0 The Range is 0-200, for most markets leave at 0 for auto mode. Factor 2.5 This input has to be 1 or greater. The recommended range is between 2.5–5.0. Percent 2.25 This setting should be > 0. Experimentation is needed to find the best setting for the market being traded. MinBars 1 This is the number of bars after a
possible cycle required to make it plot. The range is 1-4. UsePnts True If set to True, it uses a point value, if set to false it will use a percent value to calculate
the cycle high or cycle low. Refer to page 12 of this manual for more information.
for one indicator, and the other set at false. HighPrice Close This setting can be changed to high, low, open, or close. LowPrice Close This setting can be changed to high, low open, or close.
Note: If you are new to trading or having difficulty trading, I would highly recommend attending one of my workshops that I conduct several times a year.
Copyright © ARC Systems, Inc. 1993-2006 46

Dynamic Trend Filter
Dynamic Trend Filter: In respect to direction, this indicator is a fixed indicator (in that once it plots the direction, that plot will stay until the trend reverses). However, the extremes can (and do) change at times. They usually hold true in a cycling market; however, when the market trends hard the extreme can widen (or the price can break out of it). If the price breaks out of it, then that usually means the market is trending hard, and therefore, should be traded in that direction. As is true with using other indicators to help identify trend, it is also prudent to do the same for extreme ranges. The ‘Percent’ is the input that controls the strength of the indicator; the normal range is usually between 2.25 and 3.5 depending on the market being traded. The default setting works well for most markets. If you own the Kelly’s Cycle_Id Filtered indicator, you may find that the plots will not always match. If you are comparing the two, you will want the settings for both indicators to be the same. The reason this indicator may plot contrary to the Kelly’s Cycle_Id Filtered indicator is due to the MaxBarsBack. Even if both are set the same, there may at times be a difference. Due to MaxBarsBack in TradeStation the math formula is increased, which can have an effect on the way that the chart calculates the data. Until TradeStation does away with MaxBarsBack, things like this will always be a minor problem. For the inputs below I would recommend using the default settings; with the exception of, possi-bly increasing or decreasing the ‘percent’ input to your preferred setting. Tips & Techniques
You can plot this indicator in the same sub-graph as an RSI or Stochastic.
Style Default Color DFT Red Inputs Default Description CycStren 0 The Range is 0-200, for most markets leave at 0 for auto mode. Factor 3.5 This input needs to be > 1. This input is for the major trident only. The recommended range is between 2.5–5.0. Percent 2.25 This setting should be > 0.
Copyright © ARC Systems, Inc. 1993-2006 47
Trendicator
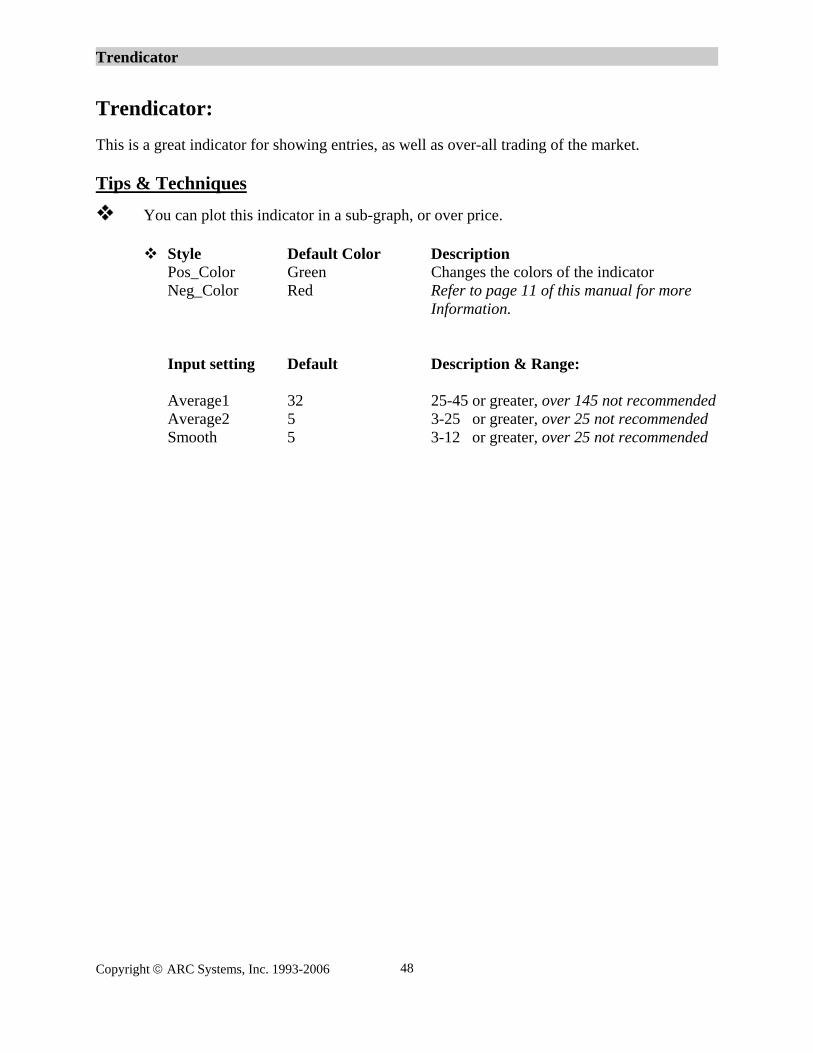
Trendicator: This is a great indicator for showing entries, as well as over-all trading of the market. Tips & Techniques
You can plot this indicator in a sub-graph, or over price.
Style Default Color Description Pos_Color Green Changes the colors of the indicator Neg_Color Red Refer to page 11 of this manual for more Information. Input setting Default Description & Range:
Average1 32 25-45 or greater, over 145 not recommended Average2 5 3-25 or greater, over 25 not recommended Smooth 5 3-12 or greater, over 25 not recommended
Copyright © ARC Systems, Inc. 1993-2006 48

Floor Pivots
Floor Pivots: These pivots are the same ones used by Floor Traders’ for years, (and also many day traders’ not in the pit). Trader’s who are not market makers have come up with variations of this indicator. But this one, out of all of them, is still the best I have used. This one will show weekly, monthly as well as daily pivots. This indicator needs to be plotted on an intraday time frame. What you are looking for on these types of indicators is; where money is going when the price reaches one of these price areas. In other words, are buyers or sellers in control?
Inputs Default Description PlotDailyPivots True True/False turns them on/off.
PlotWeeklyPivots True “ “ PlotMonthlyPivots True “ “ Day_PivotColor Yellow Changes the color of the plot. Day_SupColor Cyan “ “ Day_ResColor Red “ “ Week_PivotColor Yellow “ “ Week_SupColor Cyan “ “ Week_ResColor Red “ “ Month_PivotColor Yellow “ “ Month_SupColor Cyan “ “ Month_ResColor Red “ “ ShowText True True/False, on/off, turns off the numbers. Day_Style tool_dashed Can also use tool_dashed2, or tool_dotted, or tool_solid Week_Style tool_dashed “ “ Month_Style tool_dashed “ “
ShowHistory False True/False, on/off, if set to false, it will only show the current day; if set to true, it will show the entire history of the indicator. I find it best to have this input set to false.
Copyright © ARC Systems, Inc. 1993-2006 49
Two Smooth
Two Smooth: This a custom indicator designed by myself based on the Stochastic indicator. It works much bet-ter and smoother than the standard ones. Tips & Techniques
Inputs Default Description & Range
Length 10 Any value will work. I like a setting between 10-21.
SellLine 90 Oversold area, usually a value between 75-95. BuyLine 10 Overbought area, usually a value of 5-25.
Note: Try overlaying two of these indicators in the same sub-graph—one with a value of 10, and the other with a value of 21.
Copyright © ARC Systems, Inc. 1993-2006 50
Gartley
Gartley: This pattern is founded on information provided by Mr. Gartley. I have tested many professed Gartley indicators, only to find that they weren’t programmed correctly, or didn’t perform as Mr. Gartley intended for this pattern originally. So I had this one programmed correctly based on in-formation I provided to Stuart (my programmer) to be the most accurate, and user friendly, one available. Tips & Techniques
Inputs Default Description & Range
Strength 03 This is the Swing value the indicator uses. See page 12 for more information on swings.
Tolerance 0.20 The actual pattern that Gartley came up with rarely occurs; consequently more recently,
“Tolerance” was added. This gives the indicator forgiveness, allowing the indicator to plot more pat-terns.
BullColor Blue Changes the color of the plot. See page 11 for more information. BearColor Red “ “
Notes:
This pattern (Gartley) was designed before intraday charts; therefore, it was mostly used on daily charts. In later years traders have adapted it for intraday chart time, and that is one reason we came up with the “Tolerance” input. What my research shows is the larger the time frame, for instance a 60, or 90 minute chart, the better it works. That is not to say it doesn’t work on differ-ent charts like tick or volume charts. I use it as Gartley did, with one exception—I wait for one of my TrendPro Trigger Points to plot in the direction of the indicator before entering the trade. For example, if I had a Bearish Gartley (Red Pattern), I would wait for my TrendPro Trigger Points to give a sell signal before entering the trade; this increases the accuracy of the indicator significantly.
Copyright © ARC Systems, Inc. 1993-2006 51

Kelly’s AMA
Kelly’s Advanced Moving Average: I designed this Moving Average (MA) just a few years after I started trading. The cliché’ about ‘building a better mousetrap’ would apply here. For many years I traded with just four indicators; Kelly’s AMA, Kelly’s Cycle Identifier, Turn Points, and Floor Pivots. I like this indicator be-cause it helps filter out many bad cycles that are untradable. Tips & Techniques
Try using two of these overlaid—one with the input called ‘Price’ set to Close, Length set at 21; and the second one with a Length set at 27, and ‘Price’ input set to (High+Low)/2. You can also plot this indicator in a sub-graph over other indicators.
Style Default Color Description & Range Advanced MA Red Moving Average
Inputs Default Description & Range Length 21 The value used for the MA, range 1to
infinity. See notes below. Price Close The price the indicators calculate from.
Price could be any of the following, High, Low Open, or Close. Or a combination of them, (High+Low)/2 or (HLOC)/4.
Copyright © ARC Systems, Inc. 1993-2006 52

Dynamic Cycles
Dynamic Cycles: Tips & Techniques
Style Default Color Description & Range Dom Cyan Dominate Cycle Geo White Aptitude of the Cycle
Inputs Default Description CenterColor Red Changes the color of the plot, see page 11. EndColor Yellow Changes the color of the plot, see page 11.
Notes: At the center of the Dominate Cycle (Cyan) the indicator plots (two red bars), if a cycle high or low falls in this area, the market will usually make a powerful move in the direction of the cycle. At the end of the Dominate Cycle (Cyan) the indicator will plot (two yellow bars); if a cycle high or low happens in this area, the market will usually make a powerful move in the direction of the cycle.
Copyright © ARC Systems, Inc. 1993-2006 53