the flhsa/rba community high blood pressure … · management support . delivery system design ......
TRANSCRIPT

Hypertension Collaborating to Control Blood Pressure: “Knowing
Your Numbers” is Just the Beginning
Robert J. Fortuna, MD, MPH Site Medical Director Culver Medical Group University of Rochester
Al Bradley Senior Program Manager Director, High Blood Pressure Collaborative Finger Lakes Health Systems

Agenda
1. National-Level - Importance and Relevance
2. Community-Level Initiative - FLHSA/RBA Community High Blood Pressure Collaborative
3. Practice-Level Initiative - Culver Medical Group

National-Level Importance and Relevance

Hypertension Prevalence
• 66.9 million (30.4%) U.S. adults aged ≥ 18 years have hypertension
Diagnosis
• Under Recognized Disease
• Estimated 21% of people with HTN remain undiagnosed
Treatment
• Inadequate treatment
• Estimated 53.5% of those with HTN are uncontrolled
Morbidity and Mortality Weekly Report (MMWR). Vital Signs: Prevalence, Treatment, and Control of Hypertension --- United States, 1999--2002 and 2005—2008. February 4, 2011 / 60(04);103-108

National Control Rates Hypertension
66.9 million (30.4%)
Controlled 31.1 million (46.5%)
Uncontrolled 35.8 million (53.5%)
Morbidity and Mortality Weekly Report (MMWR). Vital Signs: Awareness and Treatment of Uncontrolled Hypertension Among Adults – United States 2003-2010. CDC. September 7, 2012 / 61(35);703-109.

National Control Rates Hypertension
66.9 million (30.4%)
Controlled 31.1 million (46.5%)
Uncontrolled 35.8 million (53.5%)
Aware and Treated 16.0 million (44.8%)
Aware but Untreated 5.7 million (15.8%)
Unaware 14.1 million (39.4%)
Morbidity and Mortality Weekly Report (MMWR). Vital Signs: Awareness and Treatment of Uncontrolled Hypertension Among Adults – United States 2003-2010. CDC. September 7, 2012 / 61(35);703-109.

Health & Economic Impact
Mortality Impact • 348,000 deaths per year include hypertensions as
a primary or contributing cause • If all hypertensive patients were treated to goal,
46,000 deaths might be averted each year Financial Impact • $93.5 Billion per year in direct and indirect costs
(The American Heart Association)

Effective Treatments
Generic Medications $4/month • Ace-Inhibitors • Thiazides • Beta-Blockers • Aldosterone Antagonists • Direct vasodilators • Alpha-1 Blockers • Alpha-2 Agonists Other generics • Calcium Channel Blockers • Angiotensin Receptor Blockers

Opportunity
Mortality 46,000 Preventable deaths
Costs $93.5 billion / year
Uncontrolled Hypertensives 35.8 million people
Effective and Inexpensive Treatments
+
+

Opportunity
Mortality 46,000 Preventable deaths
Costs $93.5 billion / year
Uncontrolled Hypertensives 35.8 million people
Effective and Inexpensive Treatments
Significant Opportunity
+
+

Community-Level Finger Lakes Health Systems Agency
Rochester Business Alliance
High Blood Pressure Collaborative

Objectives
• Articulate the value of a multifaceted project to improve chronic disease outcomes.
• Demonstrate the inter-relationship of community engagement and primary care practice involvement in the project.
• Outline the community engagement component of the project.
• Describe the creation of a Monroe County community wide HBP registry and the primary care intervention.

Community Orgs Employers Resources, Policies
Wellness Promotion Consumer Outreach
And Coaching
Health Systems/Plans Organization of Health Care
Self-Management Support
Delivery System Design
Decision Support
Clinical Information Systems
Informed Activated
Patients/Families
Prepared, Proactive Practice Teams
Productive Interactions
Improving Health Outcomes For High Blood Pressure
Quality and Value Outcomes; ROI; Engaged
Satisfied Participants Wagner, E, Group Health

Community Interventions
• Attitude Survey • Ambassador Network • Health Screenings • Pharmacy • Faith communities/CBOs • Kiosks • Barbershops /Salons
14

Worksite Interventions • Peer led self help curriculum • Based on self-determination theory, promoting:
– Competence – Autonomy – Relatedness to increase internal motivation to sustain choices
• Year 1 participants: AIDS Care of Rochester, Bausch and Lomb, Paychex.
• Year 2 participants: Community Place, LiDestri Foods, Roberts Wesleyan College
• Million Hearts
15

Blood Pressure Advocates
• Community health worker model
• Advocates placed in primary care practices in all three health systems
• Practices geographically serve the most vulnerable
• Advocates possess deep knowledge of the neighborhoods and available community services

Clinical Interventions
• Patient Registries
• Baseline Data
• Primary Care Quality Improvement
17

High Blood Pressure Registry Participation by Provider Type
2010 - 2012
0
20
40
60
80
100
120
140
160
180
200
practices internists family phys NP PA Residents
2010
2011
2012

Participating Practices • Unity Health System
• Rochester General Health System
• URMC Primary Care Network
• Highland Family Medicine
• UR IM Resident Practice
• RGH Twig Practice
• Lifetime Healthcare
• Jordan/Westside
• GRIPA
• Evergreen Family Medicine
• Jefferson Family Medicine
• Honeoye Valley Family Medicine
• Mahoney, Horohoe and Garneau Internal Medicine

HBP Registry Data Through December 31, 2012
20
Patients with BP information
Monroe County Population ≥18 585,900
Patients ≥18 with Dx HBP seen in participating practices* in past 3 years
Monroe County Population ≥18 with High blood pressure diagnosis (30% based on national data)
175,770 est.
New patients 1st seen in last 6 months
Not Available
Dx HBP No BP read
in 13 months Not Available
Dx HBP BP read Within 13
months 104,300
BP ≥ 140/90 32.3% - 33,689
BP < 140/90 66.7% - 70,611
Patients with HBP not seen in participating* practices within past 3 years
Patients with HBP not seen
Not Available
Patients with HBP seen in non-participating practices –
no clinical or demographic data Not Available
BP < 140/90 Not Available
BP ≥ 140/90 Not Available
Community Engagement
Education &
Lifestyle Support
Community Engagement
to Find, Educate & Encourage Care
Best Practice to
Recruit Practices with EMRs
Measure of Community
Engagement Success
Practice Quality Improvement Opportunities
Measure of Best
Practice Success

High Blood Pressure Registry Monroe County Residents 18 & Older
Registry Date Monroe Co Population 18 & Older
Estimate of HBP
Population (30%)
Patients in HBP
Registry with BP
Info
Control Rate
December 2010 578,200 173,460 59,400 62.7%
December 2011 582,000 174,600 88,900 64.4%
December 2012 585,900 175,770 104,300 66.7%
Control Rate is age-sex adjusted % of established patients with BP read in last 13 months with BP <140/90


Components of BP Quality Improvement
• Standardizing accuracy of office BP measurement
• Understanding the important role clinical inertia plays as a barrier to higher BP control rates
• Improving practice strategies to uncover patient specific barriers to improved BP control
• Facilitating the contribution of practice staff in achieving quality improvement goals
• Accepting that the physician is NOT the solution to every practice improvement plan

Summary
• It takes a community to improve chronic disease management
• Many partners are key contributors to that effort • Rochester is becoming a leader in community
based collaborative implementation of project to improve the quality and value of care to ALL
• Linkages are being built between the practice community, employers, faith community and community based organizations to maximize improvement

Practice-Level Culver Medical Group University of Rochester

Practice Setting
• Culver Medical Group – 7 Attending Physicians
– 28 Resident Physicians
– 1 Social Worker
• Setting – Urban
– Federally designated underserved area
– Predominantly Medicaid and Uninsured
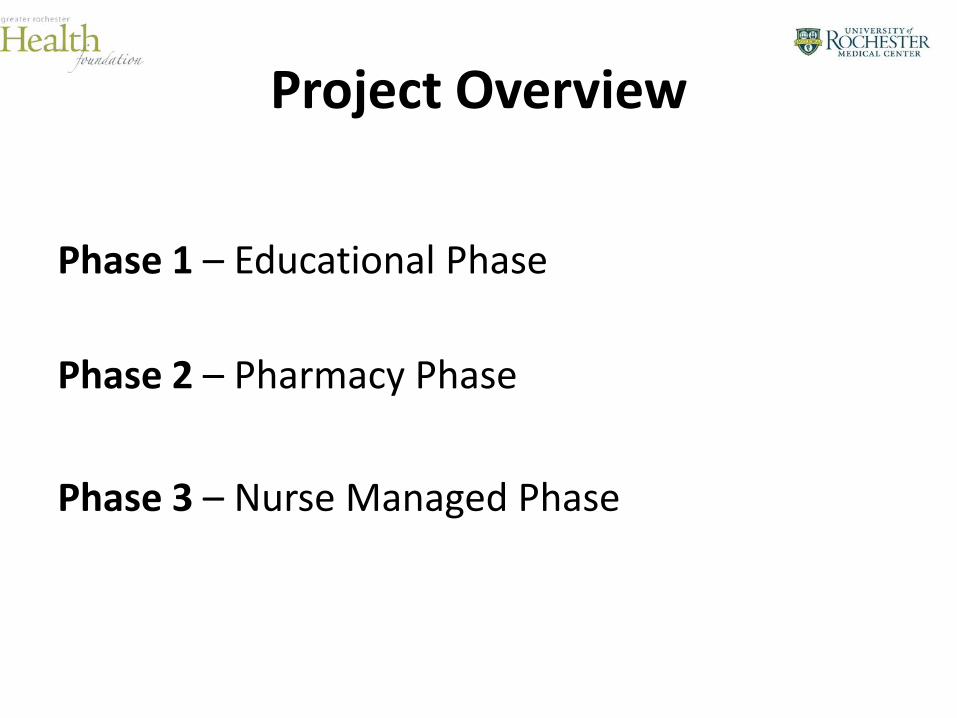
Project Overview
Phase 1 – Educational Phase
Phase 2 – Pharmacy Phase
Phase 3 – Nurse Managed Phase

Educational Phase
Phase 1 – Educational Phase • Teaching
– Guidelines
• Team Building
• Standardization of office protocols
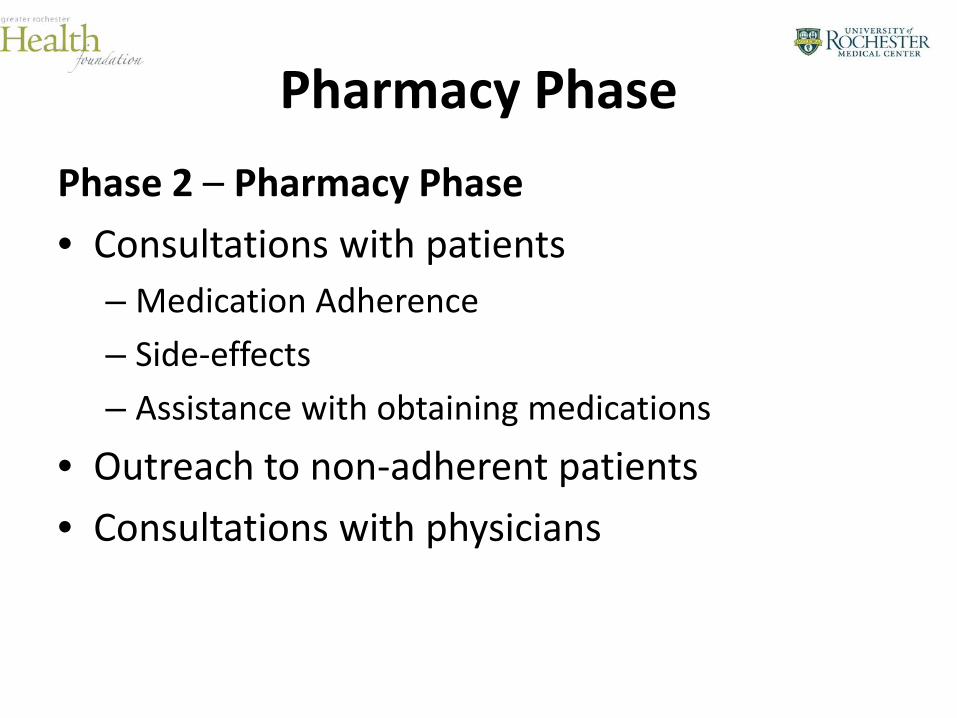
Pharmacy Phase
Phase 2 – Pharmacy Phase
• Consultations with patients – Medication Adherence
– Side-effects
– Assistance with obtaining medications
• Outreach to non-adherent patients
• Consultations with physicians

Nurse Managed Phase
Phase 3 – Nurse Managed Phase A. Patient-Level Management
– Direct patient visits. Titrate medications. – Phone calls to follow-up with patient
B. Population-Level Management – Outreach to uncontrolled patients without appts
C. Provider-Level Management – Provider reports – Transparent results – Working with individual providers and teams

Nurse Managed Phase
Hypertension Nurse
Direct Patient Care Follow-up appts
Titrate medications Phone management

Nurse Managed Phase
Hypertension Nurse
Direct Patient Care Follow-up appts
Titrate medications Phone management 100-125 Actively
Managed Pts
200+ Patients Contacts

Nurse Managed Phase
Hypertension Nurse
Direct Patient Care Follow-up appts
Titrate medications Phone management
Attending MD 1
Attending MD 2
Attending MD 7
Resident MD 1
Resident MD 2
Resident MD 28
100-125 Actively Managed Pts
200+ Patients Contacts

Nurse Managed Phase
Hypertension Nurse
Direct Patient Care Follow-up appts
Titrate medications Phone management
Attending MD 1
Attending MD 2
Attending MD 7
Resident MD 1
Resident MD 2
Resident MD 28
100-125 Actively Managed Pts
1,500 + Patients
200+ Patients Contacts

Nurse Managed Phase
Hypertension Nurse
Direct Patient Care Follow-up appts
Titrate medications Phone management
Attending MD 1
Attending MD 2
Attending MD 7
Resident MD 1
Resident MD 2
Resident MD 28
100-125 Actively Managed Pts
1,500 + Patients
200+ Patients Contacts

Nurse Managed Phase - Managing Physicians Teams -
Key Elements • Working with individual providers
1. Credibility
2. Sense of team
3. Efficiency
4. Proximity
• Transparency, Accountability 1. Provider Reports

Hypertension Report
Physician: Provider
Culver HTN Control Rate: 67.5% Physician Control Rate: 61.9%
--Patients Not at Goal-- Patient Name MRN SBP DB
P Last Appt Next Appt Patient Called? Follow-up
App Nurse f/u Comments
(Urgency of appt, Further instructions)
Last, First ***** 140 92 Apr 25 2011 8:00AM 5/11/2012
Yes Not required Message left Unable Contact
Needs appt Appt pending
RN call RN Appt None
Last, First ***** 140 98 Jul 20 2011 4:10PM NULL
Yes Not required Message left Unable Contact
Needs appt Appt pending
RN call RN Appt None
Last, First ***** 152 92 Sep 7 2010 1:50PM NULL
Yes Not required Message left Unable Contact
Needs appt Appt pending
RN call RN Appt None
Last, First ***** 144 92 Oct 1 2009 1:00PM NULL
Yes Not required Message left Unable Contact
Needs appt Appt pending
RN call RN Appt None
Last, First ***** 161 88 Nov 3 2010 8:50AM NULL
Yes Not required Message left Unable Contact
Needs appt Appt pending
RN call RN Appt None
Last, First ***** 151 76 Apr 1 2010 2:10PM 6/1/2012
Yes Not required Message left Unable Contact
Needs appt Appt pending
RN call RN Appt None
Last, First ***** 140 92 Apr 25 2011 8:00AM 5/19/2012
Yes Not required Message left Unable Contact
Needs appt Appt pending
RN call RN Appt None

Results
Hypertension Performance Improvement Project
Culver Medical Group

Prevalence
HTN Baseline (N=4991)
4/4/2011 (N=4538)
8/22/2011 (N=4506)
11/15/2011 (N=4420)
2/21/2012 (N=4496)
Percent Hypertensive
26.7% 28.1% 27.7% 27.2%
27.3%

Accurate Diagnosis
All Hypertensive Patients
Baseline (N= 1388)
8/22/2011 (N=1249)
11/15/2011 (N=1204)
2//21/2012 (N=1229)
Diagnosed HTN* 93.44% 97.0% 97.2% 97.6%
Undiagnosed HTN 6.56% 3.0% 2.8% 2.4%

Control Rates
40%
45%
50%
55%
60%
65%
70%
Aug-10 Apr-11 Aug-11 Nov-11 Feb-12 Jun-12 Jan-13 Apr-13
Data 1 Data 2 Data 3 Data 4 Data 5 Data 6 Data 7 Data 8
Perc
ent C
ontr
olle
d to
Goa
l
Education Phase
Pharmacy Phase Nursing
Phase
Maintenance Phase


Key Lessons Learned

Key Elements
1. Adequate Support
2. Physician “buy-in”
3. Transparency / Feedback (HTN Reports)
4. Population, Physician, and Patient Management

Key Elements
Adequate Support is Required
• Care management
• Nursing
• Pharmacy
• Clerical

Key Elements
Physician “buy-in” is Essential – Patient focused
– Peer implemented
– Physician input used in program development/adaptation

Key Elements
Transparency / Feedback (HTN Reports) – Timely, clinically useful information
– Aimed at improving patient care
– Structured to be helpful, not punitive
– Peer developed, peer delivered
– Provided in context of team

Key Elements
Population, Physician, and Patient Management
– Population-Management • Managing lists of patients
• Outreach to patients

Key Elements
Population, Physician, and Patient Management
– Population-Management • Managing lists of patients
• Outreach to patients
– Physician/Provider-Management • Leveraging multiple providers
• Promoting “Best-Practice”

Key Elements
Population, Physician, and Patient Management
– Population-Management • Managing lists of patients
• Outreach to patients
– Physician/Provider-Management • Leveraging multiple providers
• Promoting “Best-Practice”
– Patient-Management • Individual appts, counseling

Thank you