the first law of thermodynamics - usp · the first law of thermodynamics ... generally described as...
TRANSCRIPT

Chapter 2
The First Law ofThermodynamics
A. Introduction
To gain a good understanding of the laws of thermodynamics, it willhelp to develop an appreciation of the meaning of the words law andthermodynamics. Let’s take a moment to think about these wordsbefore launching into a detailed discussion of how we might unpackthe content of how the laws can be formulated. We are aided in thisquest by the nature of science itself, which unlike ordinary proseand poetry aims to give words a more or less precise definition.
We are familiar with the concept of law from our everydayexperience. Laws are rules that we are not supposed to break; theyexist to protect someone’s interests, possibly our own, and theremay be a penalty to pay if the one who breaks a law gets caught.Such are civil and criminal laws. Physical laws are similar but dif-ferent. They are similar in that they regulate something, namelyhow matter behaves under given circumstances. They are differentin that violations are not known to have occurred, and they describewhat is considered to be a basic property of nature. If a violation of aphysical law should ever seem to have occurred, you will think firstthat the experiment has gone wrong at some stage, and second thatmaybe the “law” isn’t a law after all.
Here’s an example. Galileo,1 like Copernicus,2 believed that theorbits of the known planets were circles; the circle being the shaperof perfection and perfection being of the heavens. This view wasinherited from Aristotle. Galileo also thought that the motion of
1 Galileo Galilei, Italian astronomer and physicist, lived 1564–1642. His model ofthe Earth, the Moon, the Sun and planets was based on that of Copernicus, whohad proposed a Sun-centered planetary system in his De Revolutionibus OrbiumCoelestium (1543). Galileo is widely considered the father of modern science,because he emphasized the role of observations and experimentation in thediscovery of new aspects of nature.
2 Nicolaus Copernicus (1473 –1543) held an ecclesiastical position in a church inPoland and was fascinated by astronomy.

celestial objects like planets was qualitatively different from themotion of terrestrial objects like cannonballs and feathers. But infact, the orbits of planets are ellipses, not circles,3 and themechanical laws of planetary motion are fundamentally the same asthose of a missile flying through the air on a battlefield, an objectrolling down an inclined plane, and an apple falling to the ground inan orchard.4 The point is not that Galileo was poor at science: hiscontributions to science have played an extremely important role inits development. Rather, the point is that what was considered a“law” was later shown not to be a law. (We can also see that at timesa great does not get it quite right, in the best cases not through aninherent unwillingness to give all due consideration to availableevidence, but because the evidence needed to change a perspectivesimply did not exist and was not yet sufficiently compelling.) Thereare many related examples one could cite from the history of sci-ence. It is the nature of human awareness of the physical world todevelop in this way. It borders on the inhumane to assess the sci-entific ability of people who lived in a previous age by the standardsand knowledge of today.
Whereas a human can break a law intentionally or unwittingly, abasic assumption of science is that a particle cannot break a law ofphysics. Particle motion is governed by the laws of physics (even if wedon’t know what those laws are). An important fact for us is that noviolation of a law of thermodynamics is known to have occurred innearly two hundred years of research in this area. Because of thismany scientists, for example, Einstein, consider the laws of ther-modynamics to be the laws of physics least likely to be overturnedor superseded by further research. The laws of thermodynamics aregenerally described as the most general concepts of all of modernscience. It behoves the biologist to be familiar with the basic prin-ciples of thermodynamics because they are of such basic impor-tance. In view of all this, we might begin to suspect that theconcepts we shall discuss are very deep and that considerable studyand thought will be the price to pay for mastery of them. Thus has itever been with basic things.
Energy has been around, well, since “the beginning,” but theword thermodynamics was not coined until 1840, from the Greekroots therme, heat, and dynamis, power. The same roots appear inthermometer (a device to measure temperature, or heat) and dynamite(a powerful explosive). We can guess, then, that thermodynamics
3 This was demonstrated by the German astronomer Johannes Kepler (1571–1630). In fact, though, the orbit of Earth is remarkably close to circular.
4 As shown by the English mathematician, natural philosopher, and alchemistIsaac Newton (1642–1727). Sir Isaac is perhaps the greatest scientist of all time.His voluminous writings show that he was apparently as interested in theologyand alchemy as in mathematics and natural philosophy, i.e. science. ThomasJefferson, principal author of the Declaration of Independence and thirdpresident of the USA, owned a copy of one of Newton’s lesser known works,Observations upon the Prophecies of Daniel.
26 THE FIRST LAW OF THERMODYNAMICS
will have to do with heat energy and power or movement. In fact,this branch of physics is concerned with energy storage, transfor-mation, and dissipation. Thermodynamics aims to describe andrelate – in relatively simple mathematical terms – the physicalproperties of systems of energy and matter. Thermodynamics hasvery much to do with molecular motion.
You might not think so, but you will certainly know somethingabout thermodynamics. If not from having studied physics beforestarting university, then from having seen what happens when apan of water is heated on the stove! At first, when the temperatureof still water is about 25 !C, nothing seems to be happening; the eyedoes not detect any motion. But when heat is applied, motionbecomes more significant and indeed readily apparent, so that bythe time the boiling point is reached the water is moving aboutrather violently! So you do know something about thermodynamics,even if you don’t normally think about it in the framework oftoday’s physics, and a lot was known about thermodynamics wellbefore the word was invented. There is not space to say much aboutthe history of thermodynamics here, but it is worth mentioning thatthe principles of this science grew out of practical attempts in thenineteenth century to understand how to make a steam enginework as efficiently as possible and why heat is generated when onedrills the bore of cannon, not academic speculation on universallaw. This suggests that there may be value in avoiding being tooprescriptive about how scientific knowledge should develop.
Like Kepler’s laws of planetary motion and Newton’s laws ofmechanics, there are three laws of thermodynamics (plus one).There is a good deal about the first two of them here and in Chapter 3;they form the core of classical thermodynamics. Discussion of theFirst and Second Laws also provides the necessary context forintroducing concepts that underlie the concept of free energy, auseful tool in the biological sciences (Chapters 4 and 5). The ThirdLaw of Thermodynamics is of less immediate importance to biolo-gists, but we’ll touch on it at the end of Chapter 3, showing how itraises some very interesting questions about the nature of livingorganisms. For the purposes of our present subject, the chief prac-tical value of studying the laws of thermodynamics is that theyprovide insight into how biological systems work and a frameworkfor designing experiments, testing hypotheses, and explainingresults.
We’re ready for the First Law of Thermodynamics. But beforeinvestigating it, let’s take one minute to go over the so-called ZerothLaw. The function of the Zeroth Law is to justify the concept oftemperature and the use of thermometers (two things most of usare accustomed to take for granted!), and it is included here toprovide a broader conceptual foundation to our subject. The form ofthe Zeroth Law is identical to that of a famous logical argumentknown at least as early as the ancient Greeks. It goes like this: iffi" fl (one premise), and fl" ! (another premise), then !"fi
INTRODUCTION 27

(conclusion). The Zeroth Law is built on this syllogism, or logicalargument consisting of three propositions. It involves the concept ofthermal equilibrium, that two objects A and B are in contact and atthe same temperature.5 The Zeroth Law states that if A is in thermalequilibrium with B, and B is in equilibrium with object C, then C isalso in thermal equilibrium with A (Fig. 2.1). Simple! In Chapter 1 wetouched on how temperature is a measure of the average speed ofmolecules in a gas. And now that we have the Zeroth Law, we arefree to use the concept of temperature as much as we like.
The First Law is a conservation law: energy can be changed fromone form to another, but in all its transformations energy is neithercreated nor destroyed (Fig. 2.2). There is a close resemblance to theconservation of matter, according to which the total amount ofmatter in a chemical reaction is a constant. The First Law of Ther-modynamics is empirical in nature; it cannot be derived from morebasic principles. Unlike the Pythagorean theorem,6 for example,which can be derived from the most basic principles of Euclideangeometry,7 there is no mathematical proof that the First Law ofThermodynamics is right. So then why should you believe it? Sedsolum ego ipse dixi? Some might question an appeal to “authority” inscientific circles. We accept the First Law on a number of differentbases, a most important and necessary one being that it is based onthe experience of many, many researchers. The First Law has beentested many times, and as far as anyone knows, it has not beenviolated even once. It works. It’s simple. It makes sense. That alonedoes not prove that the First Law is true, but it does at least give a goodreason for thinking that it is probably a pretty good description ofnature. So we believe in the First Law of the thermodynamics.
Despite its lack of a rigorous mathematical foundation, the FirstLaw is the basis of all quantitative accounts of energy, regardless ofform. The First Law makes energy the most scientific importantconcept in physics. And to the extent that physics is the basis of all ofscience and engineering, energy is the most important scientificconcept in these technical areas. We saw in the previous chapter, theenergy of a system can be converted from one form to another anddistributed in a myriad of ways. And now we assume that energy is
Fig. 2.1 The Zeroth Law of
Thermodynamics. If three systems,
A, B and C, are in physical contact,
at equilibrium all three will have the
same temperature. The concept of
equilibrium is discussed in depth in
Chapter 4.
Fig. 2.2 The First Law of
Thermodynamics. The total energy
of the universe is constant, no
matter what changes occur within.
This principle also applies to an
isolated system. Moreover, it is no
less applicable to an open system or
a closed system, as long as a
complete account can be made of
energy exchanged with the
surroundings.
5 That thermal equilibrium is characterized by the equality of a single parameter(temperature) for all systems was first stated by Joseph Black (1728–1799), aScottish chemist and physician.
6 Named after Pythagoras (c. 580–500 BC), a mathematically inclined pre-Socraticreligious philosopher. The Pythagorean theorem is a2" b2# c2, where a, b and care the lengths of the sides of a right triangle. Clay tablets unearthed in present-day Iraq prove that various combinations of integer which satisfy the algebraicequation were known a millennium before Pythagoras was born, historically onthe island of Samos, very close to present-day Turkey. A more intuitive,geometrical proof of the theorem requires no knowledge of algebra. Thetheorem boasts more different proofs than any other theorem of mathematics –literally hundreds of different ones.
7 The Greek mathematician Euclid lived c. 300 BC. His Elements of Geometry wasthe standard work on the subject until other types of geometry were inventedin the nineteenth century.
28 THE FIRST LAW OF THERMODYNAMICS

not created or destroyed. The energy of a system plus surroundings isconstant in time. For example, you can turn the chemical energy ofan aphrodisiac into heat by a series of bodily actions that are betterleft to the imagination than described in writing or expressed inmathematical formulae, but the amazing thing is that throughout allthe underlying changes, the total energy remains the same.
Box 2.1. Thermogenic oscillations keep the home fireburning
Homeotherms like mammals display adaptive thermogenesis. Detected exposure
to cold by the brain leads to the activation of efferent pathways which control
energy dissipation through the sympathetic nervous system. Mammals maintain
body temperature by constant metabolism in cells throughout the body and by
circulation of the blood. Plants, by contrast, lack a nervous system and are
generally regarded as poikilotherms; most plants are unable to control their own
temperature. Some cold-tolerant plants can, however, acclimatize to reduced
temperature. So-called thermogenic plants have metabolic pathways that increase
the temperature of a particular organ or tissue in response to cold. This group of
plants includes the lotus (Nelumbo nucifera), a sacred symbol of perpetual
regeneration in various religions. The lotus maintains its receptacle temperature
between 30 !C and 36 !C during the 2–4 day sequence of anthesis, during which
the flower bud opens and is fully functional. A perhaps more prosaic thermogenic
plant is the skunk cabbage (Symplocarpus foetidus), a species of arum lily whose
Japanese name, Zazen-sou, means Zen meditation plant, and whose English name
comes from its bad smell and cabbage-like leaves. Skunk cabbage blooms in the
early spring and maintains the temperature of the female spadix, the spike-like
flowering stalk, at close to 20 !C for about a week, even when the ambient air
temperature drops below the freezing point of water. Recently, researchers in Japan
have shown that the thermogenic oscillations of the skunk cabbage are induced by a
change in spadix temperature, through chemical reactions in the cells’ mitochondria.
The oscillations have a period of around 60min, and the threshold is less than
0.9 !C, the greatest precision known among plants. There is also some evidence
that the thermoregulation process is chaotic. In a model of the oscillatory
temperature-sensing ability of skunk cabbage, the temperature of the spadix is
maintained at a certain level where heat production and loss, due to radiation,
evaporation, conduction, and convection, are balanced. An as-yet unidentified
thermal sensor detects changes in temperature, and if the change exceeds the
threshold for over about 30min, thermogenesis is modified. The temperature
oscillator in skunk cabbage appears to be distinct from known circadian rhythms and
other kinds of biological rhythms.
B. Internal energy
To see more clearly how the First Law operates, we need to addinternal energy and work to our conceptual toolkit. As with heat,both internal energy and work are measured in units of joules (or
INTERNAL ENERGY 29

calories). But not all heat is work, and internal energy will be heat orwork only under certain circumstances. Say again? The internalenergy is the energy within the system, U. For our purposes U willrepresent only those kinds of energy that can be modified by achemical process – translational, vibrational, rotational, bonding,and non-bonding energies. A particle in a system may translate fromA to B, a bond may rotate and vibrate, a bond may break and reform,and particles may interact non-covalently, for instance, by electro-statics. We’ll leave out nuclear energy, even though it is alwayspresent and important in energy production and fusion reactions inthe Sun. Nuclear energy simply does not play much of a role in thetypical biochemical reaction, and when we think about a particularbiochemical reaction, we take the atoms involved as given and wedo not consider their history. So we can leave nuclear energy out ofany calculation of the internal energy because the nuclear energydoes not change in the typical biochemical reaction. Keeping trackof quantities that do change is complicated enough!
The internal energy defines the energy of a substance in the absenceof external effects, for instance, those owing to capillarity, electricfields, andmagnetic fields. But U is an extensive property of a substance,meaning that its value depends on the size of the sample. For instance,the internal energy of 2 g of fat is twice as great as the internal energyof 1 g of fat under the same conditions. An intensive property; bycontrast, for example, the concentration of sodium in a solution ofsodium bicarbonate, is independent of the amount of the sample. U isa special kind of thermodynamic quantity called a state function. Thismeans that U can be expressed in a certain mathematical form, andthat the value of U depends only on the current state of the system (e.g.temperature, pressure and number of particles) and not at all on howthe particles of the system came to be arranged in a particular way. Anexample will help to illustrate the point. The internal energy of anaqueous buffer solution depends only on its current state and not onwhether it wasmade directly bymixing some chemicals withwater orwas prepared from a concentrated stock solution that had been frozenat $20 !C for however long. Other general properties of state func-tions will be introduced as we go along.
The internal energy of a system cannot be measured directly; it iscalculated from other measured properties. Moreover, it is not Uthat is measured but a change in U. But this presents no problemsbecause normally we are interested in changes in U and not U itself.When a process brings about a change in a system from state 1 tostate 2, the internal energy changes from U1 to U2, and the differ-ence 1U"U2 – U1. For example, when salt is dissolved in water alarge amount of heat is released, and solvation of the ions can bemeasured as a change in temperature. State 1 is the crystalline formof the salt and pure water, and state 2 is the salt when it is completelydissociated into ions and solvated. It does not matter whether wethink of dissolution occurring in several steps (e.g. separation of ionsin vacuum followed by solvation) or all in one go (Fig. 2.3); the
Fig. 2.3 Thermodynamic cycle.
The difference in internal energy
between state 2 and state 1 is
1U1!2. Because U is a state
function, the energy difference is
independent of path; the internal
energy of a system is determined by
the specific physical properties of
the state of the system and not on
how the state was prepared. It
follows that if the system begins in
state 1 and is brought back to this
state, 1U" 0. In symbols,Ploop1X" 0. This holds not just
for the internal energy but for any
state function X.
30 THE FIRST LAW OF THERMODYNAMICS

computed energy difference between states 1 and 2 is the same. Thisimplies that 1U for a complete cycle, say, a change from state 1 tostate 2 and back again, will be 0, regardless of the path of the process –the succession of states through which the system passes. Manyexperiments corroborate the rule, and no exception is known. This isthe experimental basis on which U is considered a state function. Allstate functions are path-independent.
The path-independence of U has the ring of the First Law about it.In fact, changes in U are what the First Law is about! In the moneyanalogy of Chapter 1, the total amount at the end of the day did notdepend at all on whether payment was made in coins and bank-notes, nor on the order in which the customers made their pur-chases (and definitely not on the identity of the customers); itdepended only on which purchases were made on a particular day.There are many, many ways in which money could change handsand still compute to a net change of 1m. The situation with 1U isclearly very similar. Let’s now set internal energy aside for amoment and have a look at work.
C. Work
Work,w, is a key physical quantity in thermodynamics; we had betterknow something about it. Adequate treatment of work requires theconcept of force, F, so let’s look at F and then w. A force is anyinfluence that can cause an object to be accelerated, and it is usuallymeasured in newtons, N (1N" 1kg- m- s$2). There are as many kindsof force as there are kinds of energy. A familiar example of a force isthe gravitational force of attraction of Earth for some object, e.g. thebook you are reading. The force of gravity on an object is proportionalto the quantity ofmatter (itsmass), and for objects near the surface ofEarth, the acceleration due to gravity, g, 9.8m- s$2. These conceptsare combined in Newton’s famous second law, F"ma, wherem is themass of the object and a is the acceleration. When the force is thegravitational force, a" g and F"mg. The gravitational force on a70kg man, i.e. his weight, is 70 kg · 9.8m- s$2" 690N. The ratio ofweight (F) to mass (m), namely, the acceleration due to gravity (g), isthe same for a large object and a small object. Similarly, the ratio ofcircumference to diameter is the same for a large circle and a smallcircle. Time to get to work!
Work is similar to heat. When heat is added to a system, theinternal energy changes (it increases). When work is done on a sys-tem, for example by compressing the volume of a gas, the internalenergy changes (it increases). Both heat andwork are forms of energytransfer across the boundary of a system; q and w are “boundaryphenomena” (Chapter 1). You may have noticed that, unlike theinternal energy, both heat and work are represented by lower casesymbols. This is because U is a state function, but neither q nor w is astate function. Instead, q and w are path functions. In practical terms
WORK 31

this means that both q and w are transient quantities, unlike U, whichis stored in a system. So heat and work are similar. But they are alsodifferent, and that’s why different names are needed. They differ inthat work is the equivalent of a force (e.g. gravity) acting through thedisplacement of an object, while heat is the transfer of energy owingto a temperature difference. Work involves the non-random move-ment of particles, heat the random movement of particles.
There are many different kinds of work. Not many differentpossible jobs for readers of this book, but different kinds of w. Hereare a few of the latter sort: lifting of a weight against the force ofgravity, expansion of a gas against an external pressure, movementof a charge against an electric field gradient (voltage), rotation of ashaft driving a fan, driving of an electric generator, expansion of aliquid film against its surface tension. In each case a force actsthrough a displacement, resulting in work being done by or on thesystem. The system does work when it pushes on the surroundings,and work is done on the system when the surroundings push on thesystem. When a system consisting of gas in a syringe is compressedby pushing on the plunger, the surroundings, which may includeyour hand and arm, do work on the system, and the internal energyof the gas increases.
The technical definition of work is similar to the one we arefamiliar with from everyday life. If someone “works hard,” they puta lot of effort into accomplishing a task or reaching a goal. Similarly,in physics work is done when an object is moved against anopposing force. For example, when a crate is lifted vertically againstthe opposing force of gravity, the atoms of the box are involved inan organized transfer of energy; all the atoms of the box movetogether in the same direction. The heavier the crate, the more workdone. But there are also differences in meaning, so we need toclarify what is meant by work. Although it may be income-earningwork (non-technical meaning) for a porter to tote baggage at somedistance above the ground, if the distance above ground is fixed nowork (technical meaning) is done. This is because the suitcase is notdisplaced against the opposing force of gravity, though it is main-tained at a fixed height against the pull of gravity. We have assumedthat the suitcase alone is the system. If the person carrying the suit-case is made part of the system – and we are free to define the systemhowever we like – then a sort of work, “physiological” work, is donein holding the suitcase at a fixed distance off the floor. Physiologicalwork is done to maintain the muscle tension needed to hold thesuitcase in place. This work results from transformation of chemicalenergy into mechanical energy in striated muscle (red meat) – aprocess that involves a lot of nerve impulses, the energy moleculeATP (Chapter 5), and polymerized actin and myosin (Chapter 8).
Another example will help to illustrate how work is done incoordinated movement against an opposing force. Pumping air intoa bicycle tire is easy if the tire is flat; there is not much stuff in thetube to resist the flow of air in. Once the tube starts to fill, however,
32 THE FIRST LAW OF THERMODYNAMICS

and the pressure begins to build, it gets harder and harder to forceair in. Here air in the pump is being moved in an organized wayagainst the opposing force of the compressed air in the tire. Duringinflation, the tire expands somewhat but not much. This is becausetires are made to adopt a certain shape, one well-suited to theirfunction. The volume of the tire is approximately constant. Whydoes the pressure increase as you pump more air in? More and moremolecules get stuffed into more or less the same volume.
Similarly, you may have been to a nightclub or concert, or beenwearing a headphone, and found the music painfully loud. This isnot merely a psychological effect: it comes from huge waves of airpressure smashing into your eardrum! Even in the middle of agrassy plain on a still day, where there is not a sound to be heardanywhere, the eardrum is in contact with the air. Nitrogen, oxygen,and carbon dioxide bombard it continually. We usually take nonotice of this, because the same types of molecules are bombardingthe eardrum from the opposite side with equal force. We detect adisturbance of the air as sound only when there is a pressure dif-ference across the eardrum (a type of membranous boundary) and thedifference is large enough. When a sound is so loud that it makesyour ears hurt, it’s because the pressure on the outside of youreardrum is far greater than the pressure on the inside, and to saveyour hearing it would be advisable to plug your ears or leave!
When particles of a system have reached thermal equilibrium, all theparticles will have the same (average) thermal energy. In a gas, as wesaid above, some particles will be moving faster than others, but wecan think of the like particles as having the same average speed. Bythe Zeroth Law, the temperature of each object in the system will bethe same at equilibrium.Whatwe’re getting at here is that the thermalenergy of a collection of particles is proportional to T, the absolutetemperature. Suppose our system is a gas at thermal equilibrium. Thegas particles move about freely within the system in all directions;particle movement is disorganized, or random. From time to time (veryoften!) a gas particle will collide with a wall of the container, thesystem boundary. The impact of such collisions will give rise to apressure exerted by the particles on the contained. If we keep thevolume constant but increase the number of particles in the con-tainer, the number of collisions between particles and boundary risesand the pressure is increased. If the volume and number of particlesis constant but heat is added, the speed of the particles goes up and sodoes the temperature. Faster particles strike the walls of the systemmore often, increasing pressure. This descriptive view of tempera-ture and pressure fits the simple mathematical relationship calledthe ideal gas law: pV" nRT, the pressure times the volume equals thenumber of moles of gas times the gas constant times the absolutetemperature. This law has a long empirical foundation, and it can bederived frommore basic principles. The ideal gas law is too simplisticto provide an accurate description of most real gases, but like manyof the examples of elementary physics, it is none the less useful for
WORK 33

making sensible qualitative predictions about the behavior of matterunder most of the conditions that most of us are likely to care about.We can leave the ideal gas law for now, but there will be reasons topay it another visit later on.
What if we have amixture of two different kinds of gas particles, a“light” gas like hydrogen and a “heavy” one like nitrogen? At thermalequilibrium, all the particles will have the same thermal energy. Butwill the heliummolecule and nitrogen molecules bombard the wallsof the container with equal force? No! Why not? Their masses aredifferent. From physics the energy of motion of a particle, its kineticenergy (K.E.), is proportional to itsmass times its velocity squared: K.E./ mv2. (The direction of motion is not important here, so we canthink of velocity as speed.) K.E. is a non-linear function of v. If thevelocity of an object doubles, say, from 1 to 2m s$1, its K.E. quad-ruples. We can make the proportionality into an equality by includ-ing a multiplicative factor, in this case 1/2, but it’s not needed for thepresent discussion. The momentum of a particle p"mv. It is a linearfunction of v. The momentum of an automobile traveling at velocityv1 is clearly much greater than that of a bicycle traveling at v1.Historically, it took a good long while for physicists and philosophersto clarify the difference between K.E. and momentum and the rela-tion of these quantities to energy and force, but we now think this isunderstood pretty well. By simple substitution K.E. / p2/m. Momen-tummatters to our present study because a change inmomentumperunit time is proportional to a pressure. A change in momentum perunit time is a force, and a force per unit area is a pressure. In symbols,1p/1t" F" p/A. At thermal equilibrium, the (average) kinetic energyof a particle is equal to the (average) thermal energy, so p2/m / T atequilibrium. Solving this relationship for p gives p/ (Tm)1/2. Thus, inour mixture of gases a “heavy” nitrogen molecule will have a greateraverage momentum than a “light” hydrogen molecule. Such ideasunderlie all of physical biochemistry, and it will help us to keep themrunning in the background of our thinking as we make our waythrough the many avenues of our subject.
Before concluding this section,wewant to introduce the concept ofa heat engine. We’ll give the heat engine the once-over-lightly treat-ment here and come back to it with vigor in Chapter 3. As shown inFig. 2.4A, a heat engine does work by transferring heat from a source(e.g. a radiator) to a sink (e.g. a cold room). Only some of the heattransferred can be used to do work, because there is a fundamentallimit on engine efficiency. (This limitation is a statement of the SecondLawof Thermodynamics, aswe shall see inChapter 3.) Theheat energythat is not used to do work enters the heat sink as randomizedmolecularmotion.Work is energy transfer by orderedmotion, heat isenergy transfer by random motion. Note here how the First Lawapplies: the energy lost by the heat source (1U) is either convertedinto work (w) or transferred to the heat sink (q), andw and qmust sumto 1U. Figure 2.4B shows a diagram of a cell, say, an epithelial cell; itcould just as well represent a tissue, organ or entire organism. The
34 THE FIRST LAW OF THERMODYNAMICS

system of inputs and outputs resembles the situation in panel (A),but in panel (B) everything is at the same temperature. An organism isan isothermal system. Figure 2.4C shows how the heat energy of acandle can be used to do work. A rubber band dangles from a hori-zontal support, and attached to the rubber band is a weight (a massaccelerating under the force of gravity).When heat from the candle isabsorbed by the molecules of the rubber band, the rubber bandcontracts. The attached weight is translated a distance1x against theopposing force of gravity, and workw is done. Some of the heat of thecandle will of course be lost to the surrounding air (this heat engine israther inefficient), and only if adequate care is taken will the rubbernot melt before our eyes, leaving no engine at all! Bearing all this inmind, let’s take a closer look at how the First Law works.
D. The First Law in operation
By convention, the internal energy of a system will increase either bytransferring heat to it or by doing work on it (Table 2.1). Knowingthis, we can express the First Law of Thermodynamics as follows:
1U " q# w: %2:1&
Note that, in keeping with our earlier comments on measuringenergy, the First Law defines only changes in 1U. The conceptualbackground to Eqn. (2.1) was formulated in 1847 by the eminentGerman physicist and physiologist Hermann Ludwig Ferdinand vonHelmholtz (1821–1894).8 The idea of energy conservation had been
Fig. 2.4 Heat transfer. (A) Heat is
transferred from a source (a warm
body) to a sink (a cold body). Some
of this heat can be used to do work,
but certainly not all of it (Chapter 3).
(B) Schematic representation of
energy transformations within the
body. The energy “input” is food.
There are several “outputs.” Aside
from heat and work, which are
mentioned explicitly in the First Law,
there is excretion and change in
body weight. In general, (food
intake) – (waste excreted)" (change
in body weight)# (heat)# (work),
according to the First Law of
Thermodynamics. (C) A very simple
heat engine. The rubber band
contracts when heated, lifting a
weight. Because the weight is
translated against the force of
gravity, work is done. Thus, some
portion of the heat is turned into
work. The efficiency of this
engine is low! Panel (C) is based on
Fig. 44–1 of Feynman et al. (1963).
8 See Ueber die Erhalting der Kraft (Berlin: Reimer, 1847). Helmholtz was son of ateacher of philosophy and literature at the Potsdam Gymnasium, a top-gradesecondary school; his mother was descended fromWilliam Penn, a Quaker who
THE FIRST LAW IN OPERATION 35

proposed in 1842 by the German physiologist Julius Robert vonMayer (1814–1878).9 It is interesting that a physiologist played suchan important role in establishing one of the most importantconcepts of thermodynamics. When a system does work on itssurroundings, w makes a negative contribution to 1U because thesystem loses energy. Similarly, if heat is lost from the system, qmakes a negative contribution to 1U. In other words, 1U measuresthe net amount of energy change in the system; it is the differencebetween the energy gained from the surroundings and the energylost to the surroundings.
Let’s look at some examples of Eqn. (2.1) in action. James PrescottJoule (1818–1889), son of a brewer in Manchester, England, isfamous for his studies on the conservation of thermal energyunderstood as the mechanical equivalent of heat (1843). Perhaps thebest-known experiment Joule did was to monitor the temperature ofa vat of water during stirring. In this experiment, increases in water
Table 2.1. Sign conventions for heat and work
Heat is transferred to the system q > 0Heat is transferred to the surroundings q < 0The system expands against an external pressure w < 0The system is compressed because of an externalpressure
w > 0
was expelled from Oxford University for refusing to conform to Anglicanismand who later founded the American Commonwealth of Pennsylvania.Helmholtz’s earned degree was in medicine; he would eventually receive anhonorary doctorate in physics. Music and painting played a large part in hisscience. The present author, who was a Ph.D. student at Johns HopkinsUniversity and a post-doctoral research fellow at University of Oxford, isconnected to Helmholtz in various ways. Helmholtz’s student Otto RichardLummer (1860–1925) was awarded the doctorate in physics at the HumboldtUniversity of Berlin. And Lummer was thesis adviser of George Ernest Gibson, aScot, at University of Breslau, who was the adviser of Henry Eyring (see Chapter8) in the Department of Chemistry at University of California at Berkeley, whowas adviser of I in the Department of Chemistry at University of Utah, who wasthesis adviser of J in the Department of Chemistry at University of Minnesota,who was thesis adviser of K in the Department of Pharmacology at University ofVirginia, who was thesis adviser of the author. Johns Hopkins University wasfounded in 1876 by a wealthy Quaker merchant on the German model, whichemphasized specialized training and research. The person who advisedHelmholtz’s medical thesis was Johannes Peter Muller, son of a shoemaker.Muller’s academic degree was in medicine. His Handbuch der Physiologie desMenschen fur Vorlesungen was recognized throughout the world, and itestablished a positive interchange between physiology and hospital practicein Germany, stimulated further basic research, and became a starting point forthe mechanistic concept of life processes.
9 The conservation of mechanical energy (kinetic energy#potential energy"constant) had in fact been proposed much earlier, by the German philosopherand mathematician Gottfried Wilhelm Leibniz (1646–1716), son of a professorof moral philosophy, and was an accepted principle of mechanics. Mayer’smore general statement stemmed, curiously, from an analysis of the color ofblood – a key means of distributing food energy throughout the body.
36 THE FIRST LAW OF THERMODYNAMICS

temperature represent positive increments in q, the heat transferredto the system. A motor turns a wheel in contact with water. Thesystem is the water plus the wheel. As the wheel turns, mechanicalenergy is converted into increased motion of the water, and as wehave seen, the motion of water is related to its temperature. Indi-vidual water molecules collide with the wheel and with each other.Vigorous and protracted stirring could eventually bring the vat ofwater to the boil. The system does no work; it does not expandagainst an opposing pressure or anything like that, so w"0 and1U" q. As a second example, suppose we have a motor. Suppose ithas been determined that the motor generates 30kJ of mechanicalwork per second, and that 9 kJ is lost to the surroundings as heat inthe same amount of time. The change in internal energy of themotor per second is $9kJ $ 30kJ"$39kJ. The energy produced bythe motor is negative because work is done by the system on thesurroundings and heat is lost to the surroundings. OK, but we alsowant to see how these ideas can be applied to something biological.
Above we saw that no work is done in holding up a heavy cratewhen the person is excluded from the system. And even when theperson is included, no physical work is done, just physiologicalwork. And if the energy expended in holding up the crate is notreplenished by food, there will be a net decrease in the internalenergy of the body. Our bodies do work even when we’re sleeping!When you touch a metallic door handle on a wintry day, unless youhave gloves on you can feel the heat being transferred from yourflesh to the metal, and it might hurt! This heat transfer makes anegative contribution to the internal energy of the body, and theenergy used to keep the body warm comes from food. When youwalk up a flight of stairs, you do work against the force of gravity. Ifthere are many steps to climb, as for instance on the way up to thecupola of Santa Maria del Fiore in Florence, or to Lady Liberty’storch in the Big Apple, by the time you’ve reached the top you maywell be out of breath and dripping with perspiration. But if you’recaptivated by the view, you will not mind too much! Not only willyou have lost energy to move your weight against Earth’s gravita-tional pull on your body, you will be losing a lot of heat energy tothe surroundings to keep your body cool. In any case, the energyused to climb stairs and the energy lost as heat comes from food.
We can be more quantitative about work with relatively littleadditional effort. From physics, the work done when an object isdisplaced a distance 1x (xfinal $ xinitial, where x refers to position)against an opposing force (hence the minus sign) of constant mag-nitude F is calculated as
w " $F1x: %2:2&
We see that work is the product of an “intensity factor” that is inde-pendent of the size of the system (the force) and a “capacity factor”(the change in the position of the object on which the force acts). Forinstance, thework done against gravity by a 50kgwoman in climbing
THE FIRST LAW IN OPERATION 37
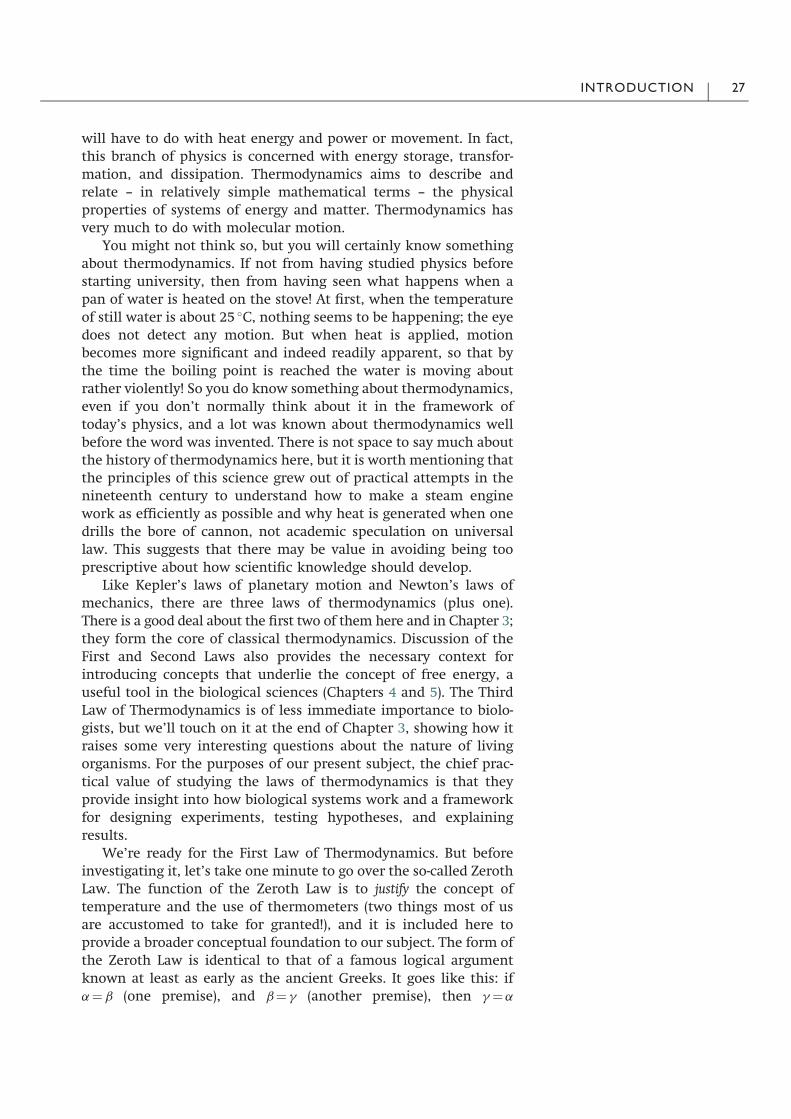
to a point on a ladder 4m above the ground is $(50kg· 9.8ms$2) ·4m"$1960kgm2 s$2"$1.96kJ. (Note: 1 J" 1kgm2 s$2. Oddly, thedimensions of energy are [mass][length]2[time]$2.) The minus signindicates that energy has been expended by the system, in this case,the woman. Diagrams help visualize the situation. The work donein Eqn. (2.2) can be represented graphically as an area, as shown inFig. 2.5A. Figure 2.5B shows that the work done during a processdepends on the path, because the shaded area need not be the samefor all processes. This is a way of depicting that w is a path function;its magnitude depends on the path.
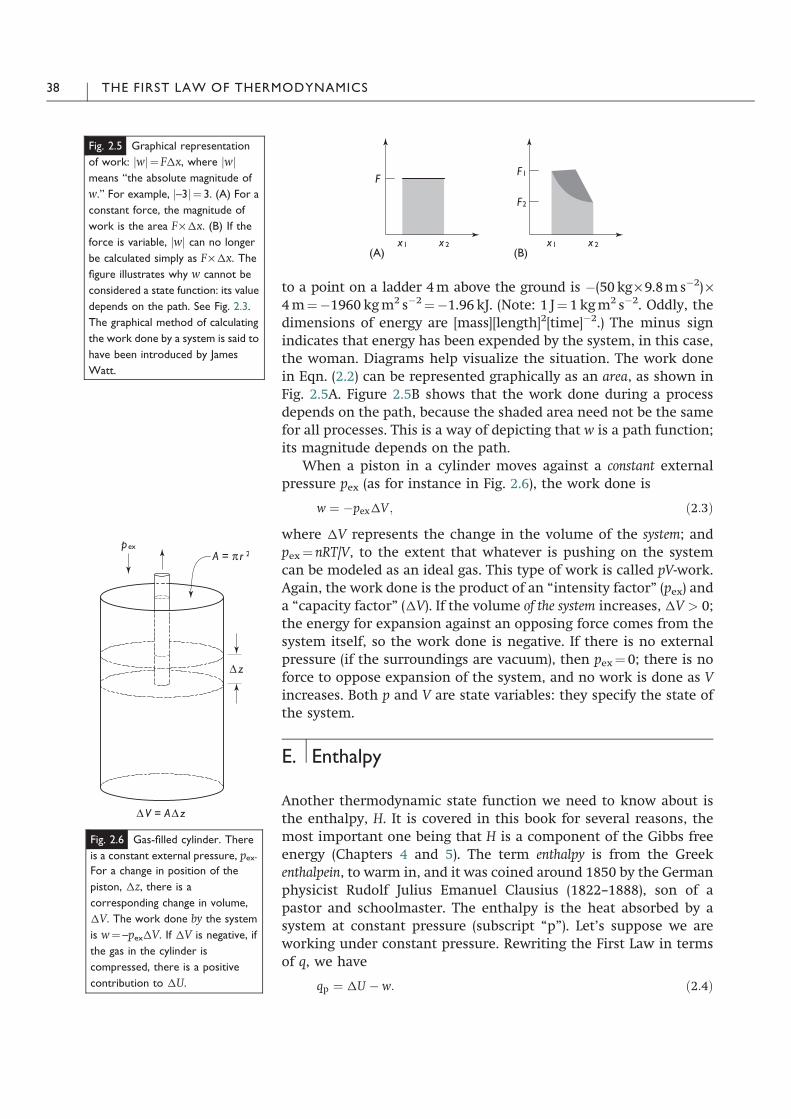
When a piston in a cylinder moves against a constant externalpressure pex (as for instance in Fig. 2.6), the work done is
w " $pex1V; %2:3&
where 1V represents the change in the volume of the system; andpex" nRT/V, to the extent that whatever is pushing on the systemcan be modeled as an ideal gas. This type of work is called pV-work.Again, the work done is the product of an “intensity factor” (pex) anda “capacity factor” (1V). If the volume of the system increases, 1V > 0;the energy for expansion against an opposing force comes from thesystem itself, so the work done is negative. If there is no externalpressure (if the surroundings are vacuum), then pex"0; there is noforce to oppose expansion of the system, and no work is done as Vincreases. Both p and V are state variables: they specify the state ofthe system.
E. Enthalpy
Another thermodynamic state function we need to know about isthe enthalpy, H. It is covered in this book for several reasons, themost important one being that H is a component of the Gibbs freeenergy (Chapters 4 and 5). The term enthalpy is from the Greekenthalpein, to warm in, and it was coined around 1850 by the Germanphysicist Rudolf Julius Emanuel Clausius (1822–1888), son of apastor and schoolmaster. The enthalpy is the heat absorbed by asystem at constant pressure (subscript “p”). Let’s suppose we areworking under constant pressure. Rewriting the First Law in termsof q, we have
qp " 1U $ w: %2:4&
Fig. 2.5 Graphical representation
of work: jwj" F1x, where jwjmeans “the absolute magnitude of
w.” For example, j–3j" 3. (A) For a
constant force, the magnitude of
work is the area F·1x. (B) If theforce is variable, jwj can no longer
be calculated simply as F·1x. Thefigure illustrates why w cannot be
considered a state function: its value
depends on the path. See Fig. 2.3.
The graphical method of calculating
the work done by a system is said to
have been introduced by James
Watt.
Fig. 2.6 Gas-filled cylinder. There
is a constant external pressure, pex.For a change in position of the
piston, 1z, there is a
corresponding change in volume,
1V. The work done by the system
is w" –pex1V. If 1V is negative, if
the gas in the cylinder is
compressed, there is a positive
contribution to 1U.
38 THE FIRST LAW OF THERMODYNAMICS

When the pressure is constant and the system expands from state 1to state 2, the system does work on the surroundings. If the onlytype of work is pV-work, Eqn. (2.4) becomes
qp " U2 $ U1 # p %V2 $ V1&: %2:5&
We can rearrange Eqn. (2.5) as
qp " %U2 # pV2& $ %U1 # pV1& " 1U # p1V: %2:6&
The complicated quantity 1U# p1V is equivalent to the heatexchanged at constant pressure. The right-hand side of Eqn. (2.6) is astate function, called the enthalpy, H:
H " U # pV: %2:7&
Equation (2.7) can seem confusing and abstract; we need a way ofmaking things fit better with what we have said already and oureveryday experience of the world. We said above that w"$pex1V isa path function. But how can a state function plus a path functionequal a state function? It is precisely because, although the productof p and V is a path function, p and V themselves specify the state ofthe system, and like U, they are independent of how that state wasreached. H is therefore a state function, and it is no less or more ofa state function than U is. And the development leading up toEqn. (2.7), e.g. Eqn. (2.6), says that if the pressure is constant, theamount of heat exchanged during a reaction is independent ofwhether the product is formed directly or indirectly, in one or in aseries of steps.10 This statement, which is based on the results ofexperiments, says that state functions and state function differences(e.g. 1U or 1H) are additive (compare Fig. 2.3).
Looked at another way, the enthalpy can be thought of as theamount of energy in a thermodynamic system for transfer betweenitself and the environment. For example, in the calorimetryexperiments in Chapter 1, the change in enthalpy was (very close to)the heat of oxidation, which was the energy transferred from theoxidized compounds to the calorimeter. When a system changesphase, for example, when a quantity of liquid water becomes solid,the change in enthalpy of the system is the “latent heat” of fusion,the heat given off to the environment in the freezing process. Andin a temperature change, for example, the cooling off of a food itemwhen placed in a fridge, the change in the enthalpy per unit tem-perature reflects a property of the material.
Let’s see what happens when the enthalpy varies by a small butmeasurable amount. From Eqn. (2.7) we have
1H " 1%U # pV& " 1U #1%pV& " 1U # p1V # V1p: %2:8&
10 This is known as the “law of constant summation” of the Swiss–Russianchemist Germain Henri Hess (1802–1850), a physician and chemist. Hess’s Lawrestates the First Law, though historically the former preceded the latter.
ENTHALPY 39

Note that p and V are assumed to vary independently. If the externalpressure is constant, 1p"0 and the last term vanishes. Substitutingin Eqn. (2.1) and requiring pV-work only gives
1H " qp $ p1V # p1V: %2:9&
The last two terms on the right-hand side cancel, and we are left with
1H " qp: %2:10&
Just as we said, the heat transferred to a system at constant pressuremeasures the change in the enthalpy of the system.Why the emphasison heat transfer at constant pressure in a book on biological thermo-dynamics? Most of the reactions biochemists study are carried out atconstant pressure (usually 1 atm), and aswe shall see in Chapter 4,H isa component of a state function known as the Gibbs free energy, G,which predicts the direction of spontaneous change for a process atconstant pressure and temperature, the biological scientist’s favoriteexperimental constraints.
How can we understand the difference between 1H and 1U?Equations presented above make them out to be quite different, butthe discussion about them sounds quite similar. In fact, the differ-ence between 1H and 1U is often small enough to be neglected, butnot always. If a reaction occurs in solution, and gas is neitherproduced nor consumed, 1V ' 0. Under such circumstances 1U 'qp, as we can see from Eqn. (2.5), and so 1U ' 1H. An example willhelp to illustrate that as a general rule it is a mistake not to takeaccount of differences when there are reasons to suspect they mightbe significant. From Eqn. (2.7),
1H " 1U #1%pV&: %2:11&
The ideal gas law is pV" nRT, so assuming that the gas involved inour experiment can be modeled as an ideal gas, Eqn. (2.11) can bewritten as
1H " 1U #1%nRT&: %2:12&
If we now require constant temperature, 1(nRT)" RT(1n), where 1nrepresents the change in the number of moles of gas in the reaction;R, the universal gas constant, is 8.3145 J K$1 mol$1 in SI units(1.9872 cal K$1 mol$1 is also still in use); and T is the absolutetemperature.
To illustrate, let’s express the combustion of ethanol as:
C2H5OH%1& # 3O2%g& ! 2CO2%g& # 3H2O%1&: %2:13&
From a bomb calorimetry experiment at 298K and constant volume,1368kJ mol$1 of heat are released in the reaction. Now, 1n" 2 $3"$1. Therefore, by Eqn. (2.12), 1H(298K)"1U(298K)$RT"$1 368000 J mol$1$ 2480 J mol$1"$1370kJ mol$1. This is a smalldifference between 1H and 1U – less than 1%, i.e. 1H is approxi-mately equal to 1U for beer, wine, and other such beverages – butit is a difference. We learn from this example that, although the
40 THE FIRST LAW OF THERMODYNAMICS

oxidation heats of Chapter 1 are changes in internal energy, they arevery close to the corresponding changes in enthalpy. Check whetherthe combustion data you use for calculations do or do not take thepV term into account! A process for which the change in enthalpy isnegative is called exothermic, as heat is let out of the system intothe surroundings; a process for which the change in enthalpy ispositive is called endothermic, as heat is let into the system from thesurroundings.
Combustion of food in a bomb calorimeter tells us more than justhowmuch heat is produced when food is completely burnt to a crisp.Indeed, tables of oxidation would be of little use to nutritionists ifthe numbers did not say something about the energetics of meta-bolism. Such tables are useful to the physicist, the biochemist, andthe nutritionist because the laws of physics are assumed to beindependent of time and location. In other words, the enthalpy ofoxidation of glucose is not one value in a bomb calorimeter and someother value in the striated muscle connecting your big toe to the restof your body. By Hess’s Law, this enthalpy equivalence holds despitethe fact glucose oxidation occurs in the body by a large number ofsequential steps involving a large number of chemical intermediates.This discussion suggests that we can use machines like calorimetersto investigate the thermodynamic properties of the body and themolecules the body is made of. It also suggests that our bodiesthemselves are very much like machines.
Finally, suppose we have a system of pure water. We know fromcareful measurements that when ice melts at #0.1 !C, barely abovethe melting temperature, 1H"1437.2 cal mol$1. When meltingoccurs at $0.1 !C, just below the freezing point, 1H" 1435.4 calmol$1. The difference in enthalpy differences, 1(1H), is 1.8 calmol$1. This is only about half the enthalpy change we would expecton changing the temperature of water by 0.2 !C in the absence ofmelting. (See Section H below.) The difference arises from the changeof phase that occurs between the initial state and final state, themelting of the solid into a liquid. It is necessary to account for theheat effect of any changes in the state of matter (solid, liquid or gas)when calculating 1H.
F. Standard state
Changes in enthalpy (and other state functions) in tables of thermo-dynamic data are generally given for processes occurring under astandard set of conditions. The standard state is usually defined as onemole of a pure substance at 298.15K (25.00 !C) and 1 bar (1 bar"105 Pa"0.986 932 atm). An example is the standard enthalpychange accompanying the conversion of pure solid water to pureliquid water at the melting temperature and a pressure of 1 bar:
H2O%s& ! H2O%l& 1H o$$%273K& " 6:01 kJ mol$1: %2:14&
STANDARD STATE 41
Note that this enthalpy change is positive: heat must be added to iceat 0 !C in order to melt it. The standard enthalpy change used by thebiochemist, 1H!, is the change in enthalpy for a process in whichthe initial and final states of one mole of a substance in pure form arein their standard state: 25 !C and 1 atm pressure. The difference inenthalpy from the difference between 1bar and 1 atm is almostalways small enough to be neglected in biochemical reactions. Butone should nevertheless be aware of the different ways in whichthermodynamic data of use to the biochemist are presented intables and be on the lookout for situations where the small differ-ences cannot be neglected.
G. Some examples from biochemistry
Equation (2.10) is useful to the biochemist. As we have seen, it helpsto make sense of the oxidation heats measured by bomb calori-metry. It can also be used in the study of protein stability, animportant subject for several reasons. One is that about half of thedry mass of the human body is protein, and knowing how a poly-peptide folds up into its native state would be of tremendous valuein making good use of all the protein-encoding DNA sequence datathat has been revealed by the Human Genome Project.
How can Eqn. (2.10) be used to study the thermodynamic prop-erties of proteins (or of nucleic acids)? The native state of a proteinis like an organic crystal. It is fairly rigid, and held together by alarge number of different kinds of “weak” non-covalent interac-tions, including hydrogen bonds (largely electrostatic in character),van der Waals interactions11 and “salt bridges” (electrostaticattractions between ionized amino acid side chains) (Tables 2.2 and2.3). A native protein is “folded.” In the “core” of a folded protein,apolar amino acid side chains interdigitate and are tightly packed,forming rigid and specific contacts. The rigidity of a folded proteinis important to its biological function and, in favorable circum-stances, permits determination of its structure at atomic resolu-tion. This is not to say that a folded protein exhibits no fluctuationsof structure or rotations of bonds. Native protein structure certainlydoes fluctuate, as we know for example by nuclear magnetic reso-nance studies, and such fluctuations can be important in thebinding of small compounds to macromolecules (Chapter 7) and toenzyme function (Chapter 8). But the folded state of a typical pro-tein is nevertheless quite rigid. In contrast, the unfolded state of aprotein is more flexible and fluid-like. Bonds in amino acid sidechains rotate relatively freely in an unfolded protein, and in the
11 Named after the Dutch physicist Johannes Diderik van der Waals (1837–1923).Van der Waals was awarded the Nobel Prize in Physics in 1911.
42 THE FIRST LAW OF THERMODYNAMICS
ideal case all amino acid side chains are completely exposed tosolvent (Table 2.4).
The non-covalent interactions that stabilize folded protein struc-ture (or double-stranded DNA or folded RNA structure) can be“broken” in a number of ways. One is by adding heat. If all the non-covalent bonds break simultaneously, in an all-or-none fashion(“cooperative” unfolding), then there are in essence just two states ofthe protein: the folded state and the unfolded state. The transitionfrom the folded state to the unfolded state is like melting. Soinducing the unfolding of protein by heat or some other means issomething like melting a solid. This is true even if one is workingnot with a mass of freeze-dried protein but with folded proteinsdissolved in aqueous solution. The cooperativity of the transition, theall-or-none character of going from being folded to being unfolded,
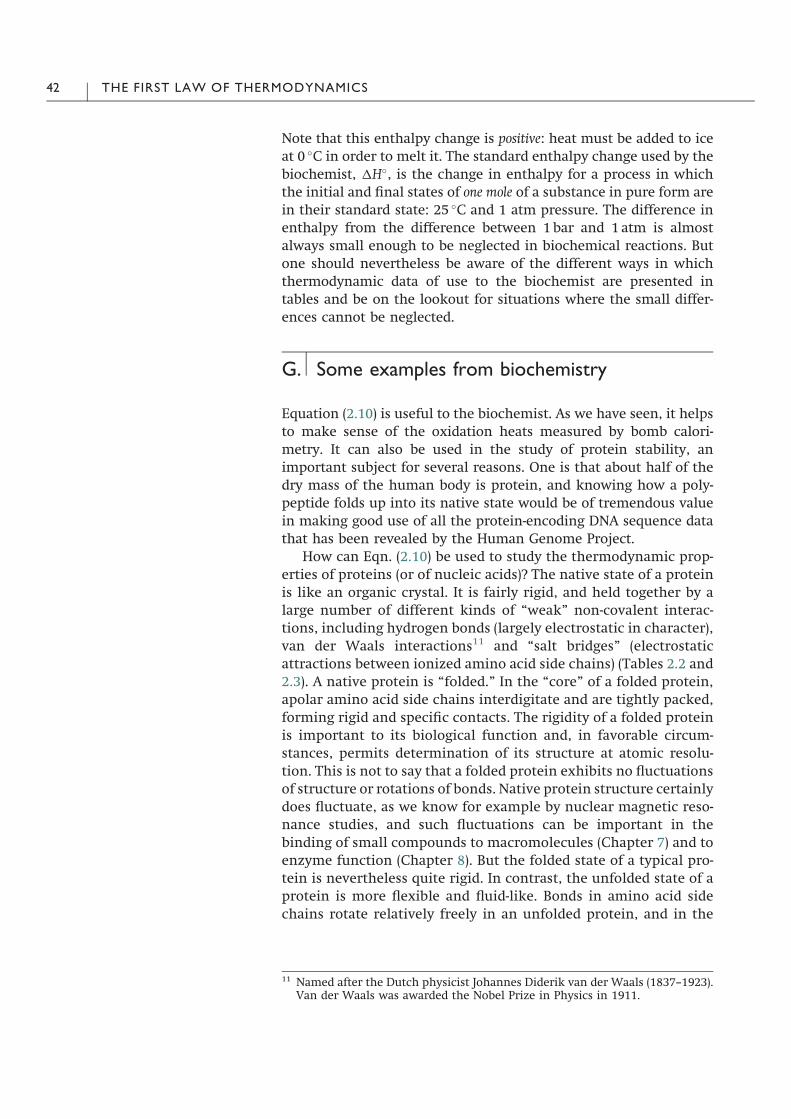
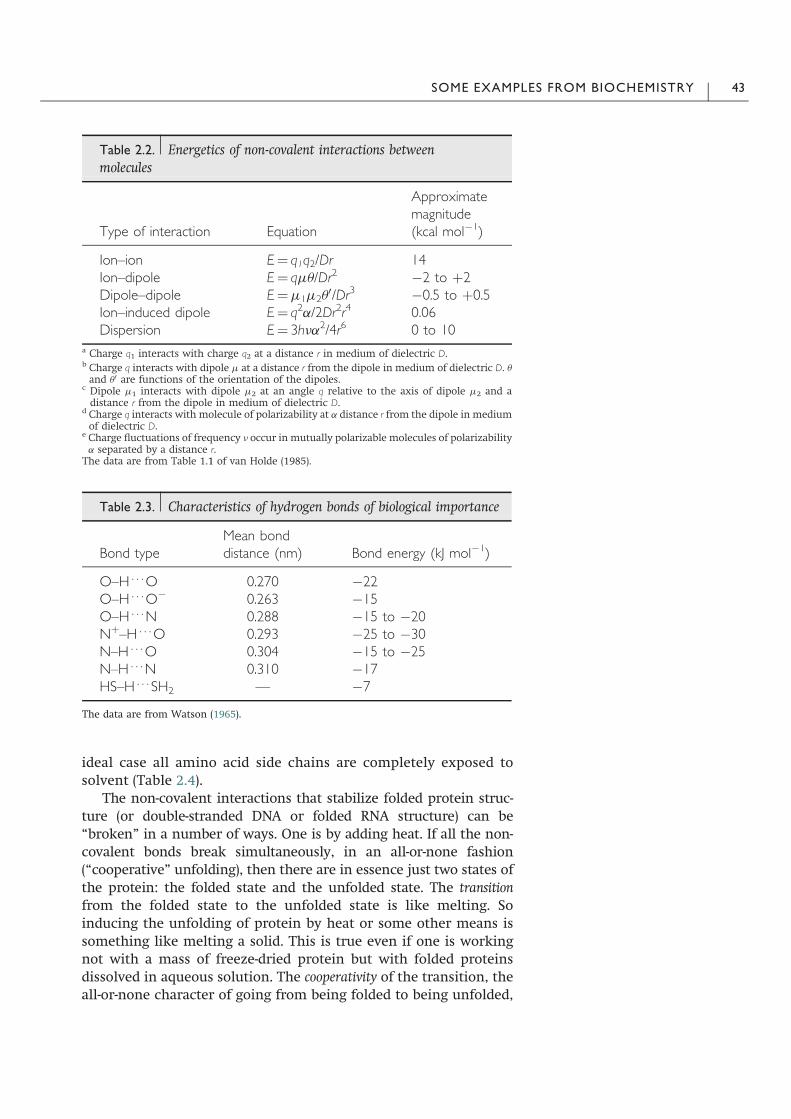
Table 2.3. Characteristics of hydrogen bonds of biological importance
Bond typeMean bonddistance (nm) Bond energy (kJ mol$1)
O–H . . .O 0.270 $22O–H . . .O$ 0.263 $15O–H . . .N 0.288 $15 to $20N#–H . . .O 0.293 $25 to $30N–H . . .O 0.304 $15 to $25N–H . . .N 0.310 $17HS–H . . .SH2 — $7
The data are from Watson (1965).
Table 2.2. Energetics of non-covalent interactions betweenmolecules
Type of interaction Equation
Approximatemagnitude(kcal mol$1)
Ion–ion E" q1q2/Dr 14Ion–dipole E" q„"/Dr2 $2 to #2Dipole–dipole E"„1„2"
0/Dr3 $0.5 to #0.5Ion–induced dipole E" q2fi/2Dr2r4 0.06Dispersion E" 3h”fi2/4r6 0 to 10
a Charge q1 interacts with charge q2 at a distance r in medium of dielectric D.b Charge q interacts with dipole „ at a distance r from the dipole in medium of dielectric D. "and "0 are functions of the orientation of the dipoles.
c Dipole „1 interacts with dipole „2 at an angle q relative to the axis of dipole „2 and adistance r from the dipole in medium of dielectric D.
d Charge q interacts with molecule of polarizability at fi distance r from the dipole in mediumof dielectric D.
e Charge fluctuations of frequency ” occur in mutually polarizable molecules of polarizabilityfi separated by a distance r.
The� data� are� from� Table� 1.1� of� van� Holde� (1985).
SOME EXAMPLES FROM BIOCHEMISTRY 43

results from the concurrent breaking of a large number of weakinteractions. In water, these interactions are hydrogen bonds; inproteins, they are the several kinds mentioned above. The meltingof pure water or any other pure solid is a cooperative phenomenon.That is, melting occurs at a single or over a very narrow range oftemperatures, not over a broad range. The same is true of coop-erative protein unfolding or the melting of DNA.
A number of experimental studies have been carried out tomeasure the energy required to break a hydrogen bond at roomtemperature. This is pertinent not only to the unfolding of proteinsbut also to the “melting” of double-stranded DNA, which is heldtogether by hydrogen bonds. Estimates of the bond energy vary, but areasonable and generally agreed rough figure is 1kcal mol$1. Indi-vidual hydrogen bonds are weak; collections can be quite strong.
In terms of Eqn. (2.10), the enthalpy of the folded state of aprotein is H!
F, the enthalpy of the unfolded state is H!U, and the dif-
ference, H!U $ H!
F, is the enthalpy of denaturation or unfolding, 1Hd!.
In this case the folded state of the protein is the reference state, as theenthalpy of the unfolded state is measured with respect to it. Whatis this enthalpy difference? As discussed above, the enthalpy changefor a process is equal to the heat absorbed by the system at constantpressure, and the rigid folded state of a protein can be pictured as asolid, and the flexible unfolded state as a liquid. So the enthalpydifference between the unfolded and folded states of a protein is theamount of heat needed to unfold the protein. As we shall see, themagnitude of that heat depends on the temperature.
Table 2.4. Principal features of protein structure
Folded (native) stateUnfolded (denatured)state
Highly ordered polypeptidechain
Highly disordered chain– “random coil”
Intact elements of secondarystructure, held together byhydrogen bonds
No secondary structure
Intact tertiary structure contacts,as in an organic crystal, heldtogether by van der Waalsinteractions
No tertiary structure
Limited rotation of bonds in theprotein core
Free rotation of bondsthroughout polypep-tide chain
Desolvated side chains in proteincore
Solvated side chains
Compact volume Greatly expandedvolume
44 THE FIRST LAW OF THERMODYNAMICS

The temperature at which a protein unfolds (or double-strandedDNA melts) is called the melting temperature, Tm. This temperaturedepends not only on the number and type of non-covalent bonds inthe folded state but also on the pH and other solution conditions. Tmalso depends on the pressure, but most biological science experi-ments are done at 1 atm pressure. In the case of proteins, changingthe pH of solution changes the net charge on the protein surface.This can have a marked impact on Tm and 1H!
d, as shown in Fig. 2.7for the example of hen egg white lysozyme, a well-studied smallglobular protein. The figure also illustrates that the slope of 1H!
against Tm for this protein is more or less constant throughout thepH range shown.
Above we saw how a bomb calorimeter can be used to obtainthermodynamic information. Here we introduce isothermal titra-tion calorimetry (ITC)12 and explain how it can be used to measurethe enthalpy of a biochemical process (Fig. 2.8). By Eqn. (2.10) theheat absorbed at constant pressure measures the enthalpy change.Suppose, for example, we are interested in the energetics of thebinding of the Fc portion of immunoglobulin G (IgG), important inhumoral immunity and biotechnology, to soluble protein A, a bac-terial protein. We need not be concerned at the moment just whichpart of IgG the Fc portion of is: we just need to know that antibodymolecules can be dissected into components and that the Fc portionis one of them. The thermodynamic states of interest here are theunbound state, where protein A is free in solution, and the boundstate, where protein A is physically associated with Fc. The heatexchanged at constant pressure upon injection of protein A into acalorimetric cell containing the antibody can thus be used todetermine 1Hb
!, the enthalpy of binding (under standard state con-ditions). The heat of injection will change as the number of vacantbinding sites decreases.
Fig. 2.7 Enthalpy of unfolding of hen
egg white lysozyme as a function of
transition temperature. Filled
symbols: intact lysozyme. Open
symbols: lysozyme in which one of
the four native disulfide bonds has
been removed. When folded, 3-SS
lysozyme closely resembles the
native state of intact lysozyme.
Change in transition temperature
was induced by a change of pH.
Note that 1H is approximately
linear in Tm. The data are from
Cooper et al. (1991).
12 The isothermal titration calorimeter was first described in 1922 by Theophilede Donder, founder of the Brussels School of thermodynamics.
SOME EXAMPLES FROM BIOCHEMISTRY 45
What if we’re interested in the energetics of an enzyme bindingto its substrate? This can be measured if a suitable substrate analogcan be found or the enzyme can be modified. For instance, ITC hasbeen used to measure the enthalpy of binding of a small compoundcalled 20-cytidine monophoshate (20CMP) to ribonuclease A, whichhydrolyzes RNA to its component nucleotides. 20CMP binds to andinhibits the enzyme. If the enzyme of interest is, say, a proteinphosphatase with a nucleophilic cysteine in the active site, muta-tion of the Cys to Ser or Asn will abolish catalytic activity, as in theN-terminal domain of the cytoskeleton-associated protein tensin,and the energetics of binding can be studied. A deeper under-standing of binding will be sought in Chapters 5 and 7.
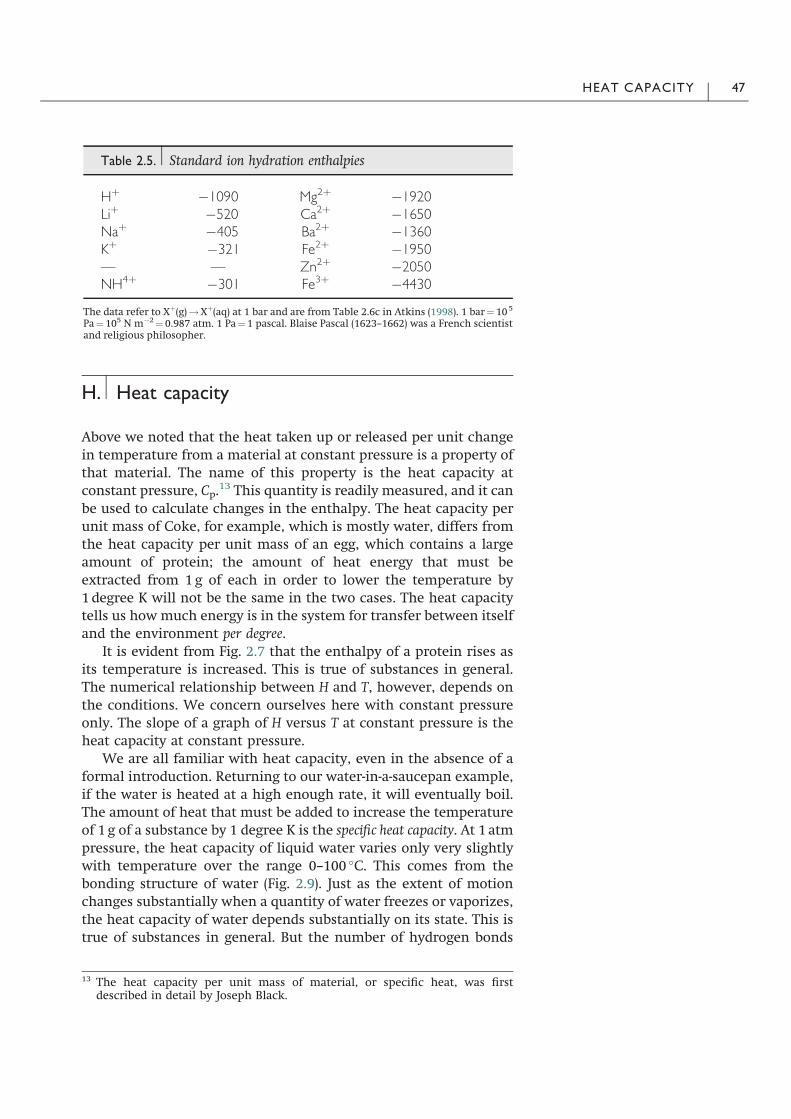
If you’ve spent any time in a biochemistry lab, you may haveexperienced the large heat given off by a salt solution as the saltdissolves. There are several contributions to the effect, but the mainone is the enthalpy of hydration. This is the enthalpy change thatoccurs when an ion in vacuum is dropped into a sea of pure water.Water molecules form what is called a hydration shell around theion, the number depending on the radius of the ion and its charge.Calorimetry can be used to measure the hydration enthalpy of bio-logically important ions. Values are given in Table 2.5. Why is thisimportant? In one example, some of the water molecules hydratingan ion must be stripped away before the ion can pass through aselective ion channel in the plasma membrane, and this requires aninput of energy. Complete dehydration of the ion would require avery large input of energy, so it is easy to imagine that a few watermolecules remain associated with an ion as it passes through a pore.Ion channels that are specific for the passage of certain types of ionare part of the molecular machinery underlying the transmission ofnerve impulses.
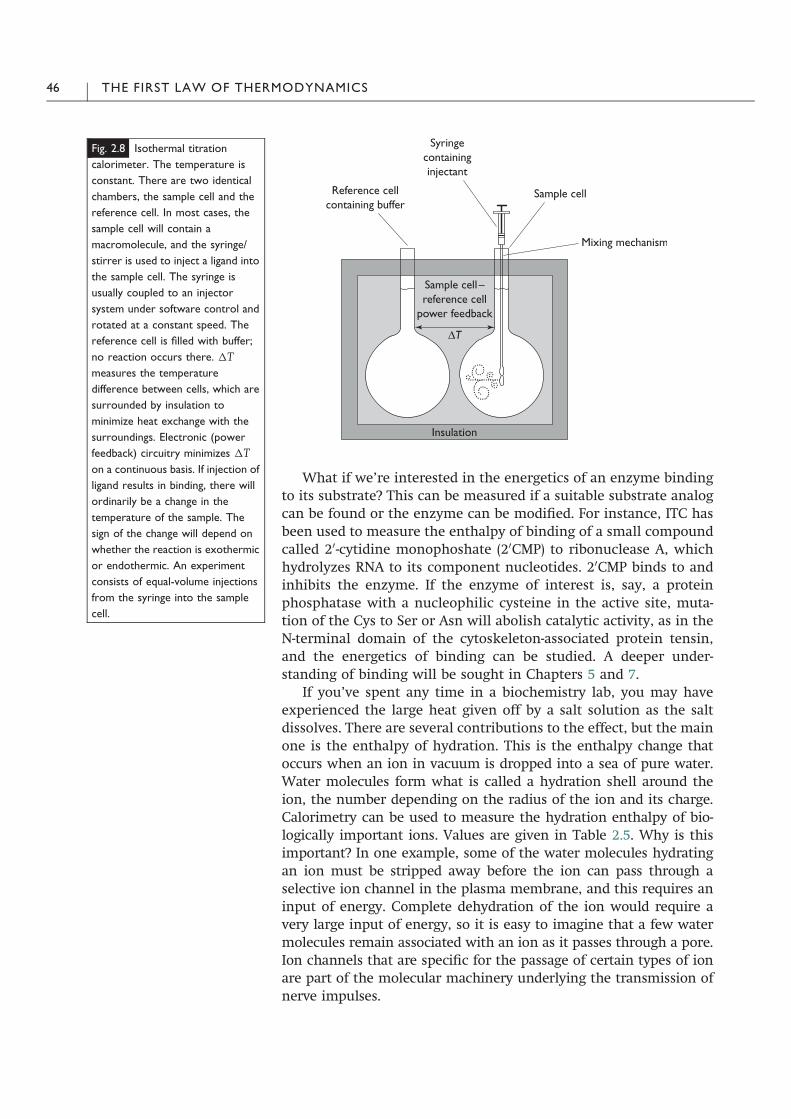
Fig. 2.8 Isothermal titration
calorimeter. The temperature is
constant. There are two identical
chambers, the sample cell and the
reference cell. In most cases, the
sample cell will contain a
macromolecule, and the syringe/
stirrer is used to inject a ligand into
the sample cell. The syringe is
usually coupled to an injector
system under software control and
rotated at a constant speed. The
reference cell is filled with buffer;
no reaction occurs there. 1Tmeasures the temperature
difference between cells, which are
surrounded by insulation to
minimize heat exchange with the
surroundings. Electronic (power
feedback) circuitry minimizes 1Ton a continuous basis. If injection of
ligand results in binding, there will
ordinarily be a change in the
temperature of the sample. The
sign of the change will depend on
whether the reaction is exothermic
or endothermic. An experiment
consists of equal-volume injections
from the syringe into the sample
cell.
46 THE FIRST LAW OF THERMODYNAMICS
H. Heat capacity
Above we noted that the heat taken up or released per unit changein temperature from a material at constant pressure is a property ofthat material. The name of this property is the heat capacity atconstant pressure, Cp.
13 This quantity is readily measured, and it canbe used to calculate changes in the enthalpy. The heat capacity perunit mass of Coke, for example, which is mostly water, differs fromthe heat capacity per unit mass of an egg, which contains a largeamount of protein; the amount of heat energy that must beextracted from 1g of each in order to lower the temperature by1 degree K will not be the same in the two cases. The heat capacitytells us how much energy is in the system for transfer between itselfand the environment per degree.
It is evident from Fig. 2.7 that the enthalpy of a protein rises asits temperature is increased. This is true of substances in general.The numerical relationship between H and T, however, depends onthe conditions. We concern ourselves here with constant pressureonly. The slope of a graph of H versus T at constant pressure is theheat capacity at constant pressure.
We are all familiar with heat capacity, even in the absence of aformal introduction. Returning to our water-in-a-saucepan example,if the water is heated at a high enough rate, it will eventually boil.The amount of heat that must be added to increase the temperatureof 1 g of a substance by 1 degree K is the specific heat capacity. At 1 atmpressure, the heat capacity of liquid water varies only very slightlywith temperature over the range 0–100 !C. This comes from thebonding structure of water (Fig. 2.9). Just as the extent of motionchanges substantially when a quantity of water freezes or vaporizes,the heat capacity of water depends substantially on its state. This istrue of substances in general. But the number of hydrogen bonds
Table 2.5. Standard ion hydration enthalpies
H# $1090 Mg2# $1920Li# $520 Ca2# $1650Na# $405 Ba2# $1360K# $321 Fe2# $1950— — Zn2# $2050NH4# $301 Fe3# $4430
The data refer to X#(g)!X#(aq) at 1 bar and are from Table 2.6c in Atkins (1998). 1 bar" 105
Pa" 105 N m$2" 0.987 atm. 1 Pa" 1 pascal. Blaise Pascal (1623–1662) was a French scientistand religious philosopher.
13 The heat capacity per unit mass of material, or specific heat, was firstdescribed in detail by Joseph Black.
HEAT CAPACITY 47

formed by an individual water molecule is roughly constantthroughout the temperature range 0–100 !C at 1 atm pressure. Aquantity of water vapor can be much hotter than 100 !C, and watervapor must lose a good deal more energy than liquid water to fall intemperature by 1 degree K. This makes steam hazardous for people,but it reduces the time to cook the claw muscle of Chesapeake Bayblue crabs.
With regard to purified proteins in solution, just as the foldedand unfolded states have different enthalpies, they also havedifferent heat capacities. The heat capacity of the folded state is Cp,F,while that of the unfolded state is Cp,U. The heat capacity differencebetween states at constant pressure is Cp,U$Cp,F"1Cp,d. In princi-ple, Cp,F, Cp,U and therefore 1Cp,d are temperature-dependent. Inpractice, however, the variation with temperature can be and oftenis sufficiently small to be ignored. An example of a case where 1Cp,dis only slightly dependent on temperature is shown in Fig. 2.7. That1Cp,d is positive is related to the increase in hydrophobic surfacethat is in contact with the solvent. The side chains of the hydro-phobic core are largely sequestered from the solvent in the foldedstate.
Now we are in a position to write a general expression for theenthalpy of a substance as a function of temperature. It is
H%T2& " H%T1& # Cp%T2 $ T1&; %2:15&
where T1 is the temperature of the system in state 1 and H(T2) is theenthalpy of the system in state 2. Anotherway ofwriting Eqn. (2.15) is
1H " Cp1T; %2:16&
where 1H"H(T2)$H(T1) and 1T" T2$ T1. Note that 1H would havethe samemagnitude but the opposite sign if the labels attached to the
Fig. 2.9 Schematic diagram of the
structure of water under different
conditions: (A)
solid state, (B) melting point, (C)
liquid state, and (D) boiling point.
Oxygen is shown in black, hydrogen
in white. The black bars represent
hydrogen bonds. Hydrogen bonds
are relatively persistent in the solid
state. The number of bonds
decreases at the melting point, as
molecules move out of the lattice. In
the liquid state, hydrogen bonds are
present, but they are formed only
transiently. Boiling water has such a
high thermal energy that persistent
hydrogen bonds are rare. As the
temperature increases, there are
increases in translational, vibrational
and rotational energy. The change in
translational energy is not very
difficult to detect; for example,
when water is brought to the boil
on the stove. Increases in vibrational
and rotational motion of water
cannot be seen with the naked eye.
Based on Fig. 3.3 in Voet and Voet
(1995).
48 THE FIRST LAW OF THERMODYNAMICS

states were reversed; the enthalpy is a state function. From a math-ematical point of view Eqn. (2.16), which can be written Cp"1H/1T,tells us that the constant pressure heat capacity can be obtained froma plot of H versus T in the interval 1T. When Cp is constantthroughout the temperature range,H versus Twill be constant. As wehave said, Cp is effectively constant over small temperature ranges formany materials in the absence of a change of phase. But theunfolding of a protein can be described as a phase change (melting ofa solid), andwe should therefore expect that therewill be a differencein heat capacity between the folded and unfolded states. The corre-sponding expression to Eqn. (2.8) for the enthalpy difference betweenthe unfolded and folded states of a protein is
1H!d%T2& " 1H!
d%T1& #1Cp;d%T2 $ T1&; %2:17&
where the heat capacity change is independent of temperature.Equations (2.15) and (2.17) apply tomany different situations (not justprotein folding/unfolding!) and are known as Kirchhoff’s enthalpylaw, after the German physicist Gustav Robert Kirchhoff (1824–1887).
One way of determining 1Cp,d for protein unfolding is to dena-ture the protein under different conditions. A common method is tomeasure 1H!
d and Tm for different values of pH, as shown in Fig. 2.7.This can be done with a technique called differential scanningcalorimetry (DSC), which measures the heat absorbed as a functionof temperature (Fig. 2.10). The experiment is repeated at a variety ofpH values to generate a curve like that shown in Fig. 2.7. As we shallsee in Chapter 5, the relatively large1Cp,d of protein unfolding has abig impact on how much work must be done to unfold a protein,and how this amount of work depends on temperature.
Box 2.2. A micromachined nanocalorimeter for lifesciences research and diagnostics
Receptors are membrane-embedded protein molecules that recognize and
respond to the body’s own chemical messengers, for example, hormones or
neurotransmitters. In pharmacology, receptor affinity and efficacy together
determine the potency of a drug. Differences in efficacy make a drug an agonist
or antagonist. A drug of sufficient efficacy and affinity for a receptor to affect cell
function is an agonist. A drug that binds the receptor but does not elicit a
response is an antagonist. Pre-clinical screening of agonists and antagonists and
assessment of the toxicity of novel lead compounds is generally done with
specialized cell-based assays. Often, a specific cell line is required. An
understanding of the nature of the molecules and cellular pathways involved is
generally needed to interpret the results of such assays, and therefore a substantial
investment of time and money. Close monitoring of cell temperature could
provide a means of detecting changes in cell metabolism that are not stimulus-
specific, enabling simpler, less expensive and more general cell-based screening
than with specialized cell-based assays. Researchers in the Department of
Electronic and Electrical Engineering at University of Glasgow have developed a
HEAT CAPACITY 49
Box 2.2. Cont.
micromachined nanocalorimeter which functions as a biosensor. A small number
of living cells are present in a sub-nanoliter chamber. The small size of the
chamber could be useful for rapid screening of small samples. The sensor
comprises a 10-junction gold and nickel thermopile on a silicon chip. A thermopile
is a number of thermocouples, 10 in this case, connected end on end, and a
thermocouple is simply a temperature-measuring device consisting of two wires of
different metals fused at each end. A temperature difference between the metals
results in a difference in an electrical potential, which can be calibrated to a
temperature. The nanocalorimeter of the Glasgow group can detect a mere
13 nW of power generated by the cells on exposure to a chemical stimulus, the
temperature resolution is 0.125mK, the heat capacity is 1.2 nJ mK$1, and the
response time is 12ms. Primary cell lines or tissue biopsies can be analyzed.
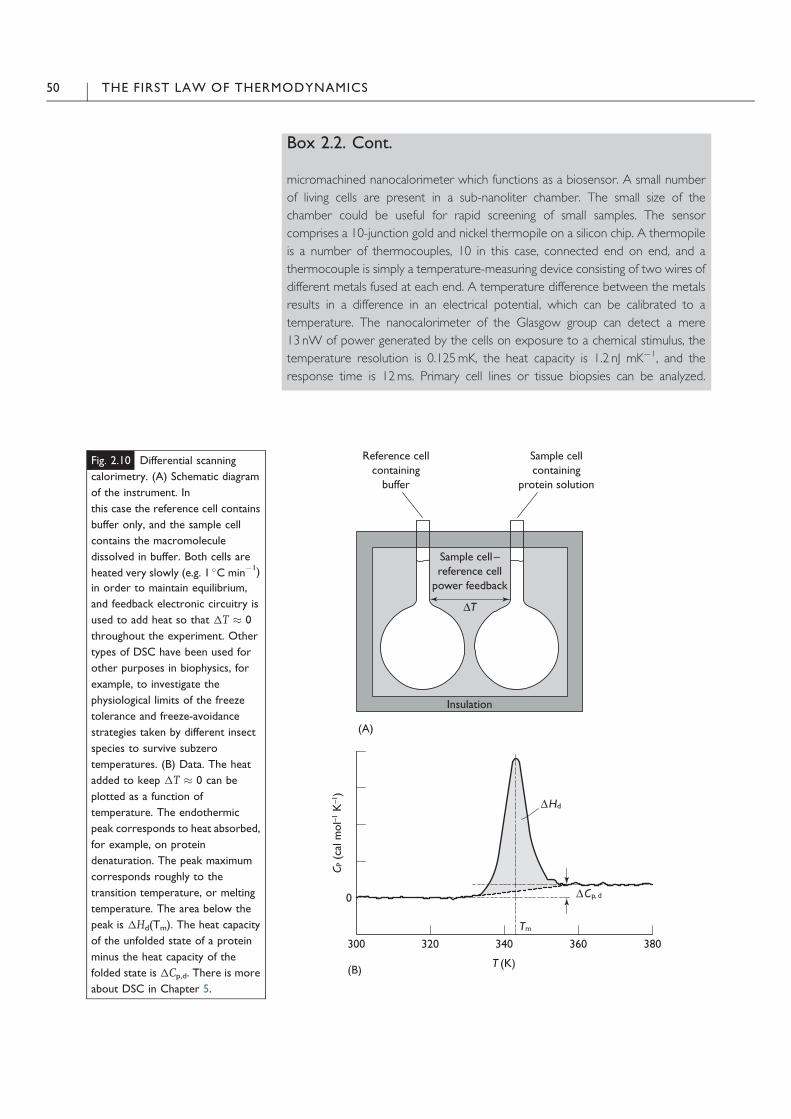
Fig. 2.10 Differential scanning
calorimetry. (A) Schematic diagram
of the instrument. In
this case the reference cell contains
buffer only, and the sample cell
contains the macromolecule
dissolved in buffer. Both cells are
heated very slowly (e.g. 1 !C min$1)
in order to maintain equilibrium,
and feedback electronic circuitry is
used to add heat so that 1T ' 0
throughout the experiment. Other
types of DSC have been used for
other purposes in biophysics, for
example, to investigate the
physiological limits of the freeze
tolerance and freeze-avoidance
strategies taken by different insect
species to survive subzero
temperatures. (B) Data. The heat
added to keep 1T ' 0 can be
plotted as a function of
temperature. The endothermic
peak corresponds to heat absorbed,
for example, on protein
denaturation. The peak maximum
corresponds roughly to the
transition temperature, or melting
temperature. The area below the
peak is 1Hd(Tm). The heat capacity
of the unfolded state of a protein
minus the heat capacity of the
folded state is 1Cp,d. There is more
about DSC in Chapter 5.
50 THE FIRST LAW OF THERMODYNAMICS

I. Energy conservation in the living organism
The First Law tells us that, if a system does work, wmakes a negativecontribution to 1U; the system loses energy. This implies that noteven the most sophisticated known “machine” – the human body,as far as we know – can do work without an energy source. And nomatter how much the urge to eat might conflict with other ways wemight rather spend time, there is no getting around having to eat –relatively often. But this does not necessarily mean that the FirstLaw applies to living organisms.
In Chapter 1 we noted that calorimetry experiments on wholeorganisms were carried out as early as 1781 by Lavoisier andLaplace. They measured the heat given off by animals (and otherobjects) as the amount of water produced by melting ice, relative toa control in which no animal was present. The greater the volume ofwater at the end of the experiment, the greater the amount of heatgiven off during the experiment. Lavoisier and Laplace also collectedand measured the gaseous “waste” from the animals used in theirexperiments. The quantity of heat and carbon dioxide produced by aguinea pig was compared with what was found for the combustionof carbon. Lavoisier later used the data from such experiments toestablish that the combustion of food in animals leads to the pro-duction of heat, CO2, and H2O. About a century later, in 1904, aGerman physiologist named Max Rubner (1854–1932) reported onsimilar experiments with dogs. Rubner’s work was effectively thefinal word on whether thermochemistry applied to physiology. Forhe was able to show that the heat production of a dog can beaccounted for by the carbon and hydrogen balance of its respirationand the heats of combustion of fat, protein, and excrement. And onthat cheerful note, we bring the text of this chapter to a close.
J. References and further reading
Atkins, P.W. (1998). Physical Chemistry, 6th edn, ch. 2. Oxford: OxfordUniversity Press.
Atkinson, D. E. (1977). Cellular Energy Metabolism and Its Regulation. New York:Academic Press.
Bergethon, P. R. (1998). The Physical Basis of Biochemistry: the Foundations ofMolecular Biophysics, ch. 11. New York: Springer-Verlag.
Blandamer, M. J., Cullis, P.M. & Engberts, J. B. F. N. (1995). Differentialscanning and titration calorimetric studies of macromolecules in aqueoussolution. Journal of Thermal Analysis, 45, 599–613.
Burton, R. F. (1998). Biology by Numbers: an Encouragement to QuantitativeThinking, ch. 3.1–3.3. Cambridge: Cambridge University Press.
Cahan, D. (1993). Letters of Hermann von Helmholtz to His Parents: The MedicalEducation of a German Scientist, 1837–1846. Stuttgart: Franz Steiner Verlag.
ENERGY CONSERVATION IN THE LIVING ORGANISM 51

Cahan, D. (2004). An Institute for an Empire: The Physikalish–TechnischeReichsanstalt, 1871–1918. Cambridge: Cambridge University Press.
Christensen, H.N. & Cellarius, R. A. (1972). Introduction to Bioenergetics:Thermodynamics for the Biologist: A Learning Program for Students of the Biologicaland Medical Sciences. Philadelphia: W. B. Saunders.
Cooper, A., Eyles, S. J., Radford, S. E. & Dobson, C.M. (1991). Thermodynamicconsequences of the removal of a disulfide bridge from hen lysozyme.Journal of Molecular Biology, 225, 939–43.
Creighton, T. E. (1993). Proteins: Structure and Molecular Properties, 2nd edn, ch.4.4.3. New York: W.H. Freeman.
Darveau, C.-A., Suarez, R. K., Andrews, R.D. & Hochachka, P.W. (2002).Allometric cascade as a unifying principle of body mass effects onmetabolism. Nature, 417, 166–70.
Dunham, W. (1994). The Mathematical Universe: An Alphabetical Journey through theGreat Proofs, Problems, and Personalities, ch. H. New York: John Wiley & Sons.
Encyclopdia Britannica CD 98, “Drug,” “Enthalpy,” “Heat Capacity,” “Heat ofReaction,” “Heat Transfer,” “Infection,” “Internal Energy,” “KineticTheory of Gases,” “Latent Heat,” “Maxwell–Boltzmann Distribution Law,”“Principles of Thermodynamics,” “Specific Heat,” “Temperature,”“Thermal Energy,” “Thermocouple,” and “Work.”
Feynman, R. P., Leighton, R. B. & Sands, M. (1963). Lectures on Physics, vol. I, cc.14–1, 44–1, 45–1 & 45–2. Reading, Massachusetts: Addison-Wesley.
Fruton, J. S. (1999). Proteins, Enzymes, Genes: the Interplay of Chemistry and Biology.New Haven: Yale University Press.
Ganong, W.F. (1989). Review of Medical Physiology, 13th edn, ch.17. New York:McGraw-Hill/Appleton & Lange.
Gillispie, C. C. (ed.) (1970). Dictionary of Scientific Biography. New York: CharlesScribner.
Gislason, E. A. & Craig, N. C. (1987). General definitions of work and heat inthermodynamic processes, Journal of Chemical Education, 64, 660–8.
Harold, F.M. (1986). The Vital Force: a Study of Bioenergetics, ch. 1. New York:W.H. Freeman.
Haynie, D. T. (1993). The Structural Thermodynamics of Protein Folding, ch. 2.Ph.D. thesis, The Johns Hopkins University.
Haynie, D. T. & Ponting, C. P. (1996). The N-terminal domains of tensin andauxilin are phosphatase homologues. Protein Science, 5, 2543–646.
Hewitt, P. G. (2006) Conceptual Physics, 10th edn. ch. 4, San Francisco: PearsonAddison-Wesley.
Ito, K. & Ito, T. (2005). Nonlinear dynamics of homeothermic temperaturecontrol in skunk cabbage, Symplocarpus foetidus, Physical Review E, 72,051909, 6 pages.
Ito, K., Ito, T., Onda, Y. & Uemura, M. (2004). Temperature-triggeredperiodical thermogenic oscillations in skunk cabbage (Symplocarpusfoetidus); Plant and Cell Physiology, 45, 257–64.
Johannessen, E. A., Weaver, J.M. R., Bourova, L., Svoboda, P., Cobbold, P. H. &Cooper, J.M. (2002). Micromachined nanocalorimetric sensor for ultra-lowvolume cell based assays. Analytical Chemistry, 74, 2190–7.
Jones, C.W. (1976). Biological Energy Conservation. London: Chapman & Hall.Katchalsky, A. & Curran, P. F. (1967). Nonequilibrium Thermodynamics inBiophysics, ch. 1. Cambridge, Massachusetts: Harvard University Press.
Klotz, I.M. (1986). Introduction to Biomolecular Energetics, ch. 1. Orlando:Academic Press.
52 THE FIRST LAW OF THERMODYNAMICS

Kondepudi, D. & Prigogine, I. (1998).Modern Thermodynamics: from Heat Enginesto Dissipative Structures, ch. 2. Chichester: John Wiley.
Lawrence, C., Roger, A. & Compton, R. (1996). Foundations of Physical Chemistry.Oxford: Oxford University Press.
Lazarides, T., Archontis, G. & Karplus, M. (1995). Enthalpic contribution toprotein stability: insights from atom-based calculations and statisticalmechanics. Advances in Protein Chemistry, 47, 231–306.
McNab, B. K. (2003). Metabolism: ecology shapes bird bioenergetics. Nature,426, 620–1.
Morowitz, H. J. (1978). Foundations of Bioenergetics, ch. 3. New York: Academic.Microsoft Encarta 96 Encyclopedia, “Thermodynamics.”Pearson, H. (2004). Low-carb diets get thermodynamic defence. Nature News,16 August.
Peusner, L. (1974). Concepts in Bioenergetics, ch. 2. Englewood Cliffs: Prentice-Hall.
Polanyi, M. (1946). Science, Faith and Society, ch. 1. Chicago: University ofChicago Press.
Price, G. (1998). Thermodynamics of Chemical Processes, cc. 1 & 2. Oxford: OxfordUniversity Press.
Roberts, T. J., Marsh, R. L., Weyland, P. G. & Taylor, C. R. (1997). Muscularforce in running turkeys: the economy of minimizing work, Science, 275,1113–15.
Schneck, D. J. (2006a). What is this thing called “me”? Part 4: The buffered,isothermal, living engine. American Laboratory News, January, 4–8.
Schneck, D. J. (2006b). What is this thing called “me”? Part 5 : The stationary,buffered, isothermal living engine. American Laboratory, May, 4–10.
Schneck D. J. (2006c). What is this thing called “me”? Part 6: The controlled,stationary, buffered, isothermal living engine. American Laboratory,November/December, 6–12.
Smith, C. A. & Wood, E. J. (1991). Energy in Biological Systems, cc. 1.2 & 1.3.London: Chapman & Hall.
Treptow, R. S. (1995). Bond energies and enthalpies: an often neglecteddifference. Journal of Chemical Education, 72, 497–9.
van Holde, K. E. (1985). Physical Biochemistry, 2nd edn, ch. 1.1. EnglewoodCliffs: Prentice-Hall.
Voet, D. & Voet, J. G. (1995). Biochemistry, 2nd edn, cc. 2-2, 3, 4, 11-2, 15-4–15-6, 16, 18-1, 19-1, 28-3 & 34-4B. New York: Wiley.
Watson, J. D. (1965). The Molecular Biology of the Gene. New York: Benjamin.Westerterp, K. R. (2001). Pattern and intensity of physical activity. Nature,410, 539.
Williams, T. I. (ed.) (1969). A Biographical Dictionary of Scientists. London: Adam& Charles Black.
Zachariassen, K.E. (1985). Physiology of cold tolerance in insects. PhysiologicalReview, 65, 799–832.
K. Exercises
1. Invent three syllogisms. See Aristotle’s Topics for ways of makinguse of syllogisms in formulating arguments.
EXERCISES 53
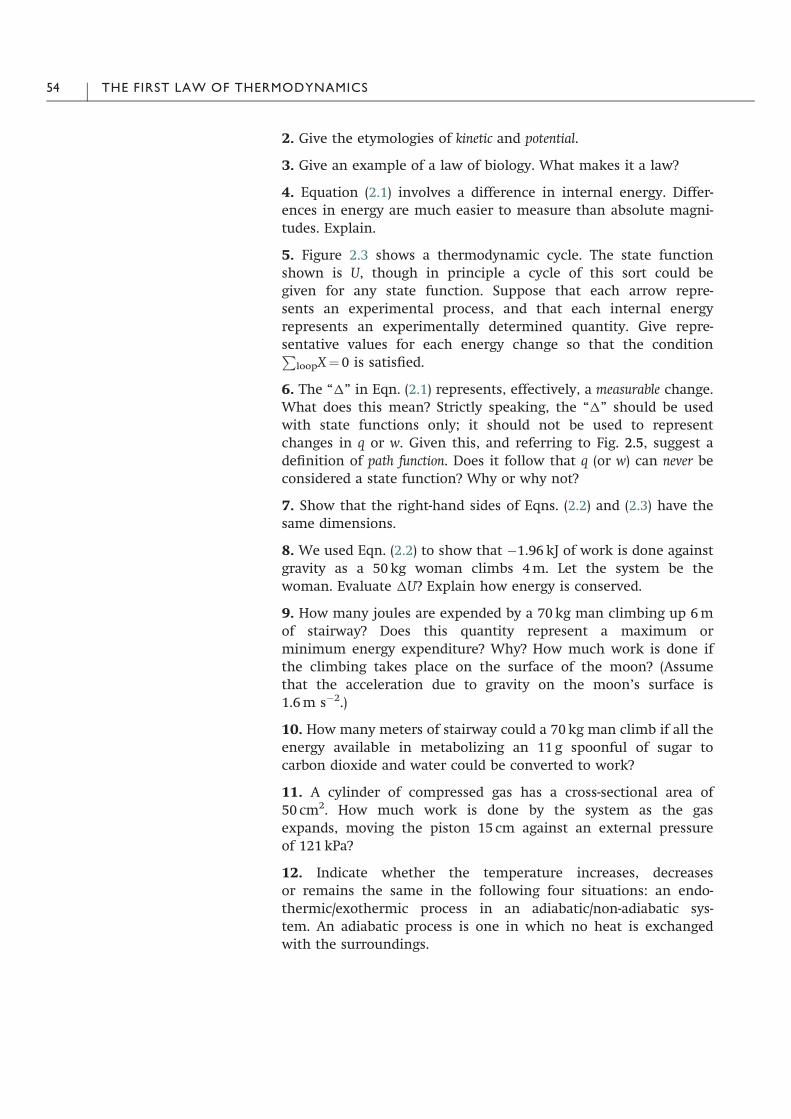
2. Give the etymologies of kinetic and potential.
3. Give an example of a law of biology. What makes it a law?
4. Equation (2.1) involves a difference in internal energy. Differ-ences in energy are much easier to measure than absolute magni-tudes. Explain.
5. Figure 2.3 shows a thermodynamic cycle. The state functionshown is U, though in principle a cycle of this sort could begiven for any state function. Suppose that each arrow repre-sents an experimental process, and that each internal energyrepresents an experimentally determined quantity. Give repre-sentative values for each energy change so that the conditionP
loopX"0 is satisfied.
6. The “1” in Eqn. (2.1) represents, effectively, a measurable change.What does this mean? Strictly speaking, the “1” should be usedwith state functions only; it should not be used to representchanges� in� q� or� w.� Given� this,� and� referring� to� Fig.� 2.5,� suggest� adefinition of path function. Does it follow that q (or w) can never beconsidered a state function? Why or why not?
7. Show that the right-hand sides of Eqns. (2.2) and (2.3) have thesame dimensions.
8. We used Eqn. (2.2) to show that $1.96kJ of work is done againstgravity as a 50kg woman climbs 4m. Let the system be thewoman. Evaluate 1U? Explain how energy is conserved.
9. How many joules are expended by a 70kg man climbing up 6mof stairway? Does this quantity represent a maximum orminimum energy expenditure? Why? How much work is done ifthe climbing takes place on the surface of the moon? (Assumethat the acceleration due to gravity on the moon’s surface is1.6m s$2.)
10. How many meters of stairway could a 70kg man climb if all theenergy available in metabolizing an 11 g spoonful of sugar tocarbon dioxide and water could be converted to work?
11. A cylinder of compressed gas has a cross-sectional area of50 cm2. How much work is done by the system as the gasexpands, moving the piston 15 cm against an external pressureof 121kPa?
12. Indicate whether the temperature increases, decreasesor remains the same in the following four situations: an endo-thermic/exothermic process in an adiabatic/non-adiabatic sys-tem. An adiabatic process is one in which no heat is exchangedwith the surroundings.
54 THE FIRST LAW OF THERMODYNAMICS

13. A mathematical statement of the First Law of Thermodynamicsis 1U" q#w. This holds for all processes. Assume that the onlytype of work done is pV-work. Show that 1U"#w for an adia-batic process. Show that 1U"0 for a process in an isolated sys-tem. Show that 1U" q for a process that occurs at constantvolume. Show that 1H"0 for an adiabatic process at constantpressure.
14. When glucose is burned completely to carbon dioxide andwater,
C6H12O6 # 6O2 ! 6CO2 # 6H2O;
673kcal are given off per mole of glucose oxidized at 25 !C.What is 1U at this temperature? Why? What is 1H at thistemperature? Why? Suppose that glucose is fed to a culture ofbacteria, and 400kcal mol$1 of glucose is given off while thegrowing bacteria converted the glucose to CO2 and H2O. Whythere is a discrepancy between the oxidation heats?
15. Conservation of energy is said to be implicit in the symmetricalrelation of the laws of physics to time. Explain.
16. A person weighing 60 kg drinks 0.25 kg of water. The latter has atemperature of 62 !C. Assume that body tissues have a specificheat capacity of 0.8 kcal kg$1 K$1. The specific heat of water is1.0 kcal kg$1 K$1. By how many degrees will the hot drink raisethe person’s body temperature from 37 !C? Explain how arrivingat the answer involves the First Law of Thermodynamics.
17. Prove that Eqn. (2.14) follows from Eqn. (2.13).
18. Non-polar moieties in proteins make a positive contribution to1Cp,d. This is known from measurements of the change in heatcapacity of water on dissolution of non-polar compounds, e.g.cyclohexane. Is this true for polar moieties as well? What is thesign of their contribution to 1Cp,d? Explain your reasoning.
19. Early protein microcalorimetry studies were done by Peter Pri-valov, a Soviet biophysicist who emigrated to the United Statesin the early 1990s. One of the most thorough of all micro-calorimetric studies of a protein is Privalov and Pfeil’s work onhen egg white lysozyme, published in 1976. According to thiswork and later studies, 1Cp,d"1.5 kcal mol$1 K$1, and at pH4.75, 1Hd(25 !C)"52 kcal mol$1. Calculate the enthalpy differ-ence between the unfolded and folded states of lysozyme at (a)78 !C, the transition temperature, and (b) $10 !C. What is thephysical meaning of 1H in part (b)?
20. You have been asked to investigate the thermodynamic prop-erties of a newly identified small globular protein by differentialscanning calorimetry. The following results were obtained.
EXERCISES 55

Plot 1Hd(Tm) v. Tm. Describe the curve and rationalize its shape.Now plot 1Hd(Tm) v. pH. What is happening?
21. ITC can be used to measure the enthalpy of protonation ofamino acid side chains. Suppose three peptides were separatelydissolved in weak phosphate buffer at pH 8 and injected intoweak phosphate buffer at pH 2.5. There is a change in side chainionization in going from one pH to the other. The peptides andthe measured heats of reaction were Gly–Asp–Gly ($7.2 ± 0.8mcal),Gly–Glu–Gly ($5.4 ± 0.8mcal) and Gly–His–Gly ($5.5 ± 1.0mcal).The data represent an average of 10 experimental data points,heat of injection minus background signal (injection of thepH 8 buffer into the pH 2 buffer in the absence of peptide).Gly" glycine, Asp" aspartate, Glu" glutamate, His"histidine.The peptide concentrations for the experiments were 0.64mM,0.57mM and 0.080mM, respectively. At pH 8, the side chainsare approximately completely deprotonated, while at pH 2 theyare approximately completely protonated. These solutions wereinjected into a sample cell in 10ml aliquots. What is the phy-sical basis of the background signal? What are the approximateprotonation enthalpies of the Asp, Glu and His side chains?Suggest why tripeptides were used for these experiments ratherthan free amino acids. Would pentapeptides be any better?What could be done to account for the possible contribution ofthe terminal amino or carboxyl group?
22. Table C in Appendix C gives enthalpies of protonation for anumber of popular biochemical buffers. Which five of these arelikely to be best for thermodynamic measurements? Why?
23. The conditions of the standard state are chosen arbitrarily. Whatadditional condition(s) might a biochemist add to those given inthe text? Why?
pH Tm (!C) 1Hd(Tm) (kJ mol$1)
2.0 68.9 2382.5 76.1 2593.0 83.2 2793.5 89.4 2974.0 92.0 3054.5 92.9 3075.0 93.2 3085.5 91.3 3036.0 88.9 2966.5 85.9 2877.0 82.0 2767.5 79.4 2688.0 77.8 264
56 THE FIRST LAW OF THERMODYNAMICS

24. Explain in structural and thermodynamic terms how theunfolding of a protein is like the melting of an organic crystal.
25. A protein called a-lactalbumin is a close homolog of hen eggwhite lysozyme. Unlike lysozyme, a-lactalbumin binds Ca2#
with high affinity. The measured enthalpy of binding, however,is much smaller in magnitude than the enthalpy of hydration.Explain.
26. Design a series of experiments to test whether the First Law ofThermodynamics applies to all living organisms.
27. Figure 2.7 shows that the enthalpy change on protein folding islarge and positive. Suggest what gives rise to this.
28. Matter can neither be created nor destroyed, merely inter-converted between forms. Discuss the statement in terms of theFirst Law of Thermodynamics.
29. Living organisms excrete the excess nitrogen from the meta-bolism of amino acids in one of the following ways: ammonia,urea, or uric acid. Urea is synthesized in the liver by enzymes ofthe urea cycle, excreted into the bloodstream, and accumulatedby the kidneys for excretion in urine. The urea cycle – the firstknown metabolic cycle – was elucidated in outline by HansKrebs and Kurt Henseleit in 1932. As we shall see in Chapter 5,urea is a strong chemical denaturant that is used to study thestructural stability of proteins. Solid urea combusts to liquidwater and gaseous carbon dioxide and nitrogen according to thefollowing reaction scheme:
CO%NH2&2%8&%s& # 1:5O2%g& ! CO2%g& # N2%g& # 2H2O%l&:
According to bomb calorimetry measurements, at 25 !C thisreaction results in the release of 152.3 kcal mol$1. Calculate 1Hfor this reaction.
30. Giant sequoias, an indigenous species of California, are amongthe tallest trees on Earth. Some individuals live to be 3500 yearsold. Water entering at the roots must be transported up some300m of xylem in order to nourish cells at the top of the tree.Calculate the work done against gravity in transporting a singlewater molecule this distance.
31. Suggest three proofs that heat is not a fluid is the sense thatliquid water is a fluid.
EXERCISES 57

Chapter 3
The Second Law ofThermodynamics
A. Introduction
We have seen that a given amount of energy can be distributed inmany different ways – something like how a certain volume of fluidcan adopt many different shapes and adapt itself to its container. Inthis chapter we turn the spotlight on a thermodynamic function thatenables us tomeasurehow “widely” a quantity of energy is distributed.
The First Law of Thermodynamics relates heat, work and internalenergy, and it tells us that energy is neither created nor destroyed in allits changes of form; the total energy of a reaction, and indeed of theuniverse, is constant. The First Law tells uswith breathtaking generalitythat a boundary on thepossible is a basic characteristic of our universe.It is not hard to see, though, that the First Law does not tell us somethings we would like to know. For instance, if we put a “hot” systeminto contact with a “cold” one and allow them to come to thermalequilibrium, we find that the final temperature of the two objects,which will persist indefinitely if the combined system is isolated, is atsome intermediate value. The value of 1U for this reaction, however,which obviously proceeds spontaneously, is 0. Similarly, if we add a“concentrated” solution of substance A to a “dilute” solution of sub-stance A, we find that the final concentration of the combined system,which will persist indefinitely if the system is isolated, is between theinitial concentrations (Fig. 3.1). Again, 1U"0, this time for sponta-neous mixing. We see a similarity in behavior between heat energyandmatter, and there is a correlation between1U"0 and spontaneityof reaction. Wait a minute. Won’t 1U"0 for a system that undergoesno change at all? In general the magnitude or sign of 1U does notindicate the direction of spontaneous change!
Could we get our two objects in thermal equilibrium to returnfrom being two warm objects to one that’s hot and one that’s cold?Could we get the solution at the intermediate concentration tospontaneously unmix and return to the concentrated solution andthe dilute one? No! At least not spontaneously. For in both cases
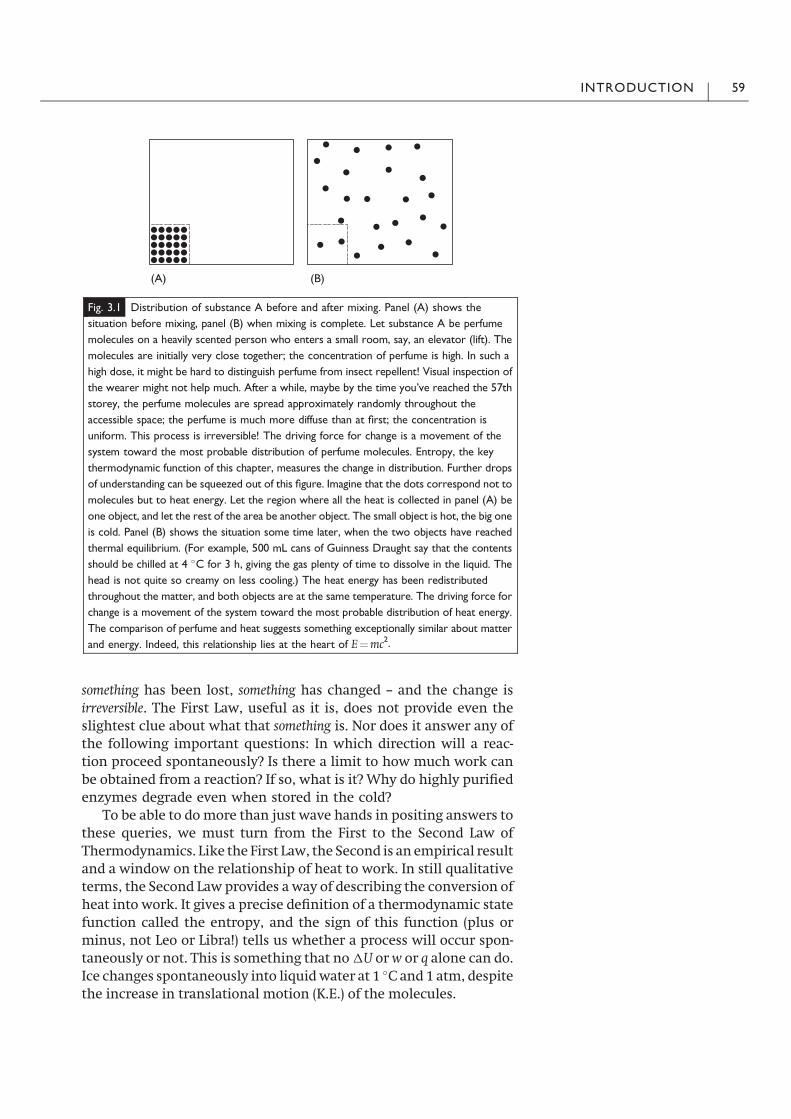
something has been lost, something has changed – and the change isirreversible. The First Law, useful as it is, does not provide even theslightest clue about what that something is. Nor does it answer any ofthe following important questions: In which direction will a reac-tion proceed spontaneously? Is there a limit to how much work canbe obtained from a reaction? If so, what is it? Why do highly purifiedenzymes degrade even when stored in the cold?
To be able to domore than just wave hands in positing answers tothese queries, we must turn from the First to the Second Law ofThermodynamics. Like the First Law, the Second is an empirical resultand a window on the relationship of heat to work. In still qualitativeterms, the Second Law provides a way of describing the conversion ofheat into work. It gives a precise definition of a thermodynamic statefunction called the entropy, and the sign of this function (plus orminus, not Leo or Libra!) tells us whether a process will occur spon-taneously or not. This is something that no1U or w or q alone can do.Ice changes spontaneously into liquidwater at 1 !C and 1 atm, despitethe increase in translational motion (K.E.) of the molecules.
Fig. 3.1 Distribution of substance A before and after mixing. Panel (A) shows the
situation before mixing, panel (B) when mixing is complete. Let substance A be perfume
molecules on a heavily scented person who enters a small room, say, an elevator (lift). The
molecules are initially very close together; the concentration of perfume is high. In such a
high dose, it might be hard to distinguish perfume from insect repellent! Visual inspection of
the wearer might not help much. After a while, maybe by the time you’ve reached the 57th
storey, the perfume molecules are spread approximately randomly throughout the
accessible space; the perfume is much more diffuse than at first; the concentration is
uniform. This process is irreversible! The driving force for change is a movement of the
system toward the most probable distribution of perfume molecules. Entropy, the key
thermodynamic function of this chapter, measures the change in distribution. Further drops
of understanding can be squeezed out of this figure. Imagine that the dots correspond not to
molecules but to heat energy. Let the region where all the heat is collected in panel (A) be
one object, and let the rest of the area be another object. The small object is hot, the big one
is cold. Panel (B) shows the situation some time later, when the two objects have reached
thermal equilibrium. (For example, 500 mL cans of Guinness Draught say that the contents
should be chilled at 4 !C for 3 h, giving the gas plenty of time to dissolve in the liquid. The
head is not quite so creamy on less cooling.) The heat energy has been redistributed
throughout the matter, and both objects are at the same temperature. The driving force for
change is a movement of the system toward the most probable distribution of heat energy.
The comparison of perfume and heat suggests something exceptionally similar about matter
and energy. Indeed, this relationship lies at the heart of E"mc2.
INTRODUCTION 59

Our approach in this chapter is mainly that of “classical” thermo-dynamics. Butwe shouldbe careful not to prejudge thediscussion andthink that its agemakes it somehowless illuminatingoruseful. Peoplewho think that way are all too common, and few of them are good atthermodynamics. In learning a foreign language, one starts withrelatively simple prose and not with poetry of the highest art! More-over, this chapter is not an end in itself: it is a piece of the foundationfor what comes next. In Chapters 4 and 5 we’ll see the role played bythe entropy in the Gibbs free energy, the biochemist’s favorite ther-modynamic function. And in Chapter 6 we’ll turn our attention tostatistical thermodynamics, and that will enable us to see how thestatistical behavior of particles underlies the classical concept ofentropy and other thermodynamic functions we’ll have met by then.
We’re all familiar with becoming aware of the cologne, after-shave, frou-frou juice, what-have-you someone nearby is wearing, ormaybe the malodorous molecules underarm bacteria are pumpinginto the environment. The particles waft along an air current to theolfactory apparatus, gain entry, bind to receptors embedded in cellmembranes, and thereby cause signals to be induced in brain-boundneurons. In some cases, for instance, when you walk by someonewho is wearing a scent, it’s your motion relative to that person thatexplains the phenomenon. But the relative motion of one person’sneck to another’s nose is not the essential ingredient of the presentpoint. For on entering a room in which a heavily scented person hasbeen present for a short while, you can smell the perfume imme-diately, even if that person’s no longer present. What in the MilkyWay does this have to do with thermodynamics?
The sweet-smelling volatile molecules in perfume may consistof various organic chemical components such as aromatic alde-hydes. When heated by the body to 37 oC and exposed to theatmosphere, these molecules quickly become airborne. Then con-vection currents resulting from differences of temperature inpatches of air play a role in spreading the cologne about. Finally,and most important here, the aromatic amines are bombardedconstantly by the random motion of gaseous nitrogen and oxygen,and this moves them around a good deal – even in the absence ofconvection currents – by a process called diffusion. After some time,the concentration of perfume molecules will be approximatelyuniform throughout the room. Amazing! And no machine wasrequired to achieve this end. Experience tells us that such behavioris the only thing that will happen (as long as there is no open win-dow or something like that). That is, leaving a perfume-filled roomand returning to find that all the aromatic aldehydes had, like someArabian genie, somehow gone back into the bottle, seems extremelyhighly improbable. It is extremely highly improbable! As we shallsee, diffusion is “governed” by the Second Law of Thermodynamics.
The Second Law is about the tendency of particles to go from beingconcentrated to being spread out in space – spontaneously. It is alsoabout the tendency of energy to go frombeing “concentrated” to being
60 THE SECOND LAW OF THERMODYNAMICS

“spread out” – spontaneously. Consider amass in a gravitational field,for example, a football that has been kicked high above the pitch.Thedriving force for changeof the airborneball ismotion towards themost probable state, the state of lowest potential energy, the state oflowest energy of position. In this example, the state of lowest potentialenergy is just the ball at rest somewhere on the football field. Thetendency of concentrated particles to become more uniformly dis-persed is a reflection of the tendency of (chemical) energy to disperseitself into its most probable distribution, the state of lowest potentialenergy.We see this tendency in actionon adding some cold cream to acup of tea or coffee. Initially, the cream is seen to form distinct swirls,but before long the color and temperature of the liquid becomemoreuniform. The Second Law, which helps to describe this process, ismarvelously general: it applies not just to the mixing of cream andcoffee but also (and equally well) to the spontaneous dissipationof aromatic aldehyde molecules from an open scent bottle, thespontaneous cooling of a hot saucepanwhen removed from the stove,the spontaneous folding of a polypeptide into a protein, the sponta-neous movement of ions down their concentration gradient when amembrane channel opens.
Some students find the Second Law hard to grasp. One reason isthat there are numerous formulations of the Law, and it’s not alwaysreadily apparent that they are equivalent. It can be instructive tolook at matter through the lenses of different observers, so to speak,as each sheds new light on the topic and helps to understand it in adifferent way. One of the earliest formulations of the Second Lawfrom the historical point of view is of particular interest herebecause it helps to reveal the practical nature of the human activityout of which the science of thermodynamics developed. It is impos-sible for a system to turn a given amount of heat into an equivalentamount of work. In other words, if we put some quantity of heat qinto the system, whatever work w is done by the system will be suchthat w< q. This comes to us from the work of the visionary Frenchmilitary engineer Nicolas Leonard Sadi Carnot (1796–1832). Pub-lication of Carnot’s Reflexions sur la puissance motrice du feu et es machinespropre a developper cette puissance1 (at the age of 28!) outlined a theoryof the steam engine and inaugurated the science of thermodynamics.We shall encounter M. Carnot again shortly, but in a differentchamber of the mansion of biological thermodynamics.
B. Entropy
The foregoing discussion brings us to the thermodynamic statefunction S, entropy (Greek, en, in# trope, transforming; also coinedby Clausius). Being a state function, the entropy change for aprocess is independent of path, regardless of whether the change is
1 Report on the driving force of heat and the proper machines to develop this power.
ENTROPY 61

reversible or irreversible. The entropy is an index of the tendency ofa system to undergo spontaneous change; it is a measure of the stateof differentiation or distribution of the energy of the system. Theentropy is the key to understanding energy transformation. As such,the entropy enables us to rationalize why solutes diffuse from aconcentrated solution to a dilute one without exception, why smokeleaves a burning log and never returns, why wind-up clocks alwaysrun down, why magnets demagnetize spontaneously, why heatalways flows from a hot body to a cold one. All this might suggestthat entropy is something physical, as indeed many people havebelieved. It is important to realize, however, that entropy is not somuch a “thing” as a highly useful mathematical object that providesinsight to the nature of change in the material world.
As we have said, the entropy is a measure of the order of a system.For now, let a non-technical definition of order suffice; in Chapter 6,a more precise definition will be given. Entropy is less a “thing”than a way of describing how particles are arranged in space (e.g.perfume in the bottle or distributed throughout the room) and howparticle arrangement changes as a system is subjected to changes oftemperature, pressure, number of particles, volume, etc. The ten-dency toward a condition of no further change that we have seen inthe examples above is a general property of thermodynamic sys-tems. In fact, it is so fundamental to all of physics that most sci-entists consider the Second Law of Thermodynamics the mostuniversal “governor” of natural activity that has ever been revealedby scientific study. Entropy measures how close a system is to thestate corresponding to no further change, or equilibrium.
Let’s avoid drifting into the ethereal world of abstractions and comeback to Earthwith another illustration, one that is closely related to thephenomenon of diffusion. Suppose we have two glass bulbs of equalvolume connected by a stopcock, as shown in Fig. 3.2. Initially, thestopcock is closed. A gas occupies one bulb only; the other is evacuated.When the stopcock is opened, the gas molecules stampede into theevacuatedbulb.There is anetflowofmolecules intothe formerlyemptybulb until the concentration of molecules is identical (on the average)throughout the accessible volume. Such expansion of a gas is accom-panied by an irreversible increase in entropy. The process is irreversiblebecause a substantial amountofworkwouldhave tobedone toherd allthe gas molecules back into one bulb. The state in which all themolecules are distributed at random throughout the volume of thetwo bulbs – state 2 at equilibrium – is less ordered than the state inwhich all the molecules were randomly distributed throughout thevolume of one bulb – state 1 at equilibrium. In this context, equilibriumjust means a state of no further (net) change. Similarly, perfume ismore ordered when it’s still in the bottle thanwhen it’s been applied,volatilized by strenuous activity and increased body temperature, andscattered to the four corners of a room.
In Fig. 2.4C we saw how heat can be used to make a rubber bandcontract and lift a weight, to do work. Now let’s see what insights
62 THE SECOND LAW OF THERMODYNAMICS

can be gained by shrinking in size by several orders of magnitudeand examining the mechanics of our rubber band machine. Rubberconsists of long, chainlike molecules (Fig. 3.3). Stretching makesthem align and become more orderly, decreasing the number ofdifferent spatial arrangements. Like forcing all the gas moleculesback into one bulb, stretching a rubber band requires work to bedone on the system, so w>0. Your fingers, hands and arms togetherdo the stretching; the energy comes from the cleavage of chemicalbonds in your muscles. The contracting muscle is then used tostretch the rubber beyond its relaxed, equilibrium position, andthere is a change in mechanical energy.
Box 3.1. The celebrated jumping insect of Cantabrigiensis
Insecta is the largest class of the phylum Arthropoda, which is itself the largest of
the various phyla of the kingdom Animalia. Of all the animal species so far
described by science, five of every six are insects. Beasts like bedbugs, beetles, and
butterflies are a few of the more familiar members of the class. About 106
different insect species are known in total, and it is estimated that about as many
more have yet to be described. Insects are poikilotherms: body temperature
follows that of the surrounding environment within the range of tolerance for a
species. Most of our knowledge of genetics has come not from humans but from
experimental studies on the insect Drosophila melanogaster, one of about 103
different species of vinegar fly (more commonly but also misleadingly called fruit
flies). Insects have jointed legs, and a segmented body covered by a hard
exoskeleton (external skeleton) which is composed in part of the protein chitin.
The exoskeleton serves as the point of attachment for muscles, which consist
Fig. 3.3 Schematic diagram of a rubber band in the unstretched (equilibrium) state (left)
and stretched state (right). In the unstretched state, the molecules are highly disordered.
When the band is stretched, the molecules form a relatively orderly array. The entropy of
the molecules is lower in the stretched state than in the unstretched state.
Fig. 3.2 Irreversible expansion of a
gas. In panel (A), when the stopcock
is closed, the gas is concentrated and
confined to the left bulb. The right
bulb is evacuated. When the
stopcock is opened, as shown in
panel (B), the gas flows rapidly from
the bulb on the left to the bulb on
the right. After a sufficiently long
time, the condition known as
equilibrium is reached; the
concentration of gas is the same in
both bulbs and the net flow of
molecules between the bulbs is zero.
This is just a more idealized view of
the heavily scented person we met in
the elevator.
ENTROPY 63

Box 3.1. Cont.
largely of the proteins actin and myosin. Locomotion is effected by muscles acting
on the exoskeleton. In leaping insects (fleas, grasshoppers, locusts and the like) the
force of muscle contraction compresses a “pad” of resilin. This protein is a
member of a family of elastic proteins that includes elastin, gluten and spider silks.
Resilin is also found in the sound-producing organs of cicadas. This long-chain
molecule consists of many copies of a short elastic repeat sequence of amino acid
residues joined in tandem. Chains are crosslinked between tyrosine residues,
providing low stiffness, high strain, efficient energy storage, and a very high fatigue
lifetime. The elasticity of resilin is thought to be the result of the extremely
dynamic nature of amorphous hydrophobic regions which form a kinetically free,
random-network polymer. At the microscopic level, rubbery materials like resilin
become more ordered when extended, decreasing entropy, and they uncoil in
elastic recovery. The energy stored in an elastic material can be transformed
under stress into other forms of energy, for example, the K.E. of a projectile from a
catapult. In the case of a cricket, the energy stored in coiled resilin is released by
way of a catch mechanism that allows force generated before the jump to release
rapidly; the projectile is the entire body of the bug. The current champion jumper
of all species is the insect Philaenus spumarius, the froghopper (spittle bug),
according to a recent report by a researcher at Cambridge University. The body
of a froghopper accelerates at 2800–4000 m s$2 in a jump. The average jump
requires about 50!J, which translates into a power output of 36 W g$1. The force
exerted in an average jump is 34 mN, about the same as the gravitational pull of
the Earth on one-third of a gram of water at the planet’s surface.
But how is work done by the contraction of rubber? Just as heatingdecreases the order of perfumemolecules by bringing about a sort ofthermodynamic diaspora, the addition of heat decreases the order ofthe rubber molecules and the rubber band contracts to its equili-brium position. Similar to muscle, the contraction of a rubber bandpermits work to be done. In this case, however, work is not done onthe system, it is done by the system.We can calculate themagnitude ofthis work knowing gravitational acceleration, the mass of the objectlifted by the rubber band,2 and the distance the mass is movedagainst the force of gravity (1x in Fig. 2.4C).
Stretching increases the order of the long, stringy molecules. Inthe taut state, the molecules make fewer random collisions witheach other; the entropy of the system is reduced relative to therelaxed state. When the rubber band relaxes, the orderliness of themolecules is lost and the entropy increases. The closer the mole-cules are to being randomly ordered, the greater the entropy of thesystem. This study of rubber bands has helped to show how changesin entropy relate to transfers of heat, and heat is a form of energyrelated to molecular motion, as discussed in Chapter 2.
2 By Newton’s Second Law 1p/1t" F"ma"mg, where m is mass, a is acceleration,and g is the gravitational acceleration.
64 THE SECOND LAW OF THERMODYNAMICS

A related illustration. When a scented candle burns, the thermalenergy of aromatic molecules embedded in the wax goes up. Thegreater the thermal energy of one of these molecules, the moreeasily it can overcome the attractive forces of other molecules in themelted wax, break forth from the surface, escape into the air, andafter some time go spelunking in the cavernous recesses of yournasal passage. Blimey! Can this camp example bespeak aught ofbiology? The point is that the addition of heat increases the entropyof the system, the “breadth” of the distribution of the energy of thesystem. And in fact, both lords and ladies of the plant Arum macu-latum attract pollinating insects to their flowers by heating andvaporizing aromatic molecules. At certain times of the day, thetemperature of the part of the flower called the appendix increasesrapidly, resulting in the evaporation of volatile compounds pro-duced within. Insects “smell” the aromatic compounds, find themstimulating, and move up the concentration gradient until reachingthe flower. Then, movement within the flower as the bug gathers upits prize leads to pollination.
Let’s� have� another� quick� look� at� Fig.� 2.�4.� Panel� (A)� shows� heat� beingtransferred from a hot system to a cold one. This is similar to Panel (C),where heat is being transferred from the candle to the rubber band.Back in Panel (A), kinetic energy is being shared as heat by meansof multiple collisions between the molecules of the heat source andthe molecules of the heat sink. A warm object is in contact with a coolone, and the warm molecules are banging on the cool ones harderthan the cool ones are banging on the warm ones (or each other!).Heat transfer from the warm object to the cool one enables work tobe done, as in the rubber band heat engine, and this situation con-tinues as long as there is a temperature difference between the twosystems.
When a thing is cold it moves relatively little. K.E. is proportionalto thermal energy is proportional to absolute temperature. So addi-tion of heat to something cold can disorder that thing more than theaddition of the same amount of heat to the same thing at a highertemperature. On this basis we can guess that if a given amount ofheat q is transferred to a system, it will increase the randomness ofthe system by an amount that is inversely proportional to theabsolute temperature. Because we have described entropy as ameasure of the breadth of a distribution of energy, we should expect1S / q/T, though at this point we don’t know if it’s the first power ofthe temperature that’s needed or something else.
Now let’s become definite about the relationship between heatand entropy. The entropy change, 1S, on heat transfer at absolutetemperature T, is defined as
1S ( q=T; %3:1&
where, by the convention we’ve adopted, q> 0 if heat is added to thesystem. Equation (3.1) is a fruit of labor on quantifying the max-imum amount of work that can be obtained from an ideal reversible
ENTROPY 65

engine. The equality holds only under an exceptional but none theless important constraint: when heat transfer is carried out veryslowly and any change in the system is reversible, i.e., when boththe system and its surroundings can be returned to their originalstates. A reversible process is one that occurs through a successionof equilibrium or near-equilibrium states. The inequality corre-sponds to any other kind of process. No wonder we said that theexpansion of a gas into vacuum is irreversible! Equation (3.1) tells usthat although heat is a path function, the heat exchanged in areversible and isothermal process is independent of path. So q can beindependent of path but generally is not. S is always independent ofpath.
Equation (3.1) says that when a quantity of heat is transferredfrom a hot system to a cold one, 1Shot < 0, 1Scold > 0, |1Shot|<|Scold|, and 1Stotal"1Shot# Scold > 0. Regardless of the magni-tudes of q, Thot, and Tcold, the total entropy change must begreater than zero. To make the discussion more concrete, let’slook at an example. Suppose we wish to calculate the entropychange in the surroundings when 1.00 mol of H2O(l) is formedfrom H2 and O2 at 1 bar and 298 K. This is of interest herebecause liquid water is the only known matrix in which lifeoccurs. We require the reaction to occur slowly. A table ofstandard thermodynamic quantities tells us that 1H" $286 kJ;the reaction is exothermic. Heat is transferred from the systemto the surroundings, and qsur"#286 kJ. Substituting this intoEqn. (3.1) and solving for 1Ssur gives 286 kJ/298 K" #959 J K$1.The entropy of the surroundings increases as heat is transferredto it. To put the numbers into perspective, 1 mol of water has amass of 18 g and a volume of 18 ml, about the same as a largesip. Formation of a mole of water from hydrogen and oxygen atroom temperature and ambient pressure increases the entropy ofthe universe by )1000 J K$1.
C. Heat engines
This section describes how living organisms do not behave. Youmight guess therefore that this will be the usual sort of apparentlyuseless, academic exercise that one is required to do to earn adegree. But in fact in trying to understand what something is, it canbe instructive to seek to know why it is not what it is not. That’s thespirit, anyhow, in which we discuss heat engines.
Let’s suppose, as Carnot did, that heat q is transferred from a heatsource to a heat sink (Fig. 2.4A). How much of this heat is availableto do work? How much work can be done? No more than meets therequirement of the Second Law; the work done is usually much lessthan the Second Law allows! Let’s calculate the limit. We set
1Shot # Scold " 0: %3:2&
66 THE SECOND LAW OF THERMODYNAMICS

Plugging in Eqn. (3.1), and calling the cold sink the place where thewaste heat goes, we have
$qtransferred=Thot # qwaste=Tcold " 0: %3:3&
Rearranging,
qwaste " qtransferredTcold=Thot: %3:4&
Here, qwaste is the minimum amount of heat transferred to sink; qwaste
cannot be used to do work. In designing a heat engine, we wouldwant to make qwaste as small as possible, making Tcold as small aspossible and Thot as large as possible, and remembering thatenergy must be “consumed” to make Tcold < Tsurroundings or Thot >Tsurroundings. The maximum work one can do is to use all the heat thatremains, and that is qtransferred less qwaste:
wmax " qtransferred $ qtransferredTcold=Thot " qtransferred%1$ Tcold=Thot&: %3:5&
A simple numerical example is the following. If 30 J is transferredfrom a heat source at 300 K to a heat sink at 200 K (cold!), themaximum work that can be done is 30 J· [1$ (200 K / 300 K)]" 10 J.The efficiency of this process"wmax/qtransferred" 10/30"33%. Wecan see now that an engine in which all the heat is converted to mechanicalwork cannot exist – a suggestion that seems suspiciously like a lim-itation on what is possible in our universe. Which brings us toanother way of formulating the Second Law, one due to Carnothimself: heat of itself cannot pass from a colder body to a hotter one; workis required. What does this have to do with biology? It helps us torealize that cells cannot do work by heat transfer because they areessentially� isothermal� systems� (Fig.� 2.4B).� This� applies� not� only� toterrestrial mammals like armadillos, but also to the hyperthermo-philic bacteria that live on the ocean floor in thermal vents, andpresumably to any living thing anywhere in the universe.
We have seen that the transfer of heat can be used to do work butthat the process generates waste heat, qwaste. By Eqn. (3.1), Sirreversible,the minimum irreversible entropy produced by heat transfer, is
Sirreversible " qwaste=Tcold: %3:6&
Does this mean that an irreversible entropy increase must be writtenoff as a pure loss? No! To see how a loss might be a gain of a sort, let’spay another visit to our friend the rubber band. When stretched, itsentropy is low; the long rubber molecules are ordered. The release oftension results in decreased ordering of the molecules, so1S>0. Weshould therefore expect q> 0 on release of tension, and this is easilyverified by experiment (try it!). The heat qwaste is lost to the sur-roundings. This heat is not completely useless, however, because thecontraction of the rubber could be used to do something constructive,for� example,� lift� a� weight� (Fig.� 2.4C).� An� irreversible� increase� inentropy can be used to do work.
Having covered the necessary background, let’s look at a biolo-gical example of an irreversible increase in entropy being used to do
HEAT ENGINES 67

work. Grasshoppers (and other hopping insects) store elastic energyin the compressed form of a protein called resilin, from resilient. Thisis something like a compressed spring, for instance, the spring in aloaded jack-in-the-box. When the insect leaps, elastic energy isreleased and the resilin becomes less ordered. 1S for this process islarge and positive. This form of energy release is just about as fast asthe transmission of a nerve impulse and much faster than a typicalmetabolic reaction, enabling the grasshopper to make tracks if itsenses danger from a predator. You will certainly know somethingabout this if you have ever tried to catch one of these crispy critterswhile it was, so to speak, in the pink.
Now, before we wander too far away from equations, we ask:which is greater in magnitude, qtransferred or qwaste? Or, suppose wehave a process that can be carried out either reversibly or irrever-sibly. For which process will q be larger? Combining Eqn. (3.1) withthe First Law gives
1U * T1S # w; %3:7&
which, upon rearrangement, becomes
w ( 1U $ T1S: %3:8&
The most negative value of w that this expression can yield, andtherefore the greatest amount of work that can be done by thesystem, is
wmax " 1U $ T1S: %3:9&
That is, the work done is maximal when the process is carried outreversibly. (Note that if wmax"0 and 1U" 0, then 1S" 0 at any T.)By the First Law,
1Urev " qrev # wrev %3:10&
for a reversible process, and
1Uirrev " qirrev # wirrev %3:11&
for an irreversible one. But if the starting and ending points are thesame, then 1Urev"1Uirrev"1U. And if work is done by the systemon the surroundings, then the sign of w is negative, and Eqns. (3.10)and (3.11) are, respectively,
1U " qrev $ wrev %3:12&
and
1U " qirrev $ wirrev: %3:13&
Combining these equations, which we can do because the change ofstate is identical in the two cases, gives
1U " qrev $ wrev " qirrev $ wirrev %3:14&
or, upon rearrangement,
qrev $ qirrev " wrev $ wirrev: %3:15&
68 THE SECOND LAW OF THERMODYNAMICS

Above we found that wrev(wirrev, which means that both sides ofEqn. (3.15) must be positive. This implies that
qrev ( qirrev: %3:16&
And so we have answered the question we set ourselves. What doesEqn. (3.16) mean? In an endothermic process, the heat extractedfrom the surroundings will be greatest when the process is rever-sible. In an exothermic process, the heat released to the surround-ings will be smallest when the process is reversible. So, livingorganisms would release the smallest possible amount of energy asheat if the processes going on inside them were reversible. And wedo release a lot of heat to the surroundings. But many of the pro-cesses going on inside you are irreversible! To keep from coolingdown to the temperature of the surroundings, we must consumeenergy. And it comes from food.
D. Entropy of the universe
As we have seen, the total entropy of an isolated system increasesin the course of a spontaneous change. Put another way, the SecondLaw says that no natural process can occur unless it is accompaniedby an increase in the entropy of the universe (Fig. 3.4 and Table 3.1).The upshot is that every process that occurs in nature is ultimatelyirreversible and unidirectional, the direction being dictated bythe requirement of an overall increase in entropy. This can be sym-bolized in a compact mathematical form as 1Stotal"1Shot#1Scold>0. Rewriting this in a more general way, we have
1Ssystem #1Ssurroundings " 1Suniverse > 0: %3:17&
In order for a physical change to occur spontaneously, the entropy ofthe universe must increase. Leafing back to a preceding page of thischapter, we see that 1S in Eqn. (3.1) is we see that 1Suniverse, and inthe previous two sections the entire universe consisted of just a heatsource and a heat sink, one being the system and the other being thesurroundings.
It is important to realize that Eqn. (3.17) does not say that entro-pically “unfavorable” reactions (ones for which the entropy changeis negative) cannot occur. Such reactions can and do occur, albeit notspontaneously. When an entropically unfavorable process is made tooccur, the overall change in the entropy of the universe will be greaterthan zero, by the Second Law of Thermodynamics. Will this be truefor a rather complicated and organized thing like an amoeba, an ant,or an aardvark? Yes! And what if we want to measure the entropyproduction of an organism? Can we do that and decide whether thechange occurred spontaneously? No! Because the sign of 1S for asystem indicates whether a reaction will proceed spontaneously onlyif the system is isolated from its surroundings or both the entropy
Fig. 3.4 The Second Law of
Thermodynamics. No process will
occur spontaneously unless it
is accompanied by an increase in the
entropy of the universe. This applies to
an isolated system, a closed system,
and an open system.
ENTROPY OF THE UNIVERSE 69
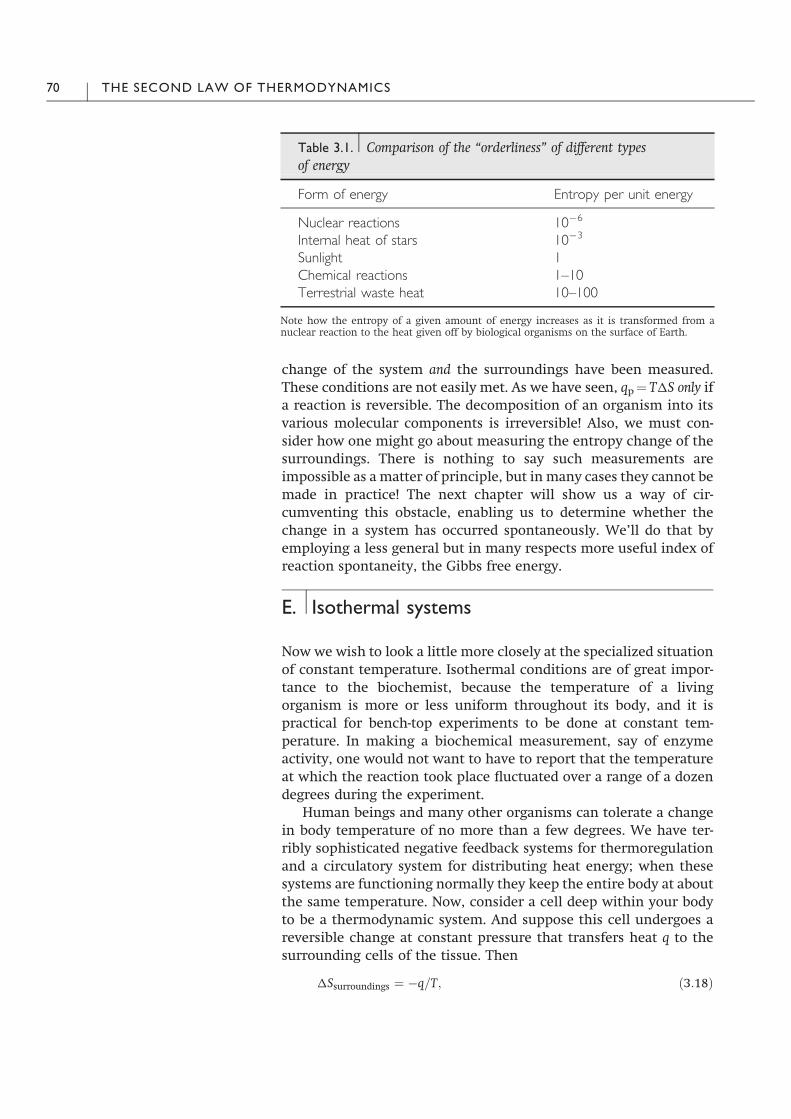
change of the system and the surroundings have been measured.These conditions are not easily met. As we have seen, qp" T1S only ifa reaction is reversible. The decomposition of an organism into itsvarious molecular components is irreversible! Also, we must con-sider how one might go about measuring the entropy change of thesurroundings. There is nothing to say such measurements areimpossible as a matter of principle, but in many cases they cannot bemade in practice! The next chapter will show us a way of cir-cumventing this obstacle, enabling us to determine whether thechange in a system has occurred spontaneously. We’ll do that byemploying a less general but in many respects more useful index ofreaction spontaneity, the Gibbs free energy.
E. Isothermal systems
Now we wish to look a little more closely at the specialized situationof constant temperature. Isothermal conditions are of great impor-tance to the biochemist, because the temperature of a livingorganism is more or less uniform throughout its body, and it ispractical for bench-top experiments to be done at constant tem-perature. In making a biochemical measurement, say of enzymeactivity, one would not want to have to report that the temperatureat which the reaction took place fluctuated over a range of a dozendegrees during the experiment.
Human beings and many other organisms can tolerate a changein body temperature of no more than a few degrees. We have ter-ribly sophisticated negative feedback systems for thermoregulationand a circulatory system for distributing heat energy; when thesesystems are functioning normally they keep the entire body at aboutthe same temperature. Now, consider a cell deep within your bodyto be a thermodynamic system. And suppose this cell undergoes areversible change at constant pressure that transfers heat q to thesurrounding cells of the tissue. Then
1Ssurroundings " $q=T; %3:18&
Table 3.1. Comparison of the “orderliness” of different typesof energy
Form of energy Entropy per unit energy
Nuclear reactions 10$6
Internal heat of stars 10$3
Sunlight 1Chemical reactions 1–10Terrestrial waste heat 10–100
Note how the entropy of a given amount of energy increases as it is transformed from anuclear reaction to the heat given off by biological organisms on the surface of Earth.
70 THE SECOND LAW OF THERMODYNAMICS
where Tsurroundings is so close to Tsystem that both temperatures are T.Because1T'0, the pV-work that canbe done from theheat transfer ispractically negligible, and q"1H. Substituting into Eqns. (3.17) and(3.18) gives
1Ssystem $1H=T > 0; %3:19&
which, after rearrangement, can be written as
1H$ T1Ssystem<0: %3:20&
The quantity H$ TS is a thermodynamic state function called theGibbs free energy. 1H measures the heat exchanged at constantpressure, as discussed in Chapter 2, and T1S can be thought of“isothermallyunavailable” energy, as transfer of this energyoutof thesystemwould result in a temperature decrease, and we have said thatthe temperature is constant. The Gibbs energy enables prediction ofthedirectionof spontaneous changeof a systemunder the constraintsof constant temperature and constant pressure.
We can approach the idea of a portion of heat released by areaction being unavailable for work from another direction. First,let’s see if we can convince ourselves (again) that some of the avail-able energy cannot be used to do work. Suppose we have a systemwhich undergoes a process that results in a decrease in the entropy ofthe system, for example, liquid water allowed to come to equilibriumin the solid state at $1 !C. If all the heat released by this process,which is about 6 kcal mol$1, were exported to the surroundings aswork, there would be no increase in the entropy of the surroundings,and the overall entropy for the process would be negative. But thiscontradicts Eqn. (3.17), the requirement of the Second Law that anyreal process will result in an increase in the entropy of the universe.So, at least some of the heat generated by the process must beunavailable to do work. But how much?
We can find the answer by continuingwith a qualitative treatment.Let’s suppose that the reaction reduces the entropy of the system bysome amount, 1S. In order for the reaction to be spontaneous, theentropy of the surroundings must increase by at least as much. ByEqn. (3.6), this is qwaste/T. Solving for the heat supplied, qwaste" T1S,where 1S is the decrease in the entropy of the system (qwaste is nega-tive). This is the energy that is not available to do work. The energythat is available to do work is the difference between the total energyand the energy that is not available to do work. And this energy is theGibbs free energy. Note the resemblance of this qualitative exampleto Eqn. (3.20). The Gibbs free energy is so important to the biologicalsciences that the next two chapters will be devoted to it.
Above we combined the First and Second Laws to arrive at theGibbs free energy. Now we wish to combine these laws again, butin a somewhat different way. The result will be different, and itwill provide new insight into the expansion of a gas into vacuum
ISOTHERMAL SYSTEMS 71
discussed above and prepare the way for a discussion of osmosis inChapter 5. Moreover, it will provide a good starting point forour coverage of statistical thermodynamics (Chapter 6). Let’s requirethe system to be adiabatic; energy can neither enter nor leave,1U" 0. By the First Law, q"$w. If we require pV-type work only,then q" p1V; and if the system is an ideal gas, then q" nRT1V/V.Suppose now that the process we’d like to carry out is reversible.Then, by the Second Law, q" T1S. Combining the First and SecondLaws gives
T1S " nRT1V=V: %3:21&
Cancelling the Ts leaves
1S " nR1V=V: %3:22&
This is the increment in entropy when an ideal gas is allowed toexpand by a small but measurable volume, 1V. If the expansion iscarried out reversibly over a large change in volume, the totalchange in entropy is the sum of all the small changes, and theresult, which can be found with a little calculus, is
1S " nRln%V f=V i&; %3:23&
whereVf is thefinal volume andVi is the initial volume. The entropy isa state function, so as long as the initial and final states are whateverthey are, the entropy difference between states will be independentof how the change occurs. The entropy change on opening the stop-cock of an adiabatic version of the system shown in Fig. 3.2 can befound by Eqn. (3.23). It is 1S" nR ln(2Vi/Vi)" nR ln2. The entropychange of the universe for irreversible change must be greater thanthe entropy change of the universe of a reversible change.
F. Protein denaturation
Let’s see how Eqn. (3.18) (or Eqn. (3.1)) can be used to describe thereversible isothermal entropy change of any biochemical system welike. Here, we apply it to protein denaturation, but it describesequally well the “melting” of DNA, the dissociation of the double-stranded helix into two single strands. In Chapter 4 we shall see howit is yet even more general.
Rewriting Eqn. (3.18) with symbols introduced in the previouschapter, we have
1Sd " 1Hd=Tm: %3:24&
The minus sign has vanished because heat is being transferred tothe system and we are describing the entropy change of the proteinsystem, not the surroundings. Suppose Tm is 342 K and we wish to
72 THE SECOND LAW OF THERMODYNAMICS

know 1Sd at 25 oC. What can we do? If the heat transfer is carriedout reversibly, then, by Eqns. (3.1) and (3.18), 1S"$q/T. The heattransferred, q, will increase the enthalpy of the system according toEqn. (2.16), if the system is at constant pressure. Combining theseequations gives
1S " Cp1T=T: %3:25&
If we now sum up all these small contributions to find the entropychange over a measurable range of temperatures (T1 – T2) and use awee bit of mathematical wizardry (the same sort used in the previoussection), the result is
1S%T2& "1S%T1& # Cpln%T2=T1&; %3:26&
where1S(Ti) is the change in entropy evaluated at temperature Ti, notthe mathematical product of1S and Ti, and we have assumed that Cpis constant throughout the temperature range. It can be shown thatEqn. (3.26) becomes
1S%T2& "1S%T1& #1Cpln%T2=T1&; %3:27&
if state 1 and state 2 differ in heat capacity and 1Cp is constantthroughout the relevant temperature range. As an example, suppose that1S" 354 cal mol$1 K$1 at 80 !C and 1Cp" 1500 cal mol$1 K$1. Then1S(25 !C)" 354 cal mol$ 1 K$ 1# (1500 cal mol$1 K$1)· ln(298.16 K/353.16 K)" 100 cal mol$1 K$1.
There is another way of thinking about proteins and entropy,one that does not involve a large change in heat capacity. As the pHdecreases, acidic amino acid side chains become protonated. Froman exercise in Chapter 2, the enthalpy change of amino acid sidechain protonation is about 1 kcal mol$1. This is so small as to benegligible in comparison with the enthalpy change of unfolding theprotein in the absence of protonation effects. Changes in pH cannevertheless have a dramatic effect on protein stability; indeed, wehave already seen how lowering the pH reduces the transitiontemperature of hen egg white lysozyme. It follows that protonationof Glu and Asp is mainly an entropic effect, with regard to thebinding of the proton to the amino acid side chain and the effect onprotein unfolding. The Tm of the protein decreases upon reductionof pH because the entropy difference between the folded andunfolded states decreases at a faster rate than the enthalpy differ-ence, making 1Hd/1Sd progressively smaller. The ionization of foodmolecules in the low-pH environment of the gut denatures proteins,facilitating their breakdown into short peptides by digestiveproteases.
How do we interpret the pH denaturation of proteins, and explainit on a more detailed level? As the pH goes down there is a change inthe ionization state of the acidic side chains. This results in a net
PROTEIN DENATURATION 73
increase in the surface charge of the protein. So at low pH, thepositive charges repel each other by electrostatic interactionsmore than at high pH, destabilizing the folded conformation. Thesituation can be represented as follows:
Pfolded#nH# ! P+ ! Punfolded; %3:28&
where P* is an unstable folded conformation. The effect of charge onprotein stability was first described mathematically in 1924 by theDanish physical biochemist Kaj Ulrik Linderstrøm-Lang (1896–1959).The earliest known experiments on the use of a strong acid to dena-ture proteins were done about a century earlier, by a Dutch chemistnamed Gerardus Johannes Mulder (1802–1880), who is also said tohave stimulated the eminent Swedish chemist Jons Jacob Berzelius(1779–1848) to coin the word protein (Greek, of the highest impor-tance). Linderstrøm-Lang’s mentor at Carlsberg Laboratory, Copen-hagen, Denmark, was the Danish biochemist Søren Peter LaurtizSørensen (1868–1939), who developed the now universally adoptedpH scale for measuring the acidity of an aqueous solution andushered in the modern era of protein chemistry. We shall meetLinderstrøm-Lang again in Chapters 6 and 8.
G. The Third Law and biology
Yet another way of stating the Second Law brings us to the ThirdLaw. Any system not at absolute zero has some minimum amount of energythat is a necessary property of that system at that temperature. This energy,of magnitude TS, is the “isothermally unavailable” energy fromabove (Section E). Now, the Third Law of Thermodynamics statesthat the entropy of a perfect crystal is zero when the absolute tem-perature is zero (0 K"$273 !C" cold!). A perfect crystal is like theideal diamond in which each atom is at its proper place in an orderlyarray. The reason why we care about the Third Law is that it impliesthat the rapid and complex changes exhibited by living organisms,for instance, in a eukaryotic cell migrating during embryogenesis,can only occur far from thermodynamic equilibrium.
There is a substantial scientific literature on the freezing of livingorganisms. Some creatures have been stuck in a rather sophisticatedsort of meat locker, taken to an extremely low temperature ()4 K),and allowed to thaw again. It is remarkable that some relatively“simple” organisms, e.g. bacteria, some types of microscopic ani-mals, and plant seeds, return to room temperature from the deadlycold and function normally. Even some nematodes, which arecomparatively complex organisms, having on the order of 103 cellsat adulthood, are known to be able to withstand this process(depending on how it is carried out).
As discussed in Chapter 2, temperature measures the averagekinetic energy of a collection ofmolecules. So, when the temperatureis made to approach 0 K, all molecular motion ceases (excluding that
74 THE SECOND LAW OF THERMODYNAMICS

required by the Heisenberg uncertainty principle3). Thus, close toabsolute zero, the only “memory” a biological system has of its life-before-deep-freeze is the information contained in the structure andarrangement of its macromolecules. When the organism thaws out,no new information is added; in fact, information is removed,because heating is a disordering process, as we have seen through-out this chapter.
The foregoing discussion would suggest that “all” one wouldhave to do to “create” a cell would be to construct a being of theappropriate configuration of atoms. If the configuration (structure)were “the right type,” the cell would function “on its own.” Fromthis point of view, it seems that a cell of an organism or indeed anentire organism might not be qualitatively different from someother collection of organic molecules. But on another view, a cell issimultaneously the most highly organized and the most complexcollection of organic molecules of its size that we can imagine!Will it be possible to make “artificial” cells? What will be theirproperties?
H. Irreversibility and life
In the first several chapters of this book we have looked at ways inwhich living organisms can be thought of as machines. (Note: thisdoes notmean that living organisms aremachines!) Back inChapter 1,for example, we discussed energy “consumption” as though biologi-calmachines really do “consume” energy.We’ve covered the First andSecond Laws in some degree of depth, and we want to take a morecritical look at energy consumption and relate it to life. If food ispotential energy and we consume food, we consume energy; a soundargument if we agree on the meaning of consume. There is, however,another way of looking at energy consumption, and that is what wewant to do now.
We do of course consume food, but that should not be taken tomean that we consume energy. For all a living organism or any typeof system whatsoever can do is transform energy from one form toanother; the total energy of the universe remains the samethroughout such transformations by the First Law. The amount ofenergy returned to the environment by an organism, for instanceas excretory products or heat, is equivalent in magnitude to theenergy taken in, assuming no change in the weight. In this sense,living things do not consume energy at all; energy simply flowsthrough them.
Just as important, the energy an organism returns to theenvironment must be less useful than the energy it “consumed.”
3 Named after the German mathematical physicist and philosopher Werner KarlHeisenberg (1901–1976), son of a professor of ancient history. Heisenberg wasawarded the Nobel Prize in Physics in 1932.
IRREVERSIBILITY AND LIFE 75
Sure, excretory products make great fertilizer, but there are severalgood reasons why certain animals would not want to feed on them!As we have seen, any real process must increase the entropy of theuniverse; any change in the universe must result in an overalldecrease in order. And as we shall see in the next chapter, biolo-gically useful energy, or free energy, is the energy that can be usedto do work under isothermal conditions. It is the sort of energythat humans, sheep, goats, even sea slugs, need to live. As theexample of the heat engine has shown, heat transfer cannot beused to perform a substantial amount of work in biological sys-tems, because all parts of a cell and its surroundings are effectivelyat the same temperature (and pressure). We have thus eliminated amajor class of ways in which cells could conceivably do work, atleast within the constraints of the physical properties of our uni-verse. And we have narrowed the path to understanding. Whew! Inplaying the game of twenty questions, the ideal strategy is to posea query whose yes-or-no reply will eliminate the largest number ofpossible answers and enable you to close in on the right one. Thedirection of spontaneous change in an isothermal system from anon-equilibrium to an equilibrium state is determined by therequirement that the extent of change be a maximum at everypoint on the reaction pathway. The suggestion that, say, uniformlydispersed smoke particles could somehow move spontaneouslyfrom all corners of a room back into a burning cigar seems absurd –except in a videotape run backwards.
There are various causes of the irreversibility of real-world pro-cesses. These include friction between two objects during relativemotion, unrestrained expansion of a gas or liquid without produc-tion of work, the mixing of different substances that would requirethe input of work to separate them – all common phenomena.Because all atoms interact with each other, even noble gases, itwould appear that there must be at least a small amount of irre-versibility in any actual process. The inexorable increase in theentropy of the universe resembles, broadly speaking, the unidirec-tional flow of time. For as far as anyone knows, time moves in onedirection only: forward! Why should this be so remarkable?
Time moves forward, and the past is, well, the past. Thisapparent conjunction of an interpretation of a scientific theory (theSecond Law of Thermodynamics) and our ordinary (psychological?)perception of time is all the more intriguing because all organismscome into being and pass out of being in time and all the funda-mental laws of physics are time-reversible.4 Newton’s laws of motionwork equally well in either direction of time; they are time sym-metrical. Maxwell’s equations of electromagnetism work equally
4 The decay of kaons and other sub-nuclear particles violates time symmetry; theseparticles appear to possess an intrinsic “sense” of past-future. See Christenson et al.(1964).
76 THE SECOND LAW OF THERMODYNAMICS

well forwards and backwards.5 The time-dependent Schrodinger6
equation of quantum theory is equally happy whether time ispositive or negative. Einstein’s theory of relativity works just as wellin either direction of time. The time-reversibility or time-symmetryof laws of physics is related to energy conservation (the First Law).
The widely accepted mathematical formulations of physicallaw help us to rationalize many aspects of the nature of the universeand, moreover, provide tools for the creation of technology. Becauseof this, we cannot but be convinced that physics gives us at least anapproximately right sense of the nature of reality. Nevertheless, andregardless of one’s familiarity with physics, time marches on. Theonly law of physics that jibes with this aspect of our everydayexperience of the world is the Second Law of Thermodynamics. Thisis all the more noteworthy here in that life on Earth has grownincreasingly complex since the advent of the first cell; humans,composed as they are of billions of cells, are a good deal morecomplex than one-celled beasts like bacteria! We’ll come back tothis point in Chapter 9.
One can think about the irreversibility of chemical processesand life on different levels. Just as the increase in complexity oflife forms on Earth is irreversible, in that it cannot be undone(though we could, it seems, blast ourselves to oblivion by means ofwell-placed and sufficiently large nuclear bombs): so at certainpoints in the development of an organism “commitment” occurs.For instance, in higher eukaryotes, once embryonic cells have“differentiated” into mesoderm or ectoderm, they ordinarily do notand in many cases apparently cannot become endoderm. If you havehad the extreme misfortune of losing a limb, you will be acutelyaware of the fact that a new one won’t grow in to take its place.Some researchers think that biological ageing can be described interms of the Second Law. On this view, what we call ageing is theprocess whereby a biological system moves from a point far fromequilibrium toward equilibrium, a state of no further change.Another way of stating this is that order is a basic property of aliving organism, and disorder, a dead one. There is a great deal thatcould be said on this topic, and it is a pity that there is not enoughspace to do more with it here.
The concepts of entropy and irreversibility (and energy conserva-tion) have had a huge impact on humankind’s view of the universe.Indeed, theconceptofentropyhas thrownintohighreliefphilosophiesof progress and development. “How is it possible to understand life
5 James Clerk Maxwell, a Scot, lived 1831–1879. He is regarded as the nineteenth-century scientist who had the greatest influence on twentieth-century physics and isranked with Isaac Newton and Albert Einstein for the fundamental nature of hiscontributions. He did important work in thermodynamics and the kinetic theory ofgases.
6 The Austrian physicist Erwin Schrodinger (1887–1961) was awarded the Nobel Prizein Physics in 1933. His little book What is Life? had a significant impact on the earlydevelopment of molecular biology.
IRREVERSIBILITY AND LIFE 77

when the entire world is ordered by a law such as the second principleof thermodynamics, which points to death and annihilation?”7 It ishard to see how a definitive answer can be given. Again, this topicdeserves far more attention than it can be given here.
Finally, we wish to touch on the origin of irreversibility in many-body systems like large collections of small interacting particles.The thermodynamic description of such systems is so useful pre-cisely because, in the usual case, there is no detailed knowledge orcontrol over the (microscopic) variables of position and momentumfor each individual particle. If such control were possible, thedynamics of many-body systems would presumably be reversible.When the number of microscopic variables is large, the state ofmaximum entropy is overwhelmingly probable, and the only lack ofcertainty that the entropy is maximal is the requirement that sta-tistical “fluctuations” be allowed to occur. Under given constraints,the maximum entropy (equilibrium) state is the macroscopic statethat can be formed in the greatest number of microscopic ways.More on this in Chapter 6.
I. References and further reading
Allen, A. (1983). Entropy still in a state of disorder. Trends in BiochemicalSciences, 8, 81–2.
Atkins, P.W. (1994). The Second Law: Energy, Chaos, and Form. New York:Scientific American.
Atkinson, D. E. (1977). Cellular Energy Metabolism and Its Regulation. New York:Academic Press.
Baron, M. (1989). With Clausius from energy to entropy. Journal of ChemicalEducation, 66, 1001–4.
Bennet, C.H. (1987). Demons, engines and the Second Law. ScientificAmerican, 257, no. 5, 108–12.
Bent, H. A. (1965). The Second Law. New York: Oxford University Press.Bergethon, P. R. (1998). The Physical Basis of Biochemistry: the Foundations ofMolecular Biophysics, cc. 12.1–12.2. New York: Springer-Verlag.
Burrows, M. (2003). Froghopper insects leap to new heights. Nature, 424, 509.Cano, R. J. & Borucki, M.K. (1995). Revival and identification of bacterialspores in 25- to 40-million-year old Dominican amber. Science, 268, 1060–4.
Christensen, H.N. & Cellarius, R. A. (1972). Introduction to Bioenergetics:Thermodynamics for the Biologist: A Learning Program for Students of the Biologicaland Medical Sciences. Philadelphia: W. B. Saunders.
Christerson, J. H., Cronin, J.W., Fitch, V. L. & Turlay, R. (1964). Evidence forthe 2# decay of the K2
0 meson. Physical Review Letters, 13, 138–40.Clugston, M. J. (1990). A mathematical verification of the second law ofthermodynamics from the entropy of mixing. Journal of Chemical Education,67, 203–5.
Craig, N. C. (1988). Entropy analyses of four familiar processes. Journal ofChemical Education, 65, 760–4.
7 Leon Brillouin, Life, Thermodynamics, and Cybernetics.
78 THE SECOND LAW OF THERMODYNAMICS

Cropper, W.H. (1988). Walther Nernst and the last law. Journal of ChemicalEducation, 64, 3–8.
Davies, P.W. C. (1995). About Time: Einstein’s Unfinished Revolution. London:Penguin.
Djurdjevic, P. & Gutman, I. (1988). A simple method for showing thatentropy is a function of state. Journal of Chemical Education, 65, 399.
Einstein, A. (1956). Investigations on the Theory of Brownian Movement. New York:Dover.
Elvin,C.M.,Carr, A. G.,Huson,M.G.,Maxwell, J.M., Pearson,R.D., Vuocolo, T.,Liyou, N. E., Wong, D. C. C., Merritt, D. J. & Dixon, N. E. (2005). Synthesis andproperties of crosslinked recombinant pro-resilin. Nature, 437, 999–1002.
Encyclopdia Britannica CD 98, “Absolute Zero,” “Elasticity,” “Entropy,”“Insects,” “Metabolism,” “Onsager, Lars,” “pH,” “Reversibility,” and“Principles of Thermodynamics.”
Entropy: An International and Interdisciplinary Journal of Entropy and InformationStudies. See http://www.mdpi.org/entropy/.
Fenn, J. B. (1982). Engines, Energy and Entropy. New York: W.H. Freeman.Feynman, R. P., Leighton R. B. & Sands, M. (1963). Lectures on Physics, Vol. I, cc.44–2–44–6. Reading, Massachusetts: Addison-Wesley.
Fruton, J. S. (1999). Proteins, Enzymes, Genes: the Interplay of Chemistry and Biology.New Haven: Yale University Press.
Gardner, M. (1967). Can time go backward? Scientific American, 216, no. 1,98–108.
Gillispie, C. C. (ed.) (1970). Dictionary of Scientific Biography. New York: CharlesScribner.
Gutfreund, H. (1951). The nature of entropy and its role in biochemicalprocesses. Advances in Enzymology, 11, 1–33.
Hale, F. J. (1993). Heat engines and refrigerators. In Encyclopedia of AppliedPhysics, vol. 7, ed. G. L. Trigg, pp. 383–403. New York: VCH.
Harold, F.M. (1986). The Vital Force: a Study of Bioenergetics, ch. 1. New York:W.H. Freeman.
Haynie, D. T. (1993). The Structural Thermodynamics of Protein Folding, ch. 3.Ph.D. thesis, The Johns Hopkins University.
Hollinger, H. B. & Zenzen, M. J. (1991). Thermodynamic irreversibility: 1.What is it? Journal of Chemical Education, 68, 31–4.
Holter, H. & Møller, K.M. (ed.) (1976). The Carlsberg Laboratory 1876–1976.Copenhagen: Rhodos.
Katchalsky, A. & Curran, P. F. (1967). Nonequilibrium Thermodynamics inBiophysics, ch. 2. Cambridge, Massachusetts: Harvard University Press.
Klotz, I.M. (1986). Introduction to Biomolecular Energetics, ch. 2. Orlando:Academic Press.
Kondepudi, D. & Prigogine, I. (1998).Modern Thermodynamics: from Heat Enginesto Dissipative Structures, cc. 3 & 4. Chichester: John Wiley.
Maddox, J. (1993). When entropy does not seem extensive. Nature, 365, 103.Microsoft Encarta 96 Encyclopedia, “Thermodynamics.”Morowitz, H. J. (1970). Entropy for Biologists. New York: Academic Press.Morowitz, H. J. (1978). Foundations of Bioenergetics, cc. 4 & 5. New York:Academic Press.
Ochs, R. S. (1996). Thermodynamics and spontaneity. Journal of ChemicalEducation, 73, 952–4.
Parker, F. L. & Krenkel, P. A. (1970) Physical and Engineering Aspects of ThermalPollution. Cleveland, Ohio: CRC Press.
REFERENCES AND FURTHER READING 79

Penrose, O. (2005). An asymmetric world. Nature, 438, 919.Peusner, L. (1974). Concepts in Bioenergetics, cc. 3 & 10. Englewood Cliffs:Prentice-Hall.
Planck, M. (1991). The Second Law of Thermodynamics. In The World Treasuryof Physics, Astronomy, and Mathematics, ed. T. Ferris, pp. 163–9. Boston: LittleBrown.
Price, G. (1998). Thermodynamics of Chemical Processes, ch. 3. Oxford: OxfordUniversity Press.
Prigogine, I. (1967). Introduction to Thermodynamics of Irreversible Processes. NewYork: John Wiley.
Schrodinger, E. (1945). What is Life? The Physical Aspect of the Living Cell.Cambridge: Cambridge University Press.
Seidman, K. & Michalik, T. R. (1991). The efficiency of reversible heatengines: the possible misinterpretation of a corollary to Carnot’s theorem.Journal of Chemical Education, 68, 208–10.
Skoultchi, A. I. & Morowitz, H. J. (1964). Information storage and survival ofbiological systems at temperatures near absolute zero. Yale Journal ofBiology and Medicine, 37, 158.
Smith, C. A. & Wood, E. J. (1991). Energy in Biological Systems, cc. 1.2, 1.3 & 2.3.London: Chapman & Hall.
Williams, T. I. (ed.) (1969). A Biographical Dictionary of Scientists. London: Adam& Charles Black.
Wrigglesworth, J. (1997). Energy and Life, cc. 1.3–1.4.1. London: Taylor &Francis.
J. Exercises
1. Is the word entropy a misnomer? Why or why not?
2. State whether the following phrases pertain to (A) the First Lawof Thermodynamics, (B) the Second Law, (C) both the First andSecond Law, or (D) neither of the Laws.
(1) Is concerned with the transfer of heat and the performanceof work.
(2) Is sufficient to describe energy transfer in purely mechanicalterms in the absence of heat transfer.
(3) Indicates whether a process will proceed quickly or slowly.(4) Predicts the direction of a reaction.(5) Is a statement of the conservation of energy.(6) Says that the capacity to do work decreases as the
organization of a system becomes more uniform.(7) Is a statement of the conservation of matter.(8) Says that a quantity of heat cannot be converted into an
equivalent amount of work.(9) Says that the capacity to do work decreases as objects come
to the same temperature.
3. Examine Eqn. (3.1). What happens to 1S as T! 0? In order toensure that this equation remains physically meaningful as
80 THE SECOND LAW OF THERMODYNAMICS

T! 0, what must happen to1S? The answer to this question is astatement of the Third Law of Thermodynamics.
4. Consider a heat engine. Suppose 45 J is transferred from a heatsource at 375 K to a heat sink at 25 !C. Calculate the maximumwork that can be done and the efficiency of the process.
5. We said that heat engines do not tell us very much about howliving organisms work. Show that if the human body dependedon thermal energy to do work, it would cook before it coulddemonstrate its efficiency as a heat engine. Assume that the“engine” has an efficiency of 20%.
6. One calorie (1 cal) is produced for every 4.1840 J (Joules) of workdone. If 1 cal of heat is available, can 4.1840 J of work beaccomplished with it? Why or why not?
7. In Chapter 2 we learned about thermal equilibrium. In theapproach to thermal equilibrium when two objects of differinginitial temperature are brought into contact, although noenergy is lost (by the First Law of Thermodynamics), somethingcertainly is lost. What is it?
8. Entropy change of protein unfolding. Suppose that 1Hd(25 !C) "10 kcal mol$1, Tm" 68 !C and 1Cp" 1,650 cal mol$1 K$1. Calcu-late 1Sd(Tm), 1Sd(37 !C) and 1Sd(15 !C). At what temperature is1Sd" 0? Give the thermodynamic significance of 1Sd in mole-cular terms at each temperature.
9. Recall Exercise 19 from Chapter 2. Use the same data to eval-uate 1Sd(Tm) at each pH value. Rationalize the entropy values.
10. For irreversible pathways, q/T is generally dependent on thepath. How can one discover the entropy change between twostates? Knowing that qreversible > qirreversible (Eqn. (3.16)), use theFirst Law to write down a similar inequality for wreversible andwirreversible.
11. Explain in thermodynamic terms why water freezes.
12. Suppose you have a cyclic process, as shown in Fig. 2.3. Theentropy change for the system must be 0. Is there any incon-sistency with the Second Law of Thermodynamics? Explain.
13. In his book What is Life?, Erwin Schrodinger says “an organismfeeds with negative entropy.” What does he mean? (Hint: con-sider an organism that is able to maintain its body temperatureand weight in an isolated system.)
14. Consider a gas, a liquid and a crystal at the same temperature.Which system has the lowest entropy? Why?
15. Can a machine exist in which energy is continually drawn froma cold environment to do work in a hot environment at no cost?Explain.
EXERCISES 81

16. There are a number of different causes of undernutrition. Someof these are: failure of the food supply; loss of appetite; fastingand anorexia nervosa; persistent vomiting or inability to swal-low; incomplete absorption, comprising a group of diseases inwhich digestion and intestinal absorption are impaired andthere is excess loss of nutrients in the feces; increased basalmetabolic rate, as in prolonged fever, overactivity of the thyroidgland, or some cancers; and loss of calories from the body; e.g.glucose in the urine in diabetes. Rationalize each type ofundernutrition in terms of the First and Second Laws of ther-modynamics.
17. The macroscopic process of diffusion can be identified withmicroscopic Brownian motion,8 which subjects molecules torepeated collisions with the atoms of their environment andresults in their random rotation and translation. Some peoplesay that the time-asymmetry in the inevitable increase of ran-domness of the universe is not strictly true as Brownian motionmay contravene it. What is your view? Support it with well-reasoned arguments.
18. Consensus is a weak but nonetheless important criterion oftruth, particularly in the scientific community. Doig and Wil-liams9 claim that disulfide bonds make a substantial contribu-tion to the enthalpy change of protein unfolding. Their view isrejected by most researchers who study protein thermo-dynamics. In the light of the results of the study by Cooperet al.10, and considering the structure of a disulfide bond,rationalize the long-standing view of the scientific communityto the thermodynamic role of disulfide bonds in proteins.
19. The Gibbs paradox: consider two gas bulbs separated by astopcock. The stopcock is closed. Both bulbs are filled with thesame inert gas at the same concentration. What is the change inentropy when the stopcock is opened?
20. Is it possible for heat to be taken in to a system and convertedinto work with no other change in the system or surroundings?Explain.
21. Organisms are highly ordered, and they continually createhighly ordered structures in cells from less-ordered nutrient
8 Brownian motion is named after the Scottish botanist Robert Brown, who was thefirst to observe it, in 1827.
9 See Doig, A. J. & Williams, D.H. (1991). Is the hydrophobic effect stabilizing ordestabilizing in proteins – the contribution of disulfide bonds to protein stability.J. Mol. Biol, 217, 389–98.
10 See Cooper, A., Eyles, S. J., Radford, S. E. & Dobson, C.M. (1992). Thermodynamicconsequences of the removal of a disulfide bridge from hen lysozyme, J. Mol. Biol,225, 939–43.
82 THE SECOND LAW OF THERMODYNAMICS

molecules. Does this mean that organisms violate the SecondLaw of Thermodynamics? Explain.
22. The process whereby the Earth was formed and living organ-isms grew increasingly complex with time is “essentiallyirreversible,” says Thomas Huxley. It “gives rise to an increaseof variety and an increasingly high level of organization.” Thus,this process appears not to square with the Second Law ofthermodynamics. Explain.
23. It would appear that all living organisms on Earth are, essen-tially, isothermal systems. Relatively few organisms live wherethe surroundings are at a higher temperature than they are.Rationalize this observation in thermodynamic terms.
24. Tube worms thrive at black smokers at the bottom of the ocean.These invertebrates live as long as 250 years, longer than anyother known spineless animal. Tubeworms have no mouth,stomach, intestine, or way to eliminate waste. The part of theworm that produces new tube material and helps to anchor theworm in its protective tube, a chitin proteoglycan/proteincomplex, is often planted deep within the crevices of a blacksmoker. The soft, bright-red structure (made so by hemoglobin)at the other end of the worm serves the same purpose as amouth and can be extended or retracted into the surroundingwater. Giant tubeworms are over 1 m long, and they have tocope with a dramatic temperature gradient across their length.The temperature at a worm’s plume is about 2 !C, just above thefreezing point of pure water at 1 atm, while that at its base isabout 30 !C! Can tube worms be modeled as isothermal sys-tems? Why or why not?
25. Individual model hydrogen bond donors and acceptors do notoften form hydrogen bonds in aqueous solution. Why not?
26. You may have noted that Carnot’s formulation of the SecondLaw of Thermodynamics involves a very bold and unusuallystrong word: “impossible.” Is this always true? Why or why not?
27. The contraction of rubber is largely an entropic phenomenon.What are the sources of the enthalpic component?
28. Recall the example used to illustrate the entropy change in thesurroundings when a mole of liquid water is formed frommolecular hydrogen and molecular oxygen at 298 K. Use thedata given in the text to calculate the entropy change per watermolecule formed.
29. Protonation of the side chains of Glu and Asp is mainly anentropic effect. Why is this not true of His as well?
30. Show that when a system gains heat reversibly from surround-ings held at constant temperature, there is no change in entropy.
EXERCISES 83
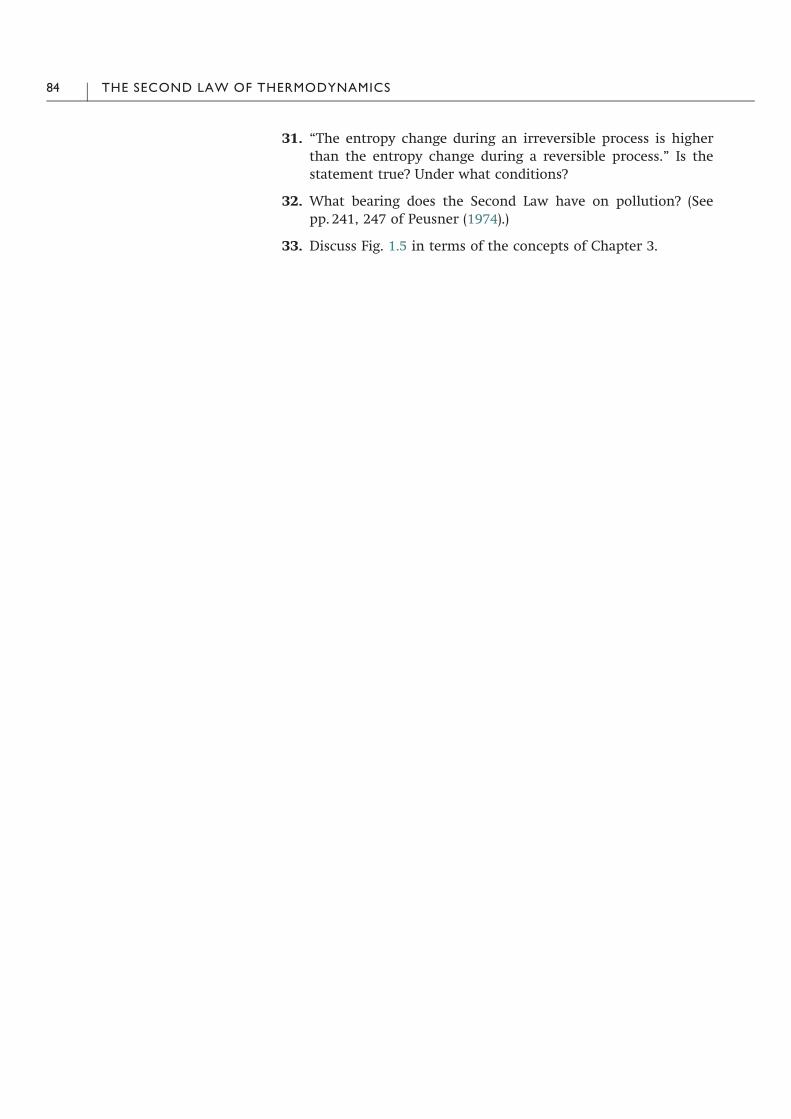
31. “The entropy change during an irreversible process is higherthan the entropy change during a reversible process.” Is thestatement true? Under what conditions?
32. What bearing does the Second Law have on pollution? (Seepp. 241, 247 of Peusner (1974).)
33. Discuss Fig. 1.5 in terms of the concepts of Chapter 3.
84 THE SECOND LAW OF THERMODYNAMICS
Chapter 4
Gibbs free energy – theory
A. Introduction
This chapter discusses a thermodynamic relationship that providesa basis for explaining spontaneous chemical reactivity, chemicalequilibrium, and the phase behavior of chemical compounds. Therelationship involves a thermodynamic state function that enablesprediction of the direction of a chemical reaction at constant tem-perature and pressure. The constraints of fixed T and p might seemannoyingly restrictive, because they are less general than therequirements of the Second Law, but in fact the gains made onimposing the constraints will outweigh the losses. How is that? Onereason is at any given time an individual organism is practically atuniform pressure and temperature (but be sure to see the Exercises atthe end of the chapter). Another is that constant temperature andpressure are the very conditions under which nearly all bench-topbiochemistry experiments are done. Yet another is that, although thetotal entropy of the universe must increase in order for a process tobe spontaneous, evaluation of the total entropy change requires mea-surement of both the entropy change of the system and the entropychange of the surroundings. Whereas 1Ssystem can often be foundwithout too much difficulty, albeit only indirectly, 1Ssurroundings canbe hard to measure! How could one measure the entropy change ofthe rest of the universe? The subject of the present chapter providesa way around the difficulty.
A particularly clear example of the inadequacy of 1Ssystemto predict the direction of spontaneous change is given by thebehavior of water at its freezing point. Table 4.1 shows the thermo-dynamic properties of water for the liquid! solid phase transition.The decrease in internal energy (which is practically identical to theenthalpy as long as the number of moles of gas doesn’t change; seeChapter 2) would suggest that water freezes spontaneously in therange 263–283K. Going on internal energy alone, spontaneousfreezing would seem even more probable at #10
!C than at $10
!C,

because 1U for this system becomes increasingly negative, meaningthat the internal energy of the system decreases, with increasingtemperature. The entropy change too is negative at all three tem-peratures, consistent with the solid state being more ordered thanthe liquid one. So the sign andmagnitude of the entropy of the systemdoes not predict the direction of spontaneous change (unless thesystem is isolated).
In contrast to 1U (which is hardly different from 1H in this case)and 1S, the last column, 1G, matches what we know about thephysical chemistry of water: below 0 !C, it freezes spontaneously(1G<0), at 0 !C solid water and liquid water coexist (1G" 0), andabove 0 !C, ice is unstable (1G> 0). 1G is negative for what we know is aspontaneous process, and it is positive for the reverse process (Table 4.2). Aswe know from experience, a stretched rubber band will contractwhen released. What is the sign of 1G for this process? Negative! 1Sis large and positive, making $T1S negative, and 1H is negative.More generally, 1G< 0 is a basis for explaining chemical reactivity,equilibrium, and phase behavior. Providing a good understanding of theGibbs free energy and how the biochemist can use it is one of themost important purposes of this book.
The thermodynamic state function of chief interest in this chapteris G, the Gibbs free energy. This quantity is an eponym of JosiahWillard Gibbs (1839–1903),1 the American theoretical physicist and
Table 4.1. Thermodynamics of the liquid! solid transition of water at 1 atm pressure
Temperature(!C)
1U( J mol$1)
1H( J mol$1)
1S( J mol$1 K$1)
$T1S( J mol$1)
1G( J mol$1)
$10 $5619 $5619 $21 5406 $2130 $6008 $6008 $22 6008 0
$10 $6397 $6397 $23 6623 $226
Table 4.2. Sign of 1G and direction of change
Sign of 1G Direction of change
1G> 0 The forward reaction is energetically unfavorable,the reverse reaction proceeds spontaneously
1G" 0 The system is at equilibrium, there is no furtherchange
1G< 0 The forward reaction is energetically favorable,the forward reaction proceeds spontaneously
1 Gibbs was the fourth child and only son of Josiah Willard Gibbs, Sr, professor ofsacred literature at Yale University. In 1863 the younger Gibbs became the firstperson to receive the doctorate in engineering in the USA. Gibbs never married,lived with his sister, and spent all of his life in New Haven, Connecticut, apart from
86 GIBBS FREE ENERGY – THEORY

chemistwhowas thefirst todescribe it. Like its cousinsU andH,whichwemet in Chapter 2, G is measured in units of joules. If all these statefunctions have the same units, what distinguishes G from U and H?What sort of energy is the Gibbs free energy?
Free energy is energy that is available in a form that can be used to dowork. You should not find this statement terribly surprising.Remember from the last chapter that some energy is not free to dowork; heat transfer always generates waste heat, and waste heatcannot be used to do work. The Gibbs free energy measures themaximum amount of work that can be done by a process going fromnon-equilibrium to equilibrium (at constant temperature and pres-sure). The First and Second Laws place boundaries on what is pos-sible in extremely general terms. The Gibbs free energy tells us howmuch work can be done by a system under the constraints of theFirst Law, the Second Law, constant temperature, and constantpressure. But there is no law of free energy!
Like H and U, G is defined for macroscopic systems, ones thatinvolve a very large number of particles. This implies that, althoughmeasurement of 1G does tell us how much work must be done toconvert one state of a system into the other, or how much workcould be done by a process, it does not explain why that much workshould done. Nevertheless, thermodynamics is often all the moreuseful for its very power in dealing with systems described in qua-litative of terms. For instance, a microcalorimeter enables theenthalpy change of a process, say, the unfolding of a protein, to bemeasured directly and with extraordinary accuracy, regardless ofhow little or much one knows about the structure of the protein.And a bomb calorimeter can be used to measure the heat of com-bustion of a beignet from Cafe du Monde in New Orleans or a cremebrule from the Latin Quarter in Paris without knowing the slightestthing about ingredients, shape, structure of the molecules involved,or the nature of the interactions in either case. Indeed, one need nothave heard of beignets to record good combustion data! A biophy-sicist can measure the heat effects of pure protein or DNAmoleculeswhose three-dimensional structures are not known in detail. Whena molecular interpretation of thermodynamic quantities is needed,one turns to a branch of physical chemistry called statisticalmechanics (Chapter 6).
G is a thermodynamic potential function. As such, it is analogous tothe gravitational potential function of classical mechanics, whichdescribes how the gravitational energy of an object varies with posi-tion inagravitational field. If you takea coinout of yourpocket and letit go, it will change position spontaneously and rapidly! The coin fallsbecause its gravitational potential energy is greater in the air than on
three years in Europe shortly after the American Civil War. He was appointedprofessor of mathematical physics at Yale University in 1871. Gibbs is arguably themost famous American-born scientist to date, owing partly to the promotion of hiswork by Maxwell.
INTRODUCTION 87

the ground, and air gives relatively little resistance to a change ofposition. The coinmoves down its gradient of gravitational potential.A potential function, like G, permits prediction of whether a systemwill change or stay the same under given conditions.
Of course any change in a system will happen at some rate –some extent of change per unit time. As we shall see, though, youdon’t need to know the rate of a reaction in order to say whether itwill occur spontaneously. And the rate of a reaction is no predictorof the energy difference between reactants and products. But let’skeep things simple and focus on energy differences here and tacklereaction rates in Chapter 8.
Finally, the mathematics of this chapter will be a little rougherride than earlier on, so fasten your seatbelt. Don’t worry, though,because we’ll find that we can make the complete journey withoutanything more perplexing than algebraic equations and the oddlogarithm. The ideas themselves will always be considered moreimportant than the specific mathematical tricks by which theresults are obtained. This is not to imply that the mathematics isunimportant; it’s to put our priorities in proper order. Mathematicsmay be Queen of the Sciences, but Applied Mathematics is definitelyHandmaid of the Sciences. Those who are prepared for a moredemanding mental journey and wish to explore an all-terrain-vehicle treatment of the subject might consider consulting the moreadvanced references at the end of the chapter.
B. Equilibrium
We turn now to the very important concept of chemical equili-brium. It was first proposed by the Norwegian chemists Cato Max-imilian Guldberg (1836–1902) and Peter Waage (1833–1900) in the1860s, in the form of the law of mass action: when a system is atequilibrium, an increase (decrease) in the amount of reactants(products) will result in an increase (decrease) in the amount ofproducts (reactants). An equilibrium system responds to change byminimizing changes in the relative amounts of reactants and pro-ducts. For example, suppose we have a solution of our favoriteprotein molecule. At equilibrium some molecules will be in thefolded state (reactant), some in the unfolded state (product). Nowadd a dash of protease. In the usual case, unfolded proteins aremuch more susceptible to proteolytic attack than folded proteins. Ifa proteolyzed protein is unable to refold, proteolysis will change thebalance of folded proteins and unfolded ones. By the law of massaction, the response of the system to the decrease in the numberunfolded proteins will be for folded proteins to unfold, in order tominimize the change in the relative amounts of reactants and pro-ducts. Equilibrium is such an important concept that the Swedishchemist Svante August Arrhenius (1859–1927) called it “the centralproblem of physical chemistry.” That was in 1911, eight years after
88 GIBBS FREE ENERGY – THEORY
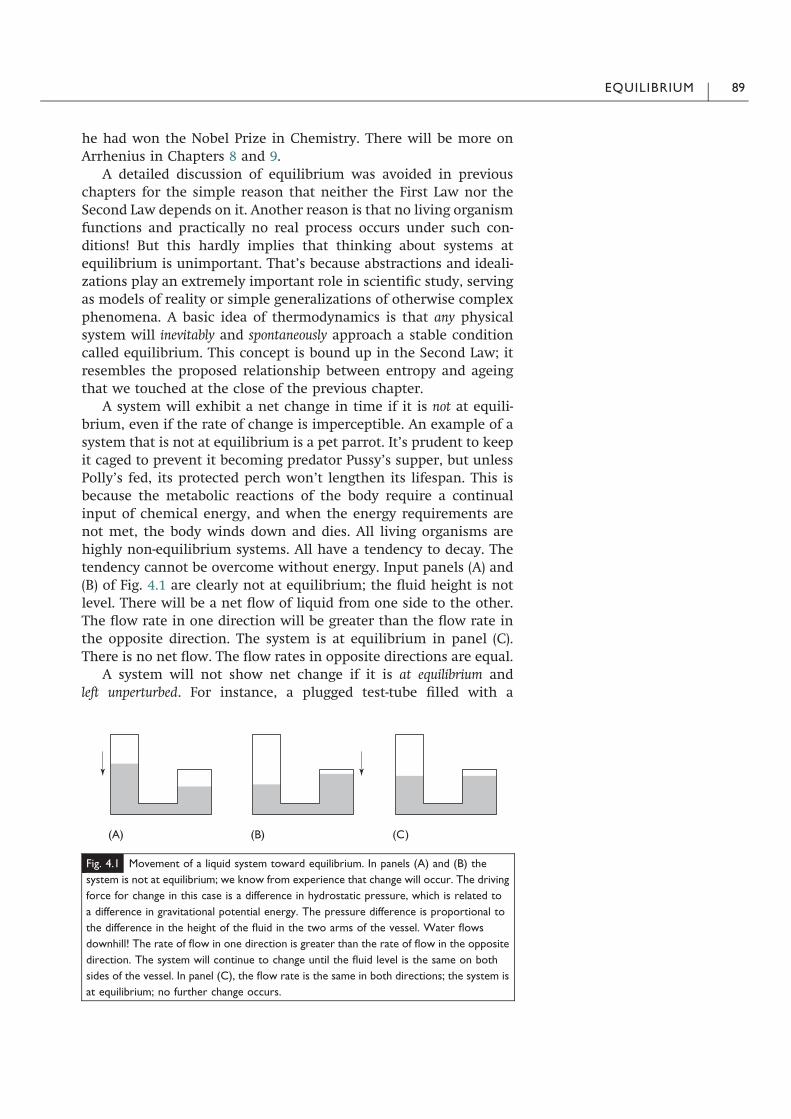
he had won the Nobel Prize in Chemistry. There will be more onArrhenius in Chapters 8 and 9.
A detailed discussion of equilibrium was avoided in previouschapters for the simple reason that neither the First Law nor theSecond Law depends on it. Another reason is that no living organismfunctions and practically no real process occurs under such con-ditions! But this hardly implies that thinking about systems atequilibrium is unimportant. That’s because abstractions and ideali-zations play an extremely important role in scientific study, servingas models of reality or simple generalizations of otherwise complexphenomena. A basic idea of thermodynamics is that any physicalsystem will inevitably and spontaneously approach a stable conditioncalled equilibrium. This concept is bound up in the Second Law; itresembles the proposed relationship between entropy and ageingthat we touched at the close of the previous chapter.
A system will exhibit a net change in time if it is not at equili-brium, even if the rate of change is imperceptible. An example of asystem that is not at equilibrium is a pet parrot. It’s prudent to keepit caged to prevent it becoming predator Pussy’s supper, but unlessPolly’s fed, its protected perch won’t lengthen its lifespan. This isbecause the metabolic reactions of the body require a continualinput of chemical energy, and when the energy requirements arenot met, the body winds down and dies. All living organisms arehighly non-equilibrium systems. All have a tendency to decay. Thetendency cannot be overcome without energy. Input panels (A) and(B) of Fig. 4.1 are clearly not at equilibrium; the fluid height is notlevel. There will be a net flow of liquid from one side to the other.The flow rate in one direction will be greater than the flow rate inthe opposite direction. The system is at equilibrium in panel (C).There is no net flow. The flow rates in opposite directions are equal.
A system will not show net change if it is at equilibrium andleft unperturbed. For instance, a plugged test-tube filled with a
Fig. 4.1 Movement of a liquid system toward equilibrium. In panels (A) and (B) the
system is not at equilibrium; we know from experience that change will occur. The driving
force for change in this case is a difference in hydrostatic pressure, which is related to
a difference in gravitational potential energy. The pressure difference is proportional to
the difference in the height of the fluid in the two arms of the vessel. Water flows
downhill! The rate of flow in one direction is greater than the rate of flow in the opposite
direction. The system will continue to change until the fluid level is the same on both
sides of the vessel. In panel (C), the flow rate is the same in both directions; the system is
at equilibrium; no further change occurs.
EQUILIBRIUM 89

biochemical buffer and kept at constant temperature will not change(barring bacterial contamination and chemical degradation, ofcourse). The system is in a rather stable equilibrium. A less stableequilibrium might be a heavy snow lying peacefully on a moun-tainside. Demonstration of the tenuous nature of this equilibriumcould be regrettable for anyone or anything nearby: for a slight dis-turbance could turn a huge pile of resting snow into a ragingavalanche! Another example of an unstable equilibrium is a balancedseesaw. The weights on either side of the fulcrum need not be equal,but if they are unequal, adjustments must be made in their distancesfrom the fulcrum to achieve a balance, as in Newton’s laws ofmechanics (Fig. 4.2). What might be called a semi-stable equilibriumis one in which the energy of the system is at a minimum but not atthe lowest possible minimum. For example, suppose a rock is restingat the bottom of a ravine between two hills. The rock will not leap upspontaneously and move elsewhere! If given a hard enough kick,though, itmight roll up the side of the ravine, reach the crest of a hill,and tumble down the hill into the valley below. Various types ofequilibrium are summarized in Fig. 4.3. The equilibrium state is onein which no further macroscopic change takes place because allforces acting on the system are balanced.
Let’s look at the relationship of diffusion to equilibrium. Diffu-sion, a type of transport process, is important in many differentbiochemical reactions, for example, the chemical transmission ofnerve impulses across synapses. Figure 4.4 shows one of many waysin which diffusion can be illustrated. We have two miscible liquids,and for the sake of argument we suppose that one can be layeredaside the other, giving a sharp boundary, until we say “go.” The topsolution is colorless, like water, the bottom one opaque, like Indiaink. The densities are assumed to be about the same. Just aftermixing has begun, which occurs spontaneously, there is a largeconcentration gradient across the boundary. But we know that thissituation is unstable and will not persist. The result after a long timeis that the dark liquid will be distributed uniformly throughout thecombined volume.
Fig. 4.2 Equilibrium. We know from experience that if the weights are the same, as in
panel (A), the distance of each weight from the fulcrum must be the same. But if the
weights are different, as in panel (B), the distance from the fulcrum cannot be the same.
The lighter weight must be farther from the fulcrum than the heavier weight. By Newton’s
Second Law, at equilibrium the clockwise torque equals the counterclockwise torque,
where torque"mass · gravitational acceleration · distance from fulcrum.
90 GIBBS FREE ENERGY – THEORY

Fig. 4.3 Different types of equilibrium. The non-equilibrium situation will change
immediately. The unstable equilibrium, like the snow at rest on a mountainside, will not
change without the addition of energy. But the amount of energy needed to get over the
barrier is very small. There are two main types of energy minimum: local minimum and
global minimum. A local minimum has the lowest energy in the vicinity. The global
minimum has the lowest free energy of all. An ongoing debate in protein folding research is
whether the folded state of a protein corresponds to a local or a global free energy
minimum. In some case, the functional state of a protein or enzyme might be a kinetically
trapped conformation.
Fig. 4.4 Mixing. At time t" 0,
when the partition is removed, the
liquids are completely separate. The
liquids are miscible so mixing
occurs. After a sufficiently long time,
the liquids are completely mixed.
The unmixed state has a maximum
of free energy for the system and a
minimum of entropy. The
completely mixed state has a
minimum of free energy and a
maximum of entropy. Based on
Fig. 1.5 of van Holde (1985).
EQUILIBRIUM 91
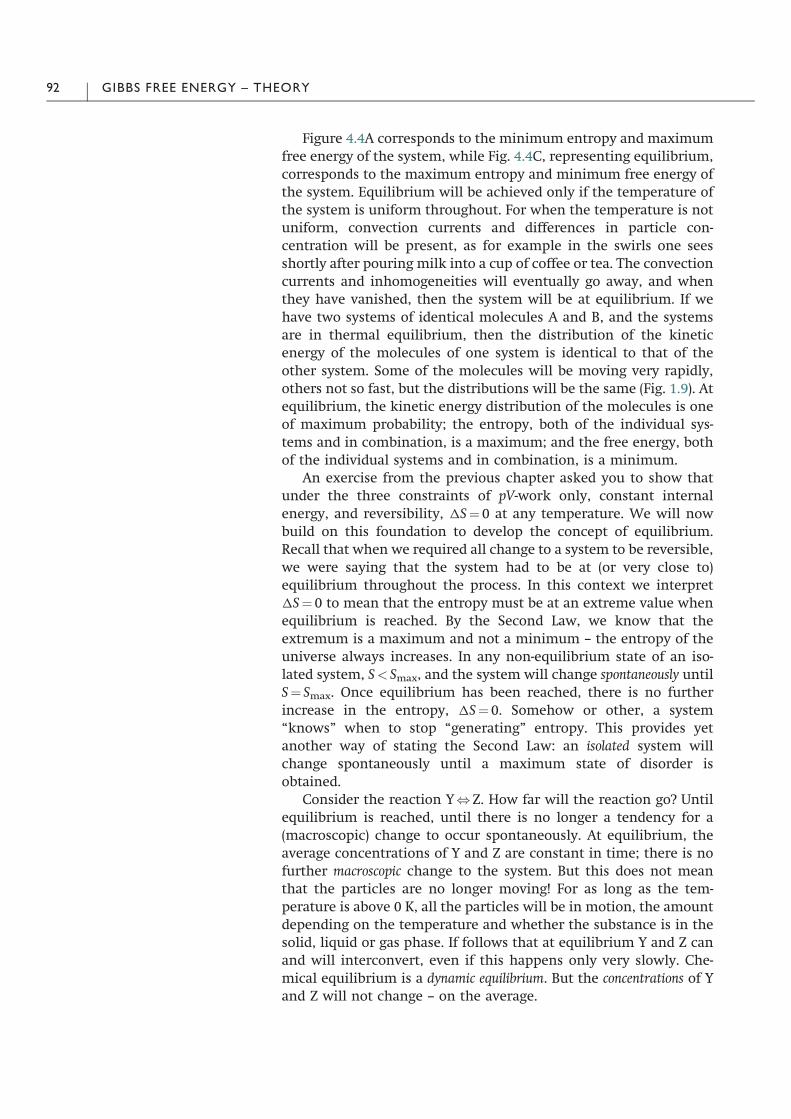
Figure 4.4A corresponds to the minimum entropy and maximumfree energy of the system, while Fig. 4.4C, representing equilibrium,corresponds to the maximum entropy and minimum free energy ofthe system. Equilibrium will be achieved only if the temperature ofthe system is uniform throughout. For when the temperature is notuniform, convection currents and differences in particle con-centration will be present, as for example in the swirls one seesshortly after pouring milk into a cup of coffee or tea. The convectioncurrents and inhomogeneities will eventually go away, and whenthey have vanished, then the system will be at equilibrium. If wehave two systems of identical molecules A and B, and the systemsare in thermal equilibrium, then the distribution of the kineticenergy of the molecules of one system is identical to that of theother system. Some of the molecules will be moving very rapidly,others not so fast, but the distributions will be the same (Fig. 1.9). Atequilibrium, the kinetic energy distribution of the molecules is oneof maximum probability; the entropy, both of the individual sys-tems and in combination, is a maximum; and the free energy, bothof the individual systems and in combination, is a minimum.
An exercise from the previous chapter asked you to show thatunder the three constraints of pV-work only, constant internalenergy, and reversibility, 1S" 0 at any temperature. We will nowbuild on this foundation to develop the concept of equilibrium.Recall that when we required all change to a system to be reversible,we were saying that the system had to be at (or very close to)equilibrium throughout the process. In this context we interpret1S"0 to mean that the entropy must be at an extreme value whenequilibrium is reached. By the Second Law, we know that theextremum is a maximum and not a minimum – the entropy of theuniverse always increases. In any non-equilibrium state of an iso-lated system, S< Smax, and the system will change spontaneously untilS" Smax. Once equilibrium has been reached, there is no furtherincrease in the entropy, 1S"0. Somehow or other, a system“knows” when to stop “generating” entropy. This provides yetanother way of stating the Second Law: an isolated system willchange spontaneously until a maximum state of disorder isobtained.
Consider the reaction Y,Z. How far will the reaction go? Untilequilibrium is reached, until there is no longer a tendency for a(macroscopic) change to occur spontaneously. At equilibrium, theaverage concentrations of Y and Z are constant in time; there is nofurther macroscopic change to the system. But this does not meanthat the particles are no longer moving! For as long as the tem-perature is above 0 K, all the particles will be in motion, the amountdepending on the temperature and whether the substance is in thesolid, liquid or gas phase. If follows that at equilibrium Y and Z canand will interconvert, even if this happens only very slowly. Che-mical equilibrium is a dynamic equilibrium. But the concentrations of Yand Z will not change – on the average.
92 GIBBS FREE ENERGY – THEORY

If a process is made to occur through a succession of near-equili-brium states, the processmust be slow, allowing the system to come toequilibrium after each small change. Real processes necessarily occurat a finite rate, so the best one can achieve in practice is a near-rever-sible process. Many biological macromolecules, for example smallproteins, exhibit highly reversible order–disorder transitions (> 95%)on thermal or chemical denaturation. It would appear in such casesthat all the information required for the protein to fold to its nativestate is present in the matter it’s made of, i.e. in the amino acidsequence. We’ll return to protein folding in later chapters.
There are a number of other important features of the equili-brium state. One is that for a system truly to be at equilibrium, it must beclosed. For example, if an unopened Pepsi can has reached thermalequilibrium, the contents will be at equilibrium. The amount ofcarbonic acid present and the amount of gaseous CO2 will be con-stant, even if individual CO2 molecules are constantly escaping fromthe liquid and returning thither. On opening the can, there will be avery rapid change in pressure and a jump to a non-equilibrium state.And a net loss of CO2 will ensue for three main reasons. One, thesystem will no longer be closed, and gaseous CO2 will escapeimmediately. Two, the decrease in abundance of CO2 gas near theliquid–gas interface will promote the loss of CO2 from the liquid.And three, if the can is held in your hand and not kept on ice, itscontents will begin warming up, and this will drive off CO2 becausethe solubility of the gas varies inversely with the temperature. Weinfer from all this that for a system to remain at equilibrium, vari-ables such as T, p, V, and pH must be constant. For if any of themshould change, or if the concentration of any component of thesystem should change, a non-equilibrium state would result, and thesystem as a whole would continue to change until equilibrium wasreached.
C. Reversible processes
Now it’s time for a mathematical statement of the Gibbs free energy:
G " H$ TS: %4:1&
We see that G is a sort of combination of the First and Second Laws,as it involves both enthalpy and entropy. We must bear in mind,though, that the temperature and pressure are constant for G topredict the direction of spontaneous change of a system.
What can be done with Eqn. (4.1)? For an incremental measur-able change in G,
1G " 1H$ T1S$ S1T: %4:2&
If T is constant, the last term on the right-hand side vanishes,leaving 1G"1H$ T1S. This tells us that the gain in useful work
REVERSIBLE PROCESSES 93

from an isothermal system must be less than the gain in energy orenthalpy (1H). The difference is measured by the product of gain inentropy (1S) and the temperature at which the reaction occurs.T1S is “isothermally unavailable energy.” 1G is also the minimumwork required to take a system from one equilibrium state toanother.
Let’s require that pV-work only be done in a reversible system.Then, because 1U" T1S$ p1V, H"U# pV, and 1H"1U# p1V#V1p, substitution into Eqn. (4.2) gives 1G" [(T1S$ p1V)# p1V#V1p]$ T1S$ S1T, which simplifies to
1G " V1p$ S1T: %4:3&
If we further require p and T to be constant, then 1G"0. Just aswith 1S, we interpret this to mean that a reversible system has amaximal or minimal value of G when T and p are constant and thesystem is at equilibrium. In this case, and opposite to the entropy,the extremum is a minimum, just as with gravitational potential. Inother words, the magnitude of 1G measures the extent of dis-placement of the system from equilibrium, and 1G"0 for a systemat equilibrium.
Now we are positioned to see how the Gibbs free energy can beof great utility in predicting the direction of a process in a closedbiochemical system. Have another look at Table 4.1, particularlythe 1G column. When 1G is positive (if the energy change isendergonic), the process will not occur spontaneously. This is becausethe final state of the process has a higher free energy than theinitial state, and this can be achieved only at the expense of theenergy of the surroundings. When 1G is negative for a process (ifthe energy change is exergonic), the reaction proceeds spontaneouslyin the direction of equilibrium, and when equilibrium is reachedno further change will occur. For any real process to occur spontaneouslyat constant temperature and pressure, the Gibbs free energy change must benegative. Equation (4.1) shows that the lower the enthalpy (energy),the lower G, and the higher the entropy, the lower G. This tells usthat spontaneity of a reaction is favored by a reduction of enthalpy(exothermic reactions) and by an increase of entropy (heat-releasingleading to increased disorder or increased energy that cannot beused to do work).
It must be emphasized that while the magnitude of 1G tells us the size ofthe driving force in a spontaneous reaction, 1G says nothing at all about thetime required for the reaction to occur. Real physical, chemical, andbiological processes occur at a finite rate, and all real chemicalreactions are, to some extent, irreversible. Nevertheless, the basicprinciples of thermodynamics hold. Reversibility can be approachedin the real world of biochemistry by having the process take place ina controlled manner, and that is what the biochemist often aims todo by studying reactions in vitro. The rate of a reaction will bedeveloped in Chapter 8.
94 GIBBS FREE ENERGY – THEORY

D. Phase transitions
We have already encountered phase transitions in two differentcontexts in this book: in likening the thermal denaturation of aprotein molecule to the melting of an organic crystal, and indescribing the physical properties of water. A phase is a system orpart of a system that is homogeneous and has definite boundaries. Aphase need not be a chemically pure substance. A phase transition isordinarily caused by heat uptake or release, and when a phasechange does occur it is at a definite temperature and involves adefinite amount of heat. Phase changes are associated with a varietyof fascinating and general aspects of biological thermodynamics.Let’s take a few minutes to know more about them!
Phase transitions might look simple “from the outside;” in factthey are actually rather complex. No one really knows how todescribe a phase change on the level of individual particles, thoughquantum mechanics must come into play at some level. Never-theless, it is possible to give a description of a phase change on themacroscopic level in terms of classical thermodynamics. Someenergetic quantities, for instance enthalpy and entropy, exhibit adiscontinuous change at a phase boundary. What this means is thatthe enthalpy curve with temperature has the shape of a “step”;there is an abrupt change as the solid becomes a liquid or theliquid a solid, not a smooth change. Same for entropy. (See Fig. 4.5.)The amount of heat exchanged on melting or boiling is a heatcapacity change, the latent heat of melting or vaporization,respectively. There is a relatively large change in heat capacity overan extremely small temperature range on a change of phase. Tran-sitions of this type are “all-or-none” transitions; the material iscompletely in one phase on one side of the phase boundary andcompletely in another phase on the other side of the phaseboundary. The two phases can coexist at the transition temperature.Such transitions are known as first-order phase transitions. Thesetransitions resemble the “catastrophes” of an area of mathematicsimaginatively called catastrophe theory. In many cases proteinfolding/unfolding closely resembles a first-order phase transition,for example, hen egg white lysozyme in Chapter 2. In more com-plicated situations, for example, gradual unfolding with heatincrease, such a description is clearly inadequate (see Chapter 6).
Fig. 4.5 First-order phase
transition. The graphs show the
behavior of the enthalpy and entropy
functions versus temperature. Both
of these thermodynamic quantities
are discontinuous at the transitiontemperature, as is Cp.
PHASE TRANSITIONS 95

The phase transition in water from the solid state to the liquid stateis a first-order phase transition.
The liquid–solid phase boundary of water plays a key role in lifeon Earth – in more than one way. For instance, when the tem-perature drops, water begins to freeze on the surface of a pond, notat the bottom, and ice remains up top. Water on the surface loses itsheat to the surroundings, the temperature of which can dip wellbelow 0 !C. The density of solid water is lower than that of theliquid. Water is a peculiar substance! The physical properties ofwater also play a critical role in determining the level of the oceansand shaping the world’s weather, determining what fraction of theoceans’ water is liquid and how much is in the polar icecaps. Inshort, water determines the character of the biosphere.
Less well-known and obvious than the phase changes of water andproteins, perhaps, are those of lipids. These mainly water-insolublemolecules can undergo changes in state just as other compounds do.We say “mainly water-insoluble” because lipids are made of twoparts, a small water-soluble “head” and a long water-insoluble “tail”(Fig. 4.6). In bilayers, which are surfaces of two layers of lipids in
Fig. 4.6 Lipid bilayers. Lipids, or phospholipids, have two main regions, a polar “head” and aliphatic “tails.” The head group is
in contact with the solvent in a lipid bilayer, as shown. Sphingomyelins are the most common of the sphingolipids, which together
form a major component of biological membranes. Sphingomyelins are just one type of phospholipid. The myelin sheath that
surrounds and electrically insulates many nerve cell axons is rich in sphingomyelin. The most abundant steroid in animals is
cholesterol. The metabolic precursor of steroid hormones, cholesterol is a major component of animal plasma membranes. In
animals or plants, biological membranes are highly heterogeneous. They include not just several kinds of lipids and cholesterol, but
membrane-spanning and membrane-associated proteins as well. At physiological temperatures, membranes are gel-like and allow
lateral diffusion of their components.
96 GIBBS FREE ENERGY – THEORY

which the tails face each other, lipids can be in the liquid crystallineor gel state. This is an intermediate level of organization between thesolid state, which is rigid, and the liquid state, which is fluid. The gelstate is the one in which lipids are found in the membranes of thecells of living organisms. In pure lipid bilayers, there is a definitemelting temperature between the solid state and the gel state, just asthere is for water at the liquid–gas phase boundary and for a proteinlike lysozyme between its folded and unfolded states. The solid–geltransition of pure lipid bilayers is highly cooperative, also similar tothe behavior of water and some proteins. Decreasing the purity of abilayer, for instance by introducing a second type of lipid that ismiscible with the first or by adding transmembrane proteins, thecooperativity of the solid–gel transition shows a correspondingdecrease. Biological membranes in the living organism are highlyheterogeneous: they are made of lipids in the fluid–lamellar phase,proteins, and some carbohydrate. Such membranes therefore do notexhibit very cooperative transitions, andmelting occurs over a rangeof temperatures, usually 10–40 !C.
Other physical properties of lipids influence bilayer fluidity. Oneis length of the non-polar hydrocarbon tails (Fig. 4.7). The longer thechain, the higher the transition temperature. This is because thehydrophobic stuff of one lipid can interact fairly strongly withthe hydrophobic stuff of another lipid. Another is the degree ofsaturation of the carbon–carbon bonds in the tails. Unsaturatedbonds (double bonds) introduce kinks into the chain, making itmore difficult for lipids in a bilayer to form an orderly array. Var-iation in the number and location of double bonds ensures that bio-logical membranes do not become rigid. A contributor to membranerigidity is lipid-soluble cholesterol, which decreases membranefluidity by disrupting orderly interactions between fatty acid tails.Cholesterol� itself� is� a� rigid� molecule� (Fig.� 4.6).� The� melting� tem-perature also depends on solute and counter ion concentration! Thephysical properties of lipids, which are evidently complex, are of
Fig. 4.7 Membrane melting
temperature. In general, the melting
temperature of a phospholipid
bilayer decreases with increasing
heterogeneity. An exception to the
rule is cholesterol, which increases
the melting temperature by
increasing the rigidity of the bilayer.
Increasing the number of double
bonds in the aliphatic tail in lipids
decreases the melting temperature
by decreasing the ability of the
molecules to pack against each
other. A double bond introduces a
kink in the tail. Increasing the length
of the tail increases the melting
temperature, because the aliphatic
portions of lipids can interact
favorably with each other by means
of van der Waals forces. Redrawn
from Fig. 7 of Bergethon (1998).
PHASE TRANSITIONS 97

vital important to the cell. Biological membranes permit membrane-bound proteins some degree of lateral movement, enable the cell tochange shape and migrate, and make tissue formed by millions ofcells relatively soft to the touch. Would a baby so enjoy nourishingitself at its mother’s breast if her nipples were no more flexible thanfingernails?
E. Chemical potential
Life as we know it could not exist without water. Small wonder thatThales of Miletus (fl. c. 500 BCE) considered water the ultimate sub-stance, or Urstoff, the stuff of which all things are made! All physio-logical biochemical reactions take place in a largely aqueousenvironment, from enzyme catalysis to the folding of proteins to thebinding of proteins to DNA to the assembly of large macromolecularcomplexes. It is probable that life on Earth began in a primordial seaof salt water (if it did not arrive from space). We had therefore betterdevote some energy to learning the basics of the thermodynamics ofsolutions. The path we shall take towards greater understanding willinvolve scaling a few jagged mathematical formulas, but the view weshall have at the end of the journey will make the effort worthwhile.
If you have doubted the usefulness of mathematics in previousstudy of biochemistry, it might help to bear in mind that mathe-matics is to biochemistry as a protocol is to producing a biochemicalresult. Mathematics is handmaiden, not master. Nevertheless, pro-tocols themselves can be extremely useful, particularly when theyare rather general in scope. One of the most highly cited scientificjournal articles of all time is one of the most boring biochemistryarticles ever published. This is because it has to do with a techniquefor separating proteins on the basis of size and says nothing specificabout biology. But the paper in question is very important becausethe method it outlines (polyacrylamide gel electrophoresis) can beused in a very broad range of situations. In this sense, the protocol iseven more important than any particular result it might be used toproduce. In the same way, getting to know something of themathematical background to a formula can be worth the time andeffort, because the sort of thinking involved is in many cases ofgeneral utility.
Being quantitative about free energy changes is a matter of bothbeing careful in making measurements and being clear about theconventions onehas adopted. Teaching thefirst of these is beyond thescope of this book! To do the latter, we need to return to a topicintroduced in Chapter 2: the standard state. Previously, we defined thestandard enthalpy change, 1H!, as the change in enthalpy for a pro-cess in which the initial and final states of one mole of a pure sub-stance are at 298 K and 1 atm. Nowwe wish to define the standard freeenergy change,1G!. Here, the superscript indicates unit activity at stan-dard temperature (298.15 K; three significant digits are usually
98 GIBBS FREE ENERGY – THEORY

enough) and pressure (1 atm). The activity of a substance, a conceptintroduced by the American Gilbert Newton Lewis (1875–1946), is itsconcentration after correcting for non-ideal behavior, its effectiveconcentration, its tendency to function as a reactant in a given che-mical environment. There are many sources of non-ideality, animportant one being the ability of a substance to interact with itself.
Ideal behavior of solute A is approached only in the limit ofinfinite dilution. That is, as [A]! 0, !A! 1. In the simplest case, theactivity of substance A, aA, is defined as
aA " !A,A-; %4:4&
where !A is the activity coefficient of A on the molarity scale. When adifferent concentration scale is used, say the molality scale, a dif-ferent activity coefficient is needed. The concept of activity is basi-cally the same in both cases. According to Eqn. (4.4), 0< aA< [A]because 0< !A<1. Activity is a dimensionless quantity; the units ofthe molar activity coefficient are l mol$1.
Defining 1G! at unit activity, while conceptually simple, is pro-blematic for the biochemist. This is because free energy changedepend on the concentrations of reactants and products, and theproducts and reactants are practically never maintained at molarconcentrations throughout a reaction! Moreover, most reactions ofinterest do not occur at standard temperature. Furthermore, bio-chemistry presents many cases where the solvent itself is part of areaction of interest. We need a way to take all these considerationsinto account when discussing free energy change.
The relationship between the concentration of a substance A andits free energy is defined as
„A $ „!A " RT ln aA; %4:5&
where !A is the partial molar free energy, or chemical potential, of A, and„!A is the standard state chemical potential of A. The partial molar
free energy of A is, in essence, just 1GA/1nA, or how the free energyof A changes when the number of molecules of A in the systemchanges by one (Fig. 4.8). The chemical potential of A is a function ofits chemical potential in the standard state and its concentration.Equation (4.5) could include a volume term and an electrical term(there are numerous other kinds of work, see Chapter 2), but let’sassume for the moment that the system does not expand against aconstant pressure and that no charged particles are moving in anelectric field. It is appropriate to call „ the chemical potentialbecause at constant T and p, G is a function of chemical compositionalone.
Equation (4.5) tells us that when aA" 1, „A $ „!A " 0. That is
„A $ „!A measures the chemical potential of A relative to the stan-
dard state conditions; the activity of a substance is 1 in the standardstate. The chemical potential also depends on temperature asshown, and the gas constant puts things on a per-mole basis.Equation (4.5) also says that the chemical potential of a solvent
Fig. 4.8 Thermodynamic potential
and solute concentration. The
Gibbs free energy of a solute varies
with concentration. The chemical
potential measures the rate of
change of G with n, or the slope of
the curve at a given value of n (1G/1n). Note that G can decrease or
increase on increases in
concentration.
CHEMICAL POTENTIAL 99

decreases as solute is added. The activity of a substance is alwayshighest when that substance is pure. The reduction in chemicalpotential on mixing occurs even if the solution is ideal (enthalpy ofmixing of zero),2 as in the case where the solute is “inert” and doesnot interact with the solvent at all. This tells us that the decrease inchemical potential on mixing is fundamentally an entropic effect,even if for any real solvent and solute the change in chemicalpotential will contain an enthalpic component stemming frominterparticle interactions.
Before getting too far down this road, let’s look at an examplethat is aimed at helping to clarify the difference between 1G! and1G (and thus 1„! and 1„). Suppose you’re doing a study of thebinding of a peptide hormone to a receptor situated in the plasmamembrane of a cell. The cheapest way to obtain large quantities ofpure hormone might be to synthesize it chemically and purify itusing a type of liquid chromatography – quite possibly no problemat all if the peptide does not have to be glycosylated. Suppose thatthe sequence of the peptide you’re studying is X–X–X–X–X–X–X–X–Ala–Gly, and because solid-phase chemical synthesis of peptides isdone from the C-terminus to the N-terminus (the reverse of how ithappens during translation of mRNA on a ribosome), the firstcoupling is of Ala to Gly attached to a resin. You’d like to knowsomething about the energetics of formation of the peptide bondbetween these two amino acids. But when two free amino acids jointo form a peptide bond, a water molecule is produced; the reaction is atype of dehydration synthesis. When the reaction occurs in aqueoussolution under standard state conditions – that is, all products and reac-tants are at a concentration of 1 M except water (we’ll say why lateron) – the free energy change, 1G!, is 4130 cal mol$1 – far fromequilibrium! The driving force for change is in the direction of thereactants. When Ala and Gly are at 0.1 M, and Ala–Gly is at 12.5 !M,the reactants and products are no longer in their standard states, andthe free energy difference is not1G! but1G. On doing an experimentto determine the energetics of peptide bond formation, one findsthat the reaction is at equilibrium and that no change in the con-centrations of reactants takes place unless the system is perturbed. Inother words,1G"0. If the concentrations are again changed, so thatAla and Gly are at 1M, as in the standard state reaction, but Ala–Gly isat 0.1 mM, you will find that the reaction proceeds in the direction ofthe products and 1G"$1350 cal mol$1. 1G on its own measureshow far away a reaction is from equilibrium, and1G$1G! measures
2 The given definition of an ideal solution is less general than it could be. We couldsay instead that an ideal solution is one for which the enthalpy of mixing is zero atall temperatures, implying that the solute always interacts with the solvent as itinteracts with itself. An even more technical definition is that an ideal solution is ahomogeneous mixture of substances whose physical properties are linearlyproportional to the properties of the pure components, which holds in fact formany dilute solutions. This is known as Raoult’s Law, after Francois-Marie Raoult(1830–1901), a French chemist.
100 GIBBS FREE ENERGY – THEORY

how much the conditions differ from the standard state conditions.Yippee!
Let’s have the discussion become a little more difficult. Supposewe have a two-component solution made of solvent and solute. Thesolute is some general substance A that is soluble in the solvent. Thesolvent could be water and the solute a metabolite. Assuming idealbehavior, aA" [A] and Eqn. (4.5) becomes
„A $ „!A " RT ln,A-: %4:6&
Let’s now construct a notional partition between two regions of thesolution and require that the system not be at equilibrium. Ourmental boundary could be a liquid–gas interface or a membranepermeable to A. Substance A in any case can move across theboundary and back again by random motion. Calling the two regionsof the solution fi and fl, the difference in chemical potentialbetween them is
1„A " „A;fl$„A;fi" RT ln%,A-fl=,A-fi&: %4:7&
The standard state terms have vanished because the standard statefree energy of A is the same in both regions. Intuitively, we wouldexpect 1„A<0 when [A]fi> [A]fl. When [A]fi> [A]fl, the argument ofthe logarithm ([A]fl/[A]fi) is less than one, and because lnx<0 for x<1,our expectation is met (Fig. 4.9). When 1„A is negative, the soluteparticle will move spontaneously down its concentration gradientfrom fi to fl. If the concentration is greater in region fi than region fl,1„A>0, and A will move spontaneously from fl to fi.
So far, so good. Backing up a couple of steps and combiningEqns. (4.4) and (4.5), we have
„1 " „!1 # RT ln !1,1- %4:8&
for component 1, the solvent. We can rewrite Eqn. (4.8) as
„1 " „!1 # RT ln f1X1; %4:9&
where f1 is the activity coefficient of component 1 on themole fraction
Fig. 4.9 Chemical potential
difference as a function of
concentration. The figure illustrates
the behavior of the left-hand side of
Eqn. (4.7) when the total
concentration of A is fixed;
[A]fi# [A]fl" constant. The dashed
line represents a change in
temperature.
CHEMICAL POTENTIAL 101

scale. The mole fraction Xi is the number of molecules of i (i.e. ni)expressed as a fraction of the total number of molecules in the system, n.In other words, Xi" ni/n. We are still dealing with a two componentsystem, so X1" n1/(n1# n2)" 1$X2, where X2 is the mole fraction ofsolute A; themole fractions of the individual components of solutionmust sum to 1.Writing RT lnf1X1 as RT lnf1#RT lnX1 (which we can dobecause lnab" lna# lnb), using ln(1# x)" x$ x2/2# x3/3 . . . (a rela-tionship from mathematics which is valid for $1< x<1), and rear-ranging terms, Eqn. (4.7) becomes
„1 $ „!1 " RT%$X2 # . . .& # RT ln f1: %4:10&
We can simplify this beastly equation in two ways if the solution isdilute (n2<< n1). One is that the “higher order” terms in X2 (namely, thesquare of X2, the cube of X2, etc.) are small because n2 and therefore X2 issmall. So we consciously neglect them! The other assumption is that
X2 ' C2V!1=M2; %4:11&
where C2 is the concentration of the solute inmolal units (g l$1),M2 is themolecular weight of the solute, and V!
1 is the molar volume of puresolvent. Equation (4.11) comes from X2" n2/(n1# n2)' n2/n1 whenn2<< n1. Because n1V!
1 " V, the total volume of solvent,X2 ' n2V!
1=V " M2n2V!1=M2V " %M2n2=V&%V!
1=M2& " C2V!1=M2. The dimen-
sions of Eqn. (4.11) are (g l$1) · (l mol$1) / (g mol$1)" 1 (i.e., no units).That is, X2 is dimensionless, as it must be! Substitution of Eqn. (4.11) intoEqn. (4.10) gives
1„1 " „1 $ „!1 ' $RTC2V
!1=M2 # RT ln f1 %4:12&
for a dilute solution of component 2, the solute. Assuming that thesecond term on the right-hand side is small enough to be neglected(because f1' 1 and ln1' 0), as is often approximately the case inbiochemical experiments, we have a relatively simple and mathematicalexpression and can see that the chemical potential of a single-componentsolution relative to the pure solvent (1„1) is (approximately) directlyproportional to the concentration of the solute and inversely propor-tional to solutemass. The higher the concentration of a solute, the higherits chemical potential. A substance always diffuses from a region of higherconcentration to a region of lower concentration. The greater the mass of aparticle, the lower its chemical potential. If we start to think about realbiological macromolecules like proteins or DNA, things become morecomplex, because such molecules are almost always charged. Let’s waituntil Chapter 5 to see how to take charge into account.
F. Effect of solutes on boiling points andfreezing points
Our comments on phase transitions have suggested that we shouldbe aware of them in biochemistry. And the previous section
102 GIBBS FREE ENERGY – THEORY

showed that the chemical potential of a substance depends on itsconcentration. Now we want to combine these areas of knowledgeto obtain an expression for the change in boiling or freezing point ofa solvent which results from the addition of a solute. We know thatsalt is used to keep roads clear of ice in the winter, and that salt isadded to water to cook pasta, but why either is done may have beena mystery to you before now. Let’s slog through a few more formulasand then look at examples of how to apply the gained knowledge tobiochemistry.
From Eqn. (4.9) we have
„1 $ „!1 " RT ln f1X1: %4:13&
This can also be expressed as
%„1 $ „!1&=RT " 1G1;m=RT " %1H1;m $ T1S1;m&=RT " lnf1X1; %4:14&
where, for instance, 1G1,m"1G1/1n1, and 1G1 represents the dif-ference in the Gibbs free energy of component 1 between the onephase and the other. Because 1Hm and 1Sm are relatively insensitive totemperature over short temperature ranges, 1Hm"1Htr and 1Sm"1Htr/Ttr, where ‘tr’ stands for ‘transition.’ Substitution of these relationsinto Eqn. (4.14) gives
1Htr=R · %1=T $ 1=Ttr& " lnf1 X1 %4:15&
The difference T$ Ttr"1T is very small, so 1=T $ 1=Ttr ' $1T=T2tr.
When this and Eqn. (4.10) are substituted in, we obtain
$1Htr=R · 1T=T2tr " $%X2 # . . .& # lnf1: %4:16&
If the concentration of the solute, component 2, is small, then lnf1 ' 0and Eqn. (4.16) equation simplifies to
1T ' RX2Ttr2=1Htr: %4:17&
That’s it! It is easy to see that 1T varies proportionately with X2. Thegreater the mole fraction of solute, the more the temperature of thephase transition will differ from that of the pure solvent. Becausethe effect depends on the mole fraction of the solute but not the solute’sidentity, it is called a colligative property, one that depends “on thecollection” of solute molecules.
Are there practical applications in biological science of this hard-won knowledge of physical chemistry? Yes! In both cases, theaddition of the “solute” changes the temperature of the phasechange, in the one case lowering the freezing point and in the otherraising the boiling point. There are also applications in the bio-chemistry lab. For instance, glycerol is often used to reduce thefreezing point of aqueous protein solutions. The restriction enzymesso important for molecular biology and biotechnology are stored inc. 50% glycerol, which lowers the freezing point of water to below$20 !C! The enzymes are more thermostable at this temperature
EFFECT OF SOLUTES ON BOILING POINTS AND FREEZING POINTS 103
than at 4 !C, and this preserves them for longer than if stored in thefridge by reducing the rate of spontaneous inactivation. Maintainingenzymes in the freezer comes with a cost – that of keeping theicebox running – so this is not a case of getting something fornothing! Then there are proteins that either raise or lower thefreezing point of water with biological effect. The ones that lower itare known as anti-freeze proteins. Such proteins bind to and arrestthe growth of ice crystals in the fish and thereby prevent it fromfreezing. By contrast, some bacterial proteins are known to increasethe probability that supercooled water3 will freeze.
Box 4.1 Puzzling proteins keep flounders from freezing
Pleuronectes americanus, the winter flounder, flourishes in the freezing waters of
polar and subpolar oceans. Plasma proteins in the blood of this fish bind to ice
crystals and stop them from growing. Type I anti-freeze protein, discovered in
winter flounder 30 years ago, is a 3.3 kDa alanine-rich amphipathic molecule that
forms a single fi helix and binds to a pyramidal plane of ice. The concentration of
this protein in fish blood plasma in winter is about 10–15 mg m‘$1, giving a non-
colligative freezing-point depression, or thermal hysteresis, of 0.7 !C; far short of
the –1.9 !C freezing point of sea water. The thermal hysteresis attributable to the
colligative effects of other blood solutes adds another 0.8 !C to the total. But the
1.5 !C sum is not quite enough to keep the fish thawed. A piece of the jigsaw was
missing. Recently, researchers in Ontario and Newfoundland, Canada, identified a
previously unknown 16.7 kDa anti-freeze protein in the fish. This protein provides
a thermal hysteresis of 1.1 !C at a concentration of just 0.1 mg m‘$1, about half
the circulating concentration. It would appear that this new protein resolves the
question of how the fish survives icy polar waters.
G. Ionic solutions
Ions in solution are called electrolytes. Charged particles get thisname from their ability to conduct an electric current. Discussionabout them takes up space in the present tome because water isfound everywhere in the biological world, life aswe know it could notexist withoutwater, andmost of the time plenty of ions are present inwater. (An expensivewater purification system is required to doworkon ordinary water and separate ions from the solvent!) Moreover,many representatives of the three major classes of biological macro-molecule – namely, proteins, nucleic acids, and polysaccharides – arecharged at neutral pH, even if their net charge might be zero (thoughit usually isn’t). And many species of lipid are charged. Chargeproperties help to give biomacromolecules important physicalproperties that are closely related to their physiological function.
3 Liquid water cooled below its normal freezing point.
104 GIBBS FREE ENERGY – THEORY

Box 4.2. Surviving a dip in the ice-cold ocean in a Speedo
In December 2005 British swimmer Mr. Lewis Pugh broke two records previously
held by US swimmer Ms. Lynne Cox: the most southerly swim in the ocean, and
the longest-duration swim near a Pole. For his first feat, Mr. Pugh swam 1 km
under conditions that would kill a typical person within minutes. He spent 18 min
10 s in salt water just below 0 !C in the seas off the Antarctic Peninsula (latitude,
65! S). His second feat was a 1 mile swim for 30 min 30 s in mere 2–3 !C water.
How was Mr. Pugh able to maintain body temperature and stave off the normally
debilitating effects of the body’s reaction to cold? In part by habituation, through
increasingly frequent exposure to cold. The body can be trained not to shiver,
allowing muscles to work more effectively in frigid surroundings. But when the
surroundings are so cold, how is it possible to keep the temperature of the
body above 35 !C, the cut-off point for hypothermia? Mental imagery plays a key
role, stimulating the production of large amounts of heat by “anticipatory
thermogenesis.” Just as in sprinting and other sports, the release of stress hormones
by the brain increases the metabolic rate of the body. Finally, there are the fitness
and fatness factors. The latter is related to why women tend to be better than men
at outdoor swimming: females tend to have more fat over their leg and arm
muscles, which keeps them better insulated. Fitness favors the frantic movement of
appendages, muscle activity, generation of heat, endurance, and speed. And men
are generally ahead of women in that category. Mind over matter?
Ionic solutions tend to be dominated by electrical forces, whichcan,� be� very� strong.� Referring� back� to� Table� 2.2,� you� will� see� that� theelectrostatic energy of two electronic charges can be as great as14 kcal mol$1, an energy as large or larger than the free energydifference between the folded and unfolded states of a protein atroom temperature. Often, though, electrostatic interactions aresubstantially weaker, as they depend not only on the distancebetween the interacting charges but also on the dielectric constantof the medium, D. In the middle of a protein, which is somethinglike an oily solid, D'4, and the electrostatic interaction is reducedto just 75 % from its vacuum value. In bulk aqueous solution, bycontrast, D'80! The polarity of water greatly reduces the distanceover which the strength of the electric field created by a charge issignificant. The strength of charge–charge interactions in water isoften reduced even further by the orderly arrangement of a fewwater molecules in a “solvation shell” around an ion.
EDTA is a cation4 chelator. It is a useful tool in the biochemist’skit because it can be used in a variety of practical situations. Forinstance, when preparing dialysis tubing, EDTA is used to “trap”divalent metal ions, “removing” them from solution, limiting theirability to bind to biomacromolecules one might want to prepare by
4 Positive ions, e.g. Na#, are cations. Cl– and other negative ions are anions.
IONIC SOLUTIONS 105

dialysis and proteases that might require them for activity. Theactivity of such proteases is greatly reduced in the presence of EDTA.1H for the binding of Mg2# to EDTA is positive, but because 1S isvery negative, 1G<0 and chelation occurs. Anyone who has evertried to make an aqueous EDTA solution will know very well thatthe sodium salt does not dissolve very quickly at room temperature.If enough EDTA is present, when the solution comes to equilibriumonly some of the salt will be dissolved. It might be possible to getmore EDTA into solution by heating, which changes its solubilityand the rate of dissolution.
What we want to do now is look at some general ways ofthinking about thermodynamic properties of electrolytes. We’ll dothis by way of the example of EDTA. But let’s bear in mindthat the example will show how the approach is really muchbroader in scope. The solubility equilibrium of EDTA can bewritten as
Na4EDTA%s& , 4Na# # EDTA4$: %4:18&
Based on this equation, at equilibrium,
„NaEDTA " 4„Na# # „EDTA$ : %4:19&
The positive and negative ions appear as a pair because it is notpossible to make separate measurements of the chemical poten-tials on the right hand side. To take this doubling effect intoaccount, we define the mean chemical potential, „±, which in thiscase is
„/ " 4
5„Na# # 1
5„EDTA$ : %4:20&
The coefficients account for the stoichiometry of dissociation ofEDTA. Equation (4.19) can now be rewritten as
„NaEDTA " 5„/: %4:21&
More generally,
W , ”#Az# # ”$Bz$: %4:22&
In this equation W is a neutral compound, A and B are positiveand negative ions with ion numbers z# and z$, and ”# and ”$ arestoichiometric coefficients. The mean (not meaner!) chemicalpotential is
„/ " %”#Az# # ”$Bz$&V# # V$
" „salt
”# # ”$: %4:23&
This is just W divided by the sum of the stoichiometric coefficients.Try working through the equations using EDTA as the example.
Substituting Eqn. (4.9) into Eqn. (4.20), we have
„/ " 4
5%„!
Na# # RTln%fNa#XNa#&& #1
5%„!
EDTA$ # RTln%fEDTA$XEDTA$&&: %4:24&
106 GIBBS FREE ENERGY – THEORY

Making use of xlna" lnax, a handy formula from mathematics, gives
" „!/ # RTln
!!!!!!!!!!!!!!!!!!!!!!!!!!!!!!!!!!!!!!!!!!!!!!!!!!%fNa#XNa#&4fEDTA$XEDTA$
5
q; %4:25&
where the standard state chemical potentials of Na# and pure EDTA$
have been combined in the first term on the right-hand side ofEqn. (4.25).
Just as the chemical potentials of the ions cannot be measuredseparately, neither can one measure the activity coefficients sepa-rately. We therefore define a mean ionic activity coefficient, which forthe present example is
f/ " fNa#4=5fEDTA$
1=5: %4:26&
This comes from (ab)1/2, the geometric mean of a and b. In the moregeneral case, Eqn. (4.26) looks like
f/ " %f v## f v$$ &1=%”##”$&; %4:27&
where f# and f$ are the activity coefficients of the positive andnegative ions on the mole fraction scale.
Knowing the mean activity coefficient of a salt can be importantfor interpreting the results of a biochemistry experiment. This willbe especially true when the solution conditions are far from ideal,and particularly when the salt concentration is high. The bacteriathat live in the Dead Sea, known as halophiles, thrive in a high saltenvironment. Somehow or other the molecular machinery of thesebugs can cope with the high-salt surroundings. A high-salt solutionis far from ideal, so the activity coefficients of ions in the sur-rounding environment of halobacteria deviate substantially fromunity. In a similar example, the salt guanidinium chloride (GuHCl) isa strong protein denaturant. Most proteins are unfolded at a con-centration of about 6 M GuHCl (a large concentration indeed, butone still many times smaller than the concentration of pure water,which is about ten-fold greater). Like HCl, GuHCl dissociates com-pletely in aqueous solution to guanidinium ion and chloride ion (thesolubility limit of GuHCl is well above 5 M at 25 !C). To explain inmolecular terms what GuHCl does to protein structure, one needs toknow its activity coefficient. We’ll learn more about guanidiniumchloride-induced unfolding of proteins in Chapter 5.
Now we want to think about electrolytes in a slightly differentway. What follows is a simplified version of the theory of strongelectrolytes developed by the Netherlander Petrus JosephusWilhelmus Debye5 (1884–1966) and the German Erich Huckel(1896–1980), published in 1923. The activity of an ion depends on aquantity known as the ionic strength, I, which is defined as
I " 1
2
X
i
z2i mi: %4:28&
5 Debye was awarded the Nobel Prize in Chemistry in 1936.
IONIC SOLUTIONS 107

Heremi, themolality, is defined as Xi/Ms, the ratio of the mole fractionof solute i to the molecular mass of the solvent in kilograms, Ms. Notethat if the salt you’re working with is relatively simple, like NaCl,there is no problem in computing I: NaCl dissociates below its solu-bility limit, each particle carries just one charge, so a one molalsolution of this salt has an ionic strength of [(12· 1)# (12 · 1)]/2"1.CaCl2 is somewhat more complicated, because the ions involved nolonger carry the same charge.
Finally, it can be shown6 that the activity coefficient of ion i onthe molality scale is
log ! i " $Hz2i!!I
p; %4:29&
where ! i is the activity coefficient on the molality scale. H is a com-plicated expression that depends the density of the solvent, theabsolute temperature, the charge on an electron, the dielectricconstant of the solvent . . . For ions in water at 25 !C, H'0.5. And sothere is a way to calculate ! i. Things are much more complicatedwhen dealing with polyvalent ions like proteins, because the degreeof ionization is sensitive to pH. Polyvalent ions and ionization willbe treated in greater depth below. Enough about ions for now!
H. Equilibrium constant
We have looked at the concept of equilibrium from various direc-tions throughout the present chapter. But in fact, we have onlyscratched the surface of what could be known. Many things in lifework like that. Here, we approach equilibrium in yet anotherway, one that is very useful to biological scientists, particularlybiochemists.
Given a general reaction
aA # bB , cC# dD %4:30&
the overall free energy change is
1G " c„C # d„D $ a„A $ b„B: %4:31&
Substituting Eqn. (4.31) into Eqn. (4.5), we have
1G " 1G! # RT ln,C-c ,D-d
,A-a ,B-b
8>>>:
9>>>;; %4:32&
where 1!G " c„!
C # d„!D $ a„!
A $ b„!B and we have not distinguished
between activity and concentration, in case the reaction is not car-ried out at infinite dilution. The quantity [C]c[D]d/[A]a[B]b, called themass action ratio, is based on Eqn. (4.30). Equation (4.32) indicates thatthe free energy change of a reaction has two parts: a constant termthat depends only on the particular reaction taking place, and a
6 See, for example, pp. 250–2 of Atkins (1998).
108 GIBBS FREE ENERGY – THEORY

variable term that depends on temperature, concentrations ofreactants and products, and stoichiometric relationships.
At equilibrium, the forward reaction balances the reverse reac-tion, and 1G"0. So
1G! " $RT ln Keq " $RT ln,C-ceq ,D-deq,A-aeq ,B-beq
8>>>>:
9>>>>;; %4:33&
where the subscript “eq” signifies “equilibrium.” The concentra-tions of reactants and products are the concentrations at equili-brium. The equilibrium constant of the reaction, Keq, is defined as
Keq ",C-ceq ,D-deq,A-aeq ,B-beq
8>>>>:
9>>>>;: %4:34&
Note that Keq will be unitless if a# b" c# d. Equation (4.33) indicatesthat Keq can be calculated from standard state free energies. The formof relationship is illustrated in Fig. 4.10. You can get a feel for mag-nitudes by substituting in values (see Table 4.3). For instance, when1G! "0, Keq" 1. A 10-fold change in Keq at 25 !C corresponds to1G! "5.7 kJ mol$1, an energy difference two to three times greaterthan thermal energy at the same temperature. Deviations fromequilibrium will stimulate a change in the system towards the equi-librium concentrations of reactants and products. This is known as LeChatelier’s principle.7 A reaction will go to completion for Keq(104.
Table 4.3. Relationship between 1G! and Keq
Free energy change Equilibrium constant
1G! < 0 Keq> 11G! " 0 Keq" 11G! > 0 Keq< 1
Fig. 4.10 Variation of
Keq with 1G!. Note that Keq is afunction of the negative logarithm of
1G!. When 1G! is large and
negative, Keq is very large. When
1G! is large and positive, Keq is verysmall. In most biochemical reactions
1G! will fall within the range shown
here.
7 Named after the French chemist Henri Louis Le Chatelier (1850–1936). The principlewas first enunciated in 1884, and it applies equally as well to reversible chemical
EQUILIBRIUM CONSTANT 109

Comparison of Eqn. (4.32) with Eqn. (4.34) tells us that it will be hardto change the direction of a reaction with a very large or very smallvalue of Keq by changing the mass action ratio. In Chapter 5 we shallsee how this difficulty is relevant in glycolysis, the process of glucosemetabolism. Finally, Eqn. (4.34) also has a relationship to reactionrates, whichwas put forward by van’t Hoff.Wemention this here as aforetaste of the development in Chapter 8.
Here’s a worked example of the relationship between Gibbs freeenergy change and equilibrium constant. Consider the glycolyticreaction in which a phosphoryl group is moved from carbon 1 ofglucose to carbon 6:
glucose-1-phosphate , glucose-6-phosphate: %4:35&
The equilibrium constant for this reaction, which is catalyzed by theenzyme phosphoglucomutase, is 19. How big is 1G! at room tem-perature? By Eqn. (4.31), 1G! "$(8.314 J mol$1 K$1) · 298 K · ln(19)" $ 7.3kJmol$1. Thenegative sign indicates that reactionproceeds tothe right spontaneously under standard conditions. We need not haveevaluated the magnitude of 1G! to know this (Table 4.1), becausewhenKeq>1,1G! < 0and the forward reactionwill be spontaneous. IfKeq<1, the reaction will be energetically unfavorable. Let’s see whathappens when we alter the concentrations of reactants and productsin Eqn. (4.35) and require the concentrations of reactants and pro-ducts to be held at 10 mM and 1 mM, respectively. By Eqn. (4.32),1G"$7.3 kJ mol$1# (8.314 J mol$1 K$1) · 298 K · ln(1/10)"$13kJmol$1. The reaction is considerably more exergonic than understandard state conditions. This tells us both that we are far fromequilibrium, where1G"0, and the reaction will proceed to the rightto reach equilibrium. Clearly, the magnitude of 1G can depend sig-nificantly on the concentrations of reactants andproducts. In fact, theconcentrations can be different enough in some cases (when 1G'0)to reverse the direction of the reaction, a situation that is relativelycommon inmetabolism and occurs in glycolysis.What is the positionof the enzyme in this picture? Will it influence the rate of reaction?Yes! Will it change the free energy difference between products andreactants? No! Why not? The Gibbs free energy is a thermodynamicstate function. As such, what it measures depends only on the state ofthe system and not on how the system was prepared.
I. Standard state in biochemistry
Most in vitro biochemical experiments are carried out at constanttemperature and pressure in dilute aqueous solution near neutral pH.To be maximally useful, the biochemist’s definition of standard state
reactions and reversible physical processes. The conclusions reached by Le Chatelierin his 1884 work had been anticipated in part by the American J. Willard Gibbs.
110 GIBBS FREE ENERGY – THEORY

should take all these conditions into account. Doing this will seemto make things more complicated at first, but not ultimately.
We define the standard state of water to be that of the pure liquid.This means that the activity of water is set to 1, even though itsconcentration is 55.5 M. One justification for this is that if a reactionis carried out in dilute aqueous solution, the percentage change inconcentration of water will ordinarily be negligible. Another is thatit is pretty easy to multiply and divide by 1! You might agree thatmany in vitro experiments are carried out under relatively close-to-ideal conditions, but object that such conditions will often differgreatly from those in a cell. Which cell? Which organism? Where?We take 25 !C as the standard temperature because it is convenientfor bench-top experiments. It is also close to the temperature ofmany organisms. The hydrogen ion activity is defined as unity at pH 7(neutral solution), not pH 0 (highly acidic solution where the activityof H3O
# is 1).8 Finally, no account is taken of the various ionizationstates of molecules that might be present at pH 7. This is particularlyrelevant to biological macromolecules, especially proteins, whichcan be ionized in a multitude of different ways. When all the statedconditions are accounted for, the standard state free energy changeis symbolized as 1G! 0. The prime indicates pH 7. See Table 4.4.
To put the foregoing discussion in practice, consider thefollowing chemical reaction, a sort of variation on Eqn. (4.30):
A # B , C# D# nH2O: %4:36&
From Eqn. (4.34),
1G! " RT lnKeq
" RT ln%,C-eq,D-eq,H2O-n=,A-eq,B-eq&" RT ln%,C-eq,D-eq=,A-eq,B-eq& $ nRT ln,H2O-; %4:37&
which, on invoking the biochemist’s conventions, is
1G!0 " RT ln Keq0 " RT ln%,C-eq,D-eq=,A-eq,B-eq&: %4:38&
Thus, the relationship between 1G! and 1G!0 is
1G!0 " 1G! # nRT ln ,H2O-: %4:39&
What if protons are “consumed” in the reaction, taken up from thesolvent by solute molecules? The situation can be modeled as
A # ”H#%aq& ! P: %4:40&
By Eqn. (4.31),
1G " „p $ „A $ ”„H# : %4:41&
If A and P are in their standard states, then
1G " „!P $ „
!A $ ”„H# : %4:42&
8 H3O# symbolizes the hydronium ion, the proton in aqueous solution.
STANDARD STATE IN BIOCHEMISTRY 111

The chemical potential of H#, from Eqn. (4.5), is
„H# " „!H# # RTlnaH# " „!
H# $ 2:303RT%pH&; %4:43&
where we have assumed ideal conditions and used the definition ofpH (log[H#]'$pH, see below). Combining Eqns. (4.42) and (4.43)gives
1G " „!P " „!
A $ ”%„!H# $ 2:303RT%pH&& " 1G! # ”2:303RT%pH&: %4:44&
The biochemist’s standard state, however, is defined for pH"7. So,
1G!0 " 1G! $ ”16:121RT %4:45&
The free energy difference varies linearly with T and ”, the number ofprotons transferred in the reaction. Happily, if neither H2O nor H#
is involved in the reaction, then n"0 and ”"0, and 1G!!"1G!.
Table 4.4. Values of 1G!0 for some important biochemical reactions
Reaction 1G!0 (kcal mol$1)
HYDROLYSIS
Acid anhydrides:Acetic anhydride#H2O! 2 acetate $21.8PPi#H2O! 2Pi $8.0ATP#H2O! ADP# 2Pi $7.3
Esters:Ethylacetate#H2O! ethanol# acetate $4.7Glucose-6-phosphate#H2O! glucose# Pi $3.3
Amides:Glutamine#H2O! glutamate#NH4
# $3.4Glycylglycine#H2O! 2 glycine (a peptide bond) $2.2
Glycosides:Sucrose#H2O! glucose# fructose $7.0Maltose#H2O! 2 glucose $4.0ESTERIFICATIONGlucose# Pi! glucose-6-phosphate#H2O #3.3
REARRANGEMENTGlucose-1-phosphate! glucose-6-phosphate $1.7Fructose-6-phosphate! glucose-6-phosphate $0.4Glyceraldehyde-3-phosphate! dihydroxyacetone phosphate $1.8
ELIMINATIONMalate! fumarate#H2O #0.75
OXIDATIONGlucose# 6O2! 6CO2# 6H2O $686Palmitic acid# 23O2! 16CO2# 16H2O $2338
PHOTOSYNTHESIS6CO2# 6H2O! six-carbon sugars# 6O2 #686
The data are from p. 397 of Lehninger, A. L. (1975) Biochemistry, 2nd edn. New York: Worth.
112 GIBBS FREE ENERGY – THEORY
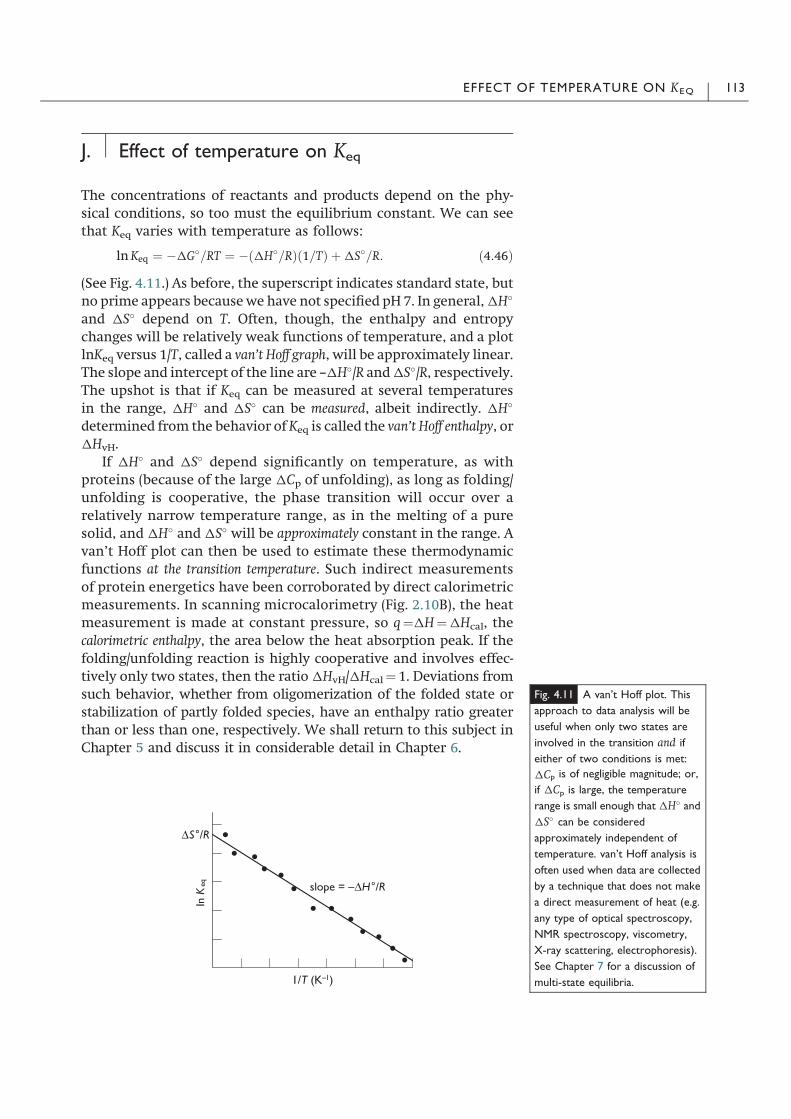
J. Effect of temperature on Keq
The concentrations of reactants and products depend on the phy-sical conditions, so too must the equilibrium constant. We can seethat Keq varies with temperature as follows:
lnKeq " $1G!=RT " $%1H!=R&%1=T& #1S!=R: %4:46&
(See Fig. 4.11.) As before, the superscript indicates standard state, butno prime appears becausewe have not specified pH 7. In general,1H!
and 1S! depend on T. Often, though, the enthalpy and entropychanges will be relatively weak functions of temperature, and a plotlnKeq versus 1/T, called a van’t Hoff graph, will be approximately linear.The slope and intercept of the line are –1H!/R and1S!/R, respectively.The upshot is that if Keq can be measured at several temperaturesin the range, 1H! and 1S! can be measured, albeit indirectly. 1H!
determined from the behavior of Keq is called the van’t Hoff enthalpy, or1HvH.
If 1H! and 1S! depend significantly on temperature, as withproteins (because of the large 1Cp of unfolding), as long as folding/unfolding is cooperative, the phase transition will occur over arelatively narrow temperature range, as in the melting of a puresolid, and 1H! and 1S! will be approximately constant in the range. Avan’t Hoff plot can then be used to estimate these thermodynamicfunctions at the transition temperature. Such indirect measurementsof protein energetics have been corroborated by direct calorimetricmeasurements. In scanning microcalorimetry (Fig. 2.10B), the heatmeasurement is made at constant pressure, so q"1H"1Hcal, thecalorimetric enthalpy, the area below the heat absorption peak. If thefolding/unfolding reaction is highly cooperative and involves effec-tively only two states, then the ratio1HvH/1Hcal"1. Deviations fromsuch behavior, whether from oligomerization of the folded state orstabilization of partly folded species, have an enthalpy ratio greaterthan or less than one, respectively. We shall return to this subject inChapter 5 and discuss it in considerable detail in Chapter 6.
Fig. 4.11 A van’t Hoff plot. This
approach to data analysis will be
useful when only two states are
involved in the transition and if
either of two conditions is met:
1Cp is of negligible magnitude; or,
if 1Cp is large, the temperature
range is small enough that 1H! and
1S! can be considered
approximately independent of
temperature. van’t Hoff analysis is
often used when data are collected
by a technique that does not make
a direct measurement of heat (e.g.
any type of optical spectroscopy,
NMR spectroscopy, viscometry,
X-ray scattering, electrophoresis).
See Chapter 7 for a discussion of
multi-state equilibria.
EFFECT OF TEMPERATURE ON KEQ 113

How does a fluctuation in T translate into a fluctuation in lnKeq?In other words, how does T ! (T#1T) affect lnKeq? If the changebrought about in lnKeq by the temperature fluctuation is 1lnKeq, byEqn. (4.44) we have
lnKeq #1lnKeq" $%1H!=R&%1=%T #1T&& #1S!=R: %4:47&
To evaluate 1/(T#1T)" (T#1T)$1, we make use of a famous rela-tionship in mathematics known as the binomial theorem, accordingto which (x# y)n" xn# nxn$1y# n(n$1)xn$2y2/2# . . . for y2< x2. Ourrequirement is 1T< T, so the theorem can be applied! Making thesubstitution, we have
ln Keq # lnKeq " $%1H!=R&,T$1 # %$1&T$21T # %$1&%$2&T$3%1T&2=2# . . .-#1S!=R . . .
" $%1H!=R&%1=T& # %1H!=R&%T$2&%1T&$ %1H!=R&%T$3&%1T&2=2# . . . #1S!=R: %4:48&
The first and last terms on the right-hand side of Eqn. (4.48) sum tolnKeq, so these terms can be dropped from both sides, leaving
1lnKeq " %1H!=R&%T$2&%1T& $ %1H!=R&%T$3&%1T&2=2# . . . %4:49&
If 1T is small, then the second and following terms on the right-hand side will be much smaller than the first one. So we have
1lnKeq ' %1H!=R&%T$2&%1T&: %4:50&
Does the approximation work? Let’s test it! Suppose 1H! " 50 kcalmol$1 at 300 K, a representative value for a small protein. If 1T )1K, then by Eqn. (4.50) 1lnKeq" (50 kcal mol$1) · (300 K)$2 · (1 K) /(1.9872 calmol$1 K$1)$ (50 kcal mol$1) · (300 K)–3 · (1 K)2 / (1.9872calmol$1 K$1)"0.2796# 0.0009. That is, in neglecting the secondterm, we incur an error of less than 1% $ smaller than the usualuncertainty in measuring protein concentration! The error of theneglected terms would be greater if all of them were taken intoaccount, but it can be shown that the total error would still be small.If, however, living organisms flourished at a temperature muchcloser to absolute zero, the relative magnitude of a 1 degree fluc-tuation would be much larger, the calculation we have just donewould not involve division by such a large number, and the termswe have neglected would be much bigger. Life seems to depend onliquid water – the ability of water molecules to move around witha degree of independence – and on fluctuations in temperatureand therefore thermal energy to be relatively small. The Antarcticbacteria mentioned in Chapter 1 are hardly “living” when frozen,even if they are not “dead.” Finally, Eqn. (4.50) does provide a handyway of calculating the effect of temperature on lnKeq. You may havenoticed, though, that we made a key simplifying assumption in thecalculation – that the variation of 1H! and 1S! with temperatureis small!
114 GIBBS FREE ENERGY – THEORY

K. Acids and bases
A key application of the concept of equilibrium in biology concernsacids and bases in solution. According to the Brønsted–Lowry defini-tions, an acid is a proton donor and a base is a proton acceptor.9
Biological situations usually concern water in some way or other. Ameasure of the acidity of water, due to the Danish biochemistSørenson, is its pH, defined as
pH " $ log aH3O# : %4:51&
The pH of a solution determines the extent of proton dissociationfrom ionizable chemical groups in biological macromolecules andthus can have a profound effect on enzyme activity, protein–proteinassociation, protein–DNA binding, and other types of biochemicalreaction. We therefore had better put some effort into knowing thissubject!
Suppose we have an acid HA. It participates in the followingreaction in water:
HA%aq& #H2O%l& , H3O#%aq& # A$%aq&: %4:52&
The acidity constant for this reaction is defined as
Ka"aH3O
#aA$
aHAaH2O
" #'
aH3O#aA$
aHA
" #: %4:53&
The approximation is justified on the same grounds as before: if ourconcern is dilute aqueous solutions, the activity of water is close to 1and essentially unchanging. At low concentrations of HA, theactivity of hydronium ions is roughly equal to their molar con-centration, and the acidity constant is usually written as
Ka ' ,H3O#-,A$-=,HA-; %4:54&
where the concentrations are in mol ‘$1. This approximation is validonly when all the ions in solution are present in low concentrations.Neglecting the limitations of the approximation can introducecomplications. For instance, 1 mM imidazole10 has an activity coef-ficient of about 0.95, and ignoring this can affect the equilibriumconstant by as much as 10%! Acidity constant values are often tabu-lated in terms of their negative logarithm, pKa:
pKa " $ log Ka: %4:55&
The pKa is related to the standard state free energy of ionization as
9 Johannes Nicolaus Brønsted, a Danish physical chemist, lived 1879–1947. ThomasMartin Lowry was an Englishman. Brønsted and Lowry introduced their definitionssimultaneously but independently in 1923.
10 A common buffer in biochemistry. The structure of imidazole is the same as that ofthe side chain of histidine. The pKa of imidazole is about 6.5, close to neutral pH.
ACIDS AND BASES 115

pKa " 1G!=%2:303RT&: %4:56&
Taking the logarithm of both sides of Eqn. (4.54) yields the Henderson–Hasselbalch equation:
pH " pKa$log%,HA-=,A$-&: %4:57&
The form of this relation is the same as that of Eqn. (4.7). Equation(4.57) tells us that the pKa of an acid indicates the pH at which half ofthe protons are dissociated (when [HA]" [A–], log([HA]/[A–])" 0). Abuffer exhibits its greatest buffering capacity at this pH: a change in[H3O
#] or [OH–] has the smallest effect on the solution pH at the pKa.The A– ions at this pH can react with the largest amount hydroniumions produced on addition of strong acid, and the HA present canreact with strong base added. The pKa values of acidic and basicgroups in proteins are given in Table 4.5. Proteins themselves arecrucial for buffering fluids in living organisms. For example, about80% of the buffering capacity of human blood comes from proteins,principally serum albumin and hemoglobin.
Let’s use Eqn. (4.57) to calculate the pH of buffer solution con-taining 0.200 mol ‘$1 KH2PO4 (monobasic potassium phosphate) and0.100 mol ‘$1 K2HPO4 (dibasic potassium phosphate). The equationdescribing the equilibrium between acid and base is as follows:
H2PO$4 %aq& #H2O%1& , H3O
#%ap& #HPO2$4 %aq&: %4:58&
The pKa for this reaction, which is based on measurement, can befound in standard tables and is 7.21. Plugging all the numbers intoEqn. (4.57) gives
pH " 7:21$ log%0:2=0:1& " 6:91: %4:59&
It is clear why potassium phosphate is a favorite buffer of bioche-mists.
Despite the neat appearance of the calculation we’ve just done,the situation with phosphate buffer is rather complex. This is
Table 4.5. pKa0 values of acidic and basic groups in proteins.
Group Amino acid residue pKa0(25
!C)
fi-Carboxyl 3.0–3.2Carboxyl Aspartic acid 3.0–4.7
Glutamic acid )4.5Imidazolyl Histidine 5.6–7.0fi-Amino 7.6–8.4Sulfhydryl Cysteine 9.1–10.8Phenolic hydroxyl Tyrosine 9.8–10.4Guanidino Arginine 11.6–12.6
Note that a range of values is given. The acidity constant will depend in part on the specificelectronic environment of the acidic or basic group.
116 GIBBS FREE ENERGY – THEORY

because, unlike a simple acid like HCl, phosphoric acid is polyprotic.That is, phosphoric acid can donate more than one proton, so it hasmore than one pKa. One of the other two pKas is much higher thanpH 7, the other is much lower. Fortunately, neither of the othersmakes a large contribution to the acid–base equilibrium at pH 7,and we can justify ignoring them in the neutral pH range. But don’tneglect other contributions of a polyprotic acid if it has acidityconstants that differ by less than about two pH units! Figure 4.12shows how the net charge varies with pH for two polyprotic acids,phosphoric acid (panel (A)), in which there are three, well-separatedionization constants, and the protein ribonuclease (panel (B)), inwhich there are numerous ionizable groups of similar value. We’llhave a further look at this topic in Chapter 6.
L. Chemical coupling
The Gibbs free energy is a state function. Individual contributions tothe� overall� free� energy� change� are� therefore� additive� (see� Fig.� 2.3).Well, OK, but what does this say about biology? An endergonicreaction (1G>0) can be “powered” by an exergonic reaction(1G<0) if the two reactions are chemically “coupled” and the overallfree energy change under the same conditions is negative. This isimportant! An analog will help to illustrate the situation. Anexample of mechanical coupling is the use of the downhill flow of astream of water to turn a wheel to drive a system of gears to dosomething useful, for example, convert mechanical energy intoelectrical energy as at a hydroelectric dam or grind grain into flour.
Fig. 4.12 Acid–base titration curves. Panel (A) shows titration of sodium phosphate at
25 !C. Phosphoric acid has three dissociable protons and therefore three pKa values. ThepKas of phosphate are well-separated on the pH axis. This means that titration of the first
site is effectively complete before titration of the second site begins, and so forth. Panel (B)
shows the titration of ribonuclease at 25 !C. Ribonuclease is an extremely complicated
molecule. Not only are there several different types of titratable group (the different types
of ionizable amino acids), but the specific chemical environment of a dissociable proton can
result in a substantial shift in its pKa relative to the value for the free amino acid (in some
cases by more than two pH units, or a 100-fold change in H3O# concentration). This
makes the titration curve of a protein very complicated. Panel (B) is based on a figure in
Tanford & Hauenstein (1956).
CHEMICAL COUPLING 117
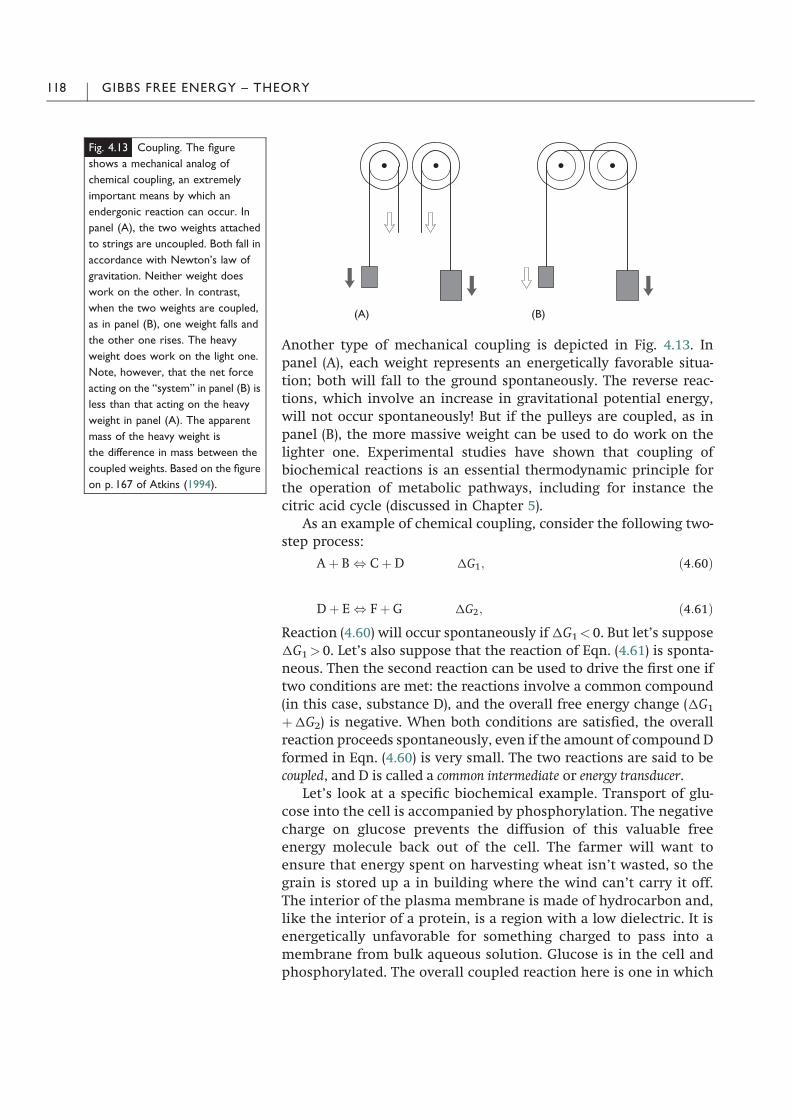
Another type of mechanical coupling is depicted in Fig. 4.13. Inpanel (A), each weight represents an energetically favorable situa-tion; both will fall to the ground spontaneously. The reverse reac-tions, which involve an increase in gravitational potential energy,will not occur spontaneously! But if the pulleys are coupled, as inpanel (B), the more massive weight can be used to do work on thelighter one. Experimental studies have shown that coupling ofbiochemical reactions is an essential thermodynamic principle forthe operation of metabolic pathways, including for instance thecitric acid cycle (discussed in Chapter 5).
As an example of chemical coupling, consider the following two-step process:
A # B , C# D 1G1; %4:60&
D# E , F# G 1G2; %4:61&
Reaction (4.60) will occur spontaneously if1G1<0. But let’s suppose1G1>0. Let’s also suppose that the reaction of Eqn. (4.61) is sponta-neous. Then the second reaction can be used to drive the first one iftwo conditions are met: the reactions involve a common compound(in this case, substance D), and the overall free energy change (1G1
#1G2) is negative. When both conditions are satisfied, the overallreaction proceeds spontaneously, even if the amount of compound Dformed in Eqn. (4.60) is very small. The two reactions are said to becoupled, and D is called a common intermediate or energy transducer.
Let’s look at a specific biochemical example. Transport of glu-cose into the cell is accompanied by phosphorylation. The negativecharge on glucose prevents the diffusion of this valuable freeenergy molecule back out of the cell. The farmer will want toensure that energy spent on harvesting wheat isn’t wasted, so thegrain is stored up a in building where the wind can’t carry it off.The interior of the plasma membrane is made of hydrocarbon and,like the interior of a protein, is a region with a low dielectric. It isenergetically unfavorable for something charged to pass into amembrane from bulk aqueous solution. Glucose is in the cell andphosphorylated. The overall coupled reaction here is one in which
Fig. 4.13 Coupling. The figure
shows a mechanical analog of
chemical coupling, an extremely
important means by which an
endergonic reaction can occur. In
panel (A), the two weights attached
to strings are uncoupled. Both fall in
accordance with Newton’s law of
gravitation. Neither weight does
work on the other. In contrast,
when the two weights are coupled,
as in panel (B), one weight falls and
the other one rises. The heavy
weight does work on the light one.
Note, however, that the net force
acting on the “system” in panel (B) is
less than that acting on the heavy
weight in panel (A). The apparent
mass of the heavy weight is
the difference in mass between the
coupled weights. Based on the figure
on p. 167 of Atkins (1994).
118 GIBBS FREE ENERGY – THEORY

a phosphoryl group is transferred from ATP to glucose, but itshould be mentioned that neither of the relevant half-reactions (ATPhydrolysis or glucose phosphorylation) obligatorily drives the otherreaction, as one might require in a more restricted definition ofcoupled reaction.
Let’s look at some details of the energetics of glucose phos-phorylation:
glucose# Pi , glucose-6-phosphate#H2O
1G! 0 " 13:8kJ mol$1:%4:62&
The blood concentration of glucose, the brain’s primary fuel source,is )5 mM. Given a cellular glucose concentration of about 300 !M,for the reaction to proceed to the right on the basis of concentrationdifferences alone, the concentration of glucose-6-phosphate in theblood would have to be large – over 100 mM! (Can you prove it?)What actually happens in our bodies is that glucose phosphoryla-tion is coupled to ATP hydrolysis. The overall reaction can be writ-ten as
glucose# ATP , glucose-6-phosphate# ADP: %4:63&
This coupled reaction, for which 1G!0 "$17.2 kJ mol$1, is clearlyenergetically favorable and will proceed to the right spontaneously –if the right “molecular hardware” is present.
Examination of Eqn. (4.63) can give a good sense of how thisreaction coupling works on the molecular level. Minimizing theconcentration of Pi would promote the forward reaction (by massaction), so an enzymatic nanomachine we might design to carry outthe phosphorylation reaction should avoid the accumulation of Pi.Similarly, minimizing the concentration of H2O in the vicinity ofour molecule-sized “workbench” would minimize the probability oftransfer of Pi from ATP to water; we want the phosphate group to betransferred to glucose! Crystallographic studies of the enzyme hex-okinase, one of nature’s own nanomachines, have revealed muchabout how the process actually occurs. Binding of glucose induces aconformational change in the enzyme that increases its affinity forATP 50-fold and excludes water from the catalytic site. The func-tional groups of the amino acid side chains involved in catalysismove into proper alignment and a phosphoryl group is transferredfrom ATP to glucose. The low activity (concentration) of water in theactive site of the enzyme is crucial for the reaction. Measurementshave shown that the conformational change induced in the enzymeupon glucose binding results in the release of about 60 watermolecules into bulk solution. This contributes a substantial increasein entropy to the overall energetics of the reaction, offsetting theunfavorable entropy change of bringing glucose and ATP simulta-neously into an orientation that permits phosphoryl transfer to theappropriate hydroxyl group on glucose. Amazing!
CHEMICAL COUPLING 119

M. Redox reactions
Utilization of the free energy of glucose and other nutrients con-sumed by organisms is controlled by means of oxidation–reductionreactions, or redox reactions. Some of these reactions occur in orga-nelles called mitochondria, the “power-houses” of the cell. Redoxreactions are of such great and general importance that much morethan one section of one chapter of this book could be allocated tothem. The present aim, however, is a brief introduction to the topicand not comprehensive treatment.
In redox reactions, electrons are transferred from one moleculeto another. Electron transfer can be accompanied by the transfer ofan atom or ion, but our main concern at the moment is electronsand changes in oxidation. The electron donor is called the reductantand the acceptor is the oxidant. Reductant and oxidant work in pairs,or couples.
Any redox reaction can be expressed as the difference of tworeduction half-reactions. Conceptual in nature, half-reactions facil-itate calculations by showing the electrons explicitly. An example ofa half-reaction is the following:
oxidized compound%Aox& # ne$ ! reduced compound%Ared&; %4:64&
where n electrons are transferred to the oxidized compound, givingthe reduced compound. A more complicated redox reaction is
Box # ne$ #mH# ! BredmH; %4:65&
where n and m could be different. Note the proton (H#) transfer. Anexample of a full redox reaction, where both redox pairs are given,is
Ared #Box ! Aox #Bred: %4:66&
A key physiological redox reaction is the reduction of oxygen towater by cytochrome c:
4cytc2# # 4H# #O2 ! 2H2O# 4cytc3#: %4:67&
The transferred electrons are only implicit in this representation.Note that water is produced in this reaction.
The standard redox potential, 1V!0, represents the strength of aredox pair to exchange electrons, the “electron transfer potential.”A redox potential is measured as an electromotive force (e.m.f.), orvoltage,11 of a half-cell consisting of both members of the redoxcouple (Fig. 4.14). Just as the Gibbs free energy (a thermodynamicpotential) must be measured with respect to a chosen referencestate, so the redox voltage measurement is made relative to astandard value. In most cases the standard is provided by the
11 The volt, the SI unit of electrical potential, or voltage, gets its name from CountAlessandro Giuseppe Antonio Anastasio Volta (1745–1827), an Italian physicist.
120 GIBBS FREE ENERGY – THEORY
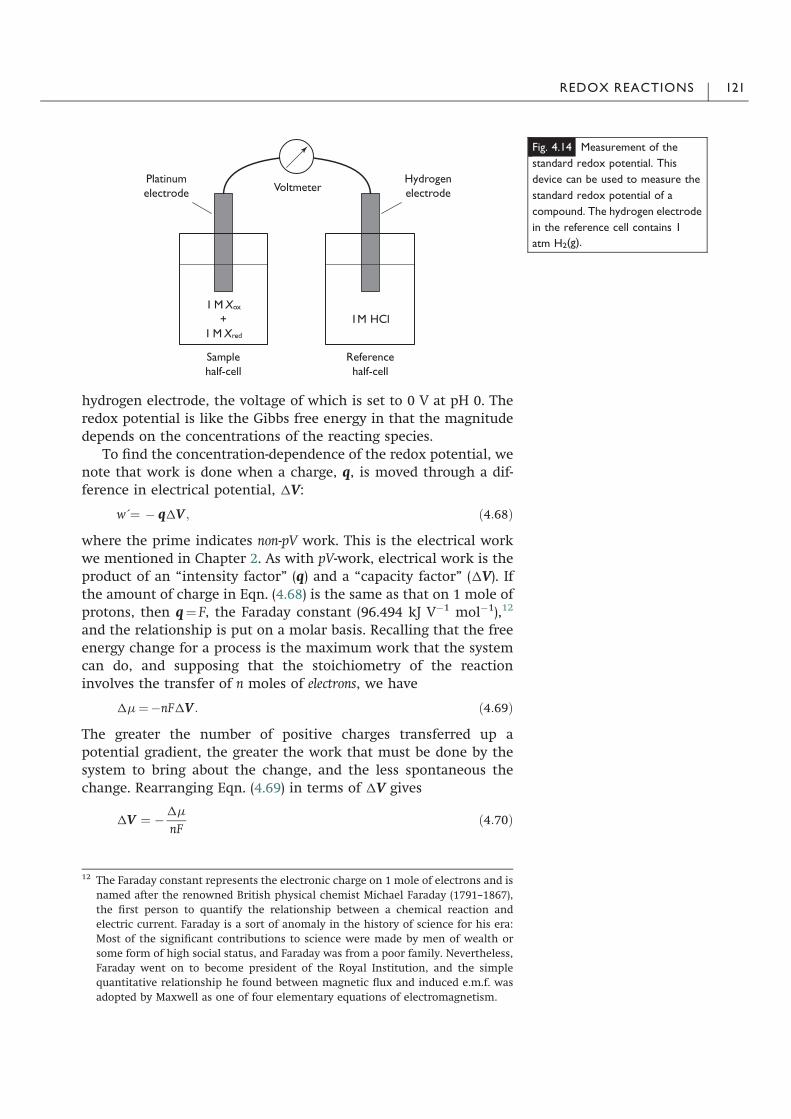
hydrogen electrode, the voltage of which is set to 0 V at pH 0. Theredox potential is like the Gibbs free energy in that the magnitudedepends on the concentrations of the reacting species.
To find the concentration-dependence of the redox potential, wenote that work is done when a charge, q, is moved through a dif-ference in electrical potential, 1V:
w!" $ q1V ; %4:68&
where the prime indicates non-pV work. This is the electrical workwe mentioned in Chapter 2. As with pV-work, electrical work is theproduct of an “intensity factor” (q) and a “capacity factor” (1V). Ifthe amount of charge in Eqn. (4.68) is the same as that on 1 mole ofprotons, then q" F, the Faraday constant (96.494 kJ V$1 mol$1),12
and the relationship is put on a molar basis. Recalling that the freeenergy change for a process is the maximum work that the systemcan do, and supposing that the stoichiometry of the reactioninvolves the transfer of n moles of electrons, we have
1„"$nF1V : %4:69&
The greater the number of positive charges transferred up apotential gradient, the greater the work that must be done by thesystem to bring about the change, and the less spontaneous thechange. Rearranging Eqn. (4.69) in terms of 1V gives
1V " $1„nF
%4:70&
Fig. 4.14 Measurement of the
standard redox potential. This
device can be used to measure the
standard redox potential of a
compound. The hydrogen electrode
in the reference cell contains 1
atm H2(g).
12 The Faraday constant represents the electronic charge on 1 mole of electrons and isnamed after the renowned British physical chemist Michael Faraday (1791–1867),the first person to quantify the relationship between a chemical reaction andelectric current. Faraday is a sort of anomaly in the history of science for his era:Most of the significant contributions to science were made by men of wealth orsome form of high social status, and Faraday was from a poor family. Nevertheless,Faraday went on to become president of the Royal Institution, and the simplequantitative relationship he found between magnetic flux and induced e.m.f. wasadopted by Maxwell as one of four elementary equations of electromagnetism.
REDOX REACTIONS 121

1V " $1„!0 # RT ln ,products-
,reactants-
nF" 1V!0 $ RT
nFln
,products-,reactants-; %4:71&
where the standard state potential, 1„!0/nF, is written as 1V!0. Stand-ard state conditions are pH 7.0, 1 atm, and 25 !C. The right hand sideof Eqn. (4.71) is known as the Nernst equation.13 As we shall see below,it has many applications in biological systems. At equilibrium,
1V!0 " $RT
nFln K 0
eq %4:72&
Nowwehave away to relate the standard cell e.m.f. to the equilibriumconstant. Some standard redox potentials are given in Table 4.6.
Equation (4.65) can be split into two parts,
Aox # ne$ ! Ared %4:73&
and
Box # ne$ ! Bred: %4:74&
The half-cell reduction potentials here are
1VA " 1V!A0 $ RT
nFln
,Ared-,An#
ox -%4:75&
and
1VB " 1V!B0 $ RT
nFln
,Bred-,Bn#
ox -: %4:76&
Note that the form of Eqns. (4.75) and (4.76) is exactly the same as thatof Eqn. (4.7). The overall redox potential of any two half-reactions is
1V " 1V e$acceptor $1V e$donor %4:77&
A biochemical example will help to illustrate how these equations areput into practice. An important reaction of glycolysis is the reduction
Table 4.6. Standard redox potentials of some importantbiochemical substrates
Electrode equation n 1V!0 (V)
Acetate# 2H## 2e$, acetaldehyde 2 $0.582H## 2e$,H2 2 $0.42NAD##H## 2e$,NADH 2 $0.32Pyruvate# 2H# 2e$, lactate 2 $0.19Cytochrome c (Fe3#)# e–,cytochrome c (Fe2#)
1 #0.22
12O2# 2H## 2e–,H2O 2 #0.82
13 Named after Walther Hermann Nernst (1864–1941), the German physicist andchemist. Nernst is connected with the Third Law of Thermodynamics and wasawarded the Nobel Prize in Chemistry in 1920.
122 GIBBS FREE ENERGY – THEORY

of pyruvate to lactate by nicotinamide adenine dinucleotide (NADH,reduced form). The reaction is catalyzed with complete stereo-specificity by the enzyme lactate dehydrogenase:
pyruvate#NADH#H# , lactate# NAD#: %4:78&
The sum of the respective half-cell potentials, 1V!0, # 0.32 V and$0.19 V (Table 4.6), exceeds 0. Therefore, by Eqn. (4.69) 1„!0 "$2 · 96.5 kJ V$1 mol$1 · 0.13 V" $ 25.1 kJ mol$1, the forwardreaction is the more probable one, and we should expect thespontaneous oxidation of NADH by pyruvate. We note that,although they do not appear explicitly in Eqn. (4.78), two electronsare transferred in this reaction. Nicotinamide adenine dinucleotidephosphate (NADPH, reduced form), a close relative of NADH, playsa key role in the cellular redox reactions that enable the synthesisof compounds that are thermodynamically less stable than glucose,a starting material.
What if we change the concentrations of reactants and products?What effect will this have on the spontaneity of electron transfer?As we have seen, the standard state redox potential of the NADox/NADred couple is $ 0.32 V. Now we wish to calculate the potential ofthis half-cell reaction under non-standard state conditions. Let thecouple be 75% reduced at T"70 !C. By Eqn. (4.75),
1V " $0:32V$ 8:314 J mol$1 K$1 · 343 K
2 · 96 494 J V$1 mol$1 ln7525
" #" $0:34V %4:79&
There is relatively little deviation from the standard state potentialat 75% reduction. At 50% reduction, 1V"1V!0. Marked deviationsfrom the standard state potential occur only for extremes of tem-perature or extremes of the ratio of the concentration of oxidant toconcentration of reductant.
Before bringing down the curtain on the text of this chapter, letus return the spotlight to photosynthesis. This biological processmakes sugar, a reduced form of carbon, using water, a reducingagent. The overall chemical reaction can be expressed as
6 CO2 # 6 H2O# light ! C6H12O6 # 6O2 # energy: %4:80&
We covered some of the conceptual background to this equation inChapter 1. Water is a relatively poor reductant, having a reductionpotential of #820 mV; energy is required to separate electrons fromwater. This energy comes from the photons absorbed by chlor-ophylls a and b in photosystems I and II. Energy trapped by chlor-ophyll is transferred to the reaction center, whence electrons aretransferred to pheophytin and plastoquinone. The reaction center isregenerated by “replacement” electrons from water, releasing theoxygen animals need to respire and generating a proton gradientacross a lipid membrane. A more in-depth look at photosynthesisand glycolysis must wait until Chapter 5.
REDOX REACTIONS 123

N. References and further reading
Arrhenius, S. (1912). Theories of Solution. New Haven: Yale University Press.Atkins, P.W. (1994). The Second Law: Energy, Chaos, and Form, p. 167. New York:Scientific American.
Atkins, P.W. (1998). Physical Chemistry, 6th edn, cc. 10.2 & 23.2. Oxford:Oxford University Press.
Bada, J. L. & Miller, S. L. (1968). Equilibrium constant for the reversibledeamination of aspartic acid. Biochemistry, 7, 3403–8.
Banks, B. E. C. & Vernon, C. A. (1978). Biochemical abuse of standardequilibrium constants. Trends in Biochemical Sciences, 3, N156–8.
Bates, R. G. (1973). Determination of pH; Theory and Practice. New York: JohnWiley.
Ben-Shem, A., Frolow, F. & Nelson, N. (2003). Crystal structure of plantphotosystem I. Nature, 426, 630–5.
Bergethon, P. R. (1998). The Physical Basis of Biochemistry: the Foundations ofMolecular Biophysics, cc. 2.17, 13 & 21.4–21.6. New York: Springer-Verlag.
Blandamer, M. J. (1992). Chemical Equilibrium in Solution. Hemel Hempstead:Ellis Horwood/Prentice-Hall.
Bradley, J. (1990). Teaching electrochemistry. Education in Chemistry, 27,48–50.
Bretscher, M. S. (1985). The molecules of the cell membrane. ScientificAmerican, 253, no. 4, 86–90.
Butcher, J. (2005). Profile: Lewis Gordon Pugh – polar swimmer. The Lancet,366, S23–4.
Christensen, H.N. & Cellarius, RA. (1972). Introduction to Bioenergetics:Thermodynamics for the Biologist: A Learning Program for Students of the Biologicaland Medical Sciences. Philadelphia: W. B. Saunders.
Creighton, T. E. (1993). Proteins: Structures and Molecular Properties, 2nd edn, ch.7. New York: W.H. Freeman.
Dawes, E. A. (1962). Quantitative Problems in Biochemistry, 2nd edn, ch. 1.Edinburgh: E. & S. Livingstone.
Dawson, R.M. C., Elliott, D. C., Elliott, W.H. & Jones, K.M. (1986). Data forBiochemical Research, 3rd edn. Oxford: Clarendon Press.
DeKock, R. L. (1996). Tendency of reaction, electrochemistry, and units.Journal of Chemical Education, 73, 955–6.
DeVries, A. L. (1982). Biological antifreeze agents in coldwater. ComparativeBiochemistry and Physiology, 73A, 627–40.
Ellis, R. J. (2001). Macromolecular crowding: Obvious but underappreciated.Trends in Biochemical Sciences, 26, 597–604.
Encyclopdia Britannica CD98, “Activity Coefficient,” “Arrhenius Theory,”“Boiling Point,” “Debye–Huckel Equation,” “Equilibrium,” “Free Energy,”“Freezing Point,” “Ideal Solution,” “Life,” “Melting Point,” and “Phase.”
Feeney, R. E. (1974). A biological antifreeze. American Scientist, 62, 712–19.Feiner, A. S. & McEvoy, A. J. (1994). The Nernst equation. Journal of ChemicalEducation, 71, 493–4.
Franzen, H. F. (1988). The freezing point depression law in physicalchemistry: is it time for a change? Journal of Chemical Education, 65, 1077–8.
Fruton, J. S. (1999). Proteins, Enzymes, Genes: the Interplay of Chemistry and Biology.New Haven: Yale University Press.
124 GIBBS FREE ENERGY – THEORY
Gennix, R. B. (1989). Biomembranes: Molecular Structure and Function. New York:Springer-Verlag.
German, B. & Wyman, J. (1937). The titration curves of oxygenated andreduced hemoglobin. Journal of Biological Chemistry, 117, 533–50.
Gillispie, Charles C. (ed.) (1970). Dictionary of Scientific Biography. New York:Charles Scribner.
Good, N. E., Winter, W., Connolly, T. N., Izawa, S. & Singh, R.M.M. (1966).Hydrogen ion buffers for biological research. Biochemistry, 5, 467–76.
Green, R. L. & Warren, G. J. (1985). Physical and functional repetition in abacterial ice nucleation gene. Nature, 317, 645–8.
Gurney, R.W. (1953). Ionic Processes in Solution. New York: McGraw-Hill.Harned, H. S. & Owen, B. B. (1958). The Physical Chemistry of Electrolytic Solutions.Princeton: Van Nostrand-Reinhold.
Harold, F.M. (1986). The Vital Force: a Study of Bioenergetics, cc. 1 & 2. New York:W.H. Freeman.
Harris, D. A. (1995). Bioenergetics at a Glance, ch. 1. Oxford: Blackwell Science.Haynie, D. T. (1993). The Structural Thermodynamics of Protein Folding, ch. 4.Ph.D. thesis, The Johns Hopkins University.
Hodgman, C.D. (ed.) (1957). C.R.C. Standard Mathematical Tables, 11th edn.Cleveland, Ohio: Chemical Rubber Company.
Hopkin, M. (2005). Man breaks world records with Antarctic swim. NatureNews, 20 December.
Howlett, G. J., Blackburn, M.N., Compton, J. G. & Schachman, H. K. (1977).Allosteric regulation of aspartate transcarbamoylase. Analysis of thestructural and functional behavior in terms of a two-state model.Biochemistry, 126, 5091–9.
Hubbard, R. (1966). The stereoisomerization of 11-cis-retinal. Journal ofBiological Chemistry, 241, 1814–18.
Kemp, H. R. (1987). The effect of temperature and pressure on equilibria: aderivation of the van’t Hoff rules. Journal of Chemical Education, 64, 482–4.
Klotz, I.M. (1986). Introduction to Biomolecular Energetics, cc. 3–7. Orlando:Academic Press.
Kondepudi, D. & Prigogine, I. (1998).Modern Thermodynamics: from Heat Enginesto Dissipative Structures, cc. 7.5, 8.2 & 8.3. Chichester: John Wiley.
Koryta, J. (1992). Ions, Electrodes, and Membranes. New York: John Wiley.Lodish, H., Baltimore, D., Berk, A., Zipursky, S. L., Matsudaira, P. & Darnell, J.(1995). Molecular Cell Biology, 3rd edn, ch. 2. New York: W.H. Freeman.
Marshall, C. B., Fletcher, G. L. & Davies, P. L. (2004) Hyperactive antifreezeprotein in a fish, Nature, 429, 153.
McPartland, A. A. & Segal, I. H. (1986). Equilibrium constants, free energychanges and coupled reactions: concepts and misconceptions. BiochemicalEducation, 14, 137–41.
Millar, D., Millar, I., Millar, J. & Millar, M. (1989). Chambers Concise Dictionary ofScientists. Cambridge: Chambers.
Nicholls, D.G. & Ferguson, S. J. (1992). Bioenergetics 2. London: Academic Press.Ochs, R. S. (1996). Thermodynamics and spontaneity. Journal of ChemicalEducation, 73, 952–4.
Ostro, M. J. (1987). Liposomes. Scientific American, 256(1), 102–11.Palmer, C.M., Siebke, K. & Yeates, D.K. (2004). Infrared video thermography: atechnique for assessing cold adaptation in insects. BioTechniques, 37, 212–17.
Peusner, L. (1974). Concepts in Bioenergetics, cc. 3, 5, 6 & 7. Englewood Cliffs:Prentice-Hall.
REFERENCES AND FURTHER READING 125

Price, G. (1998). Thermodynamics of Chemical Processes, ch. 4. Oxford: OxfordUniversity Press.
Schrake, A., Ginsburg, A. & Schachman, H. K. (1981). Calorimetric estimateof the enthalpy change for the substrate-promoted conformationaltransition of aspartate transcarbamoylase from Escherichia coli. Journal ofBiological Chemistry, 256, 5005–15.
Schultz, S. G. (1980). Basic Principles of Membrane Transport. Cambridge:Cambridge University Press.
Segal, I. H. (1976). Biochemical Calculations: How to Solve Mathematical Problems inGeneral Biochemistry, 2nd edn, ch. 3. New York: John Wiley.
Smith, C. A. & Wood, E. J. (1991). Energy in Biological Systems, cc. 1.3 & 1.4.London: Chapman & Hall.
Snell, F.M., Shulman, S., Spencer, R. P. & Moos, C. (1965). Biophysical Principlesof Structure and Function. Reading, Massachusetts: Addison-Wesley.
Spencer, J. N. (1992). Competitive and coupled reactions, Journal of ChemicalEducation, 69, 281–4.
Tanford, C. & Hauenstein, J. D. (1956). Hydrogen ion equilibria ofribonuclease. Journal of the American Chemical Society, 78, 5287–91.
Tombs, M. P. & Peacocke, A. R. (1974). The Osmotic Pressure of BiologicalMacromolecules. Oxford: Clarendon Press.
Tydoki, R. J. (1995). Spontaneity, accessibility, irreversibility, ‘useful work’:the availability function, the Helmholtz function and the Gibbs function,Journal of Chemical Education, 72, 103–12.
Tydoki, R. J. (1996). The Gibbs function, spontaneity, and walls. Journal ofChemical Education, 73, 398–403.
van Holde, K. E. (1985). Physical Biochemistry, 2nd edn, cc. 2.1, 2.3, 2.4 & 3.Englewood Cliffs: Prentice-Hall.
Voet, D. & Voet, J. G. (1995). Biochemistry, 2nd edn, cc. 2–2, 3, 4, 11–2, 15–4–15–6, 16, 18–1, 19–1, 28–3 & 34–4B. New York: Wiley.
Williams, T. I. (ed.) (1969). A Biographical Dictionary of Scientists. London: Adam& Charles Black.
Wood, S. E. & Battino, R. (1996). The Gibbs function controversy. Journal ofChemical Education, 73, 408–11.
Wrigglesworth, J. (1997). Energy and Life, cc3, 5.7.2, 7.1, 7.3 & 7.5.1. London:Taylor & Francis.
O. Exercises
1. State whether the following phrases pertain to (A) the expansionof a gas into a vacuum, (B) two objects coming to thermal equi-librium, (C) both of these processes, or (D) neither of these pro-cesses.(1) Involves a change in enthalpy.(2) Involves an increase in entropy.(3) Involves a decrease in Gibbs free energy.(4) Can be made to proceed in the opposite direction.
2. State whether the following phrases pertain to (A) spontaneity,(B) reversibility, (C) both spontaneity and reversibility, or (D)neither spontaneity nor reversibility.
126 GIBBS FREE ENERGY – THEORY

(1) Established for 1G<0 at constant T.(2) Established for 1S<0.(3) Established for a process in which the work done is a
maximum.(4) Illustrated by the migration of a solute from a region of high
concentration to low concentration.(5) Required for determination of 1S by the heat transferred.(6) Implies that the coupling of coupled reaction is very
efficient.3. State whether the following phrases pertain to (A) 1U, (B) 1G, (C)
both 1U and 1G, or (D) neither 1U nor 1G.(1) Does not depend on pathway during a change of state.(2) Consists of the heat transferred and the work done.(3) Must be negative if an isothermal and isobaric process is
spontaneous.(4) Measures the degree of disorder of a system.(5) Is zero at equilibrium for an isothermal and isobaric process.(6) Used to determine whether one reaction can drive another
by coupling.(7) Includes only energy that can do work, at constant
temperature and pressure.
4. State whether the following phrases pertain to (A) 1G, (B) 1G!,(C) both 1G and 1G!, or (D) neither 1G nor 1G!.(1) Equals $RT lnKeq.(2) Equals $nF1V!0.(3) Is zero if the change in the state of the system is
spontaneous.(4) Equals 1H$ T1S at constant T.(5) Is given for one mole of the reactants for a given reaction.(6) Is equal to the sum of the chemical potentials of the products
minus the chemical potentials of the reactants, with eachchemical potential multiplied by the number of molesinvolved in the reaction.
(7) Is independent of the concentration of the components of areaction.
5. State whether the following phrases pertain to (A) a, (B) „, (C)both a and „, or (D) neither a nor „.(1) Equals the concentration times the activity coefficient.(2) Needed to calculate 1G if 1G! is known under specified
conditions for all components of a reaction.(3) Used to calculate 1G for a process after multiplication by the
number of moles of that component involved in the process.
6. In Chapter 1 we said that all living organisms depend on the Sunin order to meet the energy requirements of life. This is onlypartially true of the chemosynthetic bacteria that live at thebottom of the ocean. Explain the energy requirements for life incompletely general terms. Although it may be that the Sun
EXERCISES 127

played an indispensable role in the formation of life as we knowit, is the Sun absolutely necessary for life? Why or why not?
7. What are the units of Keq? Explain.
8. Calculate 1G!(25 !C) for Keq"0.001, 0.01, 0.1, 1, 10, 100, and1000.
9. The multi-component enzyme aspartate transcarbamoylasecatalyzes the formation ofN-carbamoylaspartate from carbamoylphosphate and aspartate. Arthur Pardee has demonstrated thatthis reaction is the first step unique to the biosynthesis of pyr-imidines, including cytosine, thymine and uracil, major com-ponents of nucleic acids. Aspartate transcarbamoylase has atleast two stable folded conformations, known as R (high sub-strate affinity) and T (low substrate affinity). Interestingly, therelative stability of the T and R states is affected by the binding ofATP (a purine) to R and CTP (a pyrimidine) to T, a topic covered inChapter 7. Measurement of the standard state free energy dif-ference between R and T in the absence of ATP and CTP yieldedthe value 3.3 kcalmol$1. Calorimetric determination of 1H! forthe transition was –6 kcal mol$1. Calculate the standard stateentropy change for the T!R transition.
10. When a photon in the visible range is absorbed in the retina byrhodopsin, the photoreceptor in rod cells, 11-cis-retinal is con-verted to the all-trans isomer. Light energy is transformed intomolecular motion. The efficiency of photons to initiate thereaction is about 20% at 500 nm (57 kcal mol$1). About 50%of the absorbed energy is available for the next signaling step.This process takes about 10 ms. In the absence of light, spon-taneous isomerization of 11-cis-retinal is very slow, on the orderof 0.001 yr$1! Experimental studies have shown that the equi-librium energetics of retinal isomerization are 1S! " 4.4 calmol$1K$1 and 1H! "150 calmol$1. Calculate the equilibriumconstant for the reaction.
11. Which one of the following equations is used to evaluate freeenergy changes in cells under physiological conditions? Whatmakes it appropriate?(a) 1G" RT lnKeq0.(b) 1G"1G!0 # RT ln[products]/[reactants].(c) 1G"RT ln[products]/[reactants].(d) 1G"1H$ T1S.(e) 1G"1G! 0 #RT [products]/[reactants].
12. The direction of a reaction with a very large or very small valueof Keq is difficult, though not impossible, to alter by changingthe mass action ratio. Explain.
13. Show that for a reaction at 25 !C which yields 1 mol of H2O,1G!0 "1G! #9.96 kJ mol$1.
128 GIBBS FREE ENERGY – THEORY

14. Calculate Keq for the hydrolysis of the following compoundsat neutral pH and 25
!C: phosphoenolpyruvate (1G!0 "$ 61.9
kJ mol$1), pyrophosphate (1G!0 "$33.5 kJ mol$1), and glucose-1-phosphate (1G!0 "$20.9 kJ mol$1). Assume that the equili-brium constant includes water, accounting for the possibilitythat the water concentration is relatively low, as in the cell.These compounds are involved in the glycolytic pathway.
15. 1G!0 for the conversion of fructose 1,6-bisphosphate (FBP) intoglyceraldehyde-3-phosphate (GAP) and dihydroxyacetone phos-phate (DHAP) is #22.8 kJ mol$1. This reaction is step four ofthe glycolytic pathway and is catalyzed by aldolase. In the cell at37 !C the mass action [DHAP]/[GAP]"5.5. What is the equili-brium ratio of [FBP]/[GAP] when [GAP]"2 · 10$5M? When[GAP]"1 · 10$3 M?
16. Calculate 1G when the concentrations of glucose-1-phosphateand glucose-6-phosphate are maintained at 0.01 mM and 1 mM,respectively. Compare the sign of1Gwith what was obtained inthe worked example above. Suggest how this might be sig-nificant in metabolism.
17. Lactate dehydrogenase (LDH) catalyzes the oxidation of pyruvateto lactate andNADH toNAD# in glycolysis, the pathway by whichglucose is converted to pyruvate with the generation of 2 mol ofATP mol$1 of glucose. The reaction is particularly importantduring strenuous activity, when the demand for ATP is high andoxygen is depleted. The relevant half-reactions and their stan-dard reduction potentials are given in Table 4.6. Calculate1G for the reaction under the following conditions: [lactate]/[pyruvate]" [NAD#]/[NADH]" 1; [lactate]/[pyruvate]" [NAD#]/[NADH]" 160; [lactate]/[pyruvate]" [NAD#]/[NADH]" 1000.What conditions are required for the reaction to spontaneouslyfavor oxidation of NADH? [NAD#]/[NADH] must be maintainedclose to 103 in order for the free energy change of the glycer-aldehyde-3-phosphate reaction to favor glycolysis. This functionis performed by LDH under anaerobic conditions. What is thelargest [lactate]/[pyruvate] can be in order for the LDH reactionto favor the production of NAD# and maintain [NAD#]/[NADH]"103?
18. The citric acid cycle is the common mode of oxidative degra-dation in eukaryotes and prokaryotes (Chapter 5). Two compo-nents of the citric acid cycle are fi-ketoglutarate and isocitrate.Let [NADox]/[NADred]" 8; [fi-ketoglutarate]" 0.1 mM; [iso-citrate]" 0.02 mM. Assume 25 !C and pH 7.0. Calculate 1G. Isthis reaction a likely site for metabolic control? Explain.
19.� Refer� to� Fig.� 4.4.� Mixing.� In� the� text� we� noted� that� at� firstentropy is at a minimum and free energy is at a maximum.
EXERCISES 129

Later, . . . if the two liquids are the same, what are 1S and 1G ofmixing?
20.� Refer� to� Fig.� 3.2.� The� stopcock� is� closed� in� panel� (A).� All� of� theinert gas is in the bulb on the left-hand side. In panel (B), thebulb on the left-hand side has inert gas at concentration x, andthe bulb on the right has the same inert gas at concentration x.What are the entropy and the free energy differences betweenpanels (A) and (B)?
21. Rationalize the change of sign in Eqn. (4.32).
22. Cytochromes are redox-active proteins that occur in all organ-isms except a few types of obligate anaerobes. These proteinscontain heme groups, the iron atom of which reversibly alter-nates between the Fe(II) and Fe(III) oxidation states duringelectron transport. Consider the reaction
cytc %Fe2#& # cytf %Fe3#& , cytc %Fe3#& # cytf %Fe2#&
involving cytochromes c and f. If V!0 " 0.365 V for electrontransfer to cytf (Fe3#), and V!0 " 0.254 V for electron transfer tocytc (Fe3#), can ferrocytochrome c (2# oxidation state) reduceferricytochrome f (3# oxidation state) spontaneously?
23. Calculate 1V in Eqn. 4.71 when the couple is 99% reduced andthe temperature is 37 !C.
24. Table 4.1 presents the thermodynamic properties of water. Onthe basis of these data, rationalize the suitability, or lackthereof, of each thermodynamic function as an index of spon-taneous change.
25. Cholesterol increases membrane rigidity. What effect will ithave on the character of the lipid bilayer order–disorder tran-sition? Why?
26. Some organisms are able to tolerate a wide range of ambienttemperature, for instance bacteria and poikilothermic (cold-blooded) animals such as fish. The membrane viscosity of E. coliat its growth temperature is approximately constant over therange 15$ 43 !C. Knowing aspects of the physical basis of thesolid-gel transition in lipid bilayers, suggest how bacteria andfish might cope with changes of temperature.
27. Use your knowledge of the physical properties of lipids tooutline several design characteristics of a liposome-based drugdelivery system. A liposome is a bilayer structure that is self-enclosing and separates two aqueous phases.
28. The reversible deamination of aspartate yields ammonium andfumarate. Fumarate is a component of the citric acid cycle.Aspartate deamination is catalyzed by the enzyme aspartase.
130 GIBBS FREE ENERGY – THEORY

Experimental studies on the deamination reaction have shownthat
logKeq " 8:188$%2315:5=T&$ 0:01025T;
where T is in degrees kelvin (K). Note that the units of thecoefficient of 1/T (i.e. 2315.5) must be K, while those of 0.01025are K$1. Calculate 1G! at 25!C. Remember that K"10logK and2.303logx ' lnx. Follow the development leading up to Eqn.(4.50) to show that 1H! " 2.303·R· (2315.5$ 0.010 25T2). Cal-culate 1H! and 1S! at 25 !C. From Chapter 2, 1Cp"1(1H!)/1T.Use this to show that 1Cp"$ 2.303·R· 0.0205T. Evaluate 1Cpat 25 !C.
29. State whether the following phrases pertain to (A) chemicalpotential of the solute, (B) chemical potential of the solvent, (C)both of these chemical potentials, or (D) neither chemicalpotential.(1) Equals RT ln a.(2) Equals „! # RT ln a.(3) At equilibrium, its value is the same on both sides of a
membrane.(4) Is proportional to the osmotic pressure (see Chapter 5).
30. Calculate the value of x for which the approximation ln(1# x)' xgives an error of 5%.
31. State whether the following phrases pertain to (A) 1G, (B) 1V,(C) both 1G and 1V, or (D) neither 1G nor 1V.(1) Indicates whether an oxidation-reduction reaction is sponta-
neous.(2) Standard value for a reaction is determined with all
components in their standard states.(3) Is positive for a spontaneous reaction.(4) Is called the standard electrode reduction potential.(5) Can be used to calculate the equilibrium constant for a
reaction for a known set of concentrations of all componentsof a reaction at a given temperature.
32. Chemical coupling. The equilibrium constant for Glu$#NH4
#,Gln#H2O is 0.003 15 M$1 at pH 7 and 310 K; the reac-tion lies far to the left. The synthesis of Gln from Glu is madeenergetically favorable by coupling it to hydrolysis of theterminal phosphodiester bond of ATP. The products of ATPhydrolysis are ADP and Pi. The equilibrium constant for thecoupled reaction, which is known from experiments with glu-tamine synthase, is 1200. Calculate the phosphate bond energyin ATP at pH 7 and 310 K.
33. What is the pH value of 0.001 M HCl solution?
34. Calculate the hydrogen ion concentration of solution of pH 6.0.
EXERCISES 131
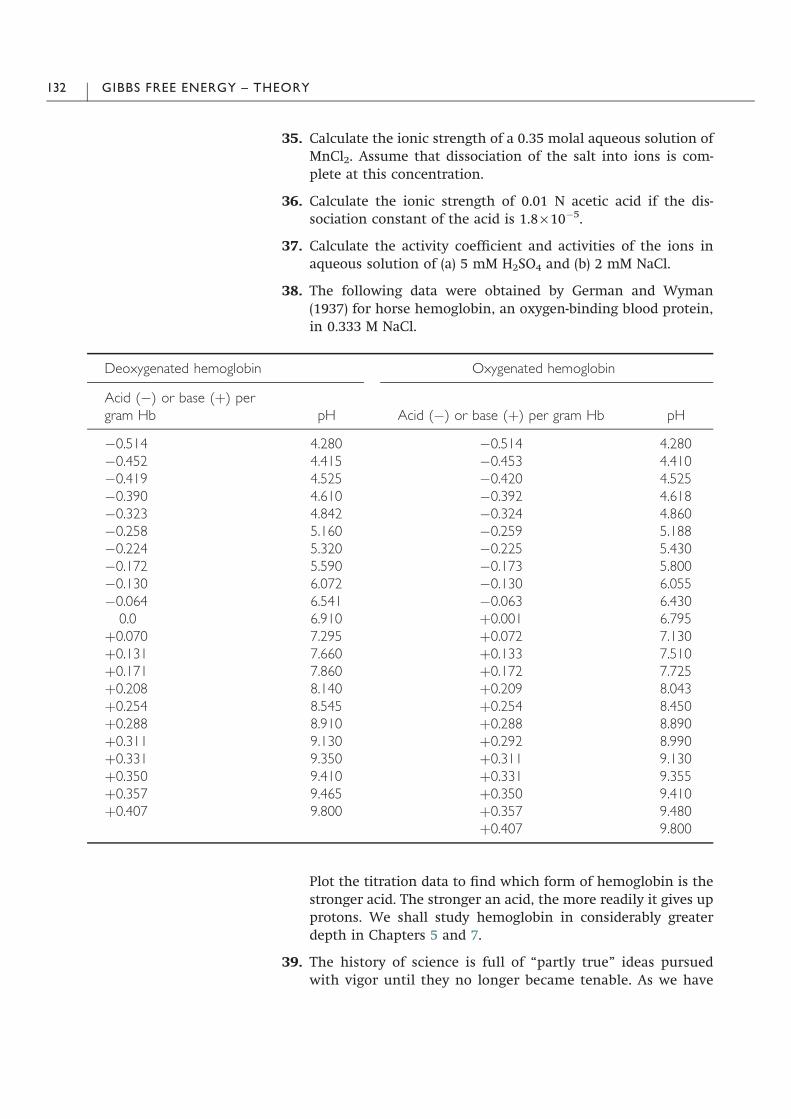
35. Calculate the ionic strength of a 0.35 molal aqueous solution ofMnCl2. Assume that dissociation of the salt into ions is com-plete at this concentration.
36. Calculate the ionic strength of 0.01 N acetic acid if the dis-sociation constant of the acid is 1.8· 10$5.
37. Calculate the activity coefficient and activities of the ions inaqueous solution of (a) 5 mM H2SO4 and (b) 2 mM NaCl.
38. The following data were obtained by German and Wyman(1937) for horse hemoglobin, an oxygen-binding blood protein,in 0.333 M NaCl.
Plot the titration data to find which form of hemoglobin is thestronger acid. The stronger an acid, the more readily it gives upprotons. We shall study hemoglobin in considerably greaterdepth in Chapters 5 and 7.
39. The history of science is full of “partly true” ideas pursuedwith vigor until they no longer became tenable. As we have
Deoxygenated hemoglobin Oxygenated hemoglobin
Acid ($) or base (#) pergram Hb pH Acid ($) or base (#) per gram Hb pH
$0.514 4.280 $0.514 4.280$0.452 4.415 $0.453 4.410$0.419 4.525 $0.420 4.525$0.390 4.610 $0.392 4.618$0.323 4.842 $0.324 4.860$0.258 5.160 $0.259 5.188$0.224 5.320 $0.225 5.430$0.172 5.590 $0.173 5.800$0.130 6.072 $0.130 6.055$0.064 6.541 $0.063 6.430
0.0 6.910 #0.001 6.795#0.070 7.295 #0.072 7.130#0.131 7.660 #0.133 7.510#0.171 7.860 #0.172 7.725#0.208 8.140 #0.209 8.043#0.254 8.545 #0.254 8.450#0.288 8.910 #0.288 8.890#0.311 9.130 #0.292 8.990#0.331 9.350 #0.311 9.130#0.350 9.410 #0.331 9.355#0.357 9.465 #0.350 9.410#0.407 9.800 #0.357 9.480
#0.407 9.800
132 GIBBS FREE ENERGY – THEORY
seen in Chapter 2, Galileo’s assumption about the shapes ofplanetary orbits, which was based on the speculations ofthinkers of classical antiquity, was eventually superseded bythe very detailed measurements of the Danish astronomerTycho Brahe (1546–1601) and analysis of Johannes Kepler.Similarly, Galileo’s work on the relative motion of bodies wasa great addition to the physics of his day (mostly that of Aris-totle), and it prepared the way for Newton; but in the twen-tieth century, Galilean (Newtonian) relativity is seen to be alimiting case of the more general view proposed by Einstein.In the nineteenth century, research in thermochemistry wasmotivated in part by the belief that the heat of a reactionmeasured its “affinity”: the greater the energy liberated, thegreater the affinity of the reactants for each other. This viewbecame untenable by the discovery of spontaneous endother-mic reactions. Explain.
40. 1G cannot generally be equated with 1G!. To a very good firstapproximation 1H can be equated with 1H!. Explain.
41. Calculate the percentage non-ionized for an acid with a pKa of 4in an environment of pH 1.
42. Tris, a base, is a popular buffer for biochemical research. Its pKais strongly dependent on temperature. Would it make a verygood buffer for a scanning calorimetry experiment? Why orwhy not? Assuming that Ka"8.3 · 10–9 M, calculate the ratio ofacid to base at pH 8.0. Let the total concentration of Tris be 150mM, and divide the stock into to two parts. To one, add 10 mMHCl. How does the pH change? Hint: assume complete dis-sociation of HCl. To the other, reduce the concentration to 30mM. How does the pH change?
43. The concentration of creatine in urine is c. 40-fold greater thanin serum. Calculate the free energy change per moleculerequired for transfer of creatine from blood to urine at 37!C.
44. Which of the following redox pairs is the strongest reducingagent?
Redox pair V!0 in volts
Oxidized ferrodoxin/reduced ferrodoxin $0.43NADP/NADPH $0.32Oxidized glutathione/reduced glutathione $0.23Pyruvate/lactate $0.19Ubiquinone/hydroquinone 0.10
EXERCISES 133

Chapter 5
Gibbs free energy – applications
A. Introduction
The Gibbs free energy is important in biology research because itenables one to predict the direction of spontaneous change for asystem under the constraints of constant temperature and pressure.These constraints generally apply to all living organisms. In theprevious chapter we discussed basic properties of the Gibbs freeenergy, showed how its changes underlie a number of aspects ofphysical biochemistry, and touched on what the biological scientistmight do with such knowledge. Here, we build on the introductorymaterial and explore how it can be applied to a wide variety oftopics of interest to the biological scientist. A range of examplesillustrate when, where, why, and how the Gibbs free energy is sucha useful concept. We shall discuss the energetics of different typesof biological structure, including small organic molecules, mem-branes, nucleic acids, and proteins. This will help to give a deepersense of the relatedness of some seemingly very different topics oneencounters in biological science.
B. Photosynthesis, glycolysis, andthe citric acid cycle
This section presents a low-resolution view of the energetics ofphotosynthesis, glycolysis, and the citric acid cycle. There can be nodoubt that the details we omit are important: entire books have beenwritten on each subject! But our aim here is to consider biologicalenergy in a global, qualitative way. We want to try to see “the bigpicture.” So many of the protein, enzyme, chemical intermediateplayers do not have a speaking part in the present dramatic perfor-mance. Such details can be found in any good biochemistry textbook.
Over 99% of the free energy in our biosphere is from theSun. Green plants, certain unicellular organisms like diatoms,

cyanophytes (blue-green algae), and various kinds of bacteria, col-lectively known as photoautotrophs, convert the light energy of theSun and CO2 into the chemical energy of bonding electrons in sugarmolecules. The energy conversion process is called photosynthesis.The remaining less than 1% of our biosphere’s free energy comesfrom the oxidation of inorganic matter, mainly hydrogen and sul-fur, by microorganisms called chemolithotrophs. Whether photo-autotrophs preceded or followed chemolithotrophs in the floweringof life on Earth is an intriguing open question (see Chapter 9).
The overall chemical reaction of photosynthesis is:
CO2 #H2O# light ! %CH2O& # O2: %5:1&
CO2 and H2O are reduced to sugar and oxygen in this redox reaction.The process carried out in photosynthetic protists and cyanophytesresembles that in green plants, while compounds other than waterserve as a reactant in photosynthetic bacteria and oxygen is notproduced. All photosynthetic organisms1 contain the light-absorbingpigment chlorophyll (Fig. 1.3). This molecule plays a key role in thetransformation of light energy to chemical compounds. Chlorophyll,like the heme group (see below) of the vertebrate oxygen transportprotein hemoglobin and the heme group of the electron transportprotein cytochrome c, is derived from protoporphyrin IX, a complexring structure synthesized from glycine and acetate (Fig. 5.1).
Figure 5.2 depicts the energetics of photosynthesis in schematicform. Absorption of photons (h”) results in the ejection of electronsfrom P680, the reaction center chlorophyll of photosystem II.2 Eachelectron passes through a chain of electron carriers to plastoqui-none, giving plastoquinol. By means of a series of redox reactions,the electrons are delivered to plastocyanin, which regenerates pho-tooxidized P700, the reaction center chlorophyll of photosystem I.The electron ejected from P700 then passes through a chain ofelectron carriers to the oxidized form of nicotinamide adeninedinucleotide phosphate (NADP#), an intracellular electron carrier.Photosynthetic electron transport drives the formation of a proton(pH) gradient, a difference in the concentration of protons onopposite sides of a membrane (in plants, the thylakoid membrane inchloroplasts). Movement of protons from a region of high chemicalpotential to low chemical potential powers the synthesis of ATP inmanner that closely resembles oxidative phosphorylation, theendergonic synthesis of ATP from ADP and Pi in mitochondria inanimal cells (see below). Plants also use light energy to make cel-lulose and other sugar molecules.
Glucose is the six-carbon sugar that is quantitatively the mostimportant source of energy for cellular processes in all known
1 Excluding halobacteria but including all other types of photosynthetic prokaryotes.Halobacteria thrive in the high salt environment of the Dead Sea.
2 So called because 680 nm is the wavelength of the absorption maximum of thereaction center chlorophyll.
PHOTOSYNTHESIS, GLYCOLYSIS, AND THE CITRIC ACID CYCLE 135

organisms. Glycolysis, the metabolism3 of glucose, is a sequence ofbiochemical reactions by which one molecule of glucose is oxidizedto two molecules of pyruvate, a three-carbon molecule (Fig. 5.3).
Fig. 5.1 Molecular formulas of the heterocyclic ring systems of ferro-protoporphyrin IX (heme) and chlorophyll a. The bound
iron of heme is normally in the Fe(II) (ferrous, 2#) oxidation state regardless of whether oxygen is bound. The structure of
chlorophyll b is nearly identical to that of chlorophyll a: a formyl group is found in place of a methyl group. Bacteriochlorophylls aand b, which are important in photon capture in photosynthetic bacteria, are very similar in structure to chlorophyll a. The long
aliphatic tail of chlorophyll increases its solubility in a nonpolar environment. Note that in both heme and chlorophyll a divalent
cation is bound. It is a remarkable indication of the unity of all known living things that such similar ring structures should play
important roles in biological energetics in organisms as different as bacteria and humans.
Fig. 5.2 Schematic diagram
(“Z-scheme”) of the energetics of
electron transport in
photosynthesis. The electrochemical
potential (free energy) is measured
in volts. Electrons tend to flow
spontaneously from a state of higher
to lower free energy. In terms of
electrochemical potential, electrons
migrate spontaneously from a more
negative to a more positive
reduction potential. PSII is coupled
to PSI via the quinone Q and
plastocyanin.
3 Greek, metabolikon, disposed to cause or suffer change; coined by the Germanbiologist Theodor Schwann (1810–1882).
136 GIBBS FREE ENERGY – APPLICATIONS

Pyruvate is then converted by a series of reactions to carbon dioxideand water. In combination with other aspects of oxidative carbo-hydrate metabolism, glycolysis is essentially the reverse process ofphotosynthesis. The overall chemical reaction for glucose metabo-lism is
C6H12O6 # 6O2 ! 6CO2 # 6H2O: %5:2&
Compare Eqn. (5.2) with Eqn. (5.1). The free energy change for thecomplete redox reaction is 1G! 0 "$ 2823 kJ mol$1, and 24 electronsare transferred in the process. The standard state free energy change(1G!0) for glycolysis alone is$ 43.4 kJ mol$1, while the physiologicalfree energy change (1G) for glycolysis, which includes the synthesisof 2 moles of ATP, is$74 kJ mol$1. Figure 5.4 depicts the physio-logical energetics of glycolysis in schematic form.
Glycolysis is similar in all organisms. Once a glucose moleculehas entered the cell, it is immediately phosphorylated at theexpense of one molecule of ATP. (It is interesting that ATP isexpended in a process which, as we shall see, leads to ATP produc-tion.) Glucose phosphorylation is an essentially irreversible reactionbecause the free energy change of removal of the phosphoryl groupfrom ATP is large and negative. Phosphorylation ensures that once ithas entered the cell, the chemical energy of glucose is trapped there.The fate of pyruvate depends on the organism, tissue and condi-tions. In stressed, oxygen-depleted skeletal muscle, for instance,pyruvate is converted to lactate (the conjugate base of lactic acid)and one molecule of ATP is produced. Fermentation of yeast, aprocess integral to making bread, beer, and wine, involves the
GlucoseGlycolysis
Glucose-6-phosphate
2 Glyceraldehyde-3-phosphate2NAD+
2NADH
2 1,3-Bisphosphoglycerate
2 Pyruvate
2 NAD+
2 NADH
2 Isocitrate
2 Citrate
2 Acetyl-CoA
2 Oxaloacetate
2 NAD+
2 NADH2 Malate
Citric acidcycle
2 ! -Ketoglutarate
2 Succinyl-CoA
2 Succinate
2 FAD
2 FADH2
2 Fumarate
2 NAD+
2 NADH
2 NADH2 NAD+
Fig. 5.3 Schematic diagram of
glycolysis and the citric acid cycle.
The figure shows the points at
which the electron carriers NAD#
and FAD are reduced by electron
transfer to form NADH and
FADH2.
PHOTOSYNTHESIS, GLYCOLYSIS, AND THE CITRIC ACID CYCLE 137
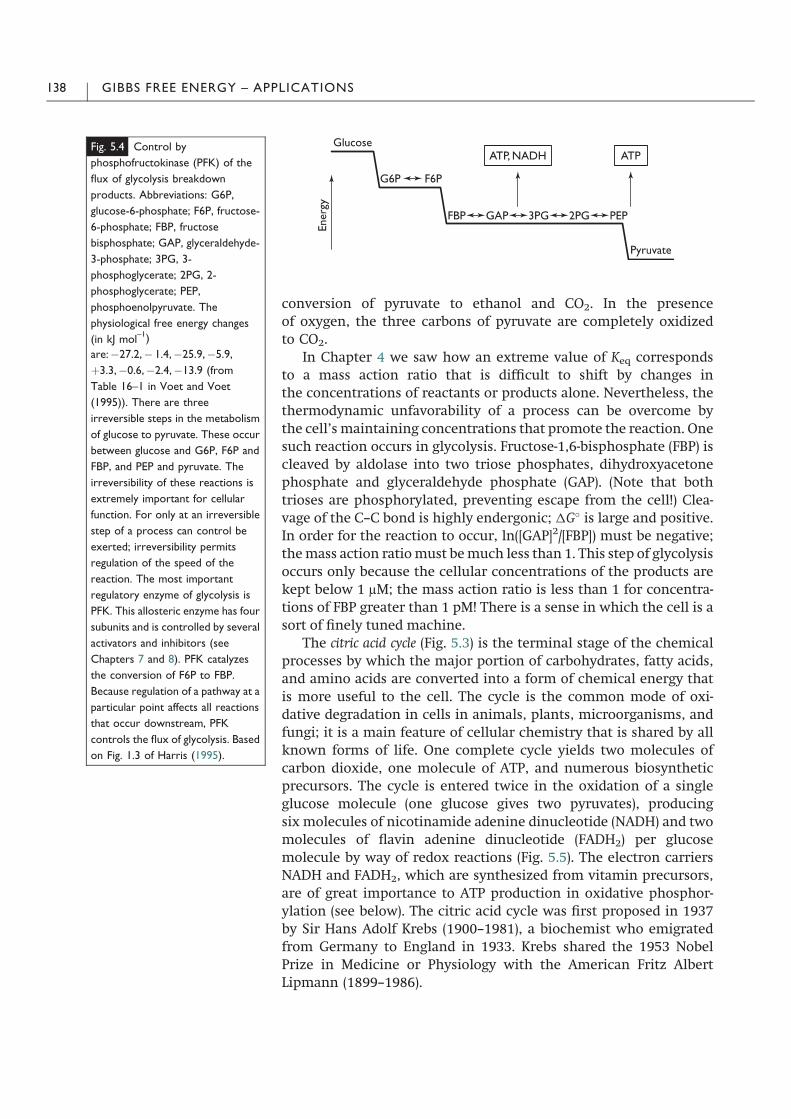
conversion of pyruvate to ethanol and CO2. In the presenceof oxygen, the three carbons of pyruvate are completely oxidizedto CO2.
In Chapter 4 we saw how an extreme value of Keq correspondsto a mass action ratio that is difficult to shift by changes inthe concentrations of reactants or products alone. Nevertheless, thethermodynamic unfavorability of a process can be overcome bythe cell’s maintaining concentrations that promote the reaction. Onesuch reaction occurs in glycolysis. Fructose-1,6-bisphosphate (FBP) iscleaved by aldolase into two triose phosphates, dihydroxyacetonephosphate and glyceraldehyde phosphate (GAP). (Note that bothtrioses are phosphorylated, preventing escape from the cell!) Clea-vage of the C–C bond is highly endergonic; 1G! is large and positive.In order for the reaction to occur, ln([GAP]2/[FBP]) must be negative;themass action ratiomust bemuch less than 1. This step of glycolysisoccurs only because the cellular concentrations of the products arekept below 1 !M; the mass action ratio is less than 1 for concentra-tions of FBP greater than 1 pM! There is a sense in which the cell is asort of finely tuned machine.
The citric acid cycle (Fig. 5.3) is the terminal stage of the chemicalprocesses by which the major portion of carbohydrates, fatty acids,and amino acids are converted into a form of chemical energy thatis more useful to the cell. The cycle is the common mode of oxi-dative degradation in cells in animals, plants, microorganisms, andfungi; it is a main feature of cellular chemistry that is shared by allknown forms of life. One complete cycle yields two molecules ofcarbon dioxide, one molecule of ATP, and numerous biosyntheticprecursors. The cycle is entered twice in the oxidation of a singleglucose molecule (one glucose gives two pyruvates), producingsix molecules of nicotinamide adenine dinucleotide (NADH) and twomolecules of flavin adenine dinucleotide (FADH2) per glucosemolecule by way of redox reactions (Fig. 5.5). The electron carriersNADH and FADH2, which are synthesized from vitamin precursors,are of great importance to ATP production in oxidative phosphor-ylation (see below). The citric acid cycle was first proposed in 1937by Sir Hans Adolf Krebs (1900–1981), a biochemist who emigratedfrom Germany to England in 1933. Krebs shared the 1953 NobelPrize in Medicine or Physiology with the American Fritz AlbertLipmann (1899–1986).
Fig. 5.4 Control by
phosphofructokinase (PFK) of the
flux of glycolysis breakdown
products. Abbreviations: G6P,
glucose-6-phosphate; F6P, fructose-
6-phosphate; FBP, fructose
bisphosphate; GAP, glyceraldehyde-
3-phosphate; 3PG, 3-
phosphoglycerate; 2PG, 2-
phosphoglycerate; PEP,
phosphoenolpyruvate. The
physiological free energy changes
(in kJ mol–1)
are:$27.2,$ 1.4,$25.9,$5.9,
#3.3,$0.6,$2.4,$13.9 (from
Table 16–1 in Voet and Voet
(1995)). There are three
irreversible steps in the metabolism
of glucose to pyruvate. These occur
between glucose and G6P, F6P and
FBP, and PEP and pyruvate. The
irreversibility of these reactions is
extremely important for cellular
function. For only at an irreversible
step of a process can control be
exerted; irreversibility permits
regulation of the speed of the
reaction. The most important
regulatory enzyme of glycolysis is
PFK. This allosteric enzyme has four
subunits and is controlled by several
activators and inhibitors (see
Chapters 7 and 8). PFK catalyzes
the conversion of F6P to FBP.
Because regulation of a pathway at a
particular point affects all reactions
that occur downstream, PFK
controls the flux of glycolysis. Based
on Fig. 1.3 of Harris (1995).
138 GIBBS FREE ENERGY – APPLICATIONS

C. Oxidative phosphorylation andATP hydrolysis
The NADH and FADH2 molecules generated by the citric acid cycleplay a central role in oxidative phosphorylation, the complex processwhereby ADP and inorganic phosphate are combined to form ATP.From a quantitative point of view, oxidative phosphorylation is themost important means by which a cell generates ATP: completemetabolism of 1 mole of glucose by the citric acid cycle yields amaximum of 38 moles of ATP (2 from glycolysis, 2 from the citricacid cycle, and 34 from reoxidation of NADH and FADH2). ATP is themost commonly utilized form of energy in a cell (Chapter 1).
The term bioenergetics usually refers to the way the in which cellsgenerate energy from foodstuffs. The main concept of bioenergetics
Fig. 5.5 Electron carriers in metabolism. NAD is a major soluble redox intermediate in metabolism. It is closely related to
NADP, another redox intermediate. NAD and NADP differ in that the latter is phosphorylated on the adenylate ribose
(R" phosphate in NADP, R"H in NAD). NADH shuttles electrons to electron transfer chains, NADPH provides electrons for
biosynthesis. Neither NADH nor NADPH can form a stable one-electron intermediate, whereas FAD, a protein-bound cofactor,
can form a one-electron semiquinone. Both NAD# and FAD comprise ADP and are synthesized from ATP (see Fig. 5.7). Energy and
matter, matter and energy, energy and matter . . .
OXIDATIVE PHOSPHORYLATION AND ATP HYDROLYSIS 139
is chemiosmotic theory, which states that energy stored as a protongradient across a biological membrane (the so-called proton motiveforce) is converted to useful chemical energy in the form of ATP. Oneof the key contributors to the understanding of biological energytransfer has been the British biological chemist Peter DennisMitchell (1920–1992), who was awarded the Nobel Prize in Chem-istry for his work in 1978.
The proton motive force is built up across the inner membraneof mitochondria in animals, the inner membrane of chloroplasts inplants, and the plasma membrane of aerobic bacteria (Fig. 5.6).Energy released from electron-transfer events in membrane-boundproteins is harnessed to generate the gradient. The chain of electrontransfer reactions in mitrochondria terminates in the reduction ofoxygen to water and the otherwise thermodynamically unfavorablepumping of protons across the membrane against the concentrationgradient. The movement of protons down their gradient throughthe enzyme ATP synthase, the most complex structure in the innermitochondrial membrane, results in the synthesis of ATP from ADPand inorganic phosphate. The difference in proton concentrationacross the membrane can be measured as a difference in pH. Therole of mitochondria in coupling the phosphorylation of ADP to theelectron transfer from reduced NAD to oxygen was shown by AlbertLester Lehninger (1917–1986) and associates at Johns Hopkins. Lestanyone think that the underlying electron-transfer reactions areunimportant to the end result, the mechanism underlying thetoxicity of the highly poisonous cyanide ion involves binding to andinhibition of the cytochrome a-cytochrome a3 complex (cytochromeoxidase) in mitochondria, and the poison sodium azide, which isadded to protein solutions to inhibit the growth of bacteria, inhibitscytochrome c oxidase and thereby ATP synthase.
ATP, once synthesized, is put to use by the cell in many ways. Forexample, the free energy change of ATP hydrolysis is employed topower a tremendous variety of otherwise thermodynamicallyunfavorable biochemical reactions. In essence what ATP does in thiscontext is provide free energy on the loss of its terminal phosphategroup by hydrolysis of the phosphoanhydride bond (Fig. 5.7). Chemicalcoupling of ATP hydrolysis (Chapter 4) then “energizes” metabolicreactions which on their own cannot occur spontaneously. ATP is acommon intermediate of energy transfer during anabolism, cellularprocesses by which energy is used to synthesize complex moleculesfrom simpler ones.
In certain specialized cells or tissues, the chemical energy of ATPis used to do other kinds of chemical work, for example, themechanical work of muscle contraction and cell movement(Chapter 8). ATP is required for osmotic work, the transport of ionsother than H3O
# or metabolites through a membrane against a con-centration gradient (below). ATP is also a major energy source in thesynthesis of macromolecules from monomers, e.g. polysaccharidesfrom individual sugar molecules and polypeptides from amino acids
140 GIBBS FREE ENERGY – APPLICATIONS

Fig. 5.6 Proton movement in
bacteria, mitochondria, and
chloroplasts. Note the
similarities and differences in
membrane orientation and direction
of proton movement. In bacteria,
mitochondria, and chloroplasts, the
protein complex in which ATP is
synthesized in situated on the
cytosolic face of the membrane.
Electron transport results in
translocation of protons from the
cytosolic side to the exoplasmic side
of the membrane, creating a pH
gradient. This is used to generate
ATP as protons move down the pH
gradient into cytoplasmic side. The
similarities in ATP generation in
bacteria, mitochondria, and
chloroplasts point to the profound
unity of all known living organisms.
Adapted from Fig. 17–14 of Lodish
et al. (1995).
Fig. 5.7 The structure of adenosine
triphosphate. There are three main
components: adenine, a base found
in RNA and DNA; ribose, a sugar;
and triphosphate. In most
biochemical reactions in which it is
involved, ATP is hydrolyzed to ADP
and inorganic phosphate. The bond
broken in this reaction is a
phosphoanhydride bond. The pKasof the dissociable protons are
different (see Chapter 4).
OXIDATIVE PHOSPHORYLATION AND ATP HYDROLYSIS 141

(Table 5.1). In respect of all this, ATP is known as the “universal bio-chemical energy currency” (Chapter 1). We can see that there aremany possible ways in which the free energy of a single glucosemolecule can be distributed throughout a cell!
The vital importance of ATP in metabolism was first recognizedby Fritz Lipmann and Herman Kalckar in 1941. Over 60 years on, therole of ATP in the cell is no less important than at any other point inthe Earth’s history (it seems). So we had better know somethingabout it! The hydrolysis of ATP to ADP and Pi can be symbolized as
ATP#H2O , ADP# Pi #H#: %5:3&
Using Eqns. (4.32) and (4.38), the free energy change for this reactioncan be expressed as
1G " 1G! 0 # RTln,ADP-,Pi-=,ATP-: %5:4&
To keep things simple, we assume ideal behavior. Note that [H#] and[H2O], which are practically independent of the concentrations ofthe other species, are not included explicitly in Eqn. (5.4) (refer tothe previous chapter if you are not sure why!). 1G!0 for Eqn. (5.4) isabout $7 kcal mol$1. Does this hold for the cell, where conditionsare of course very different from the standard state? Assuming thatthe cellular concentration of each species is 10 mM (a very roughestimate), Eqn. (5.4) says that 1G"$7 kcal mol$1# [1.987 cal mol$1
K$1 · 298 K · ln(0.010)]"$7 kcalmol$1 $ 2.7 kcal mol$1'$10 kcalmol$1'$ 42 kJ mol$1.4 That’s a 40% increase in the driving force forhydrolysis over standard state conditions! In other words, theequilibrium in Eqn. (5.3) makes a big shift towards the productswhen the solution is dilute. And according to the Second Law, if ATPhydrolysis releases about 10 kcal mol$1 at cellular concentrations, atleast that much energy must have been consumed to synthesize ATPin the first place! Where does the energy come from?
The foregoing discussion increases our sense of awe of how theworld is put together, but it also teaches some practical lessons.
Table 5.1. ATP requirements of macromolecule formation
Macromolecule Subunit type
ATP expenditureper monomeradded (mol mol$1)
Polysaccharide Sugar 2Protein Amino acid 4Lipid CH2 unit from
acetic acid1
DNA/RNApolymerization
Nucleotide 2
4 In skeletal muscle, [ATP] is )50 · [AMP] and )10 · [ADP]. Using these values, 1G iseven more exergonic, possibly as large as $60 kcal mol$1.
142 GIBBS FREE ENERGY – APPLICATIONS
Hydrolysis of ATP is clearly spontaneous in aqueous solution, andthe reaction occurs relatively rapidly at 25 !C. (In vitro, the half-life ofATP is on the order of days at this temperature, and in the cell,where it is needed for metabolism, it is less than 1 s.) If the ratio ofthe in vitro to in vivo half-life were not large, ATP would be less auseful energy storage molecule than we know it to be. The hydro-lysis rate of ATP and its dependence on concentration in thelaboratory require that ATP-containing buffers be made up fresh andstored cold. For the same reason solutions of the free nucleotidesused in the polymerase chain reaction (PCR, see below) are usuallystored frozen at $20!C and thawed immediately before use.
Measurement of the enthalpy change ofATPhydrolysis shows that1H! "$4 kcal mol$1. That is, hydrolysis of one mole of ATP at 25 !Cresults in about 4 kcal being transferred to the solution in the form ofheat and about 3 kcal remaining with ADP and Pi in the form ofincreased randommotion.Wecan combineourknowledge of the freeenergy and enthalpy changes to calculate the entropy change ofATP hydrolysis. Solving Eqn. (4.2) for 1S when 1T"0, we have 1S!
" (1H! $ 1G!)/T. At 310 K, 1S! " ($4 kcalmol$1 $ ($7 kcal mol$1))/(310 K)" 10 cal mol$1 K$1. This is roughly the amount of entropy yourbody generates every time an ATP molecule is hydrolyzed. So, nomatter howmuch youmight feel your eyes glazing over at the sight ofmore 1s and cals, and no matter how much you might feel that bio-logical thermodynamics is catalyzing the transition of your brainfromanormal to a vegetative state, because you’re simply alive you’redoing a very fine job indeed of degrading the useful energy of theuniverse!
A couple of other pertinent points can be made here. One is thatthree of the four phosphate hydroxyl groups of ATP have pKa valuesaround 1.5. These are effectively completely ionized at neutral pH.In contrast, the fourth one has a pKa of 6.5. This suggests that the netcharge on any given ATP molecule might have a large impact on itscellular function. A second point is that the free energy differencebetween ATP and ADP# Pi is not the same as that between the plus-phosphate and minus-phosphate forms of other biomolecules.Glucose-6-phosphate, for instance, an important molecule in gly-colysis, transfers its phosphate group to water with a standard statefree energy change of about $3 kcal mol$1. This is a substantiallysmaller energy change than for hydrolysis of ATP. The driving forcefor the chemical transfer of a phosphoryl group is known as phos-phoryl group-transfer potential. ATP has the higher phosphoryl group-transfer potential of the two molecules. One might wonder whetherATP has the highest standard free energy of hydrolysis of all naturallyoccurring phosphates? No! ATP occupies a position about midwaybetween extremes in tables of the standard free energy of hydrolysisof phosphate compounds (Table 5.2). ATP’s being small and in themiddle of the phosphate energy scale is likely an important deter-minant of its role in the cell.
OXIDATIVE PHOSPHORYLATION AND ATP HYDROLYSIS 143

Now let’s look at a few other aspects of the cellular role of ATP:activity of glycogen synthase, synthesis of cyclic AMP, binding ofATP to hemoglobin, and inhibition of thermogenin in heat genera-tion. Glycogen is a polymeric form of glucose that can be readilymetabolized in times of need. Synthesis of glycogen involves thetransfer of the glycosyl unit of uridine diphosphate glucose (UDPG)to an existing carbohydrate chain. UDPG is synthesized fromglucose-6-phosphate and uridine triphosphate (UTP), a moleculeinvolved in the synthesis of mRNA. Note the close “coupling”between energy storage and metabolism and information storageand expression. Marvellous efficiency! Replenishment of UTP occursby means of a phosphoryl transfer reaction mediated by nucleotidediphosphate kinase. This enzyme catalyzes the transfer of a phos-phoryl group from ATP to UDP, yielding ADP and UTP. Thenreplenishment of ATP occurs by means of a phosphoryl reactionmediated by ATP synthase and a proton gradient, and replenish-ment of the proton gradient occurs by means of oxidation ofglucose . . .
ATP is a precursor in the synthesis of 30,50-cyclic AMP (cAMP), animportant intracellular signaling molecule known as a second mes-senger (Fig. 5.8).5 The concentration of cAMP in the cell increases ordecreases in response to the tight and specific binding of an extra-cellular molecule to a cell-surface receptor. For instance, [cAMP]goes up when a specific odorant receptor on a cell in the olfactoryepithelium binds an odorant molecule, for instance, one of thearomatic ketones or amines mentioned in Chapter 3. Bindinginduces a conformational change in the receptor, and an intracel-lular protein that interacts with the cytoplasmic part of the receptorthen activates adenylyl cyclase, the membrane-bound enzymeresponsible for synthesis of cAMP from ATP. Once made, cAMP thenmoves throughout the cytoplasm, interacting with a wide range
Table 5.2. Standard free energy changes of hydrolysis of somephosphorylated compounds
Compound 1Go0 (kJ mol$1)
Glucose-1-phosphate $20.9Glucose-6-phosphate $13.8Fructose-6-phosphate $13.8ATP ! ADP#Pi $30.5ATP ! AMP# Pi $32.5Phosphocreatine $43.1Phosphoenolpyruvate $61.9
Data are from Jencks, W. P., in Fasman, G.D. (ed.) (1976) Handbook of Biochemistry and MolecularBiology, 3rd edn, Physical and Chemical Data, Vol. I, pp. 296–304. Boca Raton: CRC Press.
5 This term was introduced in 1964 by Earl Sutherland (1915–1974), an American, thediscoverer of cAMP.
144 GIBBS FREE ENERGY – APPLICATIONS

of proteins. In this way, cAMP “mediates” the response of thecell to the ligand, be it an odorant molecule, hormone, or neuro-transmitter. Again, there is a connection between energy andinformation, in that the small energy molecule ATP is involved inthe communication throughout the cell of a signal received at thecell membrane. Later in this chapter we shall look at an example ofthe mechanics of binding interactions, and the subject will be cov-ered in considerable detail in Chapter 7.
The physiological role of ATP does not always involve hydrolysisor chemical conversion into an electron carrier or second messen-ger. In fish and most amphibians, ATP binds tightly to deoxygenatedhemoglobin but only weakly to oxygenated hemoglobin. The pro-tein hemoglobin plays a crucial role in respiration by transportingoxygen to cells for oxidative phosphorylation. Binding to ATP reg-ulates the function of hemoglobin by reducing its affinity foroxygen (see below and Chapter 7).
Box 5.1 Cool mice live longer
Obesity results when energy intake exceeds the energy expenditure. Experimental
studies have shown that calorie restriction reduces core body temperature in
rodents and primates. But is a lower core body temperature a simple consequence
of calorie restriction, or is lower body temperature itself beneficial for health?
Separate studies have found that lowering the core body temperature of
poikilotherms like fish slows aging and prolongs life. But is this true of homeotherms
like humans? To investigate the matter, Bruno Conti of the Scripps Research
Institute in La Jolla, California and his colleagues created an engineered strain of
laboratory mice. These animals have an overheated hypothalamus, the preoptic
area of which is the brain’s central thermostat. Heating up the hypothalamus
dispatches “Chill out!” signals to the rest of the body and thus decreases the core
temperature. Hypothalamic overheating in the engineered mice was achieved by
over-expressing uncoupling protein 2 (UCP2). Found in the inner membrane of
mitochondria, the powerhouses of the cell, UCP2 uncouples electron transport
from ATP production and thus dissipates as heat the energy stored in the proton
gradient across the mitochondrial membrane. UCP2 over-expression dissipated
more proton gradient energy as heat than in normal mice, elevated the
Fig. 5.8 Cyclic AMP. This molecule,
which is synthesized from ATP, plays
a key role in a variety of cellular
processes. Principal among these is
the control of glycogen metabolism
in muscle. Glycogen is the highly
branched high molecular mass
glucose polysaccharide that higher
animals synthesize to protect
themselves from potential fuel
shortage. The corresponding
polymer in plants is starch (Fig. 1.1).
Glycogen synthesis involves
glycogen synthase. This enzyme
catalyzes the transfer of the glucosyl
unit of UDP-glucose (itself
synthesized from glucose-1-
phosphate and UTP, one of ATP’s
brother molecules) to glycogen.
In glycogen breakdown, the enzyme
glycogen phosphorylase cleaves the
glycosidic bond linking glucose
monomers by the substitution of a
phosphoryl group. The products are
a slightly smaller glycogen molecule
and one molecule of glucose-1-
phosphate (G1P), which is
converted to glucose-6-phosphate
by phosphoglucomutase. The
nucleotides of information storage
in genetic material play an important
role in energy storage and utilization
in all known living organisms. cAMP
activates a protein kinase which
activates phosphorylase kinase
which, through phosphorylation,
activates glycogen phosphorylase
and inactivates glycogen synthase.
The cellular concentration of cAMP
is increased by adenylate cyclase,
which is activated by the binding of
glucagon or epinephrine to its
receptor in the plasma membrane.
When the hormone insulin binds to
its receptor, glycogen phosphorylase
is inactivated and glycogen synthase
is activated.
OXIDATIVE PHOSPHORYLATION AND ATP HYDROLYSIS 145
Box 5.1. Cont.
temperature of the hypothalamus, and dropped the core body temperature 0.3–
0.5 !C. Experimental female mice lived an average of 20% longer than controls;
experimental males, 12% longer. Sex hormones might influence the rate at which
some mice attain a lower core temperature. The experimental animals also
appeared to show greater metabolic efficiency than controls, suggesting that
fewer calories were needed to live. A take-home message for all you Ponce de
Leon wannabes out there: the fountain of youth is within you.
Above we saw how the proton gradient in mitochondria can becoupled to the membrane protein ATP synthase and used to synthe-size ATP. In brown adipose tissue, which contains large amounts oftriacylglycerols� (fatty� acid� triesters� of� glycerol,� or� fats,� see� Table� 1.2)and manymitochondria, the proton gradient can be uncoupled fromATP synthesis by means of a channel protein called thermogenin.Dissipation of the proton gradient in the absence of ATP generationmeans that brown adipose tissue acts as a “built-in heating pad.”Thermogenin is particularly plentiful in cold-adapted animals. Theactivity of thermogenin is under hormonal control. The adrenalhormone norepinephrine binds to its receptor and activates adeny-late cyclase, which makes cAMP, which activates a kinase thatphosphorylates a lipase, which hydrolyzes triacylglycerols to freefatty acids. When the concentration of free fatty acids is sufficientlyhigh, thermogenesis is activated, and thermogenin changes thepermeability of the inner mitochondrial membrane to protons andallows them back into the mitochondrial matrix without ATP pro-duction. Proton flow under the control of thermogenin is inhibitedby ATP, GTP, and the diphosphate forms of these nucleotides.
D. Substrate cycling
The reaction catalyzed by the glycolytic enzyme phospho-fructokinase is highly exergonic. Under physiological conditions,
fructose-6-phosphate # ATP ! fructose-1;6-bisphosphate # ADP;
%5:5&
with 1G"$25.9 kJ mol$1. This reaction is so favorable that it isessentially irreversible. But the reverse reaction can occur! It justwon’t do so on its own. In fact, the enzyme fructose-1,6-bispho-sphatase is present in many mammalian tissues, and it catalyzes theremoval of a phosphate group from fructose-1,6-bisphosphate asfollows:
fructose-6-bisphosphate # H2O ! fructose-6-phosphate # Pi: %5:6&
This also occurs spontaneously because 1G"$8.6 kJ mol$1, but thereverse reaction is more probable than in Eqn. (5.5). The net reaction
146 GIBBS FREE ENERGY – APPLICATIONS

is simply ATP hydrolysis, and 1G"$34.5 kJ mol$1. Note that,although the overall free energy change is negative, this coupledreaction is less favorable than transfer of the terminal phosphorylgroup of ATP to water. The opposing reactions of Eqns. (5.5) and (5.6)are called a substrate cycle.
Substrate cycles might seem to serve no useful purpose, since allthey do is consume energy. But nature is a subtle lover, and she ismore apt to reveal her charms to persistent humility than audaciouspresumption. The reverse reaction, far from being futile, constitutesa means of regulating the generation of product by the forwardreaction, because enzyme activity itself is regulated. In cases wherea substrate cycle is operative, metabolic flux is not simply a matterof the activity of an enzyme, but the combined activity of theenzymes working in opposite directions. There is thus exquisiteregulation of a metabolic pathway, adjusting as needed to the cell’smetabolic needs. The price paid for such control is the energy lost inthe combined forward and reverse reactions.
Substrate cycles also function to produce heat, helping tomaintain an organism’s temperature.6 So, although there is a highcost to control, it is clear that organisms make highly efficient use ofthe resource. It is also possible that heat production is important forcontrolling the rate of enzyme activity by controlling the tempera-ture of the enzymatic reaction (Chapter 8). In bumblebees,7 thepresence of fructose-1,6-bisphosphatase in flight muscle is thoughtto enable these insects to fly at temperatures as low as 10 !C:honeybees, which do not have fructose-1,6-bisphosphatase, cannotfly when it’s cold. Substrate cycling probably plays a key role inmaintaining body heat in many animals, including humans. It isstimulated by thyroid hormones, which are activated upon expo-sure of the organism to cold. It’s time for a change of topic.
E. Osmosis
We covered the concept of chemical potential in Chapter 4. Let’s useit to develop a topic of general importance in biochemistry: osmosis(Greek, push). When mineral ions and charged molecules areabsorbed by the small intestine, water follows by osmosis. We treatthis subject in a fair amount depth for two reasons: osmotic workunderlies many physiological functions – nerve conduction, secre-tion of hydrochloric acid in the stomach, and removal of water fromthe kidneys – and the subject involves a number of key subtletiesof thermodynamics. Before looking at the mathematics of osmosis,let’s first think about the situation qualitatively. This way, we’ll bemore certain to have a general sense of the matter before facing a
6 Some organisms obtain a significant amount of heat from their surroundings, forinstance basking lizards and snakes, which absorb heat from the Sun.
7 Previously called humble-bees in the UK.
OSMOSIS 147

page filled with equations. That osmosis is a pleasant-sounding wordmight help to move the discussion along . . .
Osmosis is an equilibrium phenomenon that involves a semi-permeable membrane (not necessarily a biological membrane). Semi-permeable in this contextmeans that there are pores in themembranethat allow smallmolecules like solvents, salts, andmetabolites topassthrough but prevent the passage of macromolecules like DNA, poly-saccharides, andproteins. Biologicalmembranesare semi-permeable:large solute molecules are impermeant. Like freezing point depressionand boiling point elevation, osmosis is a colligative property.
Suppose we have an osmometer, also called a U-tube, with armsseparated by a semi-permeable membrane (Fig. 5.9). Let the tem-perature be constant. If no solute is present the height of the solventis the same on both sides, because the pressure of the externalenvironment is the same on both sides. The situation changes onintroduction of an impermeant solute to one side. Let the solute be alargish protein, say hemoglobin, and let it be freeze-dried beforebeing added to the solvent. Freeze-dried protein occupies a relativelysmall volume. Initially, the height of the fluid is the same on bothsides of the osmometer, just as when no solute was present. Butwhereas before the solute occupied a small volume on the bench-top,now it is able to move freely throughout one side of the osmometer.There has been a large increase in the entropy of the solute! (If you arenot surewhy, see the discussion onperfume inChapter 3.)We requirethat the solute particles be free to roam about the entire volume ontheir side of themembrane, but that they not be able pass through themembrane. And just as a confined gas pushes against the walls of itscontainer (Chapter 2), the solution pushes against the atmosphereand against thewalls of the osmometer.What happens? There is a nettransfer of solvent from the side where no solute is present to theother side. This decreases the volume of pure solvent and increasesthe volume of solution. How can we explain what has happened?
Addition of solute to solvent reduces the chemical potential ofthe solvent (Chapter 4). This creates a difference in the chemicalpotential of the solvent between the pure side and the impureside. The difference in chemical potential is thermodynamically
Fig. 5.9 A simple osmometer. A
solute can move freely in a fraction
of the total volume of solvent. The
solution is separated from pure
solvent by a membrane that is
permeable to the solvent but not
the solute. There is a net flow of
solvent from the pure solvent to the
solution, resulting in the
development of a head of pressure.
This pressure is the osmotic
pressure, #" $g1h, where $ is
density of the solvent, g is
gravitational acceleration, and 1h is
the difference in fluid levels. As
described by van’t Hoff, #"CVoRT/m, where C is the mass of solute in
the volume of solvent, Vo is the
partial molar volume of the solvent,
and m is the molecular mass of the
membrane-impermeant solute.
Note that # is an approximately
linear function of C under some
conditions. Osmotic pressure data
can thus be used to measure the
molecular mass of an osmotic
particle.
148 GIBBS FREE ENERGY – APPLICATIONS
unstable; change must occur. The impure side has a lower solventchemical potential, so water moves down its concentration gradientuntil equilibrium is reached. From an entropic point of view, the flowof water into the side with solute increases the entropy of the solute,making the situation more stable. How is entropy increased? Neglect-ing interactions between the solute and solvent, the greater thevolume of solvent present, the larger the volume in which the solutecan distribute itself. There is a resemblance to the ideal gas expansiondiscussed in Chapter 3 (see Eqn. (3.23)). In the context of the perfumeexample, if it is applied in the bathroom, the perfume moleculesbecome distributed throughout the bathroom, but when the door isopened, the molecules begin to spread into the corridor. At equili-brium, the perfumemoleculeswill occupy the bathroomand corridor,i.e. the entire accessible volume. The concentration is reduced in theprocess, entropy is increased, andmoreworkwould have to be done togather all the molecules back together into the same place.
The flow of water from one side of the U-tube to the other mustresult in a change in the height of the water on the two sides. Itbecomes lower on the side of the pure solvent andhigher on the side ofthe impure solvent. After enough time, the system comes to equili-brium, and the driving force forwater tomove through themembranefrom the pure solvent to the solutionwill be equal inmagnitude to thehydrostatic pressure arising from the difference in height of the waterin the two arms (phydrostatic" $g1h, where $ is the density of thesolution). The hydrostatic pressure is the same as the additionalpressure onewould have to apply to the side of the U-tubewith solutein order to equalize the height on the two sides of the membrane.This pressure is called the osmotic pressure, and it was first studied inthe 1870s by the German botanist and chemist Wilhelm FriedrichPhilipp Pfeffer (1845–1920), the son of an apothecary.
Now let’s take a more mathematical approach to osmosis. Thisway of thinking about the subject is not necessarily superior to thequalitative approach just because it involves more equations, but itwill provide additional insight to our subject, and that’s what wewant. Mathematical or computational modeling of the physicalworld makes sense as long as it leads to insights that can be testedexperimentally. In our approach to modeling, the system is regar-ded as consisting of two phases, x and y. In x, the impermeantmolecules (component 2) are dissolved in the solvent (component 1).In y, only solvent molecules are present. Considering the solventalone, the requirement for equilibrium between the two phases is
1G "„x11nx1 # „
y11ny1" 0; %5:7&
where 1n1 stands for an incremental change in the number ofmoles of solvent. (See Eqn. (4.5).) Because 1nx1 " $1ny1 (because thegain of solvent molecules in one phase must come at the expense ofthe same number of molecules from the other phase),
„x1 " „
y1: %5:8&
OSMOSIS 149

The ledger balances. But wait! Something funny’s going on. Forregardless of the amount of solvent transferred through the mem-brane, we can’t avoid the requirement that „1 $ „o
1 " 1„< 0 (seeEqn. (4.10)). That is, the chemical potential of the solvent plus solutemust be lower than that of the pure solvent. Nevertheless, Eqn. (5.8)does say that the chemical potentials of the solvent in the two phasesmust be equivalent. Where did we err?
We didn’t! We conclude that there is a contradiction, that bio-logical thermodynamics is illogical and therefore a waste of time,that it was a mistake to study biology or in any case to do it in a placewhere biological thermodynamics forms part of the curriculum, andthat our best option would be to make our way to the college bar anddrink away our misery. Right? No way! Things are just starting to getinteresting! Let’s see if we can’t crack this nut now, and think abouta celebratory night out later on. But what can we do?
Above we showed that 1G"V1p$ S1T. Under isothermal con-ditions, 1T"0 and the free energy change is proportional to 1p. Tomake the resulting expression tell us what will happen when thenumber of solvent molecules is changed, we divide both sides by1n1. This gives
1G=1n1 " „1 " Vm;11p; %5:9&
where Vm,1 is the molar volume of component 1. We have found the“missing” term from our expression of the chemical potential ear-lier in this section! Taking into account the development leading upto Eqn. (4.12), where we saw how the chemical potential of a solventchanges when a solute is added, and adding in Eqn. (5.9), we have
„1 $ „!1 ' $RTC2V
!1=M2 # RT ln f1 # V!
1#; %5:10&
where the pressure difference has been symbolized as # (this hasnothing to do with the ratio of the circumference of a circle to itsdiameter; it is the symbol that is traditionally used to designate theosmotic pressure; # starts with the same sound as pressure). Addingin the extra term (Eqn. (5.9)) might strike you as a rather arbitraryway of doing math – one that would be fine for getting a correctresult on an exam but maybe dubiously valid. But we need toremember that in order for the equilibrium condition to be met, wemust have a balance of forces, and we can write down an equation –an expression of balance – only if we take into account everythingthat’s relevant. There was indeed a contradiction earlier because wehad assumed that the system was at equilibrium when in fact wehadn’t taken the pressure term into account. Note that in Eqn. (5.10)we have assumed Vm;1 ' V!
1; the molar volume of pure solvent,which is valid for dilute solutions. The pressure difference # is thepressure that must be applied to the solute side of the U-tube tomake the fluid height the same on both sides.
We can simplify Eqn. (5.10) a bit. If the solution is ideal, f1' 1and RT lnf1'0. At equilibrium, „1 $ „o
1 " 0: It follows that
# " RTC2=M2: %5:11&
150 GIBBS FREE ENERGY – APPLICATIONS

This is the van’t Hoff law of osmotic pressure for ideal dilute solu-tions, named in honor of the scientist who gave Pfeffer’s work amathematical foundation.8 Equation (5.11) can be used to measurethe mass of an impermeant solute particle (though there are easierand more accurate ways to do it). Note how Eqn. (5.11) looks likeEqn. (4.12). You may already have noticed how closely Eqn. (5.11)resembles the ideal gas law (pV" nRT or p" nRT/V"CRT, where n isnumber of particles and C is concentration). C2, the concentration ofsolute, is the mass of solute particles added to a known volume ofpure solvent. What van’t Hoff found was that the measured osmoticpressure was basically the pressure of n solute particles movingaround in volume V, the volume of the solvent through which thesolute particles are free to move!
The degree to which Eqn. (5.11) matches experimental resultsvaries with concentration and solute (Fig. 5.10). There are severaldifferent ways of trying to cope with the situation, but our concernwill be with just one of them here. Time is spent on it at all becauseit’s a generally useful method. We express the thermodynamicobservable quantity (here, #) as a series of increasing powers of anindependent variable, (here, C) and check that the dominant term isthe same as we found before (Eqn. (5.10)) when the independentvariable takes on an extreme value (low concentration limit, as weassumed above):
# " C2RT
M2%1# B1%T&C2 # B2%T&C2
2 # . . .&: %5:12&
The Bi(T) terms are constant coefficients whose values are solute-and temperature-dependent and must be determined empirically. IfC2 is small, only the first term makes a significant contribution to #
(convince yourself of this!), just as in Eqn. (5.10). If only the first two
Fig. 5.10 Osmotic pressure
measurements. Osmotic pressure
increases with concentration of
solute, as predicted by the van’t
Hoff law. The pressure at a given
concentration of solute depends
significantly on the solute. If the
solute is a salt, dissociation in
aqueous solution will result in a
greater number of particles than
calculated from the molecular mass
of the salt. The van’t Hoff law is
exact for an ideal solution. At high
solute concentrations, non-linear
behavior can be detected. Such
behavior can be accounted for by
higher order terms in C. The data
are from Table 6–5 of Peusner
(1974).
8 The Dutch physical chemist Jacobus Henricus van’t Hoff (1852–1911) was therecipient of the Nobel Prize in Chemistry in 1901, the first year in which theprestigious awards were made.
OSMOSIS 151

terms make a significant contribution to #, a plot of #/C2 will belinear in C2 with slope B1(T)RT/M2 and intercept RT/M2. This permitsindirect measurement of M2 and B1(T). Equation (5.12) can readily begeneralized to include contributions from different species ofosmotic particle:
#total " #1 # #2 # . . . # #n " 6#i: %5:13&
If a solute species is present on both sides of themembrane, and if thissolute cannot pass through the membrane, it will make a contribu-tion to the total osmotic pressure, but only if there is a concentrationdifference. In such cases, #i is proportional not to Ci, as in Eqn. (5.12),but to 1Ci, the concentration difference across the membrane.
Now let’s leave the wispy world of mathematics and migrateover to a more material physical biochemistry. Osmosis can be avery strong effect. At 25!C, a 1 M solution of glucose, a relativelysmall “osmolyte,” gives a pressure more than 25 times greater thanthat of the atmosphere; 1 M solutions of salts give even largerosmotic pressures (see Fig. 5.10), though the ions are smaller thanglucose, even when hydration is taken into account. Osmotic forcesare important in biology because they play a key role in membranetransport of water, in all kinds of situations. For example, red bloodcells are full of impermeant solute particles, mainly hemoglobin;red cells have been called “bags of hemoglobin.” M2 is large, about68 000, and C2 is high, about 0.3 M or higher. When placed in purewater, there is initially a very large # across the membrane – about8 atm or greater, the approximate pressure when scuba diving at adepth of 70 m! The plasma membrane cannot withstand an osmoticpressure of this magnitude and breaks, spewing its hemoglobin intothe surrounding medium. Blood banks limit damage to red cellsafter separating them from plasma by centrifugation by resus-pending the cells in a sucrose solution (sucrose is membraneimpermeant) of approximately the same solute concentration asblood plasma (an isotonic solution).
Note the difference between the red blood cell in a solution oflow solute concentration (hypotonic solution) and impermeantparticles in an osmometer. In the osmometer, there is a real pres-sure difference. The presence of the impermeant particles results inthe formation of a pressure head, and the solution pushes downharder than it would if the solute were not there. But what if theosmometer were configured as a capillary tube oriented horizon-tally with a semi-permeable membrane in the middle? Water wouldmove through the membrane as before, and one could think of theeffect as arising from the pressure of n solute particles confined to avolume V of solvent. The thought experiment suggests that redblood cells burst in hypotonic solution because the hemoglobinmolecules inside the cell bang on the cell membrane much harderthan the water molecules bang on the membrane from the outside.Is that right?
152 GIBBS FREE ENERGY – APPLICATIONS
If a solution is at thermal equilibrium, then all the particles in thesystem have the same average thermal energy, irrespective of size.Big molecules like hemoglobin are relatively slow, little moleculeslike water are relatively fast (Chapter 1). But these molecules do nothave the same momentum (Chapter 2). From physics, the K.E. of aparticle is 1
2mv2"P2/m, where m is the mass, v is the velocity andP"mv is the momentum. Thermal energy is proportional to T, andat thermal equilibrium the K.E. of a particle is equal to its thermalenergy. So, P (mT)
12. In other words, the more massive the particle,
the greater its momentum. Note that P has nothing to do withparticle volume. So in a hypotonic solution, where there is nothingoutside the cell that cannot get inside, hemoglobin molecules dobang into the membrane from all directions a lot harder than watermolecules bang on the membrane from all directions. And theconcentration of water molecules on the inside certainly is lowerthan the concentration on the outside, but the concentration ofhemoglobin outside is 0. Therefore, it might be supposed, thebanging of hemoglobin molecules on the cell membrane causes thecell to burst. But wait, is not water also rushing into the cell? Wateris indeed pouring in, at a very high rate, seeking to destroy thegradient. The driving force for this flood, moreover, is very large. Itis also driven almost entirely by an increase in entropy. Water couldenter the cell before the surroundings become hypotonic, but therate in and rate out were the same. Now, with a net flow of waterinwards, the red blood cell swells, creating a larger and largervolume in which the massive hemoglobin molecules can diffuse,allowing them to display their Second Law tendency to disperse. Ithas been said that thermodynamics is a difficult subject becausethere are so many different ways of thinking about the same thing.Osmosis is a good example of the truth of that statement.
The actual situation with hemoglobin is more complicated thanwe’ve made it sound. This is because hemoglobin does not just floataround in a sea of water in a red blood cell; the protein interactswith the solvent. When particle interactions are taken into account,the volume of the particle does matter, because the more space ittakes up, the more surface it will expose to the solvent. This is thesource of the higher-order terms in Eqn. (5.12).
In contrast to red cells, some bacteria do not burst when placedin a hypotonic solution. This is because these organisms (as well asplant cells and fungi) can withstand high osmotic pressure gradientsby means of a rigid cell wall. When certain bacteria come intocontact with lysozyme, an enzyme we have encountered alreadyseveral times in this book, however, the bugs can be made to spilltheir guts. The biochemical activity of lysozyme is to cleave certainglycosidic bonds in the polysaccharides that give the bacterial cellwall its strength, weakening the cell wall. It is a rather good thingthat our bodies station lysozyme molecules at common points ofentry of foreign microbes, for example, the mucosal membrane in
OSMOSIS 153

the nasal passage. People with a mutant lysozyme gene have atougher time than most in fighting off infection, and they tend todie relatively young. One might surmise that early death resultsfrom too little lysozyme being available to make the cell walls ofbacteria more susceptible to osmotic stress. But the actual situationis more complex than that. That’s because the immune system has arole to play in fighting off infection, few pathogenic bacteria aresusceptible to lysozyme alone, and the mutant lysozyme proteins,which are less active than the wild-type enzyme, are also less ther-mostable than the wild-type enzyme and give rise to amyloid fibrilformation. Not only is the amyloidogenic lysozyme less active andtherefore less able to fight off infection, there is a net incorporationof the protein molecules into rigid fibril structures where they haveeffectively no enzymatic activity all. To make things worse, the bodyhas a hard time ridding itself of the fibrils, and their continuedincrease in size can be pathological (Chapter 8).
F. Dialysis
This section is a close relative of the previous one. There are twobasic forms of dialysis in biochemistry: non-equilibrium dialysis andequilibrium dialysis. We look at both here; the physics is basicallythe same in both cases. Dialysis is useful to the biochemist becauseit can be used to separate molecules according to size. It does this bymeans of a semi-permeable membrane, like the membrane in thesection on osmosis (Fig. 5.11). Many semi-permeable membranesused for dialysis are made of cellophane (cellulose acetate).
Fig. 5.11 Dialysis. A dialysis bag
containing a membrane-impermeant
solute is submerged in solvent in a
beaker. Membrane-permeant solute
appears on both sides of the
membrane. The dialysis bag-solvent
system is not at equilibrium. At
equilibrium, the concentration of
membrane-permeant solute will be
the same on both sides of the
membrane. A magnetic stir plate
and stirring bar are used to
accelerate the approach to
equilibrium; the flow rate of
membrane-permeant solute out of
the dialysis bag is related to the
concentration gradient of that
solute.
154 GIBBS FREE ENERGY – APPLICATIONS

Non-equilibrium dialysis is the use of a semi-permeablemembraneto change the composition of the solution in which macromoleculesare dissolved. For instance, one means of purifying recombinantproteins from E. coli host cells is to lyse the cells in 8 M urea, a smallorganic compound. Urea at a concentration of 8 M or higher willdenature most proteins at room temperature. Once the recombinantproteins have been separated from the bacterial ones (often by a typeof affinity chromatography), the recombinant protein solution istransferred to a dialysis bag. Then the bag is sealed and placed in alarge volume of buffer containing no urea. When equilibrium isreached, several hours later, the concentration of urea inside thedialysis bag has decreased and the concentration outside hasincreased, and the concentration of urea is about the same on bothsides of the membrane. What drives the change?
Initially, the concentration of solute particles is much higherwithin the dialysis bag than in the solution outside; some osmosisoccurs. The chemical potential of urea is very much higher in thebag and very low outside, at least initially; there will be a netmigration of urea out of the bag until the concentration gradienthas vanished. The continuous change in concentration of urea bothinside the bag and outside until equilibrium is reached and givesrise to a continuous change in osmotic pressure. The osmotic effectcan be substantial when working with a high urea concentration,leading to a substantial increase in the volume of material inside thebag during dialysis. So, to avoid possible rupture of tubing and lossof a precious sample, leave room in the bag for an influx of water!
Is any work done in the net migration of urea out of the bag? No!Despite similarities to osmosis, the situation here is qualitativelydifferent. True, urea moves down its concentration gradient, butthere is no corresponding development of a pressure head as inosmosis. In other words, nothing retards the dilution of urea, justlike nothing opposes the expansion of gas into vacuum, so no pV-work is done. The experiment can be carried out in isolation, soq"0. Then by the First Law, 1U" 0. If the pressure is constant, then1H" 0. And if the temperature is constant as well, G is a thermo-dynamic potential function. But the process we’ve outlined isirreversible! If we carry out the process very slowly, though, havingthe system pass through a series of near equilibrium states, we canevaluate1G. Recall thatG is a state function, so its value depends onlyon the initial and final states of the system, and not on whether theprocess was reversible or irreversible. The expansion of the urea, justlike the expansion of gas into vacuum, is spontaneous, so1G< 0. Thiscan only be true if 1S > 0, because 1H"0. No violation the SecondLaw, no problems.
Another concern of non-equilibrium dialysis is charge. Typically,the macromolecule in the dialysis bag will be ionized, and this willaffect osmosis by interactions with water. The solution being dia-lyzed out of the bag or into it will usually be a buffer of some sort,containing both charged and uncharged solute particles, and the
DIALYSIS 155

ratio and relative abundance of these will have an impact on themigration of water through the membrane.
And equilibrium dialysis? In some respects it’s rather similar tonon-equilibrium dialysis. In others, it has a more specific meaningthan dialysis and therefore deserves to be treated somewhat sepa-rately. Suppose you are interested in the binding of a macro-molecule to a membrane-permeant ligand. This presents anopportunity for quantitative analysis of the binding interaction. Tosee how, suppose we have a two-chambered device like that shownin Fig. 5.12. In the left side, you introduce a known amount ofmacromolecule in your favorite buffer, and on the right side, aknown amount of ligand dissolved in the same buffer. The ligandwill diffuse in solution, and the net effect will be movement downits concentration gradient, through the membrane. By mass actionthe ligand will bind to the macromolecule. After a sufficiently longtime, the two chambers will be at equilibrium; the concentration offree ligand will be the same on both sides of the membrane. Theamount of ligand on the side of the macromolecule, however, willbe higher by an amount depending on the strength of interactionbetween macromolecule and ligand. You can then use a suitableassay to measure the amount of ligand on both sides of the mem-brane, and the difference will be the amount bound to the macro-molecule. You then compare the concentration of “bound” ligand tothe concentration of macromolecule and to the concentration of“free” ligand, and use the results to calculate the binding constantand the number of ligand molecules bound per macromolecule. Thisis an important topic. See Chapter 7.
Fig. 5.12 Equilibrium dialysis. At
the beginning of the experiment
(t" 0), the membrane-impermeant
macromolecule and membrane-
permeant ligand are on opposite
sides of a semi-permeable dialysis
membrane. The two-chambered
system is not at equilibrium. After a
long time (t!1), the concentration
of free ligand is approximately the
same on both sides of the
membrane, in accordance with the
Second Law of Thermodynamics.
The number of ligand molecules is
not the same on both sides of the
membrane, however, as some
ligands are bound to the membrane-
impermeant macromolecules. The
bound ligand molecules are
nevertheless in equilibrium with the
free ones. Measurement of the
concentration of free ligand at
equilibrium and the total
concentration of ligand determines
the amount of bound ligand at
equilibrium.
156 GIBBS FREE ENERGY – APPLICATIONS

G. Donnan equilibrium
In our discussion of dialysis we barely mentioned charge effects.Here, we’ll see just how much more complicated things are whencharge is taken into account more formally. We need to engage withthe subject with this added degree of complexity, because all majorclasses of biological macromolecule – proteins, nucleic acids, andsomepolysaccharides – are charged.Moreover, in the living organismthese molecules are found not in pure water but in a saline solution.
Suppose we have a polyelectrolyte like DNA, and let it be dissolvedin a solution containing a simple salt, say NaCl. Suppose further thatthere are twophases to our system, just as in our discussion of osmosis.Now, though, one phase consists of water, Na# and Cl$ (phase Æ), andtheother consists ofwater,Na#, Cl$ andDNA (phase"). Thephases areseparated by a semi-permeable membrane, and DNA alone is imper-meant. At equilibrium, the concentration of ions will not be the sameon the two sides of the membrane except in the limit that [DNA]!0.Why not? Because DNA is anionic, so we should expect the con-centration of sodium to be higher on the side of the membrane withDNA than on the other side. In symbols, [Na#"]> [Na#Æ]. Let’s see if wecan obtain a quantitative expression for the concentration of ions.
At equilibrium, even though the concentrations aren’t equal, wemust have
„ÆNaCl " „
"NaCl: %5:14&
Let’s keep things simple and assume that the solution is ideal. Thechemical potential of the salt is
„NaCl " „!NaCl # RT ln,Na#-,Cl$-: %5:15&
At equilibrium, the standard state chemical potential must be thesame in both phases, so
,Na#Æ-,Cl$Æ- " ,Na#"-,Cl$"-: %5:16&
And the net charge of each phase must be equal to zero, a conditionknown as electroneutrality, which is expressed mathematically as
,Cl$Æ- " ,Na#Æ- %5:17&
z,DNA"- # ,Cl$"- " ,Na#"-; %5:18&
where z is the number of negative charges on the DNA. With a bit ofalgebra, these equations can be combined to give
,Na#"- " ,Na#Æ- 1# z,DNA"-,Cl$"-
!1=2
%5:19&
,Cl$"- " ,Cl$Æ- 1$ z,DNA"-,Na#"-
!1=2
: %5:20&
DONNAN EQUILIBRIUM 157

As expected, [Na#"] > [Na#Æ], neutralizing the charge on DNA inphase fl. Similarly, [Cl$"] > [Cl$Æ], though because of the minus signin Eqn. (5.20) the difference between phases is not as great as for theDNA counterions (Na). In such situations, the observed osmoticpressure gradient is produced by both the impermeant macro-molecule and the asymmetric distribution of small ions. This effect,called the Donnan equilibrium, was first described in 1911 by thephysical chemist Frederick George Donnan (1870–1956), son of aBelfast merchant. The effect pertains not only to membraneequilibria but to any situation in which there is a tendency toproduce a separation of ionic species. The asymmetric distributionof ions arises from the requirement of electroneutrality, and itsmagnitude decreases with increasing salt concentration anddecreasing macromolecule concentration, as can be seen fromEqns. (5.19) and (5.20).
The Donnan effect is even more complicated for proteins thanDNA. This is because the net charge on a protein, a sort of weakpolyion, is highly dependent on pH, whereas DNA, a sort of strongpolyion, has a net charge that varies relatively little with pH. Thegreater the net charge on a macromolecule, the greater the Don-nan effect. For proteins, the Donnan effect is minimized at theisoelectric point, where the net charge on the molecule is zero.There are no conceptual difficulties here, but you might find ittricky to work with proteins at their isoelectric point in thelaboratory. Protein solubility tends to be very low at the isoelectricpoint! A physiological example of where the Donnan effect isrelevant is in the red blood cell (RBC). The effect is caused mainlyby the huge concentration of hemoglobin inside the cell and theinability of hemoglobin to penetrate the membrane under isotonicconditions. Other ions present, for instance sodium and potas-sium, do not contribute to the Donnan effect because they aregenerally impermeant and their effects counterbalance ([K#]plasma '[Na#]cell and ([K#]cell ' [Na#]plasma). Chloride, bicarbonate, andhydroxyl ions, by contrast, can cross the membrane, and they con-tribute to the Donnan equilibrium. Experimental studies have shownthat the cell-plasma ratios of these ions are 0.60, 0.685, and 0.63,respectively. The marked deviations from 0.5 arise from the con-finement of hemoglobinwithin the cell. This has an impact on the pHof the blood since both bicarbonate and hydroxyl are bases.
H. Membrane transport
There is metabolic activity within cells, and an individual cell in ahigher eukaryote is separated from its surroundings by its plasmamembrane. The membrane enclosing the cell is about 10 nm thick.It comprises two layers of phospholipids, with the charged groupson the outside. The interior of a membrane is “oily” and thus gen-erally impermeable to ions and polar compounds. Some charged
158 GIBBS FREE ENERGY – APPLICATIONS

substances can pass through membranes, but most only by means oftransport proteins embedded in the lipid bilayer.
Membrane transport is said to be passive if a solute moves downits concentration gradient, and active if it moves against it. Anexample of active transport in cells is the movement of Na# and K#
across the cell membrane of red blood cells, nerves and musclecells – against the concentration gradient. The concentration of K#
in muscle is about 124 mM, some 60-fold greater than in serum.With Na# it’s the other way around, the concentration being about4 mM in muscle cells and 140 mM in serum. These ions will ofcourse tend to move down their concentration gradients to mini-mize free energy. But the gradients, which are important to cellfunction, are maintained by a membrane-spanning enzyme calledNa#/ K#-transporting adenosine triphosphatase. In order to maintainthe gradient, the cell must pay a cost – that of kicking out theunwanted ions that have come in and that of recovering the wantedones that have left. Gradient maintenance requires moving ionsfrom a region of low concentration to a region of high concentra-tion and therefore the expenditure of energy. The Na#/K#-trans-porter acts as an ion pump and is powered by ATP hydrolysis.Another example of active transport is the secretion of HCl into thegut of mammals by parietal cells – the home of many mitochondria!
A numerical example will help to motivate the discussion thatfollows. The change in chemical potential of glucose when it istransported down a 1000-fold glucose concentration gradient at37!C is given by Eqn. (4.32):
1„ " 8:314 Jmol$1K$1 · 310 K · ln%1=1000& " $17:8 kJmol$1:
%5:21&
That is, if the glucose concentration in the blood is high, as after ameal, and the concentration in cells is low, the sugar moleculesenter cells spontaneously. As we have seen, once the sugar gets in, itis “tagged” with a charged phosphoryl group, preventing its escapethrough the hydrocarbon membrane. And if the concentration ofchloride in the blood is about 100 mM, whereas that in the urineis about 160 mM, work must be done to pump chloride out ofthe blood and into the urine. You can easily calculate the workdone by the kidneys in this process: 1„" 1.9872 calmol$1
K$1 · 310 K · ln(160/100)"290 cal mol$1. Moreover, you can esti-mate the number of chloride ions transported per ATP moleculehydrolyzed: free energy change of ATP hydrolysis in the cell/energyrequired to transport Cl$" 10 000 calmol$1/290 calmol$1'34. Wehave ignored charge effects in the second calculation, but the mag-nitude should be about right.
We know from our study of the Donnan equilibrium that if thesolute particle is charged, as in the case of N# or K#, the situation ismore subtle. Equation (4.32) does still apply, but we also need to takeinto account theworkdone as the chargedparticlemoves through the
MEMBRANE TRANSPORT 159

electrical potential across the membrane, 1V. The magnitude of 1Vis 10$200 mV, depending on the cell type – giving an electric fieldstrength of as much as 200 000 V cm$1 across a membrane about100 A
!thick. This is only one order of magnitude smaller than the
field where dielectric breakdown of air occurs and lightning strikes!Across every membrane of every cell in your body! In Chapter 4 wesaw that the magnitude of the free energy change for electrical workis 1„" nF1V when the ionic charge is n. Adding this term to Eqn.(4.32), we obtain
1„ " RT ln,I-i=,I-o # nF1V ; %5:22&
where I represents an ionic solute and 1V"Vi $ Vo. The referencestate must be the same for both terms of the right-hand side of thisequation; in this case it is the extracellular matrix. When there is nodriving force to move an ion from one side of the membrane to theother, 1G"0 and
nF1V " $ RT ln,I-i=,I-o %5:23&
which, on rearrangement, becomes
1V " $RT
nFln
,I-i,I-o
: %5:24&
We can use Eqn. (5.24) and the measured potential across themembrane to determine the ratio of the concentrations of the ionicsolute. Let’s assume, for instance, that we are working with amonovalent cation (n"#1) at 300 K, and let 1V"120 mV. Solvingfor [I]i/[I]o, we have
,I-i=,I-o " exp%$nF1V=RT&" exp,%$96:5 kJ V$1mol$1 · 0:12 V&=%8:314 Jmol$1 K$1 · 300K&-" 0:01:
%5:25&
[I]o is 100 times greater than [I]i.At a number of points in this book nerve impulses have cropped
up, for example, in the context of olfaction, perfume, and the Sec-ond Law. Now we wish to expand on the underlying mechanisms,albeit in highly qualitative terms. The aim here is to show howthe development of this section fits within the broader picture ofhow animals work. Neurons, like other cell types, have ion-specific“pumps” situated in the plasma membrane. These protein machinesuse the energy of ATP hydrolysis to generate ionic gradients acrossthe membrane in a way that resembles how electron transportproteins use the energy of glucose metabolism to generate a protongradient (below).When at rest, a neuron is not very permeable to Na#
(which is concentrated outside the cell and dilute inside) or K#
(concentrated inside, dilute outside). There is a voltage on the orderof 60 mV across the “resting” membrane. Stimulation of a nerve
160 GIBBS FREE ENERGY – APPLICATIONS

cell results in a “depolarization” of the membrane. In the process,voltage-sensitive channel proteins that are selective for specific ionsare “activated” by the decrease in voltage, allowing Na# ions in andK# ions out. The combined effect of gain and loss of membrane per-meability to these ions is amillisecond time scale spike inmembranepotential, known as an action potential – the potential across themembrane is reflecting the action of nerve impulse transmission.Depolarization of one part of the membrane by an action potentialtriggers depolarization of the adjacent part of the membrane,thereby propagating the action potential down the axon of neuron.Nerve impulses travel in one direction only because a certain amountof time is required for the recently depolarized part of the cell toregenerate its ion gradient.
A protein that has been mentioned at several points above isATP synthase, the most famous of all transport proteins. ATPase isa type of molecular motor that plays a vital role in bioenergetics.Equation (5.22) can be used to describe the energetics of the“energy-transducing” membranes involved in ATP synthesis. In thiscase, the membrane of interest is the inner membrane of mito-chondria and the ion is hydronium. The term ln[I]i/[I]o becomes ln[H#]i/[H
#]o, which can be rewritten as 2.31pH (pH"$log[H#], andlnx' 2.3logx ). Substituting into Eqn. (5.22) and converting fromunits of energy to volts gives the proton motive force of che-miosmotic theory:
1„H# " 2:3RT%pHo $ pHi& # nF1V : %5:26&
The measured membrane potential across the inner membrane ofa liver mitochondrion is about $170 mV (Vi $ Vo), and the pH of itsmatrix is about 0.75 units higher than that of its intermembranespace. Thus,
1„ " ,2:3 · 8:314 Jmol$1 K$1 · 298K · %$0:75&-# ,1 · 96500 J V$1 mol$1 · %$0:17V&-;
%5:27&
the sum total being about$21 kJ mol$1 for transport of a protoninto the matrix.
The basic ideas discussed here apply not only to the synthesis ofATP from ADP and Pi and the accumulation of ions across a mem-brane, but also to a broad range of transport processes occurringacross plasma membranes and neuronal synaptic vesicles. Beforeconcluding this section, let’s take the opportunity to see how ATPsynthesis is a matter of energy coupling on a grand scale. This willhelp us to see how things tie together, how marvelously integratedthe various aspects of the living cell are.
As we have seen, glucose oxidation in aerobic organisms iscoupled to the reduction of oxygen to water. Electron transportproteins play a key role in the process. The overall redox reaction,which is energetically favorable, is used to pumpprotons against theirconcentration gradient to the opposite side of the membrane. Inother words, the pH of solution on one side of the membrane is
MEMBRANE TRANSPORT 161

different from that on the other side. And the voltage differenceacross the membrane, which is only about 10 nm thick, is about200 mV, so the electric field strength in the middle of the membraneis huge! Protonsmigrate down their concentration gradient through aprotein channel in the lipid membrane. Protons don’t pass straightthrough the membrane because it is made of lipids. The channel islined with polar chemical groups, making proton passage energeti-cally favorable (Fig. 5.13). An amazing thing about this protein chan-nel is that the energy change of proton translocation is coupled to anenergetically unfavorable process – ATP synthesis. This is not a trivialchemical coupling; remember, the free energy change onhydrolyzingATP to ADP is about 10 kcal mol$1 at cellular concentrations. For allpractical purposes, hydrolysis of ATP is irreversible! The point of thisdiscussion is that the cell (in fact, the mitochondria here, but theprinciples are the same for entire cells) must do work to generate theproton gradient. But there is a sort of purpose to thework. Nowonderwe need to eat from time to time! The cell is a sort of machine, and avery efficient one with regard to use of energy resources!
I. Enzyme–substrate interaction
In Chapter 2 we touched on the biological function of ribonucleaseA (RNase A), a digestive enzyme that hydrolyzes RNA to itscomponent nucleotides. We said that an inhibitor of the enzyme,20-cyclic monophosphate, can be used to study the enthalpy ofnucleotide binding to RNase A. One aim of Chapter 5 is to illustratethe general utility of Eqn. (4.2). In the present section we focus onhow Eqn. (4.2) applies to studies of the energetics of binding of smallcompounds to protein or DNA, taking RNase A as our example.
Figure 5.14 shows an outline of the reaction catalyzed by RNaseA. The scheme is based on the isolation of 20,30-cyclic nucleotidesfrom RNase A digests of RNA. There are four types of 20,30-cyclic
Fig. 5.13 Dependence of
electrostatic energy on distance
between charges and medium. The
energy is inversely proportional to
distance, so attraction or repulsion
is greatest when the charges are
close to each other. The energy also
depends substantially on the stuff
between the charges, varying
inversely with the dielectric constant
of the medium. The dielectric
constant is constant for a given
temperature and pressure, and it
must be determined empirically.
The interaction between charges is
greatest in vacuum. In water, where
the dielectric constant is very large,
charges must be very close for the
interaction between them to be
significant. Charge–charge
interactions are relatively large in
the core of a protein or in the
plasma membrane, because the
dielectric constant of hydrocarbon is
much lower than that of water.
162 GIBBS FREE ENERGY – APPLICATIONS
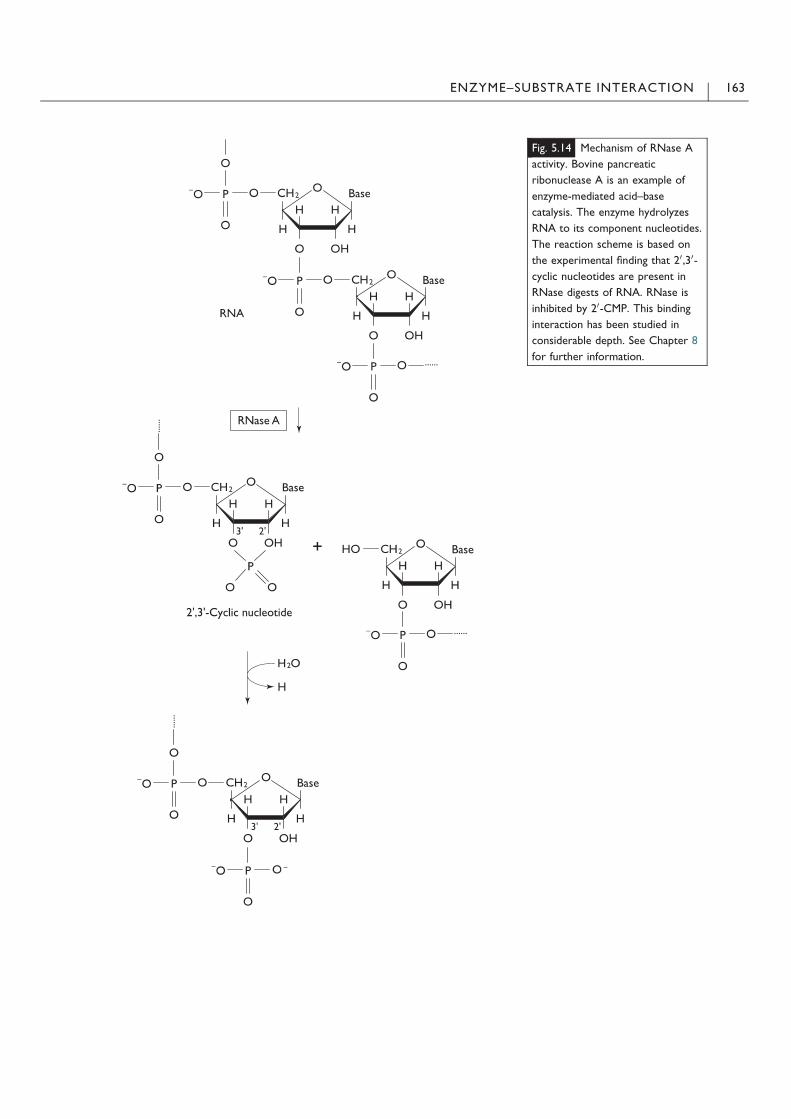
Fig. 5.14 Mechanism of RNase A
activity. Bovine pancreatic
ribonuclease A is an example of
enzyme-mediated acid–base
catalysis. The enzyme hydrolyzes
RNA to its component nucleotides.
The reaction scheme is based on
the experimental finding that 20,30-
cyclic nucleotides are present in
RNase digests of RNA. RNase is
inhibited by 20-CMP. This binding
interaction has been studied in
considerable depth. See Chapter 8
for further information.
ENZYME–SUBSTRATE INTERACTION 163

nucleotides. RNase A hydrolysis of one of them, cytidine 20,30-cyclicphosphate, has been studied extensively. The reaction is
cytidine 20; 30-cyclic phosphate%aq& # H2O%l& !cytidine 30-cyclic phosphate%aq& %5:28&
How might one determine 1G! for this reaction?From Eqn. (4.32),
1G " 1H $ T1S: %5:29&
If the products and reactants are in the standard state, the ther-modynamic relationship is
1G! " 1H! $ T1S!: %5:30&
We’ll need to know 1H! and 1S! to calculate the energy. Theenthalpy change of the reaction, which can be estimated by calori-metry, is$2.8 kcal mol$1. But what is 1S!? One approach would beto make use of the fact that S is a state function and combine mea-surements that, when summed, give1S! for Eqn. (5.28). The reactionscheme might look like this:
cytidine 20; 30-cyclic phosphate%aq& # H2O%l& !cytidine 20; 30-cyclic phosphate%s& # H2O%l&
%5:31&cytidine 20; 30-cyclic phosphate%s& # H2O%l& !
cytidine 30-cyclic phosphate%s& %5:32&
cytidine 30- cyclic phosphate%s& !cytidine 30-cyclic phosphate%aq&: %5:33&
Equation (5.31) represents the dissolution of cytidine 20,30-cyclicphosphate, Eqn. 5.32 the conversion of cytidine 20,30-cyclic phosphateto cytidine 30-cyclic phosphate in the solid state, and Eqn. (5.33) thedissolution of cytidine 30-cyclic phosphate. The sumof these reactionsis Eqn. (5.28), the conversion of cytidine 20,30-cyclic phosphate tocytidine 30-cyclic phosphate in aqueous solution. If the entropychanges of these several reactions can be measured, 1S! can be cal-culated for Eqn. (5.28). And combining1S! for Eqn. (5.28)with1H! forthe overall reaction will give 1G! for the overall reaction.
The entropy changes for Eqns. (5.31)–(5.33) have in fact beendetermined experimentally at 25!C. The values are: #8.22calmol$1 K$1, $9.9 cal mol$1 K$1, and #8.28 cal mol$1 K$1, respec-tively. The overall 1S! for these reactions is just the sum of the indi-vidual contributions, 6.6 cal mol$1 K$1. Combining this entropychangewith the calorimetric enthalpy change gives $2800 cal mol$1
$ 298K · 6.6 cal mol$1 K$1"$ 4800 cal mol$1. That 1G! is negativesuggests that cytidine 20,30-cyclic phosphate will hydrolyze sponta-neously in aqueous solution, and this is confirmed by experiment. Onecould test the role that RNase Amight play in this process by studyingthe effect of the wild-type enzyme and point mutants on the rate ofreaction. See Chapter 8.
164 GIBBS FREE ENERGY – APPLICATIONS

J. Molecular pharmacology
This is an important topic. The equations presented here are moregeneral than the section title may suggest, as they can be applied notonly to the interactions of drugs with membrane-bound receptor pro-teins but also to proteins that bind DNA, small molecules or ions.Binding interactions play a role in regulating enzyme activity andbiosynthetic pathways, oxygen transport and regulation of blood pH,and many (!) other physiological processes. But for now, let’s think ofbinding in the context of a single ligand–receptor interaction in phar-macology. Thiswill help tomotivate themathematical development. Amore thorough treatment of binding will be given in Chapter 7.
Equation (4.32) can beused to describe a chemical reaction in termsof reactants and products. But it could just as well represent the freeenergy difference between the “bound” and “free” states of a ligand, asmall molecule or an ion. Under appropriate conditions, a ligand willinteract with amacromolecule at a binding site. In some cases bindingis highly specific; in other cases, not. In either case,1G! represents thedriving force for binding under standard state conditions.
Here, we’ll represent the binding reaction as
R# L , R 0 L; %5:34&
where R is the receptor, L signifies free ligand molecules, and R 0 L isthe receptor–ligand complex. It is assumed that there is only onebinding site for L per receptor molecule. The association constant isdefined as
Ka " ,R 0 L-=%,R-,L-& %5:35&
and the dissociation constant is
Kd " K$1a " ,R-,L-=,R0L- " %,R-T $ ,R0L-&,L-=,R0L-; %5:36&
where [R]T" [R 0 L]# [R] is the total receptor concentration. Thefractional occupancy of ligand-binding sites, Fb, is
Fb " ,R 0 L-=,R-T" ,L-=%Kd#,L-&: %5:37&
A plot of Fb against [L] is shown in Fig. 5.15A. The shape of the curve isa rectangular hyperbola. Equation (5.37) indicates that Kd corresponds tothe concentration of L at which the occupancy of binding sites is half-maximal. Many physiological dissociation constants are on the orderof !M$nM. A nM binding constant is considered “tight binding.”When Eqn. (5.37) is plotted as percentage response against dose (forexample, mg of drug per kg of body weight), it is called a dose–responsecurve. The dose is often plotted on a logarithmic scale, giving the curvea sigmoidal appearance (Fig. 5.15B), but the underlying relationshipbetween dose and response is the same in both cases.
We can rearrange Eqn. (5.36) to obtain
,R 0 L-=,L- " %,R-T $ ,R 0 L-&=Kd: %5:38&
MOLECULAR PHARMACOLOGY 165

In this representation [R0L]/[L], the concentration of bound liganddivided by the concentration of free ligand, is a linear function of[R0L]. The slope of the curve is $1/Kd (see Fig. 5.16). The axis inter-cepts themselves represent interesting quantities: the intercept onthe vertical axis is [RT]/Kd, and the intercept on the horizontal axis isthe “binding capacity,” the “concentration” of ligand binding sites. Aplot of bound/free ligand versus bound ligand is called a Scatchardplot, after the American physical chemist George Scatchard (1892–1973). Radioactive methods are one way that biological scientistsmeasure the amounts of bound and free ligand.
Fig. 5.15 Binding. In panel (A) the
circles are experimental data points,
the solid line is a theoretical
description of binding. There is one
ligand-binding site per
macromolecule. In such cases, the
mathematical relationship between
the bound and free ligand
concentrations is a rectangular
hyperbola. Note that although half-
saturation occurs when
[L]"Kd" 1/Ka, [L]" 9Kd gives only0.9 saturation and [L]" 99Kd but0.99 saturation. In other words,
most of the information about
binding is in the free ligand
concentration range 0–2Kd.Experiments should be designed
accordingly. Panel (B) shows a
dose–response curve.
Fig. 5.16 Scatchard plot. The
concentration of bound ligand
divided by the concentration of free
ligand is plotted against the
concentration of bound ligand (nM).
When binding data are presented in
this way, the slope measures the
negative inverse of the dissociation
constant ($1/Kd"$Ka). Thevertical axis-intercept is [R]T/Kd, andthe horizontal axis-intercept is the
binding capacity (the concentration
of binding sites).
166 GIBBS FREE ENERGY – APPLICATIONS

Experiments can be done to determine the dissociation constantof other ligands that can compete for the same binding site as L. Forinstance, suppose you wish to test the effectiveness of a number ofcandidate drugs to compete directly with a physiological ligand L fora specific binding site on R. Let the candidate competitors be I1, I2,I3 . . . According to this model,
Kd;Ii " ,R-,Ii-=,R 0 Ii- %5:39&
for a general inhibitor compound, Ii. It can be shown that in thepresence of an inhibitor, the receptor–ligand complex, [R0L], is
,R 0 L- " ,R-T,L-Kd;L 1# ,Ii-
Kd;Ii
$ %# ,L-
: %5:40&
The relative affinity of a ligand in the presence of an inhibitor canbe found by dividing Eqn. (5.40) by Eqn. (5.38). This gives
,R 0 L-Ii,R 0 L-0
"Kd;L # ,L-
Kd;L 1# ,Ii-Kd;Ii
$ %# ,L-
: %5:41&
Equation (5.41) is zero for all concentrations of Ii when there is noinhibition (compound Ii has no effect), and it is 1 at 100% inhibition.The concentration of competitor Ii that gives 50% inhibition isdesignated [Ii,50]. At this concentration,
KIi ",Ii;50-1# ,L-
Kd;L
: %5:42&
Figure 5.17 shows the percentage inhibition for a number of dif-ferent inhibitors. Note that the shape of the curves resembles that inFig. 5.15a.
The above mathematical equations apply not only to naturalligands like the “fight-or-flight” hormone epinephrine and to com-petitive inhibitors like the “"-blocker” propranolol, which vies withepinephrine for binding sites on "-adrenergic receptors,9 but also tonoxious chemical substances like botulinum toxin. Moreover, theequations also apply to ligands of DNA, for example, repressor pro-teins that physically block the enzymatic transcription of mRNA bybinding to an operator site, and to protein–protein interactionsrelated to signal transduction. An example of ligand binding in asignal transduction cascade is the direct association of the SH2domain10 of the protein Grb2 to a specific phosphorylated tyrosineresidue on a growth factor receptor (Fig. 5.18).
Phosphotyrosine-mediated binding is of particular interest inbiological science for several reasons. One, it involves phosphory-lated tyrosine, and the phosphoryl group is acquired via catalysis bya kinase from ATP, the energy molecule. Phosphorylation and
9 The effects of "-blockers were first described by Sir James W. Black (1924–), a Scot.Sir James was awarded the Nobel Prize in Medicine or Physiology in 1988.
10 SH2, Src homology 2.
MOLECULAR PHARMACOLOGY 167

dephosphorylation of tyrosine is a type of dynamic molecular switchthat regulates cellular activity by controlling which proteins caninteract with each other. Phosphorylation also places severerestrictions on the relative orientation of interacting proteins. Animportant class of phosphotyrosine-mediated interactions is typifiedby phospholipase C!1 (PLC), an enzyme that interacts with phos-phorylated growth factor receptors by means of its two SH2 domainsand is involved in lipid metabolism. Binding of Grb2 to a receptorresembles that of PLC, but Grb2 has no catalytic activity; Grb2 is asort of “adaptor” protein. Two, there are several different types ofphosphotyrosine recognition module, and they are found in manydifferent proteins. Two of the best-known phosphotyrosine bindingmodules are the SH2 domain and the PTB (phosphotyrosine binding)domain. In some cases, both types are found in the same protein,for example, Shc11 and tensin. Three, the breadth of the range ofpossible interactions of a given type ofmodule is greatly increased bysubtle differences in structure. As a general rule, the amino acid side
Fig. 5.17 Effect of inhibitor on
ligand binding. When the
concentration of inhibitor i is lowand the inhibitor dissociation
constant is high, as in panel (A),
[R0L]i/[R0L]0 is nearly 1 even at low
concentrations of ligand.
Competition between ligand and
inhibitor is more evident when the
inhibitor concentration is increased
by a factor of 10. In panel (B), the
dissociation constant of the inhibitor
is 10 times smaller than in panel (A).
Note the marked impact this has on
[R0L]i/[R0L]0. The effect of
decreasing the dissociation constant
by yet another factor of 10 is shown
in panel (C). This is the sort of study
a pharmaceutical company might do
to characterize the properties of
inhibitors that could be used as
drugs. ITC can be used to screen
different compounds. Analysis of
such compounds will include not
only in vitro binding experiments
(high-affinity specific binding) but
also assessment of side effects (low-
affinity non-specific or high-affinity
unwanted binding).
11 Shc, Src homolog, collagen homolog.
168 GIBBS FREE ENERGY – APPLICATIONS

chains that interact directly with the ligand are conserved frommodule to module, but side chains nearby are specific to the proteinin which the module occurs. Such peculiarities underlie the speci-ficity of the interactions of an otherwise general protein structure.The general and specific interactions combine to give the overallbinding free energy. We can see here a close connection between theexistence and transmission of biological information and energy.
Finally, it should be mentioned that binding is a far more com-plicated phenomenon that we have made it seem. For instance, if amacromolecule can interact with more than one type of ligand atdifferent binding sites, there is the possibility that one kind ofmetabolite can “sense” the concentration of another, despite theabsence of a direct interaction between the metabolites. This aspectof the function of biological macromolecules, known as allostery,will be developed along with other aspects of binding in Chapter 7.
Fig. 5.18 Protein–protein interactions and phosphoryl transfer in signal transduction.
The extracellular concentration of the hormone insulin, a peptide signal, is communicated
across the plasma membrane by means of dimeric insulin-specific transmembrane
receptor molecules. The binding of insulin to its receptor results in receptor
autophosphorylation, the catalysis by one receptor molecule of the transfer of a
phosphoryl group from ATP to a tyrosine side chain of the other receptor molecule.
Phosphorylation of tyrosine acts as a molecular switch in the recruitment of proteins that
recognize specific phosphorylated tyrosine residues. One consequence of the chain of
events elicited by insulin binding is the phosphorylation of insulin-receptor substrate-1
(IRS-1). Again, ATP is involved. Once phosphorylated, IRS-1 can interact directly with the
proteins Grb2, Sos, and Ras. The last of these plays a very important role in cellular signal
transduction. The key point here is that several of the protein–protein interactions
involved in this and many other signaling cascades are mediated by phosphorylated
tyrosine, and phosphorylation of tyrosine depends on ATP. Signal transduction is a form
of biological communication and information processing. We shall return to this point in
Chapter 9. The figure is based on Fig. 20–48 of Lodish et al. (1995).
MOLECULAR PHARMACOLOGY 169

K. Hemoglobin
Most known organisms require oxygen for life; the only knownexceptions are some types of bacteria and archaea. Reduction ofmolecular oxygen to water plays a key role in the generation of ATP.In every cell in an aerobic organism, oxygen is used as fuel in thecombustion of glucose and production of ATP and carbon dioxide.Oxygen and glucose must be delivered to every cell in the body;carbon dioxide, a waste product, must be removed from every cell.Vertebrates carry out this food and gas transport by means of bloodor blood-like fluid that moves through a closed system of tubescalled the vasculature (Chapter 1). The vasculature makes contactwith the lungs, gills or skin on the one hand, and the peripheraltissues on the other hand.
Molecular oxygen is transported throughout the blood by anallosteric transport protein called hemoglobin. In view of this,hemoglobin has been called the “molecular lung.” Vertebratehemoglobin is a tetrameric protein, Æ2"2; it can be thought of as adimer of Æ" heterodimers. In invertebrates, hemoglobins range fromone to 144 subunits! Each subunit consists of a polypeptide chaincalled globin and a protoheme IX, a planar complex of an iron and ionprotoporphyrin� IX� (Fig.� 5.1).� Iron� plays� a� role� in� the� coordination� ofbound dioxygen. The ability of hemoglobin to bind oxygen dependsnot only on the structure of the protein and oxygen but also on thepartial pressure of oxygen.12 In hemoglobin, the extent of oxygenloading into binding sites influences the affinity of the other bindingsites to bind oxygen. The specific character of the amino acid chainsnear the protein–heme interface is essential for oxygen binding, asshown by amino acid replacement studies. Mutations in the region ofthe oxygen binding site can alter affinity for oxygen by over 30 000-fold! In the present section we introduce a number of aspects ofhemoglobin thermodynamics. The treatment will be brief. Amore in-depth look at oxygen binding is reserved for Chapter 7.
Now, if tetrameric hemoglobin is thermodynamically stableunder normal physiological conditions, the tetramer must representa minimum of free energy; the tetrameric state must be a lower freeenergy state than the other possible combinations of subunits, forexample Æ" dimers. (There are other possibilities, for example, akinetically trapped tetrameric state, but let’s ignore them for now.)A number of natural variants of human hemoglobin are known. Oneof these is the famous sickle-cell variant. As shown in Table 5.3, thefree energy difference between the tetrameric and dimeric states of
12 The partial pressure of a gas is just the contribution that it makes to the overall gaspressure. By Dalton’s Law, which is named after the John Dalton of the atomichypothesis, the total pressure is just the sum of the partial pressures of the gasespresent. For example, if the air pressure is 1 atm, the partial pressures of nitrogen,oxygen, and carbon dioxide sum to 1 atm.
170 GIBBS FREE ENERGY – APPLICATIONS
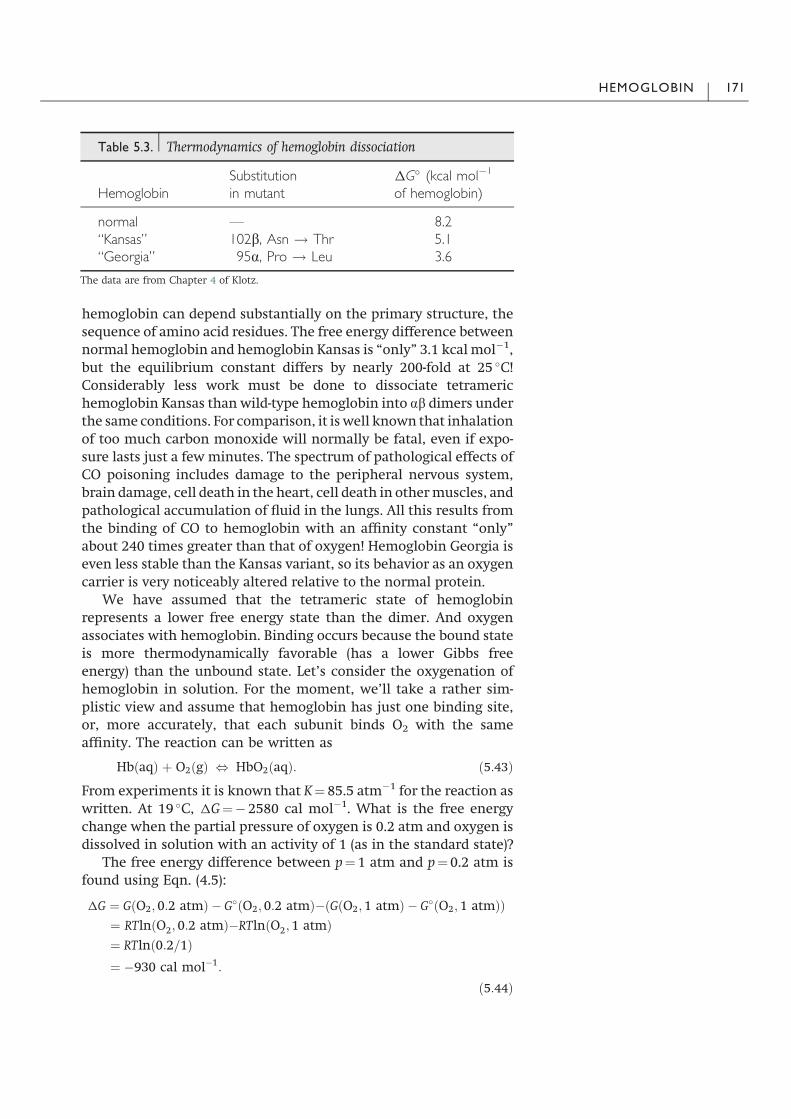
hemoglobin can depend substantially on the primary structure, thesequence of amino acid residues. The free energy difference betweennormal hemoglobin and hemoglobin Kansas is “only” 3.1 kcal mol$1,but the equilibrium constant differs by nearly 200-fold at 25 !C!Considerably less work must be done to dissociate tetramerichemoglobin Kansas than wild-type hemoglobin into Æ" dimers underthe same conditions. For comparison, it is well known that inhalationof too much carbon monoxide will normally be fatal, even if expo-sure lasts just a few minutes. The spectrum of pathological effects ofCO poisoning includes damage to the peripheral nervous system,brain damage, cell death in the heart, cell death in othermuscles, andpathological accumulation of fluid in the lungs. All this results fromthe binding of CO to hemoglobin with an affinity constant “only”about 240 times greater than that of oxygen! Hemoglobin Georgia iseven less stable than the Kansas variant, so its behavior as an oxygencarrier is very noticeably altered relative to the normal protein.
We have assumed that the tetrameric state of hemoglobinrepresents a lower free energy state than the dimer. And oxygenassociates with hemoglobin. Binding occurs because the bound stateis more thermodynamically favorable (has a lower Gibbs freeenergy) than the unbound state. Let’s consider the oxygenation ofhemoglobin in solution. For the moment, we’ll take a rather sim-plistic view and assume that hemoglobin has just one binding site,or, more accurately, that each subunit binds O2 with the sameaffinity. The reaction can be written as
Hb%aq& # O2%g& , HbO2%aq&: %5:43&
From experiments it is known that K" 85.5 atm$1 for the reaction aswritten. At 19 !C, 1G"$ 2580 cal mol$1. What is the free energychange when the partial pressure of oxygen is 0.2 atm and oxygen isdissolved in solution with an activity of 1 (as in the standard state)?
The free energy difference between p"1 atm and p"0.2 atm isfound using Eqn. (4.5):
1G " G%O2; 0:2 atm& $ G!%O2; 0:2 atm&$%G%O2; 1 atm& $ G!%O2; 1 atm&&" RTln%O2; 0:2 atm&$RTln%O2; 1 atm&" RTln%0:2=1&" $930 cal mol$1:
%5:44&
Table 5.3. Thermodynamics of hemoglobin dissociation
HemoglobinSubstitutionin mutant
1G! (kcal mol$1
of hemoglobin)
normal — 8.2“Kansas” 102", Asn ! Thr 5.1“Georgia” 95Æ, Pro ! Leu 3.6
The data are from Chapter 4 of Klotz.
HEMOGLOBIN 171
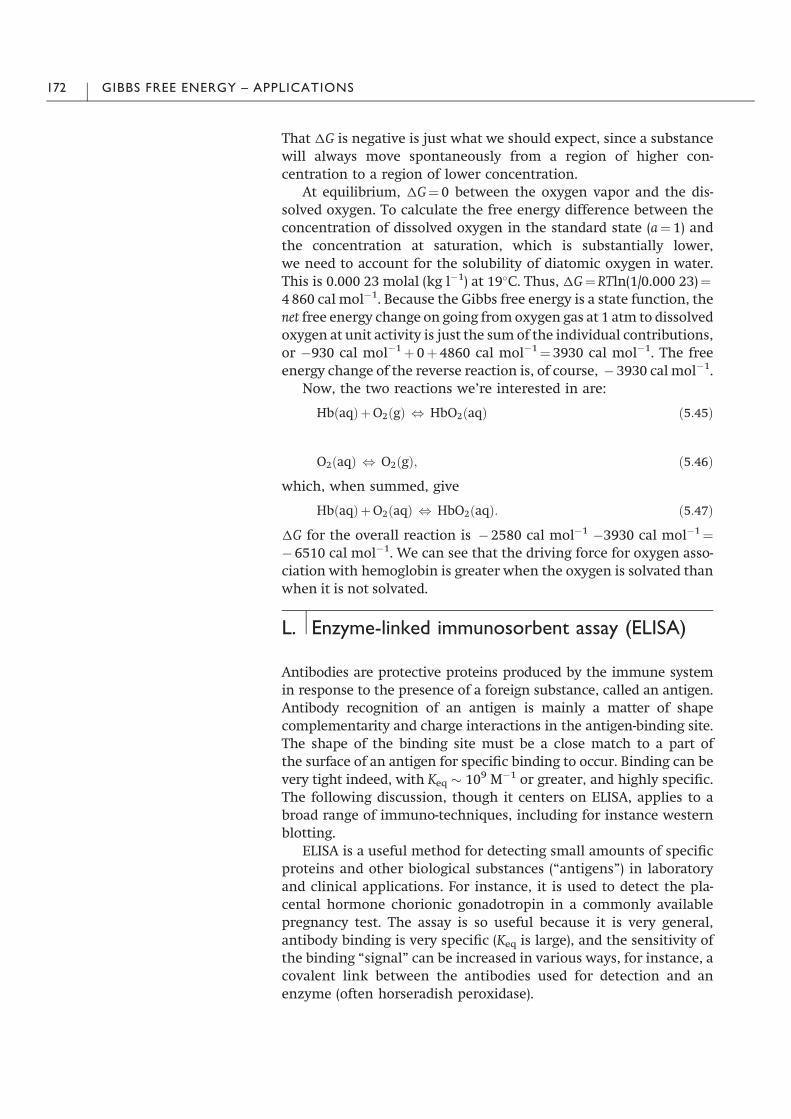
That 1G is negative is just what we should expect, since a substancewill always move spontaneously from a region of higher con-centration to a region of lower concentration.
At equilibrium, 1G" 0 between the oxygen vapor and the dis-solved oxygen. To calculate the free energy difference between theconcentration of dissolved oxygen in the standard state (a" 1) andthe concentration at saturation, which is substantially lower,we need to account for the solubility of diatomic oxygen in water.This is 0.000 23 molal (kg l$1) at 19!C. Thus, 1G"RTln(1/0.000 23)"4 860 cal mol$1. Because the Gibbs free energy is a state function, thenet free energy change on going from oxygen gas at 1 atm to dissolvedoxygen at unit activity is just the sum of the individual contributions,or $930 cal mol$1# 0#4860 cal mol$1"3930 cal mol$1. The freeenergy change of the reverse reaction is, of course, $3930 cal mol$1.
Now, the two reactions we’re interested in are:
Hb%aq&#O2%g& , HbO2%aq& %5:45&
O2%aq& , O2%g&; %5:46&
which, when summed, give
Hb%aq&#O2%aq& , HbO2%aq&: %5:47&
1G for the overall reaction is $2580 cal mol$1 $3930 cal mol$1"$6510 cal mol$1. We can see that the driving force for oxygen asso-ciation with hemoglobin is greater when the oxygen is solvated thanwhen it is not solvated.
L. Enzyme-linked immunosorbent assay (ELISA)
Antibodies are protective proteins produced by the immune systemin response to the presence of a foreign substance, called an antigen.Antibody recognition of an antigen is mainly a matter of shapecomplementarity and charge interactions in the antigen-binding site.The shape of the binding site must be a close match to a part ofthe surface of an antigen for specific binding to occur. Binding can bevery tight indeed, with Keq ) 109 M$1 or greater, and highly specific.The following discussion, though it centers on ELISA, applies to abroad range of immuno-techniques, including for instance westernblotting.
ELISA is a useful method for detecting small amounts of specificproteins and other biological substances (“antigens”) in laboratoryand clinical applications. For instance, it is used to detect the pla-cental hormone chorionic gonadotropin in a commonly availablepregnancy test. The assay is so useful because it is very general,antibody binding is very specific (Keq is large), and the sensitivity ofthe binding “signal” can be increased in various ways, for instance, acovalent link between the antibodies used for detection and anenzyme (often horseradish peroxidase).
172 GIBBS FREE ENERGY – APPLICATIONS
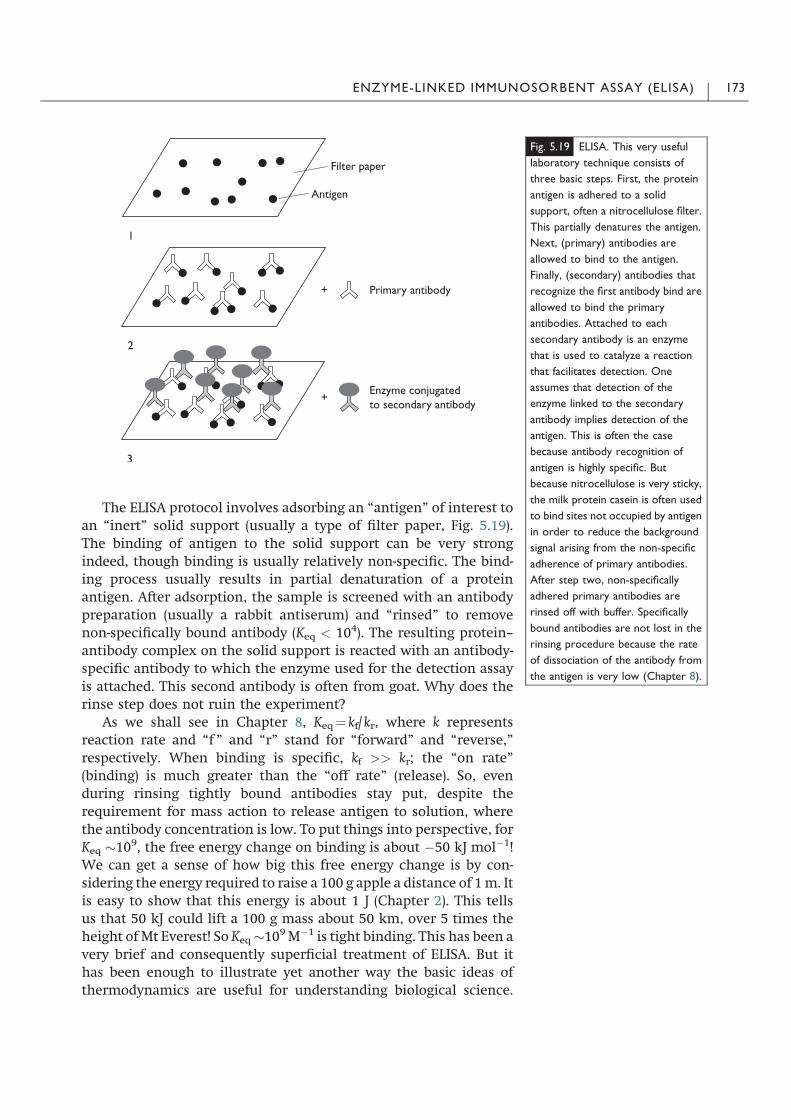
The ELISA protocol involves adsorbing an “antigen” of interest toan “inert” solid support (usually a type of filter paper, Fig. 5.19).The binding of antigen to the solid support can be very strongindeed, though binding is usually relatively non-specific. The bind-ing process usually results in partial denaturation of a proteinantigen. After adsorption, the sample is screened with an antibodypreparation (usually a rabbit antiserum) and “rinsed” to removenon-specifically bound antibody (Keq < 104). The resulting protein–antibody complex on the solid support is reacted with an antibody-specific antibody to which the enzyme used for the detection assayis attached. This second antibody is often from goat. Why does therinse step does not ruin the experiment?
As we shall see in Chapter 8, Keq" kf/ kr, where k representsreaction rate and “f ” and “r” stand for “forward” and “reverse,”respectively. When binding is specific, kf >> kr; the “on rate”(binding) is much greater than the “off rate” (release). So, evenduring rinsing tightly bound antibodies stay put, despite therequirement for mass action to release antigen to solution, wherethe antibody concentration is low. To put things into perspective, forKeq )109, the free energy change on binding is about $50 kJ mol$1!We can get a sense of how big this free energy change is by con-sidering the energy required to raise a 100 g apple a distance of 1m. Itis easy to show that this energy is about 1 J (Chapter 2). This tellsus that 50 kJ could lift a 100 g mass about 50 km, over 5 times theheight of Mt Everest! So Keq)109M$1 is tight binding. This has been avery brief and consequently superficial treatment of ELISA. But ithas been enough to illustrate yet another way the basic ideas ofthermodynamics are useful for understanding biological science.
Fig. 5.19 ELISA. This very useful
laboratory technique consists of
three basic steps. First, the protein
antigen is adhered to a solid
support, often a nitrocellulose filter.
This partially denatures the antigen.
Next, (primary) antibodies are
allowed to bind to the antigen.
Finally, (secondary) antibodies that
recognize the first antibody bind are
allowed to bind the primary
antibodies. Attached to each
secondary antibody is an enzyme
that is used to catalyze a reaction
that facilitates detection. One
assumes that detection of the
enzyme linked to the secondary
antibody implies detection of the
antigen. This is often the case
because antibody recognition of
antigen is highly specific. But
because nitrocellulose is very sticky,
the milk protein casein is often used
to bind sites not occupied by antigen
in order to reduce the background
signal arising from the non-specific
adherence of primary antibodies.
After step two, non-specifically
adhered primary antibodies are
rinsed off with buffer. Specifically
bound antibodies are not lost in the
rinsing procedure because the rate
of dissociation of the antibody from
the antigen is very low (Chapter 8).
ENZYME-LINKED IMMUNOSORBENT ASSAY (ELISA) 173

We’ll come back to the important subjects of binding and chemicalkinetics in Chapter 7 and Chapter 8, respectively.
M. DNA
Throughout this book we have put somewhat more emphasis onproteins than on DNA. In part this is a reflection of the expertise andinterests of the author and not a conscious bias against nucleic acidsor the people who study them! Besides, we shall see just howimportant DNA is to the entire story when we reach Chapter 9.Nevertheless, to redress lingering impressions of imbalance, thissection looks at the thermostability of DNA and the next one dis-cusses energetic aspects of the polymerase chain reaction.
The structure of the DNA double helix is illustrated schemati-cally in Fig. 5.20. The types of interaction that stabilize the structureare hydrogen bonds and “stacking interactions.” Three hydrogenbonds are formed between bases cytosine and guanine, two betweenadenine and thymine. These are the co-called Watson–Crick basepairs. The adenine of DNA (and RNA) is exactly the same as theadenine of ATP, cAMP, NADH and FADH2. As shown in Fig. 5.14,however, only one of the phosphate groups of ATP actually becomespart of the polynucleotide. You might guess, then, that the stabilityof double-stranded DNA relative to single-stranded DNA will dependon the proportion of C–G pairs, because this will influence theaverage number of hydrogen bonds per base pair, and in fact that iscorrect (Fig. 5.21, Table 5.4). Analysis of structures of nucleic acidshas revealed that the bases form extended stacks, interacting witheach other by van der Waals forces. Both hydrogen bonds and vander Waals interactions contribute to the overall stability of thedouble helix.
The equilibrium between double- and single-stranded DNA canbe symbolized as
D , S: %5:48&
Fig. 5.20 Double-stranded and
single-stranded DNA. DNA is
composed of bases attached to a
sugar–phosphate backbone. (See
Fig. 5.14 for a higher resolution view
of polynucleic acid.) There are two
major types of interaction that
stabilize double-stranded DNA:
intermolecular hydrogen bonds
(polar) and intramolecular base
stacking interactions (non-polar).
The number of hydrogen bonds
depends on the bases involved: three
are formed between cytosine (C) and
guanine (G), and two between
adenine (A) and thymine (T).
Intermolecular hydrogen bonds are
not present in single-stranded DNA.
Based on Fig. 3.16 of van Holde
(1985).
174 GIBBS FREE ENERGY – APPLICATIONS
The equilibrium constant for this reaction is
K" ,S-=,D-: %5:49&
This equilibrium constant is the product of the Ks for the individualbase pairings, as each base pair contributes to the overall stability ofthe double-stranded molecule.
Thermal denaturation of double-stranded DNA has been studiedextensively. As mentioned above, C–G composition is an importantdeterminant of stability of duplex DNA and therefore conditionsunder which K" 1. One means of promoting the dissociation ofdouble-stranded DNA is to add heat. Just as with proteins, heatabsorbed by DNA increases its thermal energy, fluctuations ofstructure become larger, and the disordered state becomes moreprobable than the ordered one. Measurement of the temperature atwhich double-stranded DNA is 50% “melted,” the melting tempera-ture, is one way of comparing the genetic material of one genome toanother (Fig. 5.22). Research in this area has been used to work outempirical rules for the melting temperature of DNA as a function ofC–G content, total number of base pairs, and concentration of ions,principally Mg2#. Magnesium ions neutralize the electrostaticrepulsion between the negatively charged phosphate groups in thesugar–phosphate backbone by decreasing the range and strength ofthe repulsive Coulombic interactions13 between the phosphategroups on opposite strands of the double helix. Decreases in theconcentration of such counterions increase the repulsion betweenstrands and reduce themelting temperature of double-stranded DNA.
Figure 5.23 shows percentage of double-helix as a function oftemperature for the forward and reverse reactions in Eqn. (5.48).
Table 5.4. Association constants for base pair formation
Base pair K(M$1)
Self-associationA0A 3.1U0U 6.1C0C 28G0G 103$104
Watson–Crick base pairsA0U 100G0C 104$105
The measurements were made in deuterochloroform at 25 !C. The data are from Kyogukoet al. (1969). Similar values have been obtained for T in place of U. Non-Watson–Crick basepairs are relatively unstable. The entropic component of K is roughly the same for each
Fig. 5.21 Influence of G–C content
on DNA melting temperature. As
the percentage of G–C pairs
increases, the number of
intermolecular hydrogen bonds per
base pair increases. The stabilizing
effect on double-stranded DNA is
reflected in the relationship
between G–C content and melting
temperature.
13 Coulomb’s law is an empirically derived mathematical description of theinteraction between charged particles. It is named after the French physicist andmilitary engineer Charles Augustin de Coulomb (1736–1806). The effect of Mg2#
counterions is explained by the Debye–Huckel theory of strong electrolytes.
DNA 175

The evident hysteresis (Greek, a coming late) in the reverse processarises from a difference in the rates of hydrogen bond breaking andspecific annealing of the complementary strands, and the sample’snot being at equilibrium throughout the experiment. The dissocia-tion of strands is a much simpler reaction than the formation ofperfectly matched double-stranded DNA. And as we have said,reversibility of a process depends on the system being takenthrough a series of equilibrium or near-equilibrium states. Duringthe reverse reaction, if the system is not given sufficient time tocome to equilibrium, some mismatching of bases is likely tooccur, preventing or strongly inhibiting the return to the initialconditions.
Thus far we have described DNA in rather general terms. Thereare different types of DNA, however, not only differences in G–Ccontent, and the different types have different thermodynamicproperties. Genomic DNA of higher eukaryotes, for example, islinear: there is a distinct 30-end and a distinct 50-end. In plasmidDNA, by contrast, which is of great utility as a vector for carrying“foreign” genes into E. coli for production of “recombinant” pro-teins, there is no distinct 30-end or 50-end; this DNA is circular. SuchDNA can exhibit a variety of conformations ranging from no
Fig. 5.22 DNA melting curves. The
melting temperature varies not only
with G–C content but also with
size. In other words, a 100 base
pair-long double-stranded DNA
molecule will have a higher melting
temperature than a 50 base pair-
long double-stranded DNA for a
given percentage and distribution of
G–C pairs. Differences in G–C
content and distribution and
molecular size lead to differences in
melting temperature.
Fig. 5.23 Melting and cooling
profile for double-stranded DNA.
Solid line. The melting of double-
stranded DNA is cooperative.
Relatively few base pairs are broken
below the melting temperature.
Once melting has begun, however,
relatively small increases in
temperature result in the rupture
of a relatively large number of
hydrogen bonds. The melting
profile differs greatly from the
cooling profile. Unless cooling is
carried out very slowly, the system
will not be in a near-equilibrium
state at every temperature value on
the reaction pathway. Rapid cooling
of melted DNA will not yield
perfectly formed double-stranded
DNA. Broken line. Melting
temperature is influenced not only
by G–C content and distribution
and molecular size but also by ion
concentration, particularly divalent
cations. These ions interact
favorably with the phosphate
groups of the DNA backbone. The
consequent reduction of
electrostatic repulsion results in
increased stability of the DNA
duplex. Based on Fig. 3.15 of van
Holde� (1985)� and� Fig.� 5.15� of
Bergethon (1998).
176 GIBBS FREE ENERGY – APPLICATIONS

supercoiling, or no twisting, to tight supercoiling. This topologicalcharacteristic of circular DNA suggests that energetics of plasmidDNA melting will differ from that of linear DNA, even if the basicprinciples we have discussed thus far apply to both types.
A double-helical DNA molecule with covalently attached ends, asin a plasmid, will have a certain number of “coils.” Such coils areanalogous to the ones you can introduce in a belt before the buckleis fastened. It is easy to show that the number of coils cannot bechanged after fastening the buckle without cutting the belt. In thesame way, coils in circular DNA cannot be undone without cuttingthe polynucleotide strand. From a mathematical point of view,supercoiling can be expressed in terms of three variables as
L " T # W : %5:50&
L, the linking number, is the integral number of times that one DNAstrand winds around the other; it is the number of coils in our beltanalogy. The twist, T, is the number of complete revolutions that onepolynucleotide strand makes about the duplex axis (usually thenumber of base pairs divided by 10.6, the approximate number ofbase pairs per turn of DNA). T can be positive or negative, dependingon the direction of the helix, and it can vary from one part of amolecule to another. W, the writhe, is the number of turns that theduplex axis makes about the superhelix axis. Like T, W can bepositive or negative.
If the duplex axis of DNA is constrained to lie in a single plane,W"0; there is coiling but no supercoiling, L" T, and the twist mustbe an integral number. From Eqn. (5.50) it is clear that differentcombinations of W and T are possible for a circular DNA moleculewith L, which is a property of the molecule that is constant in theabsence of a break in a polynucleotide strand. At equilibrium, oneexpects a given circular DNA molecule to fluctuate between a vari-ety of conformations, each of which must have linking number L.
As a specific example of DNA supercoiling, consider the circularDNA molecule of the SV40 virus. This molecule is about 5300 basepairs long and is therefore expected to have L" T ' 500 in theabsence of supercoiling. The prediction is based on the most ener-getically favorable number of bases per turn. But in fact, the DNAisolated from SV40 is supercoiled.14 This probably arises from anuntwisted region being present at the end of DNA replication. Such“underwinding” is energetically unfavorable, because the averagenumber of bases per turn is lower than optimal. The conformationof the molecule changes until the lowest free energy state isreached, but regardless of the conformation adopted L is constant(the DNA backbone is not severed). It has been found experimentallythat jWj ' 25, so by Eqn. (5.50), W '$25. The sign of W tells us thatthe supercoils are negative supercoils, which form to compensate
14 Under normal salt conditions. The predominant conformation depends on saltconcentration and temperature.
DNA 177
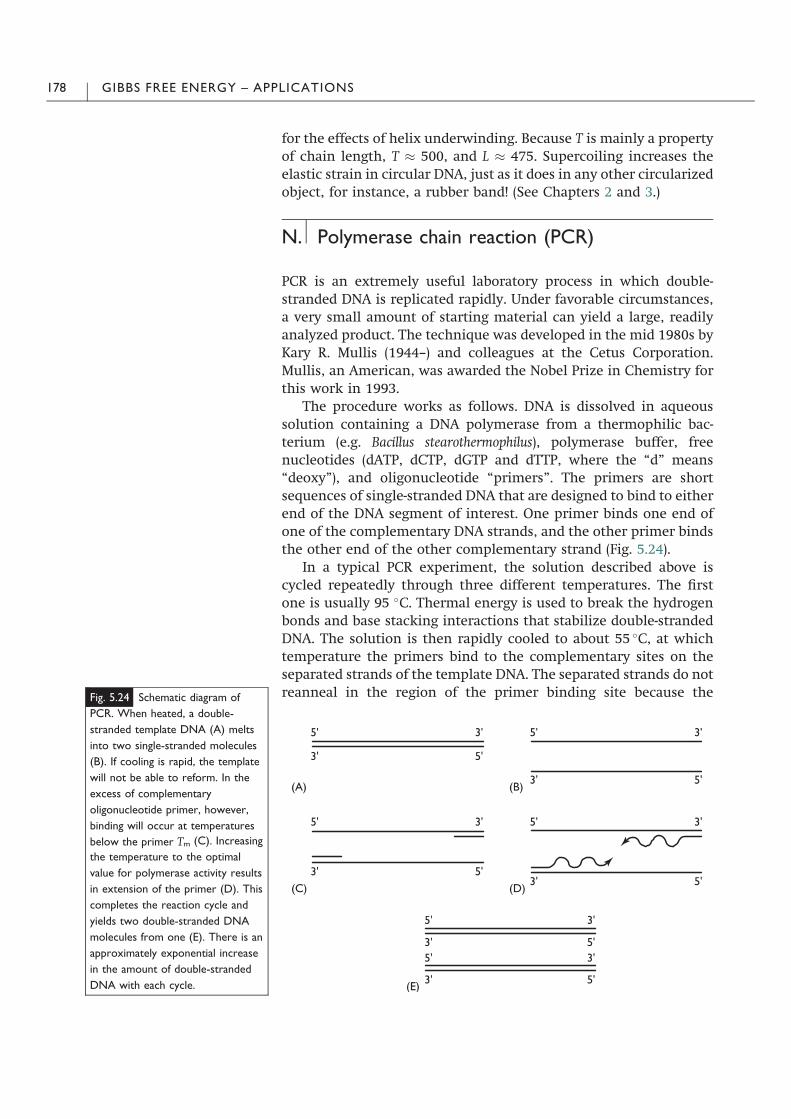
for the effects of helix underwinding. Because T is mainly a propertyof chain length, T ' 500, and L ' 475. Supercoiling increases theelastic strain in circular DNA, just as it does in any other circularizedobject, for instance, a rubber band! (See Chapters 2 and 3.)
N. Polymerase chain reaction (PCR)
PCR is an extremely useful laboratory process in which double-stranded DNA is replicated rapidly. Under favorable circumstances,a very small amount of starting material can yield a large, readilyanalyzed product. The technique was developed in the mid 1980s byKary R. Mullis (1944–) and colleagues at the Cetus Corporation.Mullis, an American, was awarded the Nobel Prize in Chemistry forthis work in 1993.
The procedure works as follows. DNA is dissolved in aqueoussolution containing a DNA polymerase from a thermophilic bac-terium (e.g. Bacillus stearothermophilus), polymerase buffer, freenucleotides (dATP, dCTP, dGTP and dTTP, where the “d” means“deoxy”), and oligonucleotide “primers”. The primers are shortsequences of single-stranded DNA that are designed to bind to eitherend of the DNA segment of interest. One primer binds one end ofone of the complementary DNA strands, and the other primer bindsthe other end of the other complementary strand (Fig. 5.24).
In a typical PCR experiment, the solution described above iscycled repeatedly through three different temperatures. The firstone is usually 95 !C. Thermal energy is used to break the hydrogenbonds and base stacking interactions that stabilize double-strandedDNA. The solution is then rapidly cooled to about 55 !C, at whichtemperature the primers bind to the complementary sites on theseparated strands of the template DNA. The separated strands do notreanneal in the region of the primer binding site because theFig. 5.24 Schematic diagram of
PCR. When heated, a double-
stranded template DNA (A) melts
into two single-stranded molecules
(B). If cooling is rapid, the template
will not be able to reform. In the
excess of complementary
oligonucleotide primer, however,
binding will occur at temperatures
below the primer Tm (C). Increasing
the temperature to the optimal
value for polymerase activity results
in extension of the primer (D). This
completes the reaction cycle and
yields two double-stranded DNA
molecules from one (E). There is an
approximately exponential increase
in the amount of double-stranded
DNA with each cycle.
178 GIBBS FREE ENERGY – APPLICATIONS
primers, which are present in great excess, out-compete them. Thethird temperature of each cycle is usually about 72 !C. At this tem-perature DNA polymerase activity is high, and it catalyzes thesynthesis of a new strand by joining free nucleotide bases to the30-end of the primers at a rate of several hundred bases per minute.Each time the thermal cycle is repeated, a strand that was formedwith one primer is available to bind the complementary primer, theresult being a new two-stranded molecule that is restricted solely tothe desired segment of starting material; the region of DNA betweenthe primers is selectively replicated. Further repetitions of the pro-cess can produce a billion identical copies of a small piece of DNA in2–3 h. A well-designed PCR experiment yields the desired productwith better than 99% purity.
A question of practical importance to the molecular biologist is:“How long should the oligonucleotide primer be?” There are twomain considerations. One is cost: why spend more than is neces-sary? The other is that although specificity of an oligonucleotideincreases with length, size is not necessarily an advantage. In orderto answer these questions, let’s think about how double-strandedDNA is held together.
Above we said that hydrogen bonds contribute to double-helixstability. How is that? Aren’t the bases in single-stranded DNA ableto form hydrogen bonds with water? Why should the hydrogenbonds in a double helix be any stronger? In the double helix, theinter-strand hydrogen bonds are not being made and broken con-stantly, as in single-stranded DNA interacting with water. Thehydrogen bond donor or acceptor is, on the average, bonded moreof the time in duplex DNA than in single-stranded DNA. Assumingthat the enthalpy change of hydrogen bond formation is of roughlythe same magnitude in both cases, we should therefore expect adifference in enthalpy between double-stranded DNA and itsconstituent strands when separated. If heat must be added to “melt”the double helix, then according to Eqn. (2.3) the single strandsrepresent a higher enthalpy state than the double helix at a tem-perature favoring the double helix. This means that the longer theoligonucleotide primer, the larger 1Hd, where the “d” stands for“denaturation of the double helix.” Below Tm, base pair formationis energetically favorable with regard to enthalpy. What aboutentropy?
The double-stranded state has a much lower entropy than thesingle-stranded one with regard to DNA strands alone. Two particlessticking together is a more orderly situation than two particlesfloating freely in solution. Formation of a base pair decreases theentropy of a strand of DNA and is, therefore, energetically unfavor-able. The unfavorability comes not only from requiring that twostrands of DNA be in the same place in the sample volume, but alsofrom the restrictions on the shape of both strands that are compatiblewith helix formation and on the orientation in space of individualbases.
POLYMERASE CHAIN REACTION (PCR) 179

As is often the case in science, thinking will get you only so far. Atsome stage it becomes necessary to do experiments to find out whe-ther or not the world really is how you imagine it to be. There are twokey experimental findings thatwill help us here. One is that G–Cpairscontribute more to duplex-DNA stability than A–T pairs. This cannotbe rationalized in terms of base stacking interactions alone, as thesurface area of an A–T pair is not appreciably different from that of aG–C pair. The extra stability must come from the G–C pair’s extrahydrogen bond. The other empirical finding is that oligonucleotideprimers must be about 20 bases long in order for PCR to work well,the exact length depending on the G–C content of the oligo and thetemperature atwhich annealing occurs (usually 55 !C).What this tellsus is that we need to form about 50 hydrogen bonds for the favorableenthalpic contribution to the free energy change of double helixformation to exceed the unfavorable entropic contribution.
Now we can see why we will not want to make our oligonu-cleotide primers too short. We also know that we will not want tomake them too long – every afghani, bhat, colon, dollar, euro . . .yen, or zaire is dear. But there is another, thermodynamic reasonwhy oligos should not be too long. Assuming a random basesequence in the template DNA strand, the absolute specificity of anoligonucleotide can only increase with length. But if the oligo islong, there will be many, many sites at which partial binding couldoccur on the template DNA. Moreover, the same oligonucleotidemolecule may be able to bind not only to more than one place onthe same template at the same time, but also to more than onetemplate molecule! Such a situation, which can be energeticallyvery favorable from an entropic point of view, will promote a hugenumber of side reactions and yield a very messy PCR product.
O. Free energy of transfer of amino acids
The free energy of transfer is the free energy change on transfer of acompound from one surrounding medium to another, usually, onesolvent to another. Suppose we have two perfectly immiscible sol-vents (ones that do not mix) in the same beaker. There is an inter-face, with one solvent on one side and the other on the other. Thereis a large free energy barrier to mixing; this is what it means for thesolvents to be immiscible. Now, if a solute is dissolved in one ofthe solvents, when the three-component system comes to equili-brium, solute will be found in the second solvent as well, if the soluteis soluble in it. You will recognize this as a means of doing extractionof chemical compounds with organic solvents. This phenomenonis often grouped together with freezing point depression, boilingpoint elevation and osmosis, but strictly speaking it is not a collig-ative property. We are interested in it here because it will help us tohave a better understanding of the solubility and thermodynamic
180 GIBBS FREE ENERGY – APPLICATIONS

stability of biological macromolecules, not because of any particularrelationship to colligative properties. A specific example will help tomake headway in understanding.
The solubility of phenylalanine (Phe) in water at 25 !C on themolality scale is 0.170 mol (kg solvent)$1; in 6 M urea it is 0.263 mol(kg solvent)$1. Urea improves the solubility of hydrophobic sidechains in aqueous solution, making urea a good chemical dena-turant of proteins. Using the given information, one can calculatethe standard state free energy of transfer of Phe from water toaqueous urea solution. To keep things simple, we’ll assume that theactivity coefficient of Phe is approximately the same in both media.
This� situation� can� be� pictured� as� follows� (compare� Fig.� 2.3).� Inone process, Phe dissolved in water is in equilibrium with crystal-line Phe; the solution is saturated. In another process, Phe dissolvedin urea solution is in equilibrium with crystalline Phe. Both of theseprocesses can be studied experimentally and the solubilities can bemeasured. In a third process, which is a sort of thought experiment,Phe in one solution is in equilibrium with Phe in the other solution.We construct a notional boundary between these solutions, andrequire that it be permeable to Phe but not to water or urea. Therewill be a net flow of Phe across the boundary until equilibrium isreached. The fourth “process” in the thermodynamic cycle is justsolid Phe in equilibrium with solid Phe.
In mathematical terms,
„water; sat: $„solid " 0 %5:51&
„water; a" 1 $ „water; sat: "$RT ln awater; sat: "#1050 calmol$1 %5:52&
„urea; sat: $„solid " 0 %5:53&
„urea; a"1 $„urea; sat: "$RT ln awater; sat: "#790 cal mol$1 %5:54&
„solid $„solid " 0: %5:55&The energy barrier between saturation and unit activity is greater inwater than urea because the solubility of phenylalanine is lower inwater than urea. The difference between Eqns. (5.52) and (5.54),which is what we set out to find, is „urea, a"1 $ „urea, sat. $ („water,
a"1 $ „water, sat.) "„urea, a" 1 $ „solid $ („water, a"1 $ „solid)"„urea,
a"1 $ „water, a"1" [„!urea, a"1# RT ln(1)] $ [(„!
water, a"1#RT ln(1)]"„!
urea, a" 1 $ „!water, a"1" 790 cal mol$1 $ 1050 cal
mol$1"$260 cal mol$1. This is the standard state driving force fortransfer of Phe from saturated water to saturated 6 M urea. We cansee from the sign of the chemical potential that the transfer isspontaneous; this is exactly what is expected from solubility data.
Though this example has involved a complete amino acid, there isin principle no reason why the experiment could not be done with
FREE ENERGY OF TRANSFER OF AMINO ACIDS 181
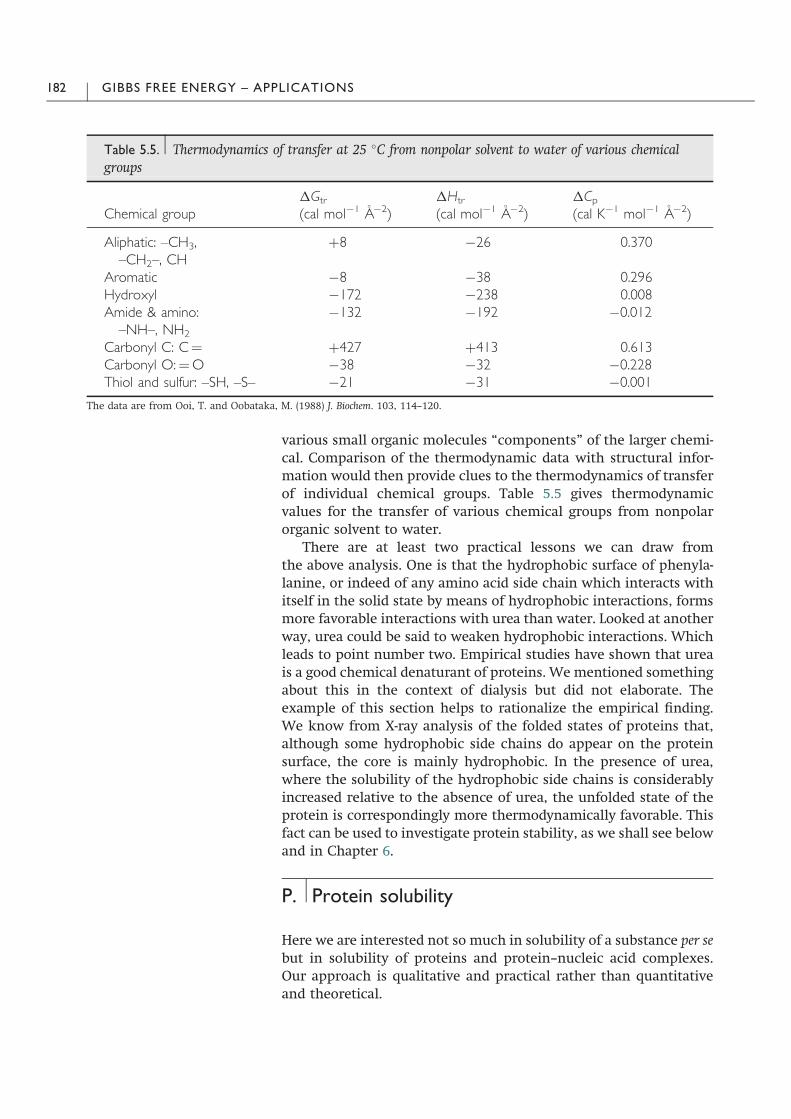
various small organic molecules “components” of the larger chemi-cal. Comparison of the thermodynamic data with structural infor-mation would then provide clues to the thermodynamics of transferof individual chemical groups. Table 5.5 gives thermodynamicvalues for the transfer of various chemical groups from nonpolarorganic solvent to water.
There are at least two practical lessons we can draw fromthe above analysis. One is that the hydrophobic surface of phenyla-lanine, or indeed of any amino acid side chain which interacts withitself in the solid state by means of hydrophobic interactions, formsmore favorable interactions with urea than water. Looked at anotherway, urea could be said to weaken hydrophobic interactions. Whichleads to point number two. Empirical studies have shown that ureais a good chemical denaturant of proteins. We mentioned somethingabout this in the context of dialysis but did not elaborate. Theexample of this section helps to rationalize the empirical finding.We know from X-ray analysis of the folded states of proteins that,although some hydrophobic side chains do appear on the proteinsurface, the core is mainly hydrophobic. In the presence of urea,where the solubility of the hydrophobic side chains is considerablyincreased relative to the absence of urea, the unfolded state of theprotein is correspondingly more thermodynamically favorable. Thisfact can be used to investigate protein stability, as we shall see belowand in Chapter 6.
P. Protein solubility
Here we are interested not so much in solubility of a substance per sebut in solubility of proteins and protein–nucleic acid complexes.Our approach is qualitative and practical rather than quantitativeand theoretical.
Table 5.5. Thermodynamics of transfer at 25 !C from nonpolar solvent to water of various chemicalgroups
Chemical group1Gtr
(cal mol$1 A! $2)
1Htr
(cal mol$1 A! $2)
1Cp(cal K$1 mol$1 A
! $2)
Aliphatic: –CH3,–CH2–, CH
#8 $26 0.370
Aromatic $8 $38 0.296Hydroxyl $172 $238 0.008Amide & amino:–NH–, NH2
$132 $192 $0.012
Carbonyl C: C" #427 #413 0.613Carbonyl O:"O $38 $32 $0.228Thiol and sulfur: –SH, –S– $21 $31 $0.001
The data are from Ooi, T. and Oobataka, M. (1988) J. Biochem. 103, 114–120.
182 GIBBS FREE ENERGY – APPLICATIONS

A proteinmolecule is a very complex polyion; there are numerousionizable groups and a variety of pKas. The solubility of a proteinin aqueous solution will depend strongly on ionic strength and pH(Fig. 5.25). This is of the greatest practical significance for the choiceof techniques that one might use to study a protein molecule. Forinstance, nuclear magnetic resonance (NMR) spectroscopy is a veryhigh-resolution structural technique, making it valuable for proteinstructure determination and other aspects of biochemical research.But NMR is also an extremely insensitive technique, meaning that avery large concentration of protein is needed for a good signal-to-noise ratio, on the order of 1 mM or higher. At the same time, NMRstructural studies generally require a relatively low rate of exchangeof labile protons in tryptophan and tyrosine side chains, a pH-dependent phenomenon (see Chapter 8). In other words, the proteinmust not only be highly soluble, it must be soluble in a suitable pHrange (near neutral pH). These requirements (and others!) restrictwhich protein structures can be studied by NMR.
Here’s an example of the effect of pH on protein solubility. ThePTB domain of chicken tensin is highly soluble at pH 2, where itsnet charge is about #30. The net charge on each PTB molecule atacidic pH is so great that electrostatic repulsion inhibits the for-mation of protein aggregates, as long as the ionic strength is low. AtpH 7, by contrast, the net charge on the PTB domain is 0 and it is notvery soluble at all. This pH is the so-called isoelectric point, or pI, ofthe PTB domain. The isoelectric point of a protein depends primarilyon amino acid composition; more specifically, the number of aminoacids with ionizable side chains, and to some extent the location ofeach ionizable residue in the folded protein structure. If the numberof basic side chains is relatively large and the number of acidic sidechains relatively small, as with hen egg white lysozyme, the iso-electric point of the protein will be high, and the net charge is likelyto be positive through most of the usual pH range (2–12). All thatprevents a protein from aggregating at its pI is its solubility, whichdepends on the actual number of charged groups present, even if thesum of charges is 0. Charge properties can be used to purify a protein.For instance, recombinant PTB domain can be separated from somebacterial proteins by adjusting the cell lysate to pH 7. Separation ofthe precipitate effectively isolates recombinant PTB domain from themany bacterial proteins which remain soluble at neutral pH.
In general, the situation with protein solubility is more complexthan we have made it seem thus far. At a given pH, a typical proteinwill have both positive and negative charges. Depending on thelocation of the charges on the protein surface, if the ionic strength islow, proteins can interact with each other by electrostatic attraction.It is often found therefore that the solubility of a protein at low ionicstrength increases with salt concentration. This phenomenon is known as“salting in,” and because it depends on the protein being charged, theeffect is least pronounced at the isoelectric point. By contrast, at highionic strength the protein charges are strongly shielded. Electrostatic
Fig. 5.25 Protein solubility. This
depends not only on the net charge
of the protein, which varies with pH,
but also on ionic strength and
temperature. The data shown
are for a milk protein called
fl-lactoglobulin at different
concentrations of NaCl. Solubility is
very low at pH 5.3, the approximate
isoelectric point of the protein. At
this pH, the solubility of fl-
lactoglobulin increases exponentially
with increasing ionic strength
(solubility ' 0.255e101pH). The data
are from Fox and Foster (1957).
PROTEIN SOLUBILITY 183

repulsion is negligible. Solubility is reduced. This effect is known as“salting out.” The shape of a solubility curve with ionic strength isthus, roughly speaking, U-shaped (Fig. 5.25). Salting out is thought toarise from the screening of charges and from the numerous inter-actions between the salt ions and water resulting in a decrease in thewater molecules available to solvate the protein.
Salting out is a useful means of purifying proteins. For instance,ammonium sulfate is often used to purify antibodies. Below a cer-tain ionic strength, antibodies and some other proteins are soluble,but many other proteins are insoluble. The insoluble proteins can beremoved from solution by centrifugation. Above a certain ionstrength, the antibodies themselves precipitate. They can be sepa-rated from the rest of the solution and subjected to further pur-ification. A similar procedure can be used to purify many differentproteins. Once a protein is sufficiently pure, it is sometimes possibleto crystallize it by dissolving it in a salt solution near the solubilitylimit of the protein. From a thermodynamic point of view, crystal-lization occurs because the crystalline state of the protein has alower Gibbs free energy than the solution state.
Q. Protein stability
This section is on cooperative and reversible order–disorder transi-tions in proteins. It builds on several of the several previoussections, including those on DNA and PCR. A key difference betweenprotein stability and duplex DNA stability is the size of 1Cp betweenthe ordered and disordered states: in proteins it is relatively large, inDNA relatively small. As we shall see, the magnitude of 1Cp canhave a marked effect on the thermostability of a protein.
When protein folding/unfolding is cooperative, effectively onlytwo states are populated at equilibrium: the folded (native) state andthe unfolded (denatured) state. The transition occurs over a rela-tively narrow range of the independent variable, be it temperature,pH or chemical denaturant concentration. In such cases, the equi-librium can be represented as
F , U: %5:56&
The equilibrium constant (Eqn. (4.11)) is then
Keq " ,U-=,F-: %5:57&
Note that Eqns. (5.56) and (5.57) are at least consistent with the ideathat all the information required for a protein molecule to fold intoits native form will be present in the amino acid sequence. The freeenergy difference between the folded state of a protein and itsunfolded state is independent of the path! Regardless of the processby which a protein folds – in the cell or in a test tube – the freeenergy difference between folded and unfolded forms is the same(given the same temperature, ion concentrations, pH, etc.). But is a
184 GIBBS FREE ENERGY – APPLICATIONS

catalyst needed to get the reaction to proceed on a biologicallyrelevant time scale?
Early attempts to give a thermodynamic description of reversibleprotein denaturation and coagulation appeared in the 1920s and1930s in the work of American physical biochemists Alfred EzraMirsky (1900–1974), Mortimer Louis Anson (1901–1968), and LinusCarl Pauling.15 In the 1950s, Rufus Lumry (1920-) and Henry Eyring(1901–1981), also both Americans, provided a more substantialmathematical analysis of reversible protein denaturation. Thisexperimental and theoretical work modeled the folded state of aprotein as corresponding to a (local) minimum of free energy, alsoknown as an energy well, when conditions favor the folded state(Fig. 5.26). An important lingering difficulty, however, was the gen-erality of the applicability of the thermodynamic description. Did itwork for some proteins and not others? Did it apply to proteins withdisulfide bonds? Christian Boehmer Anfinsen’s investigations of thereversible denaturation of proteins showed conclusively that thenative state of a protein with disulfide bonds could be recoveredspontaneously, even when the disulfides were not formed in thedenatured protein. This led to the general acceptance of the“thermodynamic hypothesis” for the folding of proteins, accordingto which attainment of the native structure rests solely upon theamino acid sequence. Anfinsen (1916–1995), an American, wasawarded the Nobel Prize in Chemistry for this work in 1972. Sincethen, and particularly since the late 1980s, the goal of working outthe structural basis of protein folding and thermostability has beenpursued with considerable intensity throughout the world.
We have already discussed protein denaturation (in Chapters 2and 3) in the context of illustrating the physical meaning of H and Sand showing the utility of a van’t Hoff analysis of equilibrium
Fig. 5.26 Free energy profile of a
“well-behaved” small protein. There
are only two stable states: the
folded state and the unfolded state.
The number of unfolded
conformations is vastly greater than
the number of folded
conformations. Although the
unfolded conformations differ in
energy, these differences are
relatively small. Therefore the
collection of unfolded
conformations can be thought of
as a single state. The energy
difference between the unfolded
state and the folded state is
comparatively very large.
15 Pauling (1901–1994) was awarded the Nobel Prize in Chemistry in 1954 for his workon protein structure. His model of DNA structure, which had the bases pointingoutwards, was no longer tenable after publication of the famous work of Watsonand Crick. Something worth remembering: Nobel laureates are unusuallyaccomplished rational animals, but they are capable of error. At the same time,though, it is fair to say that no one’s discovered anything who hasn’t also made amistake.
PROTEIN STABILITY 185

constant data. Now let’s consider protein denaturation in terms offree energy. At constant temperature, Eqn. (4.2) becomes
1G!d " 1H!
d $ T1S!d; %5:58&
where as before the subscript signifies “denaturation.” 1G!d is the dif-
ference in Gibbs free energy between the unfolded state and the foldedstate of the protein. In most cases, the energy of the unfolded state ismeasured relative to the energy of the folded state; i.e. the folded stateis the reference state. There are two main reasons for the convention:the folded state has the least ambiguous conformation, andmoreoftenthannot equilibrium studies investigate transitions from the folded stateto the unfolded state; the folded state is often the starting state (nottrue of kinetic protein refolding experiments!). 1G!
d alone tells usnothing about the relative magnitudes of 1H!
d or 1S!d; an infinitenumber of combinations of these thermodynamic functionswouldbeconsistent with a given value of 1G!
d. Of course, many of these com-binations of 1H!
d and 1S!d will have little or no physical meaning for
the system under study, and only one combination will actuallydescribe the system under study. In order to fix the values, we’ll haveto do at least one more experiment. It has been found that 1H!
d and1S!d for proteins can be very large in comparison with 1G!
d. Forinstance, it is common for themaximumvalue of1G!
d for a protein insolution to be about 15 kcal mol$1, and for 1H!
d at the denaturationtemperature to be more than an order of magnitude greater.1G!
d forproteins is thus a delicate balance of 1H!
d and 1S!d.At the melting temperature, also called the heat-denaturation tem-
perature, the fraction of molecules in the folded state equals that inthe unfolded state; the free energy difference between them,1G!
d, is0. This leads to Eqn. (3.21) and enables you to calculate the entropyof unfolding from measurement of1H!
d. Including the temperaturedependence of 1H and 1S explicitly, Eqn. (5.58) becomes
1G!d%T& " 1H!
d%Tr& # 1Cp%T $ Tr& $ T,1S!d%Tr& #1Cp ln%T=Tr&-;%5:59&
where the subscript “r” means “reference.”1G!d%T& is not %1G!
d · T&but1G!
d evaluated at temperature T. As an example, suppose thatour reference temperature is 25 !C and that both 1H!
d and 1S!dare known at this temperature. What is 1G!
d at 35 !C? If 1H!(25!C)" 51 kcal mol$1, 1S!(25 !C)" 100 cal mol$1 K$1, and 1Cp"1500calmol$1 K$1, then 1G!(35 !C)" 51 kcal mol$1#1500 cal mol$1
K$1 · (308 K $ 298 K) $ 308 K# [100 cal mol$1 K$1#1500 cal mol$1
K$1# ln(308 K/298 K)]"20 kcal mol$1. 1G!d%T& is known as the sta-
bility of a protein. It tells you how much energy must be expended(more specifically, the minimum amount of work that must be done)to unfold the protein at a given temperature. A plot of1G!
d%T& versustemperature (or any other independent variable, e.g. pH or con-centration of chemical denaturant) is called a stability curve.
The stability curve as a function of temperature resembles aparabola and has a peak at which1G!
d is amaximum. It can be shown
186 GIBBS FREE ENERGY – APPLICATIONS
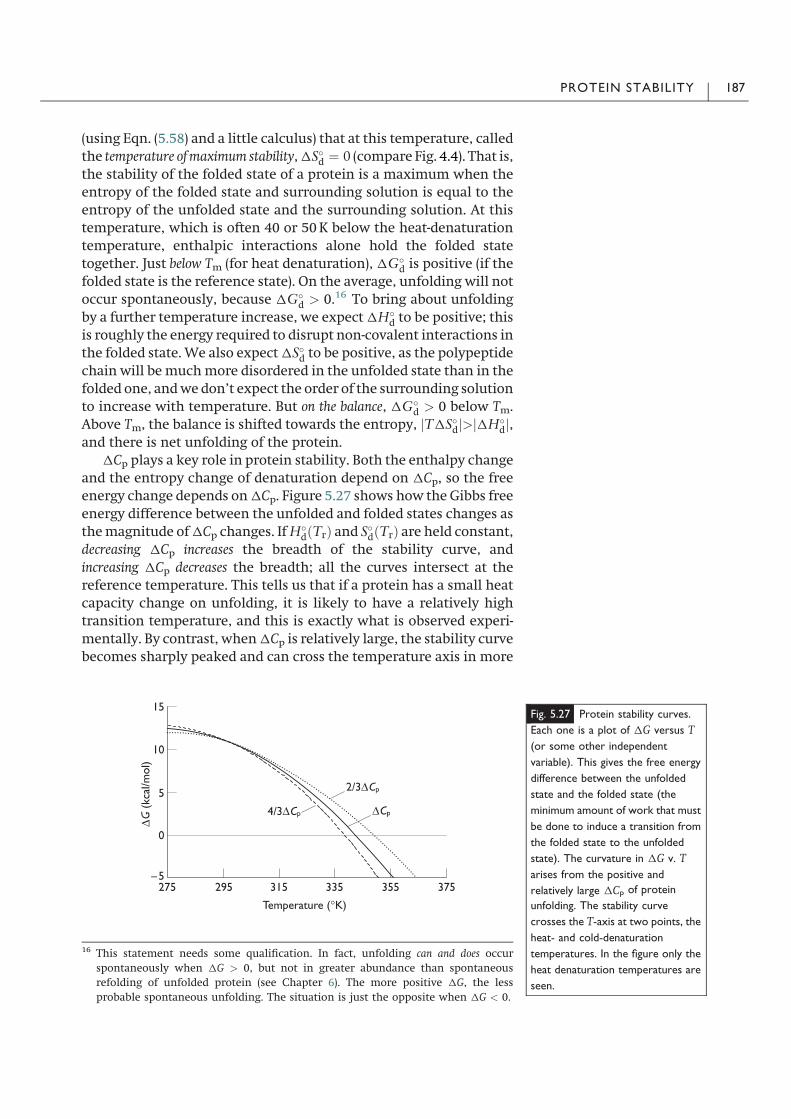
(using Eqn. (5.58) and a little calculus) that at this temperature, calledthe temperature ofmaximum stability,1S!d� "� 0� (compare� Fig.� 4.4).� That� is,the stability of the folded state of a protein is a maximum when theentropy of the folded state and surrounding solution is equal to theentropy of the unfolded state and the surrounding solution. At thistemperature, which is often 40 or 50K below the heat-denaturationtemperature, enthalpic interactions alone hold the folded statetogether. Just below Tm (for heat denaturation), 1G!
d is positive (if thefolded state is the reference state). On the average, unfolding will notoccur spontaneously, because 1G!
d > 0.16 To bring about unfoldingby a further temperature increase, we expect1H!
d to be positive; thisis roughly the energy required to disrupt non-covalent interactions inthe folded state.We also expect1S!d to be positive, as the polypeptidechain will bemuchmore disordered in the unfolded state than in thefolded one, andwe don’t expect the order of the surrounding solutionto increase with temperature. But on the balance, 1G!
d > 0 below Tm.Above Tm, the balance is shifted towards the entropy, jT1S!dj>j1H!
dj,and there is net unfolding of the protein.
1Cp plays a key role in protein stability. Both the enthalpy changeand the entropy change of denaturation depend on 1Cp, so the freeenergy change depends on1Cp. Figure 5.27 shows how the Gibbs freeenergy difference between the unfolded and folded states changes asthemagnitude of1Cp changes. IfH!
d%Tr& and S!d%Tr& are held constant,decreasing 1Cp increases the breadth of the stability curve, andincreasing 1Cp decreases the breadth; all the curves intersect at thereference temperature. This tells us that if a protein has a small heatcapacity change on unfolding, it is likely to have a relatively hightransition temperature, and this is exactly what is observed experi-mentally. By contrast, when1Cp is relatively large, the stability curvebecomes sharply peaked and can cross the temperature axis in more
Fig. 5.27 Protein stability curves.
Each one is a plot of 1G versus T(or some other independent
variable). This gives the free energy
difference between the unfolded
state and the folded state (the
minimum amount of work that must
be done to induce a transition from
the folded state to the unfolded
state). The curvature in 1G v. Tarises from the positive and
relatively large 1Cp of proteinunfolding. The stability curve
crosses the T-axis at two points, the
heat- and cold-denaturation
temperatures. In the figure only the
heat denaturation temperatures are
seen.
16 This statement needs some qualification. In fact, unfolding can and does occurspontaneously when 1G > 0, but not in greater abundance than spontaneousrefolding of unfolded protein (see Chapter 6). The more positive 1G, the lessprobable spontaneous unfolding. The situation is just the opposite when 1G < 0.
PROTEIN STABILITY 187

than one place in the experimentally accessible range (when thesolvent is in the liquid state).
The second intersection of 1G!d with the temperature axis, which
occurs well below the heat-denaturation temperature, is known asthe cold-denaturation temperature. The mathematical form of the sta-bility curve, which is based on solid experimental evidence of heat-denaturation, suggests that protein unfolding can be induced byheating or, strange as it may seem, by cooling. This prediction hasbeen confirmed by experimental studies in a number of cases, greatlyunderscoring the value of good mathematical modeling of experi-mental results for prediction of the behavior of biochemical systems.Cold denaturation seems rather counterintuitive. For in order tomelt acrystal, one expects to have to add heat, in which case 1H > 0. Theentropy change on protein unfolding, 1S!d " 1H!
d=Tm, is thereforepositive, in accord with intuition. By contrast, in cold denaturation1H!
d < 0! It follows that 1S!d < 0 for cold denaturation. Weird! Somepeptide aggregates are known to exhibit cold denaturation on heat-ing from room temperature. In other words, the peptides tend not tobe aggregated in aqueous solution at 25!C, but heating the solutionleads to spontaneous gelation, a type of peptide aggregation whichresembles the condensation of hydrophobic residues in the folding ofa small protein. In all these cases,1G!
d can pass through 0more thanonce because both 1H and 1S depend on T.
So far we have been discussing 1G as a function of temperature.There are other independent variables we could consider, forexample, pH and chemical denaturant concentration. Let’s look atthe latter first. As chemical denaturant is added to a protein solu-tion, the folded state becomes destabilized relative to the unfoldedstate, and the protein unfolds. At the so-called midpoint con-centration of denaturant, 1G" 0, and the fraction of molecules inthe folded state is equal to the fraction in the unfolded state. Thesuperscript on G has disappeared because now we are consideringthe protein in solution in the presence of denaturant. Note how themidpoint concentration of chemical denaturation closely resemblesthe transition temperature of thermal denaturation. In pH dena-turation, either acid or base is added to the protein solution toinduce unfolding. At the midpoint pH, half of the molecules are inone state and half are in the other, and again, 1G"0.
Chemical denaturation and pH denaturation are such commonforms of studying protein stability that further details can be pro-vided here. The stability of the folded state of a protein in the pre-sence of a chemical denaturant is often modeled as
1Gd " 1G!d $ mc; %5:60&
where c, the concentration of denaturant (usually in molar units), isthe only independent variable, and m is a parameter that dependson temperature, pH, buffer, and – is it surprising? – the protein.Note that at the concentration midpoint, which is determinedexperimentally, 1G!
d " mc. So if 1G!d is known independently, for
188 GIBBS FREE ENERGY – APPLICATIONS

example, by calorimetry, m can be determined experimentally.Eqn. (5.60) “works”; it can be used to study protein denaturation. Butit should be added that the physical meaning of m is not entirelyclear, though it seems to correspond roughly to the increase insurface area of the protein in contact with the solvent uponunfolding. Figure 5.28 illustrates the effect on protein stability ofchanging the denaturant concentration. The denaturant is urea, anda change in the conformation of the protein is detected as a changein electrophoretic mobility. The more compact the protein, thehigher the mobility in a network of non-migrating polymers. Anunfolded protein migrates more slowly than a folded one. Themodel of protein stability outlined here is plausible for a number ofreasons. At the same time, however, it says nothing at all aboutwhat the denaturant does to make the protein unfold. Moreover,experiments show that, although in many cases the dependence of1Gd on denaturant concentration is approximately linear, in somecases it is distinctly non-linear. The physical meaning of such non-linear behavior is usually uncertain.
As we have said, a change in pH can also cause a protein tounfold. Such denaturation usually occurs for two reasons. One isthat a charged side chain can be partly buried, giving it an anom-alous pKa, and a change in the ionization state of the side chaincan destabilize folded structure. Another is that at extremes of pH,the net charge on the protein can be very large, resulting in anunusually large destabilizing contribution to the overall thermo-stability. The change in stability of the folded state, 1(1Gd), varieswith a change in pH as
1%1Gd&=1%pH& " 2:3RT1Q ; %5:61&
where1Q is the difference in number of bound protons between theunfolded state and the folded state, 1(pH) corresponds to a differ-ence in [H3O
#], and 2.3 is a conversion factor related to logarithms.Using these hints, can you derive Eqn. (5.61)?
It has frequently been observed that point mutations in proteinslead to relatively large changes in 1S! and 1H! but a relatively smallchange in 1G!. The changes in 1S! and 1H! are often difficult torationalize in terms of changes in protein structure as assessed byNMR spectroscopy or X-ray crystallography. This “cancellation” of
Fig. 5.28 Urea denaturation gel
electrophoresis. Structural
transitions in protein can be studied
by polyacrylamide gel
electrophoresis. The horizontal
axis is a linear gradient in urea
concentration. When the
concentration is sufficiently high,
the protein unfolds. This is
detected as a change in the mobility
of the protein in the gel matrix.
Compact folded proteins generally
migrate faster in the gel than
extended unfolded proteins.
PROTEIN STABILITY 189

changes in the enthalpy and entropy terms is known as enthalpy–entropy compensation. Apparently, subtle differences in structure andsolvation can have significant thermodynamic consequences. Thispoints up both the remarkable plasticity of the folded state of aprotein and the still shallow understanding of the microscopic ori-gins of macroscopic properties of materials and systems. We’llreturn to this topic in Chapter 9.
Now let’s bring a bit of biology into the picture. We wish to covertwo subtopics to round out this section: the engineering of enzymesto enhance their thermostability without altering specificity and therole of stability in protein degradation.
Protein engineering: enzymes are biological catalysts (Chapter 8).The ability to produce massive quantities of an enzyme by recom-binant DNA technology has made it feasible to consider the use ofenzymes in biomedical, chemical, and industrial applications.Often, though, the physical environment of the enzyme in a prac-tical application will be different from the environment in which itis found in nature. An enzyme can be engineered by standardmolecular biological techniques to tailor properties to specificapplications. For instance, a way in which the stability of an enzymecan be increased is to decrease the disorder of its unfolded state.This will lead to a substantial decrease in 1Sd but in some caseseffectively no change in 1Hd. The change can be brought about byreplacing a Gly residue with any other residue type. Some Gly resi-dues, for instance, ones in turns, won’t work well for this purpose,because replacement has too large an impact on the structure of thefolded state. In general, though, Gly residues make the polypeptidebackbone very flexible, while the amino acids with side chainsrestrict bond rotations in the backbone. Pro residues allow practi-cally no backbone flexibility, and these can be introduced into turns.Yet another approach is to add disulfide bonds. These link differentparts of the polypeptide chain and reduce its mobility in the unfol-ded protein (see Chapter 6, Section C). A complementary approach tostabilization of a protein is to increase the enthalpy of the foldedstate. This can lead to a substantial increase in1Hd but effectively nochange in 1Sd. Unfavorable electrostatic interactions in the foldedstate can be replaced by favorable ones, and negatively charged sidechains (particularly that of Asp) can be placed at the beginning of anÆ-helix to interact favorably with the helix dipole. Amino acid sub-stitutions can be made within helices to increase their strength, andwithin the protein core to increase the hydrophobic surface area. Allsuch changes can lead to a protein of increased stability.
Protein degradation: as we have said, protein stability can bemeasured by 1G!
d or Keq. Because Keq measures the ratio of the for-ward and reverse rate constants (Chapter 8), when the folded state ofa protein is stable (i.e. when 1G!
d is large, if the folded state is thereference state), the rate of folding must be greater than the rate ofunfolding. When the folded state is the more stable one, there willstill be some molecules in the unfolded state, even though that
190 GIBBS FREE ENERGY – APPLICATIONS

proportion will be small except in the region of the transition (seeChapter 6). When Keq" 1, not only is there no free energydifference between the states, there is an equimolar mixture of fol-ded state and unfolded state. In other words, the bottom of theenergy well is at the same level as the ground surrounding the well!The proportion of molecules in one state or the other changes as theconditions are adjusted. Even when the stability of the folded state isrelatively large, some unfolded proteins will be around, though therelative proportion of unfolded molecules could be 10$6 or less. Aquestion we’d like to be able to answer is this: because the turnoverrate of endogenous protein in an organism is high, i.e. because thebody is constantly recycling its protein, (see Chapter 9), does thebody clear protein by having a specialized degradation protein bindto and digest unfolded proteins? Does the degradation of an unfoldedprotein then diminish the population of folded proteins by massaction and thereby stimulate the synthesis of replacement protein?Or, does the body make “degradation proteins” that actively unfoldproteins at random? If the former, it is thermal energy and the spe-cific solution conditions of the body (salt concentration, pH, etc.)that play some role in clearing proteins. If the latter, then energymust be supplied to clear proteins, since work must be done todenature a stable folded protein. In fact, there appear to be proteinsthat can unfold and degrade stable, native proteins in the presence ofATP. One such protein in bacteria, ClpA, is a member of the Clp/Hsp100 “chaperone” family. Are there corresponding proteins inmammals? Another question we’d like to be able to answer is, if thebody continually recycles protein, it must continually make it, andbecause proteins are synthesized on ribosomes from mRNA tem-plates, genes must continually be transcribed, and if mutations ingenes can lead to pathological proteins, and if mutations accumulateas the body ages, does the body somehow “program” its own death?
R. Protein dynamics
In an earlier chapter we described the folded state of a protein as anorganic crystal. Indeed, if this were not so, it probably would not bepossible to crystallize proteins! More importantly, without arelatively fixed geometry in the catalytic site, how could an enzymecarry out a specific function? Such considerations might give thefalse impression that the folded state of a protein has a rigidly fixedstructure. Instead, folded states of proteins, though sturdy andcrystal-like, are nevertheless flexible, and they exhibit many veryrapid small-scale fluctuations. Evidence for dynamical behaviorwhich arises from thermal motion tells us that the native structureof a protein is a large ensemble of similar and rapidly inter-con-verting conformations that have the same or nearly the same freeenergy. As we shall see, structural mobility in the native state hascrucial functional significance.
PROTEIN DYNAMICS 191
First, let’s see how this section links to the one on proteinstability. The melting temperature of a protein showing two-statebehavior depends on the balance of1Hd and1Sd. For given values ofthese thermodynamic functions, if the folded state of a protein wereextremely rigid, then the change in entropy on unfolding would belarge, and the protein would never fold; Tm would simply be too low(see Eqn. (3.21)). And if the entropy of the unfolded state of a proteinwere not very different from the entropy of the folded state, 1Sdwould be small, and 1Hd/1Sd would be so large that the proteinwould never unfold. This could be disastrous for the cell if a proteinbecame modified in such a way as to be pathogenic.
Now, you might find it interesting that protein flexibility isdemonstrated by the very fact that proteins can be crystallized!There are two points we can make. One is that high-resolution X-raydiffraction data provide valuable information on the motions ofatoms more massive than hydrogen. Modeling of the proteinstructure is a matter of fitting a molecule with the known covalentconstraints to an electron density map. The map does not revealprecisely where the center of mass of an atom will be, but only avolume of space where an atom is likely to be found. Analysis ofsuch data shows that some atoms in a protein move very little whileothers move a great deal – when the protein is folded and in acrystal. There is another way in which protein crystals reveal thatsuch motions exist, and it shows that the motions have physiologicalrelevance. X-ray studies of the oxygen transport and storage proteinshemoglobin and myoglobin show that there is no obvious route forO2 to move from the solvent to the binding site; oxygen takes upspace. One concludes that O2 (and CO2) binding and release dependon fluctuations in structure known as “breathing motions.”
The length and time scales of such motions depend on freeenergy differences relative to the minimum free energy structure.There are three basic types of dynamical motion: atomic fluctuations,collective motions and triggered conformational changes. Atomic fluctua-tions occur on a time scale on the order of picoseconds and arerelatively small in magnitude, while conformational changes aretypically much slower and larger. X-ray analysis of the active sitecleft of hen lysozyme, for example, shows that some of its atomsmove by )1 A
!on substrate binding. Small but significant.
Other experimental methods that reveal the motions of foldedproteins are NMR spectroscopy and hydrogen exchange. NMR can beused to measure the rate of 180!-flipping of the ring of a Phe or Tyrside chain about the C"–CÆ bond. The rate varies, but it generallyfalls in the !s–s range. Recent developments in NMR data collectionand analysis permit a more general analysis of polypeptide back-bone and amino acid side chain dynamics. NMR can also be coupledwith the exchange of labile protons in the polypeptide backbone ofa protein to gain information on protein dynamics. Exchange ofsuch protons is temperature-dependent for two reasons: the stabi-lity of the native state of a protein varies with temperature, as we
192 GIBBS FREE ENERGY – APPLICATIONS
saw above, and the exchange rate depends on temperature (as wellas pH). These experiments involve D2O, and deuterium is exchangedin for solvent hydrogen. The approach is particularly attractive fromthe point of view of experimental design and analysis of results,because hydrogen and deuterium are chemically identical but havecompletely different NMR characteristics (see Chapter 8).
S. Non-equilibrium thermodynamics and life
At some point in your study of thermodynamics you may havewondered: if the First Law requires the total energy of the universeto be constant, and the Second Law requires that every process beaccompanied by an increase in the entropy of the universe, thenhow is life possible at all? Do the tremendously complex forms ofmatter we call living organisms violate the laws of thermo-dynamics? Clearly, the answer must be no, if the laws of thermo-dynamics as formulated actually do describe our universe.
In Chapters 4 and 5 we have used a combination of the First andSecond Laws to look at a number of biological processes at equili-brium. We have seen how useful the Gibbs free energy function isfor describing these processes. Although aspects of biochemistry canbe described in this way, we should always remember that no livingorganism is at equilibrium! This holds not only for the organism as awhole but each of its cells. Moreover, it applies to every last bacter-ium inhabiting the cosy environment of your gut. Important for us, anon-equilibrium process is by definition irreversible (though possiblynot completely irreversible)! Let’s look at this topic somewhat morecarefully.
An in vitro biochemical reaction is a closed system (Chapter 1). Assuch, it will change until equilibrium is reached. A living organism, onthe other hand, be it an amoeba, a bombardier beetle, or a wildebeest,is an open system. An organism is therefore never at equilibrium. Anorganism takes in high-enthalpy and low-entropy compounds fromits surroundings, transforms them into a more useful form of che-mical energy, and returns low-enthalpy and high-entropy com-pounds to its surroundings. By means of such energy flows, livingorganisms degrade the quality of the energy of the universe. Non-equilibrium systems “dissipate” the useful energy of the universe.
Energy flow through an organism is like water flow through achannel. (But this does not mean that energy is a material particle ora collection of particles!). The rate of flow through an organism inadulthood is approximately constant, a situation known as steadystate. A steady-state system changes continually, but there is no netchange in the system – its physical makeup, the amount of matterpresent. (What changes occur in the brain when an adult learnssomething new and remembers it?) Steady state in an open systemis the analog of equilibrium in a closed system. A steady inward flowof energy is the most stable state an open system can achieve. As
NON-EQUILIBRIUM THERMODYNAMICS AND LIFE 193
depicted in Fig. 2.5B, if the inward flow of energy differs fromthe rate at which energy is consumed, a change in weight occurs.A voracious reader is clearly something very different from avoracious eater.
Must a living organism be a non-equilibrium system? If it werenot, it could not do useful work. An equilibrium system cannot douseful work. This is because at equilibrium, there is no free energydifference between reactants and products. An equilibrium processcannot be directed. It is “rudderless.” The schematic diagrams ofearlier chapters highlighted the machine-like qualities of livingorganisms; indeed, there are many similarities. For instance, bothorganisms and machines are made of matter, and the processescarried out by both are, at least to some extent, irreversible.Organisms and machines can do work. Because body temperature isnot very different from and often greater than the temperature ofthe surroundings, an organism can do very little work by means ofheat transfer, practically none. Instead, organisms do work by tak-ing in free energy from their surroundings – food. Like machines,organisms “wear out” with use. Excessive physical activity candamage the body. Extensive bicycling on insufficient conditioning,for example, can result in a damaged nervous system, with neuronsin the leg tingling constantly, possibly until death. Machines, bycontrast, are basically “static” structures. The plastic in a computerkeyboard, for example, is not changing dramatically from momentto moment. The keyboard molecules are not simultaneously beingdegraded by enzymes and replaced by newly synthesized ones. Liv-ing organisms are different. They need free energy because theymust renew themselves to live. Their proteins are constantly beingdestroyed and new ones must be made to take their place. DNA isconstantly being replicated. Certainly, organisms display machine-like qualities. But organisms are different from lifeless machines. Aliving organism cannot be at equilibrium.
Where does the thermodynamic irreversibility of a living organ-ism come from? If many individual biochemical reactions are rever-sible, at what length scale does irreversibility set in? What is themicroscopic origin of irreversibility in biological organisms? Theseare hard questions! We do not pretend to answer them fully here.There are numerous contributions to the overall fact of irreversi-bility, but a particularly important one is non-productive hydrolysisof ATP. As we have seen, ATP is hydrolyzed spontaneously in water. Ifhydrolysis is not coupled to ametabolic reaction, the energy releasedwill go off as heat – irreversibly. There are also three “irreversible”steps in the metabolism of glucose to pyruvate. These occur betweenglucose and G6P, F6P and FDP and PEP and pyruvate. This turns out tobe extremely important for cellular function, for it is really only atthe irreversible steps of a process that “machine-like” control can beexerted: it permits regulation of the speed of the reaction. Suchregulation is of considerable importance to reactions that occurdownstream.
194 GIBBS FREE ENERGY – APPLICATIONS
Lastly, non-equilibrium systems present a number of problems forthequantificationof thermodynamic functions. The First Lawhasbeenverified experimentally and quantitatively for living organisms. It’sharder to do this for the Second Law for reasons outlined above.Entropy, free energy and chemical potential cannot be measured fornon-equilibrium systems. There is nevertheless a way of connecting anon-equilibrium system with something more amenable to study andanalysis, and that is the internal energy, U. Suppose we wish to mea-sure the internal energy of a non-equilibrium system. This can bedoneby isolating the systemandwaiting for it to come to equilibrium.Because the system is isolated, the internal energy will be the same atequilibrium as in any non-equilibrium state. If U of the equilibriumstate is thenmeasuredwith respect to some reference value, thenU ofthe non-equilibrium state is known. Can you think of other ways ofapproaching the problem of quantifying thermodynamic functionsand verifying the Laws for living organisms? Doing so might lead tonew insights on what it is to be alive. Best wishes!
T. References and further reading
Adair, G. (1925). The osmotic pressure of hæmoglobin in the absence of salts.Proceedings of the Royal Society of London A, 109, 292–300.
Anfinsen, C. B. (1973). Principles that govern the folding of protein chains.Science, 181, 223–30.
Arakawa, T. & Timasheff, S. N. (1985). Theory of protein solubility. Methods inEnzymology, 114, 49–77.
Atkins, P.W. (1994). The Second Law: Energy, Chaos, and Form, ch. 8. New York:Scientific American.
Baker, T. A. (1999). Trapped in the act. Nature, 401, 29–30.Barth, R.H. (1992). Dialysis. In Encyclopedia of Applied Physics, ed. G. L. Trigg,vol. 4, pp. 533–5. New York: VCH.
Ben-Shem, A., Frolow, F. & Nelson, N. (2003). Crystal structure of plantphotosystem I. Nature, 426, 630–5.
Bergethon, P. R. (1998). The Physical Basis of Biochemistry: the Foundations ofMolecular Biophysics, ch. 13.1. New York: Springer-Verlag.
Brandts, J. F. (1964). The thermodynamics of protein denaturation. I. Thedenaturation of chymotrypsinogen. Journal of the American Chemical Society,86, 4291–301.
Brandts, J. F. (1964). The thermodynamics of protein denaturation. II. A modelof reversible denaturation and interpretations regarding the stability ofchymotrypsinogen. Journal of the American Chemical Society, 86, 4302–14.
Bridger, W.A. & Henderson, J. F. (1983). Cell ATP. New York: John Wiley.Brønsted, J. N. (1923). Recueil des Travaux Chimiques des Pays-Bas, 42, 718–28.Chothia, C. (1984). Principles that determine the structure of proteins,Annual Review of Biochemistry, 53, 537–72.
Christensen, H.N. & Cellarius, R. A. (1972). Introduction to Bioenergetics:Thermodynamics for the Biologist: A Learning Program for Students of the Biologicaland Medical Sciences. Philadelphia: W. B. Saunders.
REFERENCES AND FURTHER READING 195
Conti, B., Sanchez-Alavez, M., Winsky-Sommerer, R., Morale, M.C., Lucero, J.,Brownell, S., Fabre, V., Huitron-Resendiz, S., Henriksen, S., Zorrilla, E. P.,de Lecea, L. & Bartfai, T. (2006). Transgenic mice with a reduced core bodytemperature have an increased life span. Science, 314, 825–8.
Cooper, A. (2001). Thermodynamics of protein-protein and peptideinteractions. In Aggeli, A., Boden, N. & Zhang, S. (eds.) Self-assembling PeptideSystems in Biology, Medicine and Engineering, pp. 47–64. Dordrecht: KluwerAcademic.
Cramer, W.A. & Knaff, D. B. (1991). Energy Transduction in Biological Membranes.A Textbook of Bioenergetics. New York: Springer-Verlag.
Creighton, T. E. (1991). Stability of folded proteins. Current Opinion inStructural Biology, 1, 5–16.
Dawes, E. A. (1962). Quantitative Problems in Biochemistry, 2nd edn, ch. 1.Edinburgh: E. & S. Livingstone.
Donnan, F. G. (1911). Title. Zeitschrift fur Elektrochemie und AngewandtePhysikalische Chemie, 17, 572.
Encyclopædia Britannica CD 98, “Colligative Property,” “Dialysis,”“Metabolism,” “Photosynthesis,” “Saturation,” and “Vapour Pressure.”
Epstein, I. R. (1989). The role of flow in systems far-from-equilibrium, Journalof Chemical Education, 66, 191–5.
Fersht, A. R. (1999). Structure and Mechanism in Protein Science: a Guide to EnzymeCatalysis and Protein Folding. New York: W. H. Freeman.
Fox, S. & Foster, J. S. (1957). Introduction to Protein Chemistry, p. 242. New York:John Wiley.
Franks, F. (1995). Protein destabilization at low temperatures. Advances inProtein Chemistry, 46, 105–39.
Frauenfelder, H., Parak, F. & Young, R.D. (1988). Conformational substates inproteins. Annual Review of Biophysics and Biophysical Chemistry, 17, 451–79.
Freeman, B. (1995). Osmosis. In Encyclopedia of Applied Physics, ed. G. L. Trigg,vol. 13, pp. 59–71. New York: VCH.
Frohlich, H. (1969). Quantum mechanical concepts in biology. In TheoreticalPhysics and Biology, ed. M. Marios. Amsterdam: North-Holland.
Fruton, J. S. (1999). Proteins, Enzymes, Genes: the Interplay of Chemistry and Biology.New Haven: Yale University Press.
Garrett, J. (1990). Thermodynamics in sheep. Education in Chemistry, 27, 127.George, P. & Rutman, R. J. (1960). The ‘high energy phosphate bond’ concept.Progress in Biophysics and Biophysical Chemistry, 10, 1–53.
Gillispie, Charles C. (ed.) (1970). Dictionary of Scientific Biography. New York:Charles Scribner.
Girandier, L. & Stock, M. J. (eds.) (1983). Mammalian Thermogenesis. London:Chapman & Hall.
Gutfreund, H. (1949). In Hæmoglobin: a Symposium Based on a Conference Held atCambridge in June 1948 in Memory of Sir John Barcroft, ed. F. J.W. Roughtonand J. C. Kendrew, p. 197. London: Butterworths.
Haase, R. (1969). Thermodynamics of Irreversible Processes. New York: Dover.Harold, F.M. (1986). The Vital Force: a Study of Bioenergetics. New York: W. H.Freeman.
Harris, D. A. (1995). Bioenergetics at a Glance, ch. 1. Oxford: Blackwell Science.Hatefi, Y. (1985). The mitochondrial electron transport and oxidativephosphorylation system. Annual Review of Biochemistry, 54, 1015–69.
Haynie, D. T. (1993). The Structural Thermodynamics of Protein Folding, ch. 4.Ph.D. thesis, The Johns Hopkins University.
196 GIBBS FREE ENERGY – APPLICATIONS

Hinckle, P. C. & McCarty, R. E. (1978). How cells make ATP. Scientific American,238(3), 104–23.
Karplus, M. & McCammon, J. A. (1986). Protein dynamics. Scientific American,254(4), 30–9.
Katchalsky, A. & Curran, P. F. (1967). Nonequilibrium Thermodynamics inBiophysics. Cambridge, Massachusetts: Harvard University Press.
Kauzmann, W. (1958). Some factors in the interpretation of proteindenaturation. Advances in Protein Chemistry, 14, 1–63.
Klotz, I.M. (1986). Introduction to Biomolecular Energetics, cc. 3–7. Orlando:Academic Press.
Kondepudi, D. & Prigogine, I. (1998).Modern Thermodynamics: from Heat Enginesto Dissipative Structures, ch. 8.2. Chichester: John Wiley.
Kyoguko, Y., Lord, R. C. & Rich, A. (1969). An infrared study of the hydrogen-bonding specificity of hypoxanthine and other nucleic acid derivatives.Biochimica et Biophysica Acta, 179, 10–17.
Lamm, M. S., Rajagopal, K., Schneider, J. P. & Pochan, D. J. (2005). Laminatedmorphology of nontwisting b-sheet fibrils constructed via peptide self-assembly. Journal of the American Chemical Society, 127, 16 692–700.
Lodish, H., Baltimore, D., Berk, A., Zipursky, S. L., Matsudaira, P. & Darnell, J.(1995).Molecular Cell Biology, 3rd edn, cc. 2, 4 & 21. New York: W. H. Freeman.
Lowell, B. B. & Spiegelman, B.M. (2000). Towards a molecular understandingof adaptive thermogenesis. Nature, 404, 652–60.
Makhatadze, G. I. & Privalov, P. L. (1995). Energetics of protein structure.Advances in Protein Chemistry, 47, 307–425.
Matthews, B.W. (1995). Studies on protein stability with T4 lysozyme.Advances in Protein Chemistry, 46, 249–78.
McCammon, J. A. & Harvey, S. C. (1987). Dynamics of Proteins and Nucleic Acids.Cambridge: Cambridge University Press.
Millar, D., Millar, I., Millar, J. & Millar, M. (1989). Chambers Concise Dictionary ofScientists. Cambridge: Chambers.
Mitchell, P. (1976). Vectorial chemistry and the molecular mechanisms ofchemiosmotic coupling: power transmission by proticity Biochemical SocietyTransactions, 4, 398–430.
Morowitz, H. J. (1978). Foundations of Bioenergetics, ch. 3E. New York: AcademicPress.
Nicholls, D. G. & Ferguson, S. J. (1992). Bioenergetics 2, ch 3. London: AcademicPress.
Noyes, R.M. (1996). Application of the Gibbs function to chemical systemsand subsystems. Journal of Chemical Education, 73, 404–8.
O’Brien, C. (1994). New enzyme structure reveals cell’s rotary engine. Science,265, 1176–7.
Osyczka, A., Moser, C. C., Daldal, F. & Dutton, P. L. (2004). Reversible redoxenergy coupling in electron transfer chains. Nature, 427, 607–12.
Pardee, G. S. & Ingraham, L. L. (1960). Free energy and entropy inmetabolism. In Metabolic Pathways, ed. D.M. Greenberg, vol. I. New York:Academic Press.
Pauling, L. C. (1970). Structure of high energy molecules. Chemistry in Britain,6, 468–72.
Pepys, M. B., Hawkins, P. N., Booth, D. R., Vigushin, D.M., Tennent, G. A.,Soutar, A. K., Totty, N., Nguyent, O., Blake, C. C. F., Terry, C. J., Feest, T. G.,Zalin, A.M. & Hsuan, J. J. (1993). Human lysozyme gene mutations causehereditary systemic amyloidosis. Nature, 362, 553–7.
REFERENCES AND FURTHER READING 197

Peusner, L. (1974). Concepts in Bioenergetics, cc. 3, 5, 6, 7 & 10–8. EnglewoodCliffs: Prentice-Hall.
Plum, G. E. & Breslauer, K. J. (1995). Calorimetry of proteins and nucleicacids. Current Opinion Structural Biology, 5, 682–90.
Prigogine, I. (1967). Introduction to Thermodynamics of Irreversible Processes. NewYork: John Wiley.
Prigogine, I. (1969). Structure, dissipation and life. In Theoretical Physics andBiology, ed. M. Marios. Amsterdam: North-Holland.
Prigogine, I., Nicolis, G. & Babloyants, A. (1972). Thermodynamics ofevolution. Physics Today, 25 (11), 23–8.
Prigogine, I., Nicolis, G. & Babloyants, A. (1972). Thermodynamics ofevolution. Physics Today, 25 (12), 38–44.
Record, M. T., Jr, Zhang,W. & Anderson, C. F. (1998). Analysis of effects of saltsand uncharged solutes on protein and nucleic acid equilibria andprocesses: a practical guide to recognizing and interpreting polyelectrolyteeffects, Hofmeister effects, and osmotic effects. Advances in Protein Chemistry,51, 281–353.
Rich, P. (2003). Chemiosmotic coupling: The cost of living. Nature, 421, 583.Roberts, T. J., Marsh, R. L., Weyland, P.G., & Taylor, C.R. (1997). Muscular forcein running turkeys: the economy ofminimizing work. Science, 275, 1113–15.
Rondelez, Y., Tresset, G., Nakashima, T., Kato-Yamada, Y., Fujita, H.,Takeuchi, S. & Noji, H. (2005). Highly conserved ATP synthesis by F1-ATPase single molecules. Nature, 433, 773–7.
Rovner, S. L. (2004). The secrets of aging. Chemical & Engineering News, 82(34),30–5.
Ruelle, D. (2001). A departure from equilibrium. Nature, 414, 263–5.Schellman, J. A. (1987). The thermodynamic stability of proteins. AnnualReview of Biophysics and Biophysical Chemistry, 16, 115–37.
Schnitzer, M. J. (2001). Doing a rotary two-step. Nature, 410, 878–81.Secrest, D. (1996). Osmotic pressure and the effects of gravity on solutions.Journal of Chemical Education, 73, 998–1000.
Segal, I. H. (1976). Biochemical Calculations: How to Solve Mathematical Problems inGeneral Biochemistry, 2nd edn, ch. 3. New York: John Wiley.
Shavit, N. (1980). Energy transduction in chloroplasts. Annual Review ofBiochemistry, 49, 111–39.
Shaw, A. & Bott, R. (1996). Engineering enzymes for stability. Current Opinionin Structural Biology, 6, 546–50.
Shortle, D. (1996). The denatured state (the other half of the foldingequation) and its role in protein stability. Federation of the American Societiesfor Experimental Biology Journal, 10, 27–34.
Smith, C. A. & Wood, E. J. (1991). Energy in Biological Systems, cc. 1.3 & 1.4.London: Chapman & Hall.
Snell, F.M., Shulman, S., Spencer, R. P. & Moos, C. (1965). Biophysical Principlesof Structure and Function, ch. 8. Reading, Massachusetts: Addison-Wesley.
Spolar, R., Livingstone, J. & Record, M. T., Jr. (1992). Use of liquidhydrocarbon and amide transfer data to estimate contributions tothermodynamic functions of protein folding from the removal ofnonpolar and polar surface from water. Biochemistry, 31, 3947–55.
Tanford, C. (1968). Protein denaturation (parts A and B). Advances in ProteinChemistry, 23, 121–282.
Timasheff, S. N. (1993). The control of protein stability and association byweak interactions with water: how do solvents affect these processes?Annual Review of Biophysics and Biomolecular Structure, 22, 67–97.
198 GIBBS FREE ENERGY – APPLICATIONS

Timasheff, S. N. (1998). Control of protein stability and reactions by weaklyinteracting cosolvents: the simplicity and the complicated. Advances inProtein Chemistry, 51, 355–432.
Timbrell, J. A. (1991). Principles of Biochemical Toxicology, 2nd edn, ch. 7.London: Taylor & Francis.
van Holde, K. E. (1985). Physical Biochemistry, 2nd edn, cc. 2.1, 2.3, 2.4, 3.4 &3.5. Englewood Cliffs: Prentice-Hall.
Voet, D. & Voet, J. G. (1995). Biochemistry, 2nd edn, cc. 3, 4, 15–4–15–6, 16, 18–1, 19–1, 20, 22, 28–3, 28–5A & 34–4B. New York: John Wiley.
Weber-Ban, E. U., Reid, B. G., Miranker, A.D. & Horwich, A. L. (1999). Globalunfolding of a substrate protein by the Hsp100 chaperone ClpA. Nature,401, 90–3.
Williams, S. (1999). Life as a part-time plant. Wellcome News, 20, 38.Williams, T. I. (ed.) (1969). A Biographical Dictionary of Scientists. London: Adam& Charles Black.
Woodcock, A. & Davis, M. (1978). Catastrophe Theory. Harmondsworth:Penguin.
Wrigglesworth, J. (1997). Energy and Life, cc. 3, 5.7.2, 7.1, 7.3 & 7.5.1. London:Taylor & Francis.
Yasuda, R., Noji, H., Yoshida, M., Kinosita, K., Jr & Itoh, H. (2001). Resolutionof distinct rotational substeps by submillisecond kinetic analysis of F1-ATPase. Nature, 410, 898–904.
Youvan, D. C. & Marrs, B. L. (1987). Molecular mechanisms of photosynthesis.Scientific American, 256 (6), 42–8.
Zouni, A., Witt, H.-T., Kern, J., Fromme, P., Krauß, N., Saenger, W. & Orth, P.Crystal structure of photosystem II from Synechococcus elongates at 3.8 A
!
resolution. Nature, 409, 739–43.
U. Exercises
1. Speculate in broad terms on the effect on Earth of the cessationof photosynthesis.
2. The energy conversion process by which sunlight is convertedinto biomass is not completely efficient. What happens to theenergy that does not become biomass? Rationalize your answerin terms of the First and Second Laws of thermodynamics.
3. Animal life as part-time plant? Sue Williams of the Departmentof Botany, University of Western Australia, says that the green-tinged sea slugs she studies “enslave” chloroplasts from theseaweed they ingest, and use them as a means of capturing up to25% of their energy. Explain how this might work.
4. Use the following information to determine the standard freeenergy change of ATP hydrolysis.
Glucose#ATP ! glucose-6-phosphate#ADP 1G!0 "$ 16.7 kJ mol$1
Glucose-6-phosphate ! glucose# Pi 1G!0 "$ 13.8 kJ mol$1
Show all work.
EXERCISES 199

5. Buffers containing ATP are ordinarily made up fresh and notstored as a stock solution. When a stock solution is made, itmust usually be kept at 4!C (short term storage) or at $20!C(long term storage). Rationalize these practices. What bearingdoes this have on the necessary molecular machinery of a cell?
6. ATP is the energy currency of the cell. ATP is essential for life aswe know it. Comment on the stability of ATP in aqueous solutionand the constraints thismay place on theories of the origin of life.
7. The free energy status of a cell can be described in various ways.One of these, called the adenylate energy charge (AEC), wasfirst proposed by Daniel Edward Atkinson (1921–). The AEC isdefined as
AEC"%,ATP- # 0:5,ADP-&=%,ATP- # ,ADP- # ,AMP-&
and it varies between 1.0, when all the adenine nucleotide is ATP,and 0, when all the "- and ª-phosphoanhydride bonds have beenhydrolyzed. The relative amounts of ATP, ADP, and AMP can bedetermined by comparing the sizes of the respective peaks in ahigh-performance liquid chromatography (HPLC) profile. TheAEC of a healthy cell is about 0.90–0.95.Malignant hypothermia isan inherited muscle disease in humans and pigs. Patients sufferrapid rises in body temperature, spasms in skeletal muscle, andincreases in the rate of metabolism, which can be fatal if nottreated with a suitable muscle relaxant. The following data wereobtained before the onset of symptoms and just prior to the deathof a pig afflicted with the disease.
Calculate the AEC before the symptoms began to occur and justbefore death. Comment on the magnitude of the values and whatthey indicate.
8. A 1 M solution of a glucose gives a pressure more than 25 timesgreater than that of the atmosphere. A 1 M solution of a saltgives an even larger osmotic pressure. Explain.
9. Suppose we have an osmometer that is constructed from acapillary tube with a membrane in the middle, and that thetube is oriented horizontally (why?). Now let some osmotic par-ticles suddenly appear on one side of the tube only. Explainwhat happens.
10. You have a U-tube osmometer with cells of equal shape andvolume. On one side, you place a sphere of volume V, and at the
[ATP][ADP]!mol g$1 tissue [AMP]
Before symptoms 4.2 0.37 0.029Before death 2.1 0.66 0.19
200 GIBBS FREE ENERGY – APPLICATIONS

same time and on the other side you place a cube of volume V.Neither particle is membrane-permeant. Suppose that theseparticles are able to interact with the solvent. Explain what willhappen in the following situations: (a) the particles are so densethat they sit on the bottom of the cells of the osmometer; (b) thedensity of the particles is such that they are able to diffusethroughout the volume of their respective cells.
11. What causes the membrane of a red blood cell to burst whenthe cell is placed in hypotonic solution? Be as specific aspossible.
12. Suppose you have an osmometer in which the solute particlesare confined to a fixed volume, for instance an indestructiblemembrane of fixed volume. What happens? Why?
13. Suppose you have an osmometer with a membrane that ispermeable to water but not to larger molecules. Add glucose toone side to a final concentration of 0.001 M and hemoglobin tothe other side to a concentration of 0.001 M. Will a pressurehead develop? If yes, on which side will the water level behigher? If no, why not?
14. Suppose you are involved in preparing recombinant protein fora physical biochemistry experiment. The approach involves 8 Murea, formation of which from urea crystals and water is highlyendothermic. The bacteria are lysed in 8 M urea, a chemicaldenaturant, and the recombinant protein is separated from thebacterial proteins by column chromatography. Separation of therecombinant protein from urea is done by dialysis in two stages.In each, c. 100 ml of lysate is dialyzed against 5 l of water. Thedialysis membrane allows the passage of water and urea but notprotein. Will the volume of the protein preparation change inthis procedure, and if so, how? Assuming that the volume of theprotein solution at the end of dialysis is 100 ml, what is the finalconcentration of urea? Explain, in enthalpic and entropic terms,the driving force for the reduction in urea concentration in thefirst step of dialysis. Explain from a thermodynamic point ofview what drives the further reduction in urea concentration inthe second step of dialysis.
15. Recall what happens to a red blood cell when it’s placed in ahypotonic solution. What must be done to ensure that dialysistubing doesn’t burst?
16. Prove that Eqns. (5.19) and (5.20) follow from the precedingequations.
17. Show that Eqn. (5.38) follows from Eqn. (5.36).
18. Derive Eqn. (5.40). (Hint: start with RT"R#R 0 I#R 0 L, expressR and R 0 I in terms of R 0 L, and solve for R 0 L.)
EXERCISES 201

19. Equation (5.41) is 0 for all concentrations of Ii when there is noinhibition (compound Ii has no effect), and it is 1 at 100% inhi-bition. Explain.
20. Analysis of gene regulation involves study of structural andthermodynamic aspects of how proteins bind nucleic acid. Onearea of such research is the recognition of DNA operator sites byrepressor molecules. Suppose protein P binds a single specificsequence on a molecule of DNA D. This is a common mechan-ism for the regulation of gene expression. At equilibrium, P#D, P 0D. A bacterial cell contains one molecule of DNA. Assumethat cell is cylindrical, and that its diameter and length are 1 !mand 2 !m, respectively. Calculate the total concentration of D.Assume that Keq" 10$10 M. Calculate the [P 0D], assuming that[P]" [D]. The concentration of bound D is just [P 0D]. Calculatethe concentration of unbound D. Calculate [P 0D]/[P]. Give aninterpretation of this quantity. The subject of binding will bediscussed in detail in Chapter 7.
21. The previous problem involved the association and dissociationof two types of macromolecule, proteins and DNA. A basic fea-ture of such situations is the dependence of the equilibrium onthe total concentrations of the interacting species. The conceptcan be illustrated by means of the monomer–dimer equilibrium.Consider the equilibrium
2M , D: %5:61&
The total concentration of monomer, [M]T, is [M]#2[D], wherethe factor 2 accounts for there being two monomers in eachdimer. This equation can be solved for [D]. Write down anexpression for the equilibrium constant for the reaction inEqn. (5.61). Combine this with your equation for [D] and solvethe resulting quadratic equation for [M]. Show that [M]/[M]T! 1as [M]T! 0, and that [M]/[M]T! 0 as [M]T!1. How does oneinterpret these limiting conditions?
22. What might be the structural basis for the low stability ofGeorgia hemoglobin relative to normal hemoglobin?
23. Hemocyanin is a Cu-containing oxygen-binding protein that isfound in some invertebrates. In squid hemocyanin, when thepartial pressure of oxygen gas is 0.13 atm at 25 !C, the oxygenbinding sites are 33% saturated. Assuming that each hemo-cyanin molecule binds one molecule of oxygen gas, calculatethe equilibrium constant. What are the units of the equili-brium constant? Calculate the standard state free energychange when hemocyanin interacts with O2(aq). The solubilityof pure oxygen in water at 1 atm and 25 !C is 0.001 17 mol(kg H2O)
$1.
202 GIBBS FREE ENERGY – APPLICATIONS

24. In ELISA, what type of interactions are likely to be mostimportant for protein adsorption to the solid support? Why areantibodies able to bind to partially denatured protein?
25. Explain in thermodynamic terms how a single 30-cycle PCRexperiment can yield billions of copies of double-stranded DNA.
26. Under normal conditions, complementary strands of DNA forma double helix. In the section on PCR we provided a way ofrationalizing the stability of DNA. Compare and contrast ourview with that put forward by Voet and Voet, authors of apopular biochemistry textbook (see pp. 866–70 of the secondedition, published in 1995). Can the data in their Table 28–4 betrusted? Why or why not?
27. Equation (5.50) for DNA supercoiling resembles the First Lawof Thermodynamics. List and explain the similarities anddifferences.
28. A certain machine of a biotechnology company provides a con-trolled environment for the automation of sequence-specific DNAanalysis and performs all the reaction steps required for captureand detection of nucleic acids. A main feature of the product is itscapture specificity. For instance, suppose a 300 bp PCR fragmentderived from the filamentous bacteriophage M13 was specificallycaptured by using a series of complementary oligonucleotideprobes 24 residues in length, and that the capture probes incor-porated 0–6 mismatches with the target. Explain how optimizingthe hybridization conditions (i.e. by adjusting the temperature)could distinguish sequences differing by a single base.
29. “Hot start.” When plasmid DNA is used as the template in a PCRreaction, the enzyme buffer, plasmid, and oligonucleotide pri-mers are often incubated at 95 !C for several minutes beforestarting thermal cycling. Why?
30. The release of insulin from pancreatic "-cells on uptake of glu-cose is a complex process. The steps of the process in roughoutline are as follows. The resting membrane potential of a"-cell is determined by open ATP-sensitive K# channels in theplasma membrane. After a meal, glucose is taken into the celland phosphorylated. Eventually, there is an increase in [ATP]/[ADP] ratio in the cell, and this closes the K# channels. Themembrane depolarizes, stimulating the opening of Ca2# chan-nels. Calcium enters the cell, stimulating the release of insulinthrough exocytosis of secretory granules. Describe each step ofthis process in moderately detailed thermodynamic terms.
31. Isothermal titrationcalorimetry.Thekeyconditionunderlying thistechnique is thermodynamic equilibrium. When an aliquot oftitrant is injected, the Gibbs free energy of the system increases. Aspontaneous chemical reaction occurs until G reaches a new
EXERCISES 203
minimumand equilibrium is established once again. An ITC studyof a ligand binding to a macromolecule was carried out at threetemperatures, T1, T2 and T3, where T1 < T2 < T3. At T1,1Hb > 0; atT2, 1Hb"0; and at T3, 1Hb > 0. The ligand is known to bind themacromolecule at all three temperatures by means of indepen-dent experiments. Explain what is happening in the reaction cellat each stage of a general ITC experiment, viz. before an injectionand during an injection. Rationalize the results obtained.
32. Speculate on the possibility of observing the cold denaturationof DNA. What about tRNA?
33. The folded and unfolded states of a protein are in equilibrium asshown in Eqn. (5.57). Suppose that you are working with asolution of RNase A at a concentration of 2.0 · 10$3 M, and thatfractions of protein in the unfolded state are as follows: 50 !C:0.002 55; 100 !C: 0.14. In the thermal denaturation of this pro-tein, there are essentially just two states, the folded one and theunfolded one, so the fraction of protein in the folded state is justone minus the fraction in the unfolded state. Calculate 1H! and1S! for unfolding of RNase A. What key assumption must bemade about temperature-dependence? Calculate 1G! for unfold-ing of RNase A at 37 !C. Is this process spontaneous at thistemperature? Determine the melting temperature of RNase Aunder standard state conditions (for a two-state reaction, at Tmhalf of the proteins are folded and half are unfolded).
34. The role of 1Cp in protein stability and its molecular origin wasdiscussed in publications by the American biochemist JohnBrandts as early as 1964. Use Eqn. (4.3) to investigate the role of1Cp in the thermostability of a protein. One relatively easy wayto do this is to assume values for 1H and 1S at some referencetemperature, say 298 K, and then to use a spreadsheet to calculate1G throughout a temperature range that includes 0–100 !C. Plot1G v. T for several different values of 1Cp. Note that the curvecrosses the T-axis at two points. What are the names of theseintercepts? What if 1Cp < 0? Is this physically meaningful? Is itrelevant to biological macromolecules?
35. Suppose you have designed a four-helix bundle. A four-helixbundle is just a polypeptide that folds into four helices ofapproximately equal length, and whose helices are bundledtogether. The helices interact with each other in the core of theprotein. Various structural techniques show that at room tem-perature the structure is highly dynamic and not very much likean organic crystal, though all four helices are intact. Thermaldenaturation studies, however, indicate that the unfolding tem-perature of your designed protein is over 100 !C! Explain. Howcould the design be modified to reduce the melting temperatureand increase the specificity of interactions in the protein core?
204 GIBBS FREE ENERGY – APPLICATIONS

36. Living organisms have been described as “relatively stable”systems that “show an organized collective behavior whichcannot be described in terms of an obvious (static) spatialorder” and are “not near thermal equilibrium.” Explain.
37. The synthesis of ATP under standard conditions requires 7.7kcalmol$1, and this is coupled to the movement of 2H# across amitochondrial membrane. Calculate the pH difference acrossthe inner mitochondrial membrane needed to drive ATPsynthesis at 25 !C.
38. Oxidation–reduction reactions in E. coli generate a pH gradientof #1 (outside to inside) and a voltage gradient of –120 mV(outside to inside). What free energy is made available by thisproton motive force? "-Galactosides are transported along withH# ions. Calculated the maximum concentration ratio of "-galactoside that can result from the coupling of its transport tothe proton motive force.
39. An empirical expression for the melting temperature of double-stranded DNA in the presence of NaCl is
Tm " 41:1XG#C # 16:6 log,Na#- # 81:5; %5:62&
where XG#C is the mole fraction of G–C pairs. Given a 1000 basepair gene with 293 Gs and 321 Cs, calculate the sodium ion con-centration at which it will have a melting temperature of 65 !C.
40. Use the following osmotic pressure data for horse hemoglobinin 0.2 M phosphate and at 3 !C to determine the molecular massof the protein.
Concentration ofhemoglobin (g/100 ml) Osmotic pressure (cm H2O)
0.65 3.840.81 3.821.11 3.511.24 3.791.65 3.461.78 3.822.17 3.822.54 3.402.98 3.763.52 3.803.90 3.744.89 4.006.06 3.948.01 4.278.89 4.36
EXERCISES 205

41. The effect of pH on the osmotic pressure of sheep hemoglobinwas investigated by Gilbert Adair (Chapter 7). The following datawere obtained.
Plot the data and use them to deduce the isoelectric point ofsheep hemoglobin.
42. Why would it not be a good idea to water your houseplants withboiling water?
43. Suggestion biochemical means by which one might test theorigin of the heat produced by Arum maculatum (see Chapter 3).(Hint: use tissue extracts of the spadix and appendix of theplant and consider poisons that block either electron transportor oxidative phosphorylation).
44. It is sometimes said that the two terminal phosphoanhydridebonds of ATP are “high-energy” bonds. This implies that theenergy released as free energy when the bond is cleaved isstored within the bond itself. Why is the term high-energy bondmisleading?
45. Mg2# ions interact with ATP under physiological conditions.What is the likely effect of this on the free energy of hydrolysisof ATP? Why?
pH Osmotic pressure (mmHg/1 g protein/100 ml)*
5.0 21.55.4 13.46.5 3.26.7 2.46.8 2.46.8 3.56.8 4.57.2 5.09.6 15.610.2 21.4
*1 mmHg"133.322 . . . Pa.
206 GIBBS FREE ENERGY – APPLICATIONS