the first draft - university of technology, sydney
TRANSCRIPT
The informational role of internet-based short sellers
Lei Chen
Department of Accounting, the London School of Economics and Political Science
January 24th, 2014
This paper has benefited from comments and suggestions from Bjorn Jorgensen, Gilles Hilary, Paul Gillis, Ane Tamayo,
Peter Pope, Stefano Cascino, Paul Smeets, Troy Pollard, Abe de Jong, Henri Servaes, Ann Vanstraelen and participants
of conferences or seminars at Maastricht University and the London School of Economics and Political Science.

Abstract
Despite serious concerns about the quality of auditing and financial reporting of U.S.-listed Chinese
firms, the SEC and the PCAOB have been unable to provide sufficient or timely information to U.S.
investors due to resource constraints, the confidentiality rules underlying the PCAOB disciplinary
proceedings, and no access to relevant work papers of Chinese auditors. In response to regulatory
loopholes and severe information asymmetry, internet-based short sellers have emerged as a new
breed of information intermediary, who conduct their own due diligence and publish negative reports
on targeted firms. Using 360 hand collected internet reports released during the 2009-2012 period, I
find that short sellers provide considerable information both directly and indirectly to U.S. investors.
Targeted firms of such reports experience an average three-day cumulative abnormal return (CAR) of
-6.3% and -13.8% for initial coverage of the firm. The CARs are more negative when the reports
contain first-hand evidence, or include an extremely pessimistic stock price forecast (a proxy for more
severe alleged financial misconduct). I also document the indirect effect of short sellers’ reports on
stock prices of non-targeted Chinese firms (i.e., spillover effect). Particularly, the negative spillover is
more prominent when non-targeted firms share the same non-Big 4 auditor as targeted firms. In the
long run, stock prices of most targeted firms do not recover, and the realized stock returns are highly
correlated to short sellers’ implied stock returns. After short sellers’ coverage, class action lawsuit and
SEC enforcement are likely to follow. Short sellers tend to cover firms that exhibit good operating and
stock performance, and that have already shown certain red flags in audit and disclosure quality.
Keywords: internet-based short sellers, U.S.-listed Chinese firms, PCAOB, information intermediary,
media, audit quality, financial fraud
3
1. Introduction
“During 2011, many China-based companies listed in the United States found themselves
under attack from Internet-based short-sellers and online analysts dedicated to publishing
negative reports and exposing instances of alleged fraud and financial mismanagement.”
–Bloomberg (2011) 1
“In the absence of stricter regulation on companies and auditors, it is left to independent
investors like Andrew Left or Carson Block to ferret out suspicious activity.”
–Reuters (2011) 2
Although U.S.-listed Chinese firms were once Wall Street’ favorite,3 many of them have been
embroiled in accounting scandals since late 2010, followed by trading suspension and
delisting from stock exchanges, class action lawsuits by U.S. shareholders, and investigations
and enforcement by the Security and Exchange Commission (SEC).4
Behind the tumble of Chinese stocks was a new breed of information intermediary, i.e., short-
sellers who publish negative reports on the Internet, exposing incidence of alleged financial
misconduct committed by Chinese firms (hereafter internet-based short sellers). For instance,
on June 28, 2010, Muddy Waters released a thirty-page report on Oriental Paper after the
market closed. It rated the stock as a "strong sell" and set forth a host of detailed criticisms that
questioned the veracity of the information contained in the company's financial statements and
press releases. The stock price declined by roughly 13% overnight. On January 30, 2011,
Citron Research issued a report on China MediaExpress, showing evidence of this stock being
“too good to be true”. As a result, the stock price plunged by 15% on the second trading day.
1 http://about.bloomberglaw.com/practitioner-contributions/litigation-against-chinese-companies/ 2 http://www.reuters.com/article/2011/05/11/us-china-shortsellers-idUSTRE74A71F20110511 Andrew Left and Carson Block are notable short sellers. Left is the editor of Citron Research, and Block is the founder of Muddy Waters Research. Both Citron Research and Muddy
Waters Research are well-known websites that issue negative reports on targeted (especially Chinese) firms for alleged misconduct. 3 For example, Bae and Wang (2012) document that, just like firms that added “.com” to their names during the Internet bubble in late 1990s, dozens of Chinese firms listed in the U.S. have adopted new names containing the word "China" since late 2006. During the boom period, the
buy-and-hold returns of China-name stocks are, on average, more than 100% higher than those of non-China-name stocks. 4 Recent scandals of U.S.-listed Chinese firms have attracted considerable interest from academia, which leads to several working papers (e.g., Ang et al. 2012; Darrough et al., 2012; Jindra et al. 2012; Lee et al., 2012; Wang, 2012). My research is inherently different since those
papers focus on the risk in reverse merger firms while I explore the informational role of short sellers using hand-collected reports.
4
On February 3, 2011, LM Research claimed that China Agritech’s financial statements for the
fiscal year 2009 filed with the SEC were materially overstated compared to its subsidiaries’
financial statements filed with Chinese authorities. Consequently, Agritech's stock price was
down by 8.7%.
The rise of internet-based short sellers soon attracts considerable attention of mainstream
media such as the Wall Street Journal, Reuters and Bloomberg BusinessWeek. According to
Reuters, these short sellers were the catalyst that wiped more than $21 billion off the market
value of Chinese companies listed in North America, and the sell-off led to big losses for some
very prominent investors, including hedge fund manager John Paulson and former AIG CEO
Maurice "Hank" Greenberg.5
Why do internet-based short sellers expose alleged financial misconduct of Chinese firms in
particular? Why would internet-based short sellers emerge despite the oversight by regulators
such as the SEC and the Public Company Accounting Oversight Board (PCAOB)? To address
these questions, I provide detailed background information in Section 2. In a nutshell, the
number of firms that are listed in the U.S., while having substantially majority or all of their
operations in another country, particularly in China, has soared during the past few years.
Although such trend is not inherently problematic, the U.S. regulators have been increasingly
concerned about the quality of auditing and financial reporting of such firms. Unfortunately,
the SEC and the PCAOB have been unable to provide sufficient or timely information to U.S.
investors due to resource constraints, the confidentiality rules underlying the PCAOB
disciplinary proceedings, and no access to relevant work papers of Chinese auditors. In
response to the regulatory loopholes and severe information asymmetry, internet-based short
sellers emerge as a new breed of information intermediary, who conduct their own due
5 See “Special report: The 'Shorts' Who Popped a China Bubble” which is available on http://uk.reuters.com/article/2011/08/05/us-china-
accounting-shorts-idUSTRE7740PC20110805 Other examples of media coverage include “China Firms Face Research Armies” from The Wall Street Journal, “Worthless Stocks from China” and “Securities Litigation Against Chinese Companies: Next Stop Canada?” from
Bloomberg BusinessWeek and “For short sellers of Chinese stocks, it's time to reap” from Reuters.
5
diligence and publish negative reports on targeted firms where they allege corporate
disclosures to be untrue or even fraudulent.
Against such a backdrop, this paper is devoted to an examination of the informational role of
internet-based short sellers. Using 360 hand collected internet reports released by 55 short
sellers, which target 74 distinct U.S.-listed Chinese firms from 2009 to 2012, I find an average
three-day cumulative abnormal return (CAR) of -6.4%, centered on the report release day,
and -13.8% for initial coverage of the firm. Such negative market reactions exceed that driven
by other adverse events including analyst downgrades, auditor resignation/downgrades, chief
financial officer (CFO) resignations, negative earnings surprises, and class action lawsuits.6
CARs are more negative when short sellers’ reports present first-hand evidence that is not
available to the public, such as corporate filings by local unlisted subsidiaries, photos from
unannounced factory tours and camera surveillance. The stock returns of targeted firms are
also lower when short sellers provide extremely pessimistic stock price forecasts, which proxy
for more severe alleged financial misconduct. Moreover, the market reactions decrease in
the sequence of reports when a firm receives multiple reports, suggesting that early
coverage contains more new information than the follow-ups. I do not find that market
reacts differently to the reports issued under pseudonyms.
Short sellers not only provide information directly to the investors who hold shares in targeted
firms but also indirectly to the investors who bought shares in other U.S.-listed Chinese firms.
I find that CARs experienced by non-targeted firms over the three-day windows starting on the
report release days, i.e., CARs (0, +3), are also more negative when the reports are based on
first-hand evidence or contain extremely pessimistic stock price forecasts. Even after the year
effect and reverse merger effect are controlled for (see the definition of reverse merger in
Section 2), a report that contains first-hand evidence and provides extremely pessimistic
6 I also checked SEC litigation and enforcement. These events in my sample exclusively occurred after the Chinese firms were delisted;
therefore, abnormal returns for these events cannot be calculated.

6
forecast reduces the market value of non-targeted Chinese firms by 0.8% within three trading
days. I find that common auditor is an important channel through which the impact of short
sellers’ reports spills over. If non-targeted firms have hired the same non-Big 4 auditors as
targeted firms, the former’s abnormal returns drop by 0.7%-0.8% further.
It is a common concern that short seller might engage in rumors spreading about a firm in
which they have a short position and gain trading profit from the short-term decline in the
stock price.7
In the presence of weak regulatory oversight and severe asymmetry, the
substantial short-term value loss surrounding short sellers’ reports possibly reflects investors’
overreaction. Therefore, I check the long-term stock performances of targeted firms.
Generally, stock prices of targeted firms do not recover in the long run. One year after the
initial coverage, targeted firms on average lose half of their market value; one more year
later, the median (mean) stock return is -86.4% (-61.1%). Moreover, I document that the
long term realized stock returns are highly, positively correlated to short sellers’ implied
stock returns, and such correlation becomes stronger as the holding period extends. In
contrast, the correlation between the long- term realized stock returns and equity analysts’
implied stock returns for the same set of firms is much weaker and even becomes negative
when the holding period extends to the second year. With certain caveats (see Section 4.4), I
investigate the impact of short sellers’ reports from the legal perspective. I find that as of December
2013, following initial reports targeting 74 distinct Chinese firms, 41 firms (55%) have been
sued by shareholders, and 14 firms (19%) have been charged by SEC for financial fraud. The
results from multivariate models confirm that the coverage by short sellers is highly related to
consequent class action lawsuit and SEC enforcement. Together, I conclude that no evidence
is found that short sellers generally falsify their internet reports in order to earn trading
profits, nor investors systematically overreact to these bearish reports.
7 For example, the SEC charged Paul S. Berliner with securities fraud and market manipulation for intentionally spreading false rumours about The Blackstone Group's acquisition of Alliance Data Systems (ADS) while selling ADS short. See
http://www.sec.gov/news/press/2008/2008-64.htm
7
Last, I examine the determinants of being targeted by short sellers. I find that before the
initial report arrives, targeted firms tend to have already shown certain red flags regarding
audit and disclosure quality such as ineffective internal control over financial reporting,
auditor resignations or downgrades, CFO resignations, and new equity issues in U.S.
markets using less reputable underwriters. The likelihood of being targeted by short sellers
is also larger when the firms have higher reported operating performance, market-to-book
ratio or historical stock returns than their peers. My results suggest that short sellers do use
public information to screen the candidates for initiating (costly) coverage.
The main contribution of this study to the literature is twofold. First, this paper adds to the
literature on the media's role as an intermediary in financial markets. Previous studies have
already shown that a variety of media such as Wall Street Journal, financial newswires,
internet stock message boards, social media, and more generally the press and the Internet
facilitates information dissemination and enhances market efficiency (e.g., Bagnoli et
al.,1999; Antweiler and Frank, 2004; Tetlock, 2007; Bushee et al., 2010; Da et al., 2011;
Dougal et al., 2012; Drake et al., 2012; and Blankespoor et al., 2013). In particular, a sub-
stream of this literature examines the corporate governance role of the media. For example,
Miller (2006) finds that the press fulfils the role as a monitor or “watchdog” for accounting
fraud, by rebroadcasting information from other information intermediaries and by
undertaking original investigation and analysis. Dyck et al. (2008) find that coverage in the
Anglo-American press increases the probability that a corporate governance violation among
Russian firms is reversed. Joe et al. (2009) show that media exposure of board ineffectiveness
forces the targeted agents to take corrective actions and enhances shareholder wealth. My
research contributes to this literature by investigating a new breed of media, i.e., short sellers
who broadcast negative reports via their own websites and stock market analysis websites
such as Seeking Alpha. By exploring the setting of U.S.-listed Chinese firms where
8
information asymmetry is severe and regulatory loopholes are substantial, I show that internet-
based short sellers indeed provide considerable information to U.S. investors, and fulfil a
corporate governance role by exposing instances of fraud and financial mismanagement.
Second, this paper is an addition to a broader literature on short selling. Short selling is a
controversial activity. To their detractors, short sellers undermine investors’ confidence in
financial markets and increases market volatility. Governments around the world have even
banned short selling permanently or temporarily at various times. Despite the concerns, prior
academic research generally documents that short sellers play a vital role in maintaining
market efficiency. For instance, short selling activities are found to be associated with future
negative abnormal returns and a wide spectrum of adverse events such as downgrades by
equity analysts and credit rating agencies, financial restatements, SEC enforcement actions for
financial misrepresentation, and de-listings from major stock exchanges (e.g., Desai et al.,
2002; Christophe et al., 2004; Desai et al., 2006; Boehmer et al., 2008; Diether et al., 2009;
Christophe et al., 2010; Karpoff and Lou, 2010; Drake et al., 2011; Kecskés et al., 2012; and
Boehmer et al., 2012). Empirical evidence also shows that short-sales constraints or bans are
detrimental for liquidity and lead to slowed price discovery (e.g., Saffi and Sigurdsson, 2011;
Bener and Pagano, 2013).
Most of these studies use monthly stock-specific short interest data. Although some employ
daily short selling data available under Regulation SHO, such higher frequency data only span
from January 2005 through July 2007. To the best of my knowledge, my research is the first
one that directly investigates short sellers employing their reports. 8
Christophe et al. (2004)
argue that financial market regulators should consider to provide more extensive and timely
disclosures of short selling, since such an increase in the information available to investors
8 Jones et al. (2013) also use short seller level data instead of aggregated short interest. However, our papers are inherently different. They
focus on the European markets and employ short position disclosures data rather than short sellers’ reports. Moreover, the reports used in my
research all claim accounting irregularities or mismanagement, and the release of such reports are voluntary. In contrast, short position disclosures in Europe are mandatory and do not necessarily imply financial misconduct. The authors document an association between short
position disclosures and permanent negative returns, when associating with a rights issue.
9
could improve market efficiency. My research lends further support to their call, by
documenting that internet reports voluntarily released by short sellers are highly informative.9
A study of alternative information intermediaries for the universe of U.S.-listed Chinese firms
is of great independent interest. On the one hand, hundreds of Chinese companies have listed
securities on U.S. exchanges in the past decade to tap U.S. investors’ desire to own a piece of
China’s economy. The data from SDC Platinum indicate that China raised 48 billion equity
capital from the U.S. across 2003-2012. In particular, while most developed economies were
mired in financial crisis during 2007-2008, Chinese firms raised 11.3 billion dollars from the
U.S., dwarfing their counterparts from any other foreign country. On the other hand, although
these China-based companies are registered in the U.S., it is difficult for regulators to enforce
the securities laws, and for investors to recover their losses when disclosures are found to be
untrue, or even fraudulent ex-post.10
Therefore, it becomes particularly crucial for investors
who hold or intend to hold U.S.-listed Chinese stocks to have sufficient and timely
information.
Although this paper only concerns Chinese firms, internet-based short sellers certainly extend
their coverage to other firms and have become more active after establishing the reputation
with successful bearish calls on Chinese companies. For instance, on August 8, 2012, Citron
Research alleged Nu Skin Enterprises Inc., a Utah-based firm, was running illegal marketing
operation and exaggerating the scientific claims of its anti-aging products. As a result, the
9 Policy makers all round the world have been increasing emphasized more timely disclosure of short positions. For example, On March 6, 2007, the SEC approved amendments to Rule 33601 that increase the frequency of short interest reporting from monthly to twice a month.
This new rule became effective June 30, 2008. In May 2011, the SEC seeks public comment on both the existing uses of short selling in
securities markets and the adequacy or inadequacy of the information regarding short sales available today (release No. 34-64383). In Europe, the UK, France and Spain have already adopted disclosure regimes for short positions in January 2009, February 2011 and June 2010,
respectively. 10 Such limitations arise from the facts that the documents and people who have the information about the company and whether there is misconduct are often outside the reach of subpoena power, the persons to punish and the assets that could satisfy a judgment may be located
outside of the United States and harder to access. In addition, remedies obtained in the United States may not be enforceable in foreign
countries, where the bulk of the assets might reside. As a result, the SEC and private plaintiffs have a more difficult time enforcing their remedies and that recovery for investor losses could be limited. See the speech by SEC Commissioner Luis A. Aguilar which is available on
http://www.sec.gov/news/speech/2011/spch040411laa.htm
10
stock price declined by 9.2%.11
AmTrust Financial Services Inc., a New York-based insurer
dropped 6.7% on December 12, 2013, after GeoInvesting challenged the company’s
consolidation of earnings and valuation of assets.12
On July 17, 2013, Muddy Waters Research
released its first "strong sell" recommendation on U.S. companies –American Tower Corp.,
claiming that the company overstated the value of its acquisitions. However, the company in
question only fell 1.1%, the smallest first-day drop ever in a stock after a report from Muddy
Waters Research.13
My paper serves as a starting point for the research on internet-based short
sellers. Employing broader samples (e.g. firms from different countries and longer period) in
future studies will definitely enhance our understandings of the informational and governance
role of such an emerging information intermediary.
The rest of the paper is organized as following. Section 2 provides the background
information, which motivates why the universe of U.S.-listed Chinese firms represents an
interesting setting to study a new information intermediary, i.e., internet-based short sellers.
Section 3 describes the sample and the collection process of short sellers’ reports. Section 4
shows descriptive summaries of the main dataset. Section 5 presents the empirical results. The
conclusion is given in Section 6.
2. Background
2.1 The financial reporting risk of U.S.-listed Chinese firms
In response to a crisis stemming from the financial reporting frauds and auditing failures of
enterprises like Enron and WorldCom, the Public Company Accounting Oversight Board
(PCAOB) was created by Sarbanes-Oxley Act of 2002 (SOX). Overseen by SEC, PCAOB
inspects registered public accounting firms to assess compliance with the regulations and
11 http://online.wsj.com/news/articles/SB10000872396390443537404577576511492791188 and
http://www.reuters.com/article/2012/08/16/us-nuskin-stanford-idUSBRE87F13W20120816 12 http://www.businessweek.com/news/2013-12-12/amtrust-falls-as-geoinvesting-challenges-insurer-s-accounting 13 http://www.bloomberg.com/news/2013-07-17/carson-block-s-muddy-waters-says-american-tower-may-tumble-40-.html
11
professional standards, and further the public interest in the preparation of informative,
accurate and independent audit reports.14
During the past few years, the number of U.S.-listed firms with substantially majority or all of
their operations in another country, particularly in China, has increased. Although such trend
is not inherently problematic, PCAOB has been concerned that the quality of auditing and
financial reporting of these issuers might have been compromised by the need to understand
the local language, additional travel time and expense necessary to complete an audit, and the
need to understand the local business environment in which the client operates. In addition, the
PCAOB has found that some auditors hired by Chinese firms might be issuing opinions based
on the work of another firm, or by using the work of assistants engaged from outside of the
firm, without complying with relevant PCAOB standards.15
The concerns of regulators particularly relate to (Chinese) reverse merger companies. A
reverse merger is a transaction in which a private company gains public firm status by
merging itself with a public company that is normally a “shell” without meaningful
operation.16
This process exempts the private firm of due diligence which would have been
performed by underwriters under the IPO approach. The PCAOB and SEC find that many
reverse merger firms have been using small auditing firms, some of which may not have the
resources to meet its auditing obligations when most or all operations of the private company
is in another country (mainly China). Consequently, the circumstances where these companies
fail to comply with the relevant accounting standards might not be identified by auditing
14 http://pcaobus.org/Pages/default.aspx 15 See speech by SEC Commissioner Luis A. Aguilar which is available on http://www.sec.gov/news/speech/2011/spch040411laa.htm, and PCAOB’s Staff Audit Practice Alert No. 6 (2010) which is available on http://pcaobus.org/standards/qanda/2010-07-12_apa_6.pdf 16 Typically, the shareholders of the private company exchange their shares for a large majority of the shares of the public company. Although
the public shell company survives the merger, the private operating company’s shareholders gain a controlling interest in the voting power and outstanding shares of the public shell company. As a result, the management team, assets and business operations of the post-merger
public company are primarily, if not solely, those of the former private operating company. For more information about reverse merger,
please refer to SEC’s Bulletin on Risks of Investing in Reverse Merger Companies which is available via http://www.sec.gov/news/press/2011/2011-123.htm Also see academic research by Ang et al. (2012), Darrough et al. (2012), Jindra et al.
(2012), Lee et al. (2012) and Wang (2012).
12
firms, which poses considerable risk on U.S. investors.17
2.2 The limitation of the regulators
Unfortunately, for several reasons, the regulators have been unable to provide investors with
sufficient or timely information for assessing the financial reporting risk in China-based
companies. First, the capacity of both PCAOB and SEC to investigate potential miscreants is
limited due to severe resource constraints. Under SOX, registered accounting firms that issue
audit reports for more than 100 issuers are inspected by PCAOB annually. In contrast,
triennial auditors, i.e., firms that provide audit reports for no more than 100 issuers, are
inspected at least once in every three calendar years instead of every year. This suggests that
disclosure quality of many Chinese issuers has been under lower scrutiny since they tend to
hire triennial auditors.18
Similarly, SEC tends to focus its effort on egregious violations and
high‐profile cases that are likely to generate more publicity and so have greater deterrent
effects (Agrawal and Chadha, 2005). Moreover, resource-constrained SEC is more likely to
investigate firms that are located closer to its offices (Kedia and Rajgopal, 2011).
Consequently, certain Chinese issuers have taken advantage of the remoteness of their
operations from U.S. watchdogs to engage in fraud or other securities law violations, as the
SEC Chair, Mary J. White addressed.19
Second, under SOX, any PCAOB disciplinary proceedings against auditors are confidential
and non-public until a final decision imposing sanctions is reached. Despite the intention of
protecting accounting firms’ reputation, such confidentiality rules leave investors at risk since
investors are unaware of which companies they may have invested are being audited by
17 PCAOB’s research note # 2011-P1 (March 15, 2011) which is available on http://pcaobus.org/News/Releases/Pages/03152011_ResearchNote.aspx; and SEC’s SEC’s Bulletin on Risks of Investing in Reverse Merger
Companies which is available via http://www.sec.gov/news/press/2011/2011-123.htm 18 For example, in a 27-month period ending March 31, 2010, at least 40 U.S. registered public accounting firms with fewer than five partners
and fewer than ten professional staff issued audit reports on financial statements filed with the SEC by companies whose operations were
substantially all in the China region. See PCAOB’s Staff Audit Practice Alert No. 6 (2010) which is available on http://pcaobus.org/standards/qanda/2010-07-12_apa_6.pdf 19 See the speech on May 6, 2013: http://www.sec.gov/News/Speech/Detail/Speech/1365171515952#.UnEb3xAvZ6U
13
accountants who have been charged, even sanctioned, by the PCAOB. 20
For example, in the
2009 inspection of Sherb & Co., the PCAOB found the accounting firm had done insufficient
work to justify its audit opinion issued for two Chinese clients.21
However, Sherb & Co. was
allowed to continue to practice although the PCAOB had recognized it was conducting shoddy
audits. Consequently, short sellers discovered such a regulatory loophole, and targeted clients
of Sherb & Co. and some other small accounting firms that audited Chinese firms.22
On
November 7, 2013, after a series of financial scandals involving its clients had surfaced, SEC
finally sanctioned Sherb & Co. from auditing public companies for serious audit failures and
improper professional conduct.23
Third, the U.S. regulators are prevented by Chinese government from reviewing the U.S.-
related audit work and practices of China-based accounting firms. As SEC director of
enforcement Robert Khuzami emphasized, “only with access to work papers of foreign public
accounting firms can the SEC test the quality of the underlying audits and protect investors
from the dangers of accounting fraud”.24
As more scandals came into light, the PCAOB's
inability to inspect the work of PCAOB-registered auditors in China has been considered as a
gaping hole in investor protection.25
In December 2012, SEC launched administrative
proceedings against Chinese affiliates of global accounting firms (i.e., the Big 4 and BOD),
20 See the speech by the chair of PCAOB, James R. Doty, which is available on
http://pcaobus.org/News/Speech/Pages/03282012_DotyTestimony.aspx Also, recently, U.S. Senators Jack Reed and Chuck Grassley
reintroduced the PCAOB Enforcement Transparency Act of 2013, which will make PCAOB disciplinary proceedings public. Such a bill intends to bring auditing deficiencies at the firms or the companies they audit to light in a timely manner and help deter violations. See
http://www.reed.senate.gov/news/release/reed-grassley-seek-to-increase-transparency-at-accounting-watchdog 21 See http://pcaobus.org/Inspections/Reports/Documents/2011_Sherb_Co_LLP.pdf Note that although the inspection of Sherb & Co. was done in 2009, the report was not made public until 2011 March, and even then the names of the clients were not identified. 22 See the comments by Paul Gillis, a member of the PCAOB's Standing Advisory Group, http://www.chinaaccountingblog.com/weblog/bad-
auditors-protected-by.html 23 http://www.sec.gov/News/PressRelease/Detail/PressRelease/1370540289271#.Utm3ARBqfrc One of Sherb & Co.’s clients –China Sky
One Medical Inc. was charged for fraud by SEC on September 4, 2012. China Sky One Medical Inc. has been targeted by short sellers since
2009. 24 See http://www.sec.gov/News/PressRelease/Detail/PressRelease/1365171486452#.UnU3hBAvZ6U 25 See the speech by Jeanette M. Franzel, a board member of PCAOB, which is available on
http://pcaobus.org/News/Speech/Pages/02262013_WayneState.aspx. The inability to inspect China-based auditors is a big issue since China has become the home for the biggest number of foreign auditors registered with PCAOB. By 2012, 915 firms outside the United States have
registered with the PCAOB. The largest number of foreign registered firms are in China with 100 firms. Having recognized the importance of
improving audit quality and investor protection, the PCAOB has intensified its dialogue with both the China Securities Regulatory Commission and the Ministry of Finance over the past years. The a Memorandum of Understanding sign between PCAOB and the Chinese
authorities signed in 2013 May is considered to be an important step toward cross-border enforcement cooperation that is necessary to protect
the interests of investors in U.S. capital markets. See http://pcaobus.org/News/Speech/Pages/09212012_FergusonCalState.aspx and
http://pcaobus.org/News/Releases/Pages/05202013_ChinaMOU.aspx
14
alleging they refused to hand over documents sought in investigations of alleged accounting
frauds at several Chinese companies. On Jan 23, 2014 Chinese affiliates of the Big 4 were
barred for six months from leading audits of U.S.-listed companies after failing to comply with
SEC orders for the documents. Theses regulatory moves heighten the U.S.-China
confrontation over how much U.S. officials can do to ensure that Chinese audit firms adheres
to U.S. regulatory standards.
To sum up, despite substantial financial reporting risk identified in Chinese firms, the U.S.
regulators have been unable to provide investors with sufficient or timely information because
of resource constraints, confidentiality rules, and non-access to work papers of Chinese
auditors. In response to severe information asymmetry and regulatory loopholes, internet-
based short sellers emerge, who conduct their own due diligence and expose incidence of
alleged financial misconduct.
3. Sample and data sources
I take the following steps to collect short sellers’ reports.
First, I identify the sample of U.S.-listed Chinese firms. I include all firms headquartered in
China according to Compustat North-America from 2009 to 2012. Since many Chinese
firms are incorporated in tax havens (e.g. British Virgin Island, Bermuda and Cayman
Island), I also include any firm which generates more than 95% of its sales from China
using Compustat Segments. I further require the firms to be covered by CRSP. In the end, I
identify 294 Chinese firms listed in U.S. markets. In my sample period, these firms
combined have reached a total market capitalization of more than 161 billion U.S. dollars.
Second, I compile a list of organizations/individuals which issue negative internet reports on
Chinese firms by searching in Factiva using expressions such as misrepresent(-ation),
overstate(-ment), accounting irregularity, fraud, scam, manipulate-(tion), shenanigans,
15
allegation, and accuse(-ation) for each Chinese firm identified in the previous step.26
Third, I retrieve the reports from those organizations/individuals’ websites. After reading the
disclaimers in their reports and websites, I confirm that more than 95% internet reports
accusing Chinese firms of financial misconduct are released by short sellers.
Next, I complement the list of short sellers and their reports by using Google search, Seeking
Alpha website where many short sellers post their reports, and Zero Hedge website that
follows and reprints short sellers’ research.
Last, I require the reports to be reasonably analytic and at least three-page long, unless it
contains links to additional evidence.27
I use three-pages as the threshold given that short
sellers who cover U.S.-listed Chinese firms behave like sell-side equity analysts by issuing
reports, and the minimum length of 20 randomly collected reports issued by the analysts
following Chinese firms is three.
In the end, I collect 360 internet reports released by 55 short sellers.28
These reports target
74 distinct Chinese firms, meaning that 25% of Chinese firms listed on major U.S.
exchanges have been accused of financial misconduct at least once from January 1, 2009-
December 31, 2012.
In addition to my hand-collected short sellers’ reports, I also use data from Compustat, CRSP,
I/B/E/S, SDC Platinum, DataStream, EDGAR, the Securities Class Action Clearinghouse
(http://securities.stanford.edu/), SEC’s Accounting and Auditing Enforcement Releases
website (http://www.sec.gov/divisions/enforce/friactions.shtml), SEC’s Litigation Releases
26 Several reports from these short sellers only contain arguments regarding general overvaluation (firm operating in a overheat industry for instance). They are excluded from my sample. Such reports account for less than 5 percent of all short sellers’ reports, and they tend to have
less than 3 pages and therefore would be dropped according to my other search criteria anyway. Furthermore, my research for year 2008
returns zero reports. 27 I apply this criterion because I am interested in the reports made by short sellers rather than the talks or “rumours” from internet stock
message boards like Yahoo! Finance, which have been studied before. 28 Two Chinese firms are not covered by CRSP. Note the requirement of firms to be covered by CRSP only applies in Step 1 of my data collection process. After the list of short sellers was compiled, I retrieved all their reports no matter whether the targeted Chinese firms are
covered by CRSP or not.
16
website (http://www.sec.gov/litigation/litreleases.shtml), and Jay Ritter’s website
(http://bear.warrington.ufl.edu/ritter/). The definitions and sources of all variables used in this
study are given in the Appendix.
4. Descriptive summary of short sellers’ reports
As summarized in Table 1, Panel A, a typical targeted Chinese firm receives three reports
from two short sellers. In some cases, one firm can be covered by up to nine short
sellers and receives as many as 23 reports. On average, short sellers initiate coverage of
two Chinese firms and issue four reports.
*Insert Table 1 about here*
Short sellers do not always disclose their real identities. Therefore, the descriptive statistics
above do not rule out the possibility that some short sellers attempt to amplify their impact by
using multiple pseudonyms. Therefore, Panel B of Table 1 focuses on 32 short sellers (58%
of all short sellers) whose real identities are known. These non-anonymous short sellers are
hedge fund managers (11), independent investment advisors (6) or private investors (15).
They issued 266 reports covering 65 Chinese firms (i.e. 74% of total reports and 88% of
targeted Chinese firms). Similarly, a typical targeted Chinese firm receives two reports and
is covered by two non-anonymous short sellers. One firm could be covered by up to six
non-anonymous short sellers and receive as many as 22 reports. On average, non-anonymous
short sellers initiate coverage of 3.5 firms and issued 5.5 reports.
For the purpose of my research, the identities of short sellers are much less important than
their impact on the stock market. Therefore, the following analysis will be based on all
reports whether they are issued under pseudonyms. As I will show in the following
section, reports released by anonymous short sellers do not create less market reaction,
which suggests that the contents of the report rather than the identifies of report issuers
17
convey valuable information.
Figure 1 shows the distribution of short sellers’ reports across time. The solid line
represents all reports while the dotted line represents the initial reports on 74 distinct
Chinese firms. As can be seen, both lines climb up since the third quarter of 2010, reach the
peak in the second quarter of 2011, and start to decline afterwards. Most short sellers’
reports are issued during late 2010 until the end of 2011. The six consecutive quarters
starting from the third quarter of 2010 witness 270 reports, which account for 75% of all
reports. In comparison, much fewer reports are released in the first 6 quarters (36 reports
or less than 10% of the total). Similarly patterns can be observed if I focus on the 74 initial
reports.29
*Insert Figure 1 about here*
I subsequently examine the content of all 360 reports. Unlike relatively standardized analyst
reports, short sellers’ reports do not adopt certain format, and contain a variety of arguments
and evidence, which makes them very challenging to code. For descriptive purposes, I
classify the content of these reports into four major categories. As displayed in Table 2, the
biggest category is personnel-related. Almost 65% of targeted Chinese firms are alleged to
have weak management or ineffective board of directors, indicated by lack of experience,
lack of independence, frequent CFO/director resignations, and fake diplomas and criminal
records held by chief officers, etc. The second largest category is related to firm
performance. More than 80 reports claim the operating performance of 44 targeted firms are
too-good-to- be-true. These firms exhibit very high margin, and inexplicably good asset
turnovers. Further, the reports cite that such performances are achieved without incurring
a reasonable amount of general and administrative (SG&A), and research and development
(R&D) expenses. Weakness in audit-related issues is found in 39 firms (68 reports).
29 Note I also search the reports in 2008, and I find none.
18
Some examples are using small auditors, frequent auditor turnovers, and poor track
records of auditors. Short sellers also express their concerns over consecutive equity
issuances in U.S. markets, equity issuances when cash balances are healthy or when
issuing prices are low, and hiring less reputable underwriters. In addition, reports cite
miscellaneous red flags such as murky shareholders, complicated ownership structure,
aggressive business expansion, large swings in working capital, excessive executive
compensation, and insider sales.
*Insert Table 2 about here*
Short sellers support their allegations by 1- the synthesis and interpretation of publically
available information such as SEC filings, and/or 2- the first-hand evidence such as local
subsidiary’s corporate filings with China's State Administration for Industry and
Commerce (SAIC), and State Administration of Taxation (SAT),30
copies of contracts or
leases, unannounced factory tours, interviews with the suppliers, customers and government
officers, outlet visits, camera surveillance, or 3- both. In my sample, 169 reports (46.9% of
the total reports) covering 56 firms (75.7% of all targeted firms) contain first-hand evidence.
4. Results
4.1. The direct effect of short sellers’ reports
To examine the informational role of internet-based short sellers, I start with the direct effect
of the reports on targeted firms’ stock prices. The stock returns can be calculated for 352
out of 360 short sellers’ reports.31
Table 3 presents both three-day cumulative raw returns
and three-day cumulative abnormal returns (CARs) centred on the dates when the reports are
30 SAIC is the Chinese administrator for the filing of official documents such as business licenses and corporate registrations, in addition to
overseeing other basic compliance issues. SAT is the Chinese counterpart of IRS in the U.S., which generally audits veracity of financial filings and poses fines on the firms that misstate their tax liabilities. Therefore, any material discrepancies between SAT filings and SEC
filings could give an investor a good reason to be highly concerned. Note unlike SEC filings, corporate filings with SAIC and SAT cannot be
accessed publicly, except in very few cases where firms voluntarily disclose such information. Moreover, all these filings are in Chinese. As a result, SAIC/SAT filings are considered to be first-hand evidence since any attempt to identify the discrepancies between SEC filings and
Chinese filings for average U.S. investors is still costly. 31 The loss of observations is because 1- some reports are issued during trading suspension of the target firms, 2- some reports from different short sellers are issued on the same days and 3- some reports are issued on different calendar days but the same trading day is used for the
calculation of CAR (e.g. one on Saturday and the other on Sunday or the following Monday).
19
released. Abnormal return is defined as the raw return subtracted by MSCI-China index which
is based on a representative sample for the entire Chinese investment universe,
combining securities listed in mainland China, Hong Kong, U.S. and Singapore. Since
the results are qualitatively the same, my discussions will be mainly based on CARs.
* Insert Table 3 about here*
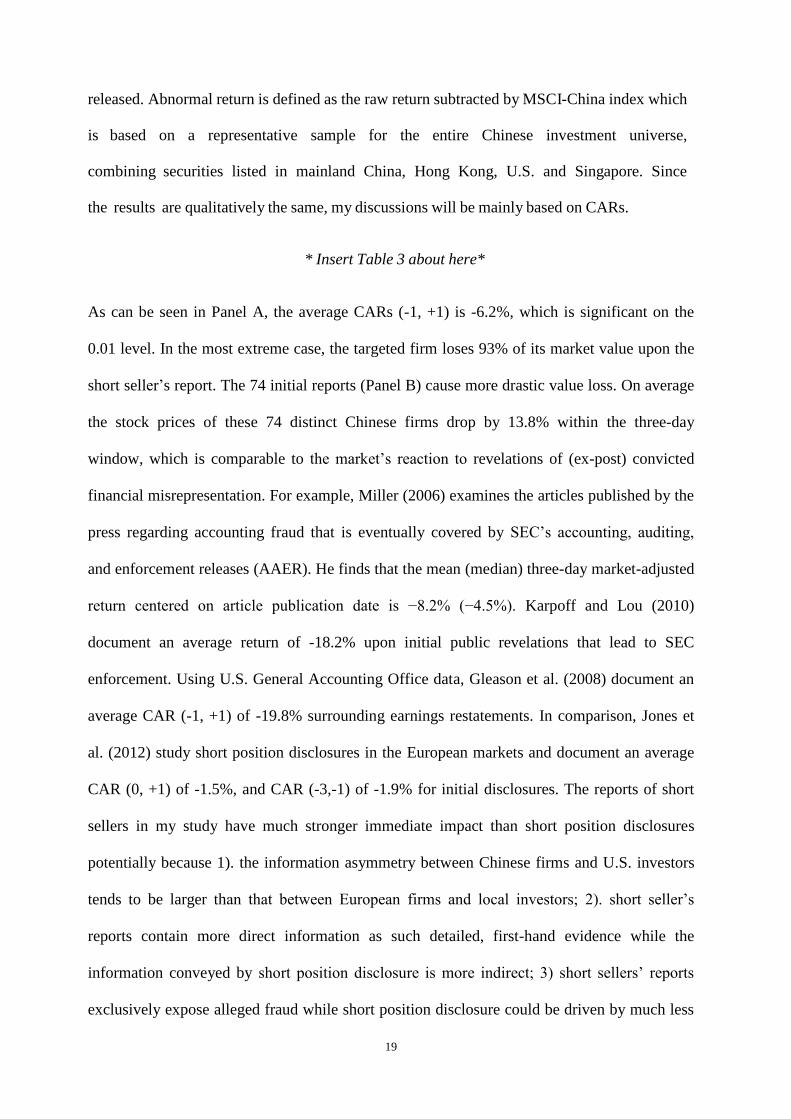
As can be seen in Panel A, the average CARs (-1, +1) is -6.2%, which is significant on the
0.01 level. In the most extreme case, the targeted firm loses 93% of its market value upon the
short seller’s report. The 74 initial reports (Panel B) cause more drastic value loss. On average
the stock prices of these 74 distinct Chinese firms drop by 13.8% within the three-day
window, which is comparable to the market’s reaction to revelations of (ex-post) convicted
financial misrepresentation. For example, Miller (2006) examines the articles published by the
press regarding accounting fraud that is eventually covered by SEC’s accounting, auditing,
and enforcement releases (AAER). He finds that the mean (median) three-day market-adjusted
return centered on article publication date is −8.2% (−4.5%). Karpoff and Lou (2010)
document an average return of -18.2% upon initial public revelations that lead to SEC
enforcement. Using U.S. General Accounting Office data, Gleason et al. (2008) document an
average CAR (-1, +1) of -19.8% surrounding earnings restatements. In comparison, Jones et
al. (2012) study short position disclosures in the European markets and document an average
CAR (0, +1) of -1.5%, and CAR (-3,-1) of -1.9% for initial disclosures. The reports of short
sellers in my study have much stronger immediate impact than short position disclosures
potentially because 1). the information asymmetry between Chinese firms and U.S. investors
tends to be larger than that between European firms and local investors; 2). short seller’s
reports contain more direct information as such detailed, first-hand evidence while the
information conveyed by short position disclosure is more indirect; 3) short sellers’ reports
exclusively expose alleged fraud while short position disclosure could be driven by much less
20
severe reasons.
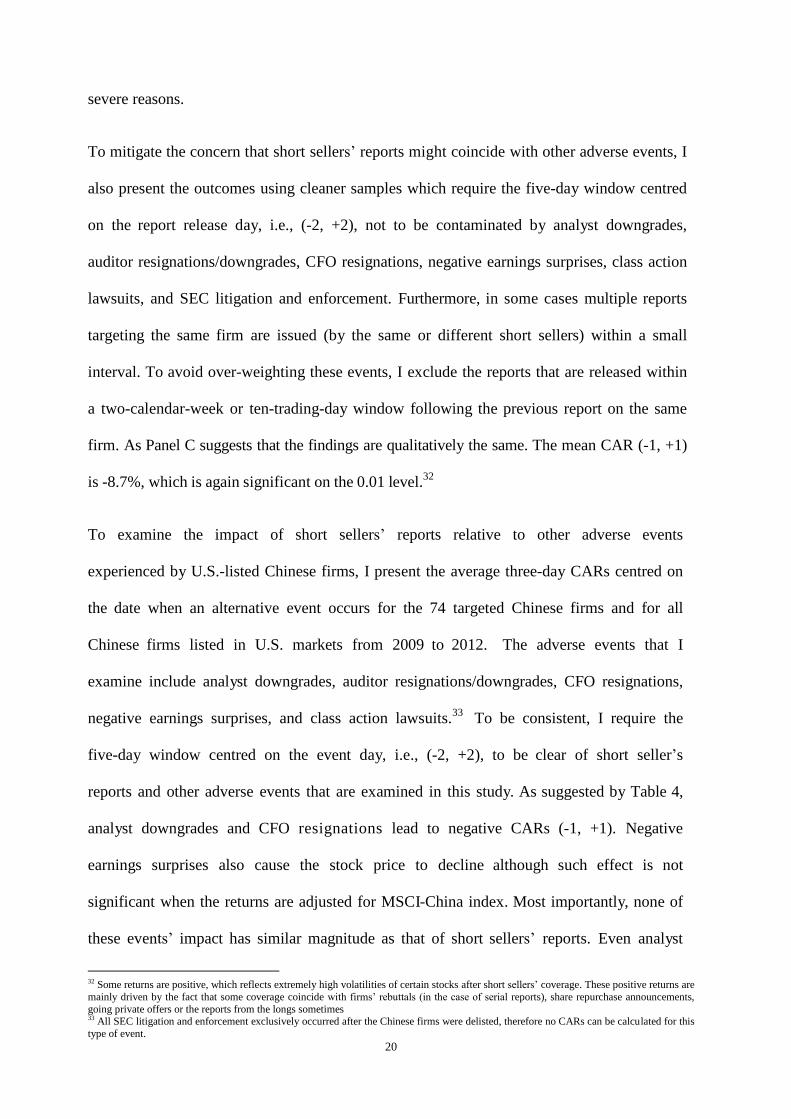
To mitigate the concern that short sellers’ reports might coincide with other adverse events, I
also present the outcomes using cleaner samples which require the five-day window centred
on the report release day, i.e., (-2, +2), not to be contaminated by analyst downgrades,
auditor resignations/downgrades, CFO resignations, negative earnings surprises, class action
lawsuits, and SEC litigation and enforcement. Furthermore, in some cases multiple reports
targeting the same firm are issued (by the same or different short sellers) within a small
interval. To avoid over-weighting these events, I exclude the reports that are released within
a two-calendar-week or ten-trading-day window following the previous report on the same
firm. As Panel C suggests that the findings are qualitatively the same. The mean CAR (-1, +1)
is -8.7%, which is again significant on the 0.01 level.32
To examine the impact of short sellers’ reports relative to other adverse events
experienced by U.S.-listed Chinese firms, I present the average three-day CARs centred on
the date when an alternative event occurs for the 74 targeted Chinese firms and for all
Chinese firms listed in U.S. markets from 2009 to 2012. The adverse events that I
examine include analyst downgrades, auditor resignations/downgrades, CFO resignations,
negative earnings surprises, and class action lawsuits.33
To be consistent, I require the
five-day window centred on the event day, i.e., (-2, +2), to be clear of short seller’s
reports and other adverse events that are examined in this study. As suggested by Table 4,
analyst downgrades and CFO resignations lead to negative CARs (-1, +1). Negative
earnings surprises also cause the stock price to decline although such effect is not
significant when the returns are adjusted for MSCI-China index. Most importantly, none of
these events’ impact has similar magnitude as that of short sellers’ reports. Even analyst
32 Some returns are positive, which reflects extremely high volatilities of certain stocks after short sellers’ coverage. These positive returns are
mainly driven by the fact that some coverage coincide with firms’ rebuttals (in the case of serial reports), share repurchase announcements,
going private offers or the reports from the longs sometimes 33 All SEC litigation and enforcement exclusively occurred after the Chinese firms were delisted, therefore no CARs can be calculated for this
type of event.
21
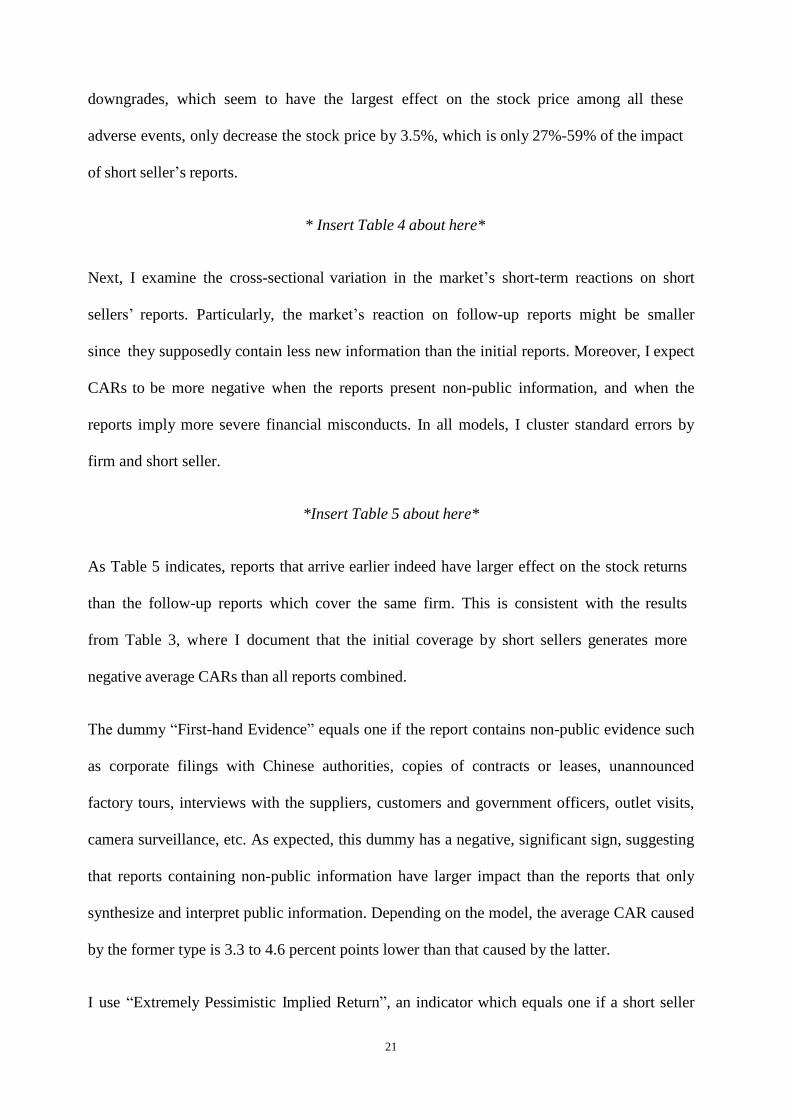
downgrades, which seem to have the largest effect on the stock price among all these
adverse events, only decrease the stock price by 3.5%, which is only 27%-59% of the impact
of short seller’s reports.
* Insert Table 4 about here*
Next, I examine the cross-sectional variation in the market’s short-term reactions on short
sellers’ reports. Particularly, the market’s reaction on follow-up reports might be smaller
since they supposedly contain less new information than the initial reports. Moreover, I expect
CARs to be more negative when the reports present non-public information, and when the
reports imply more severe financial misconducts. In all models, I cluster standard errors by
firm and short seller.
*Insert Table 5 about here*
As Table 5 indicates, reports that arrive earlier indeed have larger effect on the stock returns
than the follow-up reports which cover the same firm. This is consistent with the results
from Table 3, where I document that the initial coverage by short sellers generates more
negative average CARs than all reports combined.
The dummy “First-hand Evidence” equals one if the report contains non-public evidence such
as corporate filings with Chinese authorities, copies of contracts or leases, unannounced
factory tours, interviews with the suppliers, customers and government officers, outlet visits,
camera surveillance, etc. As expected, this dummy has a negative, significant sign, suggesting
that reports containing non-public information have larger impact than the reports that only
synthesize and interpret public information. Depending on the model, the average CAR caused
by the former type is 3.3 to 4.6 percent points lower than that caused by the latter.
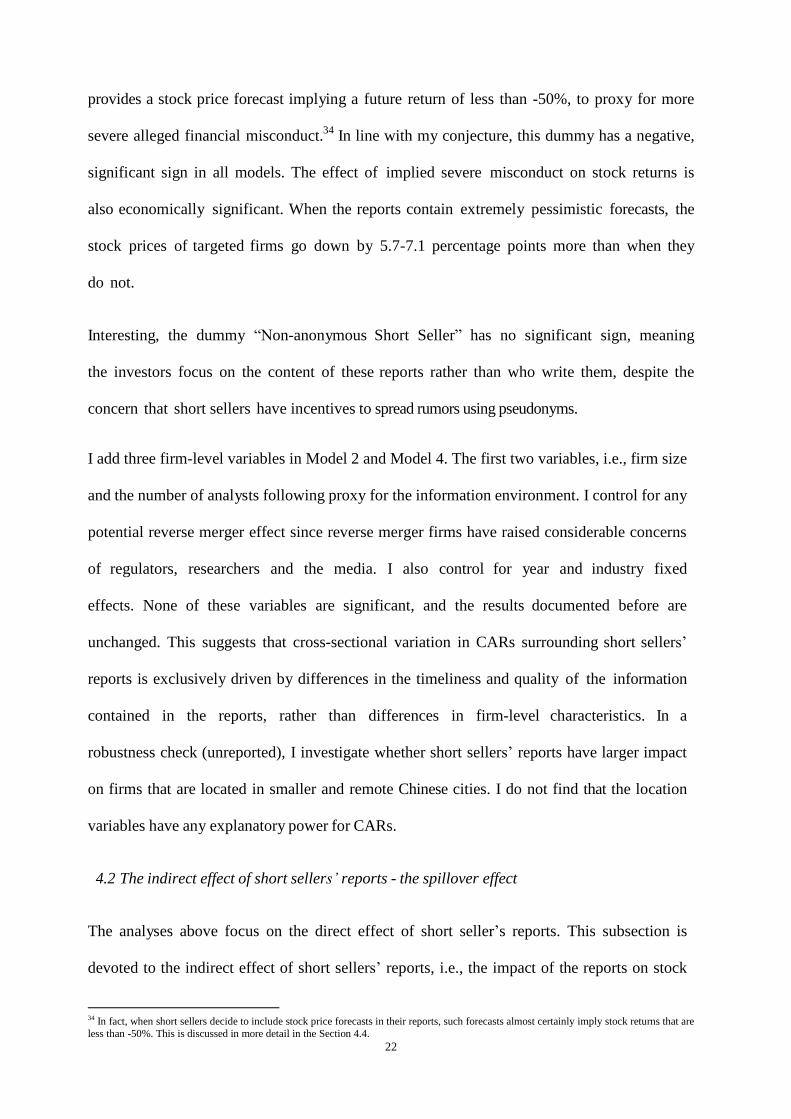
I use “Extremely Pessimistic Implied Return”, an indicator which equals one if a short seller
22
provides a stock price forecast implying a future return of less than -50%, to proxy for more
severe alleged financial misconduct.34
In line with my conjecture, this dummy has a negative,
significant sign in all models. The effect of implied severe misconduct on stock returns is
also economically significant. When the reports contain extremely pessimistic forecasts, the
stock prices of targeted firms go down by 5.7-7.1 percentage points more than when they
do not.
Interesting, the dummy “Non-anonymous Short Seller” has no significant sign, meaning
the investors focus on the content of these reports rather than who write them, despite the
concern that short sellers have incentives to spread rumors using pseudonyms.
I add three firm-level variables in Model 2 and Model 4. The first two variables, i.e., firm size
and the number of analysts following proxy for the information environment. I control for any
potential reverse merger effect since reverse merger firms have raised considerable concerns
of regulators, researchers and the media. I also control for year and industry fixed
effects. None of these variables are significant, and the results documented before are
unchanged. This suggests that cross-sectional variation in CARs surrounding short sellers’
reports is exclusively driven by differences in the timeliness and quality of the information
contained in the reports, rather than differences in firm-level characteristics. In a
robustness check (unreported), I investigate whether short sellers’ reports have larger impact
on firms that are located in smaller and remote Chinese cities. I do not find that the location
variables have any explanatory power for CARs.
4.2 The indirect effect of short sellers’ reports - the spillover effect
The analyses above focus on the direct effect of short seller’s reports. This subsection is
devoted to the indirect effect of short sellers’ reports, i.e., the impact of the reports on stock
34 In fact, when short sellers decide to include stock price forecasts in their reports, such forecasts almost certainly imply stock returns that are
less than -50%. This is discussed in more detail in the Section 4.4.
23
prices of non-targeted firms. Spillover effect has been studied in the financial fraud setting
previously. For example, Fich and Shivdasani (2007) document that when a firm is sued for
financial irregularities, other firms which share directors with the sued firm also exhibit
valuation declines at the lawsuit filing. Gleason et al. (2008) show that accounting
restatements adversely affect shareholder wealth at the restating firm and also induce share
price declines among non-restating firms in the same industry. Gande and Lewis (2009) find
that the initiation of litigation signals to investors that suits against other firms from the
same industry are forthcoming, and thus the stock prices of related firms are adjusted
downward accordingly.
My spillover analysis covers all firms that are not targeted by short sellers (yet), and
demonstrates the market’s expectation about non-targeted firms’ potential misconduct that has
not been exposed. Finding negative CARs for non-targeted firms around the release of short
sellers’ reports would be consistent with the notion that investors use the reports to reassess
the audit and disclosure risk in non-targeted Chinese firms. To be more specific, when a short
seller issues a report on firm i on day t, I calculate CAR over the three-day window starting
from day t, i.e. CAR (t, t+2) for firm j excluding all the firms which have been targeted by
short sellers before or on day t. As mentioned before, a targeted firm could receive multiple
reports, and the interval between two neighbouring reports sometimes is small. To avoid over-
weighting these events, I exclude the cases if the report on a targeted firm i is a follow-up
issued in the 10-day window starting from the previous report on the same firm. Moreover, all
the observations are excluded if non-targeted firm j experiences any other confounding
adverse events in the five-day window (t-2, t+2) centred on the report release day, or if
targeted firm i experiences any other confounding adverse events in the three-day window (t-
1, t+1). The confounding adverse events include analyst downgrades, auditor
resignations/downgrades, CFO resignations, negative earnings surprises, class action lawsuits,
24
and SEC litigations and enforcement. 35
I find on average, non-targeted Chinese firms lose 0.31% (significant on the 0.01 level) of
their market capitalization in the three- day window, which is consistent with the spillover
hypothesis. However, the declines in stock prices of non-targeted Chinese firms could also be
driven by the market’s negative sentiment against all U.S.-listed Chinese firms particularly the
ones that become public through reverse mergers, as more scandals come to light. Therefore, I
next examine the effect of the characteristics of short sellers’ reports on the spillover
magnitude, and the channels through which the spillover spread from targeted firms to non-
targeted firms. If the valuation losses suffered by non-targeted Chinese firms are indeed
triggered by short sellers’ reports on targeted firms, the negative spillover should be more
prominent when the reports contain non-public information or imply more severe financial
misconduct.
As for the spillover channels, I focus on the auditors for several reasons. First, as explained in
the introduction, the regulators have been highly concerned about the quality of audit work
done for Chinese clients. When short sellers release a negative report on a Chinese firm, they
essentially criticize the firm’s auditor for being incompetent and negligent. If the auditor
delivers similar audit quality for all its clients, non-targeted clients should suffer negative
spillover when one client’s misconduct is exposed by short sellers. Second, I focus on small
auditors since they tend to be resource-constrained. As a result, their audit quality is more
likely to be compromised by the factors identified by the PCAOB such as the need to
understand the local language and the local business environment, additional travel time and
expense necessary to complete an audit, and outsourcing audit work without complying with
relevant PCAOB standards. Last, voluminous literature has used auditor size to proxy for audit
quality, and suggests that Big 4 auditors provide higher-quality audits than non-Big 4 auditors
35 In essence, I use the 186 report release dates used in Panel E from Table 3 for the spillover analysis.
25
(e.g., Becker et al., 1998; Francis et al., 1999; Khurana and Raman, 2004; Behn et al., 2008).
Due to the time lag between occurrence of alleged financial misconduct and the release of
short sellers’ reports, I examine firms’ auditor histories. The “same non-Big 4 auditors”
indicator used in my analyses equals one if a targeted firm and a non-targeted firm have shared
at least one non-Big 4 auditor in the three-year window prior to the report release date, and
zero otherwise.
* Insert Table 6 about here*
Table 6 presents the results of a univariate analysis for spillover effect. Consistent with my
conjecture, when short sellers’ reports contain first-hand evidence or extremely pessimistic
price forecast, the stock prices of non-targeted firms decrease more (-0.64% and -0.86%
versus -0.20% and -0.28%). When non-targeted firms share the same small auditors as the
targeted firms, the former group experiences a 1.2% drop in stock prices. In contrast, the
prices decline by only 0.4% when such contagion channel does not exist.
Short sellers criticize Chinese firms for using less reputable underwriters to avoid thorough
due diligence when issuing new equity (see the discussion in Section 3). Therefore, I also
examine if the spillover can spread through common, less reputable underwriters. My results
show that although the spillover for the group sharing the same weak underwriters as the
targeted firms is more negative than the other group, the difference is not significant.
I verify these findings with a multivariate approach in Table 7. In all models, I control for the
common-industry effect. In Models 2 and 3, I include year and reverse merger dummies to
isolate the effects of negative market sentiment against U.S.-listed Chinese firms and
particularly reverse merger firms. This is a conservative way to account for short sellers’
indirect effect since short sellers tend to target reverse merger firms (see Section 4.5), and
significantly contribute to the negative market sentiment (e.g. the media coverage of short
26
sellers as shown in the introduction). In Model 3, I also include an indicator for non-Big 4
auditors so that the variable “same non-Big 4 auditors” only captures the contagion effect.
* Insert Table 7 about here*
As Table 7 indicates, when a short seller releases a report containing first-hand evidence, the
stock prices of non-targeted firms lose 0.3%-0.4% more than the cases when the short sellers’
allegations are purely based on synthesis and interpretation of public information. This
suggests that when short sellers present non-public information, other market participants
realize their informational disadvantage and adjust their valuations for other Chinese firms
accordingly to compensate such risk. The “ Extremely Pessimistic Implied Return” dummy
is negative and significant in Model 1, suggesting that more severe alleged financial
misconduct of targeted firms causes more concern among investors who hold shares in non-
targeted firms. However, this variables is not significant in Model 2 or 3. Most importantly, I
find sharing the same non-Big 4 auditor is an important driver of the spillover, as indicated
by a significant, negative sign for the dummy –Same Non-Big 4 Auditor. The effect of
common non-Big 4 auditor is also economically significant. Non-targeted firms which hire
the same non-Big 4 auditors as the targeted firms tend to lose 0.7%-1% of the market
capitalization upon short sellers’ reports. In comparison, Gleason et al. (2008) exclusively
focus on the firms that are operating in the same industry as the firms that restate their
earnings, and they document an average spillover CAR (-1, +1) of only -0.5%.36
Unsurprisingly, reverse merger firms experience more declines in stock prices than firms
that access U.S. markets via IPOs (including ADR). Average Chinese firms lose values in
2010 and 2011, as indicated by the negative, significant signs on the year dummies. I do
not find any contagions through common industry or common weak underwriters. Overall, my
36 They also find that contagion stock returns are enhanced when peer and restating firms use the same auditor. However, they don’t report the
magnitude of this incremental effect of common auditors.
27
results demonstrate that investors indeed use information conveyed by short sellers’ reports
to reassess the audit and disclosure quality in non-targeted Chinese firms.
4.3 Long term stock performance of targeted firms and short sellers’ forecast accuracy
Alternative explanation to the remarkable short-term value loss of targeted firms (Section 4.1)
is that U.S. investors overreact to short sellers’ reports. This is plausible if short sellers had
taken advantage of severe information asymmetry and spread shocking rumors. To address
such a concern, I investigate the long-term stock performance of targeted firms. After the
release of short sellers’ reports, targeted firms have a variety of tools at their disposal to
defend themselves. For example, Longtop Financial Technologies Limited issued a detailed
statement on May 10, 2011 in response to the issues raised by OLP Global and Citron
Research; on May 25, 2011 Sino Clean Energy Inc. announced a special dividend after being
targeted by Geoinvesting, Alfred Little, and other short sellers; Chinacast Education adopted
several share repurchase programs after its stock price plummeted following several short
sellers’ reports. If the short-term market reaction merely reflects investors’ panic, the stock
prices of targeted firms should recover in the long run.
Table 8 Panel A presents the average realized buy-and-hold returns over certain periods
starting from the initial coverage by short sellers. Since stock prices are retrieved in
September 2013 from DataStream, the number of observations decreases in the length of
holding period. Targeted Chinese firms have extremely poor stock performances in
general, and as the holding time extends, their performances deteriorate. Within the first
quarter, targeted firms lose more than 20% of their market values. One year after the
initial coverage, the losses are around half of their market capitalizations; one more year
later, the median (mean) stock return is -86.4% (-61.1%). In several extreme cases,
targeted firms become worthless within three quarters. Around 85%-88% of firms covered
by short sellers display negative buy-and-hold returns in the long term. Overall, these
28
findings suggest that the short-term value loss of targeted firms documented in Section 4.1
can be hardly attributed to U.S. investors’ overreaction.
*Insert Table 8 about here*
To further evaluate whether short sellers are systematically biased, I also examine the
accuracy of short sellers’ stock price forecasts and compare it to that of registered financial
analysts from I/B/E/S.
In my sample, short sellers provide stock price forecasts in 76 out of 360 reports (21%),
including 46 of the 74 targeted firms (62%). I calculate short seller’ implied return, which is
defined as ⁄ where is the price target set in
the short seller’ report and is the actual stock price of the targeted firm on the first
trading day prior to the report release day. When a forecast range rather than a price point is
given, I use the mean of the lower and higher estimate for .
Short sellers are extremely pessimistic about the prospects of targeted firms. The median and
mean implied return is -84.2% and -79.9%, respectively. In several cases, short sellers predict
stock prices to go down to zero. Even the most optimistic price target implies a stock return of
-27%. Short sellers’ pessimism seems to be justified in the long term since the median and
mean implied return is not far off the realized 2-year buy-and-hold returns as shown in Table 8
Panel A (-86.4% for the mean and -61.1% for the median). As indicated by Table 8, Panel B,
the implied returns and the realized buy-and-hold returns over different periods starting
from the report release day are highly correlated. Moreover, the correlations strengthen as the
holding period extends. For example, the correlation coefficient rises from 0.300 for the first
quarter, to 0.344 for the first year, and up to 0.440 for the first two years.
I also compare the accuracy of equity analysts’ forecasts with short sellers’ forecasts. Table 8,
Panel B indicates that the analysts who cover the same set of Chinese firms as short sellers
29
during the same period (2009-2012) display a much lower forecast accuracy. The highest
correlation between equity analysts’ implied returns and the realized buy-and-hold returns is
only 0.08. When the holding period extends to the second year, such correlations become
negative, meaning more optimistic analyst forecasts lead to bigger forecast errors in the long
run. The last column shows the correlations between the implied stock returns by equity
analysts for non-targeted Chinese firms, and these firms’ realized buy-and-hold returns. The
correlations in general are still weak, indicated by the coefficients that range between
0.049 and 0.097. However, these correlations are constantly stronger than those for analysts
who issue forecasts on the targeted firms, and do not become negative as the holding period
extends. This suggests that although not very accurate, analyst forecasts for non-targeted firms
are more reliable than those for targeted firms. Overall, I do not find evidence that U.S.
investor overreact short sellers’ reports nor short sellers generally falsify their internet reports
in order to earn trading profits.
4.4 Class action lawsuits, and SEC enforcement
So far, my analyses have exclusively focused on market consequences of short sellers’
reports. In this section, I examine the incidence of class action lawsuit and SEC enforcement
since these reports all criticize Chinese firms for financial misrepresentation or
mismanagement.
Using litigation and regulatory enforcement to gauge short sellers’ impact and accuracy has
several caveats. First, it is not clear which firms are considered by short sellers to be the
targets of class action lawsuit or SEC enforcement. For example, short sellers might claim
that a firm has shown some accounting irregularities and therefore the intrinsic value of its
stock should be much lower. However, short sellers rarely explicitly state whether these
irregularities warrant litigation or regulatory sanction. More importantly, even if short sellers’
allegations regarding serious fraud are true, these right calls are not necessarily captured by
30
the class action lawsuit or SEC enforcement data. As SEC Commissioner Luis A. Aguilar
points out, both private plaintiffs and the SEC face difficulty in enforcing law against
Chinese firms because the documents and people who have the information about whether
there is misconduct are often outside the reach of subpoena power, and the persons to punish
and the assets that could satisfy a judgment may be located outside of the United States and
harder to access. 37
For instance, as of January 2014, at least nine SEC investigations against
Chinese firms (identify undisclosed) audited by the Big 4 cannot be completed because the
accounting firms fail to hand over relevant documents, and SEC had to bar the Chinese
affiliates of the Big 4 from leading audits of U.S.-listed companies. 38
With all these caveats in mind, a preliminary examination of class action lawsuit and SEC
enforcement can still be meaningful. I collect all class action lawsuits from the Securities
Class Action Clearinghouse (http://securities.stanford.edu/) and SEC enforcement from
SEC’s Accounting and Auditing Enforcement Releases (AAER) website
(http://www.sec.gov/divisions/enforce/friactions.shtml) and SEC’s Litigation Releases
website (http://www.sec.gov/litigation/litreleases.shtml). My class action lawsuit and SEC
enforcement data span from 2009 through 2013.
First, I find that of the 74 firms targeted by short sellers from 2009 to 2012, 41 (55.4%) have
been sued by shareholders as of December 2013. 39
Among these 41 lawsuits, only six cases
predate the release of short sellers’ reports, suggesting that class action lawsuit is not
the driver of short sellers’ coverage.40
Furthermore, multiple complaints filed by
shareholders explicitly cite short-sellers’ reports. For example, the reports issued by Muddy
37 http://www.sec.gov/news/speech/2011/spch040411laa.htm 38 See http://www.sec.gov/alj/aljdec/2014/id553ce.pdf Similarly, in 2011 SEC charged Deloitte Touche Tohmatsu CPA Ltd separately for
failing to produce documents related to the SEC’s investigation of Longtop financial tech., another Chinese firm that has been targeted by
short sellers. 39 Class action lawsuit might be frivolous, which leads to overestimation of short sellers’ impact and accuracy. However, I believe this is
less likely for my setting. First, my sample period is after the enactment of the Private Securities Litigation Reform Act of 1995 (PSLRA),
which significantly restricts frivolous securities class action lawsuits (Ferris and Pritchard, 2001; Johnson et al., 2007). Second, private plaintiffs should have less incentive to file frivolous lawsuit against Chinese firms since relevant information is more difficult to collect and
any possible remedy will be more difficult to enforce (also see SEC Commissioner Luis A. Aguilar’s speech). 40 Even for the six cases where short sellers’ coverage occur after lawsuits, the minimum gap between lawsuit and the release of short sellers’ reports is 42 calendar days and the median gap is 238 calendar days, therefore, class action lawsuits do not contaminate my analysis in the
previous sections.
31
Waters in June 2010, LM research in February 2011, and Alfred Little in March 2011, are
explicitly referenced in the complaints against Orient Paper, China Agritech, and China
Deer Consumer Products. In total, 40 reports issued by 16 short sellers targeting 21 distinct
Chinese firms have been used by shareholders to build the cases in federal court.
Furthermore, three auditors, i.e., DNTW Chartered Accountants, LLP, Goldman Kurland
Mohidin LLP, and Frazer Frost, LLP have been sued by shareholders. Their Chinese
clients, i.e., Subaye, Inc., Deer Consumer Products, Inc., and China Natural Gas are a l l
previously targeted by short sellers.
I find that from January 2009 to December 2013, 18 Chinese firms have been charged by SEC
among which four litigations are still pending. In addition, three auditors have been penalized
by SEC for engaging in improper professional conduct and failing to detect financial
misstatement of five Chinese firms (two of them have been charged by SEC separately). Most
SEC disciplinary actions took place in 2012 and 2013. In particular, 13 firms have been under
SEC enforcement and three litigations are pending. Among 74 Chinese firms that receive short
sellers’ reports, 14 have been consequently charged by SEC. This suggests that by the end of
2013, the SEC has supported 19% allegations made by short sellers. The median time lag
between initial short seller’s report and SEC action is 816 days, and the maximum 1,247 days.
Therefore, it is very likely that more SEC litigations and enforcement are forthcoming.
I then confirm the association between short sellers’ coverage and consequent class action
lawsuit/SEC actions using multivariate regression models. Class action lawsuit and SEC
enforcement almost never occur more than once for the same firm (at least in my Chinese
sample). Moreover, as mentioned before, it is extremely time-consuming if it is not
impossible for SEC to finalize the investigations of Chinese firms. As a result, it is unclear
how the time of revelation of misconduct and the time of following SEC actions should be
matched. Due to these reasons, I employ simple cross-sectional regressions rather than panel
32
regressions. For Model 1 and 2 of Table 9, the dependent variable equals 1 if the firm has
been named as the defendant in a class action lawsuit under SEC Rule 10(b) during the 2009-
2013 period, and zero otherwise.41
For Model 3 and 4, the dependent variable equals 1 if the
firm has appeared in SEC’s AAER website or SEC’s Litigation Releases website during the
2009-2013 period, and zero otherwise.42
The key independent variable is the dummy “Short
sellers’ coverage” which equals 1 if the firm has been targeted by a short seller prior to a
class action lawsuit (or a SEC enforcement), and zero otherwise (hand-collected dataset). In
Model 2 and 4, I control for firm size, the reverse merger effect, and industry effect.
Moreover, for these two models, I identify the most negative market reaction caused by
uncontaminated reports short sellers’ reports prior to class action lawsuit or SEC actions for
each firm, i.e. min CAR(-1, +1). Then I introduce a “Big market reaction” dummy which
equals one for the firms that have a value that is lower than the median of min CAR (-1,+1)
across all targeted firms, and zero otherwise.
*Insert Table 9 about here*
The results show that class action lawsuit and SEC actions are very likely to follow short
sellers’ reports, suggested by the positive, significant sign of the dummy “short sellers’
coverage”. This dummy becomes insignificant in Model 4 while Big market reaction is
positive and significant, which suggests that short sellers’ coverage can predict future SEC
litigation or enforcement mainly when the reports have considerable impact on the stock
prices of targeted firms. Moreover, either reverse merger or firm size has no explanatory
power as long as short sellers’ coverage is included.
4.5 The determinants of being targeted by short sellers
41 I followed Fich and Shivdasani (2007), by restricting my sample to lawsuits alleging a violation of Rule 10(b)-5 of the 1934 Securities and
Exchange Commission Act.10(b)-5 of the 1934 Securities and Exchange Commission Act. Rule 10(b)-5 proscribes, among other things, “the
intent to deceive, manipulate, or defraud with misstatements of material fact made in connection to financial condition, solvency and profitability” 42 If I exclusively use AAER, my results are qualitatively the same.
33
Having established that internet-based short sellers are an important information source for
U.S. investors holding Chinese shares, I next investigate which firms are more likely to
be targeted by short sellers. I employ yearly panel data from 2009 to 2012. I focus on the
74 initial reports released by short sellers. In other words, if multiple reports are issued on
the same firm, only the initial report is used in this analysis (i.e. 74 observations have
values of 1 for the dependent variable, the “ being targeted by short sellers” dummy).
Based on the motivations of this paper (see Section 2) and the red flags identified by short
sellers in their reports (see Section 3), I focus on two sets of variables, i.e., financial
reporting risk variables, and performance variables. I use the following variables to proxy for
high financial reporting risk: accessing to the U.S. capital markets through reverse merger,
hiring non-Big 4 auditors, ineffective internal control, auditor resignations/downgrades,
CFO resignations, and hiring less reputable underwriters for seasoned equity offerings
(SEOs). Performance is measured by 1 ) . industry-adjusted return on assets where the
industry peers are all Chinese firms that operate in the same industry covered by
Compustat Global; 2). one-year buy-and-hold return prior to the report release day, and 3).
market-to-book ratio. In all regressions, I control for stock volatility, firm size, firm age,
number of analyst following, intangible assets, and R&D expenses.
*Insert Table 10 about here*
As indicated by Table 10, the likelihood for reverse merger firms to be targeted by short
sellers is about 8% higher than for other Chinese firms. Short sellers are also more likely to
initiate coverage of firms whose internal control has been considered weak by their
auditors. Hiring Big 4 auditors for the past financial statements does not decrease the
probability of being targeted.43
Combined with the negative, significant sign of the variable
43 Such insignificance is not due to small variation in this variable (the mean of this dummy is around 0.5). In fact, the audit quality of Big 4 auditors in China is questionable. For example, in 2012 December, the Securities and Exchange Commission began administrative
proceedings against the Chinese affiliates of each of the Big Four accounting firms and another large U.S. accounting firm for refusing to

34
–Non-Big 4 auditor in the spillover analysis (see Model 3 in Table 7), my results suggest
that Big 4 auditors do not reduce short sellers’ coverage, however, for average investors that
face severe information asymmetry, reputable auditors still provide a buffer against the
contagion. Auditor resignation/downgrade is positively related to being a target (significant on
the 0.05 level). Such relation is economically significant, indicated by a marginal effect of
0.052. CFO resignation is also a contributing factor to short sellers’ coverage, although it
is only significant on the 0.1 level. If a firm has hired less reputable underwriters for its
SEOs, the chance of receiving a report from short sellers is 6.7 percentage points higher.
Firms that exhibit extraordinary performances are more likely to attract short sellers. Three
performance measures, i.e., relative ROA, BAHR and MTB, are all significant on 0.05 or
0.01 level. If they increase by one standard deviation simultaneously, holding other variables
at mean values, the fitted probability of receiving a report soars from 2.6% up to 13.7%.
These results are consistent with the notion that short sellers are in nature bearish, and are
highly skeptical of “outperformers”.
Firm size and firm age are not significant. Surprisingly, short sellers are more likely to target
the firms that have more analysts following, which is against the conjectures that short sellers
serve as complements to financial analysts for smaller firms where analyst coverage is low,
and that short sellers provide higher value when there are limited alternative sources of
guidance (McNichols and O'Brien, 1997; Pownall and Simko, 2005). Based on my earlier
findings that equity analysts have much poorer forecast accuracy compared to short sellers
(see Section 4.3), one plausible explanation is that analysts are biased and issue more
favorable recommendations, without performing proper due diligence, to the firms that
misrepresent themselves as outperformers.44
To confirm this conjecture, I add an indicator
for positive recommendations to the model, which equals one if the median analyst
produce audit work papers and other documents related to China-based companies under investigation by the SEC for potential accounting fraud against U.S. investors. See http://www.sec.gov/News/PressRelease/Detail/PressRelease/1365171486452#.UjW4eD9F9Dk 44 The bias can also arise if these analysts are affiliated to the investment banks that underwrite the firms’ equity issues.

35
recommendation on the firm is buy or strong buy over one calendar year for non-targeted
firms or over a one-year window prior to the report release day for targeted firms (Model 3
and Model 4). I find that analyst positive recommendation is indeed significant on the 0.01
level with a marginal effect of 0.058, and other results remain. In other words, instead of
targeting firms with lower analyst coverage, short sellers play a tit-for-tat strategy against
analysts. Combined with the immediate impact of short sellers’ reports on stock prices as
shown in the previous section and targeted firms’ deteriorating long term stock performance,
these findings corroborate Boehmer et al. (2012) and Drake et al. (2011). Boehmer et al.
(2012) find that short sellers’ predictability for upcoming earnings news and analyst
recommendation changes stay significant after controlling for information in analyst actions,
suggesting that short sellers know more than analysts about firm fundamentals. Drake et al.
(2011) show that analysts sometimes provide favorable recommendations for stocks with
characteristics that are associated with negative future equity returns, and short interest
captures predictive information that can be used by investors in trading against analysts’
recommendations to increase returns.
Previous research has not reached a consensus whether short sellers’ informational
advantages are due to better use of public information or access to private information.45
My
research adds to the debate. On the one hand, short sellers tend to target firms with red flags
based on public information (e.g. auditor resignation, CFO resignation, ineffective internal
control). On the other hand, as shown in previous sections, short sellers collect a variety of
first-hand evidence, which drives most drastic valuation declines. Therefore, short sellers’
informational advantages seem to be driven by both thorough analyses of public information
and original investigations. Given private information is more costly to obtain, most likely,
short sellers first rely on public information (e.g. SEC filings and press release). They
45 Dechow et al., 2001; Christophe et al., 2004; Desai et al., 2006; Drake et al., 2011; Khan and Lu, 2011; Drake et al., 2012; Engelberg et al.,
2012.
36
consequently conduct original investigations only if some threads of financial misconduct
have been found and more concrete evidence is needed to support the allegations. 46
5. Conclusions
Although there are serious concerns about the quality of auditing and financial reporting of
U.S.-listed Chinese firms, the SEC and the PCAOB have been unable to provide sufficient or
timely information to U.S. investors due to resource constraints, the confidentiality rules
underlying the PCAOB disciplinary proceedings, and no access to relevant work papers of
Chinese auditors. My research focuses on a new breed of information intermediary, i.e.,
internet-based short sellers that have emerged in response to such regulatory loopholes and
severe information asymmetry. Based on hand collected internet reports released during the
2009-2012 period by short sellers that target U.S.-listed Chinese firms, I find that these short
sellers provide substantial information both directly and indirectly to investors.
Short sellers’ reports have a considerable impact on stock prices of targeted firms. The cross-
sectional variation in market’s short-term reaction can be explained by the timeliness and
quality of the information contained in the reports. Non-targeted firms experience negative
spillover upon short sellers’ coverage, especially when the reports contain first-hand evidence,
or imply extremely negative future stock returns. Non-targeted firms also experience larger
decreases in their stock prices when they have shared the same non-Big 4 auditors as targeted
firms. In the long term, the stock prices of most targeted firms do not recover, and the realized
stock returns are highly correlated to short sellers’ implied stock returns. Many targeted
Chinese firms have been sued by shareholders or have been under SEC enforcement. I also
find that short sellers are more likely to cover the firms that show impressive operating and
stock performances, and that have already displayed red flags in financial reporting quality.
46 As Muddy Water explained in their report on Oriental Paper –“We initially approached ONP as a possible Strong Buy. However……Once we commenced our in depth review of SEC filings though (we have read literally every SEC filing – including all exhibits– multiple times),
we saw strong indications that the company was largely a fraud.”
37
This paper contributes to both the literature on the role of media as an information
intermediary and the literature on short selling. By exploiting the unique setting of U.S.-listed
Chinese firms, I show that internet-based short sellers overcome the limitations of regulators
and mitigate information asymmetry.
Short selling is rather controversial. Despite most academic research shows that short selling
improves market efficiency, policymakers worry that short sellers may employ abusive trading
strategies and undermine investors’ confidence in financial markets. Recently, there has been
more emphasis on more timely disclosure of short positions. Across Europe, the UK, France
and Spain have already adopted disclosure regimes for short positions in January 2009,
February 2011 and June 2010, respectively. In May 2011, the SEC seeks public comment on
both the existing uses of short selling in securities markets and the adequacy or inadequacy of
the information regarding short sales available today (release No. 34-64383). My study adds to
the discussion. The findings that short sellers’ reports have substantial impact on the stock
market suggest that SEC should consider to provide more extensive and timely disclosures of
short selling, especially when the information asymmetry is severe and financial misconduct is
difficult to detect.
In response to recent accounting debacles at Chinese firms, the PCAOB has intensified its
dialogue with both the China Securities Regulatory Commission and the Ministry of Finance
over the past year. The “Memorandum of Understanding” between the PCAOB and the
Chinese authorities signed in 2013 May is considered to be an important step toward cross-
border enforcement cooperation that is necessary to protect the interests of investors in U.S.
capital markets. Further research might examine to what extent the informational asymmetry
will be alleviated by such regulatory initiatives and whether the informational role of short
sellers will weaken. For investors who hold Chinese stocks, they should keep paying close
attention to the activities of internet-based short sellers before regulators’ interventions are

38
proven to be effective. Moreover, internet-based short sellers certainly extend their coverage
to other firms and have become more active after establishing the reputation with successful
bearish calls on Chinese companies. My paper serves as a starting point for the research on
internet-based short sellers. Employing broader samples in future studies will definitely
enhance our understandings of the informational and governance role of such an emerging
information intermediary.
A voluminous literature has examined the effects of the tone or sentiment expressed in a
variety of information outlets such as annual reports (e.g. management discussion and
analysis), analyst reports, media news, and the Internet.47
So far, this line of research is based
on analysis of texts, and has ignored non-text elements such as picture, audio, and video. Short
sellers’ reports contain considerable non-text information. For example, when exposing the
fraud of Sino Clean Energy, short sellers present dozens of photos and hours of surveillance
videos of its plants that show no meaningful production. As I documented previously, reports
that present first-hand evidence, which is normally in the form of picture, audio or video,
cause the most drastic market reactions. However, any dictionary or linguistic algorithm used
in this literature would fail to capture the pessimism in such a report. In the same vein,
journalists also use non-text elements intensively. For instance, a recent bearish article about
the American retailer –Sear, only contains less than 600 words. Instead, the main message, as
the article’s title suggests, is delivered by “18 depressing photos that show why nobody wants
to shop at Sears”.48
Therefore, a fruitful area for future research is the role of non-text
information conveyed by information intermediaries in financial markets.
47 To name a few, Antweiler and Frank, 2004; Tetlock, 2007; Core et al., 2008; Li, 2008; Kothari et al., 2009; and Dougal et al, 2012. 48 http://finance.yahoo.com/news/18-depressing-photos-show-why-122600100.html
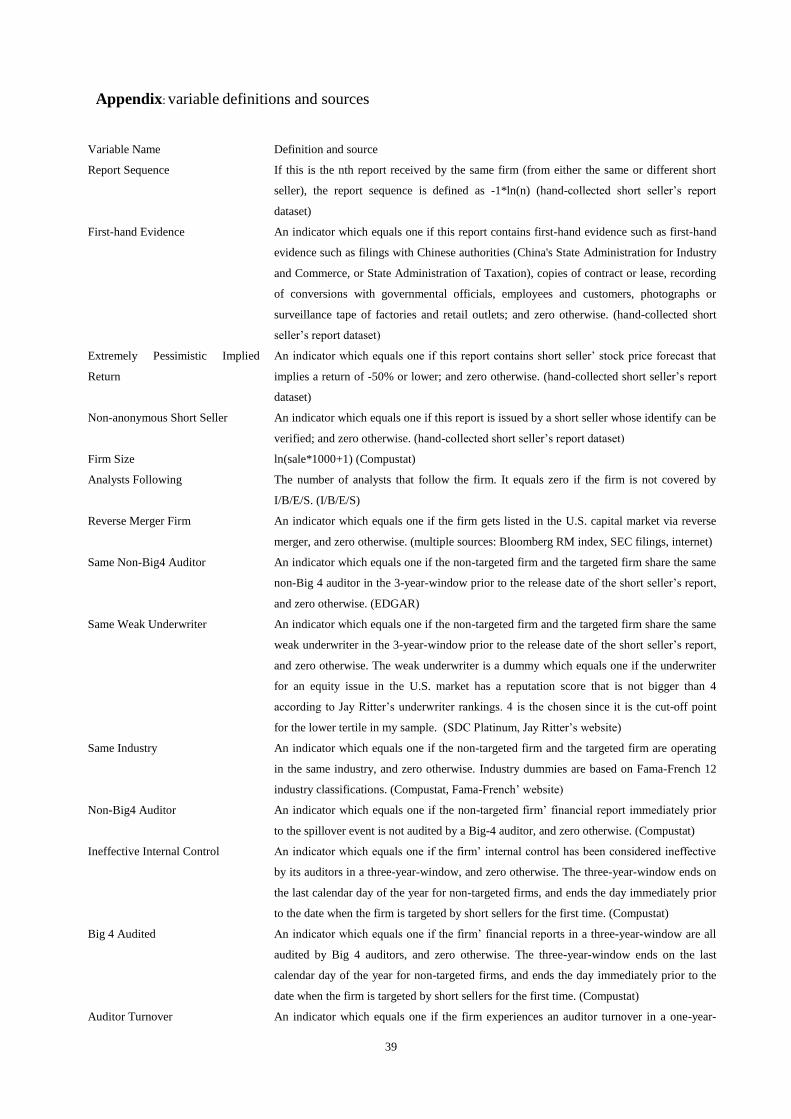
39
Appendix: variable definitions and sources
Variable Name Definition and source
Report Sequence If this is the nth report received by the same firm (from either the same or different short
seller), the report sequence is defined as -1*ln(n) (hand-collected short seller’s report
dataset)
First-hand Evidence An indicator which equals one if this report contains first-hand evidence such as first-hand
evidence such as filings with Chinese authorities (China's State Administration for Industry
and Commerce, or State Administration of Taxation), copies of contract or lease, recording
of conversions with governmental officials, employees and customers, photographs or
surveillance tape of factories and retail outlets; and zero otherwise. (hand-collected short
seller’s report dataset)
Extremely Pessimistic Implied
Return
An indicator which equals one if this report contains short seller’ stock price forecast that
implies a return of -50% or lower; and zero otherwise. (hand-collected short seller’s report
dataset)
Non-anonymous Short Seller An indicator which equals one if this report is issued by a short seller whose identify can be
verified; and zero otherwise. (hand-collected short seller’s report dataset)
Firm Size ln(sale*1000+1) (Compustat)
Analysts Following The number of analysts that follow the firm. It equals zero if the firm is not covered by
I/B/E/S. (I/B/E/S)
Reverse Merger Firm An indicator which equals one if the firm gets listed in the U.S. capital market via reverse
merger, and zero otherwise. (multiple sources: Bloomberg RM index, SEC filings, internet)
Same Non-Big4 Auditor An indicator which equals one if the non-targeted firm and the targeted firm share the same
non-Big 4 auditor in the 3-year-window prior to the release date of the short seller’s report,
and zero otherwise. (EDGAR)
Same Weak Underwriter An indicator which equals one if the non-targeted firm and the targeted firm share the same
weak underwriter in the 3-year-window prior to the release date of the short seller’s report,
and zero otherwise. The weak underwriter is a dummy which equals one if the underwriter
for an equity issue in the U.S. market has a reputation score that is not bigger than 4
according to Jay Ritter’s underwriter rankings. 4 is the chosen since it is the cut-off point
for the lower tertile in my sample. (SDC Platinum, Jay Ritter’s website)
Same Industry An indicator which equals one if the non-targeted firm and the targeted firm are operating
in the same industry, and zero otherwise. Industry dummies are based on Fama-French 12
industry classifications. (Compustat, Fama-French’ website)
Non-Big4 Auditor An indicator which equals one if the non-targeted firm’ financial report immediately prior
to the spillover event is not audited by a Big-4 auditor, and zero otherwise. (Compustat)
Ineffective Internal Control An indicator which equals one if the firm’ internal control has been considered ineffective
by its auditors in a three-year-window, and zero otherwise. The three-year-window ends on
the last calendar day of the year for non-targeted firms, and ends the day immediately prior
to the date when the firm is targeted by short sellers for the first time. (Compustat)
Big 4 Audited An indicator which equals one if the firm’ financial reports in a three-year-window are all
audited by Big 4 auditors, and zero otherwise. The three-year-window ends on the last
calendar day of the year for non-targeted firms, and ends the day immediately prior to the
date when the firm is targeted by short sellers for the first time. (Compustat)
Auditor Turnover An indicator which equals one if the firm experiences an auditor turnover in a one-year-
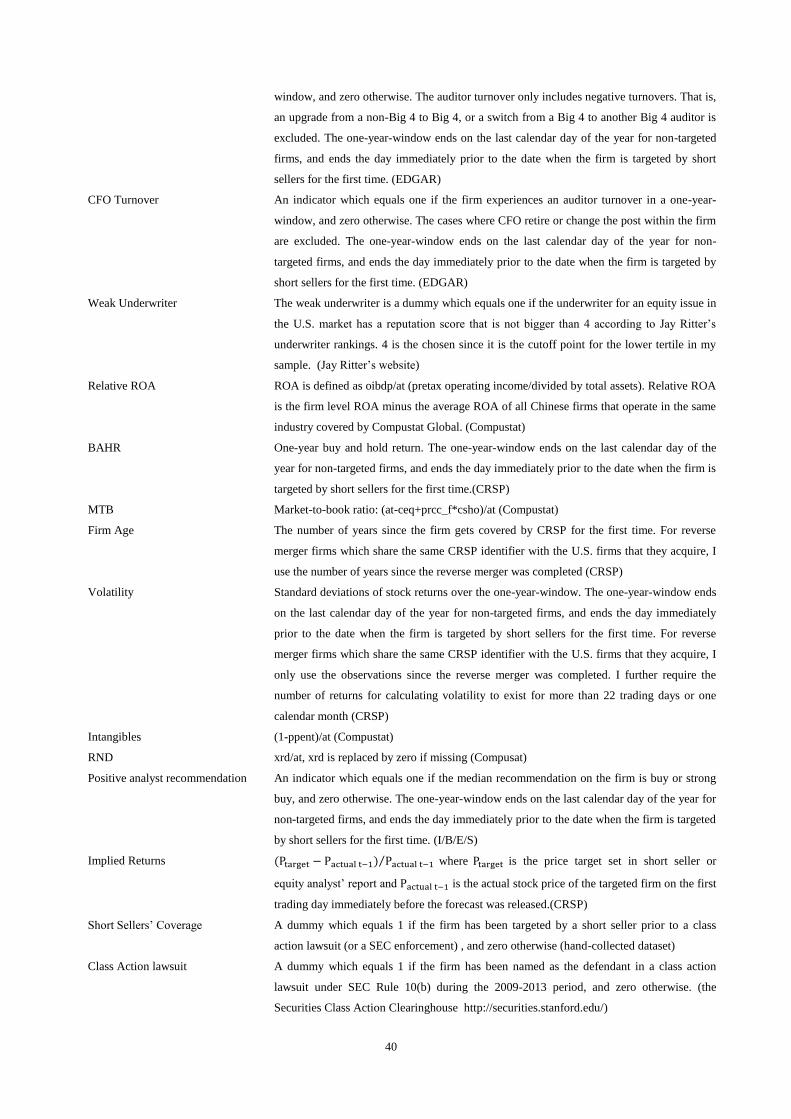
40
window, and zero otherwise. The auditor turnover only includes negative turnovers. That is,
an upgrade from a non-Big 4 to Big 4, or a switch from a Big 4 to another Big 4 auditor is
excluded. The one-year-window ends on the last calendar day of the year for non-targeted
firms, and ends the day immediately prior to the date when the firm is targeted by short
sellers for the first time. (EDGAR)
CFO Turnover An indicator which equals one if the firm experiences an auditor turnover in a one-year-
window, and zero otherwise. The cases where CFO retire or change the post within the firm
are excluded. The one-year-window ends on the last calendar day of the year for non-
targeted firms, and ends the day immediately prior to the date when the firm is targeted by
short sellers for the first time. (EDGAR)
Weak Underwriter The weak underwriter is a dummy which equals one if the underwriter for an equity issue in
the U.S. market has a reputation score that is not bigger than 4 according to Jay Ritter’s
underwriter rankings. 4 is the chosen since it is the cutoff point for the lower tertile in my
sample. (Jay Ritter’s website)
Relative ROA ROA is defined as oibdp/at (pretax operating income/divided by total assets). Relative ROA
is the firm level ROA minus the average ROA of all Chinese firms that operate in the same
industry covered by Compustat Global. (Compustat)
BAHR One-year buy and hold return. The one-year-window ends on the last calendar day of the
year for non-targeted firms, and ends the day immediately prior to the date when the firm is
targeted by short sellers for the first time.(CRSP)
MTB Market-to-book ratio: (at-ceq+prcc_f*csho)/at (Compustat)
Firm Age The number of years since the firm gets covered by CRSP for the first time. For reverse
merger firms which share the same CRSP identifier with the U.S. firms that they acquire, I
use the number of years since the reverse merger was completed (CRSP)
Volatility Standard deviations of stock returns over the one-year-window. The one-year-window ends
on the last calendar day of the year for non-targeted firms, and ends the day immediately
prior to the date when the firm is targeted by short sellers for the first time. For reverse
merger firms which share the same CRSP identifier with the U.S. firms that they acquire, I
only use the observations since the reverse merger was completed. I further require the
number of returns for calculating volatility to exist for more than 22 trading days or one
calendar month (CRSP)
Intangibles (1-ppent)/at (Compustat)
RND xrd/at, xrd is replaced by zero if missing (Compusat)
Positive analyst recommendation An indicator which equals one if the median recommendation on the firm is buy or strong
buy, and zero otherwise. The one-year-window ends on the last calendar day of the year for
non-targeted firms, and ends the day immediately prior to the date when the firm is targeted
by short sellers for the first time. (I/B/E/S)
Implied Returns ⁄ where is the price target set in short seller or
equity analyst’ report and is the actual stock price of the targeted firm on the first
trading day immediately before the forecast was released.(CRSP)
Short Sellers’ Coverage A dummy which equals 1 if the firm has been targeted by a short seller prior to a class
action lawsuit (or a SEC enforcement) , and zero otherwise (hand-collected dataset)
Class Action lawsuit A dummy which equals 1 if the firm has been named as the defendant in a class action
lawsuit under SEC Rule 10(b) during the 2009-2013 period, and zero otherwise. (the
Securities Class Action Clearinghouse http://securities.stanford.edu/)

41
SEC Enforcement A dummy that equals 1 if the firm has appeared in SEC’s Accounting and Auditing
Enforcement Releases website http://www.sec.gov/divisions/enforce/friactions.shtml or
SEC’s Litigation Releases website http://www.sec.gov/litigation/litreleases.shtml during the
2009-2013 period, and zero otherwise
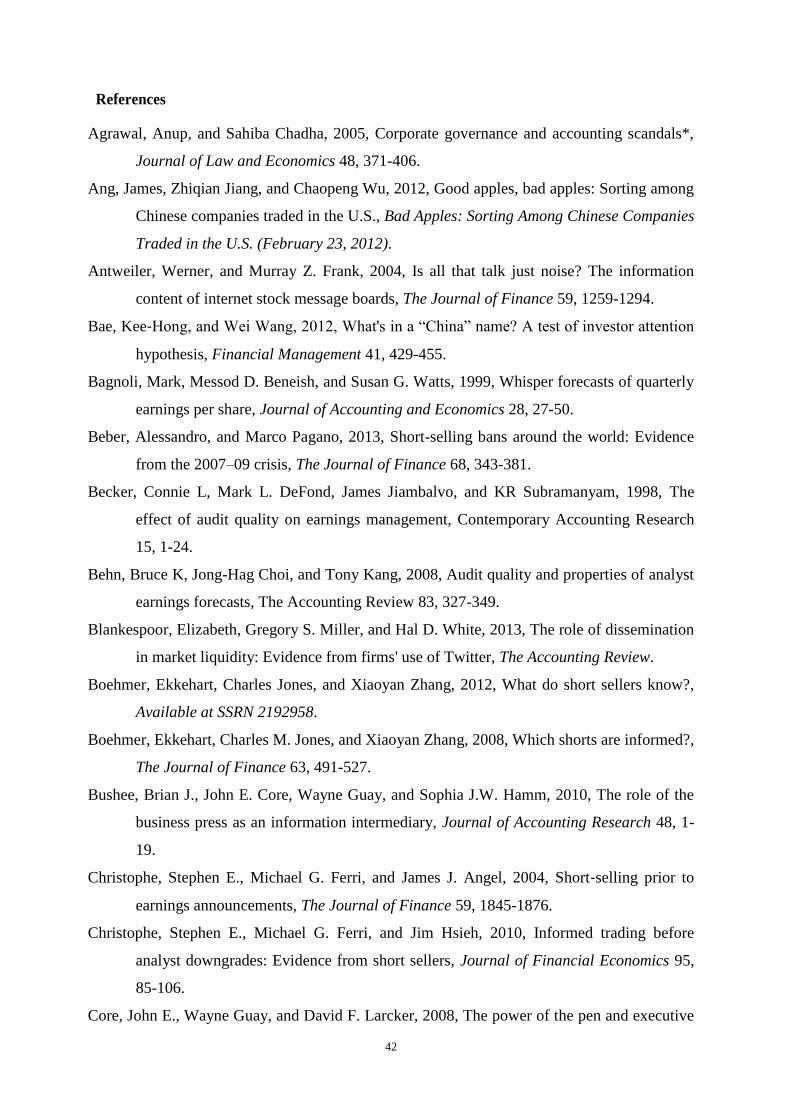
42
References
Agrawal, Anup, and Sahiba Chadha, 2005, Corporate governance and accounting scandals*,
Journal of Law and Economics 48, 371-406.
Ang, James, Zhiqian Jiang, and Chaopeng Wu, 2012, Good apples, bad apples: Sorting among
Chinese companies traded in the U.S., Bad Apples: Sorting Among Chinese Companies
Traded in the U.S. (February 23, 2012).
Antweiler, Werner, and Murray Z. Frank, 2004, Is all that talk just noise? The information
content of internet stock message boards, The Journal of Finance 59, 1259-1294.
Bae, Kee‐Hong, and Wei Wang, 2012, What's in a “China” name? A test of investor attention
hypothesis, Financial Management 41, 429-455.
Bagnoli, Mark, Messod D. Beneish, and Susan G. Watts, 1999, Whisper forecasts of quarterly
earnings per share, Journal of Accounting and Economics 28, 27-50.
Beber, Alessandro, and Marco Pagano, 2013, Short-selling bans around the world: Evidence
from the 2007–09 crisis, The Journal of Finance 68, 343-381.
Becker, Connie L, Mark L. DeFond, James Jiambalvo, and KR Subramanyam, 1998, The
effect of audit quality on earnings management, Contemporary Accounting Research
15, 1-24.
Behn, Bruce K, Jong-Hag Choi, and Tony Kang, 2008, Audit quality and properties of analyst
earnings forecasts, The Accounting Review 83, 327-349.
Blankespoor, Elizabeth, Gregory S. Miller, and Hal D. White, 2013, The role of dissemination
in market liquidity: Evidence from firms' use of Twitter, The Accounting Review.
Boehmer, Ekkehart, Charles Jones, and Xiaoyan Zhang, 2012, What do short sellers know?,
Available at SSRN 2192958.
Boehmer, Ekkehart, Charles M. Jones, and Xiaoyan Zhang, 2008, Which shorts are informed?,
The Journal of Finance 63, 491-527.
Bushee, Brian J., John E. Core, Wayne Guay, and Sophia J.W. Hamm, 2010, The role of the
business press as an information intermediary, Journal of Accounting Research 48, 1-
19.
Christophe, Stephen E., Michael G. Ferri, and James J. Angel, 2004, Short‐selling prior to
earnings announcements, The Journal of Finance 59, 1845-1876.
Christophe, Stephen E., Michael G. Ferri, and Jim Hsieh, 2010, Informed trading before
analyst downgrades: Evidence from short sellers, Journal of Financial Economics 95,
85-106.
Core, John E., Wayne Guay, and David F. Larcker, 2008, The power of the pen and executive
43
compensation, Journal of Financial Economics 88, 1-25.
Da, Zhi, Joseph Engelberg, and Pengjie Gao, 2011, In search of attention, The Journal of
Finance 66, 1461-1499.
Darrough, Masako, Rong Huang, and Sha Zhao, 2012, The spillover effect of Chinese reverse
merger frauds: Chinese or reverse merger?, Available at SSRN 2144483.
Dechow, Patricia M., Amy P. Hutton, Lisa Meulbroek, and Richard G. Sloan, 2001, Short-
sellers, fundamental analysis, and stock returns, Journal of Financial Economics 61,
77-106.
Desai, Hemang, Srinivasan Krishnamurthy, and Kumar Venkataraman, 2006, Do short sellers
target firms with poor earnings quality? Evidence from earnings restatements, Review
of Accounting Studies 11, 71-90.
Desai, Hemang, K. Ramesh, S. Ramu Thiagarajan, and Bala V. Balachandran, 2002, An
investigation of the informational role of short interest in the Nasdaq market, The
Journal of Finance 57, 2263-2287.
Diether, Karl B., Kuan-Hui Lee, and Ingrid M. Werner, 2009, Short-sale strategies and return
predictability, Review of Financial Studies 22, 575-607.
Dougal, Casey, Joseph Engelberg, Diego Garcia, and Christopher A. Parsons, 2012,
Journalists and the stock market, Review of Financial Studies 25, 639-679.
Drake, Michael, Linda Myers, Susan Scholz, and Nathan Sharp, 2012, Short selling around
restatement announcements: When do bears pounce?, Available at SSRN 1351986.
Drake, Michael S., Lynn Rees, and Edward P. Swanson, 2011, Should investors follow the
prophets or the bears? Evidence on the use of public information by analysts and short
sellers, The Accounting Review 86, 101-130.
Dyck, Alexander, Natalya Volchkova, and Luigi Zingales, 2008, The corporate governance
role of the media: Evidence from Russia, The Journal of Finance 63, 1093-1135.
Engelberg, Joseph E., Adam V. Reed, and Matthew C. Ringgenberg, 2012, How are shorts
informed?: Short sellers, news, and information processing, Journal of Financial
Economics 105, 260-278.
Ferris, Stephen P, and Adam C Pritchard, 2001. Stock price reactions to securities fraud class
actions under the private securities litigation reform act (University of Michigan).
Fich, Eliezer M., and Anil Shivdasani, 2007, Financial fraud, director reputation, and
shareholder wealth, Journal of Financial Economics 86, 306-336.
Francis, Jere R, Edward L. Maydew, and H. Charles Sparks, 1999, The role of Big 6 auditors
in the credible reporting of accruals, Auditing: A Journal of Practice & Theory 18, 17-
44
34.
Gande, Amar, and Craig M. Lewis, 2009, Shareholder-initiated class action lawsuits:
Shareholder wealth effects and industry spillovers, Journal of Financial and
Quantitative Analysis 44, 823-850.
Gleason, Cristi A., Nicole Thorne Jenkins, and W. Bruce Johnson, 2008, The contagion effects
of accounting restatements, The Accounting Review 83, 83-110.
Jindra, Jan, Torben Voetmann, and Ralph Walkling, 2012, Reverse mergers: The Chinese
experience, Available at SSRN 2105814.
Joe, Jennifer R., Henock Louis, and Dahlia Robinson, 2009, Managers’ and investors’
responses to media exposure of board ineffectiveness, Journal of Financial and
Quantitative Analysis 44, 579-605.
Johnson, Marilyn F, Karen K Nelson, and Adam C Pritchard, 2007, Do the merits matter
more? The impact of the private securities litigation reform act, Journal of Law,
Economics, and Organization 23, 627-652.
Jones, Charles, Adam Reed, and William Waller, 2013, Revealing shorts: An examination of
large short position disclosures, Available at SSRN 1910372.
Karpoff, Jonathan M., and Xiaoxia Lou, 2010, Short sellers and financial misconduct, The
Journal of Finance 65, 1879-1913.
Kecskés, Ambrus, Sattar A. Mansi, and Andrew Zhang, 2012, Are short sellers informed?
Evidence from the bond market, The Accounting Review 88, 611-639.
Kedia, Simi, and Shiva Rajgopal, 2011, Do the sec's enforcement preferences affect corporate
misconduct?, Journal of Accounting and Economics 51, 259-278.
Khan, Mozaffar, and Hai Lu, 2008, Do short sellers front-run insider sales?, The Accounting
Review.
Khurana, Inder K, and KK Raman, 2004, Litigation risk and the financial reporting credibility
of Big 4 versus non-big B audits: Evidence from Anglo-American countries, The
Accounting Review 79, 473-495.
Kothari, SP, Xu Li, and James E. Short, 2009, The effect of disclosures by management,
analysts, and business press on cost of capital, return volatility, and analyst forecasts:
A study using content analysis, The Accounting Review 84, 1639-1670.
Lee, Charles, Kevin Li, and Ran Zhang, 2012, Shell games: Are Chinese reverse merger firms
inherently toxic?, Available at SSRN 2155425.
Li, Feng, 2008, Annual report readability, current earnings, and earnings persistence, Journal
of Accounting and Economics 45, 221-247.
45
McNichols, Maureen, and Patricia C. O'Brien, 1997, Self-selection and analyst coverage,
Journal of Accounting Research 35, 167-199.
Miller, Gregory S., 2006, The press as a watchdog for accounting fraud, Journal of
Accounting Research 44, 1001-1033.
Pownall, Grace, and Paul J Simko, 2005, The information intermediary role of short sellers,
The Accounting Review 80, 941-966.
Saffi, Pedro A. C., and Kari Sigurdsson, 2011, Price efficiency and short selling, Review of
Financial Studies 24, 821-852.
Tetlock, Paul C., 2007, Giving content to investor sentiment: The role of media in the stock
market, The Journal of Finance 62, 1139-1168.
Wang, Zigan, 2012, U.S.-listed Chinese firms in credibility crisis: Who are they? Where are
they?, Where are They.
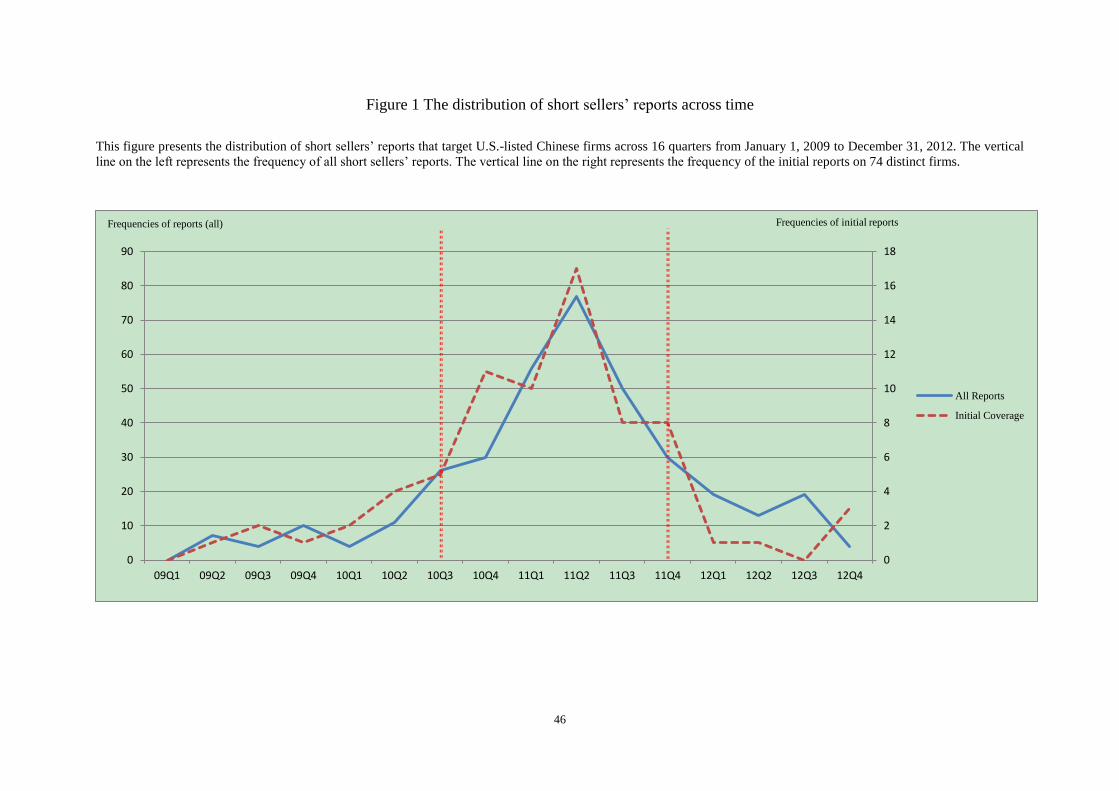
46
Figure 1 The distribution of short sellers’ reports across time
This figure presents the distribution of short sellers’ reports that target U.S.-listed Chinese firms across 16 quarters from January 1, 2009 to December 31, 2012. The vertical
line on the left represents the frequency of all short sellers’ reports. The vertical line on the right represents the frequency of the initial reports on 74 distinct firms.
0
2
4
6
8
10
12
14
16
18
0
10
20
30
40
50
60
70
80
90
09Q1 09Q2 09Q3 09Q4 10Q1 10Q2 10Q3 10Q4 11Q1 11Q2 11Q3 11Q4 12Q1 12Q2 12Q3 12Q4
Frequencies of initial reports Frequencies of reports (all)
All Reports
Initial Coverage
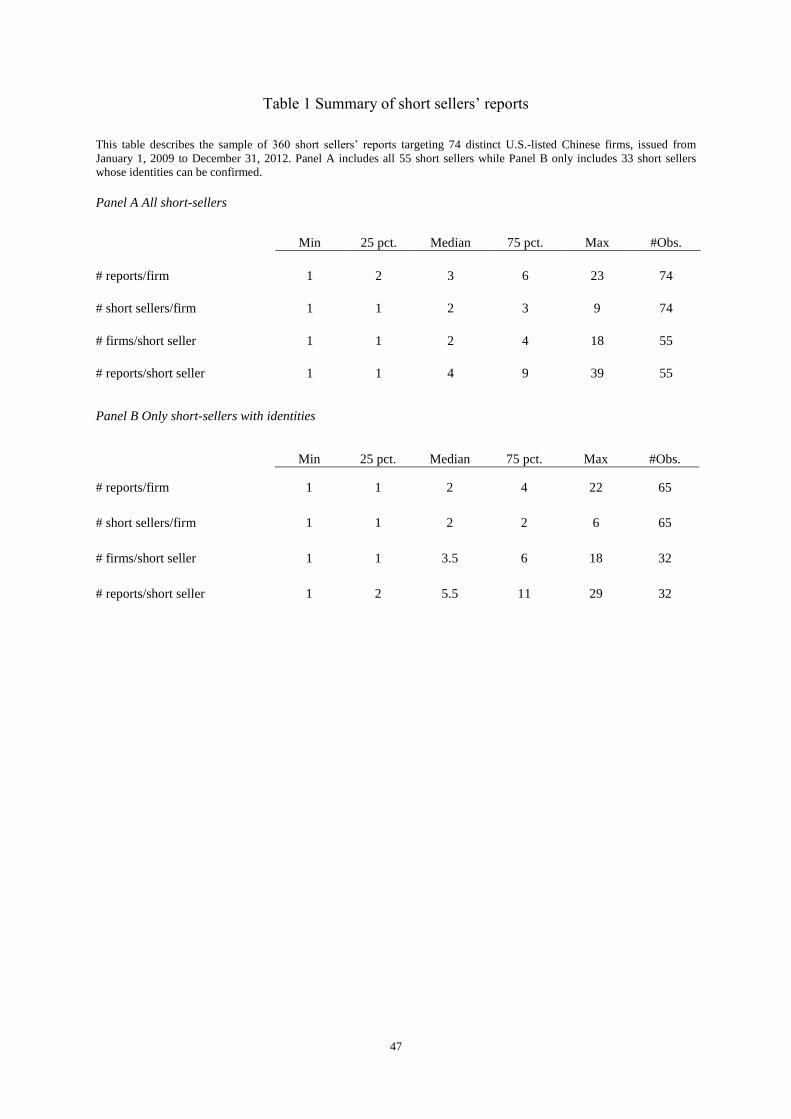
47
Table 1 Summary of short sellers’ reports
This table describes the sample of 360 short sellers’ reports targeting 74 distinct U.S.-listed Chinese firms, issued from
January 1, 2009 to December 31, 2012. Panel A includes all 55 short sellers while Panel B only includes 33 short sellers
whose identities can be confirmed.
Panel A All short-sellers
Min 25 pct. Median 75 pct. Max #Obs.
# reports/firm 1 2 3 6 23 74
# short sellers/firm 1 1 2 3 9 74
# firms/short seller 1 1 2 4 18 55
# reports/short seller 1 1 4 9 39 55
Panel B Only short-sellers with identities
Min 25 pct. Median 75 pct. Max #Obs.
# reports/firm 1 1 2 4 22 65
# short sellers/firm 1 1 2 2 6 65
# firms/short seller 1 1 3.5 6 18 32
# reports/short seller 1 2 5.5 11 29 32
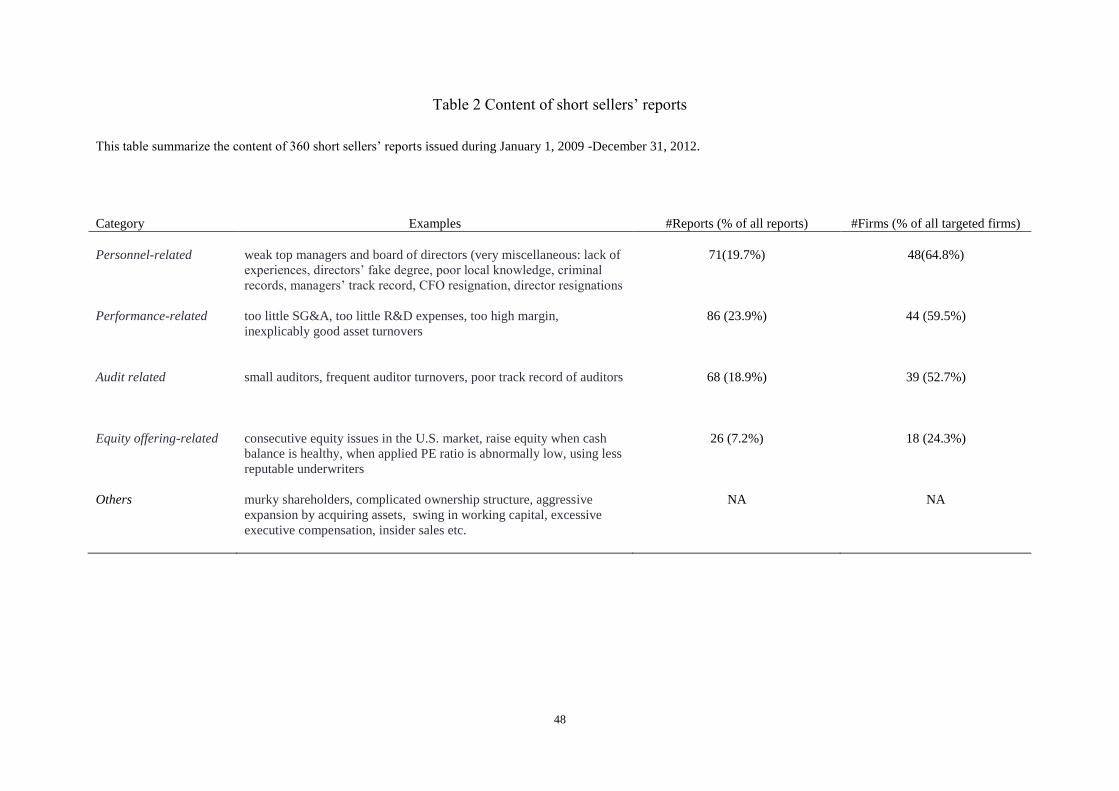
48
Table 2 Content of short sellers’ reports
This table summarize the content of 360 short sellers’ reports issued during January 1, 2009 -December 31, 2012.
Category Examples #Reports (% of all reports) #Firms (% of all targeted firms)
Personnel-related weak top managers and board of directors (very miscellaneous: lack of
experiences, directors’ fake degree, poor local knowledge, criminal
records, managers’ track record, CFO resignation, director resignations
71(19.7%) 48(64.8%)
Performance-related too little SG&A, too little R&D expenses, too high margin,
inexplicably good asset turnovers
86 (23.9%) 44 (59.5%)
Audit related small auditors, frequent auditor turnovers, poor track record of auditors 68 (18.9%) 39 (52.7%)
Equity offering-related consecutive equity issues in the U.S. market, raise equity when cash
balance is healthy, when applied PE ratio is abnormally low, using less
reputable underwriters
26 (7.2%) 18 (24.3%)
Others murky shareholders, complicated ownership structure, aggressive
expansion by acquiring assets, swing in working capital, excessive
executive compensation, insider sales etc.
NA NA
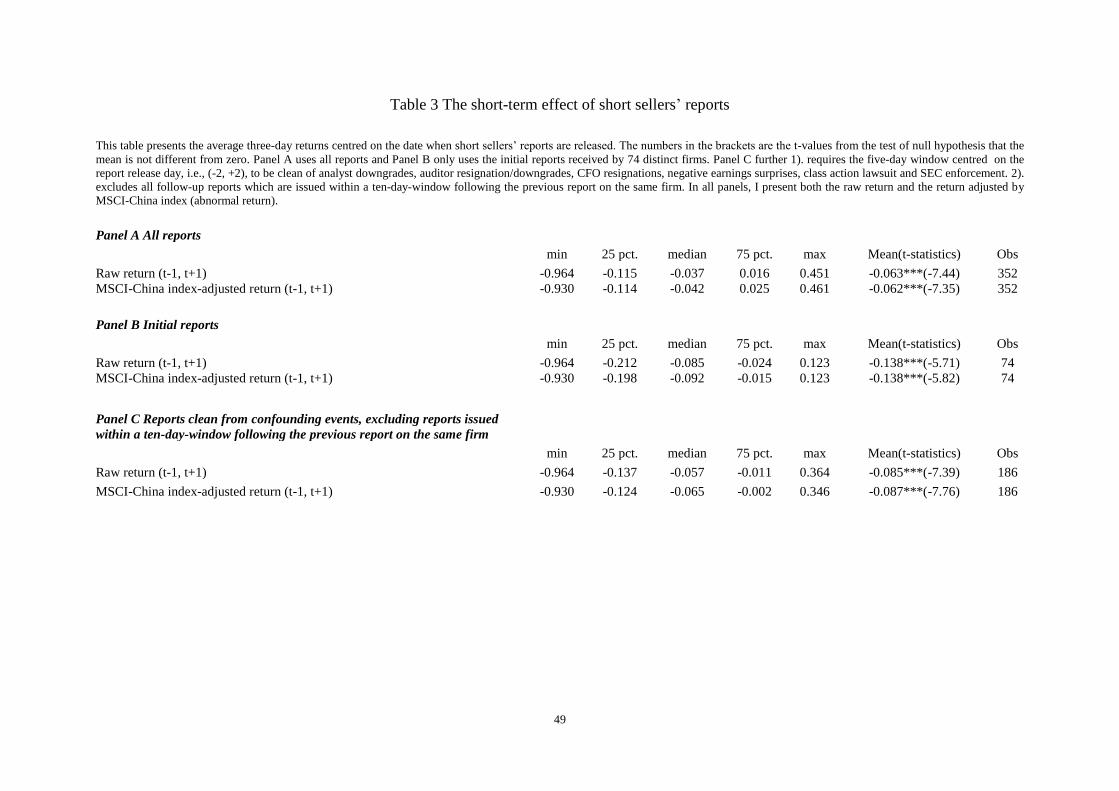
49
Table 3 The short-term effect of short sellers’ reports
This table presents the average three-day returns centred on the date when short sellers’ reports are released. The numbers in the brackets are the t-values from the test of null hypothesis that the
mean is not different from zero. Panel A uses all reports and Panel B only uses the initial reports received by 74 distinct firms. Panel C further 1). requires the five-day window centred on the
report release day, i.e., (-2, +2), to be clean of analyst downgrades, auditor resignation/downgrades, CFO resignations, negative earnings surprises, class action lawsuit and SEC enforcement. 2).
excludes all follow-up reports which are issued within a ten-day-window following the previous report on the same firm. In all panels, I present both the raw return and the return adjusted by
MSCI-China index (abnormal return).
Panel A All reports
min 25 pct. median 75 pct. max Mean(t-statistics) Obs
Raw return (t-1, t+1) -0.964 -0.115 -0.037 0.016 0.451 -0.063***(-7.44) 352
MSCI-China index-adjusted return (t-1, t+1) -0.930 -0.114 -0.042 0.025 0.461 -0.062***(-7.35) 352
Panel B Initial reports
min 25 pct. median 75 pct. max Mean(t-statistics) Obs
Raw return (t-1, t+1) -0.964 -0.212 -0.085 -0.024 0.123 -0.138***(-5.71) 74
MSCI-China index-adjusted return (t-1, t+1) -0.930 -0.198 -0.092 -0.015 0.123 -0.138***(-5.82) 74
Panel C Reports clean from confounding events, excluding reports issued
within a ten-day-window following the previous report on the same firm
min 25 pct. median 75 pct. max Mean(t-statistics) Obs
Raw return (t-1, t+1) -0.964 -0.137 -0.057 -0.011 0.364 -0.085***(-7.39) 186
MSCI-China index-adjusted return (t-1, t+1) -0.930 -0.124 -0.065 -0.002 0.346 -0.087***(-7.76) 186
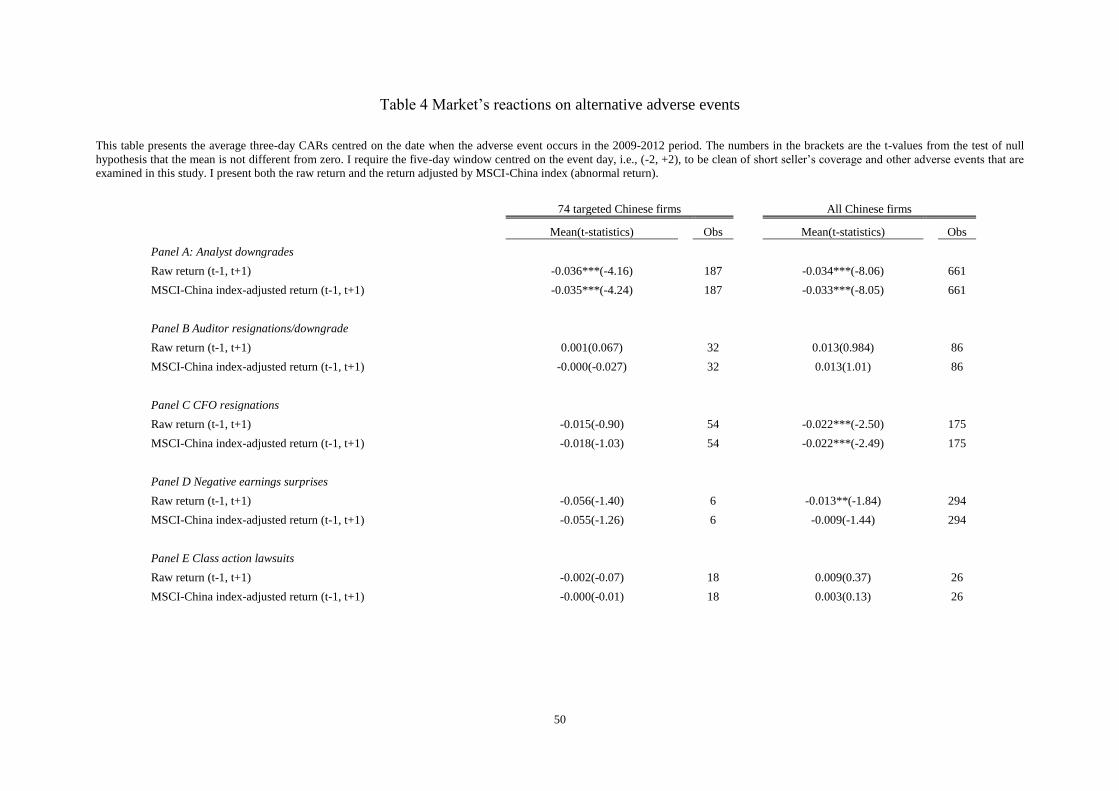
50
Table 4 Market’s reactions on alternative adverse events
This table presents the average three-day CARs centred on the date when the adverse event occurs in the 2009-2012 period. The numbers in the brackets are the t-values from the test of null
hypothesis that the mean is not different from zero. I require the five-day window centred on the event day, i.e., (-2, +2), to be clean of short seller’s coverage and other adverse events that are
examined in this study. I present both the raw return and the return adjusted by MSCI-China index (abnormal return).
74 targeted Chinese firms
All Chinese firms
Mean(t-statistics)
Obs
Mean(t-statistics)
Obs
Panel A: Analyst downgrades
Raw return (t-1, t+1) -0.036***(-4.16)
187
-0.034***(-8.06)
661
MSCI-China index-adjusted return (t-1, t+1) -0.035***(-4.24)
187
-0.033***(-8.05)
661
Panel B Auditor resignations/downgrade
Raw return (t-1, t+1) 0.001(0.067)
32
0.013(0.984)
86
MSCI-China index-adjusted return (t-1, t+1) -0.000(-0.027)
32
0.013(1.01)
86
Panel C CFO resignations
Raw return (t-1, t+1) -0.015(-0.90)
54
-0.022***(-2.50)
175
MSCI-China index-adjusted return (t-1, t+1) -0.018(-1.03)
54
-0.022***(-2.49)
175
Panel D Negative earnings surprises
Raw return (t-1, t+1) -0.056(-1.40)
6
-0.013**(-1.84)
294
MSCI-China index-adjusted return (t-1, t+1) -0.055(-1.26)
6
-0.009(-1.44)
294
Panel E Class action lawsuits
Raw return (t-1, t+1) -0.002(-0.07)
18
0.009(0.37)
26
MSCI-China index-adjusted return (t-1, t+1) -0.000(-0.01)
18
0.003(0.13)
26
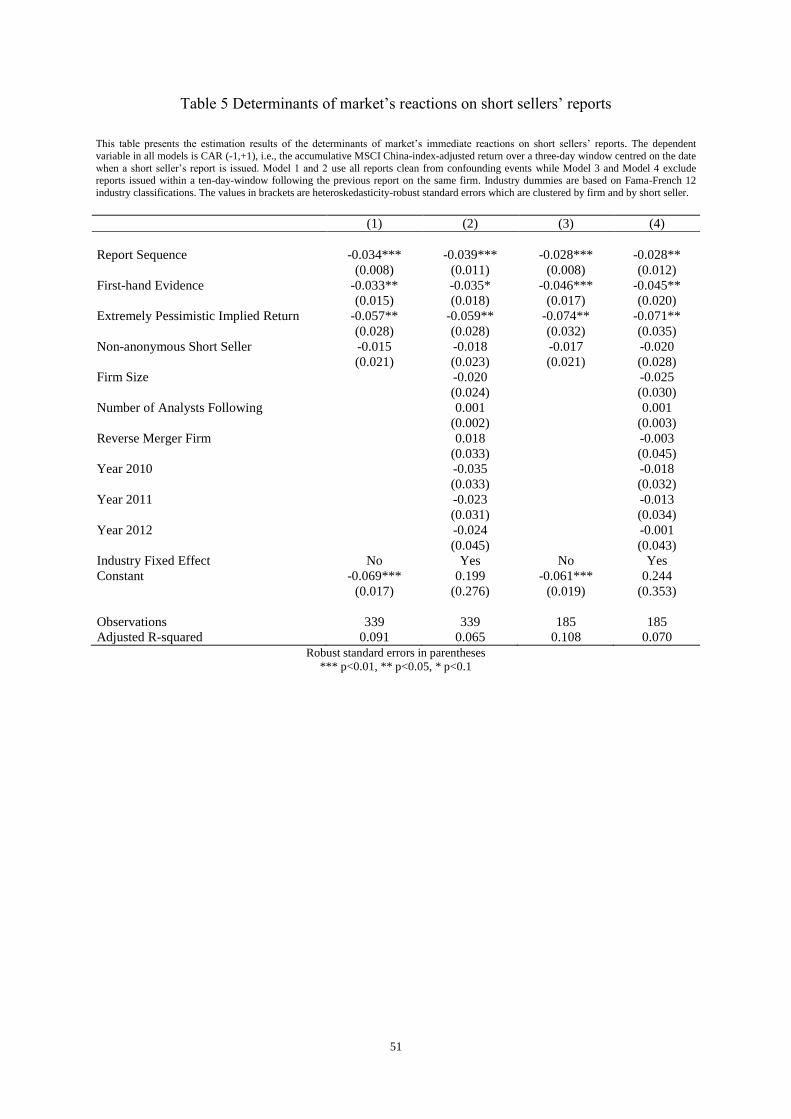
51
Table 5 Determinants of market’s reactions on short sellers’ reports
This table presents the estimation results of the determinants of market’s immediate reactions on short sellers’ reports. The dependent
variable in all models is CAR (-1,+1), i.e., the accumulative MSCI China-index-adjusted return over a three-day window centred on the date
when a short seller’s report is issued. Model 1 and 2 use all reports clean from confounding events while Model 3 and Model 4 exclude reports issued within a ten-day-window following the previous report on the same firm. Industry dummies are based on Fama-French 12
industry classifications. The values in brackets are heteroskedasticity-robust standard errors which are clustered by firm and by short seller.
(1) (2) (3) (4)
Report Sequence -0.034*** -0.039*** -0.028*** -0.028**
(0.008) (0.011) (0.008) (0.012)
First-hand Evidence -0.033** -0.035* -0.046*** -0.045**
(0.015) (0.018) (0.017) (0.020)
Extremely Pessimistic Implied Return -0.057** -0.059** -0.074** -0.071**
(0.028) (0.028) (0.032) (0.035)
Non-anonymous Short Seller -0.015 -0.018 -0.017 -0.020
(0.021) (0.023) (0.021) (0.028)
Firm Size -0.020 -0.025
(0.024) (0.030)
Number of Analysts Following 0.001 0.001
(0.002) (0.003)
Reverse Merger Firm 0.018 -0.003
(0.033) (0.045)
Year 2010 -0.035 -0.018
(0.033) (0.032)
Year 2011 -0.023 -0.013
(0.031) (0.034)
Year 2012 -0.024 -0.001
(0.045) (0.043)
Industry Fixed Effect No Yes No Yes
Constant -0.069*** 0.199 -0.061*** 0.244
(0.017) (0.276) (0.019) (0.353)
Observations 339 339 185 185
Adjusted R-squared 0.091 0.065 0.108 0.070
Robust standard errors in parentheses
*** p<0.01, ** p<0.05, * p<0.1
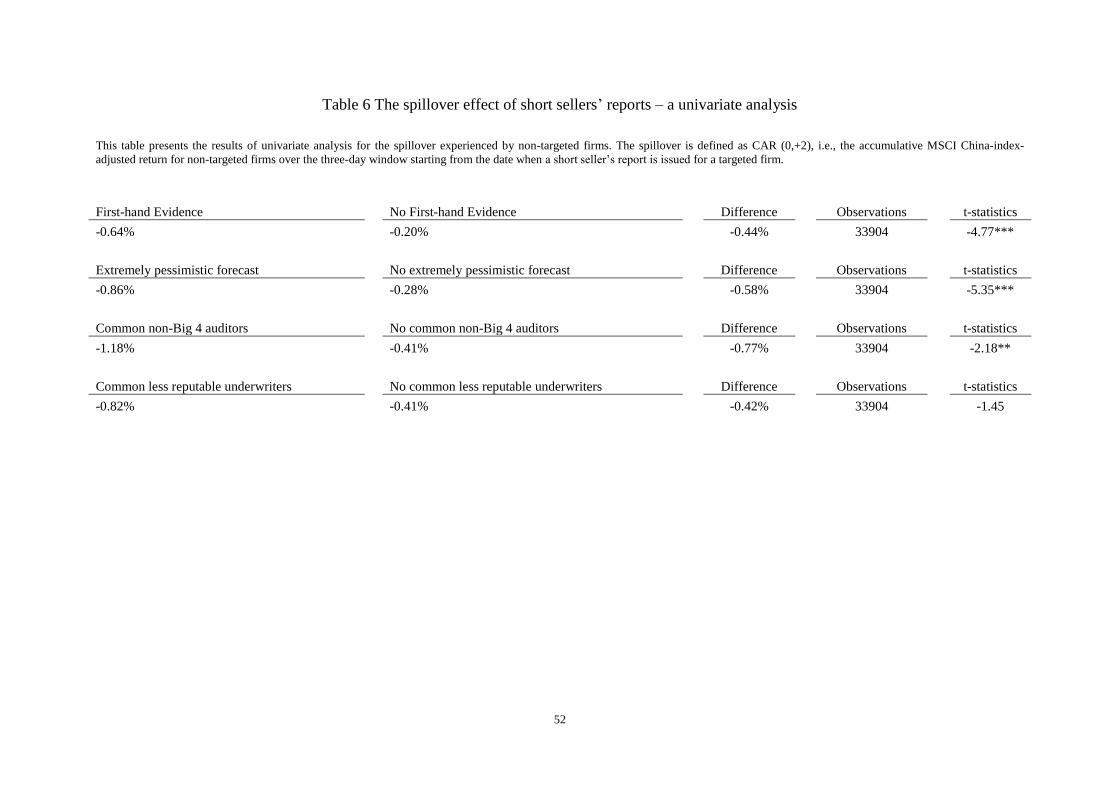
52
Table 6 The spillover effect of short sellers’ reports – a univariate analysis
This table presents the results of univariate analysis for the spillover experienced by non-targeted firms. The spillover is defined as CAR (0,+2), i.e., the accumulative MSCI China-index-
adjusted return for non-targeted firms over the three-day window starting from the date when a short seller’s report is issued for a targeted firm.
First-hand Evidence
No First-hand Evidence
Difference
Observations
t-statistics
-0.64%
-0.20%
-0.44%
33904
-4.77***
Extremely pessimistic forecast
No extremely pessimistic forecast
Difference
Observations
t-statistics
-0.86%
-0.28%
-0.58%
33904
-5.35***
Common non-Big 4 auditors
No common non-Big 4 auditors
Difference
Observations
t-statistics
-1.18%
-0.41%
-0.77%
33904
-2.18**
Common less reputable underwriters
No common less reputable underwriters
Difference
Observations
t-statistics
-0.82%
-0.41%
-0.42%
33904
-1.45
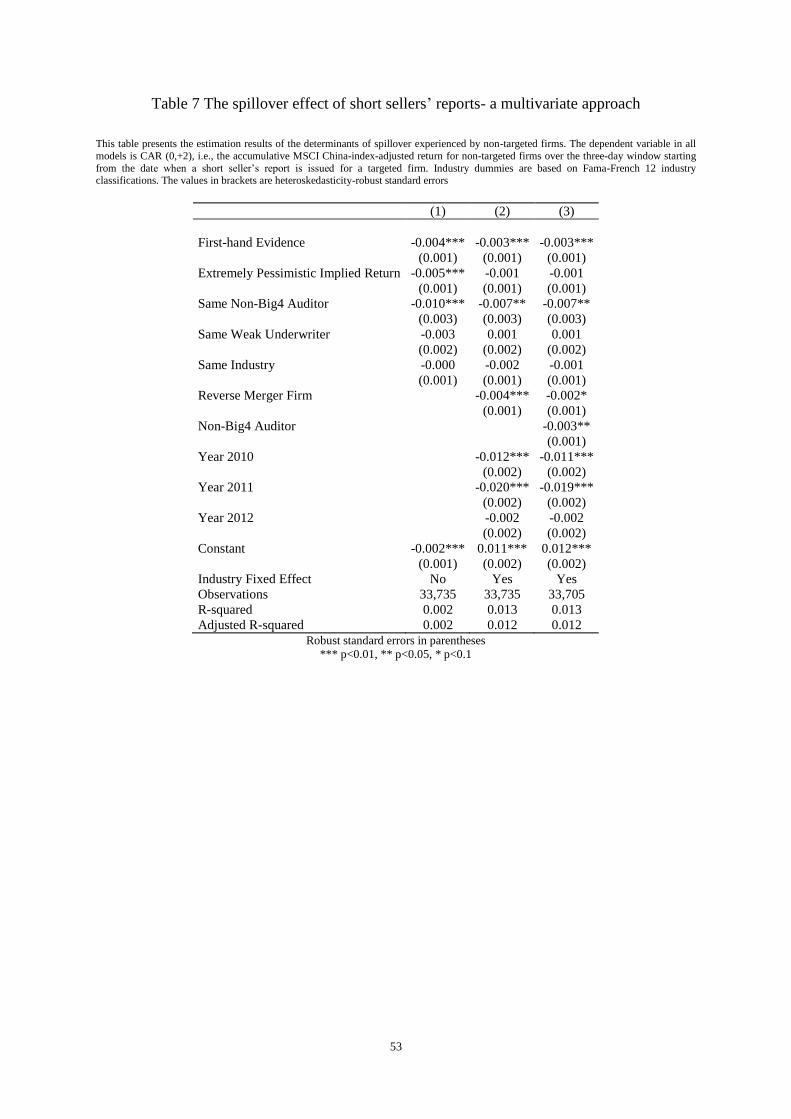
53
Table 7 The spillover effect of short sellers’ reports- a multivariate approach
This table presents the estimation results of the determinants of spillover experienced by non-targeted firms. The dependent variable in all
models is CAR (0,+2), i.e., the accumulative MSCI China-index-adjusted return for non-targeted firms over the three-day window starting
from the date when a short seller’s report is issued for a targeted firm. Industry dummies are based on Fama-French 12 industry classifications. The values in brackets are heteroskedasticity-robust standard errors
(1) (2) (3)
First-hand Evidence -0.004*** -0.003*** -0.003***
(0.001) (0.001) (0.001)
Extremely Pessimistic Implied Return -0.005*** -0.001 -0.001
(0.001) (0.001) (0.001)
Same Non-Big4 Auditor -0.010*** -0.007** -0.007**
(0.003) (0.003) (0.003)
Same Weak Underwriter -0.003 0.001 0.001
(0.002) (0.002) (0.002)
Same Industry -0.000 -0.002 -0.001
(0.001) (0.001) (0.001)
Reverse Merger Firm -0.004*** -0.002*
(0.001) (0.001)
Non-Big4 Auditor -0.003**
(0.001)
Year 2010 -0.012*** -0.011***
(0.002) (0.002)
Year 2011 -0.020*** -0.019***
(0.002) (0.002)
Year 2012 -0.002 -0.002
(0.002) (0.002)
Constant -0.002*** 0.011*** 0.012***
(0.001) (0.002) (0.002)
Industry Fixed Effect No Yes Yes
Observations 33,735 33,735 33,705
R-squared 0.002 0.013 0.013
Adjusted R-squared 0.002 0.012 0.012
Robust standard errors in parentheses
*** p<0.01, ** p<0.05, * p<0.1
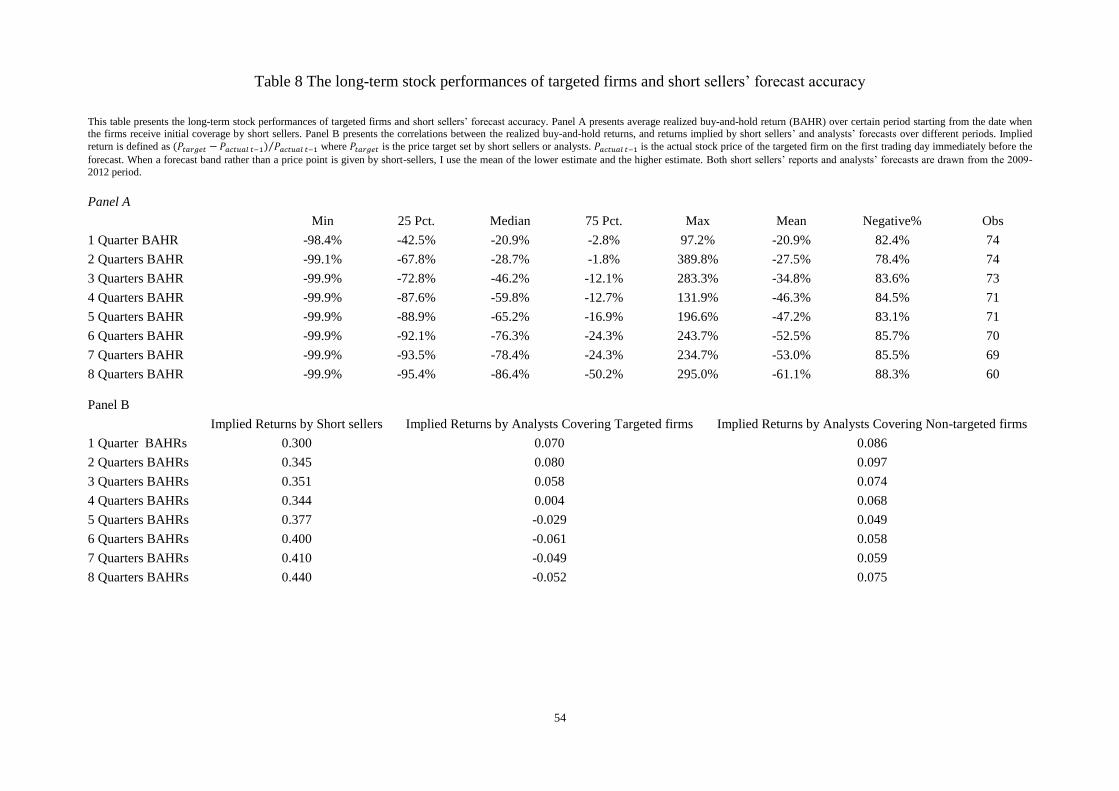
54
Table 8 The long-term stock performances of targeted firms and short sellers’ forecast accuracy
This table presents the long-term stock performances of targeted firms and short sellers’ forecast accuracy. Panel A presents average realized buy-and-hold return (BAHR) over certain period starting from the date when the firms receive initial coverage by short sellers. Panel B presents the correlations between the realized buy-and-hold returns, and returns implied by short sellers’ and analysts’ forecasts over different periods. Implied
return is defined as ⁄ where is the price target set by short sellers or analysts. is the actual stock price of the targeted firm on the first trading day immediately before the
forecast. When a forecast band rather than a price point is given by short-sellers, I use the mean of the lower estimate and the higher estimate. Both short sellers’ reports and analysts’ forecasts are drawn from the 2009-
2012 period.
Panel A
Min 25 Pct. Median 75 Pct. Max Mean Negative% Obs
1 Quarter BAHR -98.4% -42.5% -20.9% -2.8% 97.2% -20.9% 82.4% 74
2 Quarters BAHR -99.1% -67.8% -28.7% -1.8% 389.8% -27.5% 78.4% 74
3 Quarters BAHR -99.9% -72.8% -46.2% -12.1% 283.3% -34.8% 83.6% 73
4 Quarters BAHR -99.9% -87.6% -59.8% -12.7% 131.9% -46.3% 84.5% 71
5 Quarters BAHR -99.9% -88.9% -65.2% -16.9% 196.6% -47.2% 83.1% 71
6 Quarters BAHR -99.9% -92.1% -76.3% -24.3% 243.7% -52.5% 85.7% 70
7 Quarters BAHR -99.9% -93.5% -78.4% -24.3% 234.7% -53.0% 85.5% 69
8 Quarters BAHR -99.9% -95.4% -86.4% -50.2% 295.0% -61.1% 88.3% 60
Panel B
Implied Returns by Short sellers Implied Returns by Analysts Covering Targeted firms Implied Returns by Analysts Covering Non-targeted firms
1 Quarter BAHRs 0.300 0.070 0.086
2 Quarters BAHRs 0.345 0.080 0.097
3 Quarters BAHRs 0.351 0.058 0.074
4 Quarters BAHRs 0.344 0.004 0.068
5 Quarters BAHRs 0.377 -0.029 0.049
6 Quarters BAHRs 0.400 -0.061 0.058
7 Quarters BAHRs 0.410 -0.049 0.059
8 Quarters BAHRs 0.440 -0.052 0.075
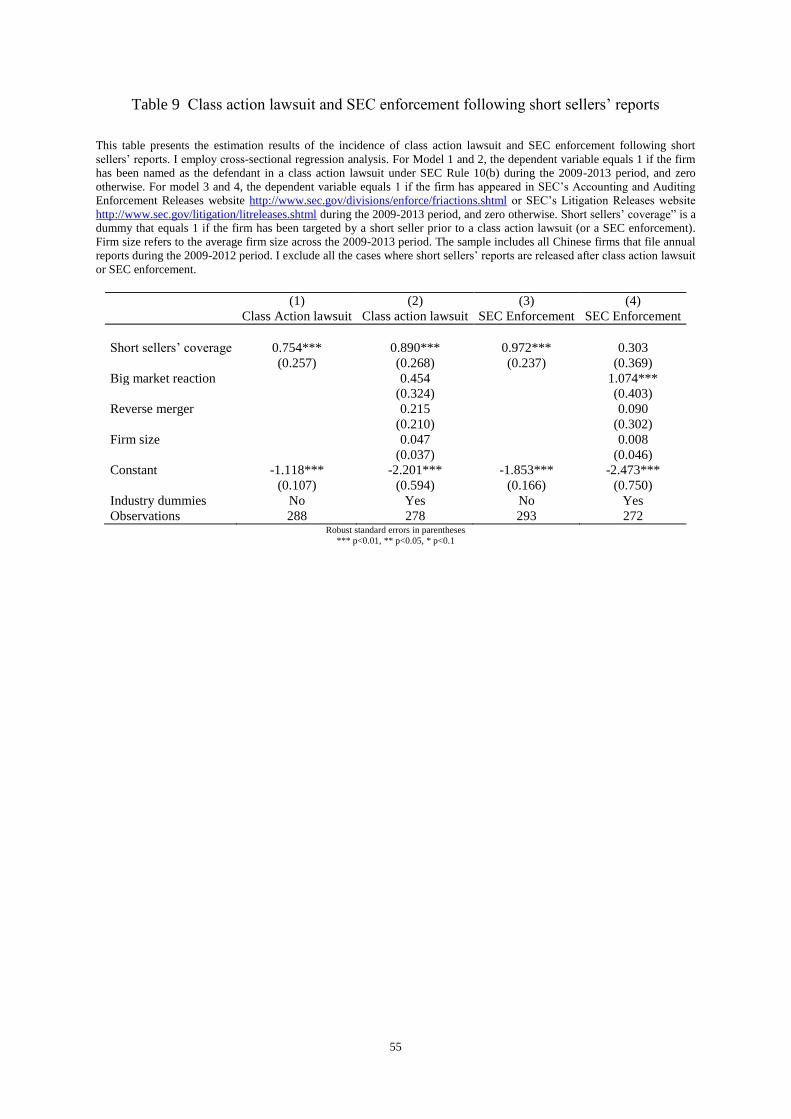
55
Table 9 Class action lawsuit and SEC enforcement following short sellers’ reports
This table presents the estimation results of the incidence of class action lawsuit and SEC enforcement following short
sellers’ reports. I employ cross-sectional regression analysis. For Model 1 and 2, the dependent variable equals 1 if the firm
has been named as the defendant in a class action lawsuit under SEC Rule 10(b) during the 2009-2013 period, and zero
otherwise. For model 3 and 4, the dependent variable equals 1 if the firm has appeared in SEC’s Accounting and Auditing
Enforcement Releases website http://www.sec.gov/divisions/enforce/friactions.shtml or SEC’s Litigation Releases website
http://www.sec.gov/litigation/litreleases.shtml during the 2009-2013 period, and zero otherwise. Short sellers’ coverage” is a
dummy that equals 1 if the firm has been targeted by a short seller prior to a class action lawsuit (or a SEC enforcement).
Firm size refers to the average firm size across the 2009-2013 period. The sample includes all Chinese firms that file annual
reports during the 2009-2012 period. I exclude all the cases where short sellers’ reports are released after class action lawsuit
or SEC enforcement.
(1) (2) (3) (4)
Class Action lawsuit Class action lawsuit SEC Enforcement SEC Enforcement
Short sellers’ coverage 0.754*** 0.890*** 0.972*** 0.303
(0.257) (0.268) (0.237) (0.369)
Big market reaction 0.454 1.074***
(0.324) (0.403)
Reverse merger 0.215 0.090
(0.210) (0.302)
Firm size 0.047 0.008
(0.037) (0.046)
Constant -1.118*** -2.201*** -1.853*** -2.473***
(0.107) (0.594) (0.166) (0.750)
Industry dummies No Yes No Yes
Observations 288 278 293 272 Robust standard errors in parentheses
*** p<0.01, ** p<0.05, * p<0.1
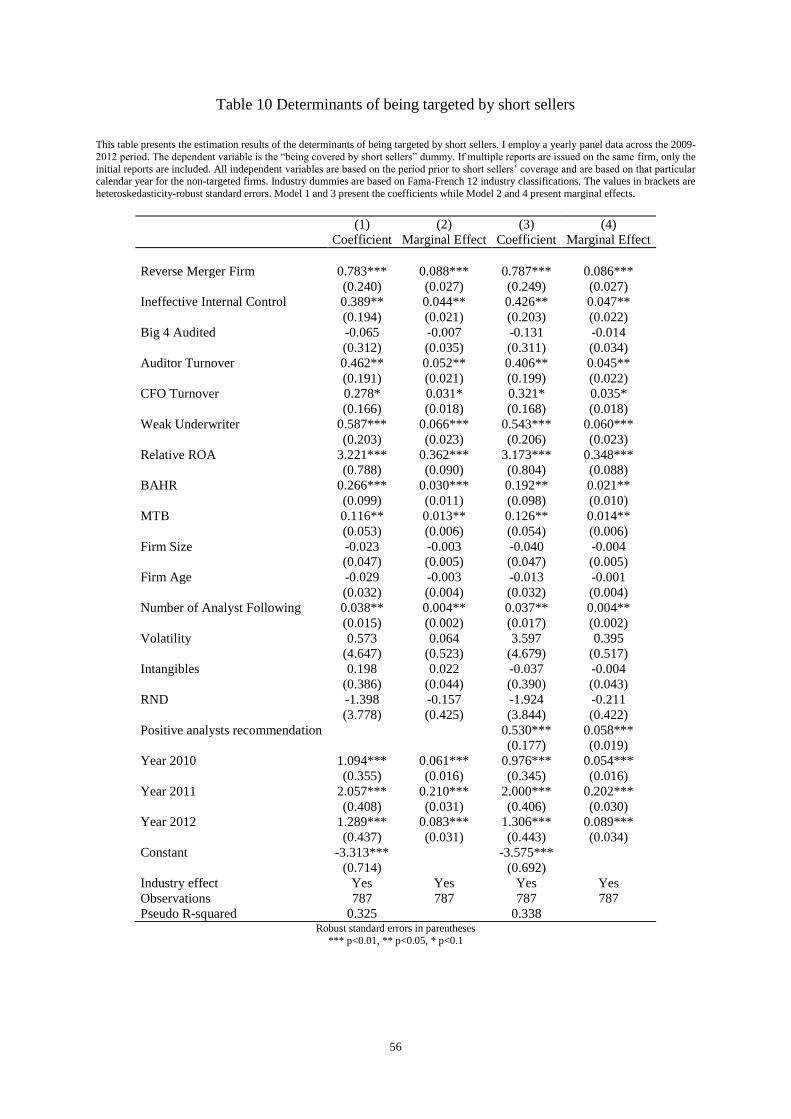
56
Table 10 Determinants of being targeted by short sellers
This table presents the estimation results of the determinants of being targeted by short sellers. I employ a yearly panel data across the 2009-
2012 period. The dependent variable is the “being covered by short sellers” dummy. If multiple reports are issued on the same firm, only the
initial reports are included. All independent variables are based on the period prior to short sellers’ coverage and are based on that particular calendar year for the non-targeted firms. Industry dummies are based on Fama-French 12 industry classifications. The values in brackets are
heteroskedasticity-robust standard errors. Model 1 and 3 present the coefficients while Model 2 and 4 present marginal effects.
(1) (2) (3) (4)
Coefficient Marginal Effect Coefficient Marginal Effect
Reverse Merger Firm 0.783*** 0.088*** 0.787*** 0.086***
(0.240) (0.027) (0.249) (0.027)
Ineffective Internal Control 0.389** 0.044** 0.426** 0.047**
(0.194) (0.021) (0.203) (0.022)
Big 4 Audited -0.065 -0.007 -0.131 -0.014
(0.312) (0.035) (0.311) (0.034)
Auditor Turnover 0.462** 0.052** 0.406** 0.045**
(0.191) (0.021) (0.199) (0.022)
CFO Turnover 0.278* 0.031* 0.321* 0.035*
(0.166) (0.018) (0.168) (0.018)
Weak Underwriter 0.587*** 0.066*** 0.543*** 0.060***
(0.203) (0.023) (0.206) (0.023)
Relative ROA 3.221*** 0.362*** 3.173*** 0.348***
(0.788) (0.090) (0.804) (0.088)
BAHR 0.266*** 0.030*** 0.192** 0.021**
(0.099) (0.011) (0.098) (0.010)
MTB 0.116** 0.013** 0.126** 0.014**
(0.053) (0.006) (0.054) (0.006)
Firm Size -0.023 -0.003 -0.040 -0.004
(0.047) (0.005) (0.047) (0.005)
Firm Age -0.029 -0.003 -0.013 -0.001
(0.032) (0.004) (0.032) (0.004)
Number of Analyst Following 0.038** 0.004** 0.037** 0.004**
(0.015) (0.002) (0.017) (0.002)
Volatility 0.573 0.064 3.597 0.395
(4.647) (0.523) (4.679) (0.517)
Intangibles 0.198 0.022 -0.037 -0.004
(0.386) (0.044) (0.390) (0.043)
RND -1.398 -0.157 -1.924 -0.211
(3.778) (0.425) (3.844) (0.422)
Positive analysts recommendation 0.530*** 0.058***
(0.177) (0.019)
Year 2010 1.094*** 0.061*** 0.976*** 0.054***
(0.355) (0.016) (0.345) (0.016)
Year 2011 2.057*** 0.210*** 2.000*** 0.202***
(0.408) (0.031) (0.406) (0.030)
Year 2012 1.289*** 0.083*** 1.306*** 0.089***
(0.437) (0.031) (0.443) (0.034)
Constant -3.313*** -3.575***
(0.714) (0.692)
Industry effect Yes Yes Yes Yes
Observations 787 787 787 787
Pseudo R-squared 0.325 0.338 Robust standard errors in parentheses
*** p<0.01, ** p<0.05, * p<0.1