the financial story wall street doesn't tell. - alliance for advancing
TRANSCRIPT

NONPROFITHEALTHINSURERS:
EXECUTIVE SUMMARY
For several years, Wall Street investmentfirms have campaigned for conversion ofnot-for-profit health insurers to investorownership, arguing that an infusion ofequity capital is critical to insurers’survival. However, closer examination ofthe financial performance and capitalposition of not-for-profit health plansshows that:
• The lower operating margins reportedby not-for-profit health very likelyreflect the organizations’ corporatemissions to serve their communitiesby minimizing the cost of coverageand their ability to invest all gainsback into the company for the futurebenefit of their customers. Theirinvestor-owned counterparts mustgenerate higher margins to giveshareholders a return on theirinvestment.
• Compared with investor-ownedinsurers, not-for-profit health plans usea significantly higher percentage ofthe customers’ premium dollar to payhealth care claims. A lower percentagegoes for administrative expenses.
• Over the past ten years, not-for-profithealth plans have succeeded in usingoperational and investment gains tobuild and retain a strong capitalposition - stronger than that ofinvestor-owned companies - whileinvesting heavily in infrastructure,product development, and marketgrowth.
The FinancialStory Wall StreetDoesn’t Tell.
Susan R. Barrish

INTRODUCTION
For decades, community-based nonprofitorganizations1 were the chief source ofhealth insurance coverage. The recent waveof highly publicized initial public offeringsof health insurers, including a number ofBlue Cross and Blue Shield Plans, has ledsome to conclude that the nonprofit healthinsurer is an endangered species on thebrink of extinction. Wall Street (andinvestor-owned companies) has beenchampioning health carrier conversion toinvestor ownership both as a source of feesfor themselves and as a requirement forcompany survival, bringing access tocapital for investments in technology andmarket growth, an avenue to economies ofscale, and a bottom-line orientation.
However, when you go beyond Wall Streetreports, you find that nonprofit healthinsurers continue to be a robust, vitalcomponent of the health care financingindustry. These companies do notnecessarily require equity capital to fundthe future. Their investments in servicedelivery, product development, and growthcan continue to be funded through acombination of gains from operations andinvestment portfolios, accumulatedreserves, access to alternative capitalsources, and intercompany alliances thatshare development and/or operationalcosts.
This paper offers an overview of thefinancial position and performance ofnonprofit health plans. It presents relatedissues to consider by organizationscontemplating conversion to investorownership and by regulators who have toapprove the conversion.
... when you gobeyond WallStreet reports,you find thatnonprofit healthinsurers continueto be a robust,vital componentof the health carefinancing industry.
Wall Street ... hasbeen championinghealth carrierconversion toinvestor ownershipboth as a source offees for themselvesand as arequirement for companysurvival ...
nonprofit HEALTH INSURERS:THE FINANCIAL STORY WALL STREET DOESN’T TELL
1 In this paper, the terms “not-for-profit” and “nonprofit”include all non-investor-owned organizations, such asmutual insurance companies.
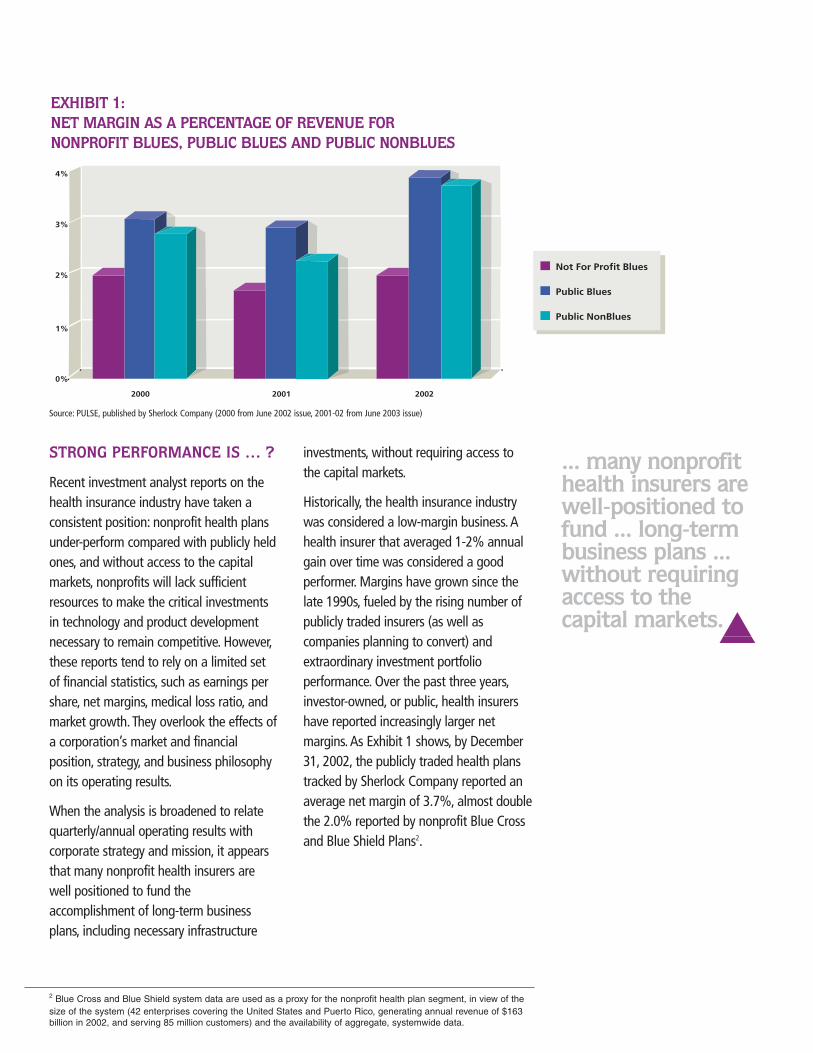
EXHIBIT 1: NET MARGIN AS A PERCENTAGE OF REVENUE FOR NONPROFIT BLUES, PUBLIC BLUES AND PUBLIC NONBLUES
Source: PULSE, published by Sherlock Company (2000 from June 2002 issue, 2001-02 from June 2003 issue)
STRONG PERFORMANCE IS … ?
Recent investment analyst reports on thehealth insurance industry have taken aconsistent position: nonprofit health plansunder-perform compared with publicly heldones, and without access to the capitalmarkets, nonprofits will lack sufficientresources to make the critical investmentsin technology and product developmentnecessary to remain competitive. However,these reports tend to rely on a limited setof financial statistics, such as earnings pershare, net margins, medical loss ratio, andmarket growth. They overlook the effects ofa corporation’s market and financialposition, strategy, and business philosophyon its operating results.
When the analysis is broadened to relatequarterly/annual operating results withcorporate strategy and mission, it appearsthat many nonprofit health insurers arewell positioned to fund theaccomplishment of long-term businessplans, including necessary infrastructure
investments, without requiring access tothe capital markets.
Historically, the health insurance industrywas considered a low-margin business. Ahealth insurer that averaged 1-2% annualgain over time was considered a goodperformer. Margins have grown since thelate 1990s, fueled by the rising number ofpublicly traded insurers (as well ascompanies planning to convert) andextraordinary investment portfolioperformance. Over the past three years,investor-owned, or public, health insurershave reported increasingly larger netmargins. As Exhibit 1 shows, by December31, 2002, the publicly traded health planstracked by Sherlock Company reported anaverage net margin of 3.7%, almost doublethe 2.0% reported by nonprofit Blue Crossand Blue Shield Plans2.
... many nonprofithealth insurers arewell-positioned tofund ... long-termbusiness plans ...without requiringaccess to thecapital markets.
2 Blue Cross and Blue Shield system data are used as a proxy for the nonprofit health plan segment, in view of thesize of the system (42 enterprises covering the United States and Puerto Rico, generating annual revenue of $163billion in 2002, and serving 85 million customers) and the availability of aggregate, systemwide data.


The adequacy of a company’s operatingmargin should also be analyzed in light ofthe entity’s capital position, a perspectivetypically neglected by Wall Street whenevaluating health insurers.
In 1998 the National Association ofInsurance Commissioners (NAIC) adopted arisk-based capital formula for managedcare organizations, MCO-RBC. This formulameasures the adequacy of a health plan’scapital position in relation to the risksassociated with issuing insurance contracts,investment portfolio, and other businesscontingencies. The higher a company’s risk-based capital ratio, the more financialflexibility it has to invest in new initiativesand technologies and in customer growth.It is also better able to weather financiallosses associated with unfavorableunderwriting results (financial lossesincurred when claims and relatedadministrative expenses exceed premiumscollected).
The NAIC has established a minimum RBClevel that triggers regulatory action: 200%of the Authorized Control Level, or ACL, isthe first step in an early warning process;at 70% of ACL, state regulators aremandated to assume control of the entity.However, the formula does not establish atarget or a maximum level of reserves. Anindividual health plan must determine howmuch capital it should accumulate aboveregulatory action levels to ensure that itslong-term business strategy can besupported.
For Blue Plans, unlike the rest of theindustry, the capital requirement generatedby the MCO-RBC formula was not a newconcept5. The Blue Cross and Blue ShieldAssociation had adopted a similarapproach for all its domestic licensees inthe early 1990s that encouraged Blue Plansto be well capitalized. By year end 2002, asshown in Exhibit 4, the average Blue Planrisk-based capital ratio was 623%; theaverage for nonprofit Blue Plans was 17%higher, at 727%.
These figures indicate that most6 of theBlue nonprofits have been quite successfulin implementing a capital-building andretention strategy - without access to thecapital market - while adding 3.8 millionnew customers, a 7.7% increase in threeyears7, and making significantinfrastructure and product investmentscritical to maintaining market leadership.The higher RBC position may also partiallyexplain the lower operating marginsreported by nonprofits. A strong capitalposition means less need to generatecapital through operations, resulting in lessmargin built into premium levels.
nonprofit HEALTH INSURERS:THE FINANCIAL STORY WALL STREET DOESN’T TELL
5 The Blue Cross and Blue Shield Association’s minimum licensure requirement is 200%.6 RBC-MCO ratios for not-for-profit Blue Plans ranged from 257% - 2082% as of December 31, 2002.7 Per BCBS Association enrollment reports.
The higher acompany’s risk-based capital ratio,the more financialflexibility it has toinvest in newinitiatives andtechnologies and incustomer growth.
... as a not-for-profitcompany does notdistribute earningsto stockholders, itretains all financialgains (“profit”) forfuture internalinvestments.

EXHIBIT 4: YEAR-END MCO-RBC RATIOS
RBC percentageSource: BCBS Association* Includes data for all nonprofit and mutual plans that were not pursuing conversion as of year end 2002 and permit BCBSA to publish results.
SUMMARY
When considering the appropriateness ofconverting a nonprofit health insurer toinvestor ownership, it is critical that alldecision makers develop a fullunderstanding of a health plan’s financialperformance and position beyond justoperating-margin statistics. A thoroughreview includes answering the followingquestions:
How does the company’s actualperformance (e.g., underwritingmargin, net margin, premium levels,administrative and medical loss ratios)compare with forecasted performance?Does the company have the disciplineto achieve its forecast?
What is the company’s mission, andhow well aligned are its businesspractices, pricing policies, and
performance results to ensure that themission is achieved?
What changes in pricing policies,product design, and business practiceswould be required to increaseoperating margins? How would keystakeholders (e.g., customers, potentialcustomers, the medical and hospitalcommunities, state regulators andlegislators, competitors) respond?
What is the company’s MCO-RBCposition? Will the company be able togenerate sufficient capital fromoperations and its investment portfolioto fund the future? If not, what are theoptions to reduce the cost of thestrategy and/or raise the capitalshortfall?
... it is critical thatall decision makersdevelop a fullunderstanding of ahealth plan’sfinancial performanceand position beyondjust operating –margin statistics.

Alliance for Advancing Nonprofit HealthCare • 165 Court Street • Rochester, NY 14647 • (877) 299-6497
Learn more about the Alliance. Visit us at:www.nonprofithealthcare.org
Or by email at: [email protected]
SUSAN R. BARRISH
Ms. Barrish is a consultant to the health insuranceindustry, advising executive management on thedevelopment and execution of strategic initiatives.Previously she was a Senior Vice President at the BlueCross and Blue Shield Association, the centralcoordinating body for Blue Cross Blue Shield Plans. As thearchitect of the Association’s brand protection program,
she guided the establishment and implementation of consistent, highstandards for the 200 independent Blue Cross Blue Shield licensees thatgenerate annual revenue in excess of $162 billion and serve 85 millioncustomers. She also led the Association’s financial, actuarial and federaltax services and related policy and advocacy efforts at the NationalAssociation of Insurance Commissioners (NAIC), the IRS and the U.S.Treasury Department. Prior to joining the Association, Susan was inhospital financial management at several large, urban teaching hospitals.
Ms. Barrish holds a Bachelor of Science in Accounting from AmericanInternational College (Springfield, Massachusetts) and a Masters ofBusiness Administration from Cornell University (Ithaca, New York).