the financial services sector and its skills …€¦ · · 2009-01-30the financial services...
TRANSCRIPT
Human Sciences Development Policy Sociology of Work Research Council Research Unit Unit
RESEARCH CONSORTIUM
________________________________________________________________
THE FINANCIAL SERVICES SECTOR AND ITS SKILLS DEVELOPMENT ISSUES
RELEVANT TO THE SOUTH AFRICAN ECONOMY
Sector Studies
Research Project
MARCH 2008
RESEARCH COMMISSIONED BY DEPARTMENT OF LABOUR
SOUTH AFRICA

The financial services sector and its skills
development issues relevant to the South African economy.
Sean Archer, Economics Department, UCT

1
Introduction 1 The role of financial services 7 Banks in South Africa 12 Insurance industry in South Africa 19 Accounting and auditing services 22 Micro-finance 24 Asset management and financial consultancy 26 Skilled demand issues in the financial services sector 28 Channels for the supply of skills to the financial services sector 39 Demand and supply of skills by sub-sector 52 Banking sub-sector 54 Insurance industry 56 Accountancy and auditing 58 Skill shortages, skill gaps and the precision of existing estimates 67 Forecasting skills demand 74 Skills training issues in theory and practice 79 Conclusions and policy implications 87 Box No. 1: Access to financial services 91 Box No. 2: Interviews with five financial services companies conducted by the DPRU 93 References 101 Interviews and acknowledgements 112

1
Introduction. In the South African economy between 1960 and 2006 the weight of the sector labelled Finance, insurance, real estate and business services rose from 10 % to 19.5 % of GDP. Secondly, in addition its contribution to the growth of GDP over this approximate half-century was 1.6 percentage points out of the 5% growth recorded by GDP at market prices; that is, its growth contribution was 32% nearly one-third. Thirdly, demonstrating this remarkable and ongoing expansion, in a recent period of a dozen years, 1993-2005, the contribution to GDP rose by 3% (percentage points). (Standard Bank 2007; Inseta 2006; IMF 2006A) These are not statistics which can be quoted without comment and qualification, which we do below, but they convey the magnitude of the structural change that has occurred in our economy during the second-half of the twentieth century. The services sector as a whole – of which financial services are a part - increased dramatically in size, while mining and manufacturing declined in relative terms. They did not fall absolutely which would be reflected in lowered output or sectoral value-added which is not evident. Table 1 on the structure of output makes this clear, with Finance, insurance, real estate and business services doubling in relative weight between 1960 (10%) and 2006 (19.5%). (Standard Bank Economic Profile 2007: 15). Table 1: Structure of output, change in sectoral contribution to GDP growth, and contribution to growth, 1960 & 2006. Sector Relative size
1960 (%) Relative size 2006 (%)
Contribution to growth (% points)
Agriculture, forestry and fishing 10.6 2.4 -0.3Mining 11.8 7.0 0Manufacturing 19.0 16.1 0.8Electricity, gas and water 2.3 1.9 0.1Construction 2.8 2.3 0.4Wholesale and retail trade, catering and accommodation
13.2 12.3 0.9
Transport, storage and communication 9.4 8.4 0.5Finance, insurance, real estate and business services
10.0 19.5 1.6
Community, social and personal services 15.7 18.6 0.6Total value added 94.9 88.6 4.6Taxes on products less subsidies 5.1 11.4 0.4GDP at market prices 100 100 5.0Total may not add to 100 due to rounding
Source: SA Reserve Bank & Standard Bank (2007)

2
This report concerns the skills profiles that characterise the Financial Services sector and its principal sub-sectors. In particular, it examines the possible causes of slow delivery that stand in the way of additional skills supply to the wide range of sector activities in South Africa. To do so, (i) the main industries, sub-sectors or activity clusters (these terms are used interchangeably) that make up the sector are analysed in some detail; (ii) the causes of their growth are identified as far as it appears plausible to do so; (iii) the demand for skilled labour in the sector is examined by activity and by occupation where data availability makes this possible; and (iv) the chain of skills supply is unravelled in order to clarify the obstructions and bottlenecks likely to impede a higher rate and volume of skills delivery. In broad outline these themes, together with wider perspectives on skills training as an investment process, comprise the different sections of the report. The sub-sectors that supply financial services as well as use them in the South African economy are wide-ranging.
• Commercial or retail banks. • Central banking. • Insurance, long-term and short-term. • Pension funding. • Financial advice. • Inter-firm banking and insurance (“wholesale” financial services in
international terminology). • Investment or asset management. • Consumer credit, finance and leasing. • Call centres and BPO (Business Process Outsourcing). • Government departments dispersing finance at national, provincial and
local levels. • Tax collection: SARS. • Accountancy, auditing and book-keeping. • Micro-finance.
Major activities selected from this list will be discussed in more detail, but the entire range illustrates a number of features important for identifying skills deficiencies. This is essential background information to understand supply and demand forces in financial services. First, these activities or sub-sectors do not correspond clearly and unambiguously to standard industrial classifications of economic activities (SIC codes). So it distorts data collection as well as data analysis to force them into existing industry designations in the pursuit of standardisation. Some activities like financial advice and asset management are important precisely because they are cross-sectoral in scope. They provide services that are valued, and priced where the market is adequate, in a range of sectors identified by the major activities that define them.

3
Second, an element of arbitrariness in occupation and qualification categories is inescapable, but can be cut down where it is feasible to spell out the skilled labour functions in question. Third, whatever listing of sub-sectors is used it will not coincide fully with the three Seta divisions responsible for financial activities under our national skills development strategy. Fasset, Bankseta and Inseta each has a partial and narrower remit, but together cover every major skill and occupational category in what is termed here the Financial Services sector, with the possible exception of independent asset management and financial advice. Fourth, each set of institutions delivering financial services, like banks or accounting firms, faces local obstacles in the path to growth. These determine the demand and supply forces acting on the set of occupations they require, and therefore on the range of skills needed in support of their growth. These discussions comprise the bulk of the present section. Employment in financial service activities is concentrated in the kinds of jobs that are non-manual and either intermediate or high skill in character – as well as high in professional and social status – along with clerical and secretarial occupations lower down in the profile of skills. Thus the jobs spectrum in this sector shows polarisation in the nature of the work performed, in the skill requirements (that is, the autonomy and discretion exercised by the holder of the skill), and in payment differences. But this is changing. Lower skilled work in the sector continues to be substituted, and therefore demand for it eliminated, by capital inputs that arise from advances in IT technology. Also, international task trading is a new phenomenon in services, including financial services, under the generic heading of off-shoring. (Grossman & Rossi-Hansberg 2006) Much of this activity ends up in large emerging economies like India and Pakistan where the English language is in widespread use. Currently there is considerable speculation that South Africa may also be a contender for off-shored financial services from major industrial economies, for example in call centres. (Lundall 2007; Gelb, Keeton & Malikane 2005) One striking conclusion of a recent American study is the size of the proportion of jobs that in principle could be exported. “I have derived and presented a new index of the ‘offshorability’ of 291 US occupations. Using this index, I estimate that the outer limit of potential offshorability encompasses between 22% and 29% of all the jobs in the 2004 US workforce, with the upper half of that range more likely than the lower half.” (Blinder 2007: 34-5) One major conclusion of this report meriting a clear statement at the outset is that accountancy skills show the strongest signs and symptoms of being in excess demand in sectors that provide and use financial services. This includes
4
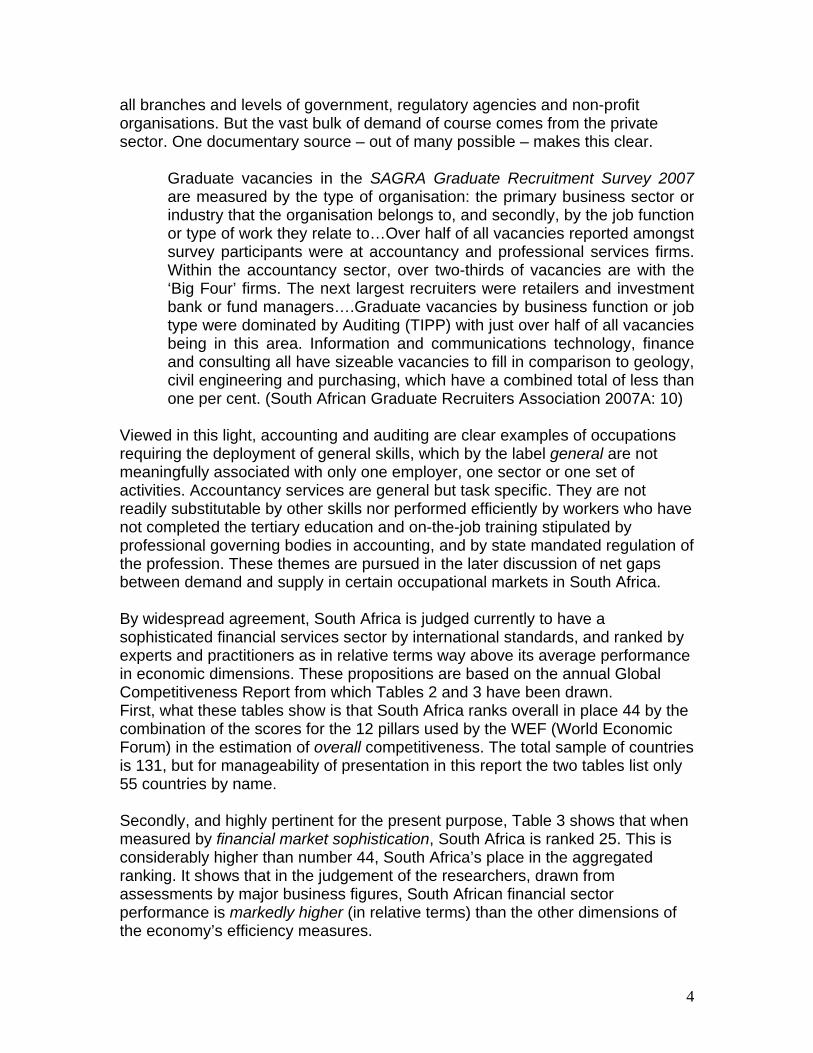
all branches and levels of government, regulatory agencies and non-profit organisations. But the vast bulk of demand of course comes from the private sector. One documentary source – out of many possible – makes this clear.
Graduate vacancies in the SAGRA Graduate Recruitment Survey 2007 are measured by the type of organisation: the primary business sector or industry that the organisation belongs to, and secondly, by the job function or type of work they relate to…Over half of all vacancies reported amongst survey participants were at accountancy and professional services firms. Within the accountancy sector, over two-thirds of vacancies are with the ‘Big Four’ firms. The next largest recruiters were retailers and investment bank or fund managers….Graduate vacancies by business function or job type were dominated by Auditing (TIPP) with just over half of all vacancies being in this area. Information and communications technology, finance and consulting all have sizeable vacancies to fill in comparison to geology, civil engineering and purchasing, which have a combined total of less than one per cent. (South African Graduate Recruiters Association 2007A: 10)
Viewed in this light, accounting and auditing are clear examples of occupations requiring the deployment of general skills, which by the label general are not meaningfully associated with only one employer, one sector or one set of activities. Accountancy services are general but task specific. They are not readily substitutable by other skills nor performed efficiently by workers who have not completed the tertiary education and on-the-job training stipulated by professional governing bodies in accounting, and by state mandated regulation of the profession. These themes are pursued in the later discussion of net gaps between demand and supply in certain occupational markets in South Africa. By widespread agreement, South Africa is judged currently to have a sophisticated financial services sector by international standards, and ranked by experts and practitioners as in relative terms way above its average performance in economic dimensions. These propositions are based on the annual Global Competitiveness Report from which Tables 2 and 3 have been drawn. First, what these tables show is that South Africa ranks overall in place 44 by the combination of the scores for the 12 pillars used by the WEF (World Economic Forum) in the estimation of overall competitiveness. The total sample of countries is 131, but for manageability of presentation in this report the two tables list only 55 countries by name. Secondly, and highly pertinent for the present purpose, Table 3 shows that when measured by financial market sophistication, South Africa is ranked 25. This is considerably higher than number 44, South Africa’s place in the aggregated ranking. It shows that in the judgement of the researchers, drawn from assessments by major business figures, South African financial sector performance is markedly higher (in relative terms) than the other dimensions of the economy’s efficiency measures.
5
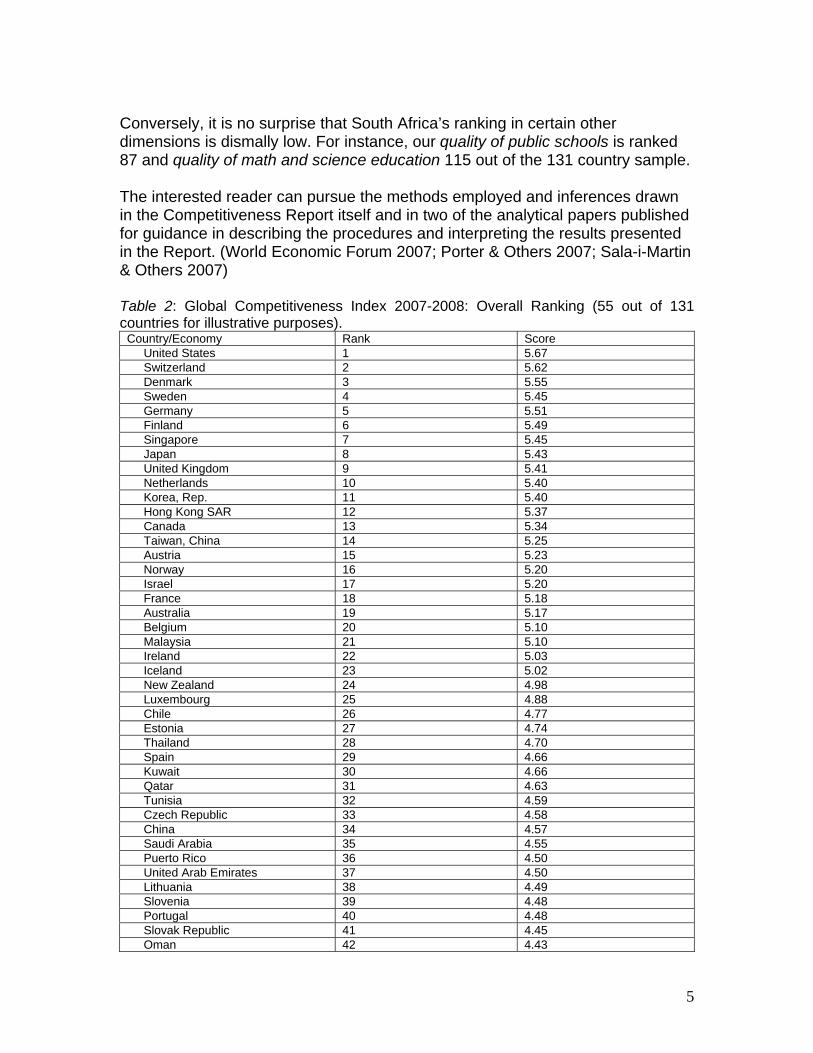
Conversely, it is no surprise that South Africa’s ranking in certain other dimensions is dismally low. For instance, our quality of public schools is ranked 87 and quality of math and science education 115 out of the 131 country sample. The interested reader can pursue the methods employed and inferences drawn in the Competitiveness Report itself and in two of the analytical papers published for guidance in describing the procedures and interpreting the results presented in the Report. (World Economic Forum 2007; Porter & Others 2007; Sala-i-Martin & Others 2007) Table 2: Global Competitiveness Index 2007-2008: Overall Ranking (55 out of 131 countries for illustrative purposes).
Country/Economy Rank Score United States 1 5.67 Switzerland 2 5.62 Denmark 3 5.55 Sweden 4 5.45 Germany 5 5.51 Finland 6 5.49 Singapore 7 5.45 Japan 8 5.43 United Kingdom 9 5.41 Netherlands 10 5.40 Korea, Rep. 11 5.40 Hong Kong SAR 12 5.37 Canada 13 5.34 Taiwan, China 14 5.25 Austria 15 5.23 Norway 16 5.20 Israel 17 5.20 France 18 5.18 Australia 19 5.17 Belgium 20 5.10 Malaysia 21 5.10 Ireland 22 5.03 Iceland 23 5.02 New Zealand 24 4.98 Luxembourg 25 4.88 Chile 26 4.77 Estonia 27 4.74 Thailand 28 4.70 Spain 29 4.66 Kuwait 30 4.66 Qatar 31 4.63 Tunisia 32 4.59 Czech Republic 33 4.58 China 34 4.57 Saudi Arabia 35 4.55 Puerto Rico 36 4.50 United Arab Emirates 37 4.50 Lithuania 38 4.49 Slovenia 39 4.48 Portugal 40 4.48 Slovak Republic 41 4.45 Oman 42 4.43

6
Bahrain 43 4.42 South Africa 44 4.42 Latvia 45 4.41 Italy 46 4.36 Hungary 47 4.35 India 48 4.33 Jordan 49 4.32 Barbados 50 4.32 Poland 51 4.28 Mexico 52 4.26 Turkey 53 4.25 Indonesia 54 4.24 Cyprus 55 4.23
Source: Global Competitiveness Report 2007-2008 (World Economic Forum 2007)

7
Table 3: Global Competitiveness Index 2007-2008: Financial Market Sophistication (55/131 countries).
Country/Economy Rank Score Hong Kong SAR 1 6.23 United Kingdom 2 6.17 Singapore 3 6.02 New Zealand 4 6.02 Ireland 5 5.91 Denmark 6 5.89 Australia 7 5.87 Luxembourg 8 5.85 Sweden 9 5.73 Israel 10 5.72 United States 11 5.68 Bahrain 12 5.65 Canada 13 5.64 Germany 14 5.64 Netherlands 15 5.63 Norway 16 5.61 Finland 17 5.58 Iceland 18 5.56 Malaysia 19 5.49 Malta 20 5.40 Switzerland 21 5.40 Belgium 22 5.37 Panama 23 5.20 France 24 5.20 South Africa 25 5.19 Chile 26 5.17 Korea, Rep. 27 5.15 Austria 28 5.13 Qatar 29 5.13 Puerto Rico 30 5.11 Estonia 31 5.10 Mauritius 32 5.05 Slovak Republic 33 5.02 Spain 34 4.96 Portugal 35 4.94 Japan 36 4.94 India 37 4.93 Latvia 38 4.90 Cyprus 39 4.88 Kuwait 40 4.79 Barbados 41 4.78 Botswana 42 4.77 Montenegro 43 4.75 United Arab Emirates 44 4.75 Trinidad and Tobago 45 4.70 Peru 46 4.68 Slovenia 47 4.68 Kenya 48 4.67 Jamaica 49 4.66 Indonesia 50 4.65 Hungary 51 4.64 Thailand 52 4.63 Czech Republic 53 4.60 Lithuania 54 4.59 Jordan 55 4.55
Source: Global Competitiveness Report 2007-2008 (World Economic Forum 2007)

8
One last source of international perspective on the sophistication of South Africa’s financial sector is the recent World Bank study of the investment climate in South Africa, based on “a survey of over 800 formal private enterprises…benchmarked against firms” in six other countries that include two in Africa plus Brazil, Lithuania, Malaysia, Poland and China. Later in this report reference is made to the data on training originally published on these comparator countries by the World Bank. In the present report what is relevant is the positive finding about the respondent firms’ perception of the availability of finance in the South African economy as a potential constraint on their activities.
In contrast to firms in other countries [assessed by the World Bank], firms in South Africa rated neither access to finance nor cost of financing as serious obstacles to enterprise operations and growth. Fewer than 20 percent of enterprises rated either [of these dimensions of financing] as a major or very severe obstacle. Firms rated access to finance 8th and cost of financing 11th among the 18 constraints queried in the survey. By comparison, over 50 percent of enterprises in the middle-income comparator countries of Brazil and Poland rated cost of financing as a major obstacle. (Clarke & Others 2007: 73)
The role of financial services. Financial Services viewed as a stand-alone sector contains a diverse grouping of economic activities. Table 4 lists the most important of these activities, certain of which will be given explicit attention because of claims about shortages in the performance or production in question. According to the SIC (2005: 8), in order to identify “the principal (main) activity” – one step amongst six – it is necessary to “Determine the division of SIC (2-digit) that has the highest share of the chosen measure [of the activity, eg value-added in insurance].” In the table there are four divisions. But it is quite possible to mount an argument that Division 86, comprising “Computers and related activities”, should be added because of the growing weight of Call Centres and BPO (Business Process Outsourcing) which have their origin in one or other financial service like banking or insurance. The technology at the heart of these activities is computer-based, and there are widespread forecasts of their future growth and concomitant creation of jobs requiring identifiable skills. By way of comparison, Table 5 provides a UK example of the occupational mapping to which the industry, more mature in this case, lends itself. It is easy to demonstrate the arbitrary activity and occupational boundaries of what is termed Financial Services. In general, the sub-grouping of Support Services is extremely heterogeneous. This makes extrapolations about skills characteristics more uncertain, as applies also to the demand and supply forces

9
Table 4: Definition of the Financial Services Sector Sector Grouping – SIC Major Division 8 Principal Activities Industry classification
Banking & Finance SIC 81
Central banking Banks Building societies Other financial
intermediation (leasing, credit granting, investment trusts, venture capital)
Retail includes Call Centres, IFAs (independent financial advisors) and BPO (business process outsourcing).
Insurance SIC 82
Life insurance Pension funding Short-term insurance
Retail including Call Centres, IFAs and BPO.
Professional Services (Financial Intermediation) SIC 81, 82, 83
Administration of financial markets
Security broking Fund management Taxation advice
Wholesale (dealing with firms and other organisations).
Professional Services (Accountancy) SIC 88
Accounting Book-keeping Auditing and related
activities for outcome verification. Support Services.
National, provincial and local government. Public corporations and parastatals
Regulation Accounting Auditing Taxation Financial policy
Regulation and support services in administration and taxation.
Source: DfES, UK (2001:4), Fasset, Inseta, Bankseta (2007), Gelb & Others (2005), South African SIC (2005) to which they are subject. Not only is the range of identifiable skills to be performed large by comparison with other sectors in the economy, but there are multiple groups of employers, some with common interests in the demand and supply of skills but some without. In the UK literature there is the suggestion that instead of being termed a sector the set of financial activities should be labelled a footprint. This word does not carry the implication of close links between named activities, and neither therefore the presumption of homogeneity in the skill types required to carry them out functionally.
10
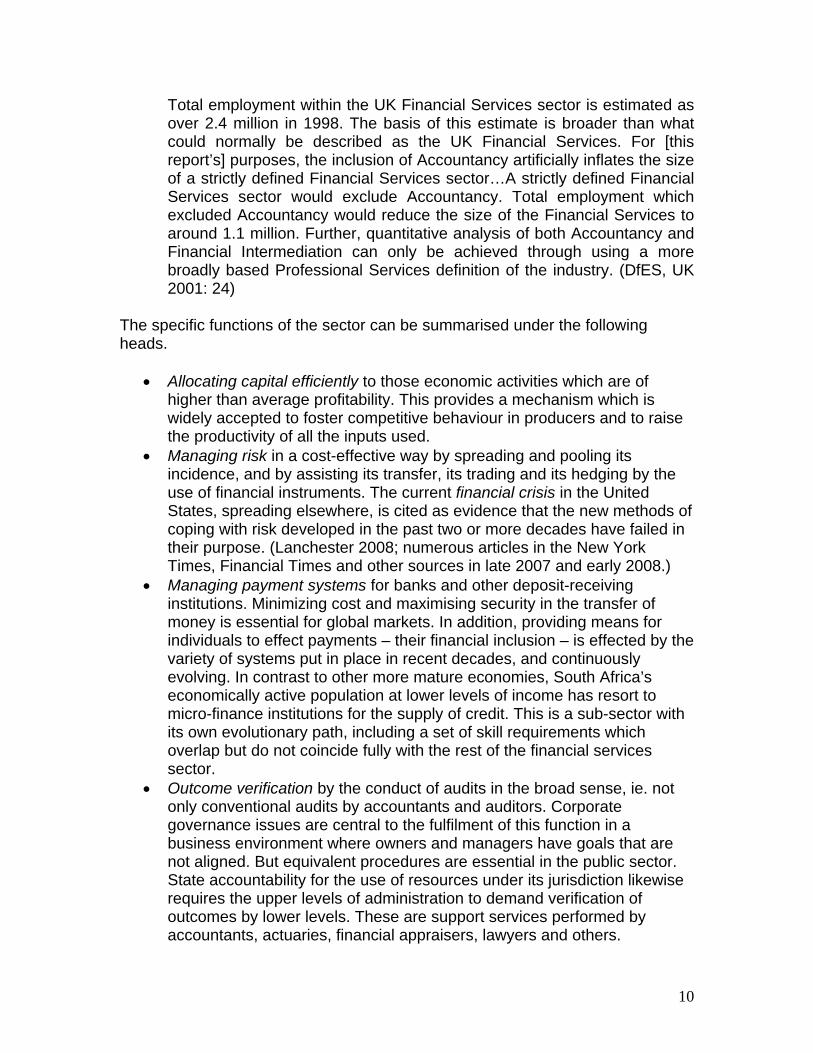
Total employment within the UK Financial Services sector is estimated as over 2.4 million in 1998. The basis of this estimate is broader than what could normally be described as the UK Financial Services. For [this report’s] purposes, the inclusion of Accountancy artificially inflates the size of a strictly defined Financial Services sector…A strictly defined Financial Services sector would exclude Accountancy. Total employment which excluded Accountancy would reduce the size of the Financial Services to around 1.1 million. Further, quantitative analysis of both Accountancy and Financial Intermediation can only be achieved through using a more broadly based Professional Services definition of the industry. (DfES, UK 2001: 24)
The specific functions of the sector can be summarised under the following heads.
• Allocating capital efficiently to those economic activities which are of
higher than average profitability. This provides a mechanism which is widely accepted to foster competitive behaviour in producers and to raise the productivity of all the inputs used.
• Managing risk in a cost-effective way by spreading and pooling its incidence, and by assisting its transfer, its trading and its hedging by the use of financial instruments. The current financial crisis in the United States, spreading elsewhere, is cited as evidence that the new methods of coping with risk developed in the past two or more decades have failed in their purpose. (Lanchester 2008; numerous articles in the New York Times, Financial Times and other sources in late 2007 and early 2008.)
• Managing payment systems for banks and other deposit-receiving institutions. Minimizing cost and maximising security in the transfer of money is essential for global markets. In addition, providing means for individuals to effect payments – their financial inclusion – is effected by the variety of systems put in place in recent decades, and continuously evolving. In contrast to other more mature economies, South Africa’s economically active population at lower levels of income has resort to micro-finance institutions for the supply of credit. This is a sub-sector with its own evolutionary path, including a set of skill requirements which overlap but do not coincide fully with the rest of the financial services sector.
• Outcome verification by the conduct of audits in the broad sense, ie. not only conventional audits by accountants and auditors. Corporate governance issues are central to the fulfilment of this function in a business environment where owners and managers have goals that are not aligned. But equivalent procedures are essential in the public sector. State accountability for the use of resources under its jurisdiction likewise requires the upper levels of administration to demand verification of outcomes by lower levels. These are support services performed by accountants, actuaries, financial appraisers, lawyers and others.
11
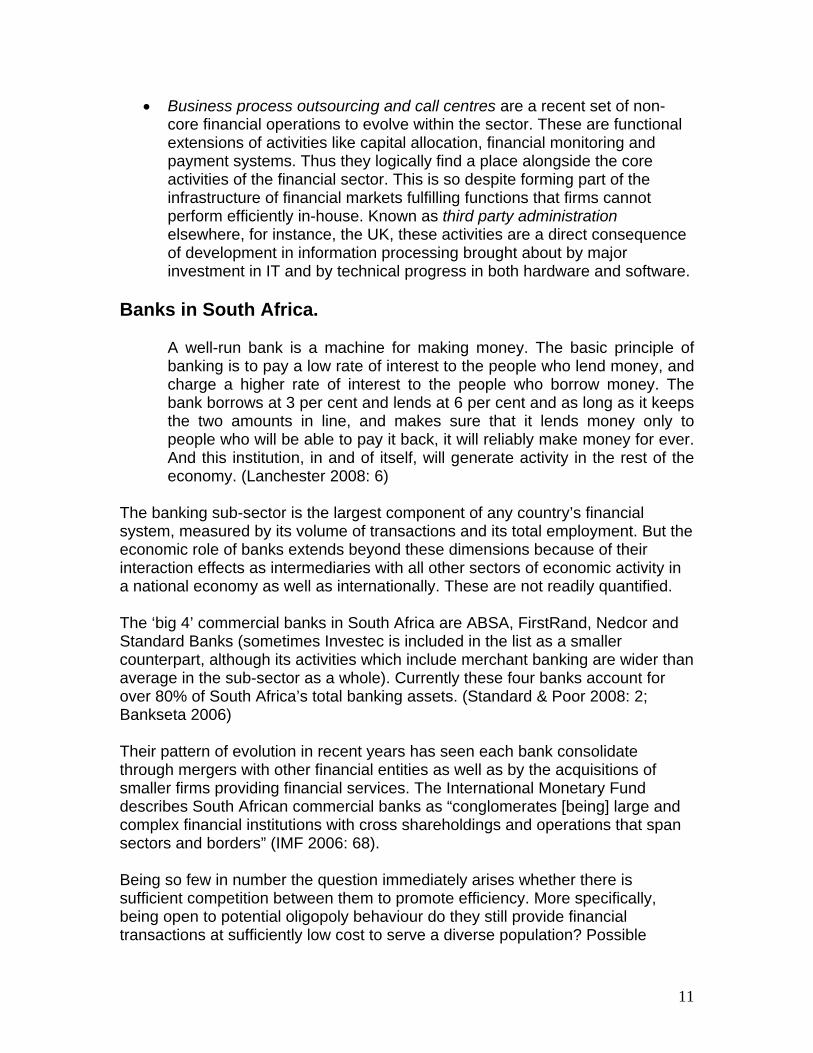
• Business process outsourcing and call centres are a recent set of non-core financial operations to evolve within the sector. These are functional extensions of activities like capital allocation, financial monitoring and payment systems. Thus they logically find a place alongside the core activities of the financial sector. This is so despite forming part of the infrastructure of financial markets fulfilling functions that firms cannot perform efficiently in-house. Known as third party administration elsewhere, for instance, the UK, these activities are a direct consequence of development in information processing brought about by major investment in IT and by technical progress in both hardware and software.
Banks in South Africa.
A well-run bank is a machine for making money. The basic principle of banking is to pay a low rate of interest to the people who lend money, and charge a higher rate of interest to the people who borrow money. The bank borrows at 3 per cent and lends at 6 per cent and as long as it keeps the two amounts in line, and makes sure that it lends money only to people who will be able to pay it back, it will reliably make money for ever. And this institution, in and of itself, will generate activity in the rest of the economy. (Lanchester 2008: 6)
The banking sub-sector is the largest component of any country’s financial system, measured by its volume of transactions and its total employment. But the economic role of banks extends beyond these dimensions because of their interaction effects as intermediaries with all other sectors of economic activity in a national economy as well as internationally. These are not readily quantified. The ‘big 4’ commercial banks in South Africa are ABSA, FirstRand, Nedcor and Standard Banks (sometimes Investec is included in the list as a smaller counterpart, although its activities which include merchant banking are wider than average in the sub-sector as a whole). Currently these four banks account for over 80% of South Africa’s total banking assets. (Standard & Poor 2008: 2; Bankseta 2006) Their pattern of evolution in recent years has seen each bank consolidate through mergers with other financial entities as well as by the acquisitions of smaller firms providing financial services. The International Monetary Fund describes South African commercial banks as “conglomerates [being] large and complex financial institutions with cross shareholdings and operations that span sectors and borders” (IMF 2006: 68). Being so few in number the question immediately arises whether there is sufficient competition between them to promote efficiency. More specifically, being open to potential oligopoly behaviour do they still provide financial transactions at sufficiently low cost to serve a diverse population? Possible

12
collusion on price setting, on the minimum conditions they stipulate for customer access to their products, and on erecting entry barriers to new competitors are what concerns the regulatory authorities and consumer watchdog organisations. Questions of this kind are currently under investigation by the Competition Commission. But in early 2008 the final report in the CC Banking Enquiry is not yet available. It has to be noted also that, contrary to international practice, certain definitions of the banking sector in South Africa include micro-finance organisations. This is clear in the following statement. So micro-finance is treated briefly in this report although the skills issues which characterise this sub-sector are not clear, as will be discussed below.
Most organisations within the banking sector are small and medium-sized enterprises: the majority of stakeholders are micro finance institutions. South Africa has 84 registered banks and about 1600 micro finance organisations currently in the process of registering with the newly established National Credit Regulator. There are 1331 levy-paying organisations registered with the BANKSETA: some 94% are small organisations. These account for only 6% of employment within the sector. (Bankseta 2006: v-vi, 4)
For the present concern, principally with skills problems, the issues that warrant mentioning are those likely to influence the evolution of retail banking in the long term.
• First, there is a history of contention that bank charges in South Africa are considerably higher than similar charges levied by counterpart banks in other countries. This is vigorously denied by the retail banks themselves, so the issue remains unsettled. It is also not easy for interested parties to arrive at a satisfactory empirical answer where comparison has to be between countries whose banking systems do not supply uniform products. (Falkena 2004, Feasibility Report 2006, ABSA 2006).
• Secondly, putting banking into a development perspective, what regulation
by authorities like the Treasury and Reserve Bank is most appropriate for advancing the welfare of our population? Too much control inhibits growth, too little control raises exposure to risk which causes substantial losses to large numbers of people when banks under-perform. This takes place during the declining phases of the business cycle, and most notably where there is a general downturn in financial activity, as is continuing to happen in the US in early 2008. The implications for the financial sectors of the rest of the world including South Africa are unclear, but likely to be negative.

13
• Third, what barriers exist which hold back the extension of banking services to half the South African population who remain unbanked? In the absence of local research results on this question, the international literature provides a list of the barriers identified to inhibit banking outreach and therefore essential to be watched by policy-makers and researchers.
• Fourth, do banks merit subsidies from the state to encourage extension of
services lower down the income profile of individuals and companies? Or are state-financed or state-controlled banks the better option?
• Finally, banks everywhere chafe at regulations, and the South African
industry appears no different (ABSA 2006). This is particularly evident in normal trading times. But policy-makers and outside observers have to ask whether this resistance is justified when there are major disruptions, as at present in most industrial country financial markets. The following quotation expresses a representative attitude by the banking industry. This [Regulatory Working Group] is a reflection of a wide-spread concern among our sponsors and friends that the tide of ever-more intrusive micro-regulation has become irresistible, and that it is starting to do serious damage both to the financial services industry [globally] and to the City of London. We are not alone in this view; nor is our Group the only one out there. (Centre for the Study of Financial Innovation, London 2006: 3)
Each of these themes examined even briefly will deepen understanding of the challenges that face contemporary banking in a South Africa characterised by persistent economic dualism. Most producers and consumers in the formal economy use bank services that are equivalent in sophistication to the norm in industrial countries (Falkena 2004; Feasibility 2006). Yet large numbers in the economically active population, not only those in the informal sector, remain unbanked like their counterparts in many developing countries. Mexico is a convenient example of the consequences of only partial banking access for the welfare of the poor.
Financial instruments are an essential consumption-smoothing technique for low-income households, particularly in rural areas with high risk levels associated with agriculture…During most of the 20th century, the Mexican financial system suffered from financial repression that was manifested in numerous ways, including credit targeting, interest rate ceilings, credit quotas, subsidization and negative real interest rates during inflationary periods. The lack of financial market penetration is particularly pronounced in rural areas of Mexico where poverty is widespread. (Paxton 2007: 57)
South Africa’s history is different for multiple reasons, not least due to apartheid’s skewing of land-ownership on grounds of race. But the failure of private financial institutions to penetrate rural areas in this country for most of the 20th century

14
parallels that of Mexico and numerous other middle income countries. One projection two years ago is that “Conservatively estimated, 60% of low-income groups and 80% of the lowest income groups are without access to banking services [in South Africa]”. (Feasibility Report 2006: 37) So it is no surprise that one major component of local economic policies post-1994, aimed broadly at redistribution and development as a counterpart to political change, should be a major drive to extend financial services to the lower half of the population on the income scale.
The lack of a transparent (and unbundled) price guide for consumers and the lack of an independent banking adjudicator to which consumer complaints can be directed has contributed to the apparent consumer resistance to high banking fees [in South Africa]. In a country where there is considerable political pressure to improve the access of under-served consumers to financial services, the absence of these features is likely to be particularly keenly felt. This is an important consideration in improving the fairness of the existing [banking] landscape. (Feasibility Report 2006: 29)
The question whether banking costs to private consumers and small businesses are out of line with international norms because they are higher in South Africa is clear enough but the answer is not. The two reports utilized by the Competition Commission in its enquiry into the state of competition in South African banking are deliberately cautious in their conclusions. Because it is contentious the following points convey the flavour of what is at stake in drawing conclusions about welfare and policy innovation. First, profitability by some measures, like rates of return on equity (ROE), is high in South Africa but not the highest by country in international comparison. Thus it may not be the simple outcome of a lack of competition. Second, strong profitability in banking may be essential for stability, more so than in other industries because of the role played by banking in any economy; what is termed its systemic importance. Third, what is significant are excess returns, calculated after subtracting the cost of capital from a measure of profitability like ROE. If the cost of capital is disproportionately high in a national economy, for whatever reason, then profitability has to be high too in order for banks to stay in business. Fourth, it follows that excess returns might be a reflection of lack of competition. But given the strategic importance of banking in the economy as a whole such returns might be considered a necessary cushion for banking industry stability. (Falkena 2004:153; Feasibility Report 2006)

15
So, concerning the general question of bank charges that may constitute a barrier to the extension of services to the remaining, unbanked half of the population, there is no clarity to report at the time of writing. The Banking Enquiry conducted by the Competition Commission is scheduled to report later in 2008. That document may throw more detailed and more definite light on the magnitude of costs to clients of the banking industry. Turning to regulation of banking, there have been changes in South Africa in recent decades but the details are peripheral to the present concern with skills issues. But what needs reminding is that regulation is a policy art not a science. Too much regulation is an obstacle to competition - and therefore efficiency – as well as a brake on growth. Too little regulation runs the risk of financial contagion. This is the domino effect of bank failure to repay borrowings in the interbank loan market where such lending is integral to the conduct of the industry. Contagious defaults occur if the losses on the exposures to the defaulting bank exceed the capital of a creditor bank. Every default weakens the surviving bank, which can lead to a cascade of bank failures. Other causes of contagion include a banking institution’s inability to meet obligations in payment systems and securities settlements. But the most prominent cause of contagion is high waves of deposit withdrawals or bank runs. (Upper 2007) At the time of writing in early 2008 we are seeing contagion spreading in the United States financial services sector. In the UK in the high profile case of Northern Rock, as well as in France and Germany, the financial authorities in recent months have rescued individual banks subject to bank runs. We say more about this below. In summary, regulation of the banking industry comprises a selection and mixture of the following categories of policy action in any given national economy. • Minimum capital adequacy is prescribed for banks by the central bank; locally
this is the SA Reserve Bank. In 2008 South Africa is publicly committed to adopting the Basel II Accords on international standards of capital provision against the financial and operational risks faced by domestic banks.
• Credit controls on individuals are instituted to protect the consumer against over-indebtedness. That these are controversial is no surprise in developed economies, but much less so where average levels of formal education in the population are low as in all African countries, including South Africa’s rural areas and informal economic sector.
• Deposit insurance is compulsory in that, in the event of bank failure, depositors receive their deposit investments back. But in some national jurisdictions the amount insured is not necessarily 100%, but a lesser percentage of individual deposits above a set threshold.
• There are stipulations that banks supply customers with minimal price transparency concerning their charges like service fees, minimum balances and penalties.

16
• Transactions costs are minimized by regulation, like the cost of buying a house and registering a mortgage bond, as well as the cost attendant on enforcement procedures in the case of defaults. If not regulated, transaction costs independent of the size of the transaction – whether deposit, loan or payment – inhibit banking extension because they make outreach costly to clients with demand for small and frequent transactions.
• The monetary authorities set maximum interest rates that may be levied by banks at any time, as under our Usury Act. But not all national jurisdictions contain maximum limits on interest rates.
• Government ownership of banks is in certain respects a substitute for regulation of private banks. But there is no evidence that government ownership means lower restrictions on horizontal expansion of banking services to poor individuals and SMMEs. This is contrary to conventional wisdom, but empirical data do not show lower access barriers stemming from higher levels of government ownership in national systems. (World Bank 2006B; Ide, Hoj & Lenain 2007; Beck & Others 2007)
This brief survey shows that certain questions of strategy arise out of the literature on the regulation of banking in a national economy. These are summarized here because either all or a sub-set are highly likely to apply to the South African banking industry. Until the required research is conducted we cannot say more.
(i) Regulation can have the unintended consequence of increasing entry costs for new providers of services, in other words, new banks or deposit-receiving institutions. This depends on the types of regulation applied by authority and the penalties for non-compliance.
(ii) There is evidence that “it is reliance on private monitoring rather than regulatory restrictions and official supervision that foster financial development and efficiency”. (Beck & Others 2007: 30) This is contentious because it is a conclusion welcome to the industry.
(iii) If result (ii) is correct, it opens the difficult question whether private monitoring by the banking industry itself is amenable to policy encouragement? What carrots and what sticks promise to do the job? This is particularly pertinent when the banking infrastructure in place is immature. This is when the national system of banks collectively contains – by international norms - few branch banks and cash machines, only partial computerized access to services, where there is low media attention to financial matters, limited freedom to publish, and a political culture accepting that what is deemed beneficial to large business organizations is beneficial to society. These are not variables easy to identify in a national economy.
(iv) Big banks are contended to be unfairly advantaged by regulatory provisions that require more sophisticated risk measures and therefore a more skilled work-force. Basel II lays down standards for best-practice risk management. While the outcome of adopting Basel II

17
promises to be positive for established banks, like easing their entry into global markets, and it should reinforce the stability of the system, it may have the negative effect of handicapping new banking entrants and thereby inhibit more competition.
(v) One complication which has to be recognized is that in numerous countries “these barriers are likely to result from the rational business decisions of financial institutions taking into account their business model and the environment they work in, [so] it is important to understand which bank and country characteristics explain variation in barriers across countries and across banks”. (Beck & Others 2007: 32) Local South African research is unlikely yet to disentangle these determining characteristics.
(vi) A final strategic consideration, already alluded to in passing, is that banking regulation is believed to stand in a trade-off relationship with development goals, of which outreach to financial services is one. But the forces at work are highly complex, as argued above. One more illustration is that there is evidence that the absence of regulations that protect investors can be an effective barrier to the creation of new limited liability firms. Expansion of these ventures is an integral component of the development process. (Klapper & Others 2006) Hence no a priori formula for efficient regulation is available to the South African authorities responsible, the Treasury and Reserve Bank. This remains one of the major decision problems in current policy formation.
A summary statement of the issue is helpful, as besides the regulatory challenge it brings out the intensive use of skills entailed in the conduct of regulatory policy. This component of skills demand in the sector is easily overlooked.
South Africa has a complex, dynamic and innovative financial industry, thus skilled consolidated supervision and substantial resource availability is a constant imperative for regulatory adequacy. The financial system is sophisticated with complex legal, financial and business relationships among the various parts of the banking groups and substantial cross border operations. The SARB supervises the banking groups on a consolidated basis, but it has to constantly upgrade its regulatory framework to address emerging risks due to the complexity of the ownership structure and operations, the concentration of the sector, the global reach of these banking groups and constant product innovation. This, therefore, places heavy demands on the supervisory resources. (IMF 2006A: 82-3)
18
The insurance industry in South Africa. Like the banking sub-sector, insurance activities in South Africa are conducted by a distribution of organizations that is bi-polar, being a small number of large firms and a large number of small firms, some with annual payrolls of R half-million or less. At present 4 000 contributors pay the skills development levy and employ an industry workforce of 102 000. Yet we do not know how many small operations fall through this net, because “estimates of the number of very small and independent intermediaries differ vastly.” (Inseta 2006: iii) Is the South African insurance industry competitive despite evidence of a high degree of concentration by comparative international standards? Does it serve the whole population with acceptable efficiency? Does it contribute to the redistributive goals of economic policy in general? These illustrate the questions about this sub-sector which must be aired in the present national context for economic policy. The answers remain tentative in the current state of financial sector research, but the issues need to be stated with clarity. What is the role of the insurance industry in a national economy? (FSSC, UK: 2007; Hartmann & Others 2007; Inseta 2006; DfES 2001) Insurers offer economic decision-takers protection against risks and the consequences of such risks. Customers buying insurance policies are covered against injury or loss, the probability of which is calculated by the insurer – usually actuaries with specialized skills for the purpose, as discussed below – on the basis of quantitative models derived from historical information and insurers’ experience of the market. A premium or fee is assigned to the insurance policy, so that total premiums received will at least cover the total expected claims of the insured person or organization. By this process the risk of loss is transferred from customers to the insurers, who have the capacity to manage it in a more efficient way by pooling risk and spreading it over a group of similar policy-holders. Given the large range of risks that individuals or companies seek to protect themselves against, there has been in recent decades in the international industry a corresponding rise in the types of insurance for which markets exist. The major divide is between life insurers devoted to long-term risk and investment management, and short-term or general insurers. This terminology differs between countries but the activities conducted by each type are the same. Life insurance companies offer financial protection or death cover in the event of an individual’s early death to those dependent on such a person’s earnings. They also offer pension funding which ensures that people have a steady and adequate income after retirement. By contrast, general insurance also offers protection against the occurrence of low probability events with significant consequences, like premature death, but

19
the direct losses are usually material in nature. Fire insurance for a house, motor vehicle insurance against accidental damage, property insurance against theft, damage insurance against natural events like flooding, all these are standard examples of short-term insurance transactions. What they have in common is the scope created for individuals and businesses to provide against high-impact events. Thus it facilitates personal and organizational planning by eliminating part of the uncertainty unavoidable in anticipating the future. A further category of insurance product becoming more specialized over time is health care. Insurance protection provides claims for ensuring access to medical services as well as a source of income in the event of illness, injury or any other event which would otherwise cause a disruption of economic activity and therefore loss of income for an extended period. A final characteristic of insurance as a financial services sub-sector is its growing dominance of the pensions industry. As institutional investors, insurance companies like Old Mutual and Sanlam in South Africa are also active participants in corporate governance. Because of their large size, they can demand alignment of the interests of managers and owners like themselves in the conduct of business corporations. In other words, they can force the pursuit of goals like stability alongside profitability, as well as the growth of the institution’s assets to which management remuneration is usually tied. As providers of risk management advice, they can reduce the direct and indirect losses to companies, persons and the general public that are the consequence of over-ambition, faulty projections and outright failure. An equivalent South African figure is not available, but in the UK the insurance industry when viewed as an aggregate institutional investor, controls 17 per cent of all investment on the London stock markets. (FSSC, UK 2007: 17) One of the main effects of institutional investors from an economic perspective is that they constitute a concentrated ownership structure. It is characterized by controlling share-holders, that is, large institutions holding blocks of shares, weaker securities markets, high private benefits of control to institutional share-holders, and lower disclosure and market transparency standards. These are not issues directly pertinent to this report but they demonstrate that insurance companies, by their very large investments of life insurance premiums, pension contributions and short-term insurance premium inflows can exert considerable influence on corporate governance. The implications are more directly relevant to the gate-keeper or watchdog role played by accountants and auditors as professional groups within the financial services sector. This is raised below. Projecting skill needs in the South African insurance industry is discussed in a later section of this report, but certain general observations about insurance as a financial service packaged and sold in various ways to meet a range of needs is a useful preliminary to examining skills issues. One unambiguous example of the

20
challenges that face this industry globally is because of climate change. Signs of atmospheric and oceanic warming exist in the present as well as on the horizon in ways difficult to project on risk grounds. But in general, insurance providers will be under pressure to provide cover through developing new kinds of policies under the high expectation of losses through natural events. Insurance does not decrease loss from an unexpected negative event, but it spreads the financial impact by enabling individuals and groups at risk to pay a small premium in order to protect themselves against a large loss that has a low likelihood of taking place. Catastrophes that occur on a national scale are usually considered the state’s responsibility. Hurricane Katrina is a case in point. The Bush Administration in the United States was widely criticized for its delayed response to the disaster. But no-one seriously questioned its responsibility for rendering assistance to the victims who suffered death, health and material losses. What is potentially new about a rise in the probability of catastrophic loss through climatic disasters in the future, is whether the state in affected countries will continue to be seen as bearing sole responsibility for relief? It uses resources generated in the public sector, and hitherto its obligations have not been questioned. But if private individuals make choices and decisions which raise the likelihood of themselves suffering damage from natural hazards, will efficiency and equity considerations require them in the future to bear a share of the cost of loss? The building of private homes and industrial structures close to sea levels and in fire zones are simple cases in point. Should this predicted change in the conception of responsibility occur, the role of the insurance industry will expand even more to provide protection against extreme weather-related events. “Catastrophes have had a more devastating impact on insurers [globally] over the past 15 years than in its entire history.” (Kunreuther & Michel-Kerjan 2007: 5) Private decision-takers will be expected increasingly to use markets to offset risk. An entire industry is likely to arise for modeling climatic events, estimating the risks of damage, the costs of damage and the liabilities incurred by insurers. This is happening already in the United States and Europe, but not yet on a significant scale in South Africa and developing countries. For instance, Thailand suffered catastrophic loss of human life and material damage through the tsunami of 2004, yet the liabilities shouldered by the insurance industry, nationally and globally, were small. A second trend, weaker than climate change in impacting on insurance but providing a potential boost for the growth of the insurance industry and thus its demand for skilled human capital, is the high rate of urbanization and the large movements of people into, as well as within, the Southern African region. National governments currently react to these phenomena on a range of political and economic grounds. But there are persuasive arguments that the private sector will become pressured to participate on a greater scale in the construction

21
of infrastructure, the provision of facilities like transportation, and the management of services to the population. For the present, this is speculative rather than research-based. But the implications of such a trend for the insurance industry would be profound. Accountancy and auditing as services. By general agreement the skills shortages identified under this sub-sector are the most prominent and widely accepted. This appears to mimic the world-wide inadequacy in the supply of trained accountants and auditors. (International Federation of Accountants: IFAC 2007) Thus the constrained numbers identified as chronic in the South African profession of accountancy is by no means unique. Yet student numbers on a world scale – chartered accountants in this illustration - have been growing spectacularly in the past five years: see Table 5. Why has supply not caught up with demand so that the gap appears structural in nature? This question is not answerable for South Africa in the present state of research, but is addressed below in the section on training in the accountancy field. Any description of the accounting and auditing sub-sector in South Africa will bring out yet again a characteristic of financial services activities, namely a bi-polar distribution by size of enterprise. The Big Four accounting firms have been in place in the country for many years (PriceWaterhouse, Deloittes, Ernst & Young, KPMG), although under other names before the succession of mergers that took place over time. In addition there are a substantial number of medium firms and SMEs which supply either the full range or a sub-set of auditing services to the national economy. What is clear is the high regard internationally for the South African profession’s “Strength of auditing and reporting standards”. In this it ranks number 6 in the world out of 131 countries, scoring 6.2 against a mean for the entire sample of 4.7. It is topped by the five countries of Germany, Sweden, UK, Australia and Austria. (World Economic Forum 2007: 391) There may be difficulties in the methods of calculation and the comparability of data in such exercises, but there is no evidence that measurements of this kind, qualitative as well as quantitative, are systematically biased and therefore questionable as comparisons. Thus the annual calculations in the Global Competitiveness Report are described and justified with care, based on publicly available information and an “executive opinion survey”. (Sala-i-Martin 2007; Porter 2007) The following generalizations apply to the accounting and auditing sub-sector of the financial services sector at the time of writing in early 2008. Most of these are shared with the international profession, but some are caused by uniquely South African circumstances.

22
• The large and medium-sized firms continue to increase the weight of their advisory and consultancy services – in contrast to auditing services – in their total activities. (Financial Reporting Council UK 2007; Cunningham 2006; Boyd 2004A & B) This issue generated public debate and wide consideration following the US accountancy scandals and the disappearance of Arthur Anderson, then one of the Big-5 amongst world accountancy firms. It led directly to the passage of the Sarbanes-Oxley Act of regulation in 2002. Non-US firms are not subject to this legislation when they operate outside the US, but its influence on international accountancy practice is undeniable.
Table 5: Numbers of students registered worldwide with the chartered accountancy institutes from 2000 to 2005 ACCA CIMA CIPFA ICAEW ICAI ICAS Total 2000 174,201 73,761 2,213 10,727 2,789 1,652 265,3432001 185,392 75,263 2,322 10,114 3,008 2,080 278,1792002 205,099 77,923 2,484 9,648 3,392 2,327 300,8012003 221,261 81,590 2,782 8,694 3,000 2,431 319,6832004 240,741 84,868 2,954 8,910 3,167 2,497 343,1372005 260,644 86,565 3,194 10,406 3,880 2,636 367,325% growth (00-05)
49.6 17.4 44.3 -3.0 39.1 59.6 38.4
% compound annual growth (00-05)
8.4 3.3 7.6 -0.6 6.8 9.8 6.7
Source: Accountancy Occupational Standards Group (2007:3)
• Firms are subject to a complex mixture of regulations, some by the state
and some by their professional associations. This is ongoing. • The main drivers of change are regulation, competition that is domestic
and international, and technology through the extension of processes and communications uses of computerized information.
• An erosion of trust between the public users of accounting and auditing services, like companies, governments and other organizations, and the professionals providing the great range of financial services now on offer.
• There is world-wide concern about auditor concentration – a small number of extremely large firms contributing the vast bulk of service output – which is believed to limit competition and potentially compromise independence. Conversely, there appear to be substantial economies of scale in auditing, and wide international networks of accountancy services require significant investment. (International Audit Networks 2006) How this trade-off relationship is best solved remains to be decided.
• Accountancy and auditing are uniquely mobile activities for professional employees, particularly those trained to meet qualification standards for
23
which there is a major drive towards uniformity in international markets. (FSSC, UK 2007; IFAC 2007; Fasset 2007)
• Similarly, the vast majority of national professional associations identify human capital problems as their most pressing. (IFAC 2007)
• Technological change in general has reduced the demand for conventional accountancy services as functions previously carried out manually can now be performed by the appropriate soft-ware. This inhibits job creation within the profession but in complex ways not easily identified as trends.
• In South Africa, sector charters governing black advancement straddle financial services but particularly so in accountancy activities. As discussed below, it is the shortage of black professionals with the required qualifications which constitute the largest shortage in accountancy, auditing and – as regards managers in particular - the financial services sector as a whole.
• It is easy to forget the demand for accountancy skills coming from the public sector. “South Africa has 37 government departments and 284 municipalities. Government departments in particular need about five chartered accountants each. They are presently nowhere near that number.” (SAICA, quoted in Johnston & Bernstein 2007: 20)
• A current regulatory proposal in early 2008 is for a Financial Reporting Investigation Panel to be set up in South Africa as a new regulatory watch-dog for the financial services sector. Perception of skills shortages has generated skepticism about its staffing to the level required for efficiency. The JSE, analysts, the big four auditing firms (PricewaterhouseCoopers, Deloitte, KPMG and Ernst & Young) and even the GAAP (Generally Accepted Accounting Standards) Monitoring Panel are in the dark as to how the government will find professionals to monitor financial reports released by companies daily. The interims, annual reports, prospectuses and circulars released by companies are not documents just any person can understand, Prof Harvey Wainer, chairman of the GAAP monitoring Panel has pointed out. Usually it is a chartered accountant who will pick up where a company has issued misleading or inaccurate financial information. (Business Day, 15 February 2008)
Micro-finance. South Africa has a large and expanding sub-sector engaged in microcredit or lending to the poor. It is most accurately described as spanning the spectrum from formal to semi-formal to informal in its institutional characteristics. Generally speaking, the set of local sources of micro-finance mimics the international pattern, although with varying success between the sources. These services are provided by three kinds of institutional sources.
• Formal lending institutions, like commercial banks and cooperatives. • Semi-formal sources, such as non-governmental organizations (NGOs).

24
• Informal sources, such as money lenders, shopkeepers, cooperative groups and small loan providers run on semi-commercial lines.
On paper, practitioners are subject to a set of regulations to protect borrowers and inhibit excessive risk-taking. But in practice it has proved difficult in all developing countries to enforce such provisions. It follows that estimates of the magnitude of this set of activities in any national economy can be subject to wide variation, as the following assertions illustrate about South Africa. About 95 percent of some 16.4 million poor households and unbanked South African citizens have little or no access to institutional financial services, yet according to Paul Hanratty: Managing Director, Old Mutual, a Stokvel fund tripled to record R33 billion in the past decade and is classified as “grey money”…Grey money consists of funds held by savings clubs such as stokvels, that circulate outside of the formal financial system. [This money is] part of the non-traditional savings now fast approaching the R1 trillion mark. In South Africa, government as the policy maker and formal financial institutions recognize that providing efficient microfinance services for this segment of the population is important for the following reasons.
• Poverty eradication and employment creation strategy thereby enhancing AsgiSA initiatives;
• Microfinance is an enabler for the poor and low-income earners to actively participate in and benefit from the development opportunities which the country is realizing…;
• Microfinance is the key to empowerment of microenterprise and poor women (providing working capital) who make up a significant proportion of the poor and suffer disproportionately from poverty especially in the rural areas, to access procurement within medium and large companies as required by the Financial Sector Charter. (Madav & Others 2007: 3)
These are ambitious undertakings, difficult to assess on grounds of realism. This is so because the evolution of microfinance success in other countries is more and more widely recognized even if the reasons for success rather than failure remain controversial. For the purpose of this report, more discussion of microfinance is deferred to the section on skills issues below. But in the light of the international trends in this sub-specialised activity of financial services, it is easy to predict that major developments will be taking place in the domestic economy. The following passage provides an indication of the global size of the phenomenon.
Originally a small-scale, philanthropic movement to provide credit to the neediest, microfinance has grown enormously in recent years and is now firmly established as a major supplier of a wide range of financial services to millions of people around the world. The 1,200 microfinance institutions (MFIs) who report to the Microfinance Information eXchange (MIX) have

25
53m borrowers and 64m savers, and numbers are growing by 25 per cent a year, more in some countries. Total assets of these MFIs amount to $53bn. However the sector is also undergoing great structural changes. Its success is attracting large volumes of outside investment, both official and commercial. According to research by the Consultative Group to Assist the Poor, the stock of foreign capital investment in the sector more than tripled to $4bn between 2004 and 2006, much of it held by specialized microfinance investment vehicles, and much of it coming from the private sector. (Centre for the Study of Financial Innovation 2008: 6-7)
In South Africa, Mzansi was introduced as a low-cost bank account in October 2004 by the Banking Association. It was endorsed by the four major commercial banks – Standard, First National, Absa and Nedbank - as well as by Post Bank. It is claimed to have been a major success in the interim, with a large proportion of account holders graduating to new accounts and access to wider services in commercial banks. At the end of February 2008, the total number of Mzansi accounts opened was 5 119 219, and the number of accounts closed was 568 929, “resulting in 4 550 290 Mzansi accounts that are open across the industry at present.” (Aart Juriaanse, Banking Association, personal communication, 21 February 2008) One looming issue in this sub-sector, with the potential to generate considerable controversy in South Africa, is the acceptability of microfinance institutions founded with a characteristic set of values and goals evolving into business organizations dominated by the goal of profitability. In Mexico currently this issue is evoking serious disagreement. At base it is the old dilemma in the choice between efficiency – lower borrowing and operating costs for large micro-lenders pursuing profits – and equity. Organizations that lend amounts as small as $50 require more labour to service such loans, which push up the charged rates disproportionately on such small amounts. This is not so with large profit-seeking micro-lenders like Compartamos in Mexico, which made profits of $80 million last year. Yet it started life as a “non-profit”. (New York Times, 5 April 2008) Asset management and financial consultancy. Financial advice for the purpose of this report includes all activities involved in the distribution for sale of financial services as products sold to the public, and includes the management of investments in financial assets for the benefit of a client community. Services sold are in the form of information and guidance supplied directly either [A] by providers themselves, like banks, insurance companies and pension funds, or [B] by independent advisers and asset managers (known for example in the UK industry as IFAs, independent financial advisers). Group [A] are excluded from this sub-sector because they form an

26
intrinsic part of the activities of banks and insurance companies treated as separate sub-sectors. These distinctions make discussion in this report more manageable. But one difficulty for the analysis of skills questions is that asset management and financial advice do not fall within the purview of any single Seta. Identifying the skills needed for fulfilling these occupations, and therefore the forces influencing demand and supply, has to be on general grounds culled from the international discussion. There are no estimates of skill gaps or skill shortages that apply in local occupational markets to these activities. The intention of this theme in the report is to bring into perspective a set of skill requirements, particularly for independent financial advisers (IFAs), destined to become more important as the development of South Africa’s financial services sector becomes deeper. This is the inference plausibly drawn from the history of financial development in industrial countries. The providers of differentiated investment vehicles are commercial or retail banks, insurance companies and a wide range of financial organizations. Allan Gray, Cadiz Holdings and Citadel are well-known examples locally. Many, perhaps most, practitioners also manage investments for their clients on a fee basis. Because the average individual consumer, business and other investing institutions are faced with increasingly complex financial decisions, these services – advice and management – are acquiring wider markets and greater unit value. Acting both as a distribution channel for financial products and services that are constantly evolving, and as sources of guidance on personal and business finance, advisers and managers are instrumental in making financial services more readily and securely available to business and the general public. In the South African economy, as elsewhere in certain industrial countries and in those labeled emerging market economies, there is ongoing concern about savings and pension gaps. Not only is the average individual living longer and therefore in need of higher post-working age income, but in some national contexts there is asserted to be evidence of “a record number of individual insolvencies” occurring currently. (FSSC, UK 2007: 26) If true, in these circumstances the provision of high quality financial advice is a precondition for sustaining economic stability and prosperity. This observation forms part of the justification in analyzing skills supply difficulties as comprehensively as possible in South African occupational labour markets. Asset management and financial advice compete for similar competencies with every other major sub-sector like banking, insurance and accountancy. It is easy to predict as well that ongoing product differentiation in financial services will intensify the information problem in the entire sector. This is discussed at greater length in the conclusion to this report.

27
Skill demand issues in the financial services sector as a whole. There are demand and supply issues pertaining to the whole financial services sector or footprint, which will be discussed first. Then each of the main sub-sectors examined in the previous section of the report face specific problems and opportunities in the recruitment of skilled labour by employers. In principle the public sector, comprising the different levels of government, should be examined separately. But because the main skill deficiencies that the state faces are in accountancy and, to a lesser extent, actuarial services, the relevant discussion will take place under these job title and occupational headings. To keep the treatment brief, the observations and themes regarding skills that can be generalised for the sector as a whole are summarized and presented in serial form.
• Financial Services as a sector uses a proportion of skilled labour nearly double the average for the economy as a whole. This is consistently the case for the 11 year period in Table 6, if the mix of Financial Intermediation, Insurance, Real Estate and Business Services in the table is accepted to be a reasonable proxy measure of the range of activities covered by this report.
• A snapshot view of skills training can be misleading. Firms, particularly small businesses, demand skills and train according to their current need and are influenced by their financial position. Thus, the level of their training activity can be measured only over a period of time. At the aggregate level – for an industry or sector – this problem may be less serious because above and below average training intensity may cancel each other out. But this depends on an unknown distribution across firms and other training organizations within the set of activities being investigated. (Cosh & Hughes 2003)
• All demands for skilled competencies are derived demands. Together the composition of output, the scale of output, and the technology in use that determines the mixture of inputs so as to maximize profitability determine what kinds of skilled and unskilled labour are required for efficient production. An organisation’s product strategy will reflect these influences yet this dimension of the skills problem tends to be overlooked in discussion of skills deficiencies.
The Leitch Review of Skills in the UK is explicit in drawing attention to the role played by management in the use as well as training of needed skills.
Skills are a derived demand: employers’ skills needs are a consequence both of their product strategy and the firm’s characteristics. Management is a key determinant of an employer’s product or service strategy and whether skills are used effectively. The quality of management and

28
leadership varies both between and within sectors. Comparative research on a wide range of best management practices in manufacturing firms in the USA, UK, France and Germany has shown US firms to be the best managed and UK firms to be the most poorly managed. In addition, a low proportion of employers in the UK with managerial staff provide training for them. (Leitch Review 2006: 52)
Table 6: Skills Breakdown of Employment by Sector, 1995, 2004 & 2006. Year Skilled Semi-
Skilled Unskilled Total
1995 0.01 0.22 0.77 12004 0.05 0.42 0.53 1Agriculture, Hunting, Forestry and
Fishing 2006 0.04 0.48 0.48 11995 0.07 0.74 0.18 0.992004 0.07 0.8 0.12 1Mining and Quarrying 2006 0.07 0.74 0.19 11995 0.12 0.68 0.19 12004 0.17 0.64 0.19 1Manufacturing 2006 0.15 0.65 0.20 11995 0.18 0.67 0.13 0.982004 0.39 0.5 0.1 0.99Utilities (Electricity, Gas and Water
Supply) 2006 0.28 0.65 0.07 11995 0.09 0.71 0.19 12004 0.09 0.68 0.23 1Construction 2006 0.08 0.71 0.21 11995 0.17 0.64 0.2 12004 0.14 0.56 0.3 1Internal Trade 2006 0.15 0.54 0.31 11995 0.26 0.62 0.11 0.992004 0.23 0.62 0.14 1Transport, Storage and
Communication 2006 0.21 0.66 0.14 11995 0.38 0.56 0.06 12004 0.39 0.5 0.11 1
Financial Intermediation, Insurance, Real Estate and Business Services 2006 0.39 0.51 0.10 1
1995 0.45 0.39 0.15 0.992004 0.5 0.35 0.15 1Community, Social and Personal
Services 2006 0.49 0.38 0.13 11995 0 0.02 0.97 12004 0 0 1 1Private Households 2006 0.00 0.01 0.99 11995 0.2 0.48 0.31 0.992004 0.22 0.48 0.3 1Total 2006 0.21 0.50 0.29 1
Source: Oosthuizen (2005: 19), updated by Carlene van der Westhuizen, DPRU, 2008.
29
• There are distinct dangers if countries liberalize their financial systems rapidly without putting in place sufficient regulatory and supervisory infrastructure and without training a sufficient skills base. This is documented in the international literature, and was demonstrated by a speculative bubble and breakdown in an economy even as sophisticated in institutions as that of Sweden during the 1990s. The crisis in Sweden was preceded by the rapid expansion of credit following the deregulation of financial markets; in the span of five years, private borrowing grew from 85 to 135 percent of gross domestic product. Sheltered prior to liberalization, Sweden’s financial system did not have a base of skills or experience for assessing and evaluating risks. As a result, credit was used for speculation in real estate and other financial assets. At the peak of the crisis, bank loans to real estate, or collateralized by real estate, accounted for more than 60 percent of all loan losses. The real estate speculation in Sweden culminated in a bubble that burst in 1990-91. (Pomerleano 2002: 2)
• In any national economy, the distribution of product strategy choices by enterprises is likely via associated demands for skills to have substantial effects on the incentives for skill acquisition within that country…This approach would do justice to the empirical reality of enterprises searching for profitable product strategies and progressively learning over time what complementary investments (eg, in skills formation) are needed to make a success of particular strategies. (Mason 2004: 45-6)
Applied to the production of financial services, this observation makes it clear that analysis and policy formation cannot concentrate attention on skills training motives and incentives alone, to the neglect of other strategic decisions by firms, governments and non-profit organisations. There is no scope in the present report for summarizing the international literature, but attention needs directing to the role that management of skills production and use plays in every organization. A focus on the investment decision by employer and employee is inadequate for understanding in policy formation. Much South African discussion of skills issues is too narrow for this purpose.
• Broadly speaking, South African skills forecasting is conducted by individual firms in workplace skills plans (WSPs) and by Setas in sector skills plans (SSPs). This information is an essential component in the understanding of demand for skills by occupation and qualification, and it is drawn upon in a section below in the discussion of skill needs in individual sub-sectors like banking and insurance. But what is equally informative and important is a focus on the adaptive capacity of skills providers. For example, “[We] should learn to measure and reduce the response times needed for the development of new provision to meet new and future needs…Taking employers and their current needs at face value
30
is not the way forward…Skills policy must be centred on building capacity to improve responsiveness to the needs of the individual and of business. Adaptive capacity would be about equipping [providers] at the point of interface with employers with the skills to help employers articulate their needs, accepting that it is an imprecise discipline…” (Davis & Kewin 2007: 25-6) The suggestion is not to displace forecasting but to supplement it with alternative tactics to produce information conducive to the encouragement of skills investment by employers and employees.
The key influences on the financial sector’s expansion, contraction or structural alteration are the following.
• The macroeconomic context is of particular importance. Financial services are integrated within every sector of the economy, as outlined already. Stability together with growth have been symptoms of major success in South Africa’s economic fortunes since the political changes of the early 1990s. Despite relatively high population growth in recent decades, but with a rate now probably in decline, GDP per capita has shown marked gains. Poverty indicators have declined in parallel, although less than desired by politicians and anticipated by civil society organizations.
But whether the future prospects for the Financial Services sector will continue to remain favourable is not possible to say. There are current worries about the slowdown of the US economy which is highly likely to impact on middle-income countries like South Africa as well as the rest of globally-linked economies. Already months ago the Economist provided a perspective on the recent past for the wide-spread doubts about a smooth recovery for the global economy.
Since the 1970s, the [different national] central banks’ record has been remarkable. A generation ago, inflation around the world was high and variable. Now, by and large, it is low and stable. That has helped to foster steady growth. Central banks have done more than enough to justify the argument that monetary policy should be run by technicians rather than by elected politicians – an astonishing achievement in a democratic age…Nevertheless, the past couple of months have demonstrated the limitations of central bankers and financial supervisors (they are not always under the same roof). This is so in at least three respects: monetary policy, economic modelling and bank supervision. Loose monetary policy is partly responsible for the [current] mess…The other two limitations are both related to central banks’ and supervisors’ ability to control a much-changed financial system. One has to do with asset-price bubbles. The macro-economic models used by many central banks focus on short-term influences on inflation; they focus less on the supply of money and credit.

31
Even when they do have the right tools, central banks have preferred to wait till bubbles have burst, before mopping up afterwards by cutting rates. The snag is that this can start off new bubbles (as it did after the dotcom bust). (Economist 20/10/07: 15)
• Another vitally important set of influences specific to this sector concerns
regulation. The South African setting for financial activities is subject to international influences exerted by agreements like the Basel Accords on banking supervision known as Basel II, previously discussed for the banking sub-sector. But local regulatory exigencies depend on our economic structure as well as on political developments like affirmative action and BEE. Put briefly, the international regulations aim to determine capital holding requirements for banks and other financial institutions in order to manage lending risk prudently and efficiently. But their application in developing economies has been criticized. They are charged with ignoring the unfair advantages enjoyed by large banks in implementing more sophisticated measures of risk, and with handicapping people economically marginalized by restricting their access to lending or by making it more expensive. Whether this criticism applies to South Africa is unknown, but the report of the Competition Commission on banking costs awaited this year may throw light on the question.
South African regulatory actions aiming to redistribute work and increase access to credit may expand jobs in the financial sector in a horizontal direction, namely increased demand for the existing range of skilled and unskilled occupations in the workforce. But whether it will lead to skills deepening, meaning net increases in the demand for specific skills amongst managers, professionals and associate professionals is a highly pertinent issue. Yet we are unable to say what is likely to happen, given the state of research in this sector. The net effects of regulatory changes, international and national that impinge on South Africa, more precisely on the demand for workers trained in the range of required Financial Services competencies calls for detailed investigation. Until then, projections of skills demands as driven by regulatory action have limited utility.
A number of other sector-wide influences on the demand and supply of skilled labour in South Africa’s financial services sector can be described briefly. A half-dozen in number, they provide background to discussion of the forces driving skills in specified sub-sectors like banking, insurance and accountancy.
• First, one example of innovation in product rather than process in national
markets like South Africa and the UK are the movements in the range of pensions instruments. In general, in industrial countries there has been a shift from state provision towards an array of products offered by non-state providers through the banking and insurance industries. These providers are mostly profit-seeking. But for the present purpose the important point
32
is that such initiatives are subject to strict regulation. For example, in industrial countries the stakeholder pension has regulated features that include the capping of charges, contribution or payments flexibility built into its design, and generally schemes are intended by government to be run in the interests of their members.
In South Africa a prominent example of product innovation has been the trend, roughly speaking, over the last two decades away from defined benefit to defined contribution schemes. This switch has been driven by employer fears of higher investment risk and increasing pension contributions over time. One effect was decreased demand for actuarial skills by insurance companies. But certain actuaries have retrained themselves and there has been movement into new fields that are growing, like short-term insurance, health care and the investment arena. (Personal communication, Actuarial Science Department, UCT; Actuarial Society of SA 2005.)
Another prediction common in international skills training discussion about financial services is the confident projection that administrative, clerical and secretarial occupations should be expected in the future to be less in demand because of the continued rise of computer and IT software use in virtually all offices. (DfES, UK 2001; Beaven & Others 2005; Leitch Review 2006) This is anticipated to be the case in many kinds of financial services where the reduction in face-to-face transacting is a high priority on cost grounds. We can infer the same will happen in South Africa, but perhaps on a lesser scale given cheaper labour costs at the lower end of the skills pyramid. Certainly the technological drivers are common in kind given ongoing globalization in goods and ideas.
• Second, what is solidly in evidence in most countries’ Financial Services
sector is the trend towards out-sourcing and sub-contracting. Call Centres and internet-accessed services or BPO (Business Process Outsourcing) increasingly rely on ICT equipment to sell in negotiation, to deliver and to service financial packages. Examples are insurance policies, differentiated banking accounts, asset management services, and medical aid programmes, claims and payments. Yet the implications for the magnitude and mix of skills demand again cannot be definite until micro-level research is undertaken. There is little at present in South Africa, although skills issues are discussed briefly below under the asset management and financial advice sub-sector.
• Third, globalization in the straightforward sense of the rapid increase in
economic transactions across national boundaries has particular relevance for financial activities in any national economy. But to generalize about the impact on skills demand is hazardous since certain sub-sectors like wholesale banking – banking relationships between banks and other
33
financial institutions not individual customers – have entered into global trading earlier than have other financial specializations. So there is differential timing in the effects of globalization across the sector.
• Fourth, there is competition. Where its pressure is significant there is
usually a concentrated strategy on cutting costs. This includes a reluctance to hire skilled workers and the search for cheaper alternatives to such hiring, like making-do with lower levels of qualified workers supplemented by short and dedicated training courses for the existing labour force. Mergers between companies in the sub-sector and acquisitions by one producer of another is a process of concentration resulting in major financial institutions growing ever larger. The accountancy and banking sub-sectors exhibit spectacular evidence of this both internationally and in South Africa. (Basel Committee 2008; IFAC 2007; International Audit Networks 2006; Cunningham 2006; IMF 2006; Falkena 2004)
This consolidation occurs alongside smaller counterpart firms in most sub-sectors seeking to survive in industry niches. The former process of agglomeration may entail job losses by occupational category and skill type. With even mild economies of scale in operation, one firm acquiring a competitor company in the same line of activity usually means acquiring a workforce surplus to be decreased under negotiation with trade unions and often with government agencies charged with upholding competition. Only micro-level research can tell with accuracy what such outcomes entail for trends in specific skills demand. Yet in South Africa there is clear evidence of competition in the major sub-sectors of banking, insurance and accountancy. In the course of conducting research for this report it soon became evident that information about numbers of qualified staff, remuneration levels, inducements, and hiring strategies was not forthcoming from prominent commercial banks and certain of the Big 4 accountancy firms consulted. This was refused on grounds of confidentiality. The reasons given were maintenance of their competitiveness in gaining higher market shares and in acquiring skilled professionals, managers and technicians from the external markets for workers with certified qualifications.
• Fifth, in countries with well-documented financial services sectors there
are said to be shifts evident in producer strategies from a product focus to a client focus. This can have contradictory effects. “With the advent of ICT, there is no brand loyalty. But the only thing we have to differentiate ourselves with the competition is our customer care and service.” (Financial services employer consulted in UK research, DfES, UK: 2001: 30; Leitch Review 2006). What implications follow for net skills demand by category is uncertain even, as seems likely, this trend is occurring in equivalent South African sub-sectors.

34
One relevant aspect is that a significant proportion of services to clients have to be produced and consumed simultaneously. The transacting between parties requires both sides to be in place at the same time, which entails a direct relationship between personnel in the supplying entity, say an insurance company, and the consumer of a policy or pension scheme. Where this is the case, the use of ICT is not a complete substitute for the established methods of selling services, especially in product lines where an expanded client focus is becoming more important. But whether such advice to clients will be offered at least cost by independent financial advisers (IFAs) or by institutional employees designated for the task and trained accordingly remains open. This efficiency question appears unsettled still both in international precedents and in the local financial services sector.
• Finally, productivity changes are a major determinant of skills demand in
every sector, but more difficult than average to quantify in services like financial activities. The simplest measure is the ratio of output or value-added to labour-force numbers or hours worked. For accuracy both the numerator, value-added, and the denominator, labour input, have to be carefully quantified. Because the increase in productivity is such an important determinant of the strength of demand for specific skills, and therefore of decisions to invest in skills training, the main difficulties must be noted and addressed as far as possible any projection of numbers of skilled workers in demand. Measures of productivity in South African research tend to be highly aggregated, pertaining to entire sectors like Manufacturing. (Fedderke 2005; Rodrik 2004) But there seem to be no research results available for the Financial Services sector as addressed in this report.
A listing of what is required will deepen understanding of the concept of productivity and its role in the training investment decision.
(i) The measure of labour input most consistent with the quantity of value-added is number of jobs recorded in surveys of firms and public sector producers. Such a headcount measure is however subject to distortion by changes in hours worked that are not recorded, as well as by the possibility that a sub-set of individual workers have more than one job. This is more likely at the lower end of the skills hierarchy.
(ii) Firm-level or business surveys tend not to capture self-employment, thereby creating imprecision.
(iii) The Labour Force Survey, standard in numerous economies including South Africa, asks a sample of households for information. It yields estimates of worker numbers, thereby avoiding double jobs, and of the number of hours worked, thus sidestepping the non-reporting of hours-worked changes over time. But it has drawbacks. Self-reporting makes for unreliability, Also,

35
disaggregating by sector or industry requires allocating workers performing multiple jobs to particular industries. This can entail arbitrary decisions.
(iv) Based on a sample of households, these surveys tend also to become less reliable when greater area or geographical detail is required for finer analysis. The South African LFS provides only limited data on occupations at the sub-sectoral level relevant to the present report, although a couple of tables present the information that is available.
(v) Estimates of hours-worked supplied by households about their members are considered of doubtful accuracy, and so are “generally regarded only as indicative of changes over a long period of time. (Beaven & Others 2005: 63)
Gains in productivity bear a complex relationship with the quantity of labour in demand. If the existing workforce produces higher quantities of output or higher value per unit of output or both because of training inputs, then productivity rises so that demand pressure for yet more skills is eased over time. Conversely, higher productivity means a higher rate of return to investment in skills training. This is true for individual firms, for sectors and for the national economy as a whole, although the net effect of increased productivity cannot be predicted a priori. A potential problem faces projections of future skill needs because technology is a potent driver of productivity gains, along with managerial skill, competitive effort as well as product market strategy. These all determine the pace of rises in productivity. But technological change can be a black box. It is essentially applied scientific enquiry with results virtually impossible to project accurately over time. At best it can yield simple extrapolations of trend in technologically driven output change, but based on equally simple suppositions that the future will be like the present and the present is like the past. To be accorded plausibility these have to be supported by other information, like the stated hiring and training intentions of employers, professional associations and state agencies charged with enforcing policy to raise skills production. In addition, it is competition and cost-cutting pressure which forces the pace of technical progress, and therefore the realized increases in productivity if it is successful. It makes little sense to quantify the likelihood of continued output gains from superior technology into the future, particularly so in information technology. But again it is not plausible to forecast the second link of the chain, the effects that such gains in output per head will have on skills needs at the micro-level. For accuracy this is where occupational demand has to be identified and shortage phenomena anticipated under specified conditions.

36
Under the heading of demand for skills within Financial Services as an entire sector it is useful to recall the basic framework for analysing the operation of demand and supply forces in every sector of a national labour market. (Richardson 2007; Future Skills Scotland 2007; Bankseta 2006; Research Focus 2006; Beaven & Others 2005; DfES, UK 2001).
• Quantities on both sides of the market are never static. A fixed quantity of
some specific skill supplied to the economy at a point in time is conceptually correct (and useful), as there is also a fixed quantity demanded. But in practice supply rises as employment conditions look more attractive to potential workers. Conversely, demand falls as the cost of employing individuals with particular skills rise. These processes in time are necessary for the forces of supply and demand to work through the labour market, or occupational market, and thereby resolve problems of deficiency or shortage.
• The main variable that solves both shortages and surpluses in any
functioning market is price. Hourly, weekly or monthly pay is the simplest concept or measure, but other dimensions of the reward for work are equally pertinent because they are valued by the employee and pose a cost to the employer. This is particularly so in a sector like financial services that employs disproportionately high numbers of well-qualified workers. Rewards in the sector include options to buy shares in the company, retirement benefits, a set of fringe benefits like medical contributions, child-care, family-friendly arrangements, allowances for housing, vehicles, further skills development itself, and more. So remuneration is multi-dimensional and challenging to measure based on monetary valuations.
• Viewed graphically, the slopes of demand and supply curves show the
responsiveness of the quantities of labour that have the relevant skills and experience to a change in the price, salary or wage, for that skill. A small change in P that causes a large change in the Q supplied or demanded means the market is efficient in resolving a shortage or surplus because there is sufficient elasticity. But if both supply and demand curves are inelastic – relatively unresponsive – then the market is not efficient. It will take a long time to clear or not do so at all.
These questions are complex as well as politically loaded in many countries. Additional perspective is provided by acknowledging the ongoing debates in industrial countries with highly developed labour market institutions. There is no consensus whatever about the causes of high unemployment, slow responses to signals like increased wage offers, and attempts at reforms towards flexibility in European labour markets like Germany, France and Italy. (Howell & Others 2007) The current controversy in France about public sector benefits and the length of the

37
working week, for instance, concern deep-seated efficiency issues in the labour market like these sketched as background for the South African analysis of skills policy.
• Slopes of demand and supply curves vary between skill groups. Thus
each occupational market will have its own set of determinants. It follows that modeling at the sector scale provides results of limited utility.
• In general, production skills learned rapidly and easily as well as used
widely within and without a sector tend to be responsive in the quantities supplied. Word processing is probably the clearest example. Conversely, skills like accountancy and actuarial proficiency that are difficult to learn – there is a high drop-out rate amongst trainees – and that take a long time to acquire will in the quantities demanded and supplied be less responsive to price changes induced by shortage or surplus.
• A rise in compensation for a skill that is in short supply applies sector-
wide, so that all workers in the skill group already employed must be paid the increase as well as those newly hired. This is a powerful reason why employers look for alternative forms of adjustment to shortage so as to avoid large increases in occupational skill costs. More paid over-time worked, out-sourcing, short-course training on-the-job or externally provided can be preferred alternative strategies.
• Individual skilled workers can be poached by individual employers so the
micro-level supply they face is more responsive than that sector-wide elasticity which sector employers as a whole must take account of.
• Skills surpluses, like skills shortages, are socially inefficient. Resources
were devoted to training not justified by an adequate return. Given time- lags due to training duration, a surplus in the present tends to lead to a shortage in the future because of ‘cob-web’ cycles in the market. Potential trainees avoid entering an occupation in which they observe hiring reluctance, employment volatility, lower than anticipated starting compensation, and other symptoms of oversupply like high proportions of contract work relative to permanent or established jobs.
One final observation about demand for skills is more encompassing in its application, not pertaining only to the Financial Services sector. We need to recall the underlying impetus for a positive decision to invest in human capital, that is, the motivation supplied by the decision environment.
[W]hat fundamentally drives the demand for skills is the existence of an economic opportunity or the fulfillment of a personal or social goal. [For instance] learning can contribute to the development of society “through the achievement of other social goals such as civic participation, sustainable development, improved health and wellbeing, reduced crime

38
and greater social cohesion” (The Lifelong Learning Strategy for Scotland 2003). This is all too often overlooked. Decisions to invest in skills are derived from an initial opportunity or goal and then sustained, increased or decreased in response to an ongoing assessment of that opportunity. A rough metaphor would be to imagine moving through time on the x-axis with the current level of investment in skills on the y-axis. In the context of the employer’s overall strategy what we should be looking to understand are those that are investing in skills above the average for their market (because of threat or opportunity); those who are investing in line (it’s what is expected); and those that are either consciously or sub-consciously investing below trend. Policy should then be concerned with considering interventions at a market and employer level and asking:
• Market level: is the market as a whole investing in skills above or below the average for an economy and what needs to change in the market to change the rate of investment (greater competition, regulation, etc.)?
• Employer level: what is the intervention which would most effectively encourage an employer to change its strategy to one that pursues the optimum path of high value added (greater support for leaders and managers, product offers for high performance working, etc.)?
In both instances the emphasis would be on evaluating skills decisions in the context of the economic environment in which decisions to invest or not to invest are made. (Davis & Kewin 2007: 12, last sentence italics added.)
Channels for the supply of skills to the financial services sector as a whole. The supply of skills is the outcome of a set of inter-related determinants, the most important of which are the following. Skills supply is separated from labour supply because the respective sets of determinants are wholly different. Labour supply depends on:
• Population changes by age, gender, marital status, urbanisation and other internal movement.
• International migration flows. • Operation of the grants or social security system which in net terms either
encourages or discourages labour force entry. • Cultural influences on participation in the labour force.
Skills supply depends on:
• The magnitude of labour supply at any point in time. • Output volume from the compulsory schooling system.

39
• Quality of school leavers. • Operation of the higher and vocational education systems. • Methods of financing higher and vocational education. • The training system. • Employer and individual investment in skills acquisition.
In addition, although not amenable to identification as a set of separable causal influences on changes in skills supply and demand, there are the alterations in both national and international financial systems that have characterised recent decades. When these began to influence skills profiles significantly and in what directions is not readily established. But the changes themselves do not appear to be in dispute. The following passage characterizes these observed trends, with the financial system described being that in an average industrial economy.
Over the past three decades, the financial system has been going through a historical phase of major structural change. And far from slowing down, the pace of change seems to be accelerating. The joint influence of financial liberalization, breakthroughs in financial know-how and advances in information technology has ushered in an era of extraordinary innovation [of product and process]…This revolution has been for the good…these forces can justifiably take some of the credit for the so-called “Great Moderation”, the current extended phase of low output volatility and low inflation across the world…The financial sphere has greatly expanded relative to the “real” economy. (Borio 2007: 1, 16)
Certain services supplied by financial services firms have become increasingly commoditized – produced and consumed far apart in spatial terms – so there has been growing scope for supplier behaviour characterized as footloose in the pursuit of increased cost efficiency. As a consequence new business centres for international finance have emerged in recent decades, like Hong Kong and Singapore. In addition there are third generation locations attempting to cater to international demand. “Along the coasts of Asia and the Persian Gulf, almost all rapidly developing countries, large and small, now appear bent on growing their own international [financial] services centers. Established centers, in turn, worry about maintaining their edge.” (Von Furstenberg 2007: 2) Whether the South African industry in the longer run has the potential to supply international financial commodities at competitive prices remains to be seen. But clearly the availability of the skills that are a prerequisite – the concern of the present report – are a major determining factor. At present no acceptable answer is forthcoming without local research that is devoted specifically to quantifying the costs and benefits of the South African financial services producers expanding into global markets.

40
On indirect evidence from other countries, if expansion occurs in the output of the sector – volume as well as value - the potential gains in employment creation will be real and multiple. One estimate for the UK suggests “that every ‘securities’ job accounts for two additional jobs in other industries [non-financial]. Applying a multiplier of 3 to ‘securities’ jobs would lead back to the earlier estimate of an employment effect [of international financial services] in London of about 1 million.” (Von Furstenberg 2007: 2) Turning to the supply channels for skills production, given the wide coverage of the sector as interpreted for the present report, it is essential to separate the upper end of the occupational spectrum from the lower end in the cost, length and intensity of training. Occupations do not equate wholly with skills or with qualifications, for reasons already discussed. But they are an acceptable proxy measure of differentiated skills at the general level of discussion in this section although not elsewhere in this report. Accountants, auditors, financial and management consultants, investment managers and advisers, actuaries, book-keepers, clerks in diverse finance fields and call centre operators are the job titles most relevant for the present purpose: see Table 6. This is a list of financial sector occupations pruned down (i) because they constitute the largest numbers employed in financial service delivery; (ii) because the pre-requisite skills to fulfill a subset of these functions require the longest periods of training, and for that reason alone are probably above the average deficiency in supply; and (iii) for manageability of the discussion in this report. Individuals are trained to enter such job categories through channels that are a mixture of
• compulsory schooling of nine years, • voluntary additional schooling to Grade 12, • further education in technical colleges and private training institutions
leading to diplomas and a range of certificates, • higher education in universities and technical universities for three and
four year degrees, and • training on-the-job in employing organizations and off-the-job in institutions
dedicated to the purpose. Occupations and learnerships, instituted and registered by the three Setas that are relevant to Financial Services, are illustrated in the tables listed below. Currently there is a growing research literature on learnerships, although those available are insufficiently detailed at the sub-sector level within the Financial Services Sector. Tables 7 and 8 illustrate the range of occupations and learnerships. (Smith, Jennings & Solanki 2005; Singizi Consulting 2007; Fasset 2007A & B)
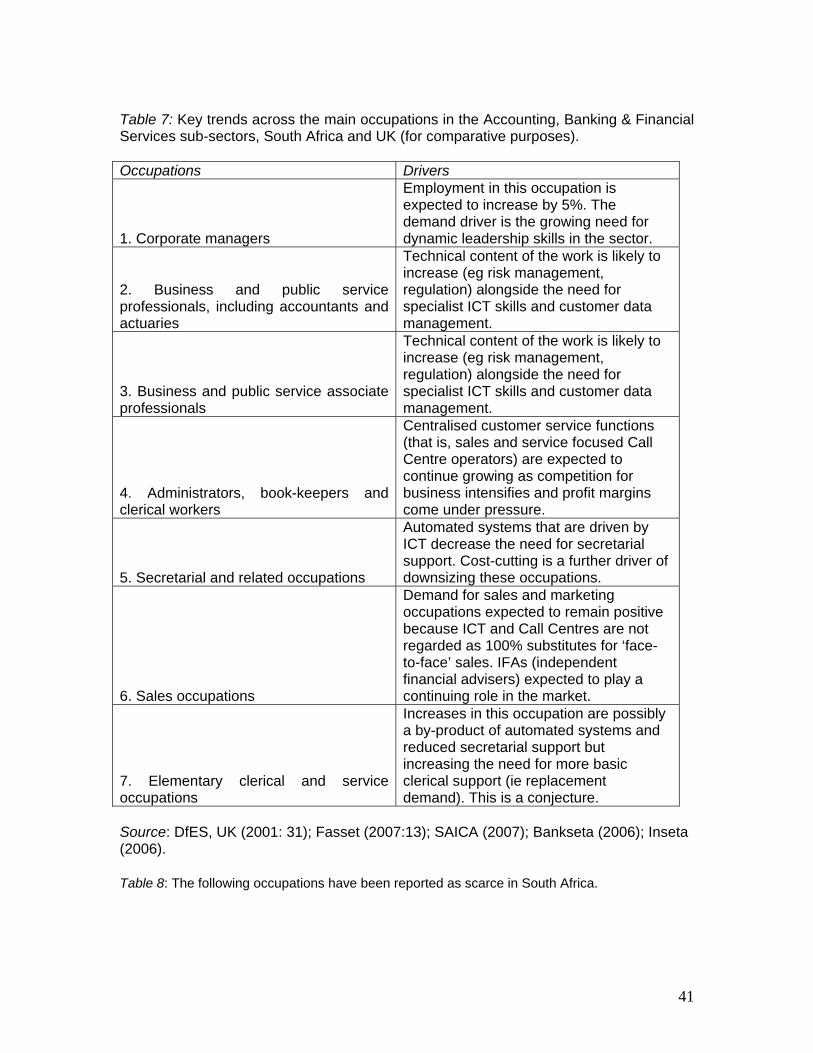
41
Table 7: Key trends across the main occupations in the Accounting, Banking & Financial Services sub-sectors, South Africa and UK (for comparative purposes). Occupations Drivers
1. Corporate managers
Employment in this occupation is expected to increase by 5%. The demand driver is the growing need for dynamic leadership skills in the sector.
2. Business and public service professionals, including accountants and actuaries
Technical content of the work is likely to increase (eg risk management, regulation) alongside the need for specialist ICT skills and customer data management.
3. Business and public service associate professionals
Technical content of the work is likely to increase (eg risk management, regulation) alongside the need for specialist ICT skills and customer data management.
4. Administrators, book-keepers and clerical workers
Centralised customer service functions (that is, sales and service focused Call Centre operators) are expected to continue growing as competition for business intensifies and profit margins come under pressure.
5. Secretarial and related occupations
Automated systems that are driven by ICT decrease the need for secretarial support. Cost-cutting is a further driver of downsizing these occupations.
6. Sales occupations
Demand for sales and marketing occupations expected to remain positive because ICT and Call Centres are not regarded as 100% substitutes for ‘face-to-face’ sales. IFAs (independent financial advisers) expected to play a continuing role in the market.
7. Elementary clerical and service occupations
Increases in this occupation are possibly a by-product of automated systems and reduced secretarial support but increasing the need for more basic clerical support (ie replacement demand). This is a conjecture.
Source: DfES, UK (2001: 31); Fasset (2007:13); SAICA (2007); Bankseta (2006); Inseta (2006). Table 8: The following occupations have been reported as scarce in South Africa.

42
Ran
king
Occupation Need for Period *
% of total need
1 Accountants 616 352 Corporate (Administration & Business) Services Managers 228 133 Contract, Program and Project Administrators 157 94 Finance Managers 133 85 General Clerks 114 66 Secretaries 94 57 Other Project Managers not elsewhere classified 47 38 Economists 40 29 Bookkeepers 36 210 Financial Investment Advisers and Managers 31 2
* 1 April 2006 to 31 March 2007
(The number of people needed has been summed to the 4-digit level of the OFO.) Source: Fasset 2007A: 6
Table 9: Range of Learnerships comprising Fasset Seta scope.
TITLE
NLR
D
No.
NQF PROFESSIONAL BODY
1 Professional Qualification: Chartered Certified Accountant The Chartered Certified Accountant Programme confers the designation ACCA. Members are recognised to perform the Audit Function in the UK and certain European and other countries. Employees without formal tertiary qualifications gain access by means of the ACCA Certified Accounting Technician Programme.
2039
9
7
2 Certified Accounting Technician Certified Accounting Technicians function as accounts support staff offering assistance to professional Accountants. This qualification affords access for employees without formal tertiary qualifications, to the ACCA Chartered Certified Accountant designation.
2039
7
5
Association of Chartered Certified Accountants (ACCA ) Ms Nirri Nair or Ms Tonia Couloubis (011) 459 1900 [email protected] / [email protected]
3 Professional Qualification: Chartered Management Accountant Allows learners who meet the minimum entrance requirements and successfully complete this qualification to register as Chartered Management Accountants with the designation ACMA.
2040
0
7
Chartered Institute of Management Accountants (CIMA) Ms Natercia Faustino (011) 268 2555 [email protected]

43
TITLE
NLR
D
No.
NQF PROFESSIONAL BODY
4 National Diploma: Management Accounting Ideal for individuals moving into management positions and for those who wish to begin specialising in Management Accounting. Includes, among others, the roles of Cost Accountant, Accountant, Management Accountant and Financial Manager.
2440
6
6
5 National Certificate: Business Accounting Ideal for learners entering the workplace who will be involved in providing accounting support services and also aimed at current employees in similar positions who require a formal certificate in basic accounting skills.
2441
8
5
6 Post Graduate Professional Qualification: Professional Accountant in Business Commercial and Financial Accountant: Commerce and Industry Commerce and Industry members of the Institute provide a number of accountancy related services to companies, close corporations, partnerships, sole proprietors, trusts and various other types of small business and non-corporate undertakings.
2039
2
7
7 Post Graduate Diploma: Professional Accountant in Practice Practising members of the Institute perform duties as an Accounting Officer and provide a number of accountancy related services to companies, close corporations, partnerships, sole proprietors, trusts and various other types of small business and non-corporate undertakings.
2039
1
7
South African Institute of Professional Accountants (SAIPA) Mr Rishard Mahomed Habib (011) 486 0283 [email protected]
8 Certificate: Accounting Technician Enables new entrants into the financial sector to become proficient in their career as an Accounting Technician or Accounting Support Professional. Learners support and assist senior professionally qualified Accountants in the fields of finance, management accounting, taxation, auditing and payroll.
2040
2
5
Fasset Mr Aboo Amod (011) 476 8570 [email protected]

44
TITLE
NLR
D
No.
NQF PROFESSIONAL BODY
9 Certificate for Registered Accounting Clerk Registed Accounting Clerks assist Bookkeepers and Accountants. They are entitled to register as Certificate members of the Institute with the designation CICB(SA) and access the Registered Bookkeeper qualification.
2036
2
3
10 Certificate for Registered Bookkeeper Registered Bookkeepers assist Accountants and Financial Managers. They are entitled to register as Associate members of the Institute with the designation AICB(SA) and access the qualifications of, among others, the IAC and SAICA.
2036
3
4
11 National Diploma: Technical Financial Accountant Financial Accounting Technicians undertake basic Bookkeeping and Accounting procedures in a variety of situations. They function within general Accounting and Financial Management roles where they lend support to the Accountant and/or the Financial Manager.
3621
3
5
12 National Certificate Small Business Financial Management Specifically designed for those learners who are, or wish to become, owner-managers and for learners who are responsible for the keeping of financial records of a small business.
4873
6
4
13 Certificate: Office Administration The learnership in Office Administration is aimed at people in clerical and administrative positions in all businesses in all industries. An Office Administrator provides a supportive role in any business.
2361
8
5
Institute of Certified Bookkeepers (ICB) Wedaad Shira (021) 421 1110 [email protected]
14 Certificate: Public Sector Accounting Specifically designed for Accounts Administrator in the public sector who realise the importance of completing a professional qualification that will equip them with the necessary skills to cope effectively with the demands of their changing environment.
2035
2
4
Fasset Ms Yogini Sigamoney (011) 476 8570 [email protected]
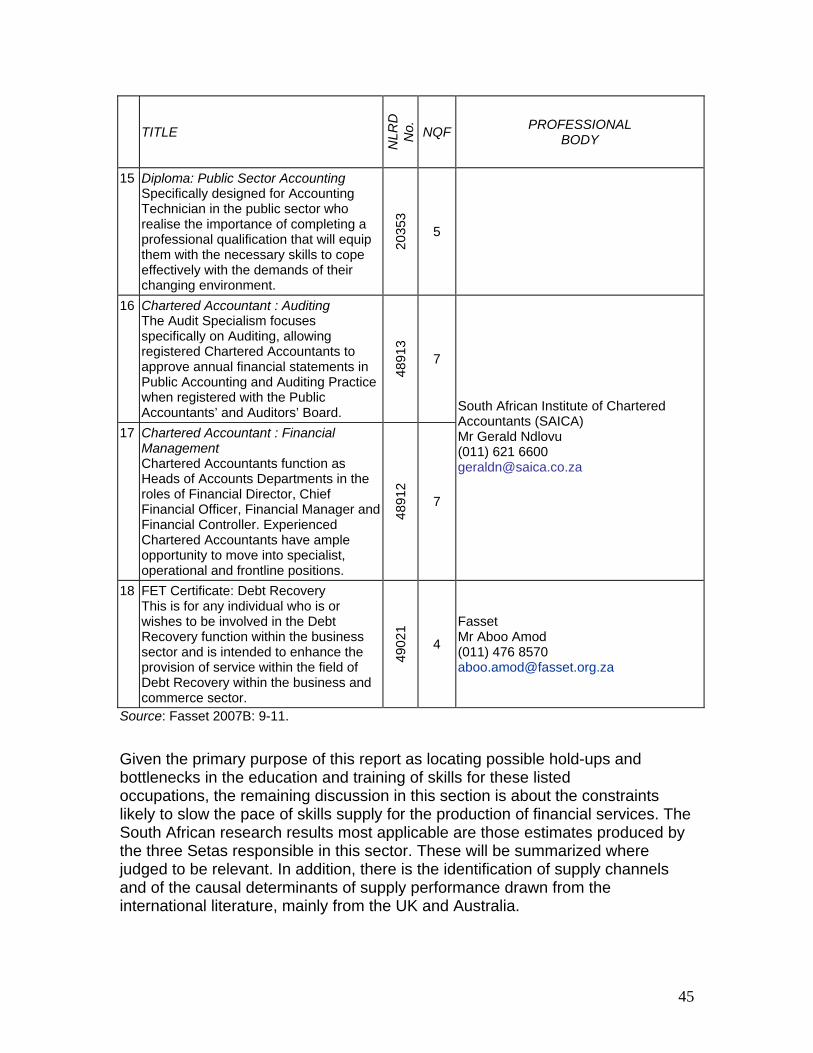
45
TITLE
NLR
D
No.
NQF PROFESSIONAL BODY
15 Diploma: Public Sector Accounting Specifically designed for Accounting Technician in the public sector who realise the importance of completing a professional qualification that will equip them with the necessary skills to cope effectively with the demands of their changing environment.
2035
3
5
16 Chartered Accountant : Auditing The Audit Specialism focuses specifically on Auditing, allowing registered Chartered Accountants to approve annual financial statements in Public Accounting and Auditing Practice when registered with the Public Accountants’ and Auditors’ Board.
4891
3
7
17 Chartered Accountant : Financial Management Chartered Accountants function as Heads of Accounts Departments in the roles of Financial Director, Chief Financial Officer, Financial Manager and Financial Controller. Experienced Chartered Accountants have ample opportunity to move into specialist, operational and frontline positions.
4891
2
7
South African Institute of Chartered Accountants (SAICA) Mr Gerald Ndlovu (011) 621 6600 [email protected]
18 FET Certificate: Debt Recovery This is for any individual who is or wishes to be involved in the Debt Recovery function within the business sector and is intended to enhance the provision of service within the field of Debt Recovery within the business and commerce sector.
4902
1
4
Fasset Mr Aboo Amod (011) 476 8570 [email protected]
Source: Fasset 2007B: 9-11.
Given the primary purpose of this report as locating possible hold-ups and bottlenecks in the education and training of skills for these listed occupations, the remaining discussion in this section is about the constraints likely to slow the pace of skills supply for the production of financial services. The South African research results most applicable are those estimates produced by the three Setas responsible in this sector. These will be summarized where judged to be relevant. In addition, there is the identification of supply channels and of the causal determinants of supply performance drawn from the international literature, mainly from the UK and Australia.

46
There are general considerations bearing on the supply of skilled workers to the Financial Services sector. These provide the necessary perspective on what is realistic to expect on expansion, and therefore on what strategies are relatively likely to be successful.
• The distinguishing features of training in the financial services sector are the following. (i) At the upper end of the occupational, skill and remuneration hierarchy, the training is by nature “professionally-driven, hence the presence of a significant accreditation system which is specific to the sector.” (ii) Training is delivered through in-house channels or by private sector providers. (iii) The public sector has only a slight role “in providing training and skills development support in financial services.” (DfES, UK 2001: 51)
(iv) But higher education is predominantly in the public sector in most countries – prominent exceptions being the US and Japan – so the provision of graduates as prerequisite preparation for specific skills training is squarely a public, meaning state, responsibility.
(v) Similarly, at lower levels of the hierarchy, the quality of school-leavers plays a particularly significant role in this sector with its emphasis on numeracy and ICT aptitudes in the work process. Quality standards in most countries are a public sector responsibility, despite the sizeable proportion of for profit and non-profit schools in private ownership in certain countries including South Africa.
• The right skills are only one driver of increased productivity in companies,
state departments and other organizations within a given sector. Skills interact with the other determinants of output per head or per hour. In recognizing this mutual dependence, one formulation lists “five main drivers” to provide perspective on skills issues in sectors like financial services.
[1] Investment, [through] increasing the stock of physical capital. [2] Raising skill levels to create a more flexible and productive workforce. [3] Science and innovation, to develop new technologies and improve efficiency.

47
[4] Promoting enterprise through measures aimed at removing barriers to entrepreneurship and developing an enterprise culture. [5] Improving competition, which promotes flexible markets ands increases business efficiency and consumer choice. (Beaven & Others 2005: 10)
Thus skills are one unambiguous cause of rises in productivity. But to be effective they have to complement the drivers listed above: science and innovation, fostering an enterprise culture, effective management, and raising competitive ability in organizations trading on national and international scales. Most important, what this means is that improving the supply of skills by widening constraints on training and utilizing more skills in production alone may not by itself raise economic performance. It is a necessary but not sufficient condition for raising productivity.
• The complementarity between skills and various kinds of capital is well established in the literature on economic growth. Two consequences amongst a number need noting. First, rapid declines in the price of ICT (information and communications technology) inputs have raised their attraction to producers relative to other kinds of capital and “the adoption and use effects of ICTs have contributed substantially to the increased relative demand for college graduates. Second, highly educated and skilled workers facilitate the ready adoption of new technologies as well as enabling their efficient use. So there is a virtuous circle between education, skills and new technology based on mutual complementarities. (Forth & Mason 2004: 5)
• The supply of workers with a particular skill is difficult to measure for
several reasons. ** What is important is not just the number of people, but also the number of hours they are willing to work. While some people work long hours, many others work part-time. ** Within an occupation, there may be specialized sub-sets of skills or locations having difficulty recruiting, while other areas are not. ** As noted above, vacancies may go unfilled not because there is no one available who can do the job, but because the wages and conditions on offer are unattractive. ** Within every skill group, there is a range of ability – from exceptional to ordinary. This variation in quality is important to employers, but not observable in measures of labour supply.

48
** Many people work in jobs that do not directly use their formal qualifications; alternatively, they may be of working age but are not seeking employment. From this we can see that it is possible to increase the supply of a particular skill in a number of ways. These include: increasing the hours worked per worker; increasing the proportion of people who are qualified for an occupation who actually work in the occupation; and increasing the intensity of work and the efficiency with which the scarce skill is used. Increasing the number of people recently trained in the skill (for example, through vocational courses) is only one way to increase supply. (Richardson 2007: 8-9)
• As noted later in this discussion in the context of skills forecasting, the
relationship between possession and use of skills and technological change is a complex one. “[T]he wage premium for more skilled workers is not just the result of their having higher ‘static productivity’. Workers endowed with more skills…tend to deal better with technological change in the sense that their productivity is less adversely affected by the turmoil created by technological transformations of the workplace, or that it is less costly for them to acguire the additional skills needed to use a new technology…[S]ources report that the skill premium also rose during the course of the first industrial revolution [in the 18th century]…[So] more educated individuals have a comparative advantage at implementing the new technologies and…high-skilled workers sort themselves into industries with higher rates of technical change.” (Hornstein & Krusell 2005: 1301)
We do not know whether these generalizations apply to the financial services sector within middle-income as well as to industrial economies, and in particular to that sector in South Africa. But it would be surprising to encounter local research results that did not corroborate these findings. Currently such research appears not to have been conducted.
• Skill shortages are estimated by Setas like Fasset by constructing a weighted sample of Workplace Skills Plans submitted by their member companies. Not all Setas appear to do this. Further, there are doubts about the representativity of this procedure which warrants further scrutiny. But in the international literature a more nuanced approach is advocated for a number of reasons.
To gain an insight into supply constraints that will be usable for policy formation it is necessary to establish in a company or sector-wide sample of companies the following. (i) The number of current vacancies in job slots characterized by occupational titles. (ii) How many of these are hard-to-fill by a commonly accepted definition. (iii) Information explaining why these

49
vacancies are hard-to-fill, either because of the quality of applicants or because there were too few applicants. (iv) If quality deficiency was the reason then precisely what qualities were lacking. (v) Were applicants judged to lack the required skills, qualifications or experience? (vi) Or finally, were the attitudes, personality or motivation of applicants called into question by employers? Vacancies existing for the reasons listed in (vi) are not indicators of skills shortages. As the following quotation brings out, time is another missing dimension in quantifying skills deficiencies. As emphasised earlier, demand and supply both are processes with the dimension of duration or flow. These are better conceived as such than as stocks that measure magnitude only at discrete points in time.
The [Scottish] employer skills survey asks only about current and open vacancies and whether they are hard-to-fill. It provides a snapshot of employers’ experience at the time of the survey rather than say over the course of a year. Best practice in surveys of this type suggests that it is difficult for employers to provide accurate answers about all of the vacancies they may have had over a longer time period and that it is easier to accurately answer questions relating to vacancies which are currently open. This is particularly true of larger workplaces who may have a lot of vacancies over the course of a year. Therefore the employers’ skills survey looks only at current and open vacancies for two reasons: • We know the employers’ response to questions about current
vacancies will be more accurate; and • We do not want to overburden employers with questions that they will
find difficult and time consuming to answer. [So] because we take a snapshot approach there is the potential that this method may over-report the incidence of hard-to-fill vacancies. (Future Skills Scotland 2007: 17, italics added.)
This section of the report has presented a set of influences on the volume and profile of occupations for which skills are supplied to the financial services sector in an average economy. The presumption is that it is valid and formative also for the South African counterpart sector. In addition, it is contended that a separation of demand from supply causal factors is arbitrary and not enlightening. What is clear is that the major trends in technology, financial product development and the increased global trade in these products in recent decades have had, and will continue to have, effects on the skills mix in the sector. The following distinction is conceptually valid but difficult to pin down in the usually available evidence. (i) Changing occupational patterns in favour of those occupations which tend to employ better qualified people, that is, those with ‘higher’ qualification profiles. (ii) A general shift of the qualifications
50
profiles within all occupations in favour of higher qualified workers. These two kinds of changes can be measured in two ways, first, in the characteristics of performance specified for registered qualifications where available; and second, in terms of what employers on average are prepared to pay to employ people who hold different levels of formal qualifications. The information requirements are formidable for micro-level intervention by policy makers and regulators. Box No.1 contains the results of a survey of five companies in the financial services sector conducted by the DPRU at UCT in 2006. It contains a useful and unique discussion of training, recruitment and policy issues relevant to this report. Box No. 2 lists the professional associations active in the financial services field in South Africa, when broadly interpreted. It stands out clearly that the South African Institute of Chartered Accountants, SAICA, is by far the most significant professional body in the sector as well as, on other evidence, the most pro-active organization in research and experimentation to accelerate the production of accountants at the present time. It is the growth and structural change in financial activities remarked earlier in this section – that is, growth on the world-wide scale – which is the ultimate cause of changing occupations. Therefore it determines the skills variety and numbers required in supply. This is true in most contemporary economies, other than the very poorest in average per capita income in the World Bank classification, and therefore lowest levels of financial development. The following statement is a capsule description that brings this out clearly.
The most important factor driving strong growth in services [including financial services] is greater use of various business services as inputs to production. This reflects changes in technology (growing dependence on IT technology, and hence on the related services), in the knowledge content of final products (growing use of technical consultancy, management consultancy, market research and advertising), and in business organization (specialization of firms in the provision of certain services which can be contracted out). For most services, the vast bulk of production is for the domestic market rather than exports, but they provide indirect support for exports to the firms to which they sell. Even so, exports have been an important driver of demand for contract R&D and (of course) international financial services. (Beaven & Others 2005: 21, italics added.)
But by way of an initial conclusion, the following observations of the Leitch Review of Skills for the UK apply to our research and policy agenda in South Africa. This is so in positive as well as negative ways. Suggestions like these have been criticised in the UK literature as aspirational rather than practical, too imprecise about what should actually be done to succeed in raising the aggregate volume of skills training. For the present purpose, which is to derive a

51
new perspective on supply constraints in financial services skills, these proposals are worth pondering.
• Shared responsibility. Employers, individuals and the government must increase investment and action. Employers and individuals should contribute most where they derive the greatest private returns. Government investment must focus on building a basic platform of skills for all, tackling market failures and targeting help where it is needed most.
• Focus on economically valuable skills. Skill developments must provide real returns for individuals, for employers and for society at large. Where possible, skills should be portable to deliver mobility in the labour market for individuals and employers.
• Demand-led skills. The skills system must meet the needs of individuals and employers. Vocational skills must be demand-led rather than centrally planned.
• Adapt and respond. No one can accurately predict future demand for particular skill types. The framework must adapt and respond to future market needs.
• Build on existing structures. Do not always chop and change. Instead, improve the performance of the current structures through simplification and rationalisation, stronger performance management and clearer remits. Continuity is important. (Leitch Review of Skills 2006: 16-17)
The demand and supply of skills by sub-sector in financial services. Skill issues in the major sub-sectors or industries are treated in this section of the report. There is no attempt at completeness because the vast majority of skilled workers engaged in financial activities work in these half-dozen industries. The public sector. Government both uses and trains skilled labour in the production of financial activities. But it tends to produce qualified workers on a scale smaller than its own new and replacement needs. In consequence it exerts a net demand for higher level professionals trained in the private sector. This appears to be true for all levels of government. For example, recently the Gauteng government launched a programme for the training of skilled workers to provide their services at the local government level. “The municipal standing committees on public accounts, also known as Scopas, were launched…to promote oversight and accountability in municipalities…such committees should be provided with competent staff to study the reports and provide information on them.” (Business Day 13/3/2008)

52
The Gauteng government also admitted “[A] 40% auditor vacancy rate or 89 unfilled posts…A high staff turnover was caused by the huge demand for skilled and competent auditors in the market, mainly due to the introduction of the Public Finance Management and Municipal Finance Management acts, where the existence of an internal audit unit was mandatory.” (Business Day 14/3/2008) The share of the public sector – “SARS and Government Departments” – in total financial services employment is 13%. This proportion is influenced by the way the sector is defined by Fasset (2007B: 2). But Fasset is not the only Seta relevant to skills issues in financial activities, as was discussed previously. So there is no readily available estimate of public sector demand for skilled professionals like accountants, auditors, accounting technicians and financial managers. An alternative source document Fasset (2007A: 11-12) lists as an “existing need” in the public sector the following categories of skills. But there is no explanation or description of the information source, and the comprehensive set reads like a wish list of all possible skills with a financial dimension.
• “Literacy and numeracy skills • Basic accounting skills, especially in respect of new people who enter
organisations in entry-level posts • Accounting support skills (eg. those needed by accounting technicians) • Auditing skills • Financial management skills • Experience and training in credit control and debt management • Risk assessment skills • Computer literacy • Management skills for newly appointed chief financial officers • Experience in statistical models, econometrics and macro-economic
modelling • Knowledge of and experience in supply chains • Financial sector policy advisory services, and • Exposure to public finance coupled with analytical skills with regard to
budgeting, strategic planning and information overload assessments.” A final illustration of the complexity of accountancy and auditing skills gaps by race group, presumed to refer to qualified CAs although the context and wording are not clear, is the following statement in a research report completed by a consultant agency for SAICA.
The Office of the Auditor General provided information significantly different from that which applies to the other [training] offices in that demand has stabilized in recent years, sufficient Black and Indian trainees are available and that there is a shortfall of White and Coloured trainees. (SAICA 2007: 29)

53
The kind of information needed for estimating potential gaps in the demand and supply of financial skills in the public sector is illustrated in the following passage from a UK source document. This kind of data appears not to exist for South African financial services skill categories by sub-sector, but should be sought by appropriately designed research.
It has been estimated that about 250,000 qualified accountants work in the [UK] private sector. This sector represents around 60% of GNP. Around 1% of GNP can therefore be said to be supported by some 4,200 qualified accountants. Estimates indicate that around 40,000 qualified accountants operate in the public sector, representing the remaining 40% of GNP. It appears, therefore, that 1% of GNP in the public sector is supported by just 1,000 qualified accountants. (Accountancy Occupational Standards Group 2007: 8)
Banking sub-sector.
The trends and forces operating in skills demand and supply in this sub-sector can be summarised adequately under the following headings. It is a large and diverse set of financial activities as described in an earlier section of this report. But distinguishing between the different kinds of banks is not justified where micro-level detail is not available. Thus the following generalisations apply to the major commercial banks in the South African economy. One important dimension of skills recruitment which distinguishes South African banking is that it appears not to have an image problem with potential job applicants with high level skills. The growth of local commercial banks in recent decades, their ability to offer competitive salary packages, and the evolution of product and process innovations has made this sub-sector an attractive employer to graduates and professionally qualified applicants. This is not the case in certain other countries, like the UK where the banking sector faces a negative image problem when recruiting, as the following passage bears out.
Retail banking, employers felt, is not a career of choice for most employees, and is a sector that young people fall into rather than actively aspire to…retail banking faces a hostile labour market, one in which the sector and its workforce do not enjoy the status and reputation associated with other sectors.” (Financial Services Skills Council, UK 2007: 74)
The strength of such competition in recruitment may be less the case in other countries with highly developed financial services. This is a conjecture awaiting research. But it may be a contributory factor in the extremely widespread conviction that in South Africa the broad bands of occupational activity in these

54
major sub-sectors face a chronic shortage of supply. These occupations are examined in more detail below under the accountancy sub-sector discussion. A further observation bearing on skills deficiencies, is that South African banks have shed jobs in recent decades. This is said to be the consequence of a number of influences. Some are local, like the ongoing consolidation in the industry, a process already raised in the earlier descriptions of sub-sectors in this report.
The [South African] financial services sector has seen a range of major acquisitions, movements, repositioning and volatility. Although it is generally only the conglomerates and the high-profile groups and companies that make the news headlines, increased activity has permeated the entire sector. The forging of international alliances has already begun with Barclays acquiring a major stake in Absa. (Bankseta 2006: 10)
Other reasons for the decline in banking job numbers are common in many, perhaps most, national banking systems. A selection of these are, first, innovation in financial products, a process seemingly taken furthest in the United States and a major contributory factor in the current instability of the American economy. (Lanchester 2008; Dodd 2007) Second, regulation that requires increases in prudential holdings of capital have raised costs for banks in providing their traditional intermediation function. Third, new technology and product innovation have lowered the costs of entry into banking. Fourth, the differentiation of financial instruments and reduced transactions costs – eg. to issue and register a mortgage bond - has allowed companies not previously in banking to participate in sub-activities in the financial intermediation line of activity. Fifth, large firms exploit their client bases by offering a variety of financial services previously supplied by banks acting under regulations. Finally, technological advances have undermined the traditional monopoly of banks in transmitting money for clients. Instead, companies in retail markets use a range of credit card payments mechanisms. (Borio 2007; Von Furstenberg 2007; Bankseta 2006) How job losses in banking influenced the supply and demand for skills in the sub-sector is the relevant question. In broad terms the answer is that, in South Africa and other countries with mature financial sectors, most jobs disappeared at the bottom end of the hierarchy. Clerical workers declined because administrative activities were both centralised and computerised. Sales workers decreased because of higher levels of outsourcing, coupled to the pressure on companies in banking to meet competition by raising hourly productivity in work reorganisation and on-the-job training bouts. At the upper end of the skills ladder, a partial offset was increased demand for more highly skilled workers coming from smaller banks intent on building secure bases or niches for themselves with differentiated products, and from larger

55
banks setting up more specialised components of activity because of the same expansion of product variety. (Van Zyl 2007: 26; Dodd 2007) Insurance industry. The number of posts in the insurance sub-sector listed as those which “organizations struggle to fill” can be ranked by occupational group from highest to lowest. These are for illustration and not a complete listing from the source.
• Professionals: 2209 posts, 69.5% of the total number. • Clerical and administrative workers, 12.1%. • Sales workers, 11.4%. • Managers, 5.6%. (Bankseta 2006: 47)
Tables 8 and 9 respectively show the categories of skills supplied within the sector, and the professional occupations deemed to entail “scarce skills”. These show the limitations on the insurance sub-sector supply, as identified by respondent firms within the relevant Seta. In summary, “the most pressing skills shortages were experienced in respect of actuaries, chartered accountants and other financial professionals such as specialist portfolio investment managers, qualified financial planners and business analysts. The employment agents also reported a shortage of the higher level numerical skills required in positions filled by financial analysts, semi-professional and actuarial support staff, and business and management consultants.” (Bankseta 2006: 49, italics added) Two issues arise for discussion. First, as with accountancy and auditing the widely accepted constraint in the insurance industry arises from the low number of South African school leavers who pass matriculation with high grade mathematics. This is not exclusively a local problem. But South Africa’s dismal performance in international comparisons of performance in mathematics and science is particularly low. It continues to show up in assemblies of comparative data on educational achievement, like TIMSS (Trends in International Mathematics and Science Study). (DPRU 2007; Hanushek & Woessmann 2007; Gelb, Keeton & Malikane 2005; Taylor, Muller & Vinjevold 2003; Wolf 2002) Second, there is some disagreement whether shortages of actuaries are a major constraint on growth in South Africa’s insurance industry, accounting firms and other investment organizations active in the financial services sector. For example implementation of the Basel II rules is projected to constitute a positive demand for actuarial skills. (Wim Els, Actuarial Society of South Africa, personal communication.)

56
All projections of risk require actuarial skills although not necessarily fully trained and qualified actuaries. University graduates in actuarial science are hired and well paid, and a proportion do not go on to become fully-qualified actuaries. In addition, the switch from defined benefit to defined contribution pension funds in the last two decades, roughly speaking, reduced the demand for qualified actuaries. But demand growth in short-term insurance and health-care has offset the lowered recruitment in the pensions industry. What the current position in 2008 is regarding a shortage is unclear, but in 2005 ASSA, the Actuarial Society, published a report with the title: “Actuarial surplus! The challenge of finding work for actuaries.” This contrasts with the UK market for actuaries where a chronic shortage is unquestioned. (FSSC, UK 2007) Table 10: Mapping of the provision of skills to specific occupational categories in insurance. Occupational category Main source of skills Comments on supply
Senior Officials and Managers
HET/FET training Industry experience Management courses (from
MBAs to short courses)
Few senior black managers with sufficient industry experience
Shortage of skilled black managers
High turnover among black managers
Professionals
HET sector Professional learnerships CPE – professional bodies
and private providers
Sufficient general output from HET sector, but the sector competes with the rest of the financial services sector and the rest of the economy
Insufficient industry-qualified professionals
Growth and transformation in high-level professions is slow
Long lead-time before new industry-specific qualifications start to make an impact
Clerical/Administrative Workers
School system Industry-specific FET training Learnerships In-service training by
employers
Sufficient numbers of people in the market
Lack of numeracy and language skills
Service and Sales Workers HET and FET institutions Intermediaries have to comply with FAIS requirements
Source: Inseta (2006:45)

57
Table 11: Scarce skills: professional occupations in the insurance industry. Occupations Posts difficult to fill
Financial and investment advisers 1084 Underwriters 279 Insurance brokers 201 Claims assessors 196 Nurse practitioners 96 Accountants 81 Actuaries 57 Software and applications programmers 70 Marketing specialists 32 Internal auditors 18 Multimedia specialists 15 Business analysts 11 Legal advisers 7 Human resources advisers 6 Compliance officers and consultants 5 Engineering professionals 5 Source: Inseta (2006: 49) Accountancy and auditing sub-sector. Fasset, the main Seta operating in the financial services sector, provides an interpretation of official skills terminology with its own nuances.
The term ‘scarce skill’ refers to those occupations that are characterized by a scarcity of qualified and experienced people (current and anticipated). In other words, occupations in which the numerical imbalances exist in employment because of a difference between the demand for and the supply of skills. The term ‘critical skill’ refers to particular elements of an occupation, or the qualitative deficiencies that may exist or develop in the skills apparatus of the existing workforce. (Fasset 2007A: 5)
Accountants and auditors at the top of the occupational hierarchy in this sector are the best documented by numbers. This has much to do with the active research and information dissemination of the professional bodies who regulate training and accreditation in these occupations, like the SA Institute of Chartered Accountants (SAICA), the Institute of Certified Public Accountants (ICPA), and the Institute of Internal Auditors (IIA-SA). For accountants, the skill and accreditation category that has a valid claim to be most scarce in the South African financial services sector, Tables 12 to 17 provide broad numbers that are currently in the training pipeline.

58
Table 12: Sectoral distribution of Financial Services professionals in South Africa, 2000-2004.
Percentage of accountants and financial managers employed
Sector 2000 2001 2002 2003 2004
Agriculture, hunting, forestry and fishing 0.2 0.5 0.0 1.4 1.1Mining and quarrying 0.9 0.0 3.8 1.1 0.5Manufacturing 12.4 15.2 7.0 8.7 10.8Electricity, gas and water supply 1.4 1.9 1.0 1.5 2.5Construction 0.9 0.0 0.6 0.8 0.8Wholesale and retail trade 4.5 4.1 6.2 6.5 16.7Transport, storage and communication 1.9 6.8 5.7 4.6 2.0Financial intermediation, insurance, real estate and business services 58.0 60.9 61.5 60.9 57.0
Community, social and personal services 12.4 10.2 12.2 14.2 8.7Other 7.4 0.3 2.1 0.3 0.0Total 100.0 100.0 100.0 100.0 100.0Source: van Zyl 2007
Table 13: Percentage distribution of SA Financial Services professionals according to population group, 2000-2004.
Source: van Zyl 2007.
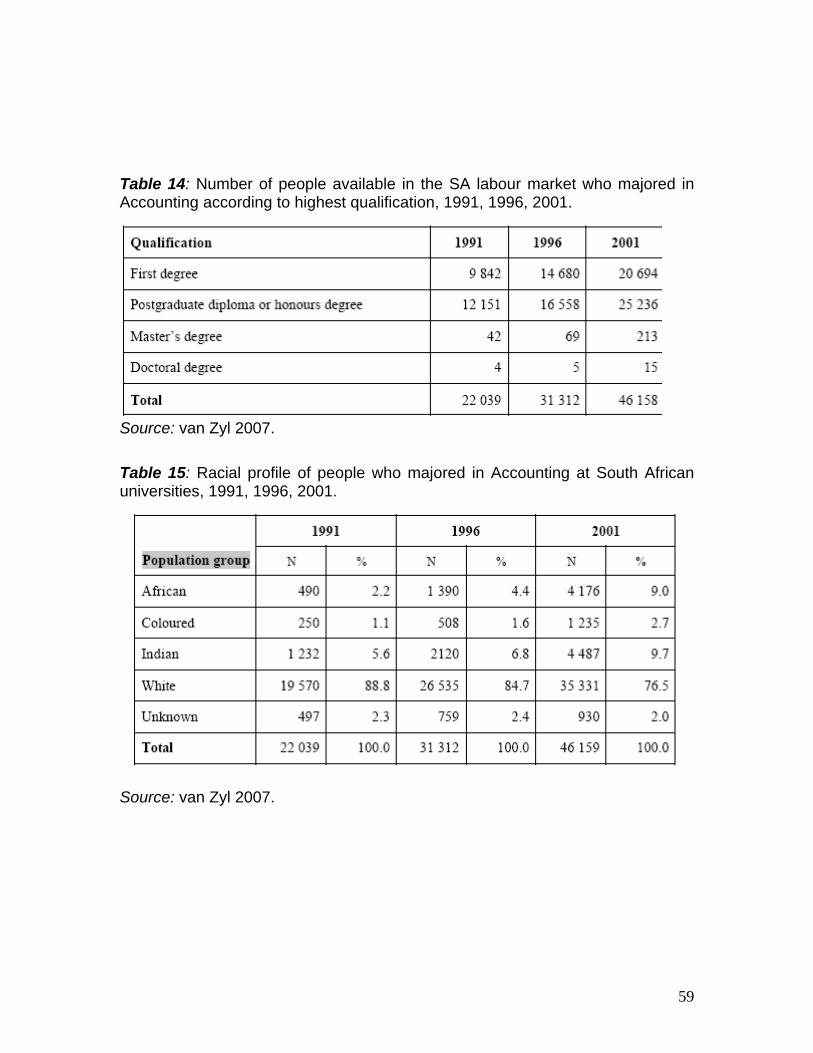
59
Table 14: Number of people available in the SA labour market who majored in Accounting according to highest qualification, 1991, 1996, 2001.
Source: van Zyl 2007. Table 15: Racial profile of people who majored in Accounting at South African universities, 1991, 1996, 2001.
Source: van Zyl 2007.

60
Table 16: Gender profile of people who majored in Accounting at South African universities, 1991, 1996, 2001.
Source: van Zyl 2007. Table 17: The following occupations have been reported as scarce in South Africa.
Ran
king
Occupation Need for Period *
% of total need
1 Accountants 616 352 Corporate (Administration & Business) Services Managers 228 133 Contract, Program and Project Administrators 157 94 Finance Managers 133 85 General Clerks 114 66 Secretaries 94 57 Other Project Managers not elsewhere classified 47 38 Economists 40 29 Bookkeepers 36 210 Financial Investment Advisers and Managers 31 2
* 1 April 2006 to 31 March 2007
(The number of people needed has been summed to the 4-digit level of the OFO or Organising Framework for Occupations.) Source: Fasset 2007: 6
But despite being the largest in total number and in number of identified deficiencies, these financial services professionals are not one of the “five high profile priority skills” clusters identified currently by JIPSA as of strategic importance for economic growth. (JIPSA Annual Report 2007: 9) Why they are omitted and not considered priority skills is a question for future research.
• SAICA is by far the largest professional association with 32900 members in 2005, rising to 35667 in 2007. (Van Zyl 2007: 19; SAICA 2007: 2) This year (2007) the total number comprises 72% qualified accountants and 28% trainee accountants.

61
• “The estimated supply and demand for CTA trainees increases every year. The estimated shortfall of CTA qualified trainees was 664 in 2004 and increased steadily to 1109 in 2007. The estimated [projected] shortfall in 2008 is 1655…[but] any changes in CTA throughput for 2007 will not be reflected in the projection provided. The clear conclusion to draw from these statistics is that training officers would prefer CTA qualified trainees. These results may have significant implications for SAICA’s strategies including policies relating to the education programme.” (SAICA 2007: 18)
SAICA (2007: 10) shows the estimated supply and demand of “First-year trainee accountants”, and the projected shortfall of supply behind demand, by race categories (the table is not reproduced to economise on space). The accuracy of this forecast is unknown but the procedure described in the document appears acceptable. Some estimate of the margin of error applicable would have been helpful.
• SAGRA (2007B) – South African Graduate Recruiters Association -
provides a comprehensive survey of graduate employment and starting salaries but no absolute numbers of vacancies recorded for a set of occupations. Again accountants and auditors dominate the results, summarized as follows. “The key findings from the SAGRA Graduate Recruitment Survey 2007 are:
• Graduate vacancies are set to increase by 4.3% in 2008, compared to 2007.
• The accounting and professional services firms are the largest recruiters – just over half of all 2007 vacancies – and are set for a modest increase for 2008 start dates.
• By job function, the most vacancies in 2007 are in auditing (TIPP) with over half of total vacancies available in this career area.
• The median number of vacancies in 2007 is 22. • The median graduate starting salary for 2007 is R82,500. However, the
primary reason for this is due to such a large number of vacancies within the accounting arena and therefore is a lower figure compared to other industries in the marketplace.
• Just over half of employers expect a ‘cost of living’ increase for 2008 salaries.
• When combined, employers participating in the survey spent in excess of R18m on marketing activities in 2007. The largest proportions were spent on employers own recruitment literature and advertising in national newspapers.
• Behavioural-based interviews were the most popular selection technique for assessing candidates (92%). Aptitude testing was used by 70% of employers.

62
• The median number of applications per vacancy in 2006 was 33.” (SAGRA 2007A: 1-2)
• Hester Hickey, SAICA Chairperson 2007, states that “To attract younger
members, the institute [SAICA] needs to change its training methods. Currently our model cannot serve the needs of the chartered accountant going forward. One of the difficulties is that the output of South African universities is not keeping pace with the demand from local accounting firms. The big four accounting firms, PriceWaterhouseCoopers, Deloitte, KPMG, and Ernst & Young, together required 950 graduates in Gauteng this year. However, there was a shortfall of 450-500 graduates from the three major residential universities in the region. The big four [auditing and accounting firms] require about 1500 graduates nationally, but have had to supplement their intake with part-time students.
What makes things harder is that, according to recent Saica statistics, 6000 (23%) of SA’s 25000 chartered accountants are overseas, while only 24% remain in the auditing profession in SA. The government and parastatals have only 340 chartered accountants and are looking at substantially increasing this number.
The difficulty is that various disciplines, such as engineering, accountancy and actuarial science, are competing for the same pool of matriculants. [O]ne way to address the shortage in the accounting profession is to look at training accountants broadly and not just chartered accountants. Not everybody is going to make it as a chartered accountant, a qualification that requires a professional certificate on top of the usual commerce degree…But chartered accountants are not the only ones in demand – the profession needs good debtors and creditors clerks, and administrative accountants…’There is a huge gap in the middle to be filled. The municipalities desperately need qualified clerks.’” (Business Day 17/5/2007)
• The latest data on skill supply and demand in the sub-sectors that
comprise the range of occupations and therefore skills for which the Fasset Seta is responsible are presented in the tables already supplied (drawn mainly from Fasset 2007A & 2007B). The principal occupations missing are in the banking and insurance sub-sectors of what has been termed, broadly, the Financial Services Sector in this report. These Fasset tables are self-explanatory. The Fasset document shows further that despite possessing post-matric qualifications in the fields of business, commerce and management studies, there is notable unemployment in the group that make up the main supply stream in financial services. There are 535 600 of these,

63
comprising 24% of the total number in the economically active labour force holding post-matric qualifications, that is 2,2 million. Of this group, 88 500 or 17% were unemployed at the time of the September 2006 Labour Force Survey. (Fasset 2007B: 22) This is a surprising and troubling high number. But the rate differs significantly by level of qualification. It is 22% for those with only a post-matric diploma or certificate, in contrast to 1% for those with a post-graduate qualification. Whether these unemployed individuals collectively make up a potential increase in the supply of skills capable of delivering financial services is a complex question. It cannot be answered without more micro-level information about the content of the qualifications and the reasons why these job applicants have been unsuccessful. This information requires special research efforts probably best mounted by the professional associations in accounting and auditing, and financed by the state.
These figures show that there is spare capacity of people who are already educated to some level and who could be available for work in the Financial and Accounting Services sector. Unfortunately, a macro-analysis such as this one does not reveal much detail about the exact skills available among the unemployed. What this analysis does reveal is that most of the unemployed with post-matric qualifications in business, commerce and management studies are young (88% are 34 years or younger) and many are living in areas where organizations belonging to the Fasset sector are thinly spread, for example 11% are living in Limpopo, 20% in the Eastern Cape and 9% in North West. (Fasset 2007B: 23)
• “Specialist financial skills are the most important critical skills in the
[Fasset] sector…The skills are grouped into six broad categories and listed in order of priority within each category.
Management and leadership. • Management skills/leadership skills • Human resources management skills • Workflow and imaging skills
Organisational development/office management skills. • Specialist financial • Accounting skills • Knowledge of taxation, including VAT and capital gains tax • Bookkeeping skills • Auditing skills • Knowledge of commercial and statutory law • Insurance knowledge • Financial and mathematical skills

64
• Investment and micro-lending training skills Information technology.
• Computer skills, e.g. word-processing and spreadsheet skills • Specialist information technology skills
Communication, customer care and marketing. • Communication skills • Marketing skills • Public relations skills • Presentation skills • Client service skills
Support and administration. • Administration skills • Secretarial skills • Business economics skills • Clerical skills • Reception skills
Personal development. • People skills • Education/Basic adult education skills
Professional bodies confirmed the need for financial skills across a broad spectrum of workers in the sector. In the financial market, general financial and mathematical skills, knowledge of financial market instruments and financial market analysis, trading knowledge, and computer knowledge and skills were identified as areas of need. In the management consulting profession, practitioners need to know what constitutes ethical behaviour. This subsector requires a combination of managerial expertise, industry knowledge, technical knowledge and an understanding of management issues. (Fasset 2007B: 39) There is a large and growing literature on skills issues in the supply of auditors and accountants in South Africa. Not all of this presents a consensus view on obstacles and proposed policy initiatives, other than the universal acceptance that a wholly inadequate number of school-leavers with the required standard of mathematics is a major blockage to training higher numbers. Current 2007 enrolments for mathematics in South African high schools are presented in Tables 17 and 18. Table 18: Grade 11 enrolments for 2007 Maths and Maths Literacy in South African high-schools.
PROVINCE MATHS
LITERACY MATHEMATICS TOTAL
EASTERN CAPE 59 000 82 000 141 000

65
FREE STATE 28 101 26 384 54 485 *
GAUTENG 73 997 61 328 135 325 *
KWAZULU NATAL 99 097 126 687 225 784 *
LIMPOPO 75 732 82 507 158 239 *
MPUMALANGA 40 455 34 594 75 049 *
NOTHERN CAPE 10 131 6 695 16 826
NORTH WEST 26 269 25 248 51 517 *
WESTERN CAPE 33 194 29 844 63 038 *
NATIONAL 445 976 475 287 921 263
* Information updated on 24/08/2007
Table 19: Mathematics enrolments SCE 2007.
SubS Name Prov Prov Name Subject Total
Entered A SENIOR CERTIFICATE (FULLTIME) 4 EASTERN CAPE MATHEMATICS HG 4,566 A SENIOR CERTIFICATE (FULLTIME) 4 EASTERN CAPE MATHEMATICS SG 62,474 A SENIOR CERTIFICATE (FULLTIME) 3 FREE STATE MATHEMATICS HG 3,840 A SENIOR CERTIFICATE (FULLTIME) 3 FREE STATE MATHEMATICS SG 20,853 A SENIOR CERTIFICATE (FULLTIME) 8 GAUTENG MATHEMATICS HG 8,143 A SENIOR CERTIFICATE (FULLTIME) 8 GAUTENG MATHEMATICS LG 29 A SENIOR CERTIFICATE (FULLTIME) 8 GAUTENG MATHEMATICS SG 26,094 A SENIOR CERTIFICATE (FULLTIME) 5 KWAZULU-NATAL MATHEMATICS HG 11,064 A SENIOR CERTIFICATE (FULLTIME) 5 KWAZULU-NATAL MATHEMATICS SG 94,175 A SENIOR CERTIFICATE (FULLTIME) 7 LIMPOPO MATHEMATICS HG 13,067 A SENIOR CERTIFICATE (FULLTIME) 7 LIMPOPO MATHEMATICS SG 43,186 A SENIOR CERTIFICATE (FULLTIME) 6 MPUMALANGA MATHEMATICS HG 4,251 A SENIOR CERTIFICATE (FULLTIME) 6 MPUMALANGA MATHEMATICS SG 22,747 A SENIOR CERTIFICATE (FULLTIME) 9 NORTH WEST MATHEMATICS HG 2,413 A SENIOR CERTIFICATE (FULLTIME) 9 NORTH WEST MATHEMATICS SG 16,769 A SENIOR CERTIFICATE (FULLTIME) 2 NORTHERN CAPE MATHEMATICS HG 601 A SENIOR CERTIFICATE (FULLTIME) 2 NORTHERN CAPE MATHEMATICS SG 4,228 A SENIOR CERTIFICATE (FULLTIME) 1 WESTERN CAPE MATHEMATICS HG 5,390 A SENIOR CERTIFICATE (FULLTIME) 1 WESTERN CAPE MATHEMATICS SG 20,149
Source: Data in Tables 18 & 19 supplied by Professor Tessa Minter, Department of Accounting, UCT. The main strategic question concerning the production of chartered accountants, internal accountants, accounting technicians and others in the accountancy profession is whether South African training procedures can be speeded up. The present report cannot answer this question, given its complexity and differences of opinion in the profession, universities and state departments. But the following

66
statements are provocative and need wider attention. The author, John Stuttard, is Lord Mayor of London and a UK chartered accountant.
[C]urrent structures are unlikely to produce [the accountants needed]. First, almost uniquely in the world, SA requires those wanting to qualify as accountants first to take university accounting degrees before beginning professional training. In the UK all that matters is that you master the material necessary to pass the (tough) professional exams – that is, the result and your independently assessed skills are what matter, not how you get them. This ensures the widest possible pool from which to draw the best minds. If South Africa wishes to emulate the success of other countries economically then it should reduce the time it takes to qualify and make it easier for non-accounting graduates to enter the profession. (Business Day 10/10/2007)
An important inference for South African occupational markets at the high end of the skills profile in financial activities is that at least three major industries – banking, insurance and accountancy – compete in overlapping ways for the existing pool of qualified professionals and managers. Skill shortages, skill gaps and the precision of existing estimates. Demand for skilled labour is a derived demand. The process of economic change drives demand alterations in the labour market and consequently skill needs. The sectoral structure by activity and skill needs is itself the result of changes in the patterns of consumer demand, technology and organisational evolution, “as well as the evolving pattern of national competitive advantage [that] continues to change the balance of occupations, qualifications and skills required in the labour market.“ (Campbell & Others 2001: 210) These complicated causal mechanisms, difficult to model, are a reason for not placing a high degree of confidence in projections of skill shortages in any economic sector. Strictly speaking, a fully-specified macroeconomic model is required to make projections of future skilled labour demand. This forms part of the projections in a few countries like the UK but not in South Africa. There is a case to be made that in the absence of such a model, establishing the expected performance in skills training of sectors like financial services, or sub-sectors like accountancy, banking or insurance, will be an approximation. But it will be an approximation of unknown reliability.
A modest claim is the most supportable, like the following for UK skills projections even when a macroeconomic model is used.
67
The results presented here should be regarded as indicative of general trends and orders of magnitude rather than precise forecasts of what will necessarily happen. That is, they are not intended to be prescriptive but rather to indicate the most likely future given a continuation of past patterns of behaviour and performance… If policies and patterns of behaviour are changed then alternative futures might be realised. The results are intended to provide a useful benchmark for debate and policy deliberations about underlying employment trends. (Sector Skills Development Agency, UK 2006: 3, italics added.)
This sub-section of the report examines briefly why claims of skills shortages in South Africa’s occupational labour markets should be approached with greater caution than is mow in evidence. There is no research work directly assessing and validating estimates of shortage. Yet the international literature provides reasons to inject uncertainty into assertions about skills deficiencies. Such tests should strengthen rather than undermine policy concerns. By way of illustration, Tables 20 to 23 illustrate the types of skills and the perceptions about them that are in question, from a UK study devoted to exposing the ambiguities of estimates of skill deficiencies in regional, sectoral as well as national labour markets. (Watson, Johnson and Webb 2006) Its results and the conclusions drawn provide grounds for caution in projections of shortages. The following are the main distinctions emphasised. • The concept of a shortage can be ambiguous without the persons questioned
being aware. UK evidence shows that some respondents – in one study 60 % of employers, companies, recruitment agencies – take the question about shortage numbers to refer to external recruitment difficulties they have experienced in the relevant occupational labour market. The remainder of employers (about 45% because some thought it referred as well to their existing workers and thus interacted with the two concepts as overlapping), as reported in the Confederation of British Industry survey data, assumed the question concerned the skill deficiencies evident in their existing workforces. (Forth & Mason 2004; Richardson 2007; Richardson & Tan 2007) Yet these are rather different concepts of deficiency.
• An additional problem is that “when employers talk about skill, they are often
referring to a range of desired behavioural attributes (reliability, adaptability, ability to work without supervision) as well as the technical abilities that are more conventionally considered to be ‘skills’”. (Watson & Others 2006: 40)
Because such inconsistencies have crept into the operational definitions used in national surveys of skill quantities asserted to be in excess demand, recent suggestions have been to avoid use of the word “shortage” completely.
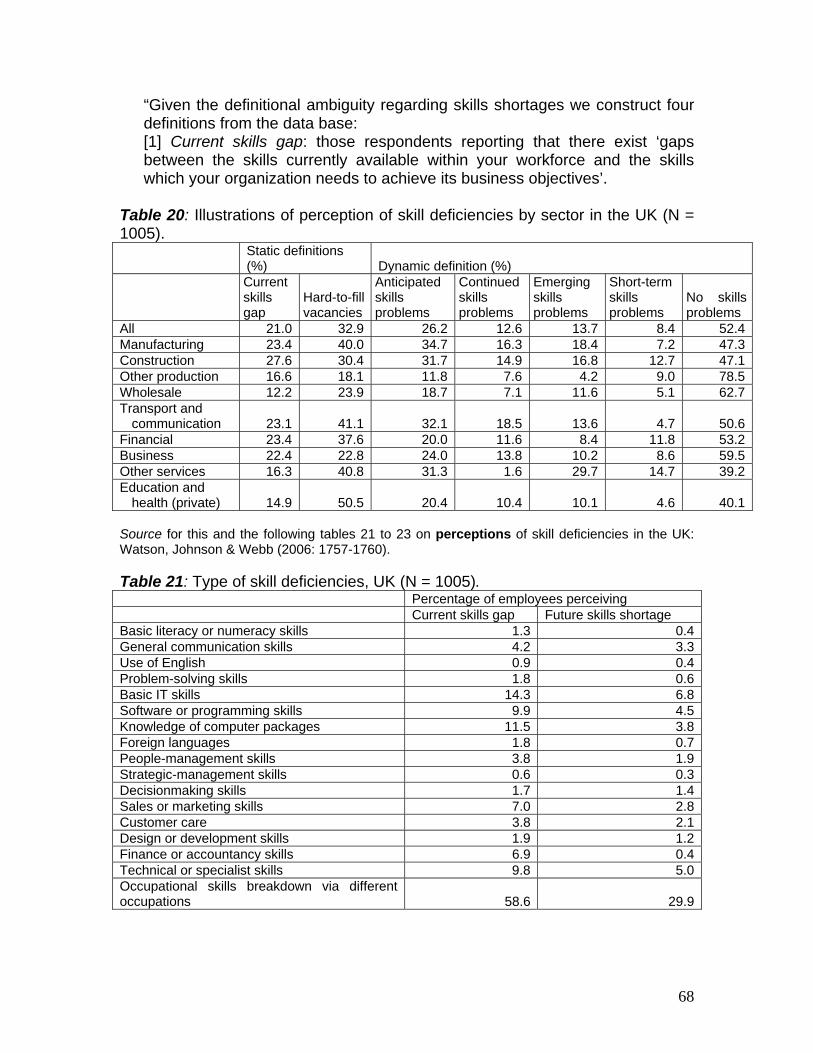
68
“Given the definitional ambiguity regarding skills shortages we construct four definitions from the data base: [1] Current skills gap: those respondents reporting that there exist ‘gaps between the skills currently available within your workforce and the skills which your organization needs to achieve its business objectives’.
Table 20: Illustrations of perception of skill deficiencies by sector in the UK (N = 1005).
Static definitions (%) Dynamic definition (%)
Current skills gap
Hard-to-fill vacancies
Anticipated skills problems
Continued skills problems
Emerging skills problems
Short-term skills problems
No skills problems
All 21.0 32.9 26.2 12.6 13.7 8.4 52.4Manufacturing 23.4 40.0 34.7 16.3 18.4 7.2 47.3Construction 27.6 30.4 31.7 14.9 16.8 12.7 47.1Other production 16.6 18.1 11.8 7.6 4.2 9.0 78.5Wholesale 12.2 23.9 18.7 7.1 11.6 5.1 62.7Transport and
communication 23.1 41.1 32.1 18.5 13.6 4.7 50.6Financial 23.4 37.6 20.0 11.6 8.4 11.8 53.2Business 22.4 22.8 24.0 13.8 10.2 8.6 59.5Other services 16.3 40.8 31.3 1.6 29.7 14.7 39.2Education and
health (private) 14.9 50.5 20.4 10.4 10.1 4.6 40.1 Source for this and the following tables 21 to 23 on perceptions of skill deficiencies in the UK: Watson, Johnson & Webb (2006: 1757-1760). Table 21: Type of skill deficiencies, UK (N = 1005). Percentage of employees perceiving Current skills gap Future skills shortage Basic literacy or numeracy skills 1.3 0.4General communication skills 4.2 3.3Use of English 0.9 0.4Problem-solving skills 1.8 0.6Basic IT skills 14.3 6.8Software or programming skills 9.9 4.5Knowledge of computer packages 11.5 3.8Foreign languages 1.8 0.7People-management skills 3.8 1.9Strategic-management skills 0.6 0.3Decisionmaking skills 1.7 1.4Sales or marketing skills 7.0 2.8Customer care 3.8 2.1Design or development skills 1.9 1.2Finance or accountancy skills 6.9 0.4Technical or specialist skills 9.8 5.0Occupational skills breakdown via different occupations 58.6 29.9

69
Table 22: Breakdown of occupational skills: current skills gap, UK. Occupation Current skills gap (%) Managers and administrators 1.19Professional 4.86Associate professional and technical 14.66Clerical and secretarial 7.16Craft and related 44.84Personal and protective service 6.91Sales 0.68Plant and machinery operatives 19.44Other 0.26Total 100.00 Table 23: Reaction to anticipated skills-deficiency problems, UK. Percentage of those anticipating shortages Increasing training 50.3Recruit necessary staff 39.2Improve wages and conditions 17.9Subcontract work out 15.7Introduce more automation 6.2Work around difficulty 42.1Other 13.8Do not know 2.0
[2] Hard to fill vacancy (HTFV): those respondents that have ‘experienced any difficulty in recruiting the staff you need’ during the 12 months prior to the survey. [3] Anticipated skill problem: those answering ‘yes’ to the question ‘could you say whether you anticipate that skills shortages in the next 3 to 5 years will affect your company’. [4] Emerging skill problem: employers that do not feel that they have a current skill gap, but anticipate that skill problems of some kind will emerge in the future.” (Watson & Others 2006: 44)
If we apply these distinctions to the South African statements of skill shortages by occupation in specific sectors, like the estimates quoted by professional associations and the main Setas in the financial services sector there are questions thrown up. We probably do not know with sufficient clarity (i) which concepts of deficiency underlie them, (ii) in what magnitudes, and (iii) whether the implicit definitions used are uniform between the employer sources consulted. What follows is that the shortage estimates now circulating in the South African policy arena can have ambiguous implications for skill formation planning by companies and industry organisations, as well as for Setas and the state agencies charged with fostering skills training. Whether we will overcome this
70
problem in the future remains to be seen. But we have to recognise it first. What we do with the existing numbers claimed to be shortages is not yet clear. We need to assess their accuracy by paying attention explicitly to the way they were gathered at the micro-level. But this task has to remain pending until the cluster of definitional uncertainties raised here are tested. The present report suggests that this become a priority for government departments and research bodies. • Another potentially serious source of uncertainty about skill shortages is the
existence of influence activities within companies, corporations, state departments and other organisations employing skilled labour. The capacity to influence information and decisions comes into play when respondents provide estimates of the shortages they state their organisations to be facing. Influence activities arise in organizations when organizational decisions affect the distribution of wealth or other benefits among members or constituent groups of the organization and, in pursuit of their selfish interests, the affected individuals or groups attempt to influence the decision to their benefit. The cost of these influence activities are influence costs. The fundamental difficulty with [any] policy of selective intervention is that it requires that there be a decision maker with the power to intervene who collects information with which to make decisions. (Milgrom & Roberts 1992: 192-3, italics in original).
When this suggestion is tested on skill shortage estimates in other countries there are claims and evidence provided that, when surveyed, personnel departments in large companies tend to have a motive to exaggerate skill deficiencies. This is true under certain conditions. Conversely, if information of the same kind is obtained from non-personnel company officials – like senior line or production managers and supervisors - the shortage figures supplied are generally lower. An example from the UK of yet more influences, based on research by Bosworth (1993), is summarised in a recent paper. “Empirical tests involving multivariate analysis of establishment data from the 1990 Skill Needs in Britain Survey demonstrate that the probability of an establishment reporting a skills shortage depends on a range of factors. This includes: the size of the establishment; whether it is based on a single site; its sector; the occupational structure of employment; and the nature of the local labour market.” (Watson & Others 2006: 41) The literature on the question of reliability in skill shortage estimates is growing in certain countries where there are campaigns to raise the national rate of training similar to that in South Africa. Although it is not the present intention to provide a survey, the following questions are relevant to consider in the local discussion of shortages to which this report is a contribution.

71
First, are there systematic differences in perceptions of shortage between employers and employees, as well as between the different layers of responsibility within a single organisation? Second, do similar perception differences exist between recipients of skills like trainees, apprentices and students who place emphasis on “specific job-related knowledge”, whereas management and supervisors lay stress on the importance of “soft skills” like inter-personal abilities and punctuality? Third, do differences in the asserted importance of skills by type show up between those experienced in the work place and those lacking experience? The latter are labour market respondents, either just completing formal education at one or other level, or emerging from unemployment spells, some short and some long, before finding their first job. The main point is that experience itself appears to influence perceptions of skill requirements in production. Finally, an illustration of the importance of these distinctions, as well as the research steps essential to establish skill shortages with a reasonable degree of accuracy, is provided by the following illustration. Vacancies can be hard-to-fill for three main reasons. Only the third reason is a skill shortage.
1. A lack of applicants (perhaps a reflection of the nature of the job on offer). 2. Employer perception of applicants’ attitude, motivation and personality. 3. Applicants lack the required skills, qualifications and experience.
Assessing the scale of hard-to-fill and skill shortage vacancies consisted of four stages, using a Scottish research example for more detail.
A. Establishments identified the number of vacancies they currently had. B. Establishments then said how many of those were ‘hard-to-fill’. C. Next, the reason why the vacancies were hard-to-fill was sought – was it because of the quality of applicants or was it because there were few applicants for the post? D. Where vacancies were hard-to-fill due to the quality of applicants, establishments were asked precisely what qualities were lacking. - Skills shortages vacancies only occur where employers judge applicants to lack the required skills, qualifications or experience. - Where the attitude, personality or motivation of applicants was called into question by employers, these are not skills shortage vacancies. (Future Skills Scotland 2006: 7, 15).

72
Whether any South African estimates of skill shortages follow this elaborated multi-stage procedure is not known. But none of the local sources consulted for this report, nor in previous research, evidenced this practice. This is not a sufficient basis for an outright judgement about the questionable accuracy of existing estimates. But existing international studies provide justification for re-consideration and possible re-design of future measurements of shortages. The quoted passages below indicate the direction new South African research should be taking.
These findings suggest that while employers appear not to have any problem for themselves in interpreting questions on “skill shortages” (if only because they showed no reluctance to answer the question) we cannot rely on them being perceived in a uniform and consistent way by all employers…Our findings point to two main conclusions for future research. First, studies that investigate the causes and effects of “skill shortages” need to pay serious attention to their measurement. If one is not certain of what is being measured, one can hardly be absolutely confident in the findings. Another practical conclusion is that in future research on establishments and their skill formation practices, further steps could be taken to gain clarification either directly or indirectly from respondents as to the experiences they choose to classify as a skills shortage. (Green, Machin & Wilkinson 1998: 183, italics added; Green & Owen 2003; Skinner, Saunders & Beresford 2004.) Overall we failed to reject the proposal that personnel departments within large firms send mixed signals regarding skill deficiencies. One implication of our results is that past research on the extent of skill deficiencies within the UK economy may have been overemphasized due to the failure to control for the bias present in questionnaire responses. Therefore, we would recommend that any future studies using questionnaires to analyse the extent of skill deficiencies should control for the position of the respondent within the company. In this way future results will provide a more accurate picture of the skills problems facing the UK. (Watson & Others 2006: 55-6, italics added.) In the market for engineer-scientists or for any other commodity we expect that a steady upward shift in the demand curve over a period of time will produce a shortage, that is, a situation in which there are unfilled vacancies in positions where salaries are the same as those being currently paid in others of the same type and quality. Such a shortage we will term a dynamic shortage. The magnitude of the dynamic shortage depends upon the rate of increase in demand, the reaction speed in the market, and the elasticity of supply and demand. (Arrow & Capron 1959: 301)

73
It is ironic that this last statement by Arrow & Capron is nearly fifty years old. It clearly states the requirement, already raised in this report, that it makes little sense to speak about the shortage of any commodity without explicit reference to its price. We cannot identify quantities of skills or occupations as being in excess demand – for instance, a shortage of some specific skill like a qualified chartered accountant – nor can we analyse the possible reasons for such a shortage without linking that shortage to its price. The concept has to be of a shortage at a stated level of the wage or salary package payable for a skill of the same type and quality currently being paid. Forecasting skills demand. From the date of its launch the National Skills Development Strategy has aimed at the construction of skills plans at workplace, sector and national levels. Recently, skills planning at the national level appears to have shifted down the action agenda for reasons not clear to researchers. Skills forecasting is subject to unknown margins of error and is no longer practiced widely in the majority of countries. In general, the international literature is skeptical after the disappointed hopes for developing country man-power planning exercises conducted in the 1970s and earlier (ILO 1995; Heijke 1994; Hopkins 2002; Ellis 2003; Woolard, Kneebone & Lee 2003). Despite these doubts, the designers of South Africa’s NSDS appeared convinced in the mid-1990s that increases in skills investment would be assisted by projections of skill needs. They became a cornerstone of the new policy. The potential pitfalls to forecasting can be summarized under headings like the ‘Three -Ts’. This is the necessity to assume fixity of tastes or of unchanging preferences held during the relevant period by consumer as well as investor decision-takers; of technology in production; and of trade in all goods and services. For any skills plan to convey useable information these dimensions must be presumed to remain sufficiently static over all meaningful forecast periods. Only then will future skills profiles of acceptable accuracy be obtainable. But from the start these assumptions are questionable on empirical grounds, so they must be tested first for plausibility. Forecasting difficulties show up in all national labour markets.
As long ago as 1989 the main [UK] national employers body – the Confederation of British Industry (CBI) – argued that “few employers are able to predict their medium term skill requirements with any confidence. The uncertainties over technology, exchange rates, and future corporate strategies are simply too great to allow traditional corporate manpower planning approaches to work effectively”. Many of these factors have with the passage of time become more, not less, uncertain (Gleeson & Keep 2004: 56).

74
The subject of forecasting is large, so brief observations suffice to show the underlying uncertainties. For instance, freeing up international capital flows and the increasing globalization of trade in recent decades have significantly widened the range of goods and services bought and sold in the majority of commodity markets. In consequence changes in tastes have accelerated causing alterations in the mix and availability of consumption and investment goods, and therefore in the demand for skilled inputs. Yet the causes of such changes are not easy to identify in the absence of well-designed surveys. (Acemoglu 2002; Crafts 2004; Rodrik 2004) Similarly, sites of production can be located more readily in different national territories so they are subject to a wider range of places to choose. Thus the pattern of productive skills in demand in a national economy has to alter in step with such compositional changes driven by trade as well as by direct investment in production capacity that crosses national boundaries. That can make the current forecasts of skill requirements subject to wider error margins than in the past. This is an argument to be examined thoroughly. The second obstacle to effective forecasting is the relationship between technological change and the required human capital in skilled, semi-skilled and unskilled labour. The key unknowns are the substitution possibilities within any given technique of production in use. Substitution refers to the flexibility or, at the opposite end of the spectrum, the fixity of input coefficients per unit of output; that is, how much skilled and unskilled labour, capital, energy and so on is required for each unit of production. Can a road be built as cheaply with unskilled labour equipped with spades and wheelbarrows as it can with bulldozers and mechanical earth movers? This is posed in relative terms, because input-output ratios exist along a spectrum. For instance, from low to medium to high capital intensity can characterize the technique of production in question. Fixed input coefficients – say a fixed quantity of capital or skilled labour per unit of output produced – is a useful assumption for certain purposes. But that is all we can say when it comes to forecasting the demand for skills. We cannot know in the absence of research for the purpose. One large American study some years ago was emphatic about the major unknowns that attach to the characteristics of technology and the resulting determination of the kinds of skills in demand. Still widely cited, it embodies the skeptical position on skills forecasting that has emerged in recent decades.
The conclusions of this research [on the effects of technological change on the skill requirements of employment] are subject to such enormous uncertainties that policy-makers concerned with training and education are well advised to avoid large resource commitments to any specific vision of the detailed occupational structure and skill requirements of the future US
75
economy…[One illustration is] a study by Binkin of the US military’s experience in forecasting and adapting to the changing skill requirements of new weapons systems…shows that the military authorities have been remarkably unsuccessful. Even within an environment in which the design and introduction of new technological systems and the training of personnel to operate these systems are largely controlled by a single organization [the armed forces], the skill impacts of new technologies have created severe difficulties for policymakers. (Cyert & Mowery 1988: xviii-xxix.)
International trade is a separate source of uncertainty about future skills demand that provides a simple case against fine-tuned skills projections. The uncertainty injected into skills projections has arguably become greater in recent decades with globalization. Trade entails a policy dimension that by its nature is political as well as economic. Thus it is difficult to conceive a reliable forecasting procedure taking into account both changing comparative advantages on economic grounds in foreign trade patterns and shifts in goals and alliances with other countries driven by political considerations. An additional complication for forecasting, independent of technology and trade influences, is the evidence that skilled as well as graduate unemployment has risen in South Africa in recent years. (Pauw, Oosthuizen & van der Westhuizen 2006; DPRU 2007) If true, how is this trend to be reconciled with claims of intermediate and high level skills shortages amongst the economically active population? No research has yet addressed this question directly. At high levels where a worker’s skills are deliberately matched with the requirements of a job, for success specific information is required on both sides of a hiring contract. A worker may possess a conventionally described skill, have the documentation to support that, and yet may be judged unsuitable by a potential employer. Quality deficiencies, including personality characteristics, may be the simplest explanation. It explains why information about occupations is often of such limited use in identifying true labour market supply and demand conditions for skills. (Blaug 1995; Spenner 1995; Felstead & Others 2007) Another consideration is that the information technology or ‘computer’ revolution has not been skill neutral. It has pushed up the productivity of high-skilled more than it has that of low-skilled workers, relatively speaking. (Feldstein 2003) This is well known and accepted to be a universal trend. “To provide some examples, computer engineers and programmers have been designing hardware and software that have displaced lower-skilled workers, whether through robots replacing assembly-line factory workers, electronic scanners replacing check-out clerks at retail establishments, or voicemail replacing answering clerks” (Chiswick 2005 :2).
76
In essence what has to be devised for usable projections of skill demands is a system of translation between knowledge of skills needs at an establishment or plant level and a functioning training system. But when aggregated or added together, can such a translation process operate at the industry level too? So it is an open question, best treated without preconception, whether any interest group – employers collectively, the state, or even organised workers – can unaided make human capital projections forward in time that are a spur to investment decisions in skills training. In consequence it may be more prudent to concentrate on the competencies of economically active individuals in broad groups (by educational qualifications, certificated skills, work experience, age, gender, language proficiency) because these competencies determine the likelihood of labour market success regardless of occupation, sector and specific job vacancies? (Bassanini & Others 2005; Forth & Mason 2004; Bassanini & Ok 2004; Blondal & Others 2002; Culpepper 2001) Certain researchers in the field are explicit in rejecting the main presumptions that underlie skills forecasting.
[T]here is no real sense in which a given level of education in the economically active population in a country can be said to be technically “required” to permit the achieved level of economic growth of that country. Such an argument grossly exaggerates the contribution of manipulative and cognitive skills in the performance of economic functions, ignores the fact that such skills are largely acquired by on-the-job training, and utterly neglects the vital role of suitable personality traits in securing the “invisible handshake” on which production critically depends. In short, educational policies may be fitted to literally any level or rate of economic growth and cannot be justified in terms of those patterns of growth. Education does make a contribution to economic growth, not as an indispensable input into the growth process, but simply as a framework which necessarily accommodates the growth process. (Blaug 1995: 51)
There are at least two types of changes, quite different, which contribute to alteration in the demand for skilled labour: “(a) changes in the composition of jobs in the economy, and (b) changes in the skill requirements of individual occupations” (Rumberger 1995: 219). Successful forecasting has to take account of trends in both of these components of demand. There is no evidence in the wider literature on skills projections that these have been tackled satisfactorily by research-workers and policy makers in other countries. A recent Australian study of skills forecasting is relevant to our attempts to project the growth in demand that aims at a level of precision that makes it usable in facilitating matches between the demand and supply of identified skills.

77
How should the VET sector decide what to teach in the light of the virtual impossibility of reliable projections of the demand for skills, at the necessary level of detail? We counsel against trying to project the number of new VET graduates who will be required, by level and type of skill and by location, and then using this to determine the shape of skills training. We do so for two reasons. One is the obvious point: that it cannot be done with any accuracy at the level of detail that is needed for deciding just what to teach and where. The other is a more comprehensive point. The labour market is a dynamic entity. People are constantly changing their jobs, learning new skills from their work, moving to new locations, moving in and out of the labour force and changing the number of hours per week that they work. At the same time, firms are being born, growing, dying, declining, altering the size and skill set of their workforce, recruiting strategic new skills, training some of their existing staff with the incremental skills they find they need. In all of this, formal vocational education has an important, but modest role to play. It is a misunderstanding of how the labour market adjusts to believe that there is a direct, one-to-one relation between an expansion in output, the associated increase in skills needed to produce that extra output, and a requirement for the VET system to provide those extra skills. (Richardson & Tan 2007: 33, italics added.)
To forecast the future demand for an array of skills is to face a problem familiar to economists and other social scientists. We have an abundance of complex variables, including the vagaries of human choice under uncertainty and partial information, that make projecting into the indefinite future highly problematic. Figure 1 illustrates the main requirements schematically. It brings out the set of assumptions that cannot be side-stepped if a projection is to have any hold on the kinds and levels of the spectrum of skills for which an effective demand exists. Although drawn from a UK exercise in forecasting, it does illustrate what kinds of decisions have to be faced explicitly by South African institutions devoted to projecting skills in demand.

78
Figure 1: The logic to be followed in preparing skills projections (an example from the UK).
Assumptions for Assumptions for proportions of proportions of workforce by workforce by occupation & by occupation and by qualification qualification (whole economy) (by sector)
Index of average Relationship skills level in each between average sector skills level and • average labour
productivity • average earnings • sector output Output and
productivity by sector
Assumptions for change Assumptions for changes to
to productivity by sector demand factors which drive in forecasting model output in forecasting model
Macroeconomic and sectoral projections in model for output, employment, skills by level & type, and average earnings. Figure 1 illustrates both the logic and the set of specific assumptions deemed necessary for skills projections in the UK. These requirements are not simple to meet and are essential to recognise in the South African discussions of forecasting. Source: based on Beaven & Others (2005:7) Skills training issues in theory and practice. One obvious question is why profit-maximizing companies in practice do finance part or sometimes the whole of a workers' general training in mobile skills? The model of a reasonably competitive labour market predicts that it is a high risk strategy for them. This is because in theory there is no way for them to hold the

79
worker once trained in transferable skills, and who is open to job offers from other employers. How do employers successfully reap a return on such high risk investments? Is the pursuit of mutual goals on either side of the training divide – by trainer and trainee – hampered, or as may be the case, assisted by market failures? We do not know. A number of answers are suggested in the literature, and a selection is summarised below. These all comprise reasons why an employer in a sector like financial services may be motivated to finance training in skills that are portable. In all cases there is an inherent risk of losing the worker once trained. Where applicable, matching institutions that have evolved in a range of countries to support stable training equilibria are mentioned as possible innovations. Figure 2 provides a summary of the broad inputs into skill development. It is a useful reminder that training as such is only one route for employees and employers to acquire the work competencies they demand for higher earnings and profitability. In practice there are inter-action effects between all these input routes. But these are difficult to model adequately and to quantify by recourse to assumptions of unknown accuracy. * Rapid technological change. If the returns to existing skills are declining relatively due to a high rate of technical progress in an industry, so that only firms that keep up with the shifting technological frontier can provide the suitable new training, workers will not readily resign their jobs because of falling returns. This makes their investment in skills training relatively secure. Due to uncertainty and risk aversion, workers may not do so even when paid a wage below the full marginal product of their skills over a period long enough for the investment outlay to be recouped by the employer. Up-dated training to overcome such obsolescence in work competencies then can become profitable to the firm wishing to capitalize fully on the new techniques of production becoming available. (Pichler 1993; Freeman 2002; Ananiadou & Others 2003; Lynch 2005) * Remedial training. American studies have identified enterprise-based training efforts which are not only general in character but even remedial, being deliberate attempts to overcome schooling deficiencies in the work-force. Seemingly this is profitable in a supply environment that lacks the required skills which otherwise might be bought-in from the market. Informational asymmetry might also be at play, although the evidence is hard to come by. Already employed workers, known to be of the high-school dropout standard in the American context, have work-related characteristics known to the employer. They contrast therefore with newly hired workers who possess more of the basic skills in demand but are also more at risk of proving unsuitable in the other dimensions wanted, like sociability, reliability and adequate capacity to learn.

80
Careful reading of the corporate profiles indicates that an important underlying factor in many firms [engaged in training] is a growing concern about the quality of the products that the firm produces...In sum, the forces behind the emergence of work-place education programs for hourly workers are many. Firms are concerned about both efficiency and quality, Figure 2: How skills are acquired.
Source: Lopez-Bassols (2002: 8)
and they also recognise that they must somehow fundamentally alter the way in which they go about production. Their customers are in many cases creating the push for this to happen. At the same time, managers recognise that work-place education is good for workers. In these firms, work-place education is clearly viewed as a win-win situation, as opposed to the win-lose situation [in skill acquisition] that is described by the theoretical framework of neoclassical economics. (Bassi 1994: 64-5; McIntosh & Vignoles 2001; Keep, Mayhew & Others 2002; Ananiadou & Others 2003)
Other (e.g. self-training,
non-formal learning)
Training (on-the-job or external)
Work experience
Formal education
Skill development
Natural abilities

81
* The options value of training. The economic value of completed training has to be conceived in two parts: its use in the intended employment within the training firm, and its “options value” in the future. Thus its potential multiple uses in other jobs - its polyvalency - is a worker motive for further skill acquisition, including for raising the worker's ability to deal with emerging new technologies. It is contended that a non-training firm, considering the poaching of needed skills, has little knowledge of the potential polyvalency. “[So this] informational asymmetry between a training and a recruiting firm therefore reduces the net benefits that a worker with general training can obtain by moving to another firm. We shall argue that this implies that a firm may find it feasible to finance part, or all, of a worker's general training” (Katz & Ziderman 1990: 1148). * Social expectations on training provision. Another explanation for employer-provided general training is political economy in nature. It invokes a social expectation about the collective responsibilities rather than individual responsibility for financing post-school education and training. This public commitment has evolved alongside the other features of a welfare state in industrial countries. In a sample of British firms studied in 1990, all training was company-funded because (1) in the employer's perception “training outlay [is] an inescapable operating cost, rather than an investment in human capital”; (2) “managers...cited equity. Young people in further or higher education do not contribute to their tuition costs, and may even obtain maintenance grants, depending on parental income. So young people leaving school for the work-force do not see why they should pay for their costs of training.” (Hart & Shipman 1991: 77-8; Keep, Mayhew & Others 2002) * Externalities and joint supply. Two other explanations of firm investment in skills that are at least partly portable by workers between different employers - contrary to the predictions of the text-book human capital theory – are logical possibilities because we do not know the motives. Such investments rest on the presumption of increasing the beneficial effects from other kinds of investment, like acquiring new technology and generating company loyalty. Alternatively there is the hypothesis that general and firm-specific skill types together comprise an inseparable mixture when produced, a joint supply commodity. This is a sufficient cause of market failure, but difficult to pin down in research. (Bassanini & Others 2005; Brunello & De Paola 2005; Pischke 2005)
The most important result of this paper is the simplest: that not all transferable skills are general, and for some types of on-the-job training for transferable skills, firms - both the training firm and external firms - can obtain a positive share of the return to the training investment. This may explain why firms have been found to invest in transferable training. It also means that there is an externality - of the type sometimes referred to as a poaching externality - associated with some types of...programmes, which
82
may lead to under-investment in training...It is imperfect competition between employers in the labour market on which the existence of an externality depends: if there is a possibility that the worker will move after training to a firm which can pay him less than his marginal product, that firm obtains a positive share of the expected return to training. (Stevens 1994: 557, emphasis added)
* Constraining the turnover of skilled labour. The raising of job security or, what amounts to the same in effect, the lowering of worker turnover to protect the value of investing in portable skills is from the employer's perspective a necessity for a stable training equilibrium to emerge. This can occur simply as a post-training consequence of increased employee loyalty in some national contexts, contrary to the predictions of the competitive model of voluntary training in the labour market. Public policy may be able to encourage or even initiate change in the direction of security. (Bassi 1994; Leuwen 2005; Pischke 2005; Bassanini & Others 2005) A number of institutions and practices are suggested by the international literature, although not all are equally achievable to direct intervention by a state agency. These include: • (i) Targeted subsidies for current employees in danger of losing jobs because
of recession, or from the structural decline of an industry, or through technological change. (Stern & Benson 1991; Keep, Mayhew & Others 2002)
• (ii) Tenure-related wage scales, as in Japan, so that quitters face the loss of high future gains through job-switching if that occurs too soon after training completion. (Hashimoto 1991, 1994; Booth & Snower 1996; Wolf 2002)
• (iii) Moral suasion exerted through chambers of industry and commerce to protect training firms from excessive skills poaching by others, as in Germany. (Soskice 1994; Lynch 1994; Culpepper 2001; Greenhalgh 2002; Wolf 2002)
• (iv) The enforcement of contracts entered into by employers and trainees that prohibit the worker with skills acquired in the company from joining a competitor during a specified period. This provision echoes that in apprenticeship agreements in earlier centuries where the apprentice's right to compete with the master after completion of training was expressly limited (Parsons 1990; Lalonde 1995; Keep, Mayhew & Others 2002).
* Risk pooling and insurance possibilities. A positive payoff to training investment can be realized through insurance schemes or collective funds, although these are proposals more often than practices in industrial countries. Two examples are (1) a revolving training fund that combines subsidies paid but balanced by taxes levied on newly-skilled workers; and (2) guaranteed minimum post-training wage levels where supplements are paid to those earning below the minimum but financed out of

83
taxes collected from those earning above it. If successful no net subsidy is entailed, or no resource input has to be made by the state or collective body. The principle is familiar and clear. Pooling risks and providing assurance that before-the-fact commitments will be met even when conditions change overcomes the inhibiting effect on training investment of the potential for time inconsistency. This happens when one party to a contract aborts the agreement once new information on the likelihood of outcomes becomes available. The state can be such a party. Put in economic terms these strategies work only when there are no hold-up problems. (Ritzen 1991; Feuer & Others 1991; Drake 1991; Dixit 2002; Leuven 2005) * Skills certification. An independent institution for accreditation is essential in every training system. Strong arguments can be mounted for its initiation and implementation by the state rather than industry certification by a professional or collective body elected by firms and workers. First, acquired skills are made portable through being defined, designated, accepted and therefore traded uniformly by all participants in occupational labour markets. In the absence of such standardization, the productive significance of certain skills is not recognised, causing pricing anomalies to emerge. Secondly, the certification of any supplied product is itself a peculiar commodity. It has definite public good characteristics. Certification is a piece of knowledge which cannot be bought and sold in the normal way, in that it is seldom in the interest of individual transactors - in the case of skills, a trainee worker or an employer - on their own to bear the costs of certification. Rather they are induced to free ride. Thirdly, it is essential that certification means that certain minimum standards of performance are met in the public interest. As already observed about the general problems of information asymmetry in the training arena, this points to state responsibility more than to private or professional testing bodies operating under licence. One illustration is Japan, where it is clearly recognised “that it is the customers, whom for the most part only the state can represent, who have an interest in making sure that plumbers can actually plumb and engineers engineer” (Sako & Dore 1988: 79; Wolf 2002) Implementation problems should be noted. Externally-determined standards tend to adjust only slowly to changing work practices, usually because skill monitors and trainers operating outside firms or other production organizations have difficulty keeping up with the evolution of new technology and work organisation (Temple 2002; Black & Lynch 2004). A further complication is the fact that individual employers have an inherent interest in developing and certifying skills on a basis that accords with their own needs, resources and inclinations, but

84
which are often too narrow and firm specific for successful trading in skilled labour markets. (Leuven 2005) However, the most serious difficulties attach to the carrying out of monitoring itself. If enterprise-based training or OJT is frequently more effective than what is institutionally supplied by a training institute or college, as attested by German, Japanese and other national practices in major economic sectors, then there are serious informational and organizational barriers facing accreditation bodies (Ryan 2001; Lynch 2005). Such authorities are external to the site of production, heavily the domain of the private sector, but charged with continually assessing the content and standard of skills acquisition during economic activity. Locally, these are constraints inherent in the work of the skills bodies at sectoral and national levels like SAQA. * The public good dimension of training. Where a commodity has certain characteristics which inhibit or obstruct its free exchange in a market, then it is deemed either a public good or a mixed good with public and private dimensions. The defining features of such goods are that they are non-rival, meaning that more for one consumer does not mean less for another. They are also non-exclusive in that no-one wanting to consume can be stopped from doing so if they do not pay or fail to meet other criteria of rationing or access. Where and wherever these characteristics apply there is the potential for free-riding. Purchasers - consumers or producers if the commodity in demand is an input like skilled labour - are under no compulsion to pay the full resource cost for acquiring it. Clearly market allocation then fails. Training involves the transmission of conceptual skills, meaning abstract, problem-solving abilities, so there is a case for treating it as partially public good in nature. Recouping the costs of producing such skills – an absolute requirement for all private goods - is notoriously difficult for public goods. The poaching of skilled workers by non-training firms, and therefore the inhibition or undersupply of that skill in the economy, lowers social welfare because it leads to suboptimal levels of investment in their acquisition. Overcoming this public good dimension of training by encouraging or regulating co-ordination between the contracting parties, is the challenge to all institutional innovations in national labour markets. (Finegold & Sokice 1988; Parsons 1990; Ashton, Maguire & Sung 1991; Soskice 1994; Heckman 1994; Dixit 2002; Black & Lynch 2005) * Skills as complements to R&D investment. How to internalize the external effects of skill acquisition arises as a policy question when a trained worker's value as an input in production does not accurately reflect itself in the price system. Therefore the volume of training is lower than it might be, because the return to investment in the decision-taker’s perception is partial not complete. One particular argument is that skilled labour of various kinds is a complement to research and development (R&D).

85
[There is] a strong positive correlation between a country’s productivity and the import-weighted R&D of its trading partners. This impact is greater the more open the countries are, the more skilled is their labour force, and in the case of developing countries, the more trade there is with developed countries…But openness is not sufficient – there needs to be absorptive capacity and ability to adapt foreign technology, both of which are related to human-capital endowments and investment in R&D-intensive industries (Hoekman & Javorcik 2004: 460, emphasis added; Wolf 2004).
* Collective decision-taking bodies. Monitoring the delivery and content of training calls for bodies or boards on which skills investors like firms, workers, purchasers of skills and the state are represented, either with equal weight or by a collective agreement about membership proportions. Certain informational difficulties were raised above under the heading of accreditation, where all parties need to play a contributory role. But in addition there are issues of collaboration and legitimacy to be solved. For instance, the acceptability of low pay to new entrants seeking training, as well as workers embarking on retraining, requires that organised labour should support such agreements. (Marsden & Ryan 1991; Keep 1991; Hart & Shipman 1991; Ryan 2001; Wolf 2002, 2004; Badroodien 2005; Kraak 2005) * State loan guarantees and their hazards. To offset successfully the informational lopsidedness that blocks efficient transacting between companies and aspiring skilled workers as well as training providers, is to overcome the problems discussed earlier as moral hazard and adverse selection. They concern appropriate incentives, enforceable contracts and the countering of opportunistic behaviour by one or more economic agent. (Dixit 2002) One example is that attaching to loans made available to trainees and providers through a policy of intervention. Private lenders in financial markets like banks are reluctant to enter this line of business because of the high probability of default. They cannot distinguish good risks from bad risks and there are few sources of surety available for the acquisition of intermediate skills. Unfortunately, what appears the obvious solution which is for the state to act as final guarantor of such training loans, is itself hazardous. Private banks because they cannot lose - ultimately they are insured by the state’s guarantees - will enter transactions that on balance are too risky by their normal criteria. There is the strong likelihood that a proportion of trained individuals will not repay loans. The net result is that taxpayers bear the cost. This section of the report has described a sample of training practises and institutions discussed in the international literature. Some evolved within the market and others resulted from state intervention. It makes most sense to

86
concentrate on the functions performed by interventions in overcoming specific market failures in skills production. Conclusions and policy implications. This report’s main themes of interest to the general reader are listed in a policy context by way of conclusion. First, the financial services sector in the South African economy has been a major success in its growth contribution, in its relative stability, in the level of sophistication embodied in its supplied services, and in its established outward links with the international economy. Where there remain serious problems are the high proportion of the population who do not possess access to financial services. Too many are denied the economic gains attendant on use of payment, intermediation, credit and saving activities in established institutions and organisations. Coupled to this failing are the relatively low numbers of skilled workers from previously disadvantaged groups employed in the major sub-sectors This has a great deal to do with the deficiencies of our schooling system, which falls outside the brief of this report. It is claimed also to be the consequence of unimaginative redress policies adopted by the major employers across this highly varied sector. But judging this contention has not been possible from the research documentation available. Second, by common consent the drivers of change in this sector are regulation, competition and technology. As a force directly amenable to policy action we have to keep regulation in the right perspective. We have to recognise two aspects clearly. Regulation of the main subsectors – banking, insurance and accountancy – can import dangers. It has often been put in place with conflicting objectives in mind. These have been promoting strong national financial institutions, providing consumer protection, fostering sectoral and sometimes regional development, and “preserving financial stability, in particular the safeguarding of the payment and settlement system.” (De Serres & Others 2007: 10; Basel Committee 2008; Borio 2007) Another serious feature of the regulation problem we face is that there is not a first-best model that exists in other economies for copying by a national jurisdiction like ours in South Africa. The current US situation is salutary. Financial regulation, of commercial banks in particular, goes back to 1933 under the Roosevelt administration in the Great Depression. The Federal Reserve was charged with responsibility for insuring bank deposits in deposit-receiving banks but not in other banks. Protection of deposits, although only one dimension of regulation, is a key one. Other kinds of banks and other financial institutions are not subject to these requirements, but then neither are they eligible for bail-outs with public funds.
87
Yet so threatening is the set of present difficulties, that in mid-March 2008 the Federal Reserve is finding ways to assist investment banks like Bear Stearns who are not covered by that particular regulation. The ostensible reason is that these “unregulated” institutions are so large that they cannot be allowed to fail and thereby cause distress to large numbers of individuals as well as become a systemic threat. A failure on such a scale can mean a full-blown depression.
Bear [Stearns] was emblematic of a financial system that grew up over the last two decades, one that largely marginalized traditional banking and that enabled lenders to evade much of the regulatory framework that had also begun during the Roosevelt administration. The new system enabled loans to be made by almost any financial institution…[But] in the end the Treasury will have to do as it did in 1933, and issue broad guarantees. Whether or not that happens, the government may have to revise its regulatory system, which as Mr Geithner [of the Federal Reserve Bank of New York] noted, has “evolved into a very complex and uneven framework, with substantial opportunities for arbitrage, large gaps in coverage, significant inefficiencies and large differences in the degree of oversight and restraint upon institutions that engage in very similar economic activities.” (New York Times, 15 March 2008)
Third, overcoming information deficiencies will be a dominating challenge to the financial sector of any country in the future. But it will also make demands on a country’s scientific ingenuity and the law. All the following words are at root about information: disclosure, transparency, trust, confidence, intangibles, and intellectual property. One major cause of the current financial crisis in the US and other industrial economies arises from a feature as basic as the absence of the working of the price system. Many new kinds of financial instrument are not traded on conventional markets, no prices are thrown up in the ordinary course of business, and their valuations take place through modelling techniques which are highly sensitive to underlying presumptions about trust and action. Finally, people have to bear the consequences of their mistakes. This may sound harsh but it is essential for efficiency as well as equity. One of its many implications is that in practice the state cannot protect every individual and firm from losses through subsidies, guarantees, write-offs and tax holidays in the financial sector. When put in place there is ample evidence that such cushions encourage moral hazard behaviour. Two examples are in banking and in accountancy. When backed by government, because they cannot lose, banks take on higher lending risks, as was evidenced by the Savings & Loan bankruptcies in the 1980s in the United States where deposits were guaranteed. (Milgrom & Roberts 1992) Similarly, in a world of auditing and accountancy dominated currently by major companies only four in number, there is a contention that these Big-4 practitioners will behave as if they are “too big to fail”. Government will not pursue them for misdemeanours or will

88
bail them out of financial trouble rather than expose the financial system to the scale of disruption that occurred with the closure of Arthur Anderson in the wake of the Enron and WorldCom collapses in 2001. In 2005 KPMG broke the law in the US and was not legally pursued by the federal government “for crimes it admitted committing” (Cunningham 2006: 1698). In the industry it was inferred that KPMG was “too big to fail”. This belief by companies can encourage moral hazard behaviour, runs the argument. Large firms take risks that are too high by normal business operating standards. (Bazerman 2007) These concluding observations do not lend themselves to straightforward interpretations of their consequences for the demand and supply of skills in the sector interpreted in this report as financial services. But it seems reasonable to infer that the demand for skills, particularly amongst professionals, professional technicians and the great variety of management skills across the sector, will continue to deepen. If it deepens ever more steeply, the deficiencies in our systems of education and training become ever more strategic to mend. This report has not addressed the economic aspects of schooling in South Africa, nor has it asked how the HE (higher education) division of education conducts its regulatory, financing and steering functions in the production of graduates. But any division between education and training is artificial and contingent on institutional responsibilities. It is not a conceptual distinction that allows for an analytical division of labour. This bifurcation, partly administrative and partly historical, has not been allowed to constrain an artificially narrow view of the policy problem in this report. With that in mind, Table 24 is a useful summary of the large number of dimensions that have to be born actively in mind in the formation of policy designs to meet the requirements of our financial services sector. Table 24: Dimensions of financial system performance. 1. Size of capital markets and financial structure
Financial systems with larger overall capital markets provide easier financing for real investment. This relates to both larger securities markets and to more bank credit. Systems that rely primarily on one but not the other may be less efficient. Also the liquidity of the different markets is relevant for this dimension.
2. Financial innovation and market completeness
Many financial innovations reduce capital market imperfections and make markets more complete. This opens up new possibilities to allocate capital across space, time and risk preferences. New financial instruments and practices, for example, allow firms to manage certain risks by shifting them to investors who have a better ability to bear them.
3. Transparency and information
Financial systems help produce and spread information about investment opportunities, market conditions and the behaviour of agents. The better they function, the lower the asymmetric information between firms and outsiders and the more information

89
should be incorporated into stock and corporate bond prices. 4. Corporate governance There are conflicts between insiders who control a firm and
outside investors who provide financing. Better governance ensures that investors receive the full return on their investment and that there will be few deadweight costs due to opportunistic behaviour by firm insiders, with beneficial effects on the cost of capital.
5. Legal system A key aspect of a financial system is how well it enforces contracts. As it allocates capital across time and space, contracts – either explicit or implicit – are needed to connect providers and users of funds. The legal system and the way in which it is applied by legal institutions determine the “distance” over which capital can be reallocated.
6. Financial regulation, supervision and stability
Government intervention in financial systems tends to be stronger than in other economic sectors. Well designed regulation and supervision should correct for market imperfections and enhance stability, whereas imperfect policies may have adverse effects on the performance of the financial sector.
7. Competition, openness and financial integration
Greater openness of a financial system and more competition among banks and other financial intermediaries lower capital market imperfections. Pressure from competition, for example, should ensure that financial institutions operate efficiently, earn fewer rents from market power and provide new instruments to customers.
8. Economic freedom, political and socio- economic factors
Economic freedom means the absence of constraints to economic activities, e.g. corruption, administrative burdens or political interventions that are unrelated to efficiency. Given the great importance of information, contract enforcement and ease of exchange in financial transactions, there is also a significant role for social capital in the form of cooperativeness ethics and trust.
Source: Hartmann and Others (2007: 16)

90
Box No. 1 Access to Financial Services. (World Bank 2006B)
Theory suggests financial exclusion is a main reason for persistent inequality, poverty traps and slower growth. Financial sector reforms that promote financial inclusion, i.e. broad access to financial services, should be at the core of the development agenda. Empirical evidence linking access to development outcomes is very limited due to lack of data. Existing evidence on financial development, growth and poverty is encouraging and consistent with theory. However, most of the evidence is either at the very aggregate level – using financial depth measures instead of access – or micro studies using financial wealth to proxy for credit constraints. The first step in improving access is measuring it. Hence, the importance of developing indicators of access and barriers to access, as well as collecting in-depth household and enterprise information on financial services. Better data will help us assess which financial services – savings, credit, payment, insurance - are the most important for development outcomes. Indicators of access are just that – indicators. While they are linked to policy, they are not policy variables. Analytical work using micro data is needed to understand the impact of these indicators and design better policy interventions. Among all business environment obstacles firms face, limited access to finance is often the most binding constraint on firm growth. Access to finance is crucial for firm growth. Analysis of survey data suggests that firms often report finance as a key constraint and their growth suffers from limited access. Not all firms are affected the same way. Smaller firms complain more from financing constraints and are affected more by them. However, small firms also benefit the most – in terms of seeing their constraints relaxed – as financial systems develop. Broader access to finance is likely to affect growth through many channels. It is associated with greater firm innovation and dynamism, entrepreneurship, more efficient asset allocation and being able to exploit growth opportunities. Access to finance promotes firm entry and growth of incumbent firms to a larger size, makes it possible to choose more efficient forms of legal organization, and allows firms to operate on a larger scale. For poor households, credit is not the only or in many cases the priority financial service they need: good savings and payments (including international remittances) services and insurance may rank higher. For example, one of the reasons why the poor may not save in financial assets may be the lack of appropriate products. Building inclusive financial systems requires a focus broader than microfinance. While microfinance lessons are important to internalize, in most developing countries, it is not only the poor that lack access to formal financial services; often the middle class is excluded from the financial sector. For example, most small and medium enterprises—even those owned by the non-poor—have limited or no access to formal finance. Greater transparency, and better developed physical, information and legal infrastructures are associated with broader access. Institutional development – good

91
laws, strong enforcement, strong regulation and supervision, good quality information and disclosure requirements – are essential. Evidence also suggests more open and competitive financial systems with limited state ownership are likely to be more inclusive. Contestable financial systems – with foreign entry and private ownership - and absence of rules and regulations that distort the risk taking, pricing or monitoring incentives of market participants, are more likely to provide broader access. Governments have an important role to play in building inclusive financial systems. However not all government action is equally effective, and some policies can be counterproductive. The report sets out principles for effective government policy on access, drawing on evidence. Policy can be more effective if it prioritizes general institutional development and specific infrastructure improvements to facilitate financial market activities that help broaden access. Encouraging competition in the financial sector is important in ensuring that the private sector has the incentives to develop innovative services to serve the underserved segments. Also important are well-designed prudential regulations and their enforcement so that risk-taking incentives of market participants are not distorted. Direct intervention through taxes and subsidies can be effective in certain circumstances, but the errors of the past suggest that the scope here is more limited than is often believed. Likewise direct intervention substituting a government-owned service provider for market intermediaries can be recommended in only a limited range of circumstances, if at all. Much more research is needed to evaluate the impact of access to financial services on development outcomes, and to design policy interventions. DECRG-FP has a comprehensive research program evaluating the impact of access to finance on firms and households, including microenterprises and microfinance products. In the context of the Year of Microcredit 2005, an effort was also started to implement a consistent household survey instrument across developing countries to measure access to and use of financial services. Analysis of these surveys will be crucial in not only measuring access more accurately, but also more importantly in evaluating the impact of this access on growth and poverty reduction which will inform (i) the design of policy interventions to build more inclusive financial systems, and (ii) the efforts to narrow down which access indicators to track over time. (World Bank 2006: 3-5, italics in original.)

92
BOX No. 2 Interviews with five financial services companies conducted by the DPRU.
Financial Services in five companies in the sector, interviewed in February-March 2006 by a research team from the Development Policy Research Unit, UCT. [Reproduced with permission from DPRU 2007: 37-44.]
Company 5A
Core functions
Company 5A is a subsidiary of a major financial institution and operates within the financial services sector of the economy. Its core business is banking. During the last decade the size of the overall workforce has increased as a result of increased economic activity. In the short to medium term the company plans to increase its local market share and it plans to expand into emerging markets as well.
Recruitment
Each of the Company 5A business units is responsible for its own recruitment. Various types of recruitment strategies are followed. Matriculants are taken into learnership programmes, and to this end the company advertises banking careers in schools. The graduate recruitment programme targets all university graduates nationwide, but Company 5A has preferences as far as specific institutions are concerned when hiring graduates, for example the company prefers actuaries who graduated from the universities of Cape Town or Witwatersrand. Given the nature of the business Company 5A does not generally hire graduates from universities of technology. Company 5A finds it difficult to recruit enough previously disadvantaged university graduates with very good results in some areas of specialisation (for example, actuaries and quantitative analysts). There is also a higher than average turnover for employment equity candidates at middle management level. The company finds that there are skills shortages in areas of advanced professional qualifications and in some areas of specialisation, for example, business analysts or project management people with experience in financial services. BEE requirements tend to compound the general skills shortage problems.
Training and Learnerships
Company 5A belongs to the BankSETA. Training and learnerships are part of the core business strategy of Company 5A. There are currently 80 matriculants on learnerships. The value of the learnership programme is that the learners gain experience. However, the underlying problem of an inadequate academic foundation, leading to a lack of quality graduates, still remains. If the company is to increase the number of learners, the costs of the learnership programme would have to be subsidised. The company feels that regulation of the learnerships and the administrative burden associated with them make incentives difficult to access.

93
Policy Considerations
• There is a need to get the foundation of the education system right. Standards at the junior school level in key subjects needs to be improved in order to generate required skills in sufficient numbers in the economy. There also needs to be better career guidance in schools so that more learners choose subjects that will allow them to do technical courses at university.
• Graduates’ perceptions have to be addressed. The company feels that there is a
need to build required attitudes from ‘day one’ and that there should be a sense of co-accountability for the economy instead of a dependence on ‘the employer’ to provide jobs. Graduates should not see a degree as an entry ticket into a job.
• Learners at schools and tertiary institutions should be encouraged to do voluntary
work in the community in order to teach them to develop life and management skills.
Company 5B
Core functions
Company 5B’s core functions are banking and financial services. Core staff requirements are people trained in management sciences, information technology and human resources. To some extent legal expertise is also required, while an increasing number of engineers are employed. The recent 2.5% growth in employment in the company can be linked to company growth, especially expansion into new markets (non-traditional regions) and BEE deals. There is large-scale investment in emerging markets in Africa (e.g. Nigeria) and the rest of the world (e.g. Argentina), which implies some job growth for South Africans (expatriates) employed in key areas.
Recruitment
Company 5B utilises all traditional channels, including graduate recruitment and direct applications. Under the Kellogg Foundation’s under-graduate programme second year students do vacation work and gain valuable experience. All universities in South Africa are approached for the graduate recruitment programmes. Every year approximately 150 graduates are recruited, with about 20 per cent to 30 per cent from historically black universities (HBUs). This figure rises to about 45 per cent if University of Western Cape and University of KZN (Durban Westville Campus) are included in the definition of HBUs. Company 5B believes that ‘latent talent’ can be found at HBUs and this can be developed through training programmes. Often poor soft skills are seen as a reflection of the quality of candidates, but this is misleading. The company does not find it difficult to recruit graduates from previously disadvantaged backgrounds. Company 5B feels that the rise in graduate unemployment is a result of inappropriate qualifications and the quality of education at schools – there are a large number of functionally illiterate graduates. There is a great need to focus more on practical aspects of work and work experience.

94
The company experiences a high turnover of black talent, especially at senior and middle-management levels. Young white managers are also becoming hard to find, since many form their own business and/or emigrate.
Training and Learnerships
Company 5B belongs to the BANKSETA. Training (and learnerships) is a business requirement of the company, although programmes such as Letsema (NQF 4 and 5, for unemployed persons) can be seen as social responsibility. The company believes that learnerships will help jumpstart employment creation nationally and provide a boost to the economy since learners receive R2 000 per month, which is ploughed back into the economy (especially townships). Financial incentives are needed for firms to employ more graduates.
Policy Considerations
• Matriculants should be given better career guidance in order to match the supply of graduates with the needs of the economy.
• People with inappropriate degrees should be put on learnerships that bridge the skills
gap by supplying learners with appropriate skills that are demanded in the market place.
• Graduates should be better informed about what they can expect from the job
market. Often people with tertiary qualifications have too high expectations in terms of their earning potential. They need to be willing to be trained and start in entry-level positions.
• Partnerships should be set up between educational institutions and firms to enable
more appropriate curriculum design and collaborative research work (vocational training). Such models are used with success in Australia (Brisbane) where students are given real-life company-based research projects to complete as part of their courses.
Company 5C
Core functions
The company operates in the financial sector with core competencies in areas such as auditing, taxation, and consulting and financial advisory services. The company’s workforce has been increasing in response to business expansion.
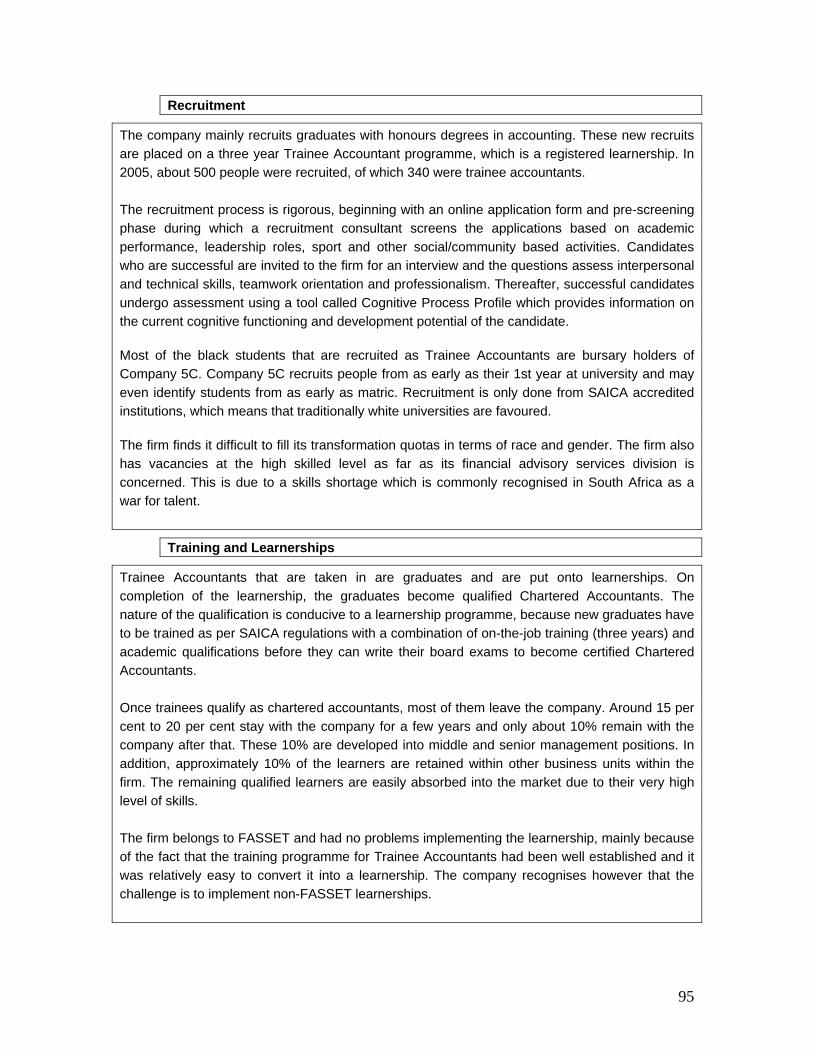
95
Recruitment
The company mainly recruits graduates with honours degrees in accounting. These new recruits are placed on a three year Trainee Accountant programme, which is a registered learnership. In 2005, about 500 people were recruited, of which 340 were trainee accountants. The recruitment process is rigorous, beginning with an online application form and pre-screening phase during which a recruitment consultant screens the applications based on academic performance, leadership roles, sport and other social/community based activities. Candidates who are successful are invited to the firm for an interview and the questions assess interpersonal and technical skills, teamwork orientation and professionalism. Thereafter, successful candidates undergo assessment using a tool called Cognitive Process Profile which provides information on the current cognitive functioning and development potential of the candidate. Most of the black students that are recruited as Trainee Accountants are bursary holders of Company 5C. Company 5C recruits people from as early as their 1st year at university and may even identify students from as early as matric. Recruitment is only done from SAICA accredited institutions, which means that traditionally white universities are favoured. The firm finds it difficult to fill its transformation quotas in terms of race and gender. The firm also has vacancies at the high skilled level as far as its financial advisory services division is concerned. This is due to a skills shortage which is commonly recognised in South Africa as a war for talent.
Training and Learnerships
Trainee Accountants that are taken in are graduates and are put onto learnerships. On completion of the learnership, the graduates become qualified Chartered Accountants. The nature of the qualification is conducive to a learnership programme, because new graduates have to be trained as per SAICA regulations with a combination of on-the-job training (three years) and academic qualifications before they can write their board exams to become certified Chartered Accountants. Once trainees qualify as chartered accountants, most of them leave the company. Around 15 per cent to 20 per cent stay with the company for a few years and only about 10% remain with the company after that. These 10% are developed into middle and senior management positions. In addition, approximately 10% of the learners are retained within other business units within the firm. The remaining qualified learners are easily absorbed into the market due to their very high level of skills. The firm belongs to FASSET and had no problems implementing the learnership, mainly because of the fact that the training programme for Trainee Accountants had been well established and it was relatively easy to convert it into a learnership. The company recognises however that the challenge is to implement non-FASSET learnerships.

96
The learnership programme did not create additional employment for graduates as the trainee accountant programme was already in place before the introduction of the learnership system and the existing programme was merely converted into a learnership. In addition, Company 5C provides training in SAP (Systems and Analysis Programme Development), but trains in excess of their own business requirements. The remainder of the trainees are absorbed in their Business Process Outsourcing Section. Company 5C has identified Business Process Outsourcing as one of their growth areas, with potential for increased employee absorption. In addition, it is also one of the priority sectors identified by government for targeted intervention.
Policy Considerations
• Company 5C offers a development programme for students to provide them with the required soft skills to make them ready for the workplace. Subjects include Stress Management, Analytical Thinking Skills, Emotional Self-Awareness, and Interpersonal Relations. Although other firms have indicated that such training falls beyond the scope of workplace training that a firm should be expected to offer, it should perhaps be explored further.
• Company 5C feels that larger organizations are constrained by the numbers they can
absorb into learnerships while smaller organizations are constrained by the costs. In addition, the costs of orientation, mentoring and support can act as a disincentive to implement learnerships. Learnerships could be more broadly implemented if the administration with regard to implementation is simplified, and the accreditation process and requirements for training providers are simplified.
• Learnerships address the skills scarcity problem in so much as they provide school
leavers with a combination of higher skills, work readiness skills and scarce critical cross-sectoral skills. It also allows the current workforce to gain higher skills and facilitates a flexible learning path. However, learnerships do not suit all organizations’ business needs or strategies and other possible solutions include apprenticeships and structured internship programmes.
• Company 5C feels there should be a more co-ordinated skills development initiative.
Company 5D
Core functions
The company operates in investment and financial services, life insurance and general short-term insurance. Company 5D employs skilled and high-skilled personnel such as actuaries, chartered accountants (trainees) etc, as well as sales staff for the insurance policies sales divisions.
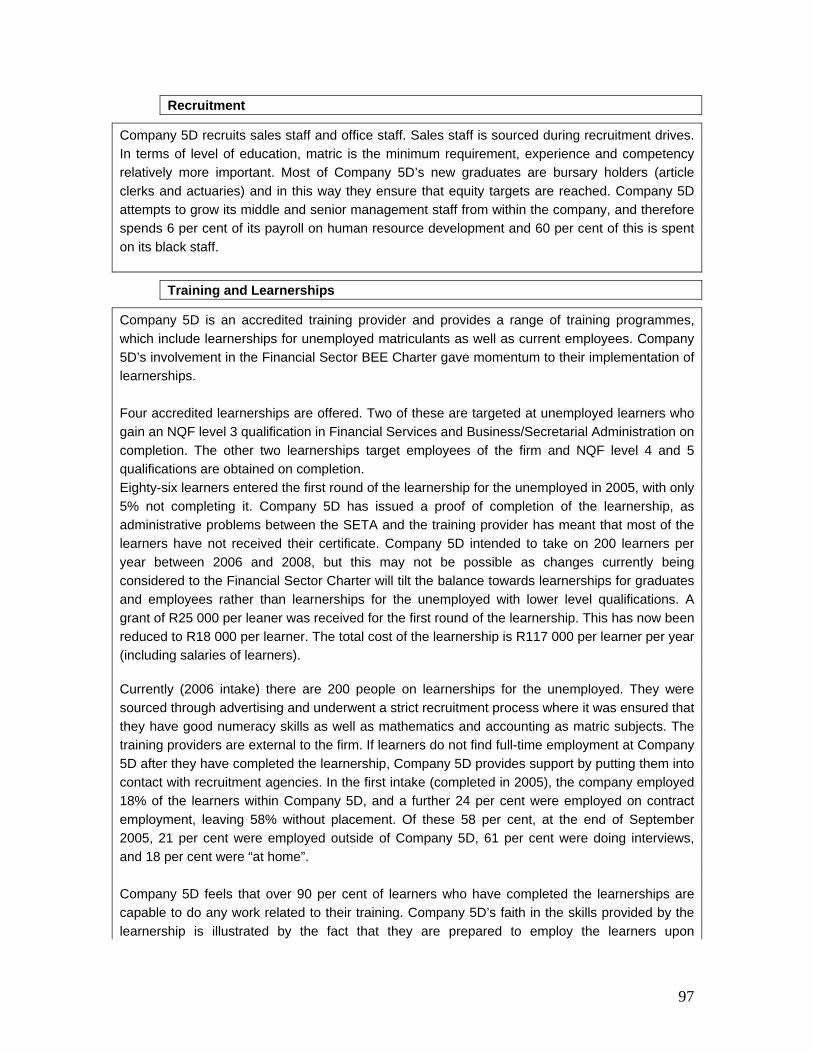
97
Recruitment
Company 5D recruits sales staff and office staff. Sales staff is sourced during recruitment drives. In terms of level of education, matric is the minimum requirement, experience and competency relatively more important. Most of Company 5D’s new graduates are bursary holders (article clerks and actuaries) and in this way they ensure that equity targets are reached. Company 5D attempts to grow its middle and senior management staff from within the company, and therefore spends 6 per cent of its payroll on human resource development and 60 per cent of this is spent on its black staff.
Training and Learnerships
Company 5D is an accredited training provider and provides a range of training programmes, which include learnerships for unemployed matriculants as well as current employees. Company 5D’s involvement in the Financial Sector BEE Charter gave momentum to their implementation of learnerships. Four accredited learnerships are offered. Two of these are targeted at unemployed learners who gain an NQF level 3 qualification in Financial Services and Business/Secretarial Administration on completion. The other two learnerships target employees of the firm and NQF level 4 and 5 qualifications are obtained on completion. Eighty-six learners entered the first round of the learnership for the unemployed in 2005, with only 5% not completing it. Company 5D has issued a proof of completion of the learnership, as administrative problems between the SETA and the training provider has meant that most of the learners have not received their certificate. Company 5D intended to take on 200 learners per year between 2006 and 2008, but this may not be possible as changes currently being considered to the Financial Sector Charter will tilt the balance towards learnerships for graduates and employees rather than learnerships for the unemployed with lower level qualifications. A grant of R25 000 per leaner was received for the first round of the learnership. This has now been reduced to R18 000 per learner. The total cost of the learnership is R117 000 per learner per year (including salaries of learners). Currently (2006 intake) there are 200 people on learnerships for the unemployed. They were sourced through advertising and underwent a strict recruitment process where it was ensured that they have good numeracy skills as well as mathematics and accounting as matric subjects. The training providers are external to the firm. If learners do not find full-time employment at Company 5D after they have completed the learnership, Company 5D provides support by putting them into contact with recruitment agencies. In the first intake (completed in 2005), the company employed 18% of the learners within Company 5D, and a further 24 per cent were employed on contract employment, leaving 58% without placement. Of these 58 per cent, at the end of September 2005, 21 per cent were employed outside of Company 5D, 61 per cent were doing interviews, and 18 per cent were “at home”. Company 5D feels that over 90 per cent of learners who have completed the learnerships are capable to do any work related to their training. Company 5D’s faith in the skills provided by the learnership is illustrated by the fact that they are prepared to employ the learners upon

98
completion of the learnership as well as recommend them to prospective employers. In the company’s opinion, the reasons why ex-learners do not manage to find employment reflects behavioural issues and a problem with their attitude. While the learnerships for the unemployed are considered to form part of the corporate social responsibility of the company, there is a drive within the organization to link learnerships with the business objectives of the organisation so that it is possible to employ learners upon completion of the learnership. While other sectors had apprenticeships in place before the learnership programme were introduced, learnerships or structured learning programmes were completely new to the insurance sector. Company 5D has found that it is very time consuming to follow all the prescriptions when running learnerships. In addition, dealing with the SETA has been difficult and time-consuming. Company 5D has outsourced the training, and therefore the training provider is responsible for the training provision, assessment and moderation. This allows the company to focus on the core activities of the business since it has to deal with less bureaucracy and administration than if it had to provide the training by itself. Company 5D has however installed its own quality assurance systems that are the same as those required by the SETAs so that they can ensure that their systems are up to SETA standards.
Policy Considerations
• There needs to be a clearer understanding by graduates that a tertiary qualification does not necessarily mean that they have the skills required in a specific job and the they do require on-the-job training.
• Company 5D recognises that although the quality assurance systems of SETAs are
stringent and time-consuming, a quality assurance system has to be in place in order to ensure that qualifications are transferable, given that the qualification received is a national qualification. However, the process could be simplified by automating of paper-based systems, as well as by better scheduling of processes.
Company 5E
Core functions
Company 5E is listed under the financial services sector and its activities include life insurance, investment services and independent financial services. Over the last decade the size of the workforce has decreased, while at the same time proportion of the workforce that is skilled or high-skilled has increased. In the last 3 to 5 years, Company 5E has outsourced administration, information technology services and infrastructure, catering and printing business units, mostly to former employees of Company 5E.

99
Recruitment
Matriculants with mathematics and science are recruited for administrative positions. Specific business units may have specific programmes for recruiting graduates. University graduates are recruited through an Accelerated Development Programme. This two year programme is currently in its pilot phase with eight black females participating in this first round. Company 5E does not have specific preferences as far as universities are concerned, and it does not find it difficult to recruit sufficient numbers of university or university of technology/college graduates from previously disadvantaged backgrounds to fill vacancies. The supply of graduates at entry level is adequate, but the progress in gaining experience can be slow. BEE requirements and the war for talent have resulted in shortages of senior skilled people from previously disadvantaged backgrounds. The company has high turnover rates for call centre and sales staff. This is largely due to the nature of these jobs and not cause for concern.
Training and Learnerships
The rationale behind the provision of training and learnerships is to bridge the gap between the supply of employees and requirements of the company. In addition, training addresses the changing needs of company. Learnerships are offered as a requirement of the Financial Sector Charter and Company 5E currently employs about 70 per cent of the learners upon completion of their learnership. Company 5E belongs to the insurance SETA (INSETA). The company found it very expensive to establish learnership programme, for example to create a workstation for every learner costs about R5 000. The company feels it is much more cost effective to employ matriculants than to offer learnerships. It was not difficult for Company 5E to establish the learnership programme. However, the administration process is too labour intensive and it was difficult to access the grant from the SETA. The company feels that learnerships may be able to bridge the gap between a matric qualification and some financial services qualifications. The lack of management competencies in commerce graduates may be addressed by a learnership but there is a limit to the number of unemployed people a company can absorb.
Policy Considerations
• There is a need to improve communication between government, educational institutions and business regarding the skills the economy requires.
• Marketing of learnerships should be improved so that there is clarity on what it means
to undertake a learnership.
• Implementation of learnerships need to be simplified. Source: DPRU (2007: 37- 44).

100
References. * ABSA 2006 Annex 6: Comments on the Falkena Report. ABSA, Johannesburg. * Accountancy Occupational Standards Group 2007 Future skills needs in accountancy: towards a sector qualifications strategy. AOSG, London. * Acemoglu, D. 2002 Technical change, inequality, and the labor market, Journal of Economic Literature 40, 7-72. * Actuarial Society of South Africa 2005 * Ananiadou, K. A. Jenkins & A. Wolf 2003 The benefits to employers of raising workforce basic skills levels: a review of the literature, Research Review, National Research and Development Centre, London. * Arrow, K. & W. Capron 1959 Dynamic shortages and price rises: the engineer-scientist case. Quarterly Journal of Economics 73, 292-308. * Ashton, D., M. Maguire & J. Sung 1991 Institutional structures and the provision of intermediate level skills: lessons from Canada and Hong Kong. In International comparison of vocational education and training for intermediate skills (P. Ryan ed.), Falmer Press, London. * Badroodien, A. 2005 Enterprise training in post-apartheid South Africa, Journal of Education and Work 18, 85-110. * Bankseta 2007 Sector skills plan 2007/8 update. Bankseta, Johannesburg. * Basel Committee 2008 Liquidity risk: management and supervisory challenges. Bank for International Settlements. * Bassanini, A. & W. Ok 2004 How do firms and individuals incentive to invest in human capital vary across groups? OECD Social, Employment and Migration Working Paper, OECD, Paris. * Bassanini, A. & Others 2005 Workplace training in Europe, IZA Discussion Paper 1640, IZA, Bonn. * Bassi, L. 1994 Workplace education for hourly paid workers, Journal of Policy Analysis and Management 13, 55-74. * Bazerman, M. 2007 Behavioral decision research: legislation, and society. Capitalism and Society 2, 1-18.

101
* Beaven, R. & Others 2005 Alternative skills scenarios to 2020 for the UK economy, Warwick Institute for Employment Research & Cambridge Econometrics. * Beck, T. & Others 2007 Banking services for everyone? Barriers to bank access and use aound the world. World Bank Working Paper, Washington. * Black, S. & L. Lynch 2004 What is driving the new economy: the benefits of workplace innovation? Economic Journal 114, F97-F116. * Blaug, M. 1995 The wage contract and education. In M. Carnoy (ed), International Encyclopedia of the Economics of Education, Oxford: Pergamon Press, pp. 44-52. * Blinder, A. 2007 How many US jobs might be offshorable? CEPS Working Paper No. 142, Princeton University, Center for Economic Policy Studies. * Blondal, S. & Others 2002 Investment in human capital through post-compulsory education and training: selected efficiency and equity aspects, OECD Economics Department Working Paper No. 333. * Booth, A. & D. Snower (eds) 1996 Acquiring skills: market failures, their symptoms and policy responses. Cambridge University Press, Cambridge. * Borio, C. 2007 Change and constancy in the financial system: implications for financial distress and policy, Bank for International Settlements, BIS Working Paper No. 237. * Bosworth, D. 1993 Skill shortages in Britain, Scottish Journal of Political Economy 40, 241-271. * Boyd, C. 2004A The structural origins of conflicts of interest in the accounting profession. Business Ethics Quarterly 14, 377-398. * Boyd, C. 2004B The last straw: book review of “Final accounting: ambition, greed and the fall of Arthur Andersen” (Toffler & Reingold). Business Ethics Quarterly 14, 581-592. * Brunello, G. & M. De Paola 2005 Market failures and the under-provision of training, CESIFO Working Paper No. 1286. * Campbell, M. & Others 2001 Skills in England, Policy Research Institute, Leeds Metropolitan University, UK. * Centre for the Study of Financial Innovation 2008 Microfinance banana skins: risk in a booming industry. CSFI, London.
102
* Centre for the Study of Financial Innovation 2006 Director’s Review of 2005. CSFI, London. * Chiswick, B. 2005 High skilled immigration in the international arena, IZA Discussion Paper No. 1782, IZA, Bonn. * Clarke, G. & Others 2007 An assessment of the investment climate in South Africa. World Bank, Washington. * Cosh, A. & A. Hughes 2003 The relationship between training and business performance. DfES Research Report No. 454, London. * Crafts, N. 2004 Globalisation and economic growth: a historical perspective, The World Economy 27, 45-58. * Culpepper, P. 2001 Employers, public policy, and the politics of decentralized cooperation in Germany and France. In Varieties of capitalism (P. Hall & D. Soskice eds.), Oxford University Press, Oxford, pp. 275-306. * Cunningham, L. 2006 Too big to fail: moral hazard in auditing and the need to restructure the industry before it unravels. Columbia Law Review 106, 1698-1748. * Cyert, R. & D. Mowery (eds) 1988 The impact of technological change on employment and economic growth, Ballinger, Cambridge, Mass. * Davis, M. & J. Kewin 2007 Skills in context 2.0 revised and updated, CDE (Centre for Enterprise) Report, Leicester, UK. * De Serres, A. & Others 2007 Regulation of financial systems and economic growth. OECD Economics Department Working Paper No. 506. * DfES, UK (Department for Education and Skills, UK) 2001 An Assessment of Skill Needs in Financial Services and Accountancy, DfES, London. * Dixit, A. 2002 Incentives and organisations in the public sector, Journal of Human Resources 37, 696-727. * Dodd, R. 2007 Subprime: tentacles of a crisis. Finance and Development 44, 15-19. * DPRU (Development Policy Research Unit) 2007 Graduate unemployment in post-apartheid South Africa: nature and possible policy responses: Appendix (K. Pauw & Others), Research Report for Business Leadership South Africa, University of Cape Town.
103
* Drake, K. 1991 Interventions in market financing of training in the European Community. In International comparisons of vocational education and training for intermediate skills (P. Ryan ed.), Falmer Press, London. * Ellis, S. 2003 Anticipating employers’ skills needs: the case for intervention, International Journal of Manpower 24, 83-96. * Falkena, H. & Others 2004 Competition in South African banking. National Treasury & SA Reserve Bank, Pretoria. * Fasset 2007A Scarce skills in the Fasset sector, Fasset, March 2007, Johannesburg. * Fasset 2007B Fasset sector skills plan 2005 to 2010: update for the 2008/2009 financial year, draft, Fasset, July 2007, Johannesburg. * Feasibility Report 2006 The national payment system and competition in the banking sector. Financial Economic Analysis Strategy, Johannesburg. * Fedderke, J. 2005 Technology, human capital and growth, Mimeographed, School of Economics, University of Cape Town. * Feldstein, M. 2003 Why is productivity growing faster? NBER Working Paper 9530, National Bureau of Economic Research, Cambridge, Mass. * Felstead, A. & Others 2007 Skills at work, 1986 to 2006. Mimeographed, ESRC Centre on Skills, Knowledge and Organisational Performance, Oxford & Cardiff. * Feuer, M. Others 1991 Firm financed education and specific human capital: a test of the insurance hypothesis. In Market failure in training? New economic analysis and evidence on training of adult employees (D. Stern & J. Ritzen eds.), Springer-Verlag, Berlin, pp. 41-59. * Finegold D. & D. Soskice 1988 The failure of training in Britain: analysis and prescription, Oxford Review of Economic Policy 4, 21-53. * Financial Reporting Council, UK 2007 Key facts and key trends in the accountancy profession. FRC, London. * Forth, J. & G. Mason 2004 The impact of high-level skill shortages on firm-level performance: evidence from the UK Technical Graduates Employers Survey, National Institute of Economic & Social Research Discussion Paper No. 235, London.
104
* Freeman, R. 2002 The labour market in the new information economy, Oxford Review of Economic Policy 18, 288-305. * FSSC, UK (Financial Services Skills Council, UK) 2007 The skills bill: assessment of education and training provision in UK financial services, FSSC, London. * Future Skills Scotland 2007 Skills in Scotland 2006, Glasgow, Scotland. * Gelb, S., L. Keeton & C. Malikane 2005 The scope of the financial services sector industry in the Western Cape. Report by the Edge Institute, Johannesburg. * Gleeson, D. & E. Keep 2004 Voice without accountability: the changing relationship between employers, the state and education in England, Oxford Review of Education 30, 37-63. * Green, F. & D. Ashton 1992 Skill shortage and skill deficiency, Work, Employment and Society 6, 287-301. * Green, A. & D. Owen 2003 Skills shortages: local perspectives from England, Regional Studies 37, 123-134. * Green, F., S. Machin & D. Wilkinson 1998 The meaning and determinants of skills shortages, Oxford Bulletin of Economics & Statistics 60, 165-187. * Greenhalgh, C. 2002 Does an employer training levy work? The incidence of and returns to adult vocational training in France and Britain, Fiscal Studies 23, 223-263. * Gribble, J. 2006 Actuarial supply and demand. International Actuarial Association Congress, Paris, June 2006. * Grossman, G. & E. Rossi-Hansberg 2006 The rise of off-shoring: it’s not wine for cloth anymore. Federal Reserve Bank of Kansas City Working Paper. * Hanushek, E. & L. Woessmann 2007 The role of education quality in economic growth, World Bank Policy Research Paper 4122, February 2007. * Hart, P. & A. Shipman 1991 Financing training in Britain, National Institute Economic Review 136, 77-85. * Hartmann, P. & Others 2007 The role of financial markets and innovation in productivity and growth in Europe. European Central Bank Occasional Paper Series No. 72.
105
* Hashimoto, M. 1994 Employment-based training in Japanese firms in Japan and in the United States: experiences of automobile manufacturers. In Training and the private sector: international comparisons (L. Lynch ed.), Chicago University Press, Chicago. * Heckman, J. 1994 Is job training oversold? The Public Interest 115, 91-115. * Heckman, J. 1999 Policies to foster human capital, National Bureau of Economic Research Working Paper No. 7288, Cambridge, Mass. * Heijke, H. (ed.) 1994 Forecasting the labour market by occupation and education, Kluwer, Dordrecht. * Herrera, S. 2007 Public expenditure and growth, World Bank Policy Research Working Paper No. 4372, Washington. * Hoekman, B. & B. Javorcik 2004 Policies facilitating firm adjustments to globalisation, Oxford Review of Economic Policy 20, 457-473. * Hopkins, M. 2002 Labour market planning revisited, Palgrave Macmillan, Basingstoke. * Hornstein, A. & P. Krusell 2005 The effects of technical change on labor market inequalities, Ch. 20 in Handbook of Economic Growth, Volume 1B (P. Aghion & S. Durlauf eds.), Elsevier, Amsterdam. * Howell, D. & Others 2007 Are protective labor market institutions at the root of unemployment? A critical review of the evidence. Capitalism and Society 2, 1-71. * Ide, S., J. Hoj & P. Lenain 2007 Enhancing the benefits of financial liberalisation in Belgium. OECD Economics Department Working Paper No. 588. * ILO 1995 World labour report 8, ILO, Geneva. * IMF 2006A South Africa: selected issues. IMF Country Report No. 06/328. * Inseta 2006 Sector skills plan for 2005-2010, Inseta, Johannesburg. * International Audit Networks 2006 Global capital markets and the global economy. International Audit Networks, November 2006. * International Federation of Accountants 2007 IFAC 2007 Global Leadership Survey: Summary of Findings. IFAC, Washington. * JIPSA (Joint Initiative on Priority Skills Acquisition) 2007 Annual Report, Pretoria.
106
* Johnston, S. & A. Bernstein 2007 Skills, growth and migration policy: overcoming the fatal constraint. CDE In Depth Issue 5/February 2007. * Katz, E. & A. Ziderman 1990 Investment in general training: the role of information and labour mobility, Economic Journal 100, 1147-1158. * Keep, E. 1991 The grass looked greener – some thoughts on the influence of comparative vocational training research on the UK policy debate. In International comparisons of vocational education and training for intermediate skills (P. Ryan ed.), Falmer Press, London. * Keep, E., K. Mayhew & Others 2002 Review of the evidence on the rate of return to employers of investment in training and employer training measures, SKOPE Research Paper No. 34, Cardiff University, UK. * Keep, E. & K. Mayhew 2004 The economic and distributional implications of current policies on higher education, Oxford Review of Economic Policy 20, 298-314. * Klapper, L. & Others 2006 Entry regulation as a barrier to entrepreneurship. Journal of Financial Economics 82, 591-629. * Kraak, A. 2005 Human resources development and the skills crisis in South Africa, Journal of Education and Work 18, 57-83. * Kunreuther, H. & E. Michel-Kerjan 2007 Climate change, insurability of large-scale disasters and the emerging liability challenge. NBER Working Paper 12821. * Lalonde, R. 1995 The promise of public sector-sponsored training programs, Journal of Economic Perspectives 9, 149-168. * Lanchester, J. 2008 Cityphilia. London Review of Books, 3 January 2008. * Leitch Review of Skills 2006 Prosperity for all in the global economy – world class skills, Final Report, December 2006, HM Treasury, London. * Leuven, E. 2005 The economics of private sector training: a survey of the literature, Journal of Economic Surveys 19, 91-111. * Lopez-Bassols, V. 2002 ICT skills and employment. OECD STI Working Paper, OECD, Paris. * Lundall, P. 2007 Employment flows and the distribution of targeted jobs in the call centre and business process outsourcing sector of the Western Cape over

107
the medium term. Western Cape Department of Economic Development and Tourism. * Lynch, L. (ed.) 1994 Training and the private sector: international comparisons, University of Chicago Press, Chicago. * Lynch, L. 2005 Job loss: bridging the research and policy discussion, IZA Discussion Paper No. 1518, Bonn. * Madav, B. & Others 2007 Can microfinance be deliverable in a sustainable manner from a South African perspective? Umboniswa Business Case. * Marsden, D. & P. Ryan 1991 Initial training, labour market structure and public policy: intermediate skills in British and German industry. In International comparisons of vocational education and training for intermediate skills (P. Ryan ed.), Falmer Press, London. * Mason, G. 2004 Enterprise product strategies and employer demand for skills in Britain: evidence from the employers skill survey. SKOPE Research Paper No. 50. * McIntosh, S. & A. Vignoles 2001 Measuring and assessing the impact of basic skills on labour market outcomes, Oxford Economic Papers 53, 453-481. * Milgrom, P. & J. Roberts 1992 Economics, organization and management. Englewood Cliffs: Prentice-Hall. * Oosthuizen, M. 2005 The post-apartheid labour market. DPRU Working Paper 06/103, University of Cape Town. * Parsons, D. 1990 The firm’s decision to train. In Labor economics and public policy (L. Bassi & D. Crawford eds.), Research in Labor Economics, vol. 11, JAI Press, Greenwich, Connecticut. * Pauw, K., M. Oosthuizen & C. van der Westhuizen 2006 Graduate unemployment in the face of skills shortages: a labour market paradox. DPRU Working Paper No. 06/114, University of Cape Town. * Paxton, J. 2007 Technical efficiency in a semi-formal financial sector: the case of Mexico. Oxford Bulletin of Economics and Statistics 69, 57-74. * Pichler, E. 1993 Cost-sharing of general and specific training with depreciation of human capital, Economics of Education Review 12, 117-124. * Pischke, J-S. 2005 Comments on “Workplace training in Europe” by A. Bassinini & Others, typescript, London School of Economics.
108
* Pomerleano, M. 2002 Back to basics: critical financial sector professions required in the aftermath of an asset bubble. Mimeographed, World Bank, Washington. * Porter, M. & Others 2007 The microeconomic foundations of prosperity: findings from the Business Competitiveness Index. World Economic Forum, Geneva. * Research Focus 2006 Study of scarce skills in the banking sector. Research Focus, Pretoria. * Richardson, S. 2007 What is a skill shortage? Report for National Centre for Vocational Education Research (NCVER), Adelaide, Australia. * Richardson, S. & Y. Tan 2007 Forecasting future demands: what we can and cannot know, Report for National Centre for Vocational Education Research, Adelaide, Australia. * Ritzen, J. 1991 Market failure for general training and remedies. In Market failure in training? New economic analysis and evidence on training of adult employees (D. Stern & J. Ritzen eds), Springer-Verlag, Berlin. * Rodrik, D. 2004 Industrial policy for the twenty-first century, typescript, Kennedy School of Government, Harvard University. * Rumberger, R. 1995 Technological change and the demand for educated labor. In International Encyclopedia of Economics of Education (M. Carnoy ed.), Pergamon Press, Oxford, pp. 217-222. * Ryan, P. 2001 The school-to-work transition: a cross-national perspective, Journal of Economic Literature 39, 34-92. * SAGRA (South African Graduate Recruiters Association) 2007A The SAGRA Graduate Recruitment Survey 2007: News Release, July 2007. * SAGRA 2007B The SAGRA Graduate Recruitment Survey 2007: Survey Report, SAGRA, Cape Town. * SAICA (South African Institute of Chartered Accountants) 2007 Trainee chartered accountants in South Africa: supply and demand. Mulberry Leaf Consulting, Johannesburg. * Sako, M. & R. Dore 1988 Teaching or testing: the role of the state in Japan?, Oxford Review of Economic Policy 4, 72-81.

109
* Sala-i-Martin, X. & Others 2007 The global competitiveness index: measuring the productive potential of nations. World Economic Forum, Geneva. * Sector Skills Development Agency, UK 2006 Working Futures 2004-2014, Sectoral Report. Institute for Employment Research, University of Warwick, Coventry. * South African SIC 2005 Standard Industrial Classification, Statistics South Africa, Pretoria. * Singizi Consulting 2007 Employment Promotion Programme: SETA Review, March 2007. * Skills in England 2007 Research Report Volume 2, Learning and Skills Council, London. * Skinner, D., M. Saunders & R. Beresford 2004 Towards a shared understanding of skill shortages: differing perceptions of training and development needs, Education and Training 46, 182-193. * Smith, M., R. Jennings & G. Solanki 2005 Perspectives on learnerships: a critique of South Africa’s transformation of apprenticeships, Journal of Vocational Education and Training 57, 537-561. * Soskice, D. 1994 Reconciling markets and institutions. In Training and the private sector: international comparisons (L. Lynch ed.), University of Chicago Press, Chicago. * South African Reserve Bank 2007 Monetary Policy Review, SARB, Pretoria. * Spenner, K. 1995 Technological change, skill requirements, and education: The case for uncertainty. Ch. 3 in The new modern times: factors reshaping the world of work (D. Bils editor), State University of New York Press, Albany, pp. 81-137. * Standard Bank 2007 Economic profile South Africa 2007. Standard Bank, Johannesburg. * Standard & Poor 2008 South African banks balance robust growth with rising risks in 2008. Standard & Poor, Johannesburg. * Stern, D. & C. Benson 1991 Firms’ propensity to train. In Market failure in training? New economic analysis and evidence on training of adult employees (D. Stern & J. Ritzen eds.), Springer-Verlag, Berlin. * Stevens, M. 1994 A theoretical model of on-the-job training with imperfect competition, Oxford Economic Papers 46, 537-562.

110
* Taylor, N., J. Muller & P. Vinjevold 2003 Research and systemic school reform in South Africa, Pearson Education, Cape Town. * Temple, J. 2002 The assessment: the new economy, Oxford Review of Economic Policy 18, 241-264. * Upper, C. 2007 Using counterfactual simulations to assess the danger of contagion in interbank markets. BIS Working Papers No. 234. * Van Zyl, E. 2007 Financial services professionals: accountants and financial managers. Draft chapter for Human Resource Development publication (A. Kraak editor), forthcoming HSRC, Pretoria. * Van Zyl, E., D. Van der Nest & B. Koopman 2003 The need for strategic learnerships in Finance, Accounting, Management Consulting and Other Financial Services. Report to Fasset, Johannesburg. * Von Furstenberg, G. 2007 Assessing the competitiveness of international financial services in particular locations: a survey of methods and perspectives, Center for Applied Economics and Policy Research Working Paper #2007-024, Indiana University, Bloomington. * Watson, D. & Others 2006 Influence costs and the reporting of skill deficiencies, Human Relations 59, 37-59. * Watson, D., S. Johnson & R. Webb 2006 Employer perceptions of skill deficiencies in the UK labour market: a sub-regional analysis, Environment and Planning 38, 1753-1771. * Wilson, R. & T. Hogarth (eds) 2003 Tackling the low skills equilibrium: a review of issues and some new evidence, Institute for Employment Research, University of Warwick, Coventry, UK. * Wolf, A. 2002 Does education matter? Penguin Books, London. * Wolf, A. 2004 Education and economic performance: simplistic theories and their policy consequences, Oxford Review of Economic Policy 20, 315-333. * Woolard, I., P. Kneebone & D. Lee 2003 Forecasting the demand for scarce skills, 2001-2006. In Human resources development 2003, HSRC, Pretoria. * World Bank 2006A South Africa: an Assessment of the Investment Climate. Washington: World Bank.

111
* World Bank 2006B Policy Research Report: on Access to Finance: Measurement, Impact and Policy Concept Note. World Bank, Washington. * World Economic Forum 2007 Global Competitiveness Monitor 2007-2008. Geneva. * World Economic Forum 2006 Policy Research Report on Access to Finance: Measurement, Impact and Policy: Concept Note. Mimeographed Paper, World Bank, December 2006. Interviews and acknowledgements. The following individuals supplied guidance and documentation during the year in which this report was prepared. Some were interviewed face-to-face, some consulted by telephone and some by e-mail. I am particularly indebted to Tessa Minter, Elize van Zyl, Ingrid Goodspeed and Cathy Sims. They were unfailingly patient and helpful in answering questions or supplying documents or suggesting sources.
• Graham Terry • Freddie Cloete • Chantyl Mulder • Adri Kleynhans • Natalie Zimmelman, SA Institute of Chartered Accountants (SAICA).
• Nicole Brower • Louise Marx, Deloittes.
• Sanelle Hobbs, PricewaterhouseCoopers.
• Cheryl James • Lauren Derman, Fasset.
• Sophie-Marie van Garderen, Rand Merchant Bank.
• Tracy Rowe, Investec.
• Sunette Botha • Raj Naidoo, SA Reserve Bank.
• Judy Naidoo • Lindy Bodewig • Spencer Janari, Treasury.

112
• Elize van Zyl, Research Focus.
• Suzanne Hattingh, Learning Road Map.
• Ingrid Goodspeed, Nedbank.
• Aart Juriaanse, Banking Association.
• Cathy Sims, SAGRA (SA Graduate Recruiters Association)
• Tessa Minter • Michael Wormald, Accountancy Department, UCT.
• Irene Petrony • Rob Dorrington • Shannon Kendal, Actuarial Science Department, UCT.
• Frank Horwitz, Graduate School of Business, UCT.
• Jeff Rowlands, Nelson Mandela Metropolitan University.
• Wim Els, Actuarial Society of South Africa.
• Janet Lopes, Merseta.
• Alta Prinsloo, International Federation of Accountants. • Heather Jackson, Cadiz African Harvest Asset Management. • Alison Mclagan, Ralph, Stanton & Harvey.
________________________________________________________________