the financial performance of impact...
TRANSCRIPT
THE FINANCIAL PERFORMANCE OF IMPACT INVESTING THROUGH PRIVATE DEBT
APRIL 2018
PRIVATE DEBT IMPACT
FUNDS CHAPTER

Legal Disclaimer This paper contains only general information. Neither Symbiotics nor GIIN is by means of this paper rendering professional advice or services. The content of this paper is meant for research purposes, with an aim to broaden and deepen the understanding of Private Debt Impact Funds. On a few occasions, this paper refers to specific asset managers and collective investment schemes. Such references are made for research purposes only and are not intended as a solicitation or recommendation to buy or sell any specific investment product or services. Similarly, the information and opinions expressed in the text were obtained from audited financial statements in addition to self-reporting sources believed to be reliable and reporting in good faith, reflecting the view of the authors on the state of the industry, but no representation or warranty, expressed or implied, is made as to their accuracy or completeness. Before making any decision or taking any action that may affect your finances or your business, you should consult a qualified professional adviser. Neither Symbiotics nor GIIN shall be responsible for any loss whatsoever sustained by any person who relies on this paper. The paper is also meant for distribution only under such circumstances as may be permitted by applicable law. 01.0318
Authored by:
SYMBIOTICS RESEARCH TEAMMarina Parashkevova Holmegaard, Research Team LeaderRamkumar Narayanan, Markets & Institutions AnalystBasile Quartier, Impact Fund Analyst
GIIN RESEARCH TEAMAbhilash Mudaliar, Research DirectorHannah Schiff, Research ManagerRachel Bass, Research Senior Associate
ACKNOWLEDGEMENTSThe following members of the Symbiotics and GIIN Teams also provided input:Roland Dominicé, Symbiotics David Grimaud, SymbioticsYannis Berthouzoz, SymbioticsAmit Bouri, Global Impact Investing NetworkGiselle Leung, Global Impact Investing NetworkJennifer Lawrence, Global Impact Investing Network
Research supportWe gratefully acknowledge the support and input of the external advisory body for this study:Hewson Baltzell, HeLiOS ExchangeGuillaume Bonnel, Lombard OdierJeff Brenner, Impact Community CapitalJacob Haar, Community Investment ManagementMichael Hokenson, Community Investment ManagementThomas Hofer, MicroVest Capital Management
Outreach partnersWe thank Donna Fabiani, Lance Loethen and Fran Lutz from Opportunity Finance Network for their input throughout the process and support in outreach to Community Development Loan Funds.
Proofing & DesignThe report was proofread by David Richmond and designed by James Atkins Limited. Additional data collection and layout support was provided by Sylvie Somerville.
SUPPORTERSThis report was produced with the generous support of the John D. and Catherine T. MacArthur Foundation, JPMorgan Chase & Co., and the W.K. Kellogg Foundation.
1

2

INDEX OF FIGURES 4
INDEX OF TABLES 5
1. MOTIVATION AND BACKGROUND 71.1 Methodology 8
2. PRIVATE DEBT IMPACT FUNDS 112.1 Business Model 11 2.2 Sample Snapshot 11 2.3 Asset Size 13 2.4 Portfolio and Investor Characteristics 17 2.5 Financial Performance Breakdown 20 2.6 Portfolio Risk 30 2.7 Impact Measurement 31
3. CONCLUSION 37
CONTENTS
3
INDEX OF FIGURESPRIVATE DEBT IMPACT FUNDS 1 Assets Under Management, Distribution of Sample 13 2 Average Assets Under Management by Sector 14 3 Age of Funds 14 4 Total Assets by Sector 14 5 Total Assets by Size 15 6 Number of Funds by Size 15 7 Portfolio Size, Distribution of Sample 17 8 Portfolio Maturity by Fund Size 17 9 Portfolio Maturity by Sector 17 10 Geographical Breakdown of Total Portfolio by Main Investment Sector 18 11 Investor Type by Volume of Total Equity and Notes 19 12 Financial Performance Breakdown, Risk-Adjusted, Market-Rate Funds 20 13 Financial Performance Breakdown, Below-Market-Rate Funds 21 14 Average Net Returns by Return Philosophy 22 15 Average Net Returns by Hedging Strategy 23 16 Average Net Returns of Levered and Unlevered Funds 24 17 Interest on Debt 24 18 Average Net Returns by Main Investment Sector 25 19 Net Return Spread over Three-Month Libor USD 26 20 Total Income 28 21 Average Portfolio Yield of Funds, Unlevered Versus Levered 28 22 Average Fund Cost Structure 29 23 Distribution of Expected Total Expense Ratio 29 24 Loss Provisions Outstanding by Fund Size 30 25 Loss Provisions Outstanding by Hedging Strategy 30 26 Write-offs by Fund Size 30 27 Impact Themes by Main Investment Sector 31 28 Impact Metrics by Main Investment Sector 32
4
METHODOLOGY1 Inclusion Criteria 8 2 List of Regions 10 3 List of Sectors 10
PRIVATE DEBT IMPACT FUNDS4 Number of Participating Funds by Year 11 5 Main Investment Sector 12 6 Unlevered Versus Levered Funds 12 7 Total Asset Size (USD million) and CAGR by Sector 15 8 Geographic Breakdown by Main Investment Sector 18 9 Return Philosophy 22 10 Hedging Strategy 23 11 Returns and Volatility by Hedging Strategy 24 12 Returns and Volatility by Leveraging Strategy 27
INDEX OF TABLES
5

Impact investments—investments made into companies, organizations, and funds with the intention of generating social or environmental impact (or both) alongside financial return — are vital to addressing a range of global challenges, including slowing and mitigating climate change, ending poverty and hunger, and achieving gender equality in both emerging and developed markets. In addition to pursuing their impact goals, impact investments also offer promising market opportunities for investors across the risk–return spectrum.
As of December 2016, a sample of 208 surveyed impact investors, allocating capital to various geographies, sectors, and asset classes and seeking a range of returns from below-market to above-market, managed USD 114 billion in impact investing assets.1 Assets under management (AUM) among existing impact investors have recently been growing at an estimated 18% compound annual growth rate (CAGR), with new investors also steadily entering the field.2
Driving this growing interest, in part, are the Sustainable Development Goals (SDGs), launched by the United Nations (UN) in 2015 to target improvements in a wide range of social and environmental issues by the year 2030. Meeting these goals will require an estimated USD 2.4 trillion or more in investment capital over the coming decade.3 While the impact investing market has shown robust growth, the need for exponential expansion is critical.
1 Abhilash Mudaliar, Hannah Schiff, Rachel Bass, and Hannah Dithrich, 2017 Annual Impact Investor Survey (New York: Global Impact Investing Network, 2017), xi, https://thegiin.org/research/publication/annualsurvey2017
2 Abhilash Mudaliar, Aliana Pineiro, and Rachel Bass, Impact Investing Trends: Evidence of a Growing Industry (New York: Global Impact Investing Network, December 2016), 5, https://thegiin.org/research/publication/impact-investing-trends.
3 Business & Sustainable Development Commission, Better Business, Better World (London: 2017), 16, http://report.businesscommission.org/.
Industry growth will require, among other factors, rigorous data on the financial performance of impact investments. Evidence regarding such financial performance has recently begun to expand,4 evidence to which this report contributes. Private debt or fixed income is the largest asset class in impact investing, accounting for 34% of impact investors’ reported AUM, followed by real assets (22%) and private equity (19%).5 The Global Impact Investing Network (GIIN) and Symbiotics have partnered for this report to analyze in aggregate the performance of impact investing through private debt.
Impact investing funds that use private debt vary by sector and geography. Seeking to reflect this reality, the report includes two distinct chapters. This chapter focuses on Private Debt Impact Funds (PDIFs) in various sectors and markets. These funds have varying capital structures, but mostly rely on equity and debt capital from investors such as pension funds, foundations, banks, or public sector funders. A second separate chapter considers Community Development Loan Funds (CDLFs), which invest exclusively in the United States and rely on both private funding and grant.
The key analyses in this report will be updated annually—both with new, yearly data from existing funds and with data from the incorporation of new funds—to continually enhance their quality and maintain their relevance.
4 Abhilash Mudaliar and Rachel Bass, GIIN Perspectives: Evidence on the Financial Performance of Impact Investments (New York: Global Impact Investing Network, November 2017), https://thegiin.org/research/publication/financial-performance.
5 Mudaliar et al., 2017 Annual Impact Investor Survey, 25.
1. MOTIVATION & BACKGROUND
7
1.1 METHODOLOGY1.1.1 SamplePDIFs considered in this report are mostly for-profit and invest in developed and emerging markets.
Results on samples of fewer than three funds are not shared here in order to protect anonymity.
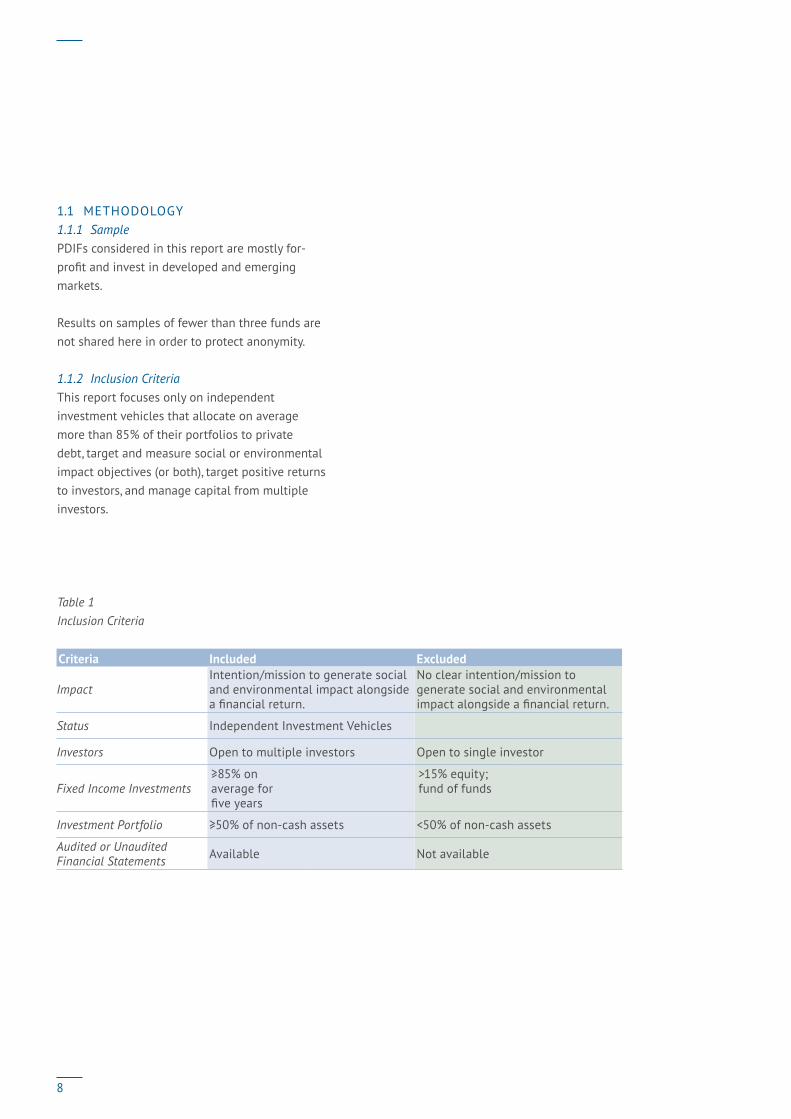
1.1.2 Inclusion CriteriaThis report focuses only on independent investment vehicles that allocate on average more than 85% of their portfolios to private debt, target and measure social or environmental impact objectives (or both), target positive returns to investors, and manage capital from multiple investors.
Table 1 Inclusion Criteria
Criteria Included Excluded
Impact Intention/mission to generate social and environmental impact alongside a financial return.
No clear intention/mission to generate social and environmental impact alongside a financial return.
Status Independent Investment Vehicles
Investors Open to multiple investors Open to single investor
Fixed Income Investments≥85% on average for five years
>15% equity; fund of funds
Investment Portfolio ≥50% of non-cash assets <50% of non-cash assets
Audited or Unaudited Financial Statements Available Not available
8
1.1.3 SourcePDIFs were identified through various networks and databases, including the GIIN’s ImpactBase database, ImpactAssets 50, LuxFlag, Fundpeak, and the Symbiotics databases of microfinance and small and medium enterprise (SME) funds.
1.1.4 Data Accuracy Participants submitted annual audited or unaudited financial statements for the past one to five fiscal years (that is, 2012–2016), from which the Research Team standardized financial performance calculations as follows.› Extrapolation: While most funds end their fiscal
years on December 31, others operate on a different cycle. To enable comparison, their data were extrapolated accordingly as of December 31.
› Exchange rates: Most metrics, including growth calculations, were determined using end-of-year exchange rates.
› Outliers: Since this study focuses on patterns of return, the Research Team identified outliers only for sub-sections of the ‘Financial Performance Breakdown’ chapter. Outliers were were defined as values amounting to three standard deviations above or below the mean of a particular metric. All figures in these sections include outliers. However, where helpful, the main text presents the results both including and excluding outliers.
› Valuation methods: Given the studied time frame of five years, the report presents no review of different funds’ accounting methods, such as historical cost versus fair value, since these do not greatly impact the final performance figures.
Additionally, all PDIFs included in the sample completed a brief survey to provide supplemental background information on the financial and legal structure of their respective funds, target investment areas, impact themes, and geographic reach. The Research Team followed up with funds individually to ensure the accuracy of the supplied information.
1.1.5 Performance CalculationThe Research Team computed PDIF’S performance based on the growth of Net Asset Value (NAV) per share, that is, net assets (assets net of liabilities) divided by the number of shares outstanding. This methodology gives the most accurate results in terms of fund performance. However, NAV per share information is not always available in funds’ financial statements because most regulators do not require reporting on this metric. In such cases where critical NAV per share information was missing for a given fund, the Research Team approximated its NAV per share growth by using primary financial statement data. Results based on this latter methodology will slightly differ from the NAV per share growth methodology, namely because information on the timing of cash flows related to share subscriptions and redemptions is not available in funds’ financial statements. Thus, results presented in sections 2.5 A, B, C, D and E differ from the results presented in figures 12 and 13 (‘Financial Performance Breakdown’), the latter figures being computed exclusively based on funds’ annual reports.
Further, for multi-currency funds that offer share classes in currencies other than the fund’s accounting currency, the Research Team approximated the unrealized foreign exchange variation against the USD for these respective currencies (mainly EUR and CHF share classes) in order to extrapolate missing information on unrealized foreign exchange gains or losses from the funds’ annual financial statements. The figures for return volatility shown in the report were calculated by considering the volatility of each respective sub-sample’s (e.g., sector, hedging strategy) weighted performance.
9

1.1.6 Regions and SectorsBreakdowns by region and investment sector used for PDIFs are derived from recognized definitions from the World Bank and the GIIN, respectively (Tables 2 and 3).
Table 2 List of Regions (World Bank Classification, 2017)
Regions
1 East Asia & Pacific
2 Europe & Central Asia
3 Latin America & the Caribbean
4 Middle East & North Africa
5 North America
6 South Asia
7 Sub-Saharan Africa
1.1.7 Selection of Impact ProfilesWhile the central objective of this report is to assess the financial performance of impact investing funds that provide loans to financial intermediaries or lend directly to projects and companies, several profiles showcase the approaches to impact measurement and management of typical funds in each sample. PDIF’s impact profiles include one Financial Services fund, one Agriculture fund, and one Multi-sector fund.
Table 3 List of Sectors
GIIN Classification
1 Education
2 Energy
3 Financial Services (incl. Microfinance)
4 Food & Agriculture
5 Healthcare
6 Housing
7 Information and Communication Technologies
8 Water, Sanitation and Hygiene
9 Multi-sector
10
2.1 BUSINESS MODELPDIFs are independent investment structures differentiated by their legal status and distribution (public or private), investment sector, and geographies, all factors that ultimately affect their business models. Most funds (all but four) in this sample are for-profit. Most invest indirectly in end clients through financial intermediaries, mostly non-investment-grade institutions, while a few invest directly in projects and companies.
All but two funds specialize in investments in emerging markets, with an average portfolio maturity of 4.5 years. Impact objectives include economic development for low-income communities, increased access to financing for micro, small, and medium-sized enterprises, and the financial needs of smallholder farmers, among others.
PDIFs are managed by specialized investment management companies that have developed labor-intensive business models by internalizing the full investment value chain, from data collection and monitoring of investees to evaluation of credit risk and pipeline management. Thus, these investment management firms represent a primary gateway for international investors who are interested in entering the impact investing space. The PDIFs included in this study are managed and advised by 27 investment managers based primarily in Europe and North America.
Funding for these PDIFs is sourced from different types of investors (public, private, retail, and high-net-worth individuals), either by issuing shares with varying subscription and redemption periods or by raising debt capital from which investors can generally expect a fixed-income return.
PDIFs invest in Financial Services (including Microfinance), Multi-sector, and Other sectors (including Arts and Culture, Education, Energy, and Food and Agriculture).
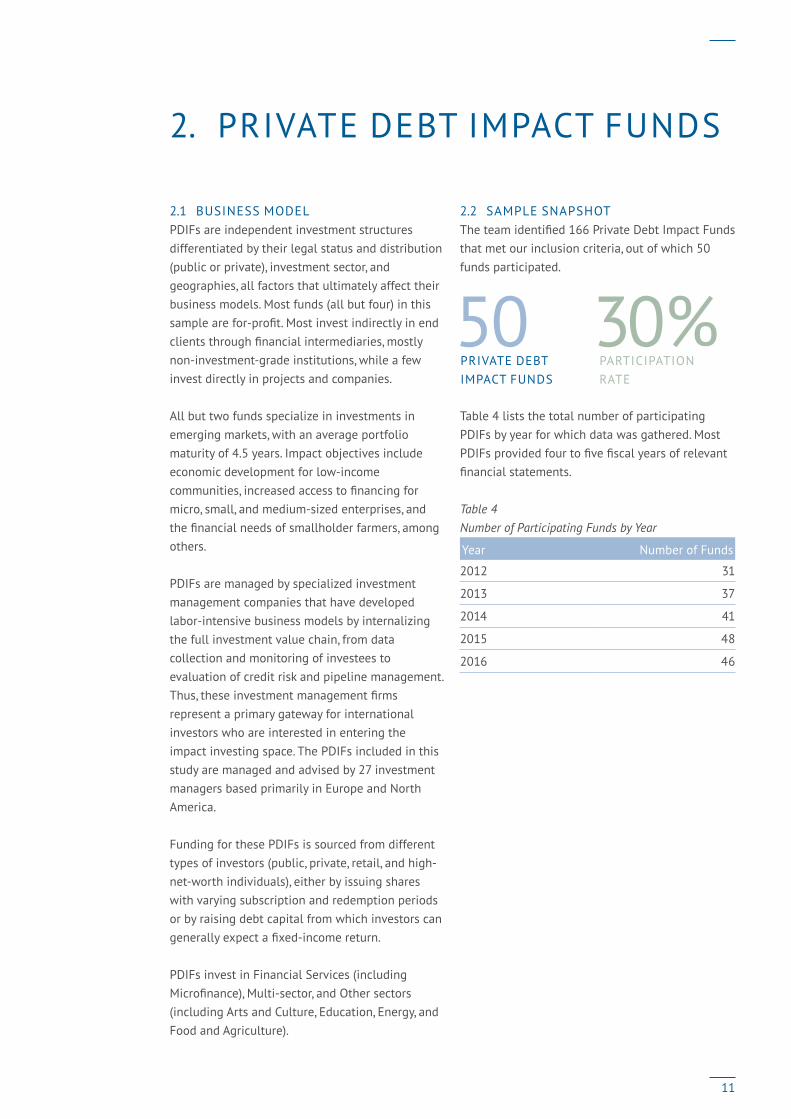
2.2 SAMPLE SNAPSHOTThe team identified 166 Private Debt Impact Funds that met our inclusion criteria, out of which 50 funds participated.
50PRIVATE DEBT IMPACT FUNDS
30%PARTICIPATION RATE
Table 4 lists the total number of participating PDIFs by year for which data was gathered. Most PDIFs provided four to five fiscal years of relevant financial statements.
Table 4 Number of Participating Funds by Year
Year Number of Funds
2012 31
2013 37
2014 41
2015 48
2016 46
2. PRIVATE DEBT IMPACT FUNDS
11

The PDIF sample mainly comprises funds that invest in Financial Services, including Microfinance, largely in emerging markets. Eight funds focus primarily in other sectors, including Arts and Culture, Education, Energy, and Food and Agriculture (in ‘Other’ Table 5).
Table 5Main Investment Sector
Year 50%+ in Financial Services 50%+ in Other Multi-Sector
2012 22 6 3
2013 27 7 3
2014 29 7 5
2015 34 8 6
2016 37 7 2
On average, one-third of PDIFs use leverage amounting to a maximum of one-fourth of total assets (Table 6).
Table 6 Levered versus Unlevered Funds
Unlevered LeveredYear Number of Funds Number of Funds Leverage Ratio 2012 22 9 24%
2013 25 12 20%
2014 29 12 21%
2015 33 15 18%
2016 30 16 17%
Nearly 40% of the sample is fully hedged, six funds are fully unhedged, and the remainder are partially hedged. Two funds invest only in USD.
Most respondents are private, for-profit funds and thus target risk-adjusted, market-rate returns. However, some nonprofit (five) and a few for-profit funds (eight) seek below-market-rate returns (either closer to capital preservation or closer to market-rate returns).
12
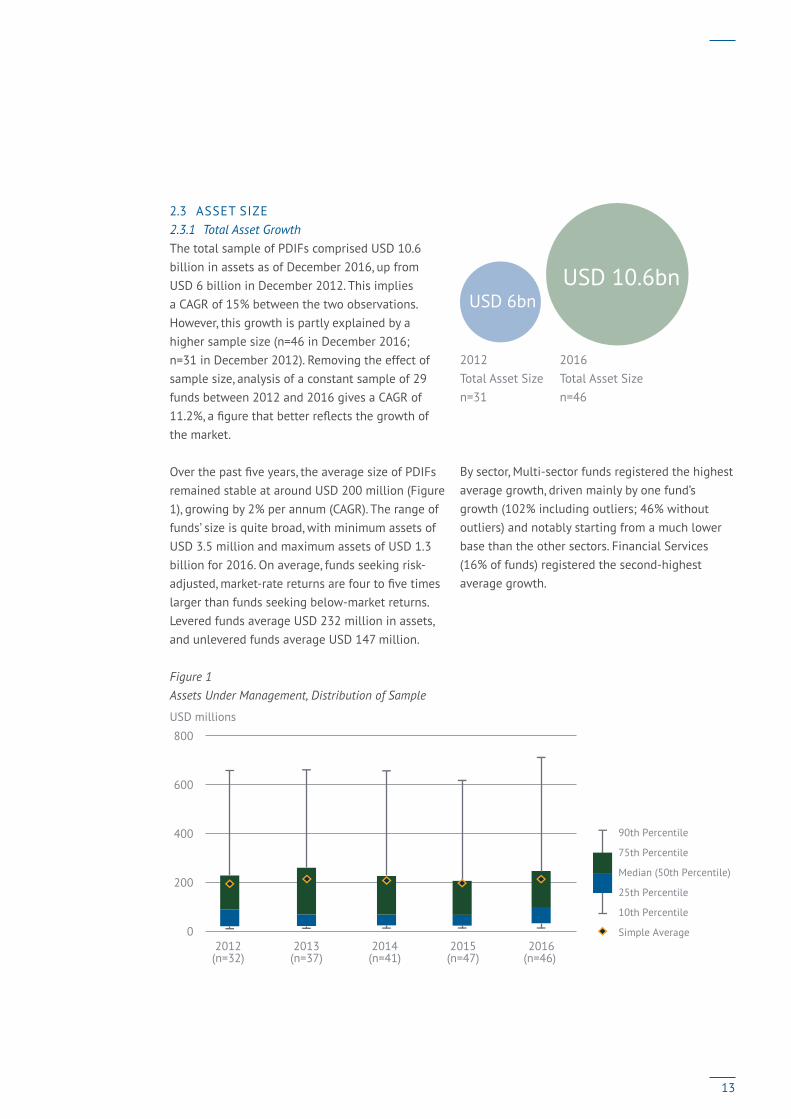
2.3 ASSET SIZE2.3.1 Total Asset GrowthThe total sample of PDIFs comprised USD 10.6 billion in assets as of December 2016, up from USD 6 billion in December 2012. This implies a CAGR of 15% between the two observations. However, this growth is partly explained by a higher sample size (n=46 in December 2016; n=31 in December 2012). Removing the effect of sample size, analysis of a constant sample of 29 funds between 2012 and 2016 gives a CAGR of 11.2%, a figure that better reflects the growth of the market.
Over the past five years, the average size of PDIFs remained stable at around USD 200 million (Figure 1), growing by 2% per annum (CAGR). The range of funds’ size is quite broad, with minimum assets of USD 3.5 million and maximum assets of USD 1.3 billion for 2016. On average, funds seeking risk-adjusted, market-rate returns are four to five times larger than funds seeking below-market returns. Levered funds average USD 232 million in assets, and unlevered funds average USD 147 million.
Figure 1 Assets Under Management, Distribution of Sample
0
200
400
600
800
2012(n=32)
2013(n=37)
2014(n=41)
2015(n=47)
2016(n=46)
USD millions
90th Percentile
75th Percentile
Median (50th Percentile)
25th Percentile
10th Percentile
Simple Average
USD 6bn
USD 10.6bn
2012 2016 Total Asset Size Total Asset Sizen=31 n=46
By sector, Multi-sector funds registered the highest average growth, driven mainly by one fund’s growth (102% including outliers; 46% without outliers) and notably starting from a much lower base than the other sectors. Financial Services (16% of funds) registered the second-highest average growth.
13
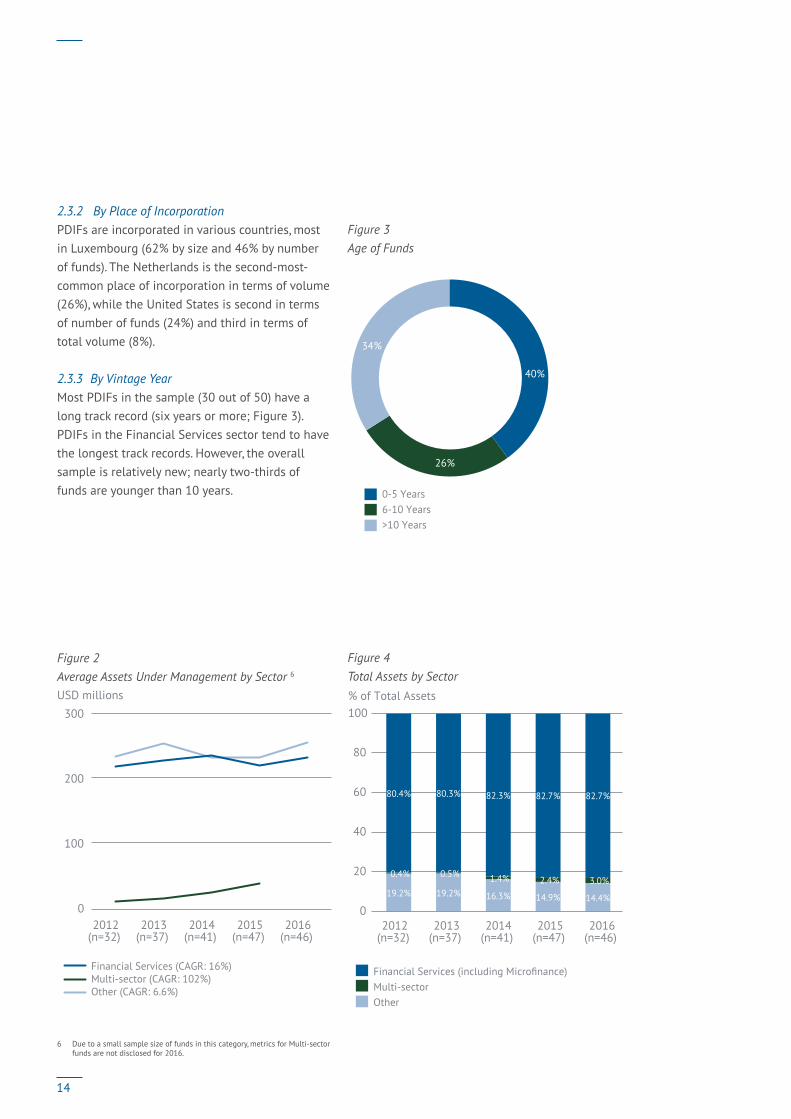
2.3.2 By Place of IncorporationPDIFs are incorporated in various countries, most in Luxembourg (62% by size and 46% by number of funds). The Netherlands is the second-most-common place of incorporation in terms of volume (26%), while the United States is second in terms of number of funds (24%) and third in terms of total volume (8%).
2.3.3 By Vintage YearMost PDIFs in the sample (30 out of 50) have a long track record (six years or more; Figure 3). PDIFs in the Financial Services sector tend to have the longest track records. However, the overall sample is relatively new; nearly two-thirds of funds are younger than 10 years.
Figure 2 Average Assets Under Management by Sector 6
USD millions
0
100
200
300
2012(n=32)
2013(n=37)
2014(n=41)
2015(n=47)
2016(n=46)
Financial Services (CAGR: 16%)Multi-sector (CAGR: 102%) Other (CAGR: 6.6%)
6 Due to a small sample size of funds in this category, metrics for Multi-sector funds are not disclosed for 2016.
Figure 3 Age of Funds
40%
26%
34%
0-5 Years 6-10 Years >10 Years
Figure 4 Total Assets by Sector% of Total Assets
0
20
40
60
80
100
2012(n=32)
2013(n=37)
2014(n=41)
2015(n=47)
2016(n=46)
Financial Services (including Microfinance) Multi-sector Other
19.2% 19.2% 16.3% 14.9% 14.4%
0.4% 0.5% 1.4% 2.4% 3.0%
80.4% 80.3% 82.3% 82.7% 82.7%
14
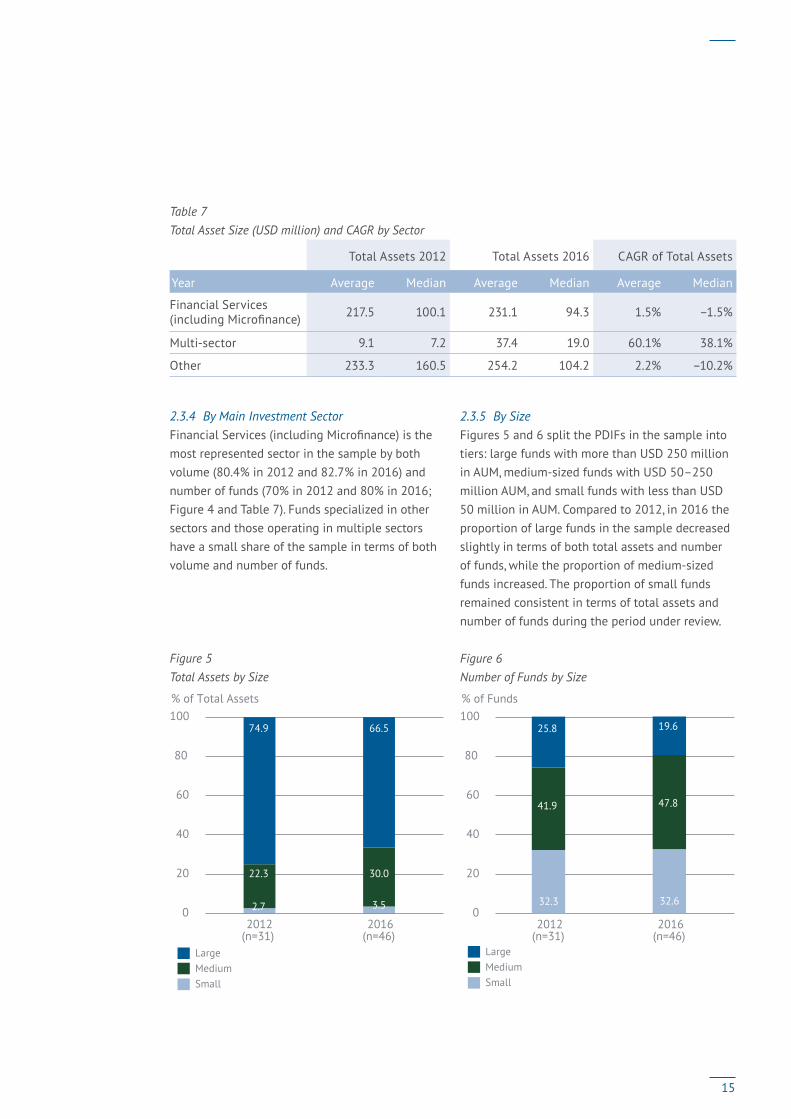
Table 7 Total Asset Size (USD million) and CAGR by Sector
Total Assets 2012 Total Assets 2016 CAGR of Total Assets
Year Average Median Average Median Average Median
Financial Services (including Microfinance) 217.5 100.1 231.1 94.3 1.5% –1.5%
Multi-sector 9.1 7.2 37.4 19.0 60.1% 38.1%
Other 233.3 160.5 254.2 104.2 2.2% –10.2%
2.3.4 By Main Investment SectorFinancial Services (including Microfinance) is the most represented sector in the sample by both volume (80.4% in 2012 and 82.7% in 2016) and number of funds (70% in 2012 and 80% in 2016; Figure 4 and Table 7). Funds specialized in other sectors and those operating in multiple sectors have a small share of the sample in terms of both volume and number of funds.
Figure 5 Total Assets by Size
% of Total Assets
LargeMedium Small
2.7 3.5
22.3 30.0
74.9 66.5
0
20
40
60
80
100
2012(n=31)
2016(n=46)
2.3.5 By SizeFigures 5 and 6 split the PDIFs in the sample into tiers: large funds with more than USD 250 million in AUM, medium-sized funds with USD 50–250 million AUM, and small funds with less than USD 50 million in AUM. Compared to 2012, in 2016 the proportion of large funds in the sample decreased slightly in terms of both total assets and number of funds, while the proportion of medium-sized funds increased. The proportion of small funds remained consistent in terms of total assets and number of funds during the period under review. Figure 6 Number of Funds by Size
% of Funds
LargeMedium Small
0
20
40
60
80
100
2012(n=31)
2016(n=46)
32.3 32.6
41.9 47.8
25.8 19.6
15
2.3.6 By Return PhilosophyFunds seeking risk-adjusted, market-rate returns (MR funds) comprise the majority of the sample in terms of number (on average 77%) and asset volume (on average 85%). MR funds have average AUM of USD 244 million, compared to below-market-rate-seeking funds (BMR funds) with average AUM of USD 38 million. In terms of investment sector, MR funds are mostly invested in Financial Services (81.7% on a five-year average), while BMR funds are primarily invested in ‘Other’ sectors (48%), followed by Financial Services (41%). By geographic allocation, BMR funds’ main exposure is to Latin America (55%) and Sub-Saharan Africa (29%), while MR funds are primarily exposed to Eastern Europe and Central Asia (32%) and Latin America (31%).
16
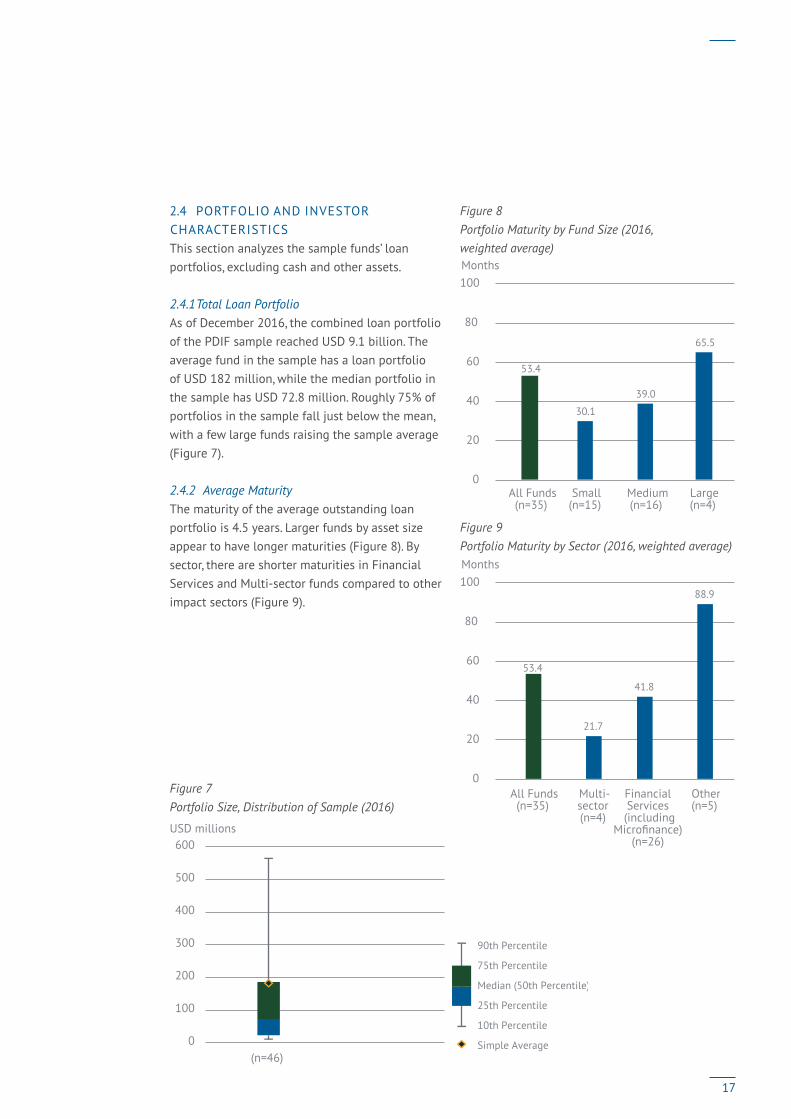
2.4 PORTFOLIO AND INVESTOR CHARACTERISTICSThis section analyzes the sample funds’ loan portfolios, excluding cash and other assets.
2.4.1 Total Loan PortfolioAs of December 2016, the combined loan portfolio of the PDIF sample reached USD 9.1 billion. The average fund in the sample has a loan portfolio of USD 182 million, while the median portfolio in the sample has USD 72.8 million. Roughly 75% of portfolios in the sample fall just below the mean, with a few large funds raising the sample average (Figure 7).
2.4.2 Average MaturityThe maturity of the average outstanding loan portfolio is 4.5 years. Larger funds by asset size appear to have longer maturities (Figure 8). By sector, there are shorter maturities in Financial Services and Multi-sector funds compared to other impact sectors (Figure 9). Figure 7 Portfolio Size, Distribution of Sample (2016)
0
100
200
300
400
500
600
(n=46)
USD millions Figure 7: Portfolio Size, Distribution of Sample (2016)
90th Percentile
75th Percentile
Median (50th Percentile)
25th Percentile
10th Percentile
Simple Average
Figure 8 Portfolio Maturity by Fund Size (2016, weighted average) Months
0
20
40
60
80
100
53.4
65.5
39.0
30.1
All Funds(n=35)
Large(n=4)
Medium(n=16)
Small(n=15)
Figure 9Portfolio Maturity by Sector (2016, weighted average)Months
53.4
21.7
41.8
88.9
All Funds(n=35)
Multi-sector (n=4)
Financial Services (including
Microfinance) (n=26)
Other(n=5)
0
20
40
60
80
100
17

Table 8 Geographical Breakdown of Total Portfolio by Main Investment Sector
Financial Services (including Microfinance) Other Multi-sector
Latin America & Caribbean 32% 9% 32%
Eastern Europe & Central Asia 30% 84% 2%
South Asia 11% 0% 0%
Sub-Saharan Africa 11% 3% 37%
East Asia Pacific 11% 0% 12%
Middle East & North Africa 3% 4% 4%
North America 2% 0% 13%
2.4.3 Geographic BreakdownThe largest region in terms of portfolio exposure is Eastern Europe and Central Asia, followed by Latin America and the Caribbean, two regions that together represent 64.5% of funds’ overall weighted portfolio allocations (Figure 10). The lowest exposures are in the Middle East and North Africa and North America (3.5% and 2.2%, respectively, of the funds’ portfolios).
Considering only the Financial Services sector, Latin America and the Caribbean has the largest allocation (32%), followed by Eastern Europe and Central Asia (30%; Table 8). Multi-sector funds invest primarily in Sub-Saharan Africa (37%). Separately, only funds focused in Financial Services invest in South Asia, while only Multi-sector funds have some significant exposure to North America (Table 8).
Figure 10 Geographical Breakdown by Total Portfolio Volume (2016, n=49)
Eastern Europe & Central AsiaLatin America & CaribbeanSub-saharan AfricaEast Asia PacificSouth AsiaMiddle East & North AfricaNorth America
Figure 10: Geographical Breakdown by Total Portfolio Volume (2016, n=49)
9.4%
35.0%
29.4%
3.5% 2.2%
9.3%
11.0%
18
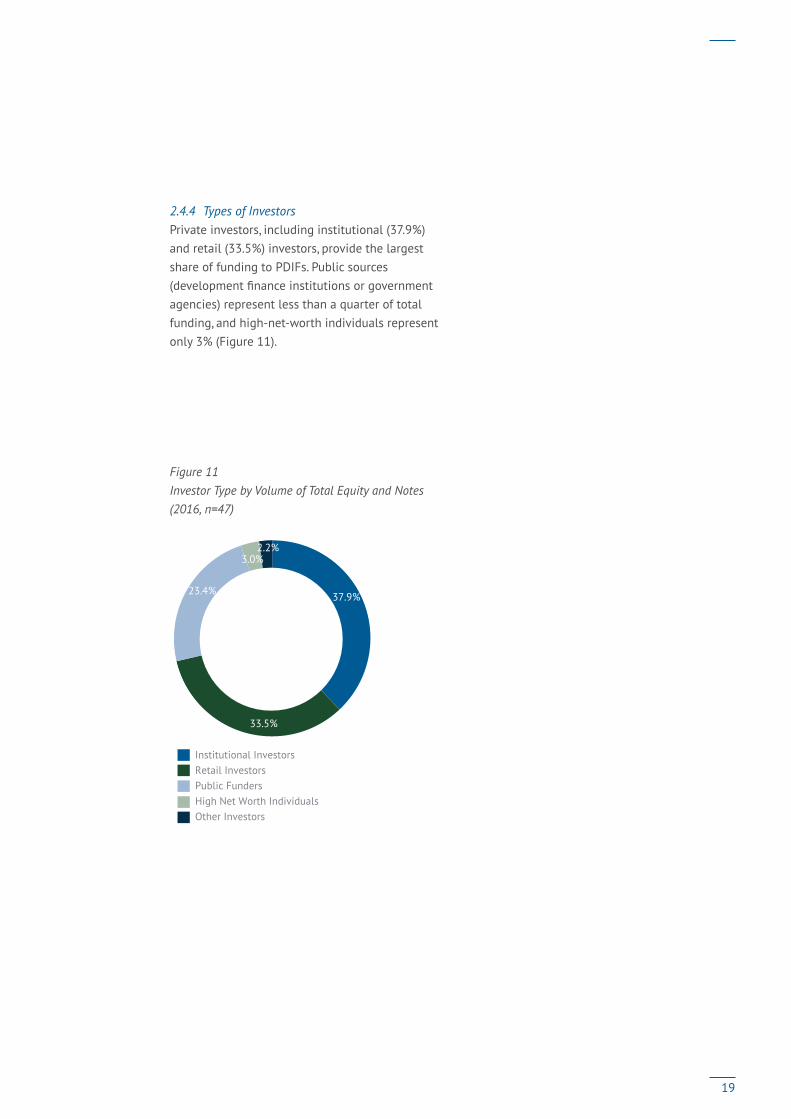
2.4.4 Types of InvestorsPrivate investors, including institutional (37.9%) and retail (33.5%) investors, provide the largest share of funding to PDIFs. Public sources (development finance institutions or government agencies) represent less than a quarter of total funding, and high-net-worth individuals represent only 3% (Figure 11).
Figure 11 Investor Type by Volume of Total Equity and Notes (2016, n=47)
Institutional InvestorsRetail InvestorsPublic FundersHigh Net Worth IndividualsOther Investors
Figure 11: Investor Type by Volume of Total Equity and Notes (2016, n=47)
33.5%
3.0%
37.9% 23.4%
2.2%
19

2.5 FINANCIAL PERFORMANCE BREAKDOWNThe following section assesses the financial performance of PDIFs.
From the perspective of an equity investor forming part of the shareholding structure of a PDIF, net returns depend on several factors. Broadly speaking, net returns primarily relate to the level of income generated by PDIFs’ core lending business (the portfolio yield) and their total expense level. Figures 12 and 13 provide more detail regarding how MR and BMR funds have generated net returns to investors from 2012 to 2016.
Figure 12 Financial Performance Breakdown (2012–2016), Risk-Adjusted, Market-Rate Funds
%Figure 12: Financial Performance Breakdown (2012–2016), Risk-Adjusted, Market-Rate Funds
Unrealized Gain/Loss (positive)Other incomePortfolio Yield
Net Return to InvestorsRealized Gain/Loss (negative)Interest CostsExpense Ratio
0.0
2.0
4.0
6.0
8.0
6.6
0.30.5
3.0
0.2
1.4
2.8 Net Return to Investors
Total Expenses Total Income
For MR funds, income is composed mainly of portfolio yield (proceeds from the loan portfolio). Other sources of income include realized or unrealized gains (changes in the valuation of funds’ assets, which in our sample are mainly driven by currency exchange fluctuations), proceeds from equity investments, if any, and recovery from write-offs, among other possible items. Costs include management fees, interest costs (cost of borrowing for levered funds), and realized or unrealized losses. Portfolio yield, other income, expense ratios, and interest costs are all relatively stable across the five years. The main drivers of fluctuations in annual performance are realized and unrealized gains or losses on assets.
MR funds generated a total income of 7.4% (expressed as a percentage of NAV) on a five-year average, comprising mostly the portfolio yield (6.6%; Figure 12). The sum of all expenses, including interest, amounts to 3.2%. After a realized loss of 1.4%, net return on the period was 2.8%.7
7 Net returns to investors in this section—that is, 2.8% for MR funds and −6.6% for BMR funds—differ from the respective averages of 2.6% and −6.8% for MR and BMR funds presented later in the chapter due to the different methodology required to calculate the complete financial breakdown shown in Figures 12 and 13. For more detail, please see 1.1.5 in the Methodology section.
20

A similar analysis for BMR funds (Figure 13) shows that these funds’ total income is mainly generated by portfolio yield (14.1%) while total expenses are much higher (20.5%), with a much higher expense ratio (16.3%) due in part to greater leverage (and consequently a higher numerator; see section 2.5.3). As a matter of fact, all BMR funds regardless of their leveraging strategy show higher portfolio yields and expense ratios than MR funds, this may also be linked to their respective underlying portfolio investments. Furthermore, BMR funds’ greater leverage also leads to higher interest costs (4.2%). Overall, the five-year period has negative net returns of −6.6% on a weighted average basis (including outliers).
Figure 13 Financial Performance Breakdown (2012–2016), Below-Market-Rate Funds
Net Loss to InvestorsOther incomePortfolio Yield
Unrealized Gain/Loss (negative)Realized Gain/Loss (negative)Interest CostsExpense Ratio
%Figure 13: Financial Performance Breakdown (2012–2016), Below-Market-Rate Funds
Total Expenses
Total Income
0
5
10
15
20
25
Net Loss to Investors
14.1
2.2
16.3
4.2
0.61.76.6
The following sub-sections analyze more deeply a specific component of financial performance—first net returns, then portfolio yield, and finally cost structure—each broken down by segment (hedging strategy, use of leverage, return philosophy, and sector).
21
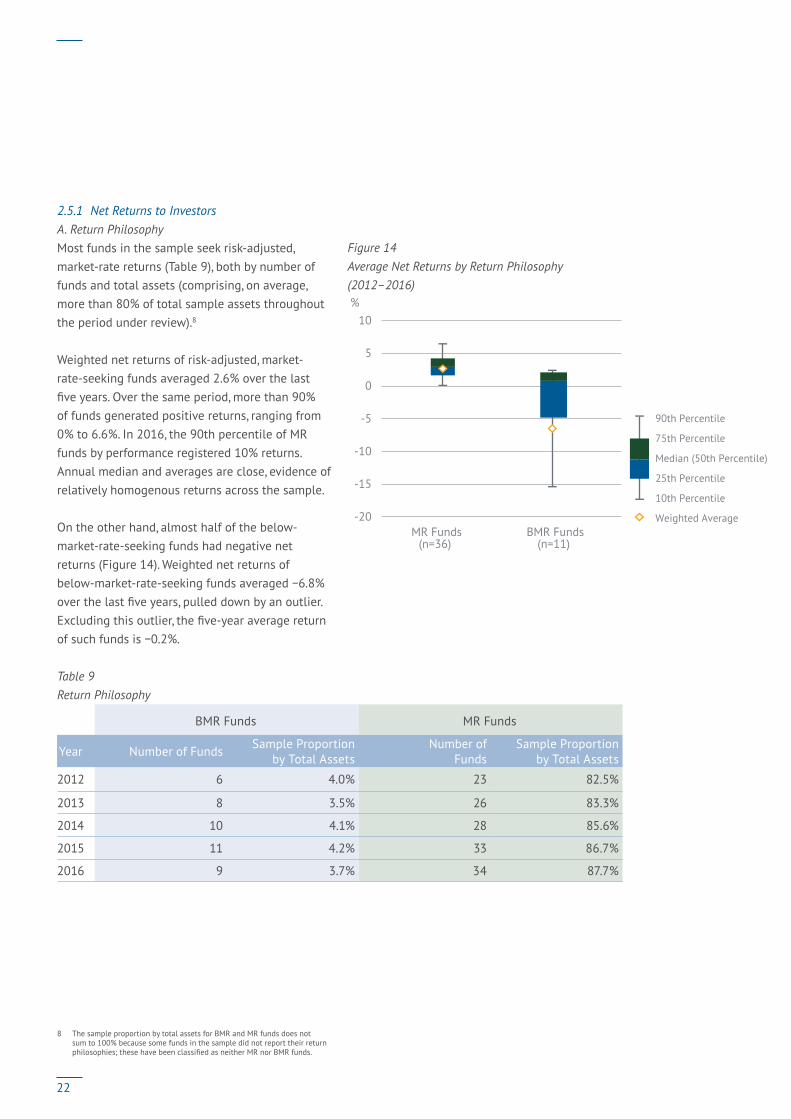
2.5.1 Net Returns to InvestorsA. Return PhilosophyMost funds in the sample seek risk-adjusted, market-rate returns (Table 9), both by number of funds and total assets (comprising, on average, more than 80% of total sample assets throughout the period under review).8
Weighted net returns of risk-adjusted, market-rate-seeking funds averaged 2.6% over the last five years. Over the same period, more than 90% of funds generated positive returns, ranging from 0% to 6.6%. In 2016, the 90th percentile of MR funds by performance registered 10% returns. Annual median and averages are close, evidence of relatively homogenous returns across the sample.
On the other hand, almost half of the below-market-rate-seeking funds had negative net returns (Figure 14). Weighted net returns of below-market-rate-seeking funds averaged −6.8% over the last five years, pulled down by an outlier. Excluding this outlier, the five-year average return of such funds is −0.2%.
Table 9 Return Philosophy
BMR Funds MR Funds
Year Number of Funds Sample Proportion by Total Assets
Number of Funds
Sample Proportion by Total Assets
2012 6 4.0% 23 82.5%
2013 8 3.5% 26 83.3%
2014 10 4.1% 28 85.6%
2015 11 4.2% 33 86.7%
2016 9 3.7% 34 87.7%
8 The sample proportion by total assets for BMR and MR funds does not sum to 100% because some funds in the sample did not report their return philosophies; these have been classified as neither MR nor BMR funds.
Figure 14 Average Net Returns by Return Philosophy (2012–2016)
BMR Funds(n=11)
MR Funds(n=36)
%Figure 14: Average Net Returns by Return Philosophy (2012–2016)
-20
-15
-10
-5
0
5
10
90th Percentile
75th Percentile
Median (50th Percentile)
25th Percentile
10th Percentile
Weighted Average
22

B. Hedged Versus Unhedged Funds From 2012 to 2013, PDIFs (most investing in emerging markets) registered low returns due to the instability of several emerging market currencies that depreciated against the USD.
Figure 15 Average Net Returns by Hedging Strategy (2012–2016)
Fully Unhedged(n=6)
Fully Hedged(n=21)
%Figure 15: Average Net Returns by Hedging Strategy (2012–2016)
PartiallyHedged(n=18)
90th Percentile
75th Percentile
Median (50th Percentile)
25th Percentile
10th Percentile
Weighted Average Return of MR Funds
Weighted Average Return of BMR Funds-8
-4
0
4
8
12
This depreciation impacted funds’ hedging costs. Returns increased in 2014, before falling again in 2015–2016 after several political and economic challenges in emerging markets. For MR funds, the highest average annual compound returns over the period were registered by fully unhedged funds (5.6%) compared to fully hedged funds (2.8%; Figure 15). However, fully unhedged funds also had higher volatility (5.2%) compared to fully hedged (0.7%) or partially hedged (1.3%) funds (Table 10).
Table 10 Returns and Volatility by Hedging Strategy
All Funds Fully Hedged Partially Hedged Fully Unhedged
Compound Annual Net Return (5 years) 2.6% 2.8% 2.3% 5.6%
Volatility 0.9% 0.7% 1.3% 5.2%
Sharpe Ratio 0.77 1.27 0.29 0.71
23

Table 11 Returns and Volatility by Leveraging Strategy
All Funds Levered Unlevered
Compound Annual Net Return (5 years) 2.6% 3.0% 2.3%
Volatility 0.9% 0.6% 1.3%
Sharpe Ratio 0.77 1.96 0.29
C. Levered Versus Unlevered Funds Overall, levered funds showed higher returns (3%) on average than unlevered funds (2.3%) over the five-year observation period (Table 11 and Figure 16). Using leverage enhances portfolio performance if the underlying portfolio return exceeds the cost of debt.
While the above figures on net return relate to the performance of PDIFs from the perspective of an equity investor, debt investors can also benefit from interest on debt capital provided to PDIFs. These types of investors can usually expect a fixed-income return from levered funds over a certain period of time. Figure 16 Average Net Returns of Levered and Unlevered Funds (2012–2016)
Unlevered Funds(n=34)
%Figure 16: Average Net Returns of Levered and Unlevered Funds (2012–2016)
-20
-15
-10
-5
0
5
10
Levered Funds(n=16)
90th Percentile
75th Percentile
Median (50th Percentile)
25th Percentile
10th Percentile
Weighted Average Return of MR Funds
Weighted Average Return of BMR Funds
Levered funds comprise one-third of the sample by number of funds and one-fourth by total assets. Interest rates they provide on notes issued to investors have averaged 3% on a weighted basis, with a maximum of 3.4% in 2015 (Figure 17).
Figure 17 Interest on Debt
% of Average Debt
3.1% 3.0%
3.4%
2.7%
0
1.0
2.0
3.0
4.0
2013 2014 2015 2016
24

D. By SectorAgain considering net returns to equity investors, MR funds investing in the Financial Services sector (including Microfinance) showed more stable returns across the years, i.e. 2.6% (Figure 18), with the lowest annualized volatility of 1.0% compared to 4.0% for Multi-sector funds and 1.1% for funds investing in other sectors. The highest returns by sector were registered by Multi-sector MR funds (2.9% on a five-year average), while the worst performance was recorded by BMR funds investing in other sectors (−21.3%, or −10.6% when excluding one outlier).9
Figure 18 Average Net Returns by Main Investment Sector (2012–2016)
Other(n=6)
Financial Services
(includingMicrofinance
(n=37)
%Figure 18: Average Net Returns by Main Investment Sector (2012–2016)
Multi-sector(n=6)
-30
-20
-10
0
10
90th Percentile
75th Percentile
Median (50th Percentile)
25th Percentile
10th Percentile
Weighted Average Return of MR Funds
Weighted Average Return of BMR Funds
9 Funds in ‘Other,’ sectors targeting risk-adjusted, market-rate returns are not shown on the graph due to a small subsample size.
Finally, several outliers characterize the ‘Other’ sector category, mainly due to the heterogeneous sectors in which the funds invest, which results in wider variations in net return.
Levered funds comprise one-third of the sample by number of funds and one-fourth by total assets. Interest rates they provide on notes issued to investors have averaged 3% on a weighted basis, with a maximum of 3.4% in 2015 (Figure 17).
Figure 17 Interest on Debt
% of Average Debt
3.1% 3.0%
3.4%
2.7%
0
1.0
2.0
3.0
4.0
2013 2014 2015 2016
25
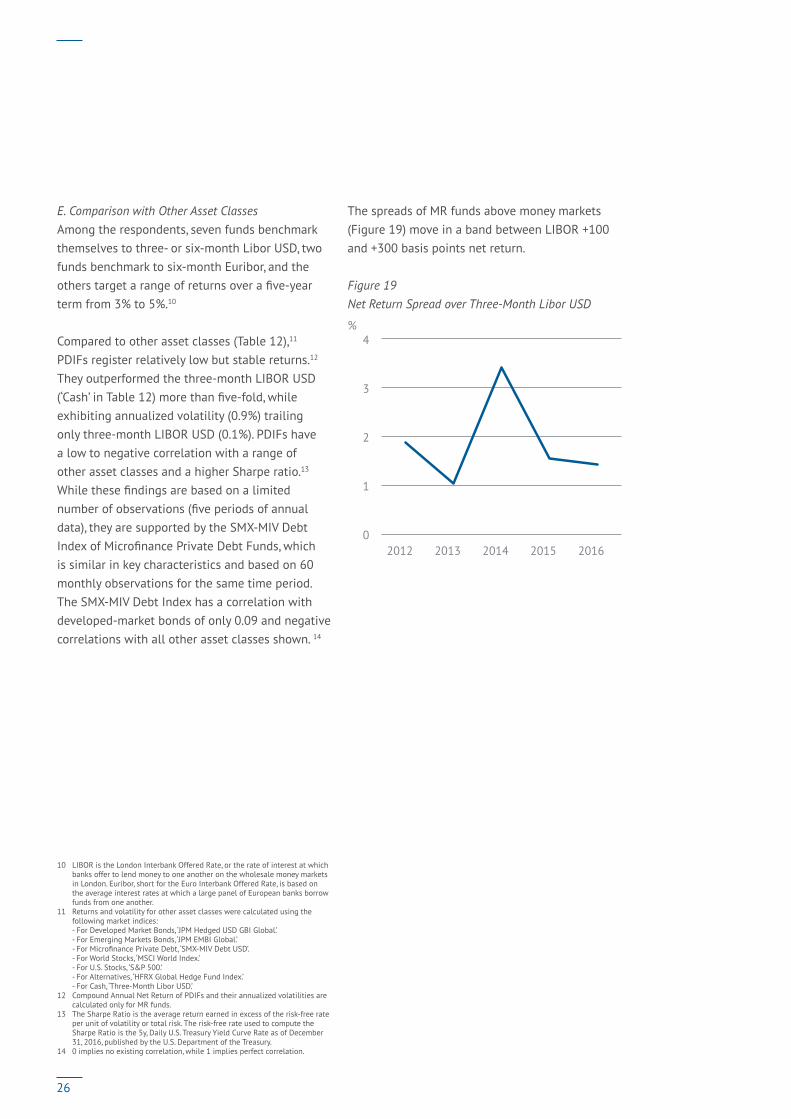
E. Comparison with Other Asset Classes Among the respondents, seven funds benchmark themselves to three- or six-month Libor USD, two funds benchmark to six-month Euribor, and the others target a range of returns over a five-year term from 3% to 5%.10
Compared to other asset classes (Table 12),11 PDIFs register relatively low but stable returns.12 They outperformed the three-month LIBOR USD (‘Cash’ in Table 12) more than five-fold, while exhibiting annualized volatility (0.9%) trailing only three-month LIBOR USD (0.1%). PDIFs have a low to negative correlation with a range of other asset classes and a higher Sharpe ratio.13 While these findings are based on a limited number of observations (five periods of annual data), they are supported by the SMX-MIV Debt Index of Microfinance Private Debt Funds, which is similar in key characteristics and based on 60 monthly observations for the same time period. The SMX-MIV Debt Index has a correlation with developed-market bonds of only 0.09 and negative correlations with all other asset classes shown. 14
10 LIBOR is the London Interbank Offered Rate, or the rate of interest at which banks offer to lend money to one another on the wholesale money markets in London. Euribor, short for the Euro Interbank Offered Rate, is based on the average interest rates at which a large panel of European banks borrow funds from one another.
11 Returns and volatility for other asset classes were calculated using the following market indices: - For Developed Market Bonds, ‘JPM Hedged USD GBI Global.’ - For Emerging Markets Bonds, ‘JPM EMBI Global.’
- For Microfinance Private Debt, ‘SMX-MIV Debt USD’. - For World Stocks, ‘MSCI World Index.’ - For U.S. Stocks, ‘S&P 500.’ - For Alternatives, ‘HFRX Global Hedge Fund Index.’ - For Cash, ‘Three-Month Libor USD.’
12 Compound Annual Net Return of PDIFs and their annualized volatilities are calculated only for MR funds.
13 The Sharpe Ratio is the average return earned in excess of the risk-free rate per unit of volatility or total risk. The risk-free rate used to compute the Sharpe Ratio is the 5y, Daily U.S. Treasury Yield Curve Rate as of December 31, 2016, published by the U.S. Department of the Treasury.
14 0 implies no existing correlation, while 1 implies perfect correlation.
The spreads of MR funds above money markets (Figure 19) move in a band between LIBOR +100 and +300 basis points net return.
Figure 19 Net Return Spread over Three-Month Libor USD
%Figure 19: Net Return Spread over Three-Month Libor USD
0
1
2
3
4
2012 2013 2014 2015 2016
26

Table 12 Returns, Volatility, and Correlation by Asset Class (2012–2016)
Private Debt Impact
Funds (MR Funds only)
Microfinance Private Debt
Developed Markets
Bonds
Emerging Markets
Bonds Cash World Stocks US Stocks Alternatives
Compound Annual Net Return (5 years) 2.6% 2.7% 3.4% 5.4% 0.4% 8.2% 12.2% 1.6%
Annualized Volatility (5 years) 0.9% 0.5% 3.1% 7.2% 0.1% 11.2% 10.4% 3.6%
Correlation Table
Private Debt Impact Funds (MR Funds only) 1.00 0.91 0.81 0.45 -0.43 -0.01 0.07 0.10
Microfinance Private Debt 1.00 0.09 -0.00 -0.30 -0.08 -0.11 -0.19
Developed Markets Bonds 1.00 0.37 -0.12 -0.17 -0.18 -0.13
Emerging Markets Bonds 1.00 0.05 0.57 0.44 0.42
Cash 1.00 -0.03 -0.03 0.04
World Stocks 1.00 0.95 0.85
US Stocks 1.00 0.83
Alternatives 1.00
Sharpe ratio 0.77 1.77 0.48 0.49 -25.45 0.56 1.00 -0.08 All results from the table (Returns, Volatility, Correlation and Sharpe Ratio) for Private Debt Impact Funds are calculated using five annual observation points (2012–2016) whereas results for all other asset classes are calculated using 60 monthly observation points (Jan. 2012 – Dec. 2016)
The spreads of MR funds above money markets (Figure 19) move in a band between LIBOR +100 and +300 basis points net return.
Figure 19 Net Return Spread over Three-Month Libor USD
%Figure 19: Net Return Spread over Three-Month Libor USD
0
1
2
3
4
2012 2013 2014 2015 2016
27
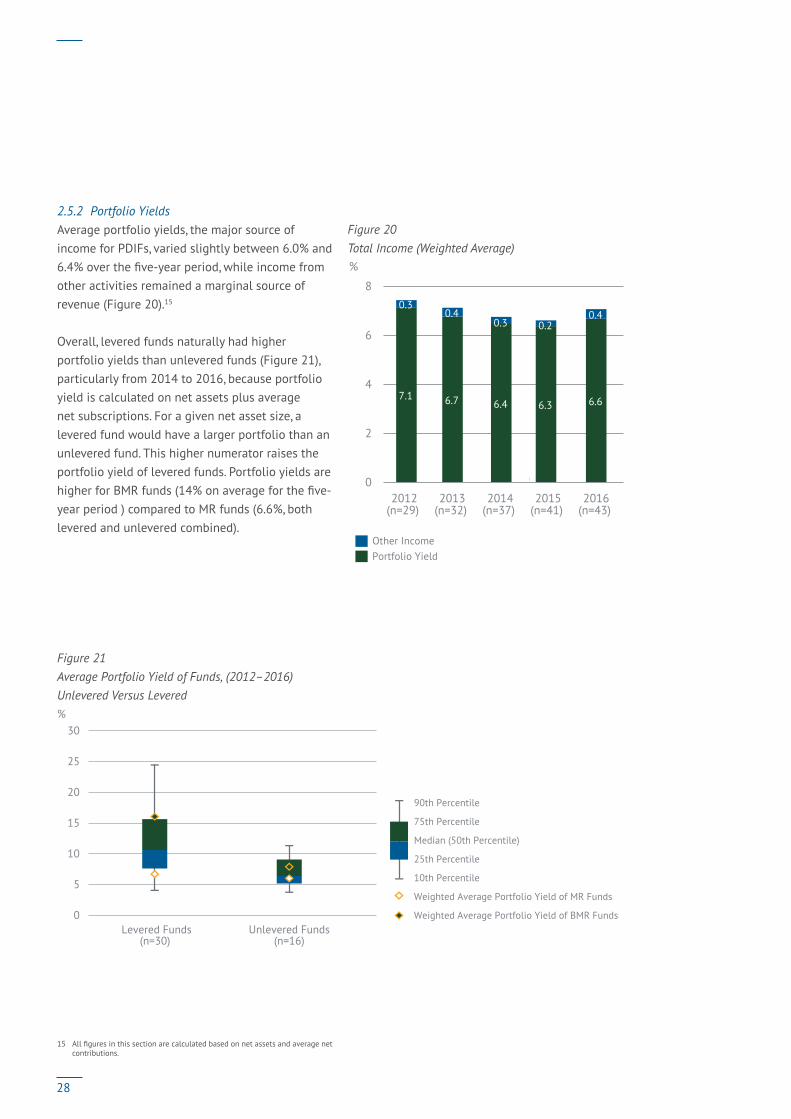
2.5.2 Portfolio YieldsAverage portfolio yields, the major source of income for PDIFs, varied slightly between 6.0% and 6.4% over the five-year period, while income from other activities remained a marginal source of revenue (Figure 20).15
Overall, levered funds naturally had higher portfolio yields than unlevered funds (Figure 21), particularly from 2014 to 2016, because portfolio yield is calculated on net assets plus average net subscriptions. For a given net asset size, a levered fund would have a larger portfolio than an unlevered fund. This higher numerator raises the portfolio yield of levered funds. Portfolio yields are higher for BMR funds (14% on average for the five-year period ) compared to MR funds (6.6%, both levered and unlevered combined).
Figure 21 Average Portfolio Yield of Funds, (2012–2016) Unlevered Versus Levered
Unlevered Funds(n=16)
%Figure 21: Average Portfolio Yield of Funds, Unlevered Versus Levered
0
5
10
15
20
25
30
Levered Funds(n=30)
90th Percentile
75th Percentile
Median (50th Percentile)
25th Percentile
10th Percentile
Weighted Average Portfolio Yield of MR Funds
Weighted Average Portfolio Yield of BMR Funds
15 All figures in this section are calculated based on net assets and average net contributions.
Figure 20 Total Income (Weighted Average) %Figure 20: Total Income (Weighted Average)
Other Income Portfolio Yield
0
2
4
6
8
2012(n=29)
2013(n=32)
2014(n=37)
2015(n=41)
2016(n=43)
7.1 6.7 6.4 6.3 6.6
0.30.4
0.3 0.20.4
28
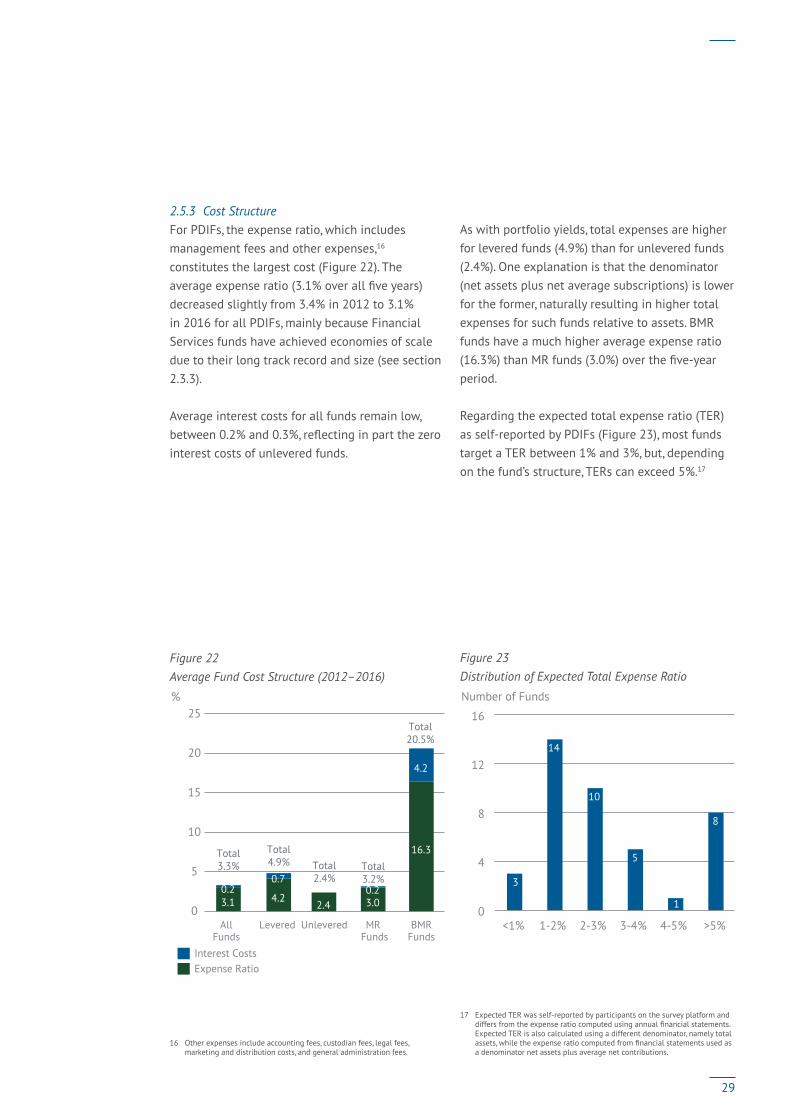
2.5.3 Cost StructureFor PDIFs, the expense ratio, which includes management fees and other expenses,16 constitutes the largest cost (Figure 22). The average expense ratio (3.1% over all five years) decreased slightly from 3.4% in 2012 to 3.1% in 2016 for all PDIFs, mainly because Financial Services funds have achieved economies of scale due to their long track record and size (see section 2.3.3).
Average interest costs for all funds remain low, between 0.2% and 0.3%, reflecting in part the zero interest costs of unlevered funds.
Figure 22 Average Fund Cost Structure (2012–2016)
%Figure 22: Average Fund Cost Structure (2012–2016)
Interest CostsExpense Ratio
Total3.3%
Total4.9% Total
2.4%Total3.2%
Total20.5%
0
5
10
15
20
25
AllFunds
Levered Unlevered MR Funds
BMRFunds
3.1 4.22.4 3.0
16.3
0.20.7
0.2
4.2
16 Other expenses include accounting fees, custodian fees, legal fees, marketing and distribution costs, and general administration fees.
As with portfolio yields, total expenses are higher for levered funds (4.9%) than for unlevered funds (2.4%). One explanation is that the denominator (net assets plus net average subscriptions) is lower for the former, naturally resulting in higher total expenses for such funds relative to assets. BMR funds have a much higher average expense ratio (16.3%) than MR funds (3.0%) over the five-year period.
Regarding the expected total expense ratio (TER) as self-reported by PDIFs (Figure 23), most funds target a TER between 1% and 3%, but, depending on the fund’s structure, TERs can exceed 5%.17
Figure 23 Distribution of Expected Total Expense Ratio
Number of Funds Figure 23: Distribution of Expected Total Expense Ratio
3
14
10
5
1
8
0
4
8
12
16
<1% 1-2% 2-3% 3-4% 4-5% >5%
17 Expected TER was self-reported by participants on the survey platform and differs from the expense ratio computed using annual financial statements. Expected TER is also calculated using a different denominator, namely total assets, while the expense ratio computed from financial statements used as a denominator net assets plus average net contributions.
29

2.6 PORTFOLIO RISKMost of the sample invests in emerging markets (see section 2.4.3 Geographical Breakdown), which informs their risk-management strategies in terms of investees, seniority, and portfolio quality. As of December 2016, half of the PDIFs’ total portfolio is invested in non-investment grade institutions (< BBB−), 33% denominated in local currency, and 85% in unsecured loans.
Figure 24 Loss Provisions Outstanding by Fund Size (2016, Weighted Average)
% of Portfolio Outstanding Figure 24: Loss Provisions Outstanding by Fund Size (2016, Weighted Average)
0
1
2
3
4
All Funds(n=26)
2.6%
1.3%
2.1%
3.1%
Small(n=8)
Medium(n=13)
Large(n=5)
Figure 25 Loss Provisions Outstanding by Hedging Strategy (2016, Weighted Average) % of Portfolio Outstanding Figure 25: Loss Provisions Outstanding by Hedging Strategy (2016, Weighted Average)
FullyHedged
PartiallyHedged
PartiallyHedged
excludingoutliers
FullyUnhedged
1.3%
4.6%
2.6%
0.5%
0
1
2
3
4
5
The level of loss provisioning for PDIFs in the sample was 2.6% on a weighted average basis (Figure 24). Larger funds tend to have higher provisioning ratios than smaller ones. Funds with total assets below USD 50 million had only 1.3% provision on average, whereas funds with total assets greater than USD 250 million had 3.1% of their portfolio provisioned, on average. BMR funds provisioned on average 7.3% compared to 2.6% for MR funds.
Furthermore, regarding hedging strategy, partially hedged funds have the highest provision rate (4.6%), and fully unhedged funds have the lowest rate (0.5%; Figure 25). However, fully unhedged funds are less mature than the others, on average, with most having fewer than three years’ track record.
Large funds have the highest proportion of written-off loans (Figure 26), even though the proportion remains relatively low compared to their provisioning ratio.
Figure 26 Write-offs by Fund Size (2016, Weighted Average)
% of Portfolio Outstanding Figure 26: Write-offs by Fund Size (2016, Weighted Average)
All Funds(n=19)
Small(n=5)
Medium(n=10)
Large(n=4)
0.7%
0.2%
0.4%
0.9%
0
0.2
0.4
0.6
0.8
1.0
Portfolio in Non-Investment Grade Institutions
Portfolio in Senior Debt
Portfolio in SubordinatedDebt
Portfolio in UnsecuredLoans
85%10%
52% Portfolio in Local Currency
33%
87%
30
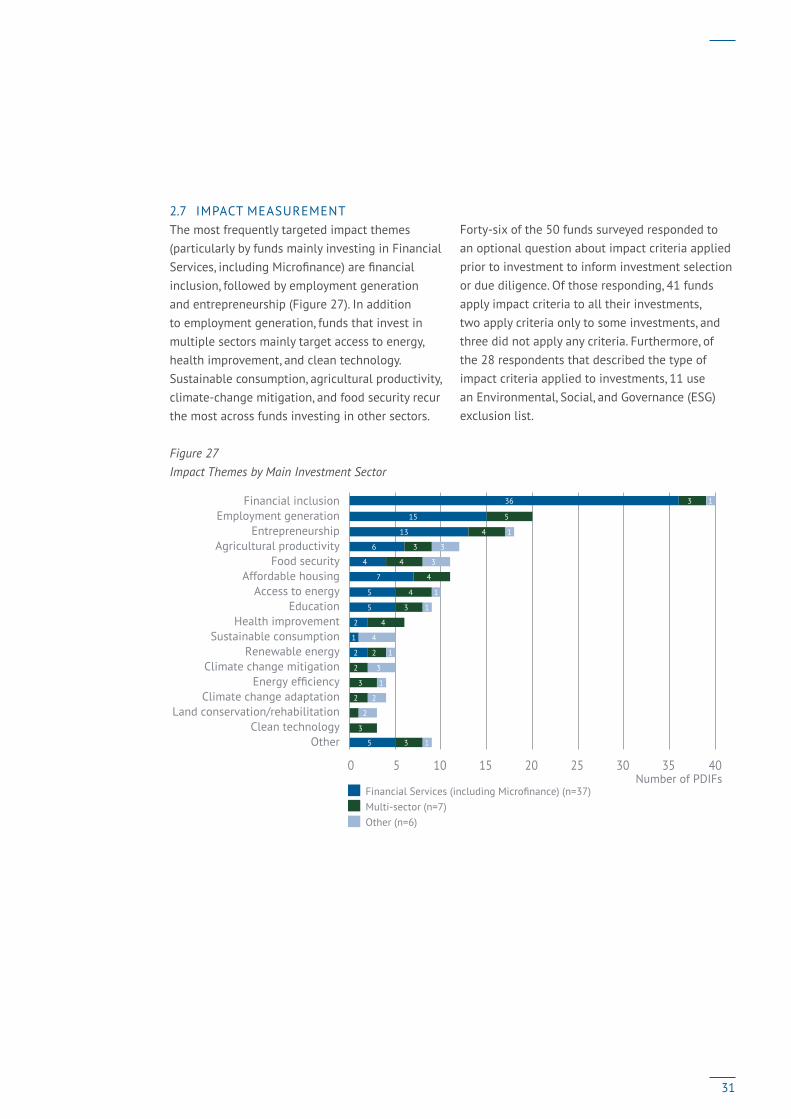
2.7 IMPACT MEASUREMENTThe most frequently targeted impact themes (particularly by funds mainly investing in Financial Services, including Microfinance) are financial inclusion, followed by employment generation and entrepreneurship (Figure 27). In addition to employment generation, funds that invest in multiple sectors mainly target access to energy, health improvement, and clean technology. Sustainable consumption, agricultural productivity, climate-change mitigation, and food security recur the most across funds investing in other sectors.
Figure 27 Impact Themes by Main Investment Sector
Financial Services (including Microfinance) (n=37)Multi-sector (n=7)Other (n=6)
0 5 10 15 20 25 30 35 40
Other
Number of PDIFs
Clean technology Land conservation/rehabilitation
Climate change adaptation Energy efficiency
Climate change mitigation Renewable energy
Sustainable consumption Health improvement
Education Access to energy
Affordable housing Food security
Agricultural productivity Entrepreneurship
Employment generation Financial inclusion
5
2
1
2
5
5
7
4
6
13
15
36
3
3
2
3
2
2
4
3
4
4
4
3
4
5
3
1
2
2
1
3
1
4
1
1
3
3
1
1
Forty-six of the 50 funds surveyed responded to an optional question about impact criteria applied prior to investment to inform investment selection or due diligence. Of those responding, 41 funds apply impact criteria to all their investments, two apply criteria only to some investments, and three did not apply any criteria. Furthermore, of the 28 respondents that described the type of impact criteria applied to investments, 11 use an Environmental, Social, and Governance (ESG) exclusion list.
31
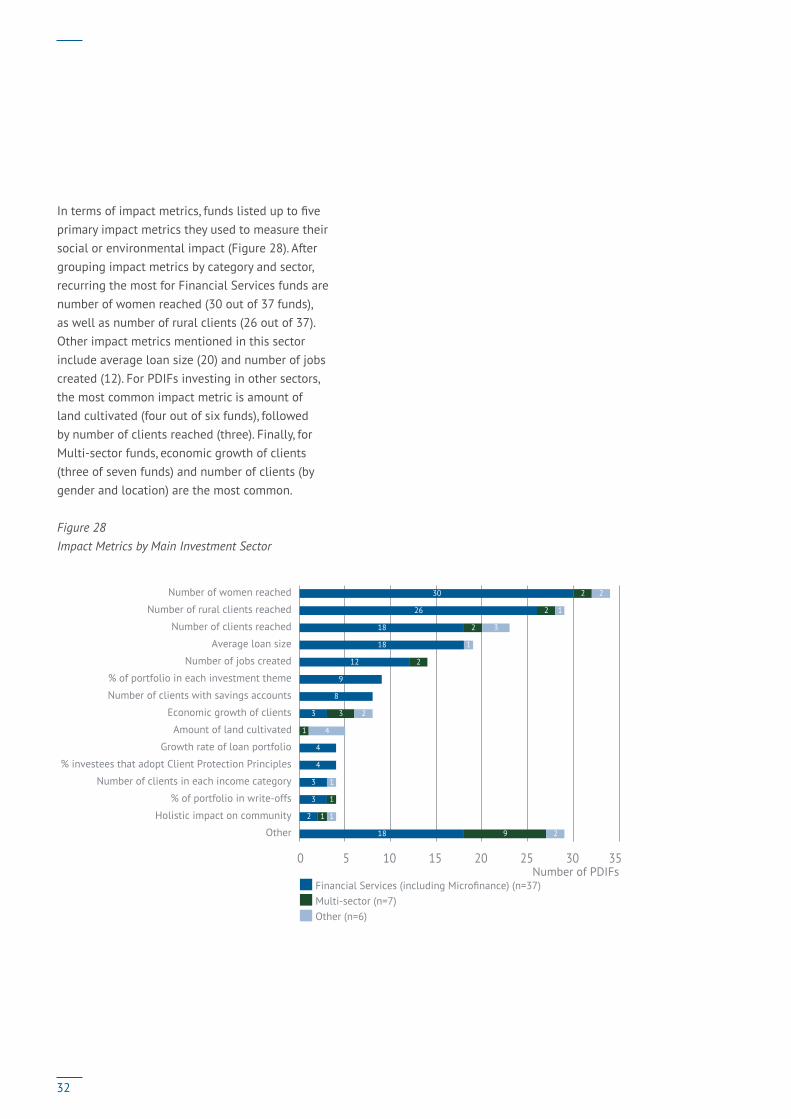
In terms of impact metrics, funds listed up to five primary impact metrics they used to measure their social or environmental impact (Figure 28). After grouping impact metrics by category and sector, recurring the most for Financial Services funds are number of women reached (30 out of 37 funds), as well as number of rural clients (26 out of 37). Other impact metrics mentioned in this sector include average loan size (20) and number of jobs created (12). For PDIFs investing in other sectors, the most common impact metric is amount of land cultivated (four out of six funds), followed by number of clients reached (three). Finally, for Multi-sector funds, economic growth of clients (three of seven funds) and number of clients (by gender and location) are the most common.
Figure 28 Impact Metrics by Main Investment Sector
Financial Services (including Microfinance) (n=37)Multi-sector (n=7)Other (n=6)
Number of PDIFs0 5 10 15 20 25 30 35
18
2
3
3
4
4
3
8
9
12
18
18
26
30
9
1
1
1
3
2
2
2
2
2
1
1
4
2
1
3
1
2
Other
Holistic impact on community
% of portfolio in write-offs
Number of clients in each income category
% investees that adopt Client Protection Principles
Growth rate of loan portfolio
Amount of land cultivated
Economic growth of clients
Number of clients with savings accounts
% of portfolio in each investment theme
Number of jobs created
Average loan size
Number of clients reached
Number of rural clients reached
Number of women reached
32
2.8 IMPACT PROFILESThe following section describes impact measurement and management processes and practices of three sample PDIFs: one investing primarily in Food and Agriculture, one focused on Financial Services (including Microfinance), and a third, Multi-sector fund.
2.8.1 Food and AgricultureBackgroundBy investing in agricultural businesses in developing countries, this open-ended fund aims to contribute to the sustainable development of actors in the value chain of local agriculture who can directly or indirectly contribute to the socioeconomic and ecological development of rural regions.
Specific impact objectives relate to agricultural productivity, resource security, job creation, working standards in agriculture, and livelihoods for farmers. Agriculture-related businesses to which the fund lends must: › employ a sustainable business model;› empower people at the base of the pyramid
by sourcing from smallholder farmers or employing people from low-income groups.
› demonstrate a commitment to socially and environmentally friendly production;
› ensure owner and manager integrity; and› have a real financing need (to avoid over-
indebtedness).
Impact Measurement and Management ProcessMonthly and quarterly reports are produced for investors with the following impact indicators: › number of investments;› number of institutions;› number of farmers reached;› number of countries; and› number of commodities.
Impact Results In November 2017 (the most recent month for which data were available), the fund was invested in 53 commodities spanning 44 developing countries. The fund reached over 814,000 farmers through the agricultural organizations it financed, helping drive economic growth in rural areas. For example, one company the fund financed helped rebuild the northern Ugandan cotton crop after the protracted period of armed conflict that ended in 2008. A capital injection enabled the company to establish cotton buying and processing operations, including purchasing a ginnery and accessing international buyers. Through its network of community-based agents, the company has provided agricultural extension and training services to 60,000 farmers on topics including agronomy, organic farming, post-harvest handling, numeracy, and financial literacy.
33
2.8.2 Financial ServicesBackgroundThis open-ended private placement fund seeks to increase financial inclusion by providing short-term loans to microfinance and SME financing institutions in emerging markets. The fund targets risk-adjusted, market-rate returns. Prior to investment, it assigns each prospective investee a social impact score, which it reviews, along with data on financial performance and anti-money laundering (AML) compliance, to determine whether to invest.
Impact Measurement and Management ProcessThe assessment prior to investment of social and environmental impact typically entails site visits to meet with various staff at the target investee, as well as interviews with end borrowers. The fund also considers whether the investee adheres to standard frameworks for client protection and social performance management, such as the SMART Campaign. After investing, the fund shares observations of social, environmental, or financial performance with senior leadership of the investee.
The fund continually measures progress towards improving financial inclusion by reviewing several key metrics on a quarterly basis. Examples include:› percent of borrowers that are women;› percent of investee staff that are women;› average loan size issued by the investee;› whether the investee is a deposit-taking
institution and thus has an appropriate range of product offerings; and
› growth rate of gross loan portfolios.
The fund monitors investee performance over time. If significant changes occur—such as a modification of investee product offerings or borrower demographics—the fund will conduct additional analysis to understand any underlying factors. The fund may then choose not to renew a loan. Additionally, the fund annually produces a publicly available impact report that aggregates data at the fund level, assessing the fund’s contributions toward three SDGs: 1. No Poverty, 5. Gender Equality, and 8. Decent Work and Economic Growth.
Impact ResultsAs of 2016 year’s end, the fund had financed a total of 36 institutions across nearly 20 countries. Among these financial institutions, nearly half were deposit-taking. On average, its portfolio companies reached nearly 300,000 active borrowers during 2016, among whom approximately 60% were women. Over three-quarters of loans were productive. In 2016, the fund also received a Gold GIIRS rating of its social and environmental impact.
34

2.8.3 Multi-sectorBackgroundThis open-ended private placement fund seeks market-rate returns from its portfolio, which is invested exclusively in emerging markets. The fund invests in multiple sectors, including Education, Energy, Food and Agriculture, and Housing to achieve a range of impact objectives aligned to six of the SDGs: 1. No Poverty, 7. Affordable and Clean Energy, 8. Decent Work and Economic Growth, 10. Reduced Inequalities, 12. Responsible Consumption and Production, and 17. Partnerships for the Goals.
Impact Measurement and Management ProcessPrior to offering financing to a prospective loan client, the fund gathers data to ascertain their impact potential. To determine whether to invest, the fund reviews both business-related criteria—such as operational track record, profitability, and growth—and impact-related criteria, including the quality of the investee’s products and services, the extent to which their impact can be measured, their governance structures, their reporting capabilities, and alignment of the company’s and fund’s visions.
During the life of a loan, the fund collects and reports impact data quarterly, using metrics identified by sector through the IRIS catalog. Additionally, investees participate in a GIIRS audit each year. The fund’s reports include the following metrics, among others:› metric tons of CO2 emissions reduced;› number of smallholder farmers;› number of clients receiving access to credit for
the first time;› percent of clients that are women; and› percent of clients that live in rural areas.
Though the fund does not set quantitative impact targets, it does monitor changes in investee performance on each metric over time. If the data show decreasing or stagnating impact performance, the fund will investigate the underlying causes of the issue. The fund may choose not to renew loans if they do not achieve the desired impact.
Impact ResultsDuring 2016, the fund reached nearly 400,000 clients, 90% of whom live in rural areas and 34% of whom are women. Portfolio companies employed over 4,500 staff. In one example, a solar energy portfolio company installed a solar system in a primary school in rural Uganda, which generated sufficient light and energy to power the school. As a result, students could access information through TV programming and study at the school during the evening hours.
35

36

3. CONCLUSIONInvestors can choose from a wide range of products to build diversified portfolios. This study demonstrates that investors have attractive options if seeking stable returns alongside positive impact.
Performance analysis over the period 2012 to 2016 presented here offers insights into the behavior of impact investments in private debt. These insights are also consistent with other research showing that returns on such investments typically maintain low volatility in the face of risk while performing in line with expectations.18 PDIFs are a gateway for different types of investors who seek to generate social and environmental impact, or both, alongside a financial return.
This study has shown that PDIFs have the following characteristics:
18 Abhilash Mudaliar and Rachel Bass, GIIN Perspectives: Evidence on the Financial Performance of Impact Investments (New York: Global Impact Investing Network, November 2017), https://thegiin.org/research/publication/financial-performance.
› Offer stable returns Returns for PDIFs seeking market-rate returns have averaged 2.6% per annum since 2012, with low volatility of 0.9%. Such PDIFs had a higher Sharpe ratio than a range of traditional investment products, including bonds and cash. Some PDIFs also raise debt financing, providing a fixed-income return to investors that has averaged 3% since 2012.
› Offer investors different risk-return strategies Investors accustomed to the traditional bond market may hesitate to invest in different, potentially less stable currencies. Such investors may prefer fully hedged funds—and such funds in the study’s sample registered a solid average return of 2.8% with 0.7% volatility. However,
the data also show that returns on average are higher (5.6%) in the more adventurous segment of fully unhedged funds, albeit with higher volatility (5.2%).
› Seek impact through a range of sectors While a range of sectors are represented in this sample, PDIF assets, at least in this sample, are concentrated in Financial Services. The most frequently cited impact objective for this group is financial inclusion, though funds also seek many other types of impact, from increased access to basic services like health and education to promotion of entrepreneurship and employment.
This study, which adds to a growing body of evidence regarding the financial performance of impact investments, takes the first steps toward building a robust database of private debt impact investing funds that will be maintained and regularly updated. This effort will establish much-needed, reliable benchmarks to help impact investors and fund managers make allocation decisions and compare their performance to peers. As the samples grow, so will their representativeness and value for current and prospective impact investors alike.
37

Symbiotics SARue de la Synagogue 31
1204 Geneva
Switzerland
Global Impact Investing NetworkOne Battery Park Plaza
2nd Floor
New York, NY 10004, USA
symbioticsgroup.com thegiin.org