the financial measures programme report
TRANSCRIPT

8/6/2019 The Financial Measures Programme Report
http://slidepdf.com/reader/full/the-financial-measures-programme-report 1/92
Central Bank of Ireland
The Financial Measures Programme Report M A R C H 2 0 1 1

8/6/2019 The Financial Measures Programme Report
http://slidepdf.com/reader/full/the-financial-measures-programme-report 2/92

8/6/2019 The Financial Measures Programme Report
http://slidepdf.com/reader/full/the-financial-measures-programme-report 3/92
1Central Bank of Ireland Financial Measures Programme
The Financial Measures Programme:
31 March 2011

8/6/2019 The Financial Measures Programme Report
http://slidepdf.com/reader/full/the-financial-measures-programme-report 4/92
2 Financial Measures Programme
Chapter
1. Foreword
2. Executive Summary
3. Detailed Results
3.1 Loan loss assessment
3.2 Prudential Capital Assessment Review (PCAR)
3.3 Prudential Liquidity Assessment Review (PLAR)
3.4 Deleveraging Review
Appendices
Glossary
8/6/2019 The Financial Measures Programme Report
http://slidepdf.com/reader/full/the-financial-measures-programme-report 5/92
3Financial Measures Programme
1. Foreword
Loan losses, actual and prospective, associated with the collapse of the property market and the severe
economic downturn, have weakened large parts of the Irish banking system and left the Irish-owned banksdependent on the State for injections of capital, and on the Eurosystem and the Central Bank of Ireland for liquidity.
The debt crisis of the peripheral euro area countries from mid-2010 was associated with reduced marketconfidence in Government securities and bank debt. Increasingly, wholesale deposits and bank bonds indomestic institutions began to be withdrawn on maturity, despite being protected by the Governmentguarantee.
Placing the finances of the banks and of the Government on a much more secure basis, and therebyreducing uncertainty, has become essential, as is recognised in the package of measures agreed as part of
the EC-ECB-IMF agreement. The Financial Measures Programme, of which the first details are announcedtoday, represents the banking element of this package.
The strategy implemented in the Financial Measures Programme intensifies existing policy by requiringasset sales, and a much larger increase in capital, sufficient to cover losses going well beyond what hasbeen catered for before. These losses could only occur in an even more stressed macroeconomicenvironment than already prevails, and on aggressively conservative assumptions about the possibleperformance of the banks’ loans under those conditions.
The Financial Measures Programme also defines a reduction in the size of the banks’ overall portfoliossufficient to reach a more viable Loan to Deposit Ratio by 2013. In the first instance the banks have beenrequired to identify segments of their business that are to be treated as ‘non-core’. These portfolios will
subsequently be disposed of – though avoiding fire-sale losses. This deleveraging will mean a lower needfor bank borrowing. It will also help create a clean, appropriately-sized banking system that is in a positionto provide new lending to support activities that are essential for economic growth.
In order to arrive at a stressed loan-loss estimate that is fully credible to the international markets, theCentral Bank has engaged BlackRock Solutions, a leading specialist in analysing potential loan losses
under stressed conditions. It has applied its international experience to the portfolios of the four main Irish-owned deposit banks. Its approach, which is regarded by the Central Bank as conservative, is explained in
this paper. It must be emphasised that the lifetime, stress loan-loss estimates are not considered likely tomaterialise: they are merely an input designed to ensure that the associated capital requirements are fully
convincing to the market as being sufficient to cover even extreme and improbable losses.
The Central Bank has made its decision on required recapitalisation based on the loan-loss projections of BlackRock, along with further calculations concerning the prospective income, expenditure, and
deleveraging plans of the banks. The Central Bank is publishing extensive details of the information used
in building the loan-loss and other estimates that have been used (except where prevented by law).

8/6/2019 The Financial Measures Programme Report
http://slidepdf.com/reader/full/the-financial-measures-programme-report 6/92
4 Financial Measures Programme

8/6/2019 The Financial Measures Programme Report
http://slidepdf.com/reader/full/the-financial-measures-programme-report 7/92
5Executive Summary Financial Measures Programme
2. Executive Summary

8/6/2019 The Financial Measures Programme Report
http://slidepdf.com/reader/full/the-financial-measures-programme-report 8/92
6 Financial Measures Programme
2. Executive Summary
Background
The Financial Measures Programme (“FMP”) implements the Central Bank of Ireland’s obligations under the agreement between Ireland and the European Commission (“EC”), European Central Bank (“ECB”) and
International Monetary Fund (“IMF”) (together referred to as the “External Partners”).
The Programme aims to place the Irish banking system in a position where it can fund itself and generatecapital without undue further reliance on the Irish or European public sectors. The FMP comprises:
• An independent loan loss assessment exercise performed by BlackRock Solutions(“BlackRock”), the results of which have informed the calculation of capital requirements under the
PCAR.
• The Prudential Capital Assessment Review (“PCAR”) 2011, an annual stress test of the capitalresources of the domestic banks under a given stress scenario, undertaken in order to calculate
the cost of recapitalisation required to meet Central Bank-imposed requirements.
• The Prudential Liquidity Assessment Review (“PLAR”) 2011, which establishes fundingtargets for banks participating in the PCAR in order to reduce the leverage of the banking system,
reduce banks’ reliance on short-term, largely central bank funding, and ensure convergence toBasel III liquidity standards over time.
This report describes in detail how the FMP has been executed, and the results of this part of theProgramme. The report refers to actions carried out in respect to Allied Irish Banks (“AIB”), Bank of Ireland(“BOI”), EBS Building Society (“EBS”) and Irish Life & Permanent (“ILP”). The FMP is a conservative,
transparent, and validated approach to assessing the capital needs of the banks while developing effectivedeleveraging plans.
The basis for assessing capital requirements
The PCAR capital requirements are derived from three exercises:
• The results of BlackRock’s independent loan loss assessment exercise;
• The results of the PCAR 2011 stress test; and
• The outputs of the PLAR, in particular banks’ plans for deleveraging.
The three are complementary but separate.
The loan loss exercise measures the nominal losses banks might experience under the base and adversescenarios, over both a three-year and a loan-lifetime horizon, stretching out to 2040. The base scenario is
in line with EU forecasts for the Irish economy and the adverse (inter-changeably referred to as the 'stress')scenario represents an unlikely further economic contraction.
These losses are estimated from a bottom-up analysis of loan data. By definition the results of thisexercise are severe as they do not take account of banks' existing or future provisions, or future operatingprofit, and should therefore not be considered in isolation. The BlackRock-derived figures in this report
should be read in this context.
The PCAR stress test is a top-down exercise which requires banks to model the impact of certainassumptions on their balance sheets and profit and loss accounts. While distinct from the EBA stress test,
the PCAR incorporates much of the methodology and parameters used by the EBA. It is designed to beclosely in line with the EBA stress test ensuring that required capital amounts under PCAR will satisfy EBAstandards. Results of the separate EBA stress test of Irish banks will be published in June along withresults from other European banks.
The PCAR stress test relies heavily on BlackRock's assessment of forecast losses through to the end of 2013. For elements of the income and expenditure accounts, it relies, in part, on the banks' own forecasts

8/6/2019 The Financial Measures Programme Report
http://slidepdf.com/reader/full/the-financial-measures-programme-report 9/92
7Financial Measures Programme
based on Central Bank-specified parameters. Additional buffers to ensure sufficient capital to cover post-
2013 events and other contingencies have also been included.
The PLAR is also a top-down exercise and requires banks to meet a range of target funding ratios. Thecentral target is the Loan to Deposit Ratio ("LDR"), which has the explicit purpose of shrinking the balance
sheets of the domestic banks. To achieve this target banks will be required to sell assets in a controlledmanner between 2011 and the end of 2013. In doing so, they are likely to incur losses relative to bookvalue. An estimate of these losses has been included in the overall assessment of the capital needs of each bank.
A conservative approach to bank capitalisation
Completing these exercises in combination has allowed the Central Bank to model both balance sheet andprofit and loss dynamics in a transparent and conservative manner, offering robust reassurance to the
market that the resulting capital requirements are based on credible stress modelling. Notably, theincorporation of incremental three-year provisions based on BlackRock-identified lifetime stress loan losses
has resulted in a total recapitalisation requirement materially in excess of the stand-alone application of EBA minimum parameters.
The selection of capital targets further adds to the conservatism of the exercise, with the banksparticipating in PCAR 2011 collectively required to raise 24.0bn in capital in order to remain above aminimum capital target of 10.5% Core Tier 1 in the base scenario and 6% Core Tier 1 in the stressscenario, plus an additional protective buffer. This compares favourably with many banking systems in
developed jurisdictions.
This Executive Summary describes: the process used to calculate the final capital requirements; how thisrequirement was impacted by three-year loan loss projections based on BlackRock forecast loan-life
losses; how the exercise was conducted using conservative assumptions and parameters; the inclusion of an additional capital buffer; and, as a result, the final capital requirements calculated under the FMP. In
addition, this section details plans agreed with the four institutions to deleverage their balance sheets,thereby beginning to 'right-size' the domestic banking sector.
The calculation method for the capital requirements
The final capital requirements are derived from a series of calculations which, at a high level, have requiredthe following steps:
• The estimation of loan-life and three-year losses under the base and adverse scenarios – theBlackRock exercise;
• The modelling of the impact of these losses on balance sheets and profit and loss accounts; and
• The combination of these two steps to produce a capital requirement for each of the four banks.
The relationship between the first and second steps is essential to understanding why the ‘raw’ BlackRock
loan loss estimates do not automatically translate into a capital number – in other words, there is not, nor could there be, a euro for euro translation of BlackRock’s estimates into capital. This is because:
• Losses take no account of existing or future provisions or future bank earnings;
• Losses are calculated over both a three-year and a loan-lifetime basis and have not beendiscounted back to a present value; and
• The model reports losses in the period in which they are realised.
The link between the BlackRock loan loss assessments and the final capital requirement is made through acalculation of three-year projected losses, inter-changeably referred to as three-year forecast provisions.
Provisions are the liabilities banks hold to meet losses. The translation of provisions into capital is acomplex process, and although there are long established accounting standards to govern this process, itultimately turns on judgements about the likelihood and size of losses. In interpreting the BlackRock loanloss estimates, the Central Bank has been careful to apply such judgements in a conservative manner, and
have drawn on expert accountants to inform and validate these judgements.
The principal driver of these three-year projected loss calculations in the PCAR is the output of BlackRock’swork. These three-year projected losses comprise:
8/6/2019 The Financial Measures Programme Report
http://slidepdf.com/reader/full/the-financial-measures-programme-report 10/92
8 Financial Measures Programme
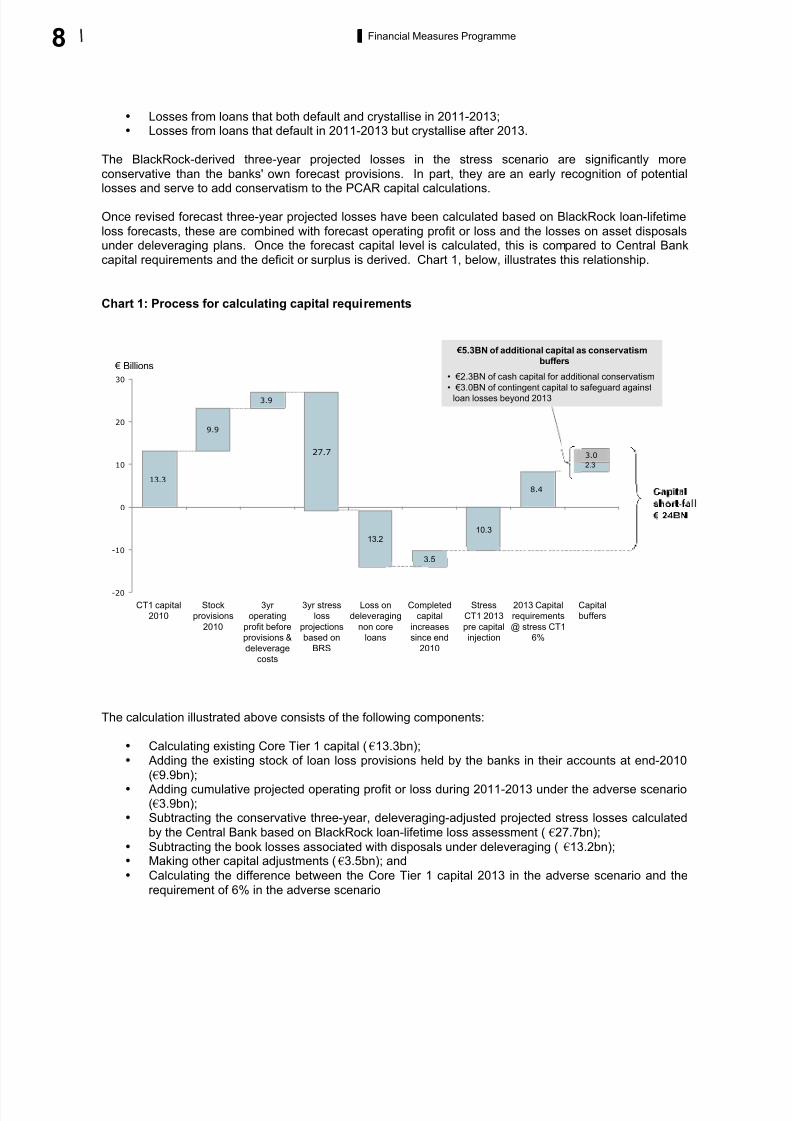
• Losses from loans that both default and crystallise in 2011-2013;• Losses from loans that default in 2011-2013 but crystallise after 2013.
The BlackRock-derived three-year projected losses in the stress scenario are significantly more
conservative than the banks' own forecast provisions. In part, they are an early recognition of potentiallosses and serve to add conservatism to the PCAR capital calculations.
Once revised forecast three-year projected losses have been calculated based on BlackRock loan-lifetime
loss forecasts, these are combined with forecast operating profit or loss and the losses on asset disposalsunder deleveraging plans. Once the forecast capital level is calculated, this is compared to Central Bankcapital requirements and the deficit or surplus is derived. Chart 1, below, illustrates this relationship.
Chart 1: Process for calculating capital requirements
The calculation illustrated above consists of the following components:
• Calculating existing Core Tier 1 capital ( 13.3bn);
• Adding the existing stock of loan loss provisions held by the banks in their accounts at end-2010
(
9.9bn);• Adding cumulative projected operating profit or loss during 2011-2013 under the adverse scenario
( 3.9bn);• Subtracting the conservative three-year, deleveraging-adjusted projected stress losses calculated
by the Central Bank based on BlackRock loan-lifetime loss assessment ( 27.7bn);
• Subtracting the book losses associated with disposals under deleveraging ( 13.2bn);• Making other capital adjustments ( 3.5bn); and
• Calculating the difference between the Core Tier 1 capital 2013 in the adverse scenario and the
requirement of 6% in the adverse scenario
5.3bn of additional capital as conservatism buffers• 2.3bn of cash capital for additional
conservatism• 3.0bn of contingent capital to safeguard
against loan losses beyond 2013
13.3
9.9
3.9
8.4
2.3
3.0
-20
-10
0
10
20
30
Billions
2013 Capital
requirements
@ stress CT1
6%
Stress
CT1 2013
pre capital
injection
10.3
Completed
capital
increases
since end
2010
3.5
Loss on
deleveraging
non core
loans
13.2
3yr stress
loss
projections
based on
BRS
27.7
3yr
operating
profit before
provisions &
deleverage
costs
Stock
provisions
2010
CT1 capital
2010
Capital
buffers
Capital
short-fall 24BN
5.3BN of additional capital as conservatism
buffers
• 2.3BN of cash capital for additional conservatism
• 3.0BN of contingent capital to safeguard againstloan losses beyond 2013
8/6/2019 The Financial Measures Programme Report
http://slidepdf.com/reader/full/the-financial-measures-programme-report 11/92
9Financial Measures Programme
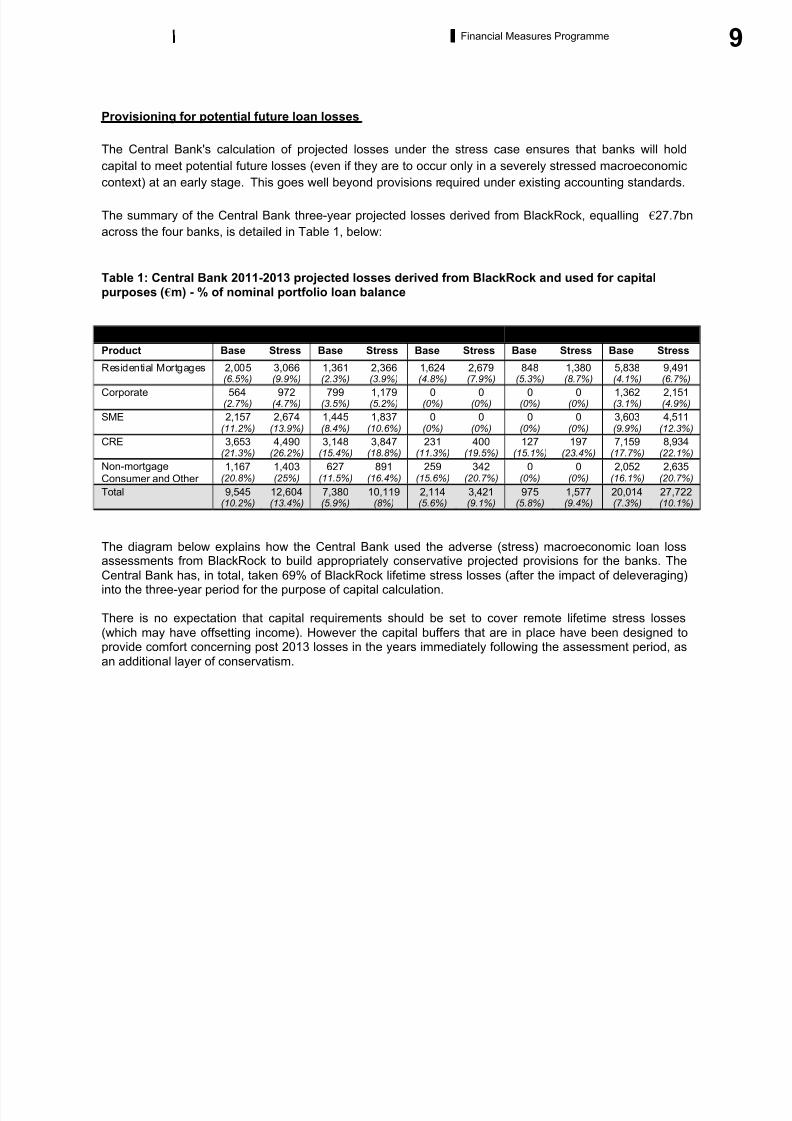
Provisioning for potential future loan losses
The Central Bank's calculation of projected losses under the stress case ensures that banks will hold
capital to meet potential future losses (even if they are to occur only in a severely stressed macroeconomic
context) at an early stage. This goes well beyond provisions required under existing accounting standards.
The summary of the Central Bank three-year projected losses derived from BlackRock, equalling 27.7bn
across the four banks, is detailed in Table 1, below:
Table 1: Central Bank 2011-2013 projected losses derived from BlackRock and used for capitalpurposes ( m) - % of nominal portfolio loan balance
AIB BOI ILP EBS Total
Product Base Stress Base Stress Base Stress Base Stress Base Stress
Residential Mortgages 2,005(6.5%)
3,066(9.9%)
1,361(2.3%)
2,366(3.9%)
1,624(4.8%)
2,679(7.9%)
848(5.3%)
1,380(8.7%)
5,838(4.1%)
9,491(6.7%)
Corporate 564(2.7%)
972(4.7%)
799(3.5%)
1,179(5.2%)
0(0%)
0(0%)
0(0%)
0(0%)
1,362(3.1%)
2,151(4.9%)
SME 2,157(11.2%)
2,674(13.9%)
1,445(8.4%)
1,837(10.6%)
0(0%)
0(0%)
0(0%)
0(0%)
3,603(9.9%)
4,511(12.3%)
CRE 3,653(21.3%)
4,490(26.2%)
3,148(15.4%)
3,847(18.8%)
231(11.3%)
400(19.5%)
127(15.1%)
197(23.4%)
7,159(17.7%)
8,934(22.1%)
Non-mortgageConsumer and Other
1,167(20.8%)
1,403(25%)
627(11.5%)
891(16.4%)
259(15.6%)
342(20.7%)
0(0%)
0(0%)
2,052(16.1%)
2,635(20.7%)
Total 9,545(10.2%)
12,604(13.4%)
7,380(5.9%)
10,119(8%)
2,114(5.6%)
3,421(9.1%)
975(5.8%)
1,577(9.4%)
20,014(7.3%)
27,722(10.1%)
The diagram below explains how the Central Bank used the adverse (stress) macroeconomic loan lossassessments from BlackRock to build appropriately conservative projected provisions for the banks. The
Central Bank has, in total, taken 69% of BlackRock lifetime stress losses (after the impact of deleveraging)into the three-year period for the purpose of capital calculation.
There is no expectation that capital requirements should be set to cover remote lifetime stress losses
(which may have offsetting income). However the capital buffers that are in place have been designed toprovide comfort concerning post 2013 losses in the years immediately following the assessment period, as
an additional layer of conservatism.
8/6/2019 The Financial Measures Programme Report
http://slidepdf.com/reader/full/the-financial-measures-programme-report 12/92
10 Financial Measures Programme
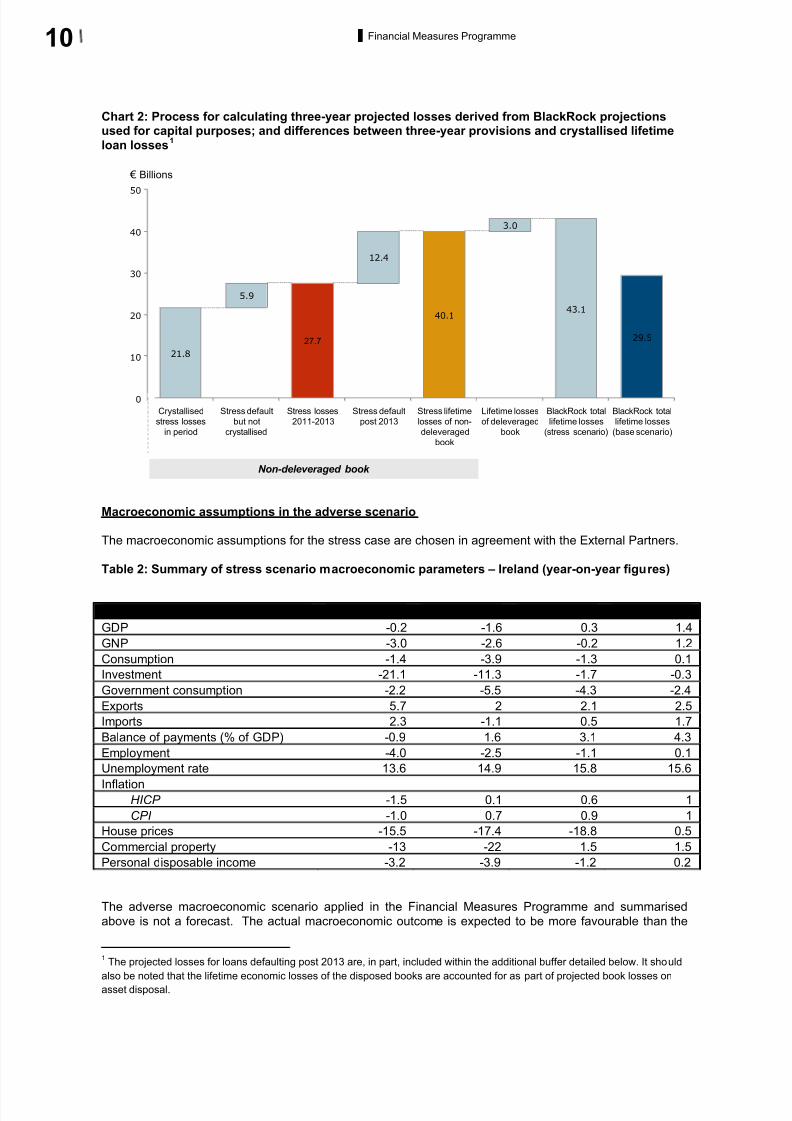
Chart 2: Process for calculating three-year projected losses derived from BlackRock projectionsused for capital purposes; and differences between three-year provisions and crystallised lifetimeloan losses
1
Macroeconomic assumptions in the adverse scenario
The macroeconomic assumptions for the stress case are chosen in agreement with the External Partners.
Table 2: Summary of stress scenario macroeconomic parameters – Ireland (year-on-year figures)
2010e
2011 2012 2013
GDP -0.2 -1.6 0.3 1.4
GNP -3.0 -2.6 -0.2 1.2
Consumption -1.4 -3.9 -1.3 0.1
Investment -21.1 -11.3 -1.7 -0.3
Government consumption -2.2 -5.5 -4.3 -2.4
Exports 5.7 2 2.1 2.5
Imports 2.3 -1.1 0.5 1.7
Balance of payments (% of GDP) -0.9 1.6 3.1 4.3
Employment -4.0 -2.5 -1.1 0.1
Unemployment rate 13.6 14.9 15.8 15.6
Inflation
HICP -1.5 0.1 0.6 1
CPI -1.0 0.7 0.9 1
House prices -15.5 -17.4 -18.8 0.5
Commercial property -13 -22 1.5 1.5
Personal disposable income -3.2 -3.9 -1.2 0.2
The adverse macroeconomic scenario applied in the Financial Measures Programme and summarised
above is not a forecast. The actual macroeconomic outcome is expected to be more favourable than the
1The projected losses for loans defaulting post 2013 are, in part, included within the additional buffer detailed below. It should
also be noted that the lifetime economic losses of the disposed books are accounted for as part of projected book losses onasset disposal.
Non-deleveraged book
50
40
30
20
10
0
BlackRock total
lifetime losses
(base scenario)
29.5
BlackRock total
lifetime losses
(stress scenario)
43.1
Lifetime losses
of deleveraged
book
3.0
Stress lifetime
losses of non-
deleveraged
book
40.1
Stress default
post 2013
12.4
Stress losses
2011-2013
27.7
Stress default
but not
crystallised
5.9
Crystallised
stress losses
in period
Billions
21.8
8/6/2019 The Financial Measures Programme Report
http://slidepdf.com/reader/full/the-financial-measures-programme-report 13/92
11Financial Measures Programme
stress case. In fact, given uncertainties in the current climate, it is improbable that either the base or the
stress scenario will prove to be accurate across the macroeconomic indicators, but using the unlikelyadverse scenario ensures that the capital basis of the institutions is appropriately stringent.
To ensure both clarity and consistency, the PCAR scenarios are to a large degree in line with the 2011
EBA stress tests on European banks.
The capital requirements
The consequence of applying conservative assumptions, and of setting demanding capital targets, is to
require Irish banks to raise a significant amount of additional capital.
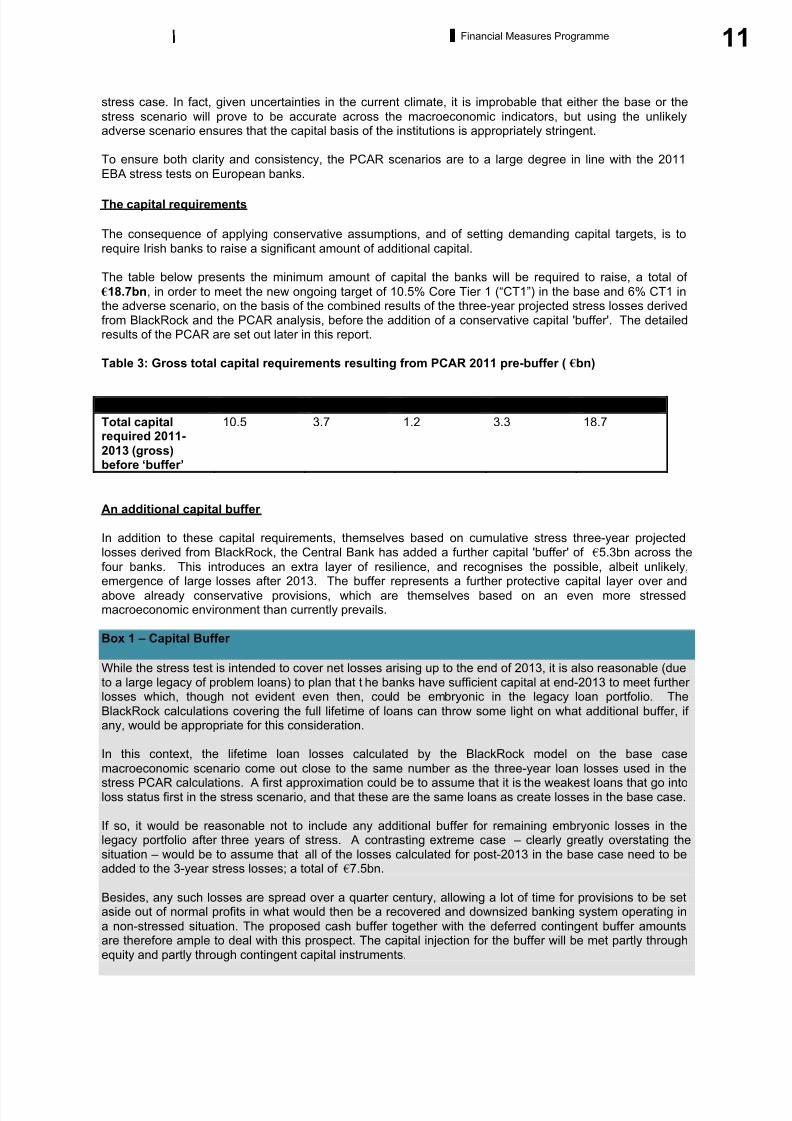
The table below presents the minimum amount of capital the banks will be required to raise, a total of
18.7bn, in order to meet the new ongoing target of 10.5% Core Tier 1 (“CT1”) in the base and 6% CT1 inthe adverse scenario, on the basis of the combined results of the three-year projected stress losses derivedfrom BlackRock and the PCAR analysis, before the addition of a conservative capital 'buffer'. The detailedresults of the PCAR are set out later in this report.
Table 3: Gross total capital requirements resulting from PCAR 2011 pre-buffer ( bn)
AIB BOI EBS ILP Total
Total capitalrequired 2011-
2013 (gross)before ‘buffer’
10.5 3.7 1.2 3.3 18.7
An additional capital buffer
In addition to these capital requirements, themselves based on cumulative stress three-year projectedlosses derived from BlackRock, the Central Bank has added a further capital 'buffer' of 5.3bn across the
four banks. This introduces an extra layer of resilience, and recognises the possible, albeit unlikely,
emergence of large losses after 2013. The buffer represents a further protective capital layer over andabove already conservative provisions, which are themselves based on an even more stressedmacroeconomic environment than currently prevails.
Box 1 – Capital Buffer
While the stress test is intended to cover net losses arising up to the end of 2013, it is also reasonable (dueto a large legacy of problem loans) to plan that the banks have sufficient capital at end-2013 to meet further losses which, though not evident even then, could be embryonic in the legacy loan portfolio. The
BlackRock calculations covering the full lifetime of loans can throw some light on what additional buffer, if any, would be appropriate for this consideration.
In this context, the lifetime loan losses calculated by the BlackRock model on the base case
macroeconomic scenario come out close to the same number as the three-year loan losses used in the
stress PCAR calculations. A first approximation could be to assume that it is the weakest loans that go intoloss status first in the stress scenario, and that these are the same loans as create losses in the base case.
If so, it would be reasonable not to include any additional buffer for remaining embryonic losses in thelegacy portfolio after three years of stress. A contrasting extreme case – clearly greatly overstating thesituation – would be to assume that all of the losses calculated for post-2013 in the base case need to beadded to the 3-year stress losses; a total of 7.5bn.
Besides, any such losses are spread over a quarter century, allowing a lot of time for provisions to be setaside out of normal profits in what would then be a recovered and downsized banking system operating in
a non-stressed situation. The proposed cash buffer together with the deferred contingent buffer amountsare therefore ample to deal with this prospect. The capital injection for the buffer will be met partly throughequity and partly through contingent capital instruments.
8/6/2019 The Financial Measures Programme Report
http://slidepdf.com/reader/full/the-financial-measures-programme-report 14/92
12 Financial Measures Programme
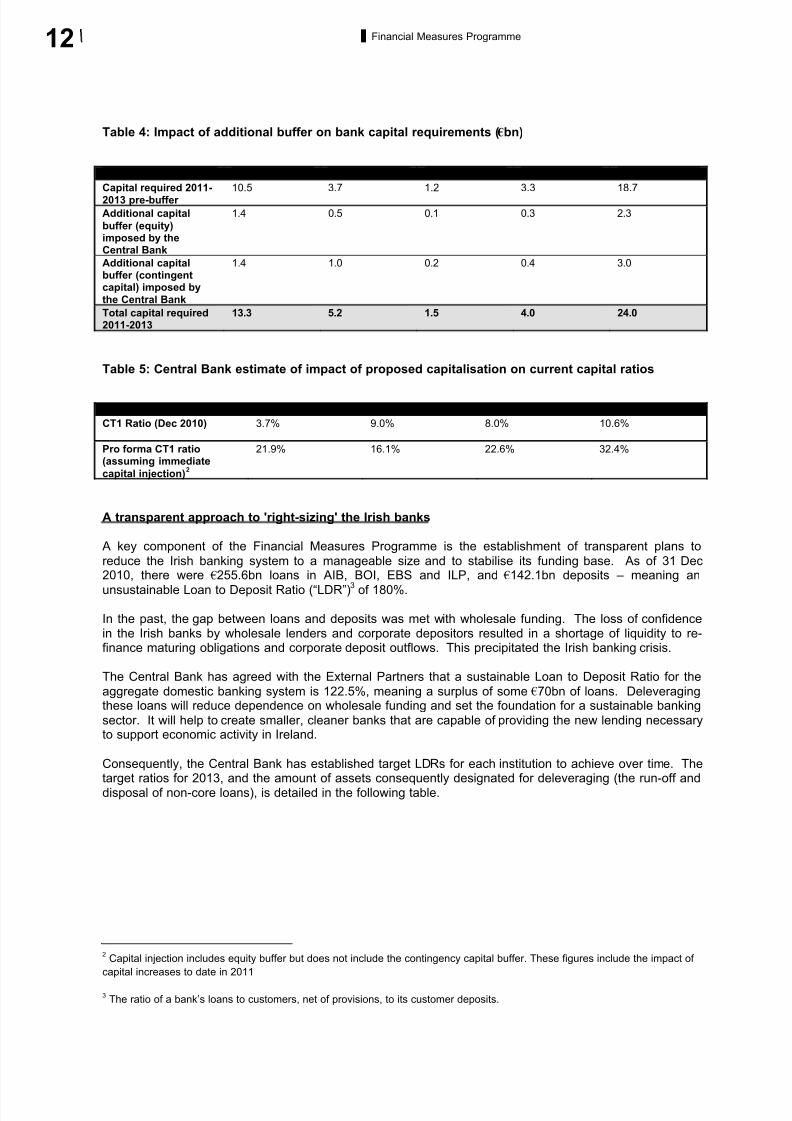
Table 4: Impact of additional buffer on bank capital requirements ( bn)
AIB BOI EBS ILP Total
Capital required 2011-2013 pre-buffer
10.5 3.7 1.2 3.3 18.7
Additional capital
buffer (equity)imposed by theCentral Bank
1.4 0.5 0.1 0.3 2.3
Additional capitalbuffer (contingentcapital) imposed bythe Central Bank
1.4 1.0 0.2 0.4 3.0
Total capital required2011-2013
13.3 5.2 1.5 4.0 24.0
Table 5: Central Bank estimate of impact of proposed capitalisation on current capital ratios
AIB BOI EBS ILPCT1 Ratio (Dec 2010) 3.7% 9.0% 8.0% 10.6%
Pro forma CT1 ratio(assuming immediate
capital injection)2
21.9% 16.1% 22.6% 32.4%
A transparent approach to 'right-sizing' the Irish banks
A key component of the Financial Measures Programme is the establishment of transparent plans to
reduce the Irish banking system to a manageable size and to stabilise its funding base. As of 31 Dec2010, there were 255.6bn loans in AIB, BOI, EBS and ILP, and 142.1bn deposits – meaning an
unsustainable Loan to Deposit Ratio (“LDR”)3 of 180%.
In the past, the gap between loans and deposits was met with wholesale funding. The loss of confidencein the Irish banks by wholesale lenders and corporate depositors resulted in a shortage of liquidity to re-finance maturing obligations and corporate deposit outflows. This precipitated the Irish banking crisis.
The Central Bank has agreed with the External Partners that a sustainable Loan to Deposit Ratio for the
aggregate domestic banking system is 122.5%, meaning a surplus of some 70bn of loans. Deleveragingthese loans will reduce dependence on wholesale funding and set the foundation for a sustainable banking
sector. It will help to create smaller, cleaner banks that are capable of providing the new lending necessaryto support economic activity in Ireland.
Consequently, the Central Bank has established target LDRs for each institution to achieve over time. The
target ratios for 2013, and the amount of assets consequently designated for deleveraging (the run-off anddisposal of non-core loans), is detailed in the following table.
2Capital injection includes equity buffer but does not include the contingency capital buffer. These figures include the impact of
capital increases to date in 2011
3The ratio of a bank’s loans to customers, net of provisions, to its customer deposits.

8/6/2019 The Financial Measures Programme Report
http://slidepdf.com/reader/full/the-financial-measures-programme-report 15/92
13Financial Measures Programme
Table 6: Total net loans; and deleveraging plans Dec 2010 – Dec 2013 ( bn)
Bank Dec 2010 Dec 2013 target Deleveraging 2010 - 20134
AIB 86.9 67.5 19.4
BOI 115.3 82.7 32.6
EBS 16.4 11.5 4.9
ILP 37.0 21.3 15.7
Total 255.6 185.2 72.6
Banks will implement deleveraging plans agreed with the Central Bank in order to transition to smaller
balance sheets and a more stable funding base. They will do this through the separation of assets into‘core’ and ‘non-core’ divisions, and the gradual run-off and disposal, avoiding a fire-sale, of their non-core
assets. There is no requirement on the State or the banks to aggressively achieve deleveraging to thepoint of creating fire-sale situations, as this would result in a significant unnecessary transfer of value tothird parties, funded via State capital injections.
The deleveraging of the banking system will give rise to losses which will create a need for further capital.These amounts are included in the overall capital requirement figures (see Chart 1).
The Irish public authorities will collectively oversee the banks’ implementation of these plans.
Providing transparency around costs and underlying assumptions
The total additional capital requirement (gross) for the four banks is 24.0bn. This is well within the 35bnprovided for this purpose in the Programme agreement. There are measures to reduce the cost to theGovernment including planned asset sales and Liability Management Exercises (“LME”). These are dealt
with separately in the Minister’s statement today.
The Central Bank's policy of transparency and the detailed results of the Programme contained within this
report seek to begin to re-establish confidence in the Irish banks and set out an appropriate path towardsfuture sustainability.
A validated programme of reform
The validation of the Financial Measures Programme is important in this process of re-establishingconfidence in the Irish banks. This work by the Central Bank was a key element of the Ireland’s agreementwith the EC, ECB and IMF. The stress test criteria and the terms of reference for the diagnostic evaluation
of bank assets were developed in consultation with the EC, ECB and IMF at the end of 2010, and theseinstitutions have since monitored progress in the implementation of the Programme.
The Central Bank also contracted international expertise to ensure that the stre ss testing, loan lossassessment and deleveraging plans set out within this report were subject to expert scrutiny and directionfrom independent specialists. In addition to this validation, the stress testing exercises have also beensubject to a peer review from central bank regulatory colleagues in France and Italy.
In accordance with the FMP, Anglo Irish Bank and Irish Nationwide Building Society were not included inthe PCAR and PLAR exercise because their loan books are being wound down. Appendix I provides acomment on these institutions in light of recent developments and the insights gained from the BlackRock
assessment process for the four other banks.
The remainder of this report is organised as follows and includes details for:
• The loan loss assessment exercise performed by BlackRock, and the translation of these figures
into three-year Central Bank loss forecast used for capital purposes;
4Total asset disposals plus net change in loan assets (across core and non-core)

8/6/2019 The Financial Measures Programme Report
http://slidepdf.com/reader/full/the-financial-measures-programme-report 16/92
14 Financial Measures Programme
• The PCAR stress testing exercise, which was used to calculate capital requirements;
• The PLAR liquidity review performed by the Central Bank; and
• The deleveraging plans agreed with the domestic institutions in order to reduce their assets and
'right-size' the aggregate balance sheet.

8/6/2019 The Financial Measures Programme Report
http://slidepdf.com/reader/full/the-financial-measures-programme-report 17/92
15Detailed Results Financial Measures Programme
3. Detailed Results
8/6/2019 The Financial Measures Programme Report
http://slidepdf.com/reader/full/the-financial-measures-programme-report 18/92
8/6/2019 The Financial Measures Programme Report
http://slidepdf.com/reader/full/the-financial-measures-programme-report 19/92
17Financial Measures Programme
captured in the future interest income found in the forecast income statements in the PCAR. The loan loss
assessment models cover the following portfolios:
• Residential mortgages• Corporate lending
• SME (small and medium enterprise) lending• CRE (commercial real estate) lending
• Non-mortgage consumer and other lending
BlackRock estimated the nominal, undiscounted losses each year over the forecast horizon for all banksand all portfolios. Their approach is close to an "intrinsic value" methodology
5, as opposed to a "mark to
market" approach, which would use current market prices. However the loss estimates do not take intoaccount the time value of money, standard accounting practices for the timing of loss recognition, existing
provisions, nor the possibility of offsetting income. Importantly, to avoid bias, BlackRock was not privy tothe banks' 2011 PCAR loss estimates.
Loan loss assessment models have been custom-built for the banks' portfolios as of 31 December 2010.
The primary data sources for these models were the institutions (data tapes as of 31 December 2010,historical data), the Central Bank (macroeconomic assumptions prepared in agreement with External
Partners), and third party information sources (for example, Moody's, CBRE, Lisney). With the exception of
consumer loans, the models assume that the portfolios run-off naturally through amortisation andprepayment; no growth or even replacement of loan balances is permitted.
The models were informed by the data integrity and verification and asset quality review (including a legalreview) exercises conducted in parallel. The sections in this chapter entitled Data Integrity and Verificationand Asset Quality Review contain summaries of these workstreams' activities and findings. Additionally,the models incorporated qualitative information gleaned from: interviews with bank management;
documentation provided by banks on a range of issues; and the experience and expertise of BlackRock.
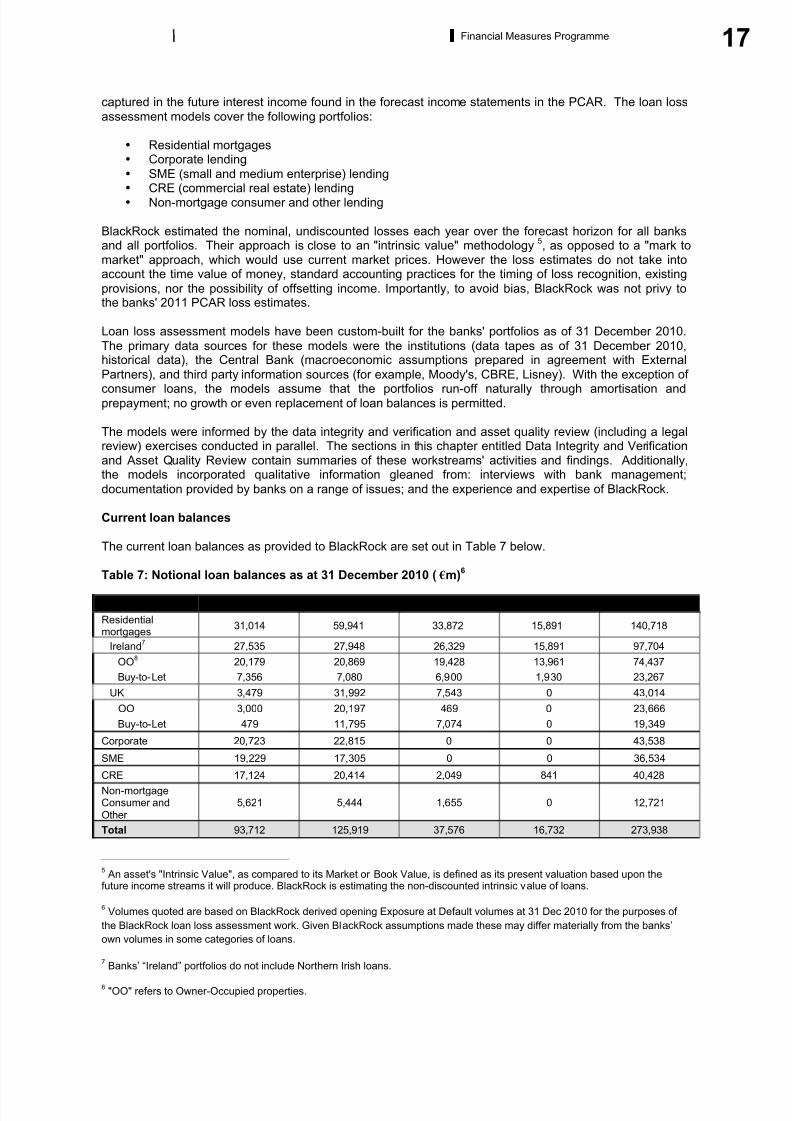
Current loan balances
The current loan balances as provided to BlackRock are set out in Table 7 below.
Table 7: Notional loan balances as at 31 December 2010 ( m)6
Product AIB BOI ILP EBS Total
Residentialmortgages
31,014 59,941 33,872 15,891 140,718
Ireland7
27,535 27,948 26,329 15,891 97,704
OO8
20,179 20,869 19,428 13,961 74,437
Buy-to-Let 7,356 7,080 6,900 1,930 23,267
UK 3,479 31,992 7,543 0 43,014
OO 3,000 20,197 469 0 23,666
Buy-to-Let 479 11,795 7,074 0 19,349
Corporate 20,723 22,815 0 0 43,538
SME 19,229 17,305 0 0 36,534
CRE 17,124 20,414 2,049 841 40,428Non-mortgageConsumer andOther
5,621 5,444 1,655 0 12,721
Total 93,712 125,919 37,576 16,732 273,938
5An asset's "Intrinsic Value", as compared to its Market or Book Value, is defined as its present valuation based upon the
future income streams it will produce. BlackRock is estimating the non-discounted intrinsic value of loans.
6Volumes quoted are based on BlackRock derived opening Exposure at Default volumes at 31 Dec 2010 for the purposes of
the BlackRock loan loss assessment work. Given BlackRock assumptions made these may differ materially from the banks’
own volumes in some categories of loans.
7Banks’ “Ireland” portfolios do not include Northern Irish loans.
8"OO" refers to Owner-Occupied properties.

8/6/2019 The Financial Measures Programme Report
http://slidepdf.com/reader/full/the-financial-measures-programme-report 20/92
18 Financial Measures Programme
Outputs of the loan loss assessment exercise
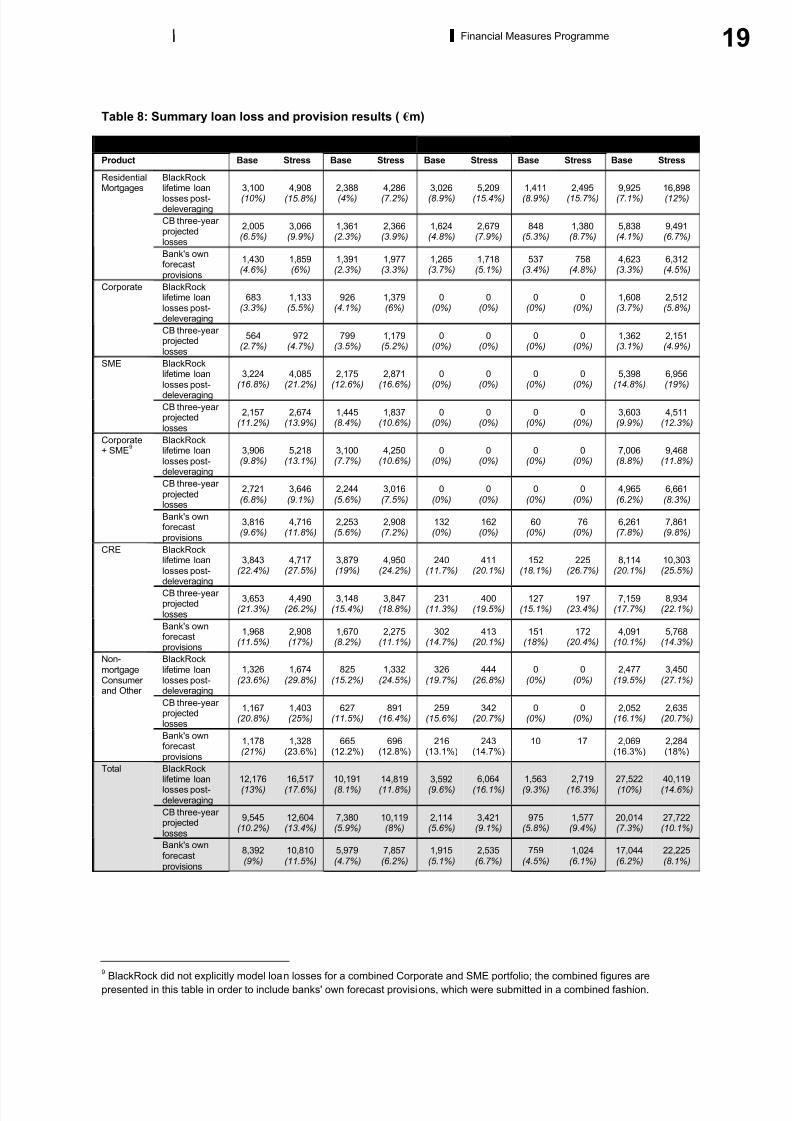
Table 8 sets out for comparative purposes the three key outputs of the loan loss assessment exercise:
1. BlackRock lifetime loan losses post-deleveraging: the cumulative lifetime crystallised losses in thebase and stress macroeconomic scenarios, assuming that all loan books are to be run-off as
estimated by BlackRock with the impact of the deleveraging plans taken into account as calculatedby the Central Bank. Percentages in this category reflect the BlackRock lifetime losses post-deleveraging divided by the starting balances laid out in Table 7.
2. “CB three-year projected losses”: the cumulative 2011-2013 crystallised losses plus losses
attributable to 2011-2013 loan defaults that crystallise later derived from BlackRock. The full
methodological explanation of how the BlackRock lifetime loan losses were converted to three-
year projected losses can be found in the Deriving three-year projected losses from BlackRock
figures section; these calculations were performed by the Central Bank using all necessary inputs
provided by BlackRock. Percentages in this category reflect the Central Bank three-year projected
losses divided by the starting balances laid out in Table 7.
3. Banks' own forecast provisions for 2011-2013: these have been reproduced here to demonstratethe additional level of conservatism built into PCAR 2011. Figures include the banks' 2010 stock of
provisions. Percentages in this category reflect the Banks’ own forecast provisions divided by the
banks’ own derived starting balances.
8/6/2019 The Financial Measures Programme Report
http://slidepdf.com/reader/full/the-financial-measures-programme-report 21/92
19Financial Measures Programme
Table 8: Summary loan loss and provision results ( m)
AIB BOI ILP EBS Total
Product Base Stress Base Stress Base Stress Base Stress Base Stress
BlackRocklifetime loanlosses post-deleveraging
3,100(10%)
4,908(15.8%)
2,388(4%)
4,286(7.2%)
3,026(8.9%)
5,209(15.4%)
1,411(8.9%)
2,495(15.7%)
9,925(7.1%)
16,898(12%)
CB three-year projectedlosses
2,005(6.5%)
3,066(9.9%)
1,361(2.3%)
2,366(3.9%)
1,624(4.8%)
2,679(7.9%)
848(5.3%)
1,380(8.7%)
5,838(4.1%)
9,491(6.7%)
ResidentialMortgages
Bank's ownforecastprovisions
1,430(4.6%)
1,859(6%)
1,391(2.3%)
1,977(3.3%)
1,265(3.7%)
1,718(5.1%)
537(3.4%)
758(4.8%)
4,623(3.3%)
6,312(4.5%)
BlackRocklifetime loanlosses post-deleveraging
683(3.3%)
1,133(5.5%)
926(4.1%)
1,379(6%)
0(0%)
0(0%)
0(0%)
0(0%)
1,608(3.7%)
2,512(5.8%)
Corporate
CB three-year projectedlosses
564(2.7%)
972(4.7%)
799(3.5%)
1,179(5.2%)
0(0%)
0(0%)
0(0%)
0(0%)
1,362(3.1%)
2,151(4.9%)
BlackRocklifetime loanlosses post-deleveraging
3,224(16.8%)
4,085(21.2%)
2,175(12.6%)
2,871(16.6%)
0(0%)
0(0%)
0(0%)
0(0%)
5,398(14.8%)
6,956(19%)
SME
CB three-year projectedlosses
2,157(11.2%)
2,674(13.9%)
1,445(8.4%)
1,837(10.6%)
0(0%)
0(0%)
0(0%)
0(0%)
3,603(9.9%)
4,511(12.3%)
BlackRocklifetime loanlosses post-deleveraging
3,906(9.8%)
5,218(13.1%)
3,100(7.7%)
4,250(10.6%)
0(0%)
0(0%)
0(0%)
0(0%)
7,006(8.8%)
9,468(11.8%)
CB three-year projectedlosses
2,721(6.8%)
3,646(9.1%)
2,244(5.6%)
3,016(7.5%)
0(0%)
0(0%)
0(0%)
0(0%)
4,965(6.2%)
6,661(8.3%)
Corporate+ SME
9
Bank's ownforecastprovisions
3,816(9.6%)
4,716(11.8%)
2,253(5.6%)
2,908(7.2%)
132(0%)
162(0%)
60(0%)
76(0%)
6,261(7.8%)
7,861(9.8%)
BlackRocklifetime loanlosses post-
deleveraging
3,843(22.4%)
4,717(27.5%)
3,879(19%)
4,950(24.2%)
240(11.7%)
411(20.1%)
152(18.1%)
225(26.7%)
8,114(20.1%)
10,303(25.5%)
CB three-year projectedlosses
3,653(21.3%)
4,490(26.2%)
3,148(15.4%)
3,847(18.8%)
231(11.3%)
400(19.5%)
127(15.1%)
197(23.4%)
7,159(17.7%)
8,934(22.1%)
CRE
Bank's ownforecastprovisions
1,968(11.5%)
2,908(17%)
1,670(8.2%)
2,275(11.1%)
302(14.7%)
413(20.1%)
151(18%)
172(20.4%)
4,091(10.1%)
5,768(14.3%)
BlackRocklifetime loanlosses post-deleveraging
1,326(23.6%)
1,674(29.8%)
825(15.2%)
1,332(24.5%)
326(19.7%)
444(26.8%)
0(0%)
0(0%)
2,477(19.5%)
3,450(27.1%)
CB three-year projectedlosses
1,167(20.8%)
1,403(25%)
627(11.5%)
891(16.4%)
259(15.6%)
342(20.7%)
0(0%)
0(0%)
2,052(16.1%)
2,635(20.7%)
Non-mortgageConsumer and Other
Bank's ownforecastprovisions
1,178(21%)
1,328(23.6%)
665(12.2%)
696(12.8%)
216(13.1%)
243(14.7%)
10 17 2,069(16.3%)
2,284(18%)
BlackRock
lifetime loanlosses post-deleveraging
12,176(13%)
16,517(17.6%)
10,191(8.1%)
14,819(11.8%)
3,592(9.6%)
6,064(16.1%)
1,563(9.3%)
2,719(16.3%)
27,522(10%)
40,119(14.6%)
CB three-year projectedlosses
9,545(10.2%)
12,604(13.4%)
7,380(5.9%)
10,119(8%)
2,114(5.6%)
3,421(9.1%)
975(5.8%)
1,577(9.4%)
20,014(7.3%)
27,722(10.1%)
Total
Bank's ownforecastprovisions
8,392(9%)
10,810(11.5%)
5,979(4.7%)
7,857(6.2%)
1,915(5.1%)
2,535(6.7%)
759(4.5%)
1,024(6.1%)
17,044(6.2%)
22,225(8.1%)
9 BlackRock did not explicitly model loan losses for a combined Corporate and SME portfolio; the combined figures arepresented in this table in order to include banks' own forecast provisions, which were submitted in a combined fashion.

8/6/2019 The Financial Measures Programme Report
http://slidepdf.com/reader/full/the-financial-measures-programme-report 22/92
20 Financial Measures Programme
Methodology and results by asset class
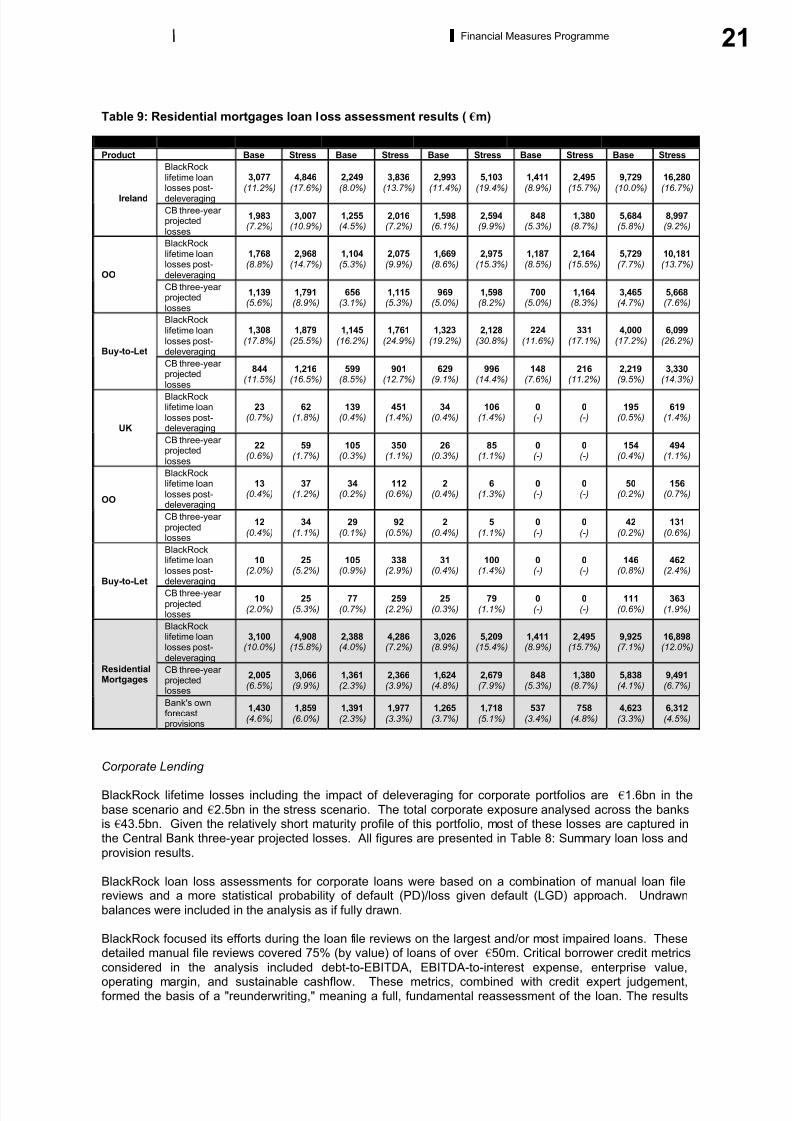
Residential mortgages
BlackRock lifetime losses including the impact of deleveraging for residential mortgage portfolios are 9.9bn in the base scenario and 16.9bn in the stress scenario. The total residential mortgage exposureanalysed across the banks is 140.7bn. More than 95% of losses in the residential mortgage portfolio areexpected to be generated from Ireland residential mortgage loans, which represent only 69% of notional
balances (the remainder is in the UK).
As there is a maturity tail of up to 30 years associated with residential mortgages, only a portion of these
lifetime losses is included in the Centra l Bank’s three-year projected losses. The Central Bank three-year projected losses derived from BlackRock figures amount to 5.8bn and 9.5bn in the base and stresscases, respectively. They are considerably more conservative than banks' own provisions (see Table 9:Residential mortgages loan loss assessment results). As noted elsewhere, an additional capital buffer is
applied for post-2013 losses.
BlackRock estimated losses using a statistical modelling approach incorporating macroeconomic factorssuch as the (assumed) forward path of house prices and interest rates, as well as lender-specific borrower
credit characteristics. Losses are defined as the principal loss amount crystallised at the time of propertyliquidation. This approach has been applied to all of the mortgage portfolios of the four banks.
The methodology employed a system of econometric behavioural models, calibrated to loan-level
data from Ireland and securitisation data from the UK. The objective of the modelling system was to projectcash flows and principal losses based on expectations regarding loan amortisation and prepayment,
borrower delinquency and default, and loss severity.
The modelling work identified ten factors – including indexed LTV, and loan age and affordability – that arepredictive in forecasting delinquency and prepayment. LTV also drove loan losses at default, alongsidecost and time to recover. Implicit in the model is the assumption that forbearance of high LTV loans
moderately increases losses by increasing time and expense to recovery, while impairing property valuethrough accumulated disrepair. In contrast, the banks' assessment of loan losses places considerable
weight on employment as a model input and focuses less on LTV. The banks' own forecasted provisionsreflect losses following forbearance measures; as employment data improves over time, loan performanceimproves regardless of LTV.
Given the lack of re-possession data in Ireland, BlackRock assumed that Irish repossession levels wouldconverge with those in the UK.
BlackRock supplemented the model-based approach described above with individual loan file reviews, real
estate valuation "drive-bys," bank management interviews, and the results of the Data Integrity and
Verification and Asset Quality Review exercises described in the self-entitled sections. The purpose of theloan file reviews was to enable BlackRock to calibrate their models to current Irish and UK fundamentals.
The real estate drive-bys utilised local real estate knowledge and were used to ensure that collateral re-indexation using published house price indices in the UK and the Ireland was effective. They establishedthat re-indexed values based on value at origination were in line with drive-by valuations for properties up
to 400K. Bank management interviews shed light on loan administration and servicing practices which inturn informed BlackRock assumptions regarding time and expense to recover.
The BlackRock models are statistically robust and performed well in out-of-time and out-of-sample testing.BCG, in its assessor role, has concluded that the models are appropriate in form, valid in construction, and
conservative in output.
8/6/2019 The Financial Measures Programme Report
http://slidepdf.com/reader/full/the-financial-measures-programme-report 23/92
21Financial Measures Programme
Table 9: Residential mortgages loan loss assessment results ( m)
AIB BOI ILP EBS Total
Product Base Stress Base Stress Base Stress Base Stress Base Stress
BlackRocklifetime loanlosses post-deleveraging
3,077(11.2%)
4,846(17.6%)
2,249(8.0%)
3,836(13.7%)
2,993(11.4%)
5,103(19.4%)
1,411(8.9%)
2,495(15.7%)
9,729(10.0%)
16,280(16.7%)
Ireland
CB three-year projectedlosses
1,983(7.2%)
3,007(10.9%)
1,255(4.5%)
2,016(7.2%)
1,598(6.1%)
2,594(9.9%)
848(5.3%)
1,380(8.7%)
5,684(5.8%)
8,997(9.2%)
BlackRocklifetime loanlosses post-deleveraging
1,768(8.8%)
2,968(14.7%)
1,104(5.3%)
2,075(9.9%)
1,669(8.6%)
2,975(15.3%)
1,187(8.5%)
2,164(15.5%)
5,729(7.7%)
10,181(13.7%)
OO
CB three-year projectedlosses
1,139(5.6%)
1,791(8.9%)
656(3.1%)
1,115(5.3%)
969(5.0%)
1,598(8.2%)
700(5.0%)
1,164(8.3%)
3,465(4.7%)
5,668(7.6%)
BlackRocklifetime loanlosses post-deleveraging
1,308(17.8%)
1,879(25.5%)
1,145(16.2%)
1,761(24.9%)
1,323(19.2%)
2,128(30.8%)
224(11.6%)
331(17.1%)
4,000(17.2%)
6,099(26.2%)
Buy-to-Let
CB three-year projectedlosses
844(11.5%)
1,216(16.5%)
599(8.5%)
901(12.7%)
629(9.1%)
996(14.4%)
148(7.6%)
216(11.2%)
2,219(9.5%)
3,330(14.3%)
BlackRocklifetime loanlosses post-deleveraging
23(0.7%)
62(1.8%)
139(0.4%)
451(1.4%)
34(0.4%)
106(1.4%)
0(-)
0(-)
195(0.5%)
619(1.4%)
UK
CB three-year projectedlosses
22(0.6%)
59(1.7%)
105(0.3%)
350(1.1%)
26(0.3%)
85(1.1%)
0(-)
0(-)
154(0.4%)
494(1.1%)
BlackRocklifetime loanlosses post-deleveraging
13(0.4%)
37(1.2%)
34(0.2%)
112(0.6%)
2(0.4%)
6(1.3%)
0(-)
0(-)
50(0.2%)
156(0.7%)
OO
CB three-year projectedlosses
12(0.4%)
34(1.1%)
29(0.1%)
92(0.5%)
2(0.4%)
5(1.1%)
0(-)
0(-)
42(0.2%)
131(0.6%)
BlackRocklifetime loanlosses post-
deleveraging
10(2.0%)
25(5.2%)
105(0.9%)
338(2.9%)
31(0.4%)
100(1.4%)
0(-)
0(-)
146(0.8%)
462(2.4%)
Buy-to-LetCB three-year projectedlosses
10(2.0%)
25(5.3%)
77(0.7%)
259(2.2%)
25(0.3%)
79(1.1%)
0(-)
0(-)
111(0.6%)
363(1.9%)
BlackRocklifetime loanlosses post-deleveraging
3,100(10.0%)
4,908(15.8%)
2,388(4.0%)
4,286(7.2%)
3,026(8.9%)
5,209(15.4%)
1,411(8.9%)
2,495(15.7%)
9,925(7.1%)
16,898(12.0%)
CB three-year projectedlosses
2,005(6.5%)
3,066(9.9%)
1,361(2.3%)
2,366(3.9%)
1,624(4.8%)
2,679(7.9%)
848(5.3%)
1,380(8.7%)
5,838(4.1%)
9,491(6.7%)
ResidentialMortgages
Bank's ownforecastprovisions
1,430(4.6%)
1,859(6.0%)
1,391(2.3%)
1,977(3.3%)
1,265(3.7%)
1,718(5.1%)
537(3.4%)
758(4.8%)
4,623(3.3%)
6,312(4.5%)
Corporate Lending
BlackRock lifetime losses including the impact of deleveraging for corporate portfolios are 1.6bn in the
base scenario and 2.5bn in the stress scenario. The total corporate exposure analysed across the banksis 43.5bn. Given the relatively short maturity profile of this portfolio, most of these losses are captured inthe Central Bank three-year projected losses. All figures are presented in Table 8: Summary loan loss and
provision results.
BlackRock loan loss assessments for corporate loans were based on a combination of manual loan filereviews and a more statistical probability of default (PD)/loss given default (LGD) approach. Undrawn
balances were included in the analysis as if fully drawn.
BlackRock focused its efforts during the loan file reviews on the largest and/or most impaired loans. Thesedetailed manual file reviews covered 75% (by value) of loans of over 50m. Critical borrower credit metrics
considered in the analysis included debt-to-EBITDA, EBITDA-to-interest expense, enterprise value,operating margin, and sustainable cashflow. These metrics, combined with credit expert judgement,formed the basis of a "reunderwriting," meaning a full, fundamental reassessment of the loan. The results
8/6/2019 The Financial Measures Programme Report
http://slidepdf.com/reader/full/the-financial-measures-programme-report 24/92
22 Financial Measures Programme
of the reunderwriting informed forecasting assumptions for the remaining portfolio. As a result of
differences between reunderwritten and original bank credit grades, BlackRock applied a conservativeadjustment to current bank credit grades for all other loans.
BlackRock has substantial in-house knowledge of PDs and LGDs for corporate loans based on historical
experience. In addition, BlackRock referenced standard benchmarks. The loss severities were adjusted toreflect macroeconomic assumptions developed by the Central Bank in conjunction with External Partners(see Appendix C).
It is worth noting that banks submitted forecasted provisions for Corporate combined with SME, accordingto the PCAR instructions. When the Central Bank three-year projected losses are combined across thesetwo portfolios, AIB's forecasted provisions are higher than the Central Bank three-year projections, whilethe forecasts of BOI are similar to those of the Central Bank.
Small and medium enterprise (SME) lending
BlackRock lifetime losses including the impact of deleveraging for the SME portfolios are 5.4bn in the
base scenario and 7.0bn in the stress scenario. The total SME exposure analysed across the banks is 36.5bn.
The banks submitted forecasted provisions for Corporate combined with SME. When the Central Bankthree-year projected losses are combined across these two portfolios, AIB's forecasted provisions arehigher than the Central Bank three-year projections, while the forecasts of BOI are similar to those of theCentral Bank. It is worth noting that that as the BlackRock SME model incorporates a relatively large
degree of forbearance into the timing of losses, the BlackRock results in crystallised losses beyond the2013 horizon for which the banks might have provisioned. The forbearance assumption is further detailed
in this section. All figures are presented in Table 8: Summary loan loss and provision results.
BlackRock loan loss assessments for SME were based on quantitative and qualitative analysis and used aratings-based expected loss approach, which incorporates projected PD and LGD as the main parametersin estimating losses over time.
The PD forecasts by industry based on three years of the banks' own historical rating migration experience.
BlackRock rebased the derived default matrices to current GDP and unemployment, and then rolled themforward in line with Central Bank forecasts based on the historical relationship of corporate insolvency ratesto GDP and unemployment.
The portfolio LGD assumptions for both Ireland and UK consider among other factors: (i) property-basedlending criteria prevailing during the boom; (ii) the decline in commercial real estate values; (iii) the extent
of excess leverage; (iv) a severe economic outlook, as defined in the macroeconomic parameters specifiedby the Central Bank (see Appendix C); and (v) BlackRock and external benchmarks.
Qualitative findings from a sample-based loan file review and bank management meetings helped informkey modelling assumptions and strengthened the robustness of the loss forecasts for each portfolio. Theloan file sample was taken by BlackRock across industry sectors, geographies, origination channels, credit
quality bands, and exposure sizes. It focused on the most distressed industry sectors, in particular their repayment capacity, excess leverage, and current internal credit rating.
It is worth noting that a considerable number of SME borrowers reviewed as part of the BlackRock loan file
review had exposure to distressed CRE. In the majority of cases, such exposures were rated either watchlist or impaired under the banks' internal ratings systems.
For Ireland, BlackRock applied a forbearance overlay to its loss projections to take into account the current
and future level of forbearance and the balance sheet restructuring backlog. The overlay assumes a two-to four-year work-out period and impacts the timing of principal losses, but not the amount. From bankmanagement interviews, it was evident to BlackRock that significant additional resources would be requiredto address the restructuring backlog. Banks' own forecast provisions may not have taken this backlog into
consideration to the same extent.
Commercial real estate (CRE) lending
BlackRock lifetime losses including the impact of deleveraging for the CRE portfolio are 8.1bn in the basescenario and 10.3bn in the stress scenario. The total CRE exposure analysed across the banks is

8/6/2019 The Financial Measures Programme Report
http://slidepdf.com/reader/full/the-financial-measures-programme-report 25/92
23Financial Measures Programme
40.4bn. The Central Bank’s three-year projected losses take into account the portion of the BlackRock
lifetime losses that crystallise within the three-year period as well as in 2014, taking into account the one-year work-out period assumed for this portfolio. The banks' own forecast provisions are substantially lower than those calculated by the Central Bank. All figures are presented in Table 8: Summary loan loss andprovision results.
In order to reach loss estimates for the CRE portfolios, BlackRock performed a bottom-up analysis on thelarger facility exposures (~20% of the portfolio) with a view to achieving maximum risk-based coverage.The rest of the portfolio was modelled where data permitted. Part of the portfolio had insufficient data to
allow for bottom-up modelling.
As was done for corporate loans, BlackRock "reunderwrote" 75% by value of CRE loans over 50m. An
additional 200 individual CRE loans were reviewed. For the rest of the portfolio BlackRock’s methodologyis deterministic, using property level debt service coverage and loan-to-value to project defaults andsubsequent losses given default. The model hinges on current net operating income (“NOI”) for theproperties securing the facility, as provided by the banks. The model estimates 25-year cashflows and
valuations for each property, by integrating forecast NOI growth and capitalisation rates by property typeand geography.
The loan loss assessment model for CRE loans was highly data-dependent. This meant that loss
estimates required: up-to-date rent rolls, attachment points in capital structures, property values, derivedloan-to-value (LTV) ratios, and debt service coverage ratios (DSCR). In most cases this information wasavailable on paper but not electronically. In other instances, data was unavailable, incomplete, or inaccurate. Where critical data was missing for a facility, BlackRock categorised the loan data as
insufficient to allow for bottom-up modelling. In these cases, loans were assigned the loss rates of similar modelled loans.
It is worth noting that a considerable number of borrowers reviewed as part of the BlackRock SME loan file
review had exposure to distressed CRE. In the majority of cases, such exposures were rated either watchlist or impaired under the banks' internal ratings systems.
Assets designated for transfer to NAMA under NAMA II were not examined by BlackRock. Instead, theywere classed as assets to be deleveraged over the time period, and haircuts were applied to their value inline with the haircuts applied under NAMA transfers during 2010 (on average about 60%). At publication,
these assets were still scheduled to be transferred to NAMA.
Non-mortgage consumer and other lending
BlackRock lifetime losses including the impact of deleveraging for non-mortgage consumer and other
lending portfolios are 2.5bn in the base scenario and 3.5bn in the stress scenario. The total non-mortgage consumer and other exposure analysed across the banks is 12.7bn. Given the relatively short
maturity profile of these portfolios, the Central Bank three-year projected losses take into account themajority of these lifetime losses. The Central Bank three-year projected losses are slightly higher than thebanks' own forecast provisions. All figures are presented in Table 8: Summary loan loss and provisionresults.
In cases where "other" loans were similar to asset classes described in other sections, BlackRock
employed a modelling approach analogous to the most relevant asset class. For the remainder, in contrastto the other portfolios BlackRock's approach in this segment is top-down, meaning that forecasts areportfolio-level rather than loan-level. The approach forecasts loan delinquency based on a macroeconomicregression model that varies by loan sub-portfolio. In the case of most non-mortgage consumer sub-portfolios, the regression model is driven by a single factor: unemployment. Conservative assumptions on
the cure rate and loss given default by sub-portfolio drive ultimate loan losses.
Securities and derivatives
In addition to forecasting loan losses, BlackRock examined banks’ securities and derivatives portfolios.
BlackRock analysed a portfolio of 59.8bn in securities across 1,597 individual positions. The majority of the securities at the institutions were used as liquidity instruments for cash management purposes. AIB
and BOI also supplied data on small portfolios of more illiquid assets held on their corporate balance sheet.
Pricing discrepancies for all positions spot-checked were not material.

8/6/2019 The Financial Measures Programme Report
http://slidepdf.com/reader/full/the-financial-measures-programme-report 26/92
24 Financial Measures Programme
BlackRock also performed a high-level review of individual derivatives positions. These instruments were
almost exclusively of the type generally used to support hedging and funding programmes, consistent withthe institutions’ stated objectives. In the time available, the objective was not to conduct a full review of positions. Instead the intent was to provide comfort on the nature of the portfolios by assessing their sizeand shape and conducting non-statistical spot checks. Spot checks revealed no material differences.
Data Integrity and Verification
As inputs into the loan loss assessment exercise, the Central Bank also conducted a data integrity and
verification exercise to ensure robust outputs. BlackRock hired accountancy firms to support this work (seeAppendix B for details). The accountancy firms carried out four specific activities:
1. Loan file sampling and testing: the aim was to assess how accurate the data provided by the
banks was as compared to their source systems. If data was missing or inaccurate, BlackRockincorporated this into its view of overall data validity. The key findings are:
• There was no pattern in error or exception rates observed across banks and portfolios,consistent with expectations for financial institutions of these sizes.
• The data fields with errors or exceptions were not necessarily relevant for loan lossassessment.
• This work complemented the view on data quality formed by BlackRock during data gathering
for the loan loss assessment exercise.• The results provided BlackRock with a more detailed understanding of the strengths and
weaknesses of the data, and informed the asset quality review and loan loss assessment work
in certain cases. The impact of this work is reflected in the conservatism that BlackRockapplied in cases of poor quality or missing data.
2. Review of IT systems: this provided insight into how effectively and appropriately the banks' loan
systems were operating. The key findings are:• AIB systems are multiple and distributed, with programmes in place to address data quality
issues.
• BOI systems are fragmented, but have passed comprehensive internal and external testing.• EBS systems rest on a number of legacy IT systems, though these are stable.
• ILP systems are in line with other European banks.• In summary, no material issues surfaced.
3. Review of credit risk monitoring: the objective was to determine if the banks' internal credit riskmonitoring systems and processes – including internal credit rating systems and incomerecognition policies – are in line with expectations out lined by the Central Bank. As an output of
this exercise, the contracted accounting firms provided a high level review and summary of processes in place. The review did not uncover any material issues.
4. Data tape to balance sheet reconciliation: this exercise reconciled the gross loan balances from
data tapes provided by the banks against the gross loan balances contained in the banks’ financialstatements. The review found that data tapes for all banks reconciled to unaudited statutoryaccounts within <0.02% of notional value. The residual amounts were deemed negligible.
Asset Quality Review
As noted in the methodology and results section, BlackRock and its subcontractors conducted in-depthassessments of loan portfolios by reviewing and reunderwriting loan files and, in some cases, work-out
capacity. By examining and reviewing loan files, a more accurate assessment of the value of theunderlying collateral was possible, enabling a refinement of loan loss assessment assumptions. For
example, the banks’ existing risk assessment and rating of a given loan were benchmarked to ensure acalibration of internal ratings to an (external) assessor scale.
The loan file reviews focused on large loans and impaired assets. The number of files sampled varied
across portfolios and banks and was sufficiently large to allow BlackRock to elicit qualitative andquantitative findings that were subsequently incorporated into their loan loss assessments. In the case of
SME and corporate loans, BlackRock reassessed banks' gradings based on conclusions from re-underwritten loans.
Additionally, BlackRock led a legal assessment of collateral enforcement issues in Irish domestic lendingby the banks. This effort was carried out by two Ireland-based law firms. The work primarily consisted of

8/6/2019 The Financial Measures Programme Report
http://slidepdf.com/reader/full/the-financial-measures-programme-report 27/92
25Financial Measures Programme
gathering security-related information (including procedures and experiences) and legal documentation
from the banks and summarising findings on potential legal issues related to security enforcement,especially those that could inform the BlackRock loan loss assessments.
Among the many issues highlighted by the legal review were findings around undertakings, receiver rights,
form mortgages, and missing documents. BlackRock generally considers that the majority of the securityenforcement issues highlighted should not have any material adverse impact on their loan losses.However the impact of a minority of identified issues could not be assessed within the scope and timeframeof the review. BlackRock's conclusions are based on a number of factors, including the banks' past and
potential ability to remediate many of the enforceability issues.
Independent assessment of BlackRock forecasts
In line with the terms of the MOU, the Central Bank appointed The Boston Consulting Group (“BCG”), an
international consultancy firm, to provide an independent assessment on the work performed by BlackRockand its sub-contractors. The assessment covered all aspects of the BlackRock work including loan loss
assessments, data integrity and validation, and asset quality review. Based on its experience andexpertise, BCG assessed BlackRock's work along four dimensions:
• Scope and methodology: prior to Central Bank sign-off, BCG reviewed and challenged theproposed scope and methodology documents from BlackRock and its sub-contractors to ensureadequate data sources, rigorous analysis, and consistency of approach across banks and sub-
contractors.• People: BCG screened, met, conducted in-depth discussions with, and worked alongside all
principal individuals at BlackRock and each of the sub-contractors to assess their capabilities andexperience with respect to their appointed tasks.
• Processes: throughout the project BCG met with BlackRock and the sub-contractors regularly(weekly or daily, as appropriate) to determine the depth and rigour of analyses being performed,identify, track and escalate issues and concerns to the Central Bank, and suggest and monitor
appropriate remedies.• Results: as results emerged, BCG conducted in-depth evaluations of outcomes, assumptions,
inferences, and judgements to ensure delivery in line with agreed terms. While BCG did notperform full data or model audits, it did provide robust challenge to the methodologies,
approaches, and assumptions employed.
In addition, BlackRock hosted numerous sessions for the Central Bank and other government agencies,the External Partners, and the four banks to explain its methodologies, assumptions, and results. BCG
attended these sessions to ensure that any questions or concerns raised were appropriately addressed.
Following this detailed assessment BCG believes that the approaches taken by BlackRock weresatisfactory, and that the results are appropriately conservative, in line with BlackRock's terms of reference.
The assessor report is found in Appendix G.
Deriving three-year projected losses from BlackRock figures
BlackRock has forecast crystallised loan losses for the entire life of the loan portfolios as at December
2010. These losses are defined as principal losses including enforcement costs at the time of liquidation,insolvency, or balance sheet write-down. In contrast, accounting rules require that banks recognise theentire anticipated loss associated with an impaired loan in the accounting period in which the loan becomes
impaired. Consequently the conversion of loan loss assessments to three-year projected losses isnecessary to enable the inclusion of BlackRock outputs in PCAR. Moreover, since BlackRock loan losses
are based on loan portfolios as at December 2010, they do not reflect asset disposals in banks’deleveraging plans (see Section 3.4).
In order to calculate the capital impact of the lifetime loan losses applicable to the 2011 PCAR stress test,
the Central Bank must apply two adjustments to BlackRock loan losses:1. Isolation of losses attributable to deleveraged exposures: Remove losses associated with
portfolios that are scheduled for disposal between 2011 and 2013.2. Converting relevant lifetime losses into three-year projected losses: Convert the relevant portion of
lifetime losses associated with loans becoming impaired between 2011 and 2013 into three-year
projected losses.

8/6/2019 The Financial Measures Programme Report
http://slidepdf.com/reader/full/the-financial-measures-programme-report 28/92
26 Financial Measures Programme
The remainder of this section describes the Centra l Bank’s methodology for these two adjustments.
It should be noted that the accounting standard for loan provisioning will change from the current incurredloss model (IAS 39) to an expected loss model, under which provisions will be required for those lossesthat are expected to arise over the life of a portfolio. This change is currently included in an exposure draft,
and when finalised will be included in IFRS 9. The current best estimate of the implementation date for IFRS 9 is from 1 January 2013.
Adjustment 1: Isolation of losses attributable to deleveraged exposures
The first required adjustment to BlackRock lifetime loan losses is to remove those losses associated withloans identified for disposal in 2011-2013. The Central Bank stripped out these losses for each year inproportion to disposed RWAs as provided from the banks' deleveraging plans. Where portfolio definitions
did not match exactly, the characteristics of the closest match were applied. Losses associated withdisposal portfolios for periods before the disposal is expected to take place remain in the analysis. It is
worth noting that the BlackRock lifetime loan loss figures in Table 8 and Table 9 reflect the impact of deleveraging.
Adjustment 2: Converting relevant lifetime losses into three-year projected losses
In order to assess the impact of BlackRock loan losses on the future capital adequacy of each bank, theCentral Bank converted a portion of the lifetime crystallised losses into three-year which the banks wouldbe required to hold during the PCAR period (2011 to 2013).
The BlackRock loan loss methodologies vary across portfolios and, as a consequence, the three-year projected loss calculation also varies to account for different timing assumptions. The remainder of thissection outlines the methodology for each of the following groups of portfolios:
• Residential mortgages.• Non-mortgage consumer and other, corporate, and SME.
• CRE.
It is worth noting that in order to ensure consistency across banks and portfolios, the Central Bank hasdefined the trigger point for a loan to be considered impaired as “payment over 90 days past due”.
Residential mortgages
BlackRock has modelled future losses by forecasting a monthly stock of over 90 days past due loans,which is consistent with the impairment definition above. This approach does not separately estimate the
loans moving into impairment and those moving out of impairment; rather it considers them both as a singlestock. This introduces the challenge of separately identifying the flow of new impairments in a given periodand their associated losses. As a result, the Central Bank produced a cumulative three-year projectedlosses based on impairments arising by December 2013 rather than annual loss figures. The Central Bank
projected losses were calculated using parameters and model runs provided by BlackRock.
The cumulative three-year projected loss estimates were produced by calculating the sum of:• Losses that crystallise between 2011 and 2013.
• Lifetime crystallised losses associated with loans in repossession at the end of 2013.•
Expected future losses for the stock of impair ed balances not in repossession at the end of 2013.
Once all three components were calculated and aggregated, the Central Bank then allocated the resultantaggregate three-year losses to individual banks and sub-portfolios (owner-occupied and buy-to-let) in
proportion to the total lifetime crystallised losses.
Commercial real estate
For commercial real estate, BlackRock modelled def aults and the associated losses with an assumed one-year liquidation period. As a result it was necessary to associate default events occurring in a given
financial period with the resultant losses crystallised one year from now in order to determine the CentralBank loss estimate in the given period (in other words, 2011 Central Bank losses are equal to the sum of crystallised losses in 2012).
8/6/2019 The Financial Measures Programme Report
http://slidepdf.com/reader/full/the-financial-measures-programme-report 29/92
27Financial Measures Programme
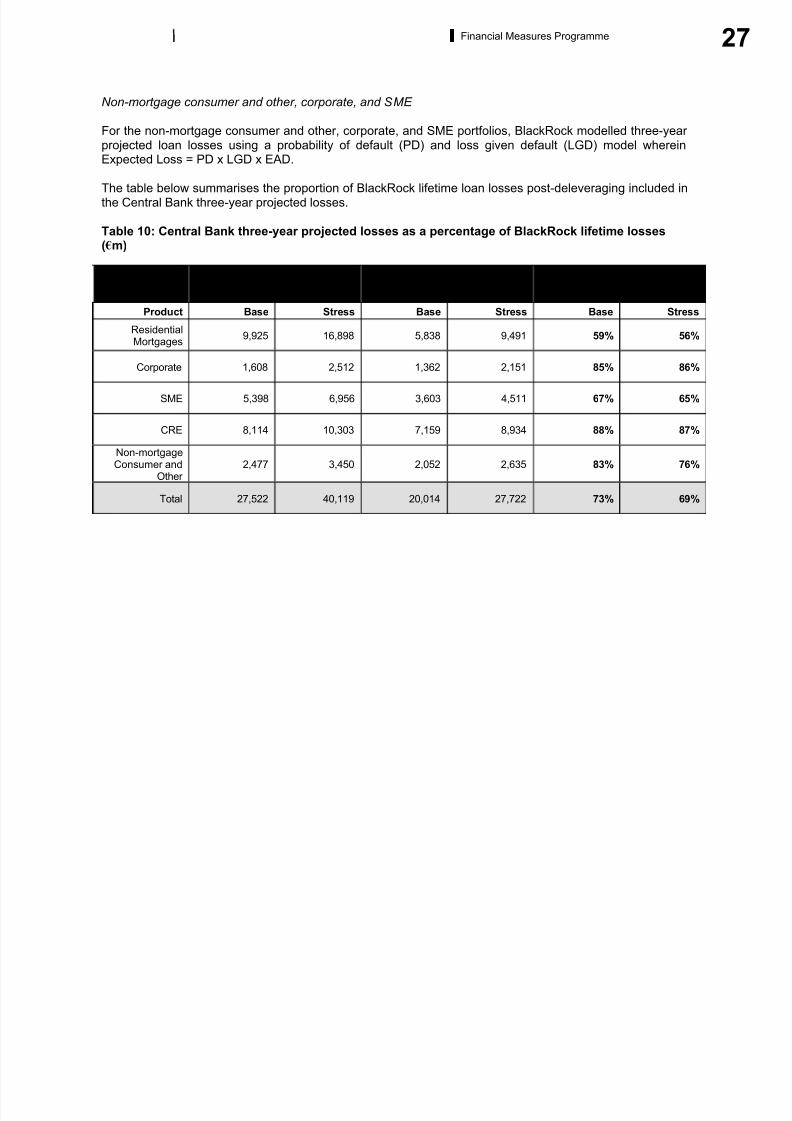
Non-mortgage consumer and other, corporate, and SME
For the non-mortgage consumer and other, corporate, and SME portfolios, BlackRock modelled three-year projected loan losses using a probability of default (PD) and loss given default (LGD) model whereinExpected Loss = PD x LGD x EAD.
The table below summarises the proportion of BlackRock lifetime loan losses post-deleveraging included inthe Central Bank three-year projected losses.
Table 10: Central Bank three-year projected losses as a percentage of BlackRock lifetime losses( m)
BlackRock lifetime loan lossespost-deleveraging
Central Bank three-year projectedlosses
CB three-year projected losses /BlackRock lifetime loan losses
post-deleveraging (%)
Product Base Stress Base Stress Base Stress
ResidentialMortgages
9,925 16,898 5,838 9,491 59% 56%
Corporate 1,608 2,512 1,362 2,151 85% 86%
SME 5,398 6,956 3,603 4,511 67% 65%
CRE 8,114 10,303 7,159 8,934 88% 87%
Non-mortgageConsumer and
Other 2,477 3,450 2,052 2,635 83% 76%
Total 27,522 40,119 20,014 27,722 73% 69%
8/6/2019 The Financial Measures Programme Report
http://slidepdf.com/reader/full/the-financial-measures-programme-report 30/92
28 Financial Measures Programme
3.2 Prudential Capital Assessment Review (PCAR)
Overview
The Prudential Capital Assessment Review (PCAR) is the Central Bank’s annual stress test of the capital
resources of the Irish banks to withstand a prescribed adverse (“unlikely/extreme but plausible”)macroeconomic scenario of three-year duration. This macroeconomic scenario is consistent with that
applied in the 2011 EBA EU-wide stress test and was developed in conjunction with the ECB to ensureappropriate conservatism. Certain aspects of the PCAR stress test go beyond the constraints appliedwithin the EBA stress tests.
To calculate the appropriate capital requirement, the Central Bank required participating banks, AIB, BOI,EBS and ILP, to prepare estimates of key financial information under the stress scenario. As with the EBAEU-wide stress test, this essentially required institutions to translate the severe macroeconomic scenariointo financial forecasts. Based on this information, the Central Bank calculated whether a bank had
adequate capital to maintain a minimum level of capital if the stress scenario were to materialise.
In order to ensure that capital requirements reflect the full financial picture for each bank, the PCARrequired each bank to submit standard information on the following dynamic components:
• The capital impact of planned deleveraging, as described in the Section 3.4 below;
• Future funding and liquidity needs, reflecting the requirements of the PLAR exercise described inSection 3.3 below;
• Loan impairment provisions;• Operating income projections; and
• Additional stresses on available for sale (AFS) and trading portfolios.
This information was reviewed through a rigorous, iterative process with the Central Bank, included twoformal submissions and regular contact between the Central Bank and the institutions participating in the
PCAR. Additionally, as described in previous sections, the Central Bank engaged external consultants,
BlackRock Solutions, to complete an independent loan loss estimation exercise to supplement the loanloss provisions provided directly by participating banks. The Central Bank has used these results as thedeterminative loan loss forecast in the 2011 PCAR: loan impairment provisions derived from the BlackRockwork have been substituted for those supplied by the banks as part of PCAR and all relevant capital
metrics have been updated. This decision is intended to ensure that the forecasts are conservative andcredible.
It is important to point out that the PCAR results are not a forecast of what will happen. Rather they are anattempt to estimate the effects of a severe but plausible, macroeconomic scenario, and consequently tosize a capital injection that would enable a bank to stay above the minimum level of solvency even in the
event that such a scenario arose.
As described in Figure 1, below, the PCAR methodology consisted of three major components:1. Inputs, which consisted of a comprehensive set of PCAR instructions including deleveraging
targets, funding and asset constraints, and macroeconomic scenarios.2. Supervisory challenge, consisting of additional specific guidance on deleveraging plans, income
and expense forecasts, and capital restructuring.3. Results, which summarise the forecasted capital requirements, available capital resources, and
resulting capital excess or deficiency.
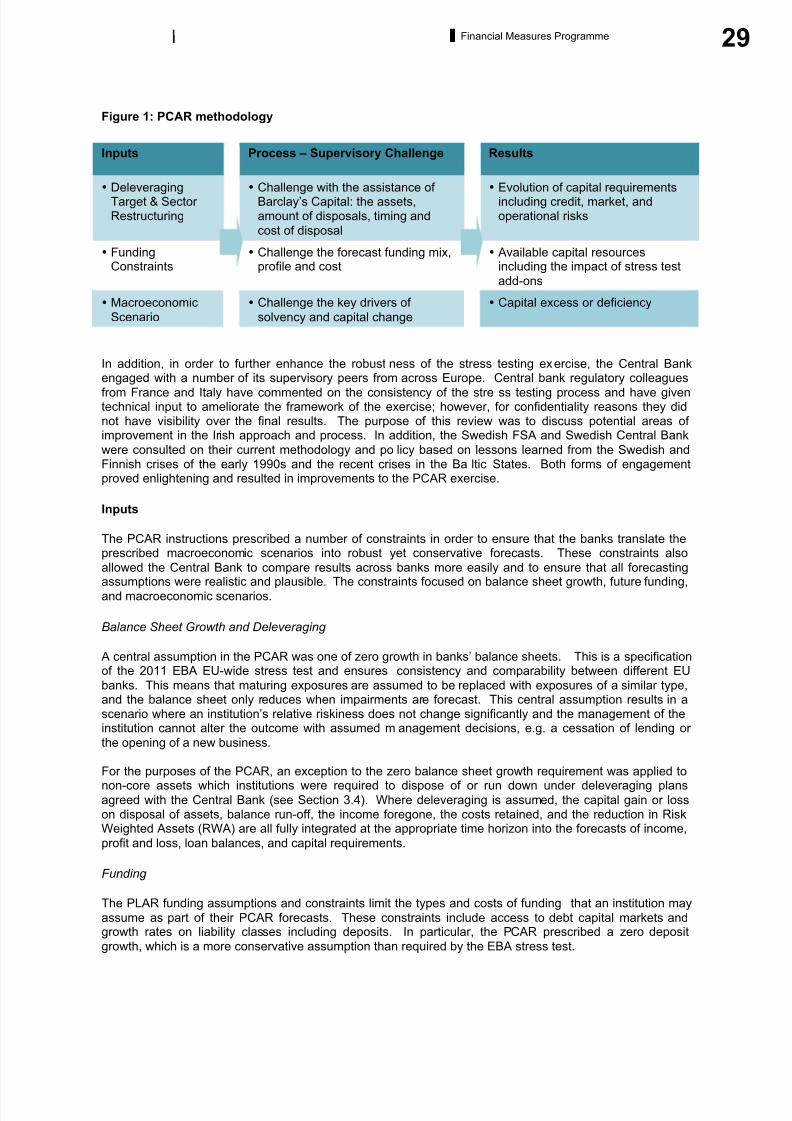
8/6/2019 The Financial Measures Programme Report
http://slidepdf.com/reader/full/the-financial-measures-programme-report 31/92
29Financial Measures Programme
Figure 1: PCAR methodology
Inputs Process – Supervisory Challenge Results
• DeleveragingTarget & Sector Restructuring
• Challenge with the assistance of Barclay’s Capital: the assets,amount of disposals, timing and
cost of disposal
• Evolution of capital requirementsincluding credit, market, andoperational risks
• FundingConstraints
• Challenge the forecast funding mix,profile and cost
• Available capital resourcesincluding the impact of stress test
add-ons
• Macroeconomic
Scenario• Challenge the key drivers of
solvency and capital change• Capital excess or deficiency
In addition, in order to further enhance the robustness of the stress testing exercise, the Central Bankengaged with a number of its supervisory peers from across Europe. Central bank regulatory colleagues
from France and Italy have commented on the consistency of the stress testing process and have giventechnical input to ameliorate the framework of the exercise; however, for confidentiality reasons they didnot have visibility over the final results. The purpose of this review was to discuss potential areas of improvement in the Irish approach and process. In addition, the Swedish FSA and Swedish Central Bank
were consulted on their current methodology and policy based on lessons learned from the Swedish andFinnish crises of the early 1990s and the recent crises in the Baltic States. Both forms of engagementproved enlightening and resulted in improvements to the PCAR exercise.
Inputs
The PCAR instructions prescribed a number of constraints in order to ensure that the banks translate theprescribed macroeconomic scenarios into robust yet conservative forecasts. These constraints also
allowed the Central Bank to compare results across banks more easily and to ensure that all forecasting
assumptions were realistic and plausible. The constraints focused on balance sheet growth, future funding,and macroeconomic scenarios.
Balance Sheet Growth and Deleveraging
A central assumption in the PCAR was one of zero growth in banks’ balance sheets. This is a specificationof the 2011 EBA EU-wide stress test and ensures consistency and comparability between different EU
banks. This means that maturing exposures are assumed to be replaced with exposures of a similar type,and the balance sheet only reduces when impairments are forecast. This central assumption results in ascenario where an institution’s relative riskiness does not change significantly and the management of theinstitution cannot alter the outcome with assumed management decisions, e.g. a cessation of lending or
the opening of a new business.
For the purposes of the PCAR, an exception to the zero balance sheet growth requirement was applied tonon-core assets which institutions were required to dispose of or run down under deleveraging plans
agreed with the Central Bank (see Section 3.4). Where deleveraging is assumed, the capital gain or losson disposal of assets, balance run-off, the income foregone, the costs retained, and the reduction in RiskWeighted Assets (RWA) are all fully integrated at the appropriate time horizon into the forecasts of income,
profit and loss, loan balances, and capital requirements.
Funding
The PLAR funding assumptions and constraints limit the types and costs of funding that an institution may
assume as part of their PCAR forecasts. These constraints include access to debt capital markets andgrowth rates on liability classes including deposits. In particular, the PCAR prescribed a zero deposit
growth, which is a more conservative assumption than required by the EBA stress test.
8/6/2019 The Financial Measures Programme Report
http://slidepdf.com/reader/full/the-financial-measures-programme-report 32/92
30 Financial Measures Programme
Macroeconomic scenarios
The Central Bank developed an adverse (“unlikely but plausible") macroeconomic scenario in conjunction
with the ECB. This scenario was designed to be consistent with Europe-wide EBA stress and includesfactors capturing the following macroeconomic areas:
•Economic growth;
• Employment;
• Government expenditure;• Personal expenditure;
• Residential and commercial property prices; and• Interest rates and inflation.
Supervisory challenge
The 2011 PCAR comprised two iterations of bank submissions separated by a thorough review andchallenge by the Central Bank. After review of the first submission the Central Bank provided additionalguidance to each institution on the parameters and assumptions to be used in the second submission. In
addition, the Central Bank conducted a final review of the banks’ second submission to ensure theaccuracy and consistency of information provided and imposed regulatory adjustments as required. In
addition to these mandated reviews, the Central Bank maintained regular interaction with all banks toensure that the PCAR process was robust and fully understood.
In reviewing PCAR submissions, the Central Bank assessed all components of banks’ profit and lossaccounts to make sure that capital calculations are grounded in sound assumptions. Where it was deemed
necessary, regulatory adjustments were applied to ensure the robustness of the final assumptions. Themajor areas of review included:
• Interest income;• Interest expense;
• Other income;• Administrative and other operating expenses; and
• Loan impairment provisions.
Interest income
The forecast income profile of the Irish banking sector is dominated by net interest income. For theparticipating institutions, interest income predominantly derives from the loan portfolio. As a result, the
PCAR, while cognisant of all interest income sources, focuses significantly on the loan portfolio interestincome.
As part of their PCAR 2011 submission, institutions were required to provide detailed forecast interest
income information on their average interest earning balances by year and by portf olio. For example, thebanks provided the average interest income forecast for Irish owner-occupied residential mortgages for
2011, 2012 and 2013. This allowed the Central Bank to examine and challenge the institutions on their forecast margins and also to require amendments where these margin forecasts seemed overly optimistic,
unrealistic or inconsistent with the macroeconomic scenario. Finally, the Central Bank developed a datasetfor each institution which included analyst forecasts, historic data and peer group averages. Comparison
with these datasets allowed the Central Bank to further ‘sense-check’ the final results.
Interest expense
Interest expense is a major cost category for Irish banks, and thus a major driver of their 2011-2013
profitability. The PCAR specified a set of constraints and parameters for funding cost and access to funds,which were consistent with those applied in the PLAR.
In the stress case, banks were instructed to calculate their cost of funds on the basis of the swap curves at
31 December 2010, and the funding spreads that applied at that date. An additional funding cost spread of 100bps for ECB borrowing and 125bps for other funding categories was also specified and Banks’
assumed access to funding markets was restricted. Banks were not permitted to assume any newwholesale issuance or roll over in the period to end-2013. A maximum annual growth in deposits of 0% was
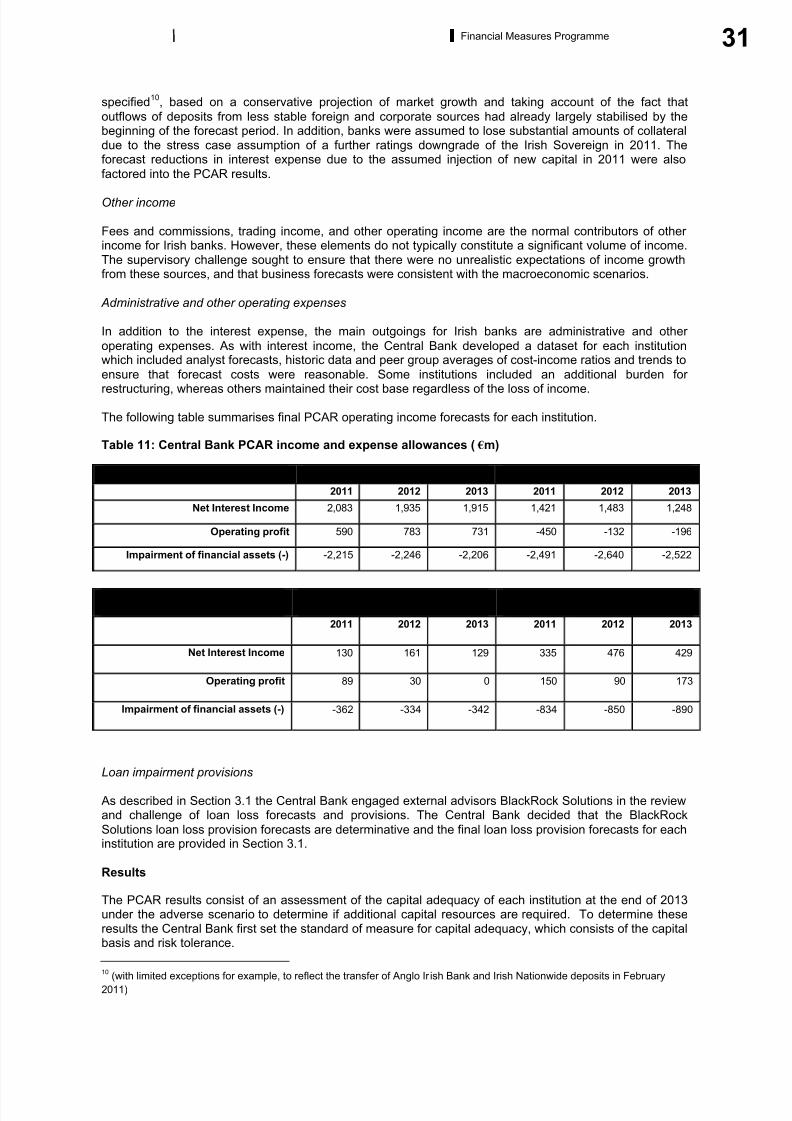
8/6/2019 The Financial Measures Programme Report
http://slidepdf.com/reader/full/the-financial-measures-programme-report 33/92
31Financial Measures Programme
specified10
, based on a conservative projection of market growth and taking account of the fact that
outflows of deposits from less stable foreign and corporate sources had already largely stabilised by thebeginning of the forecast period. In addition, banks were assumed to lose substantial amounts of collateraldue to the stress case assumption of a further ratings downgrade of the Irish Sovereign in 2011. Theforecast reductions in interest expense due to the assumed injection of new capital in 2011 were also
factored into the PCAR results.
Other income
Fees and commissions, trading income, and other operating income are the normal contributors of other income for Irish banks. However, these elements do not typically constitute a significant volume of income.The supervisory challenge sought to ensure that there were no unrealistic expectations of income growthfrom these sources, and that business forecasts were consistent with the macroeconomic scenarios.
Administrative and other operating expenses
In addition to the interest expense, the main outgoings for Irish banks are administrative and other
operating expenses. As with interest income, the Central Bank developed a dataset for each institutionwhich included analyst forecasts, historic data and peer group averages of cost-income ratios and trends to
ensure that forecast costs were reasonable. Some institutions included an additional burden for
restructuring, whereas others maintained their cost base regardless of the loss of income.
The following table summarises final PCAR operating income forecasts for each institution.
Table 11: Central Bank PCAR income and expense allowances ( m)
BOI AIB
2011 2012 2013 2011 2012 2013
Net Interest Income 2,083 1,935 1,915 1,421 1,483 1,248
Operating profit 590 783 731 -450 -132 -196
Impairment of financial assets (-) -2,215 -2,246 -2,206 -2,491 -2,640 -2,522
EBS ILP
2011 2012 2013 2011 2012 2013
Net Interest Income 130 161 129 335 476 429
Operating profit 89 30 0 150 90 173
Impairment of financial assets (-) -362 -334 -342 -834 -850 -890
Loan impairment provisions
As described in Section 3.1 the Central Bank engaged external advisors BlackRock Solutions in the reviewand challenge of loan loss forecasts and provisions. The Central Bank decided that the BlackRock
Solutions loan loss provision forecasts are determinative and the final loan loss provision forecasts for eachinstitution are provided in Section 3.1.
Results
The PCAR results consist of an assessment of the capital adequacy of each institution at the end of 2013under the adverse scenario to determine if additional capital resources are required. To determine theseresults the Central Bank first set the standard of measure for capital adequacy, which consists of the capitalbasis and risk tolerance.
10 (with limited exceptions for example, to reflect the transfer of Anglo Ir ish Bank and Irish Nationwide deposits in February2011)

8/6/2019 The Financial Measures Programme Report
http://slidepdf.com/reader/full/the-financial-measures-programme-report 34/92
32 Financial Measures Programme
On this basis the central bank assessed the institution’s forecast future capital requirements and comparedthem to available capital resources. In addition to the profitability forecasts discussed above, the PCARalso included additional stresses on available-for-sale (AFS), securitisations, and trading book assets.These additional stresses increase conservatism.
Based on these forecasts the Central Bank assessed that the Irish bank system requires an additional 24.0bn of capital, which will consist of a combination of equity ( 21bn) and contingent capital ( 3bn).
Standard of measure
The standard of measure for capital adequacy consists of:• Capital basis, which set the definition of required and available capital, and
• Risk tolerance, which sets the minimum required level of capital.
Capital basis
As supervisory authorities and central banks have used stress tests to determine banks’ capital needs, it is
important to set out the basis for that capital decision in PCAR. Capital basis refers to the set of rules or regulations by which capital adequacy is assessed. In the EU the current set of rules is the Capital
Requirements Directive.
The Central Bank applied capital requirement rules and a definition of Core Tier 1 capital as prescribed bythe Capital Requirements Directive, which is the prevailing regulatory standard in the EU. To increaseconservatism the Central Bank has included all supervisory deductions, including 50:50 deductions
11.
In addition, a new capital standard, commonly known as Basel III, has been established by BaselCommittee of Banking Supervisors (BCBS). This new capital standard has a scheduled implementationthat will commence with a transitional phase on January 1
st, 2013 and come into full effect in 2019. While
Basel III has not been used as the capital basis for PCAR 2011, the Central Bank did ensure that all
institutions would comply with the proposed scheduled implementation under both the base and stressscenarios.
Risk tolerance
Risk tolerance describes the minimum level of capital acceptable to the Central Bank after the severescenario has materialised. The level of risk tolerance determines the amounts of capital that a bank must
hold to absorb future losses and remain solvent/a going concern.
The Central Bank has applied a 6% Core Tier 1 under stress in PCAR 2011. As with the decision inrespect of loan loss forecasts to be applied, this dec ision is also intended to ensure conservatism in theforecasts, and is taken in light of the prevailing market confidence in the Irish banking system. By way of comparison, the Central Bank’s required level of minimum capital has increased from 4% Core Tier 1 in the
stress case and 8% in the base case in PCAR 2010. In addition, the Central Bank also set a base caserisk tolerance of 10.5%.
Set out in the box below is the current position with respect to risk tolerance, vis-à-vis current and future
capital ratios, regimes, and requirements.
11 50:50 deductions are supervisory deduction for which 50% are removed from tier 1 capital and 50% are removed from tier 2capital
8/6/2019 The Financial Measures Programme Report
http://slidepdf.com/reader/full/the-financial-measures-programme-report 35/92
33Financial Measures Programme
Box 2 – Developments in Capital Requirements
Current Position The current minimum capital requirements for all Credit Institutions, as per the Capital
Requirements Directive
12
(CRD), are 4% Tier 1 and 8% Total Solvency. These have applied since March2010.
PCAR 2010 On 30 March and 10 September 2010, the Central Bank announced details of the PCAR for AIB, BOI, ILP and EBS
13, which included setting new target capital requirements of 8% Core Tier 1
14, of
which 7% must be Equity Core Tier 1, under the base case and 4% Core Tier 1 under the stress case after taking account of expected losses.
New Ongoing Minimum Capital Requirements Covered Institutions subject to PCAR 2011 are required
to maintain a new ongoing capital adequacy equivalent to 10.5% Core Tier 1 during standard operation.
Basel III On 12 September 2010, the Basel Committee on Banking Supervision (BCBS) announced detailsof its proposed capital framework, commonly called Basel III. The new minimums are 7% (4.5% plus 2.5%conservation buffer) Common Equity Tier 1 (CET1), 8.5% (6% plus 2.5%) Tier 1 and 10.5% (8% plus 2.5%)
Total Capital. In addition, the BCBS has mandated a countercyclical buffer of between 0% and 2.5% of CET1, which will result in an ongoing minimum of up to 9.5% CET1 following full implementation of Basel IIIstandards in 2019.
Capital Requirements and Risk Weighted Assets (RWA)
Risk weighted assets drive minimum level of capital that must be held against an institutions' credit, market,
operational, and other (Pillar 2) risks. Here, the presentation is after translation to capital requirements
(capital requirements = 8% of RWA) to be consistent with the CRD. The following table summarises each
institutions' capital requirements over the stress test horizon for each major risk type, including:
• Credit risk;
• Market risk;
• Operational risk; and
• Other risks specific to the stress test.
12Directives 2006/48 & 49 (as amended), together known as the CRD
13Covered Institutions subject to PCAR 2010
14Core Tier 1 as per CRD and the Central Bank’s ‘Alternative Capital Instruments’ Regulatory Notice
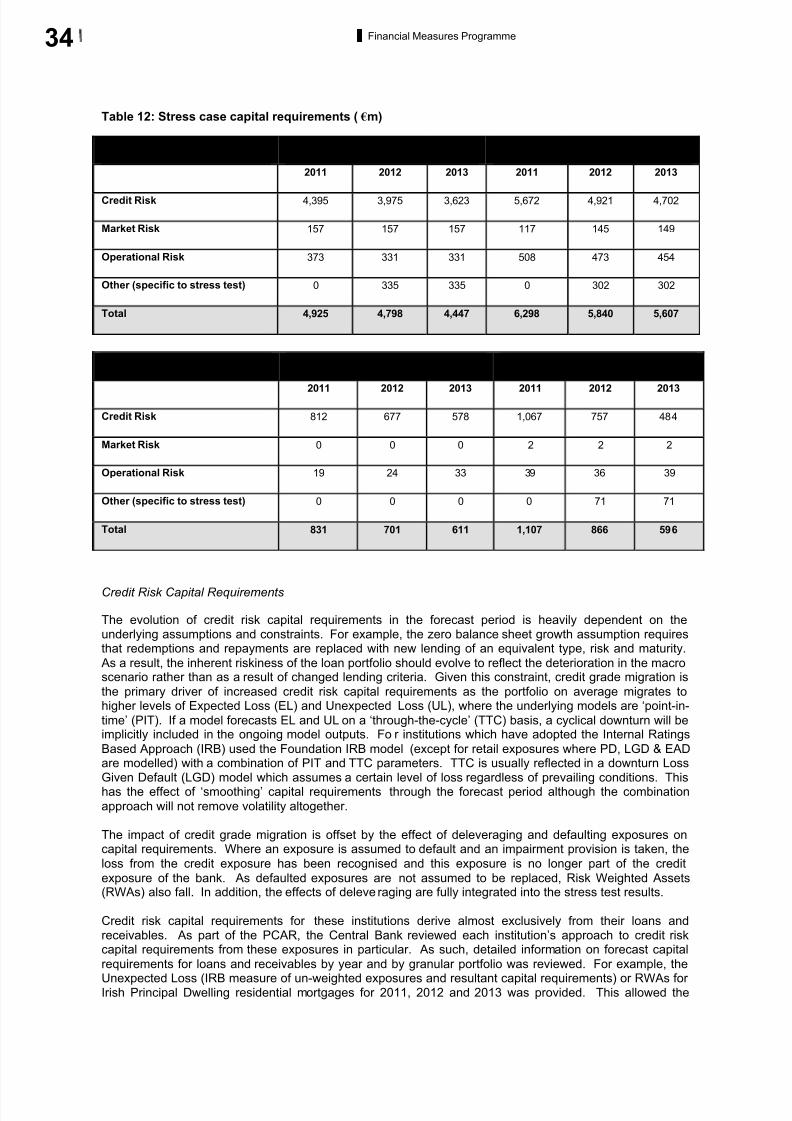
8/6/2019 The Financial Measures Programme Report
http://slidepdf.com/reader/full/the-financial-measures-programme-report 36/92
34 Financial Measures Programme
Table 12: Stress case capital requirements ( m)
BOI AIB
2011 2012 2013 2011 2012 2013
Credit Risk 4,395 3,975 3,623 5,672 4,921 4,702
Market Risk 157 157 157 117 145 149
Operational Risk 373 331 331 508 473 454
Other (specific to stress test) 0 335 335 0 302 302
Total 4,925 4,798 4,447 6,298 5,840 5,607
EBS ILP
2011 2012 2013 2011 2012 2013
Credit Risk 812 677 578 1,067 757 484
Market Risk 0 0 0 2 2 2
Operational Risk 19 24 33 39 36 39
Other (specific to stress test) 0 0 0 0 71 71
Total 831 701 611 1,107 866 596
Credit Risk Capital Requirements
The evolution of credit risk capital requirements in the forecast period is heavily dependent on theunderlying assumptions and constraints. For example, the zero balance sheet growth assumption requiresthat redemptions and repayments are replaced with new lending of an equivalent type, risk and maturity.
As a result, the inherent riskiness of the loan portfolio should evolve to reflect the deterioration in the macroscenario rather than as a result of changed lending criteria. Given this constraint, credit grade migration is
the primary driver of increased credit risk capital requirements as the portfolio on average migrates tohigher levels of Expected Loss (EL) and Unexpected Loss (UL), where the underlying models are ‘point-in-
time’ (PIT). If a model forecasts EL and UL on a ‘through-the-cycle’ (TTC) basis, a cyclical downturn will beimplicitly included in the ongoing model outputs. For institutions which have adopted the Internal Ratings
Based Approach (IRB) used the Foundation IRB model (except for retail exposures where PD, LGD & EADare modelled) with a combination of PIT and TTC parameters. TTC is usually reflected in a downturn Loss
Given Default (LGD) model which assumes a certain level of loss regardless of prevailing conditions. Thishas the effect of ‘smoothing’ capital requirements through the forecast period although the combination
approach will not remove volatility altogether.
The impact of credit grade migration is offset by the effect of deleveraging and defaulting exposures oncapital requirements. Where an exposure is assumed to default and an impairment provision is taken, the
loss from the credit exposure has been recognised and this exposure is no longer part of the credit
exposure of the bank. As defaulted exposures are not assumed to be replaced, Risk Weighted Assets(RWAs) also fall. In addition, the effects of deleveraging are fully integrated into the stress test results.
Credit risk capital requirements for these institutions derive almost exclusively from their loans andreceivables. As part of the PCAR, the Central Bank reviewed each institution’s approach to credit riskcapital requirements from these exposures in particular. As such, detailed information on forecast capital
requirements for loans and receivables by year and by granular portfolio was reviewed. For example, the
Unexpected Loss (IRB measure of un-weighted exposures and resultant capital requirements) or RWAs for Irish Principal Dwelling residential mortgages for 2011, 2012 and 2013 was provided. This allowed the
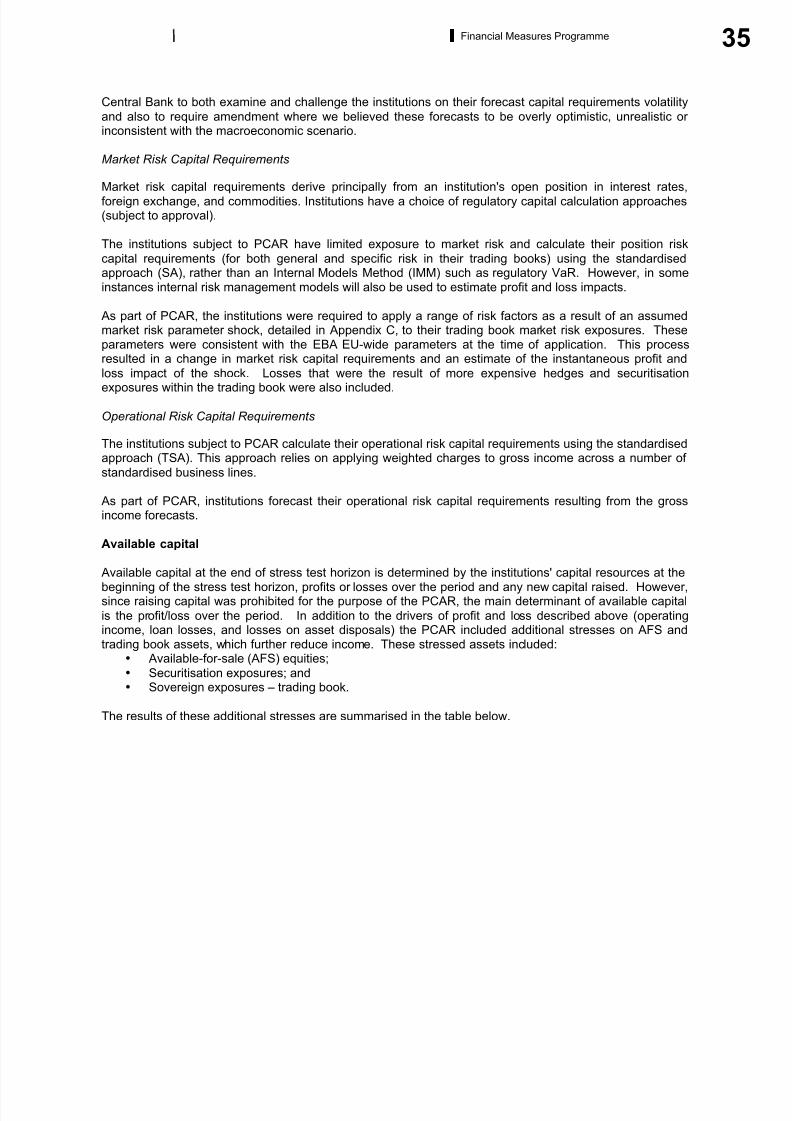
8/6/2019 The Financial Measures Programme Report
http://slidepdf.com/reader/full/the-financial-measures-programme-report 37/92
35Financial Measures Programme
Central Bank to both examine and challenge the institutions on their forecast capital requirements volatility
and also to require amendment where we believed these forecasts to be overly optimistic, unrealistic or inconsistent with the macroeconomic scenario.
Market Risk Capital Requirements
Market risk capital requirements derive principally from an institution's open position in interest rates,
foreign exchange, and commodities. Institutions have a choice of regulatory capital calculation approaches(subject to approval).
The institutions subject to PCAR have limited exposure to market risk and calculate their position risk
capital requirements (for both general and specific risk in their trading books) using the standardisedapproach (SA), rather than an Internal Models Method (IMM) such as regulatory VaR. However, in someinstances internal risk management models will also be used to estimate profit and loss impacts.
As part of PCAR, the institutions were required to apply a range of risk factors as a result of an assumedmarket risk parameter shock, detailed in Appendix C, to their trading book market risk exposures. Theseparameters were consistent with the EBA EU-wide parameters at the time of application. This processresulted in a change in market risk capital requirements and an estimate of the instantaneous profit and
loss impact of the shock. Losses that were the result of more expensive hedges and securitisation
exposures within the trading book were also included.
Operational Risk Capital Requirements
The institutions subject to PCAR calculate their operational risk capital requirements using the standardisedapproach (TSA). This approach relies on applying weighted charges to gross income across a number of
standardised business lines.
As part of PCAR, institutions forecast their operational risk capital requirements resulting from the grossincome forecasts.
Available capital
Available capital at the end of stress test horizon is determined by the institutions' capital resources at the
beginning of the stress test horizon, profits or losses over the period and any new capital raised. However,since raising capital was prohibited for the purpose of the PCAR, the main determinant of available capital
is the profit/loss over the period. In addition to the drivers of profit and loss described above (operatingincome, loan losses, and losses on asset disposals) the PCAR included additional stresses on AFS andtrading book assets, which further reduce income. These stressed assets included:
• Available-for-sale (AFS) equities;
• Securitisation exposures; and • Sovereign exposures – trading book.
The results of these additional stresses are summarised in the table below.

8/6/2019 The Financial Measures Programme Report
http://slidepdf.com/reader/full/the-financial-measures-programme-report 38/92
36 Financial Measures Programme
Table 13: Additional stresses impacting income and capital requirements ( m)
BOI AIB
2011 2012 2011 2012
Trading Book- Market Risk -11 n/a -10 n/a
Available for Sale – Equities -10 -8 -37 -30
Securitisation Exposures 0 -32 0 -61
Sovereign Exposures – Trading Book 0 0 0 0
Total -20 -40 -47 -91
Available For Sale (AFS): Equities
A profit and loss impact consistent with the haircuts in the EBA EU-wide stress test was applied to the
institutions' AFS Equity holdings.
Securitisation exposures
The PCAR applied a risk weighting grade migration matrix to those securitised exposures held in the
banking book (traditional and synthetic, as well as liquidity lines on securitisation transactions) for which
there is significant risk transfer, i.e. the underlying exposures are not already captured by some other risk
measurement mechanism such as the credit risk capital requirement. The definition of exposure value is
the one provided in the CRD and these exposures were split into two categories: Medium Risk and High
Risk. All of the following assets classes were included in the High Risk category: EMEA CMBS, US RMBS,
EMEA CDO and US CDO, as well as all re-securitisations. All other asset classes were included in theMedium Risk category and a less severe risk weighting grade migration matrix was applied. The
application of the matrix essentially results in a multi-notch downgrade in credit quality.
Sovereign Exposures: Trading Book
As part of the PCAR, Sovereign exposures included exposures held both within the Trading Book and
within the Banking Book. Sovereign exposures include inter alia: holdings of central government bonds,
holdings of government t-bills or commercial paper, loans to central government, loans or debt issued by
non-central government (in other words, local authorities), NAMA bonds, and holdings of promissory notes
issued by government. A profit and loss impact consistent with the haircuts in the EBA EU-wide stress tests
were applied to the institutions' sovereign exposures held in the trading book. Details of the institutions'
sovereign exposures by trading book and banking book, and the portion of which is held as AFS are
provided in Appendix E.
Pre-injection available capital
Under the severe macroeconomic conditions and conservative forecasting assumptions of the stress
scenario all institutions are forecasted to fully deplete their capital resources by 2013. The table below
contains the evolution of available capital for each institution over the stress test horizon.
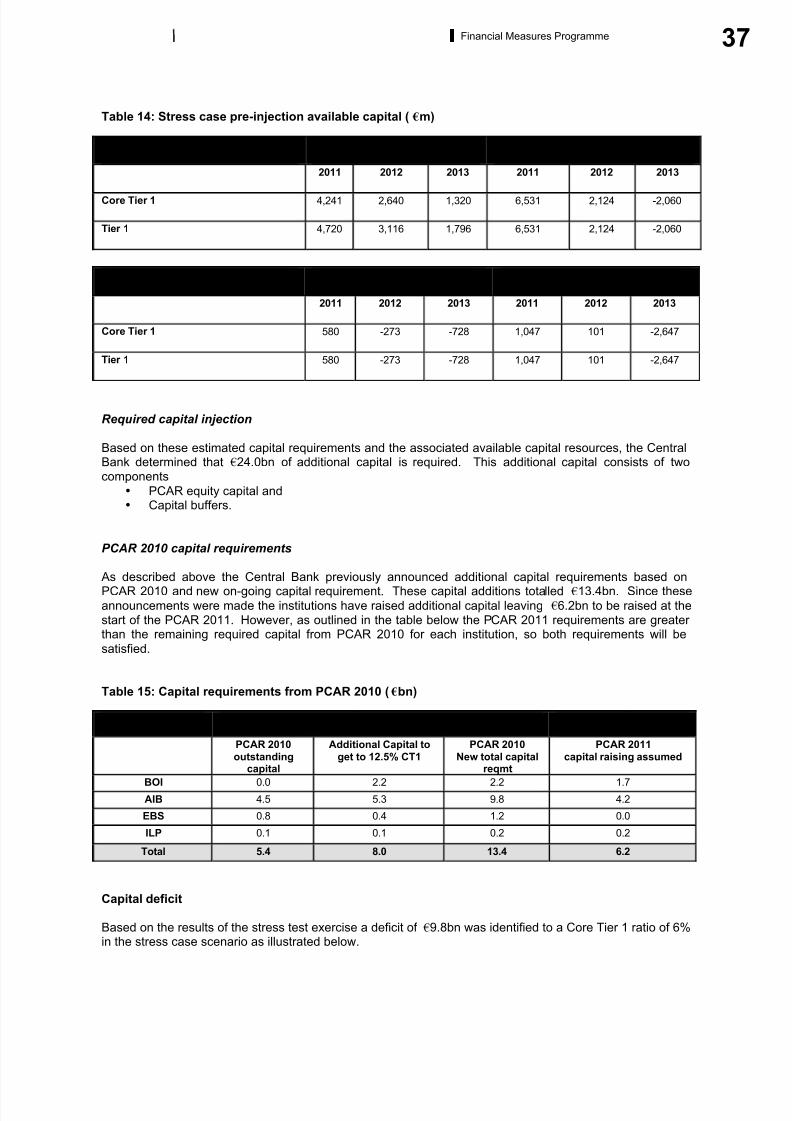
8/6/2019 The Financial Measures Programme Report
http://slidepdf.com/reader/full/the-financial-measures-programme-report 39/92
37Financial Measures Programme
Table 14: Stress case pre-injection available capital ( m)
BOI AIB
2011 2012 2013 2011 2012 2013
Core Tier 1 4,241 2,640 1,320 6,531 2,124 -2,060
Tier 1 4,720 3,116 1,796 6,531 2,124 -2,060
EBS ILP
2011 2012 2013 2011 2012 2013
Core Tier 1 580 -273 -728 1,047 101 -2,647
Tier 1 580 -273 -728 1,047 101 -2,647
Required capital injection
Based on these estimated capital requirements and the associated available capital resources, the CentralBank determined that 24.0bn of additional capital is required. This additional capital consists of twocomponents
• PCAR equity capital and• Capital buffers.
PCAR 2010 capital requirements
As described above the Central Bank previously announced additional capital requirements based onPCAR 2010 and new on-going capital requirement. These capital additions totalled 13.4bn. Since these
announcements were made the institutions have raised additional capital leaving 6.2bn to be raised at thestart of the PCAR 2011. However, as outlined in the table below the PCAR 2011 requirements are greater than the remaining required capital from PCAR 2010 for each institution, so both requirements will be
satisfied.
Table 15: Capital requirements from PCAR 2010 ( bn)
As of 28 November 2010 As of 31 March 2011
PCAR 2010outstanding
capital
Additional Capital toget to 12.5% CT1
PCAR 2010New total capital
reqmt
PCAR 2011capital raising assumed
BOI 0.0 2.2 2.2 1.7
AIB 4.5 5.3 9.8 4.2
EBS 0.8 0.4 1.2 0.0
ILP 0.1 0.1 0.2 0.2
Total 5.4 8.0 13.4 6.2
Capital deficit
Based on the results of the stress test exercise a deficit of 9.8bn was identified to a Core Tier 1 ratio of 6%in the stress case scenario as illustrated below.
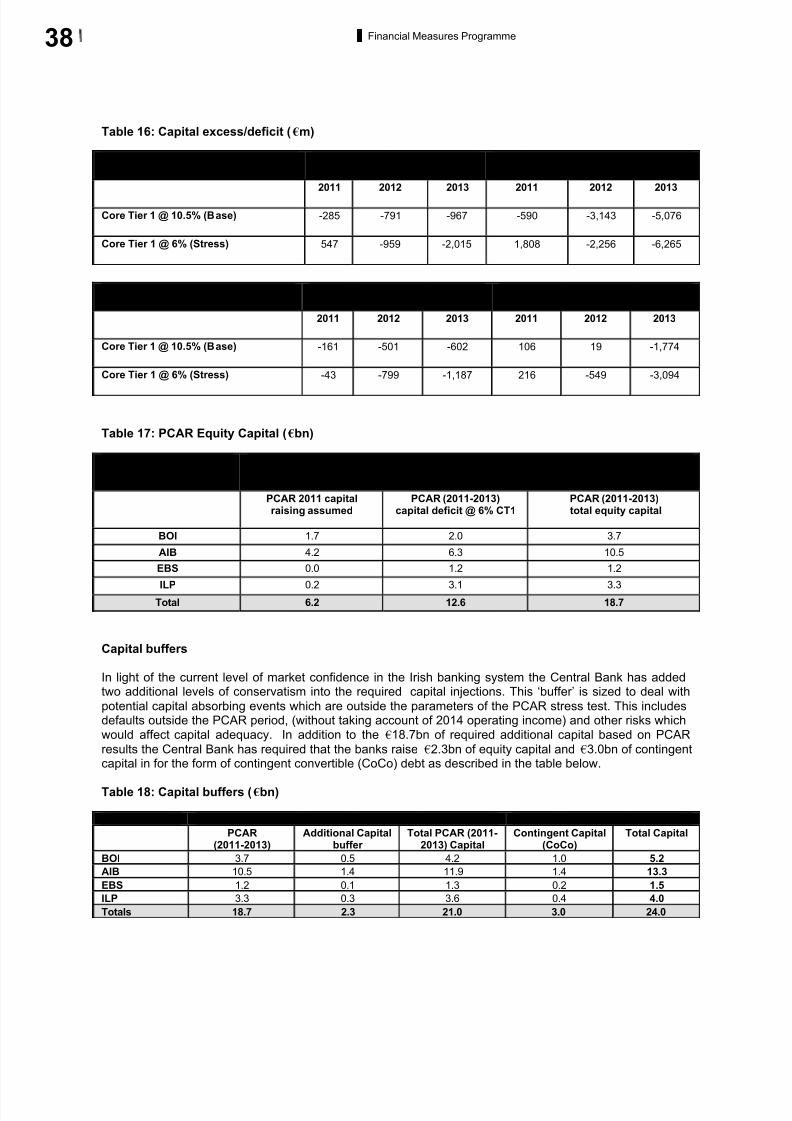
8/6/2019 The Financial Measures Programme Report
http://slidepdf.com/reader/full/the-financial-measures-programme-report 40/92
38 Financial Measures Programme
Table 16: Capital excess/deficit ( m)
BOI AIB
2011 2012 2013 2011 2012 2013
Core Tier 1 @ 10.5% (Base) -285 -791 -967 -590 -3,143 -5,076
Core Tier 1 @ 6% (Stress) 547 -959 -2,015 1,808 -2,256 -6,265
EBS ILP
2011 2012 2013 2011 2012 2013
Core Tier 1 @ 10.5% (Base) -161 -501 -602 106 19 -1,774
Core Tier 1 @ 6% (Stress) -43 -799 -1,187 216 -549 -3,094
Table 17: PCAR Equity Capital ( bn)
As of 31 March 2011
PCAR 2011 capitalraising assumed
PCAR (2011-2013)capital deficit @ 6% CT1
PCAR (2011-2013)total equity capital
BOI 1.7 2.0 3.7
AIB 4.2 6.3 10.5
EBS 0.0 1.2 1.2
ILP 0.2 3.1 3.3
Total 6.2 12.6 18.7
Capital buffers
In light of the current level of market confidence in the Irish banking system the Central Bank has addedtwo additional levels of conservatism into the required capital injections. This ‘buffer’ is sized to deal with
potential capital absorbing events which are outside the parameters of the PCAR stress test. This includesdefaults outside the PCAR period, (without taking account of 2014 operating income) and other risks whichwould affect capital adequacy. In addition to the 18.7bn of required additional capital based on PCAR
results the Central Bank has required that the banks raise 2.3bn of equity capital and 3.0bn of contingentcapital in for the form of contingent convertible (CoCo) debt as described in the table below.
Table 18: Capital buffers ( bn)
As of 31 March 2011
PCAR(2011-2013)
Additional Capitalbuffer
Total PCAR (2011-2013) Capital
Contingent Capital(CoCo)
Total Capital
BOI 3.7 0.5 4.2 1.0 5.2
AIB 10.5 1.4 11.9 1.4 13.3
EBS 1.2 0.1 1.3 0.2 1.5
ILP 3.3 0.3 3.6 0.4 4.0
Totals 18.7 2.3 21.0 3.0 24.0
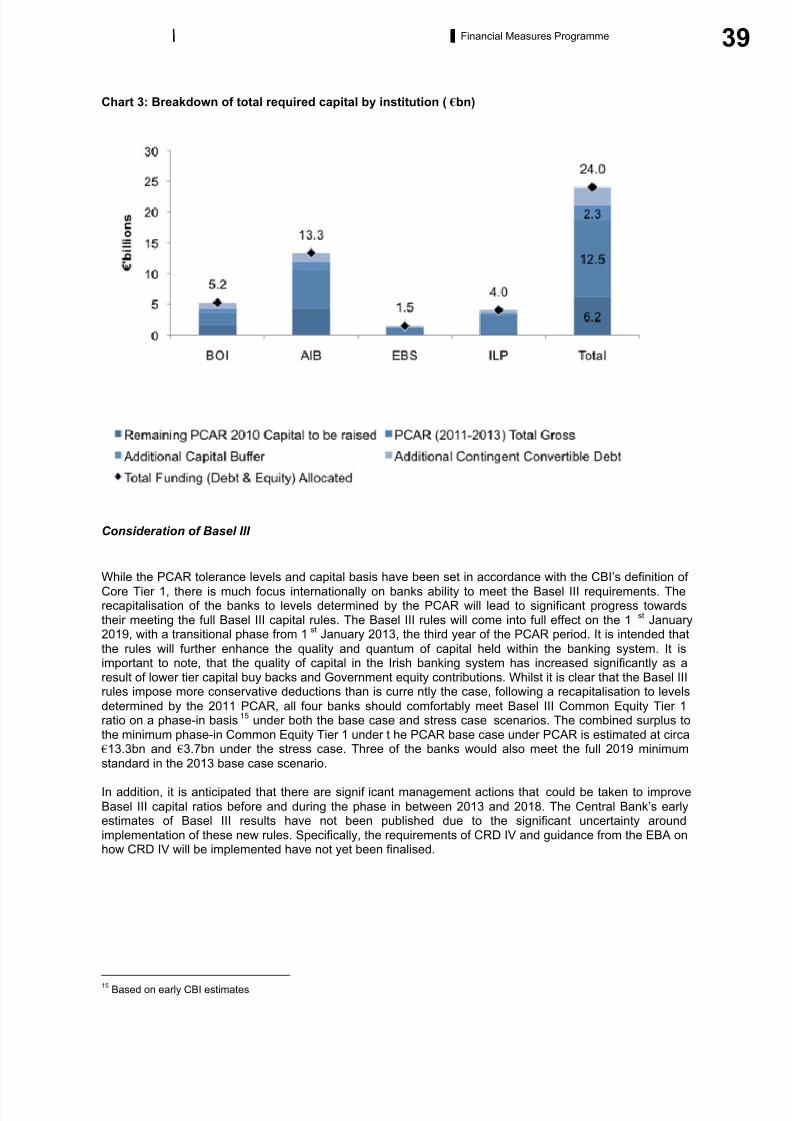
8/6/2019 The Financial Measures Programme Report
http://slidepdf.com/reader/full/the-financial-measures-programme-report 41/92
39Financial Measures Programme
Chart 3: Breakdown of total required capital by institution ( bn)
Consideration of Basel III
While the PCAR tolerance levels and capital basis have been set in accordance with the CBI’s definition of
Core Tier 1, there is much focus internationally on banks ability to meet the Basel III requirements. Therecapitalisation of the banks to levels determined by the PCAR will lead to significant progress towardstheir meeting the full Basel III capital rules. The Basel III rules will come into full effect on the 1
stJanuary
2019, with a transitional phase from 1st
January 2013, the third year of the PCAR period. It is intended that
the rules will further enhance the quality and quantum of capital held within the banking system. It isimportant to note, that the quality of capital in the Irish banking system has increased significantly as aresult of lower tier capital buy backs and Government equity contributions. Whilst it is clear that the Basel IIIrules impose more conservative deductions than is currently the case, following a recapitalisation to levels
determined by the 2011 PCAR, all four banks should comfortably meet Basel III Common Equity Tier 1ratio on a phase-in basis
15under both the base case and stress case scenarios. The combined surplus to
the minimum phase-in Common Equity Tier 1 under the PCAR base case under PCAR is estimated at circa 13.3bn and 3.7bn under the stress case. Three of the banks would also meet the full 2019 minimum
standard in the 2013 base case scenario.
In addition, it is anticipated that there are signif icant management actions that could be taken to improve
Basel III capital ratios before and during the phase in between 2013 and 2018. The Central Bank’s earlyestimates of Basel III results have not been published due to the significant uncertainty aroundimplementation of these new rules. Specifically, the requirements of CRD IV and guidance from the EBA onhow CRD IV will be implemented have not yet been finalised.
15Based on early CBI estimates
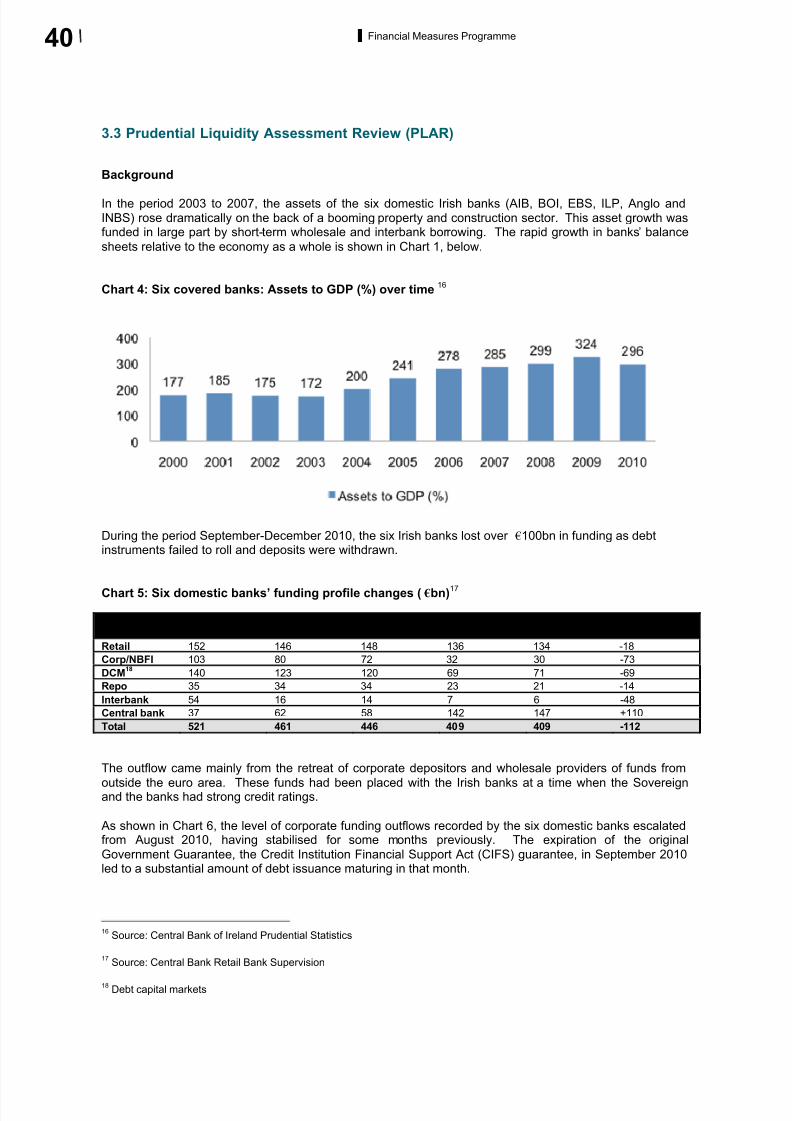
8/6/2019 The Financial Measures Programme Report
http://slidepdf.com/reader/full/the-financial-measures-programme-report 42/92
40 Financial Measures Programme
3.3 Prudential Liquidity Assessment Review (PLAR)
Background
In the period 2003 to 2007, the assets of the six domestic Irish banks (AIB, BOI, EBS, ILP, Anglo andINBS) rose dramatically on the back of a booming property and construction sector. This asset growth wasfunded in large part by short-term wholesale and interbank borrowing. The rapid growth in banks’ balance
sheets relative to the economy as a whole is shown in Chart 1, below.
Chart 4: Six covered banks: Assets to GDP (%) over time16
During the period September-December 2010, the six Irish banks lost over 100bn in funding as debtinstruments failed to roll and deposits were withdrawn.Chart 5: Six domestic banks’ funding profile changes ( bn)
17
Category Dec 08 Dec 09 Jun 10 Dec 10 18 Feb 2011 Change sinceDec 08
Retail 152 146 148 136 134 -18
Corp/NBFI 103 80 72 32 30 -73
DCM18
140 123 120 69 71 -69
Repo 35 34 34 23 21 -14
Interbank 54 16 14 7 6 -48
Central bank 37 62 58 142 147 +110
Total 521 461 446 409 409 -112
The outflow came mainly from the retreat of corporate depositors and wholesale providers of funds from
outside the euro area. These funds had been placed with the Irish banks at a time when the Sovereignand the banks had strong credit ratings.
As shown in Chart 6, the level of corporate funding outflows recorded by the six domestic banks escalatedfrom August 2010, having stabilised for some months previously. The expiration of the original
Government Guarantee, the Credit Institution Financial Support Act (CIFS) guarantee, in September 2010led to a substantial amount of debt issuance maturing in that month. 16
Source: Central Bank of Ireland Prudential Statistics
17Source: Central Bank Retail Bank Supervision
18Debt capital markets
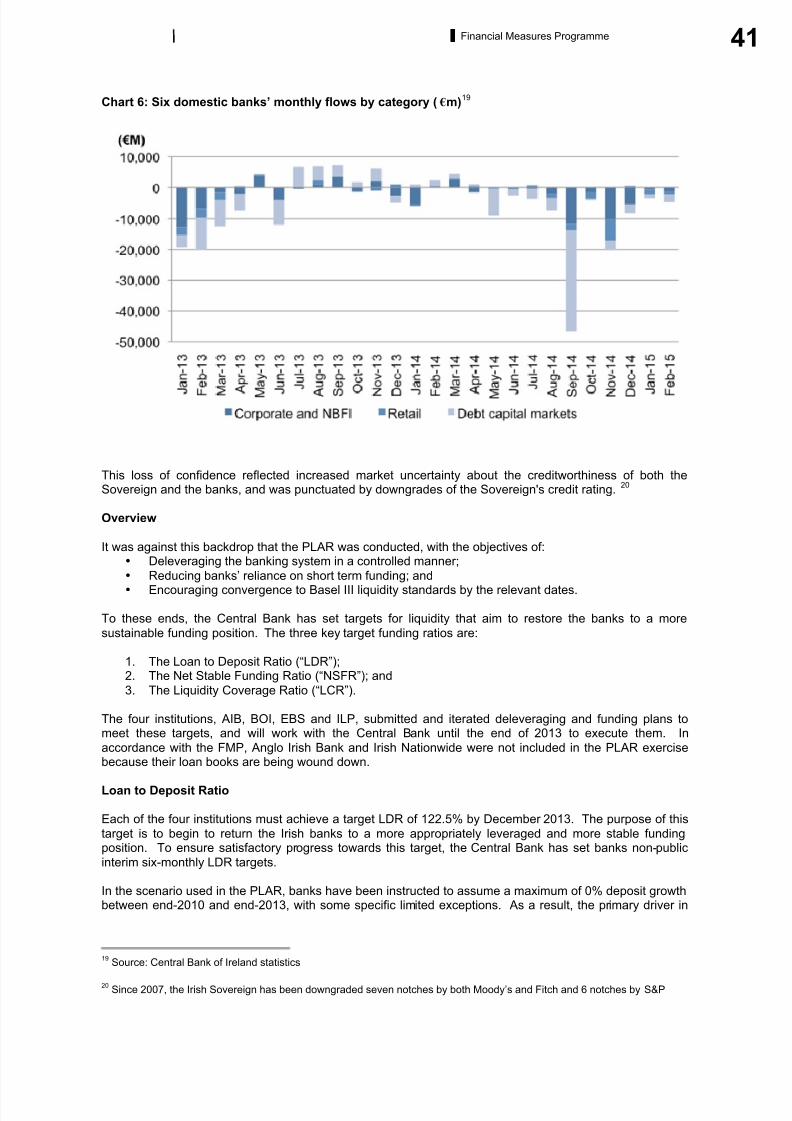
8/6/2019 The Financial Measures Programme Report
http://slidepdf.com/reader/full/the-financial-measures-programme-report 43/92
41Financial Measures Programme
Chart 6: Six domestic banks’ monthly flows by category ( m)19
This loss of confidence reflected increased market uncertainty about the creditworthiness of both theSovereign and the banks, and was punctuated by downgrades of the Sovereign's credit rating.
20
Overview
It was against this backdrop that the PLAR was conducted, with the objectives of:• Deleveraging the banking system in a controlled manner;
• Reducing banks’ reliance on short term funding; and• Encouraging convergence to Basel III liquidity standards by the relevant dates.
To these ends, the Central Bank has set targets for liquidity that aim to restore the banks to a more
sustainable funding position. The three key target funding ratios are:
1. The Loan to Deposit Ratio (“LDR”);2. The Net Stable Funding Ratio (“NSFR”); and
3. The Liquidity Coverage Ratio (“LCR”).
The four institutions, AIB, BOI, EBS and ILP, submitted and iterated deleveraging and funding plans tomeet these targets, and will work with the Central Bank until the end of 2013 to execute them. In
accordance with the FMP, Anglo Irish Bank and Irish Nationwide were not included in the PLAR exercisebecause their loan books are being wound down.
Loan to Deposit Ratio
Each of the four institutions must achieve a target LDR of 122.5% by December 2013. The purpose of this
target is to begin to return the Irish banks to a more appropriately leveraged and more stable fundingposition. To ensure satisfactory progress towards this target, the Central Bank has set banks non-public
interim six-monthly LDR targets.
In the scenario used in the PLAR, banks have been instructed to assume a maximum of 0% deposit growthbetween end-2010 and end-2013, with some specific limited exceptions. As a result, the primary driver in
19Source: Central Bank of Ireland statistics
20Since 2007, the Irish Sovereign has been downgraded seven notches by both Moody’s and Fitch and 6 notches by S&P
8/6/2019 The Financial Measures Programme Report
http://slidepdf.com/reader/full/the-financial-measures-programme-report 44/92
42 Financial Measures Programme
the improvement in the LDR will be deleveraging: the reduction of loans through the disposal and run-down
of non-core portfolios. Further details of the deleveraging plans are contained in Section 3.4.
Net Stable Funding Ratio
The NSFR seeks to ensure that banks fund a greater proportion of their lending activities with stable, long-term funding. Setting target NSFRs will create incentives for banks to improve the stability of their fundingby growing customer deposits and lengthening the term of wholesale funding (should market conditionspermit), prudently manage the asset side of their balance sheets, and reduce their reliance on central bank
funding.
The Central Bank has set each bank a target NSFR for end-2013, and interim half-yearly targets during2011 to 2013. These will ensure that convergence to Basel III standards occurs by January 2018. The
Central Bank has also instructed the banks to produce detailed plans for meeting these targets. It shouldbe noted that the Basel Committee on Banking Supervision and the European Union (via CRD IV) have not
yet finalised the format of the NSFR (nor its component definitions and weightings).
Liquidity Coverage Ratio
The LCR aims to ensure banks have sufficient high-quality liquid assets to survive a significant, one-month
liquidity stress scenario. Setting a LCR target for December 2013 will encourage banks to strengthen their liquidity buffer once their reliance on central bank borrowing has been reduced to sustainable levels.
The Central Bank has set each bank a target LCR for end-2013 that is designed to ensure thatconvergence to Basel III standards occurs by January 2015. The initial focus is for the banks to reducetheir reliance on central bank funding through the proceeds of deleveraging and any other new sources of funding. Once this has been achieved to an acceptable level, banks will then focus on rebuilding their
stock of liquid assets. As with the NSFR, it should be noted that the BCBS and the European Union (viaCRD IV) have not yet finalised the format of the LCR (nor its component definitions and weightings).
Box 3 – Liquidity Metrics
Loan to Deposit Ratio (“LDR”) The LDR is a measure of deposit funding. It is calculated as gross loansto customers, net of provisions, divided by customer deposits. The ratio is a simple and transparent
measure of a bank’s liquidity position. It can be readily calculated and tracked from publicly available data,
it can be calculated on a comparable basis for most financial institutions (underpinned by International
Financial Reporting Standards), and it is frequently monitored by market participants.
Net Stable Funding Ratio (“NSFR”) The NSFR is a measure of banks’ structural liquidity mismatch. Its
objective is to ensure that a bank’s long-term asse ts (on- and off-balance sheet) are funded by stable
funding sources, measured by either behavioural or contractual term. It is defined as the ratio of a bank’s
available stable funding to its required amount of stable funding, in line with the parameters set out by the
BCBS in December 2010. Under current Basel III proposals, banks must reach a minimum of 100% NSFR
by January 2018.
Liquidity Coverage Ratio (“LCR”) The LCR is a measure of short-term contingent liquidity risk. Its
objective is to ensure that a bank has sufficient liquidity to meet potential net outflows from both on- and
off-balance sheet exposures in a stressed environment. It is defined as the ratio of a bank’s stock of high
quality liquid assets to its expected net cash outflows in the first 30 days of a specified stress scenario, in
line with the parameters set out by the BCBS in December 2010. Under current Basel III proposals, banks
must reach a minimum standard of 100% LCR by January 2015.

8/6/2019 The Financial Measures Programme Report
http://slidepdf.com/reader/full/the-financial-measures-programme-report 45/92
43Financial Measures Programme
Ongoing monitoring and compliance
In order to assess progress towards implementing deleveraging plans and meeting targets, the CentralBank will require banks to submit a detailed plan every six months (beginning at the end of June 2011),
demonstrating how they will achieve their next interim target. Funding ratios will be calculated andcompared against the interim targets established as part of PLAR 2011. In addition to this semi-annualreporting, the Central Bank and other public authorities will interact more regularly with banks to monitor progress towards the disposal of non-core assets.
In the event that a bank’s progress towards liquidity ta rgets is considered unsatisfactory, the Central Bankwill require specific remedial actions to be taken.
The Central Bank will conduct further PLARs in 2012 and 2013 in accordance with the terms of the MOU.For more details of the assumptions, approach and methodology behind the forecasting of PLAR metrics,
see Appendix H.
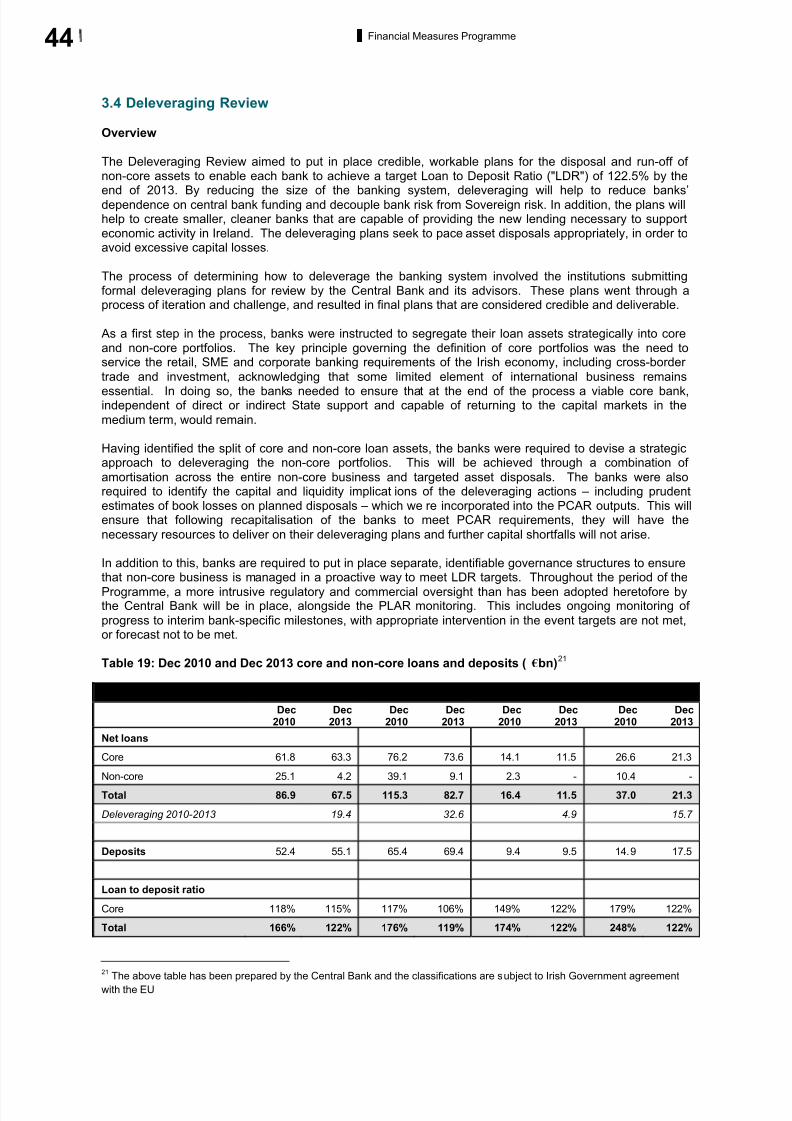
8/6/2019 The Financial Measures Programme Report
http://slidepdf.com/reader/full/the-financial-measures-programme-report 46/92
44 Financial Measures Programme
3.4 Deleveraging Review
Overview
The Deleveraging Review aimed to put in place credible, workable plans for the disposal and run-off of non-core assets to enable each bank to achieve a target Loan to Deposit Ratio ("LDR") of 122.5% by the
end of 2013. By reducing the size of the banking system, deleveraging will help to reduce banks’dependence on central bank funding and decouple bank risk from Sovereign risk. In addition, the plans willhelp to create smaller, cleaner banks that are capable of providing the new lending necessary to supporteconomic activity in Ireland. The deleveraging plans seek to pace asset disposals appropriately, in order toavoid excessive capital losses.
The process of determining how to deleverage the banking system involved the institutions submittingformal deleveraging plans for review by the Central Bank and its advisors. These plans went through aprocess of iteration and challenge, and resulted in final plans that are considered credible and deliverable.
As a first step in the process, banks were instructed to segregate their loan assets strategically into coreand non-core portfolios. The key principle governing the definition of core portfolios was the need toservice the retail, SME and corporate banking requirements of the Irish economy, including cross-border
trade and investment, acknowledging that some limited element of international business remains
essential. In doing so, the banks needed to ensure that at the end of the process a viable core bank,independent of direct or indirect State support and capable of returning to the capital markets in the
medium term, would remain.
Having identified the split of core and non-core loan assets, the banks were required to devise a strategicapproach to deleveraging the non-core portfolios. This will be achieved through a combination of
amortisation across the entire non-core business and targeted asset disposals. The banks were alsorequired to identify the capital and liquidity implications of the deleveraging actions – including prudentestimates of book losses on planned disposals – which were incorporated into the PCAR outputs. This willensure that following recapitalisation of the banks to meet PCAR requirements, they will have the
necessary resources to deliver on their deleveraging plans and further capital shortfalls will not arise.
In addition to this, banks are required to put in place separate, identifiable governance structures to ensurethat non-core business is managed in a proactive way to meet LDR targets. Throughout the period of the
Programme, a more intrusive regulatory and commercial oversight than has been adopted heretofore bythe Central Bank will be in place, alongside the PLAR monitoring. This includes ongoing monitoring of
progress to interim bank-specific milestones, with appropriate intervention in the event targets are not met,or forecast not to be met.
Table 19: Dec 2010 and Dec 2013 core and non-core loans and deposits ( bn)21
AIB BOI EBS ILP
Dec2010
Dec2013
Dec2010
Dec2013
Dec2010
Dec2013
Dec2010
Dec2013
Net loans
Core 61.8 63.3 76.2 73.6 14.1 11.5 26.6 21.3
Non-core 25.1 4.2 39.1 9.1 2.3 - 10.4 -Total 86.9 67.5 115.3 82.7 16.4 11.5 37.0 21.3
Deleveraging 2010-2013 19.4 32.6 4.9 15.7
Deposits 52.4 55.1 65.4 69.4 9.4 9.5 14.9 17.5
Loan to deposit ratio
Core 118% 115% 117% 106% 149% 122% 179% 122%
Total 166% 122% 176% 119% 174% 122% 248% 122%
21 The above table has been prepared by the Central Bank and the classifications are subject to Irish Government agreementwith the EU
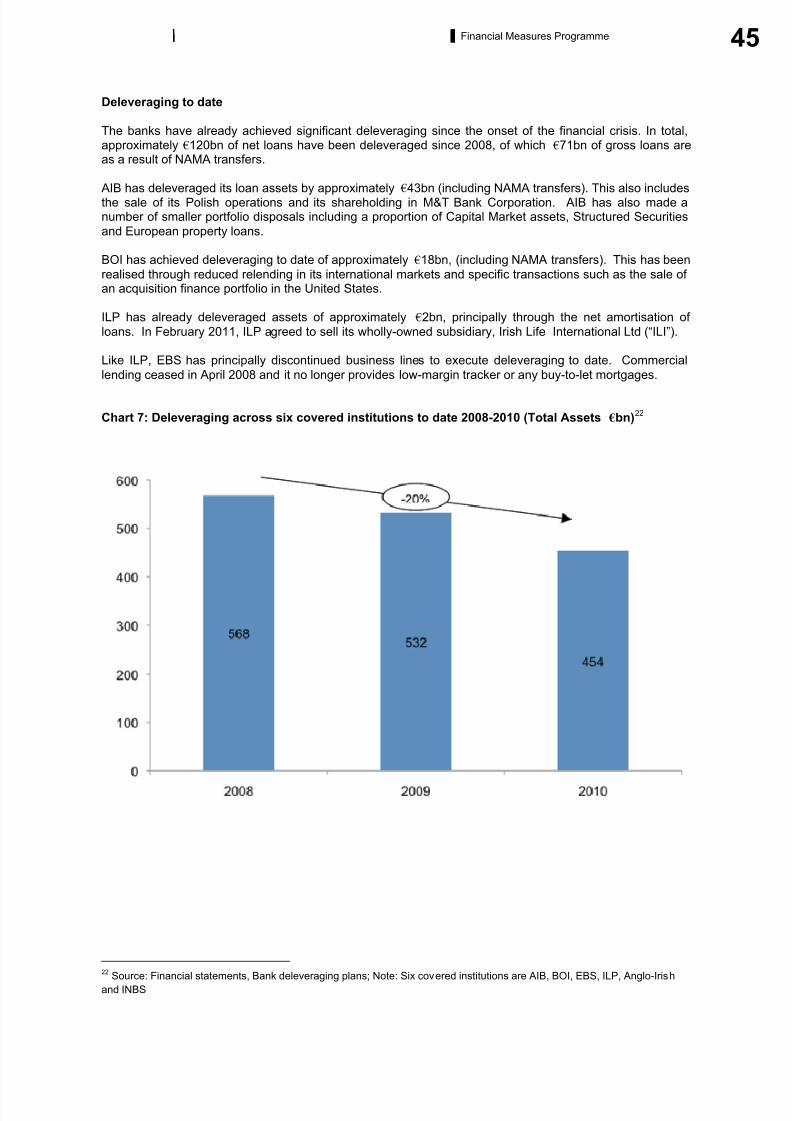
8/6/2019 The Financial Measures Programme Report
http://slidepdf.com/reader/full/the-financial-measures-programme-report 47/92
45Financial Measures Programme
Deleveraging to date
The banks have already achieved significant deleveraging since the onset of the financial crisis. In total,approximately 120bn of net loans have been deleveraged since 2008, of which 71bn of gross loans areas a result of NAMA transfers.
AIB has deleveraged its loan assets by approximately 43bn (including NAMA transfers). This also includesthe sale of its Polish operations and its shareholding in M&T Bank Corporation. AIB has also made anumber of smaller portfolio disposals including a proportion of Capital Market assets, Structured Securities
and European property loans.
BOI has achieved deleveraging to date of approximately 18bn, (including NAMA transfers). This has been
realised through reduced relending in its international markets and specific transactions such as the sale of an acquisition finance portfolio in the United States.
ILP has already deleveraged assets of approximately 2bn, principally through the net amortisation of
loans. In February 2011, ILP agreed to sell its wholly-owned subsidiary, Irish Life International Ltd (“ILI”).
Like ILP, EBS has principally discontinued business lines to execute deleveraging to date. Commercial
lending ceased in April 2008 and it no longer provides low-margin tracker or any buy-to-let mortgages.
Chart 7: Deleveraging across six covered institutions to date 2008-2010 (Total Assets bn)22
22 Source: Financial statements, Bank deleveraging plans; Note: Six covered institutions are AIB, BOI, EBS, ILP, Anglo-Irishand INBS
-20%
8/6/2019 The Financial Measures Programme Report
http://slidepdf.com/reader/full/the-financial-measures-programme-report 48/92
46 Financial Measures Programme
AIB deleveraging plan
AIB has defined core assets and businesses as those that will serve the banking needs of retail,commercial and corporate customers who are resident in Ireland or overseas entities that have trade and
investment links to Ireland. AIB’s UK incorporated subsidiary, which includes its Northern Irish operationsand is predominantly deposit-funded, is also part of the core business.
AIB’s non-core division consists largely of international loan assets across a number of portfolios in the UK,
the US and Europe. These assets have been defined as being non-core primarily on the basis of their lesser importance to the Irish economy rather than due to credit quality issues. AIB has established acredible plan for the run-off and disposal of these assets. AIB expects to reduce the balance of non-coreloans from 25.1bn at the end of 2010 to 4.2bn by the end of 2013 and that these remaining non-core
loans will be run down in due course.
BOI deleveraging plan
As with AIB, BOI has carried out a strategic split of its business into core and non-core. BOI’s non-coredivision consists largely of international loan assets that are spread across a number of portfolios in the UK,
the US and Europe. The non-core will reduce from 39.1bn to 9.1bn by 2013. Within the non-core, BOI
plans to run off a significant amount of its UK intermediary-originated mortgage book together with a mix of run-off and disposals of other non-core businesses. BOI is well advanced in its planning for the executionof its deleveraging plan and has identified a significant pool of assets. This provides flexibility within thedisposal strategy to minimise capital impacts.
BOI is proposing to reduce the size of its balance sheet from 115.3bn at 31 December 2010 to 82.7bn at
December 2013. Core businesses are those which focus on Ireland, and its fully deposit-funded UKsubsidiary which includes its Northern Irish operations along with its joint venture with the UK Post Office.
In addition, BOI will retain as core businesses some of its UK-based, corporate-focused operations andsome limited international lending.
EBS deleveraging plan
EBS has refocused its business on core mortgage lending. An element of deleveraging will be achievedover the period of the three years via the natural amortisation of its loan book as forecast mortgagedemand is significantly below redemptions during that time. EBS has also identified specific assets todispose of during the three years of the Programme.
ILP deleveraging plan
ILP has made the strategic decision to re-focus on its core mortgage business. It plans on achieving a
significant net reduction in loans as a result of the changed demand dynamic within the Irish market, asredemptions will likely significantly exceed new mortgage lending demand over the next three years.
The primary method of deleveraging for ILP will be through this mortgage amortisation, through the discrete
sale of high credit quality UK assets, and through the closure of other non-core Irish business lines with therun-down of associated loans.
The non-core assets total 10.4bn as of December 2010 but will be reduced to zero by December 2013. As
with the other banks, ILP was required to quantify the likely capital implications of the deleverageprogramme. They were however also able to provide information on non-banking assets which are withinthe ILP Group which when sold would off-set a considerable amount of the capital required relating to
disposals. This was also provided by the bank for the complete PCAR assessment.

8/6/2019 The Financial Measures Programme Report
http://slidepdf.com/reader/full/the-financial-measures-programme-report 49/92
47
Appendices
8/6/2019 The Financial Measures Programme Report
http://slidepdf.com/reader/full/the-financial-measures-programme-report 50/92
48 Financial Measures Programme
Appendix A: EU-IMF financial assistance package – Ireland
Overview
On 21 November 2010, the Irish Government requested external financial support in order to put in place a
wide-ranging reform programme to restore confidence and return the economy to a path of sustainedgrowth and job creation. On 28 November, the Government agreed, on the basis of specified conditions, to
an 85bn financial support programme which is being provided by members of the European Union
(represented by the European Commission and the European Central Bank) and the InternationalMonetary Fund.
Comprehensive details in relation to the Programme, including the agreed Memorandum of Understanding
and the Memorandum of Economic and Financial Policies by the authorities of Ireland, are contained inIMF Country Report No. 10/366 Staff Report on Ireland. This report is available at:
http://www.imf.org/external/pubs/ft/scr/2010/cr10366.pdf
Source of funds
External support totalling 67.5bn is available, with 22.5bn from the IMF’s Extended Fund Facility (EFF)23
and 22.5bn from the European Commission’s European Financial Stabilisation Mechanism (EFSM). Theremainder will come from the European Financial Stability Facility (EFSF) and a series of bilateral loans
( 3.8bn from the UK, 400m from Denmark, and 600m from Sweden).
Irish contribution
Ireland’s contribution to the Programme’s funding will amount to 17.5bn, with 12.5bn coming from the
liquid assets of the National Pensions Reserve Fund (NPRF) and 5bn from accumulated Exchequer cashbalances. This brings the total size of the Programme to 85bn.
External funding
IMF funds released through the EFF will be issued in the form of Special Drawing Rights (SDRs). SDRsare the unit of account of the IMF, and represent an international reserve asset which can be exchanged
for freely usable currencies. SDR values are based on a weighted basket of currencies (euro, Japaneseyen, pound sterling and US dollar). Under a non-concessional loan agreement (such as the EFF) the IMFcan allocate loans to members as a multiple of their IMF quotas/subscriptions (which are denominated inSDRs).
EFSM bonds are raised by means of the European Commission borrowing on capital markets in its own
name, with bonds guaranteed by the EU Budget. The EFSF lends to the Irish Government on behalf of euro area Member States. Bonds issued by the EFSF are backed by government guarantees from euro
area Member States (not including Ireland or Greece).
Interest rate
At the outset of the Programme, the average interest rate on the external funding from across the threesources was calculated as 5.82%, on the basis that the average life of the borrowings, which involves a
combination of longer and shorter dated maturities, will be seven and a half years. The actual cost will,however, depend on prevailing market rates at the time of each drawdown. The interest rate applying toborrowings from the IMF facility, at the time the Programme was introduced, was calculated to be 5.7%,
24
with a similar rate applying to borrowings from the EFSM. The rates on the EFSF and bilateral loans were
estimated, at that time, to be 6.05%.
23The Extended Fund Facility was established in 1974 to help countries address longer-term balance of payments problems
requiring fundamental economic reforms. Arrangements under the EFF are thus longer than other Fund arrangements.
24 The average interest rate on Ireland’s borrowings under the EFF declined following an increase in Ireland’s quota on 4 March2011.
8/6/2019 The Financial Measures Programme Report
http://slidepdf.com/reader/full/the-financial-measures-programme-report 51/92
49Financial Measures Programme
Further details on the above facilities are set out in a Technical Note on Programme Borrowing rates
published by the NTMA(http://www.ntma.ie/Publications/2010/TechnicalNoteOnEUIMFProgrammeBorrowingRates.pdf ), and arecent derivation of the IMF interest rate is contained in an IMF Media Advisory note issued on 3 March
2011 (see http://www.imf.org/external/np/country/2011/030311.htm). It should be noted that the IMF rate
reflects a recent increase in Ireland’s IMF quota/subscription. In addition to the surcharges applied, the
standard ‘rate of charge’ on Ireland’s funding from the EFF will depend on the prevailing SDR interest rateover the life of the loan.
Agreed policy measures
The Programme outlines a comprehensive set of measures to downsize and reorganise the bankingsystem over time, together with measures to safeguard the public finances and achieve fiscal sustainability.Access to funding will be strictly conditional on the achievement of specific fiscal targets and theimplementation of the structural reforms set out in the Memorandum of Economic and Financial Policies
(MEFP) (http://www.imf.org/external/np/loi/2010/irl/120310.pdf ). Implementation of these targets andreforms will be monitored through a set of benchmarks.
The Programme’s Memorandum of Understanding (MoU)
(http://www.imf.org/external/np/loi/2010/irl/120310.pdf ) also sets out the list of required quarterly actions,
with regard to fiscal consolidation, financial sector reforms and structural fiscal reforms, to be implementedbetween end-December 2010 and the final quarter of 2013.
Funding drawdowns – Quarter 1 2011
An initial 5.8bn25
of funding was received from the IMF on 18 January 2011. Future disbursements under
the EFF are subject to successful quarterly reviews.
Under the EFSM, Ireland drew down 5bn on 12 January 2011, and a further 3.4bn was drawn on 24March 2011. Under the EFSF, Ireland drew down 4.2bn on 1 February 2011. In the first quarter of 2011,
Ireland drew down a total of 18.4bn from the EU and IMF facilities, which was comprised of 12.6bn fromthe EU facilities and 5.8 billion from the IMF (see footnote). Subsequent drawdowns will be subject toIreland’s needs and to quarterly reviews by the Commission in cooperation with the International Monetary
Fund (IMF) and in liaison with the European Central Bank (ECB).
25SDR 5bn was valued at an exchange rate of 1 euro = SDR 1.16 on 13 January 2011.
8/6/2019 The Financial Measures Programme Report
http://slidepdf.com/reader/full/the-financial-measures-programme-report 52/92
50 Financial Measures Programme
Appendix B: Third-party contractors
To assist with the Financial Measures Programme, the Central Bank engaged a number of expert third-
party contractors. Three primary firms were contracted to provide expert support and guidance in theimplementation of the measures agreed in the MoU.
Primary third-party contractors in FMP implementation
Contractor Details of role
Barclays Capital Expert advice on banking sector reorganisation anddeleveraging issues
BlackRock Solutions Robust loan loss forecasting exercise on the assets of the Irish
banks
The Boston Consult ing Group Project management resources across the Financial Measures
Programme; assessor of the loan loss forecasting exercise; andexpert advice on the PCAR and PLAR
For certain elements of the analysis, the work of third-party sub-contractors was used by BlackRock tocomplete work or supplement information provided by the banks. The sub-contractors that were used for each workstream are outlined below. All sub-contractors were selected on the basis of (i) task-specific
expertise; (ii) local market knowledge; and (iii) lack of conflicts with assigned bank.
Sub-contractors in FMP implementation
Contractor Details of role
Deloitte • Data Integrity and Verification for AIB
• Data Integrity and Verification for EBS
Ernst and Young • Data Integrity and Verification for BOI• Asset Quality Review for CRE loans less than 50m for
BOI, EBS and ILP
Mazars • Data Integrity and Verification for ILP
• Asset Quality Review for SME lending at AIB and BOI
Clayton Euro Risk Management • Asset Quality Review for Residential mortgageportfolios across all banks
Situs • Asset Quality Review for CRE loans greater than 50mat BOI
• Asset Quality Review for CRE loans at AIB
Arthur Cox • Lead law firm for legal review of collateral enforcementissues
• Bank-specific legal analysis for AIB and ILP
Matheson Ormsby Prentice • Bank-specific legal analysis for BOI and EBS
8/6/2019 The Financial Measures Programme Report
http://slidepdf.com/reader/full/the-financial-measures-programme-report 53/92
51Financial Measures Programme
Appendix C: Macroeconomic scenarios
Stress-testing: Macroeconomic scenarios
As part of the Financial Measures Programme, the Central Bank was required to set macroeconomicscenarios for the banks, within which the stress-testing exercise was to take place. Therefore, the Central
Bank prescribed a common baseline macroeconomic scenario and an adverse scenario broadly consistentwith those being applied for the European Banking Authority (“EBA”) 2011 EU-wide stress test. The EBA-prescribed macroeconomic and market variables were applied when performing forecasts.
The baseline was built off a December 2010 EU Commission forecast for Ireland with additional propertyprice assumptions provided by the Central Bank. These assumptions set out the continuation of subdueddomestic demand and continued declines in both residential and commercial property prices over thehorizon of the exercise.
In the base case, economic growth takes place through an export-led recovery which, in turn, depends ona revival in economic growth in important trading partners within the EU and continued strong global
demand generally. The adverse case assumes a decline in EU and global economic growth combined witha further weakening of domestic demand. This resulting overall effect is renewed economic contractionconcentrated in 2011-2012 followed by a modest recovery.
The Central Bank is applying a scenario that projects a decline in both commercial and residential property
prices in the base and the adverse case. It is important to note that these are not forecasts of outcomes butrepresent two possible paths from a large range of future outcomes regarding property prices.
In this regard, there is a significant degree of uncertainty surrounding the range of possible future outcomes
for the domestic property market. These are related to borrower and bank behaviour, measurementproblems in determining the extent of property price declines due the paucity of transactions, the continued
unavailability of property price indices, and future demand for residential and commercial property.
In examining house price booms in other OECD countries, some stylised facts could be drawn which canprovide some indication as to the likely path of Irish house prices. For example, in the cases of Finland,Sweden and the UK in the early 1990s following periods of significant house price increases, prices tend to
follow a pronounced decline for a protracted period. Furthermore, when prices decline they tend to fallbelow the level suggested by market fundamentals and remains below this fundamental level for sometime. Consequently, the scenario regarding property prices in both the base and the adverse scenarioshould be viewed in this context.
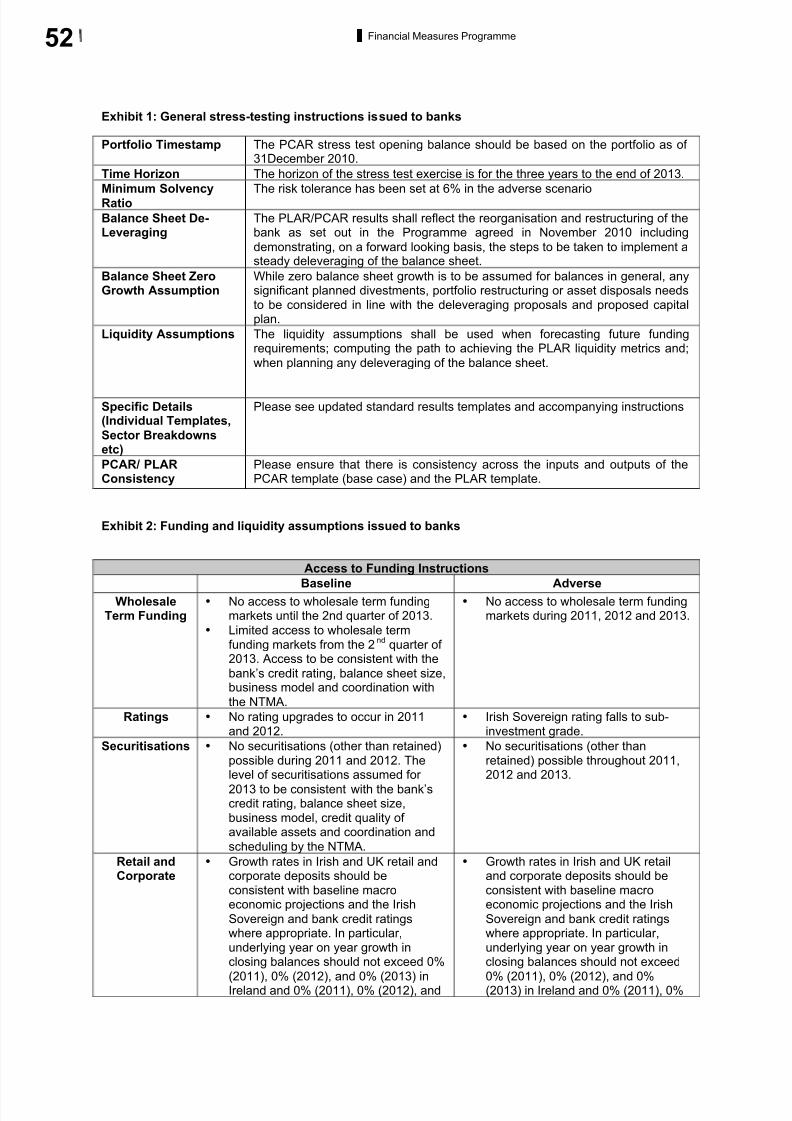
8/6/2019 The Financial Measures Programme Report
http://slidepdf.com/reader/full/the-financial-measures-programme-report 54/92
52 Financial Measures Programme
Exhibit 1: General stress-testing instructions issued to banks
Portfolio Timestamp The PCAR stress test opening balance should be based on the portfolio as of 31December 2010.
Time Horizon The horizon of the stress test exercise is for the three years to the end of 2013.
Minimum SolvencyRatio The risk tolerance has been set at 6% in the adverse scenario
Balance Sheet De-Leveraging
The PLAR/PCAR results shall reflect the reorganisation and restructuring of thebank as set out in the Programme agreed in November 2010 including
demonstrating, on a forward looking basis, the steps to be taken to implement asteady deleveraging of the balance sheet.
Balance Sheet ZeroGrowth Assumption
While zero balance sheet growth is to be assumed for balances in general, anysignificant planned divestments, portfolio restructuring or asset disposals needsto be considered in line with the deleveraging proposals and proposed capitalplan.
Liquidity Assumptions The liquidity assumptions shall be used when forecasting future fundingrequirements; computing the path to achieving the PLAR liquidity metrics and;
when planning any deleveraging of the balance sheet.
Specific Details(Individual Templates,
Sector Breakdownsetc)
Please see updated standard results templates and accompanying instructions
PCAR/ PLARConsistency
Please ensure that there is consistency across the inputs and outputs of thePCAR template (base case) and the PLAR template.
Exhibit 2: Funding and liquidity assumptions issued to banks
Access to Funding Instructions
Baseline AdverseWholesale
Term Funding• No access to wholesale term funding
markets until the 2nd quarter of 2013.
• Limited access to wholesale termfunding markets from the 2
ndquarter of
2013. Access to be consistent with the
bank’s credit rating, balance sheet size,business model and coordination with
the NTMA.
• No access to wholesale term fundingmarkets during 2011, 2012 and 2013.
Ratings • No rating upgrades to occur in 2011and 2012.
• Irish Sovereign rating falls to sub-investment grade.
Securitisations • No securitisations (other than retained)possible during 2011 and 2012. The
level of securitisations assumed for 2013 to be consistent with the bank’scredit rating, balance sheet size,business model, credit quality of available assets and coordination and
scheduling by the NTMA.
• No securitisations (other thanretained) possible throughout 2011,
2012 and 2013.
Retail andCorporate
• Growth rates in Irish and UK retail andcorporate deposits should beconsistent with baseline macroeconomic projections and the Irish
Sovereign and bank credit ratingswhere appropriate. In particular,underlying year on year growth inclosing balances should not exceed 0%
(2011), 0% (2012), and 0% (2013) inIreland and 0% (2011), 0% (2012), and
• Growth rates in Irish and UK retailand corporate deposits should beconsistent with baseline macroeconomic projections and the Irish
Sovereign and bank credit ratingswhere appropriate. In particular,underlying year on year growth inclosing balances should not exceed
0% (2011), 0% (2012), and 0%(2013) in Ireland and 0% (2011), 0%

8/6/2019 The Financial Measures Programme Report
http://slidepdf.com/reader/full/the-financial-measures-programme-report 55/92
53Financial Measures Programme
0% (2013) in the UK. This underlyinggrowth rate should be exclusive of once-off movements in deposits (for
example, a reduction caused by thedisposal of an asset to which depositsare tied). No gains in share of Irish
deposits should be assumed, except inso far as permitted by the limitsdetailed above
(2012), and 0% (2013) in the UK.This underlying growth rate shouldbe exclusive of once-off movements
in deposits (for example, a reductioncaused by the disposal of an asset towhich deposits are tied). No gains in
share of Irish deposits should beassumed, except in so far aspermitted by the limits detailed above
Short TermWholesale
• Access to short term wholesale (newand rollovers) should be consistent withthe baseline macroeconomic and creditrating assumptions provided. Market
conditions and levels of wholesalefunding of Q4 2010 must be consideredthe benchmark to which theseassumptions are to be applied.
• Access to short term wholesale (newand rollovers) should be consistentwith the stress macroeconomic andcredit rating assumptions provided.
Market conditions and levels of wholesale funding of Q4 2010 mustbe considered the benchmark towhich these assumptions are to be
applied.
ELG • ELG is to be assumed to remain in
operation throughout 2011, 2012 and
2013 subject to EU approval
• ELG is to be assumed to remain in
operation throughout 2011, 2012 and
2013.ECB • Collateral eligibility and haircut
assumptions should be consistent withcurrent practice and any known futurechanges to ECB eligibility criteria.
• Collateral eligibility and haircut
assumptions should be consistentwith current practice and any knownfuture changes to ECB eligibilitycriteria.
ForeignExchange
• FX rates are to be assumed as at31/12/2010.
• FX rates are to be assumed as at31/12/2010.
Cost of Funding Instructions
Baseline Adverse
Funding
Spread (nonECB)
• Funding cost spread in relation to retail,
wholesale and corporate funding is tobe assumed to be at Q4 2010 levels.
• Funding cost spread increases
consistent with stress macroeconomic projections and the Irish
Sovereign and bank credit ratingswhere appropriate.
ECB Funding • Assume that the ECB repo curve is theclosing EURIBOR swap curve as at
31/12/2010 with a floor of 1%. Theadditional funding spread is to bedetermined by the individual bank.Bidding levels should assume that ECB
operations will return to variable ratetenders for both main refinancingoperations and longer term refinancing
operations. Spread levels may varyover the three-year period.
• ELA26
is assumed to be the closingEURIBOR swap curve as at
31/12/2010 with a floor of 1%, plus200bps.
• Assume that the ECB repo curve isthe closing EURIBOR swap curve as
at 31/12/2010 with a floor of 1%. Theadditional funding spread is to beassumed at plus 100bps.
• ELA is assumed to be the closing
EURIBOR swap curve as at31/12/2010 with a floor of 1%, plus200bps.
Money Market Yield Curves <
1 year
• The baseline curves for relevantcurrencies are to be derived from
closing EURIBOR and LIBOR swapprices on 31/12/2010 (together these
curves are referred to as the “AssumedBaseline Short Curves”).
• Assumed Baseline Short Curves are tobe used by the banks to calculate
forward short term rates. These forwardrates are to be used as the benchmark
• It is to be assumed that stress curveswill be derived from the Assumed
Baseline Short Curves plus theCEBS stress spread of 125bps (the
“Assumed Stress Short Curves”).• Assumed Stress Short Curves are to
be used by the banks to calculateforward short term rates. These
forward rates are to be used as thebenchmark to which the bank’s own
26ELA lending is at the discretion of the Central Bank of Ireland.
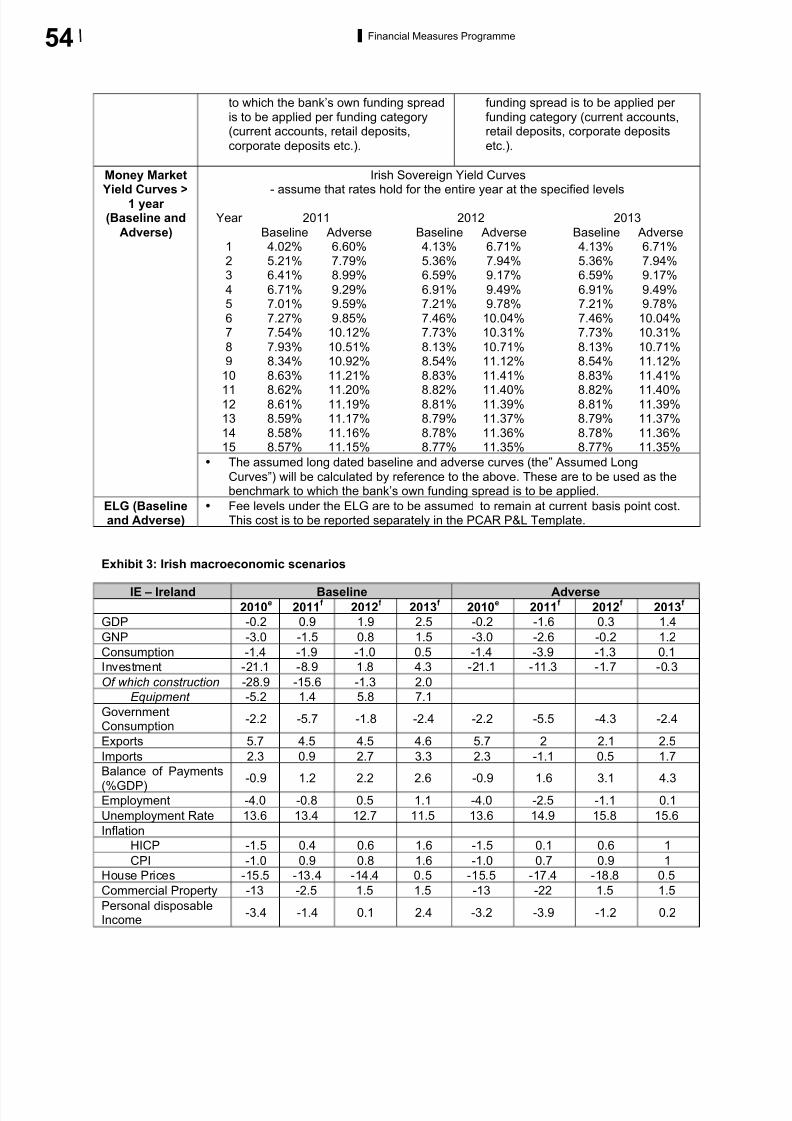
8/6/2019 The Financial Measures Programme Report
http://slidepdf.com/reader/full/the-financial-measures-programme-report 56/92
54 Financial Measures Programme
to which the bank’s own funding spreadis to be applied per funding category(current accounts, retail deposits,
corporate deposits etc.).
funding spread is to be applied per funding category (current accounts,retail deposits, corporate deposits
etc.).
Irish Sovereign Yield Curves
- assume that rates hold for the entire year at the specified levels
Year 2011 2012 2013
Baseline Adverse Baseline Adverse Baseline Adverse1 4.02% 6.60% 4.13% 6.71% 4.13% 6.71%2 5.21% 7.79% 5.36% 7.94% 5.36% 7.94%3 6.41% 8.99% 6.59% 9.17% 6.59% 9.17%
4 6.71% 9.29% 6.91% 9.49% 6.91% 9.49%5 7.01% 9.59% 7.21% 9.78% 7.21% 9.78%6 7.27% 9.85% 7.46% 10.04% 7.46% 10.04%7 7.54% 10.12% 7.73% 10.31% 7.73% 10.31%
8 7.93% 10.51% 8.13% 10.71% 8.13% 10.71%9 8.34% 10.92% 8.54% 11.12% 8.54% 11.12%
10 8.63% 11.21% 8.83% 11.41% 8.83% 11.41%
11 8.62% 11.20% 8.82% 11.40% 8.82% 11.40%12 8.61% 11.19% 8.81% 11.39% 8.81% 11.39%13 8.59% 11.17% 8.79% 11.37% 8.79% 11.37%14 8.58% 11.16% 8.78% 11.36% 8.78% 11.36%15 8.57% 11.15% 8.77% 11.35% 8.77% 11.35%
Money Market
Yield Curves >1 year (Baseline and
Adverse)
• The assumed long dated baseline and adverse curves (the” Assumed Long
Curves”) will be calculated by reference to the above. These are to be used as thebenchmark to which the bank’s own funding spread is to be applied.
ELG (Baselineand Adverse)
• Fee levels under the ELG are to be assumed to remain at current basis point cost.This cost is to be reported separately in the PCAR P&L Template.
Exhibit 3: Irish macroeconomic scenarios
IE – Ireland Baseline Adverse
2010e
2011f
2012f
2013f
2010e
2011f
2012f
2013f
GDP -0.2 0.9 1.9 2.5 -0.2 -1.6 0.3 1.4
GNP -3.0 -1.5 0.8 1.5 -3.0 -2.6 -0.2 1.2
Consumption -1.4 -1.9 -1.0 0.5 -1.4 -3.9 -1.3 0.1
Investment -21.1 -8.9 1.8 4.3 -21.1 -11.3 -1.7 -0.3
Of which construction -28.9 -15.6 -1.3 2.0
Equipment -5.2 1.4 5.8 7.1
GovernmentConsumption
-2.2 -5.7 -1.8 -2.4 -2.2 -5.5 -4.3 -2.4
Exports 5.7 4.5 4.5 4.6 5.7 2 2.1 2.5
Imports 2.3 0.9 2.7 3.3 2.3 -1.1 0.5 1.7
Balance of Payments
(%GDP) -0.9 1.2 2.2 2.6 -0.9 1.6 3.1 4.3
Employment -4.0 -0.8 0.5 1.1 -4.0 -2.5 -1.1 0.1
Unemployment Rate 13.6 13.4 12.7 11.5 13.6 14.9 15.8 15.6
Inflation
HICP -1.5 0.4 0.6 1.6 -1.5 0.1 0.6 1
CPI -1.0 0.9 0.8 1.6 -1.0 0.7 0.9 1
House Prices -15.5 -13.4 -14.4 0.5 -15.5 -17.4 -18.8 0.5
Commercial Property -13 -2.5 1.5 1.5 -13 -22 1.5 1.5
Personal disposableIncome
-3.4 -1.4 0.1 2.4 -3.2 -3.9 -1.2 0.2
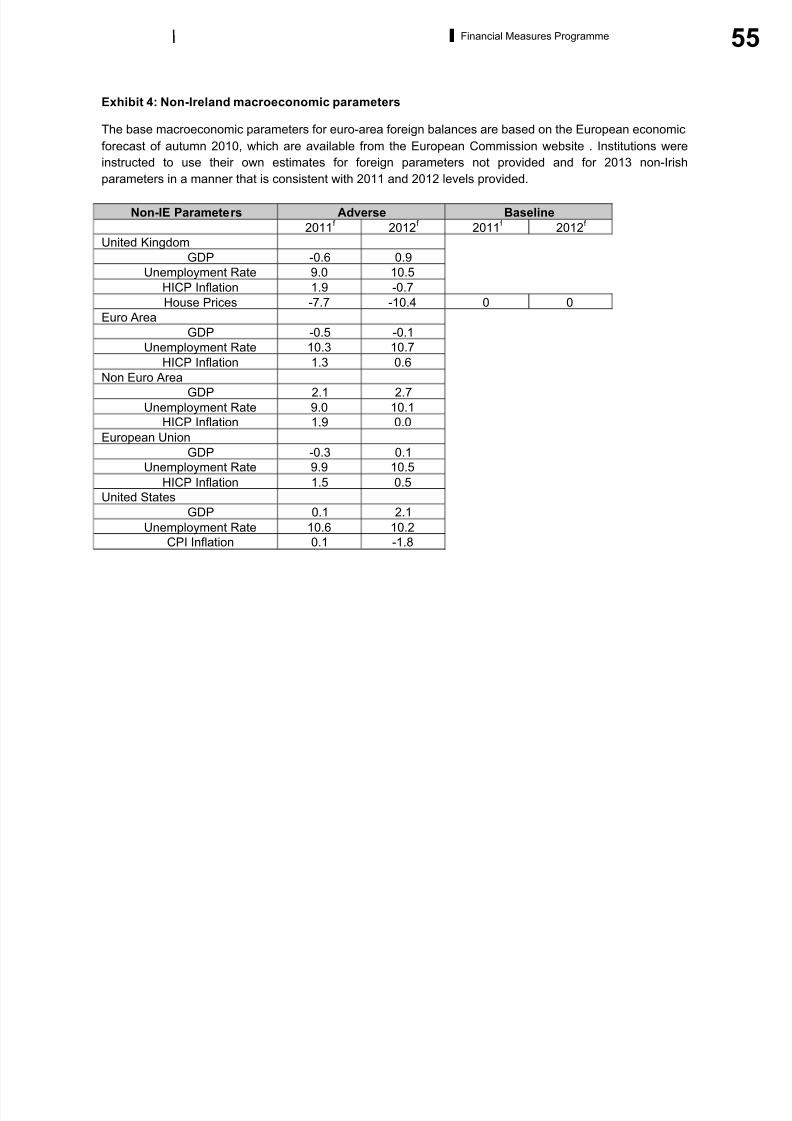
8/6/2019 The Financial Measures Programme Report
http://slidepdf.com/reader/full/the-financial-measures-programme-report 57/92
55Financial Measures Programme
Exhibit 4: Non-Ireland macroeconomic parameters
The base macroeconomic parameters for euro-area foreign balances are based on the European economic
forecast of autumn 2010, which are available from the European Commission website . Institutions were
instructed to use their own estimates for foreign parameters not provided and for 2013 non-Irish
parameters in a manner that is consistent with 2011 and 2012 levels provided.
Non-IE Parameters Adverse Baseline
2011f
2012f
2011f
2012f
United Kingdom
GDP -0.6 0.9
Unemployment Rate 9.0 10.5
HICP Inflation 1.9 -0.7
House Prices -7.7 -10.4 0 0
Euro Area
GDP -0.5 -0.1
Unemployment Rate 10.3 10.7
HICP Inflation 1.3 0.6
Non Euro Area
GDP 2.1 2.7Unemployment Rate 9.0 10.1
HICP Inflation 1.9 0.0
European Union
GDP -0.3 0.1
Unemployment Rate 9.9 10.5
HICP Inflation 1.5 0.5
United States
GDP 0.1 2.1
Unemployment Rate 10.6 10.2
CPI Inflation 0.1 -1.8
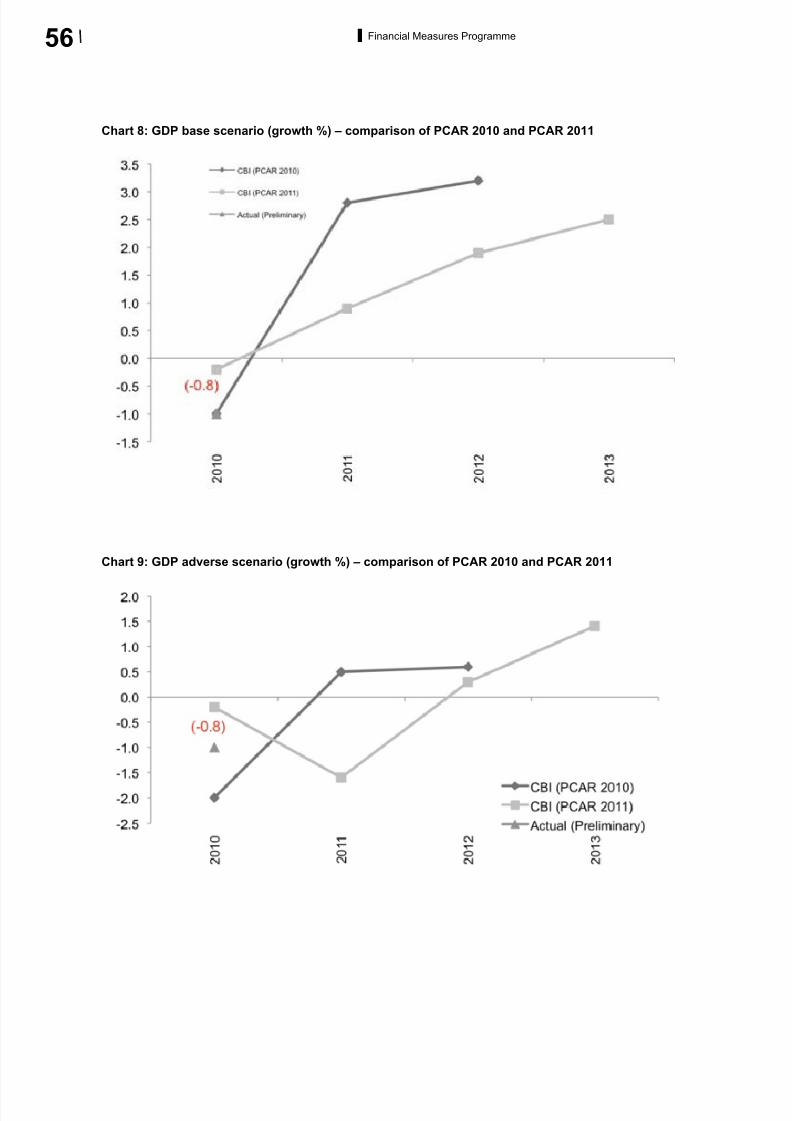
8/6/2019 The Financial Measures Programme Report
http://slidepdf.com/reader/full/the-financial-measures-programme-report 58/92
56 Financial Measures Programme
Chart 8: GDP base scenario (growth %) – comparison of PCAR 2010 and PCAR 2011
Chart 9: GDP adverse scenario (growth %) – comparison of PCAR 2010 and PCAR 2011
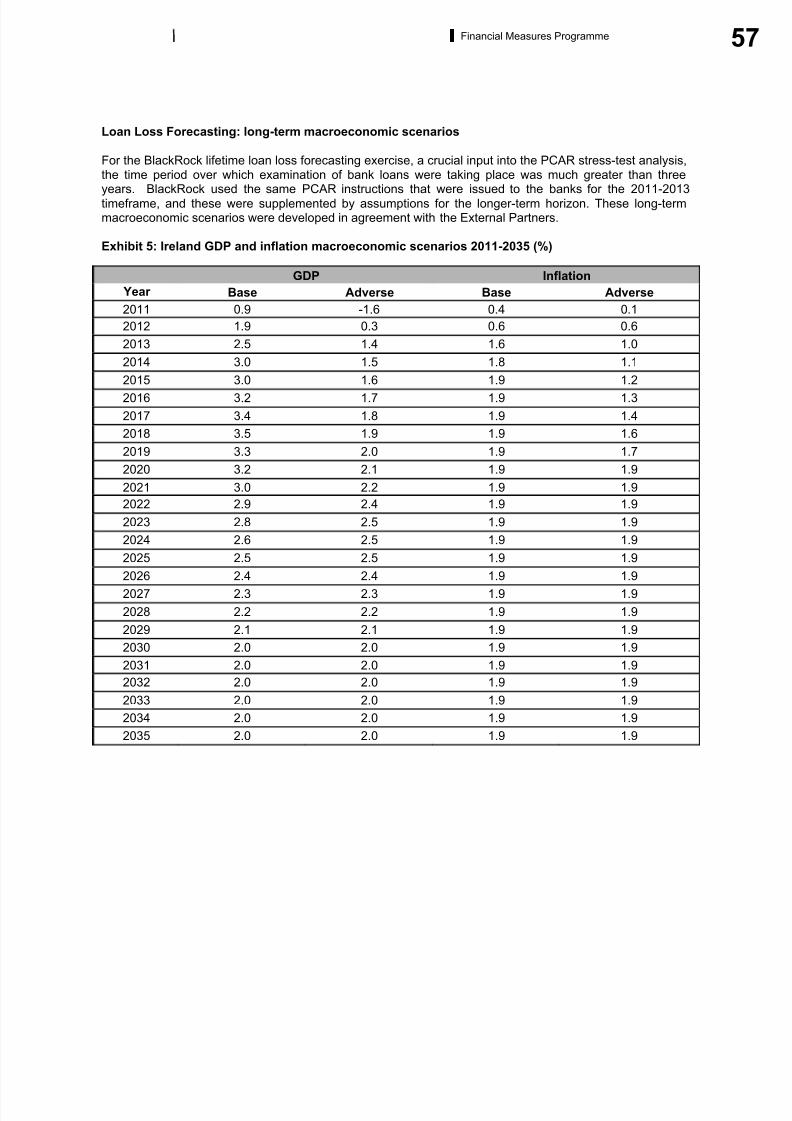
8/6/2019 The Financial Measures Programme Report
http://slidepdf.com/reader/full/the-financial-measures-programme-report 59/92
57Financial Measures Programme
Loan Loss Forecasting: long-term macroeconomic scenarios
For the BlackRock lifetime loan loss forecasting exercise, a crucial input into the PCAR stress-test analysis,the time period over which examination of bank loans were taking place was much greater than three
years. BlackRock used the same PCAR instructions that were issued to the banks for the 2011-2013timeframe, and these were supplemented by assumptions for the longer-term horizon. These long-termmacroeconomic scenarios were developed in agreement with the External Partners.
Exhibit 5: Ireland GDP and inflation macroeconomic scenarios 2011-2035 (%)
GDP Inflation
Year Base Adverse Base Adverse
2011 0.9 -1.6 0.4 0.1
2012 1.9 0.3 0.6 0.6
2013 2.5 1.4 1.6 1.0
2014 3.0 1.5 1.8 1.1
2015 3.0 1.6 1.9 1.2
2016 3.2 1.7 1.9 1.3
2017 3.4 1.8 1.9 1.4
2018 3.5 1.9 1.9 1.6
2019 3.3 2.0 1.9 1.7
2020 3.2 2.1 1.9 1.9
2021 3.0 2.2 1.9 1.9
2022 2.9 2.4 1.9 1.9
2023 2.8 2.5 1.9 1.9
2024 2.6 2.5 1.9 1.9
2025 2.5 2.5 1.9 1.9
2026 2.4 2.4 1.9 1.9
2027 2.3 2.3 1.9 1.9
2028 2.2 2.2 1.9 1.9
2029 2.1 2.1 1.9 1.9
2030 2.0 2.0 1.9 1.9
2031 2.0 2.0 1.9 1.9
2032 2.0 2.0 1.9 1.9
2033 2.0 2.0 1.9 1.9
2034 2.0 2.0 1.9 1.9
2035 2.0 2.0 1.9 1.9
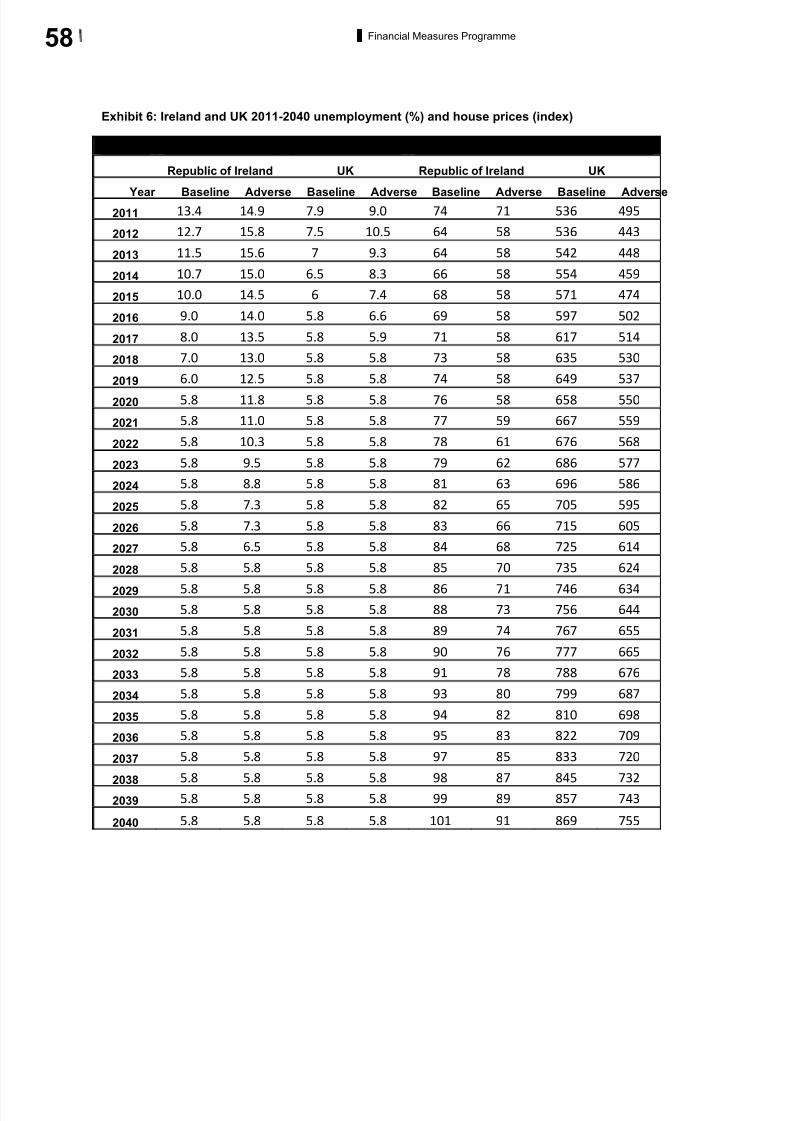
8/6/2019 The Financial Measures Programme Report
http://slidepdf.com/reader/full/the-financial-measures-programme-report 60/92
58 Financial Measures Programme
Exhibit 6: Ireland and UK 2011-2040 unemployment (%) and house prices (index)
Unemployment House Prices
Republic of Ireland UK Republic of Ireland UK
Year Baseline Adverse Baseline Adverse Baseline Adverse Baseline Adverse2011
2012
2013
2014
2015
2016
2017
2018
2019
2020
2021
2022
2023
2024
2025
2026
2027
2028
2029
2030
2031
2032
2033
2034
2035
2036
2037
2038
2039
2040
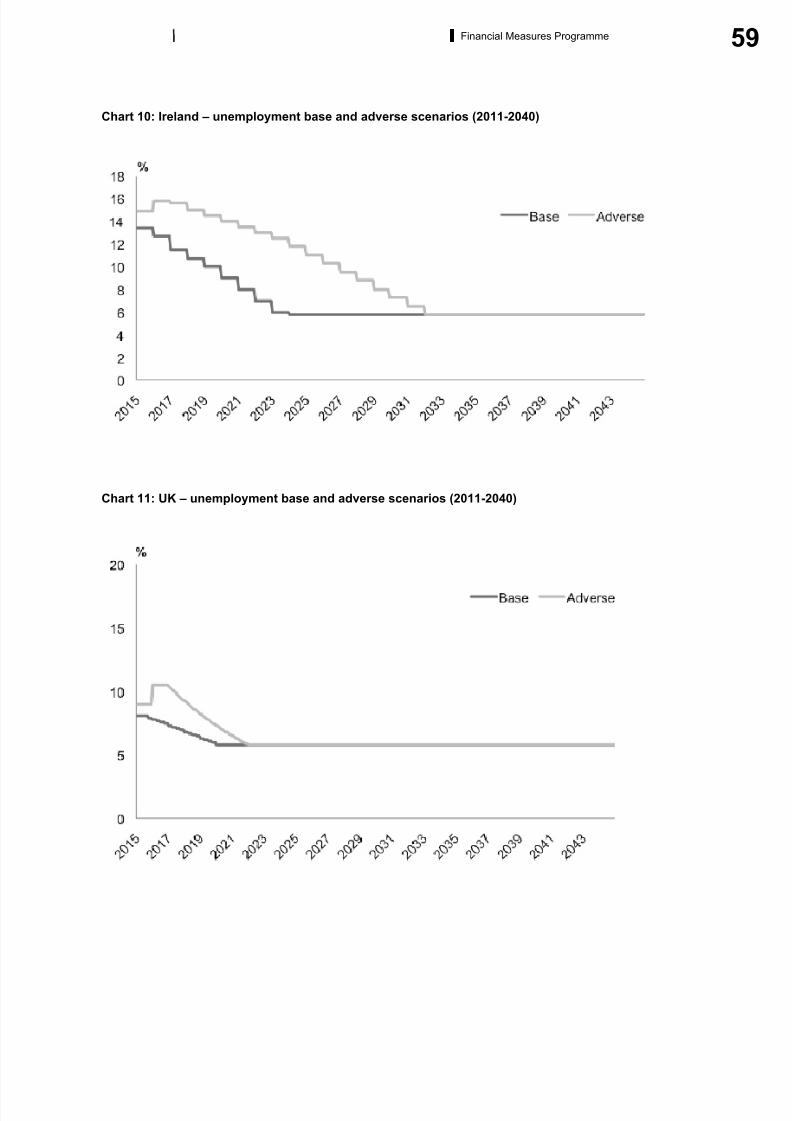
8/6/2019 The Financial Measures Programme Report
http://slidepdf.com/reader/full/the-financial-measures-programme-report 61/92
59Financial Measures Programme
Chart 10: Ireland – unemployment base and adverse scenarios (2011-2040)
Chart 11: UK – unemployment base and adverse scenarios (2011-2040)
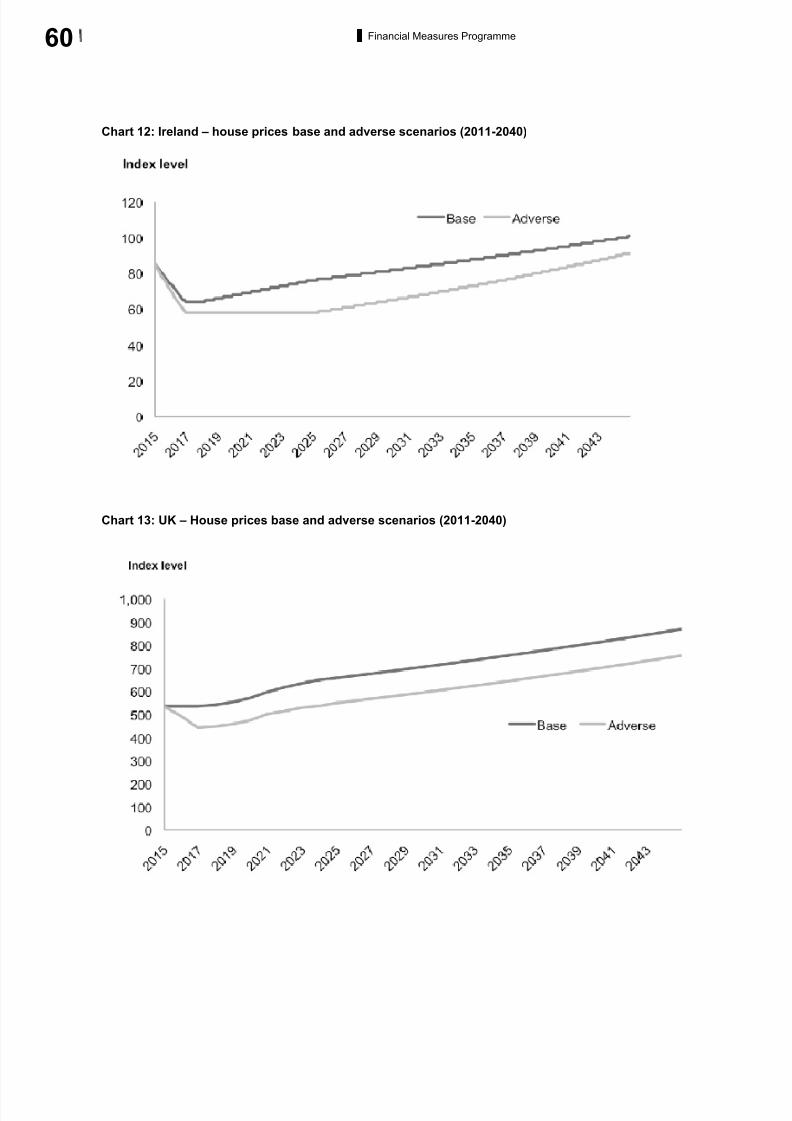
8/6/2019 The Financial Measures Programme Report
http://slidepdf.com/reader/full/the-financial-measures-programme-report 62/92
60 Financial Measures Programme
Chart 12: Ireland – house prices base and adverse scenarios (2011-2040)
Chart 13: UK – House prices base and adverse scenarios (2011-2040)
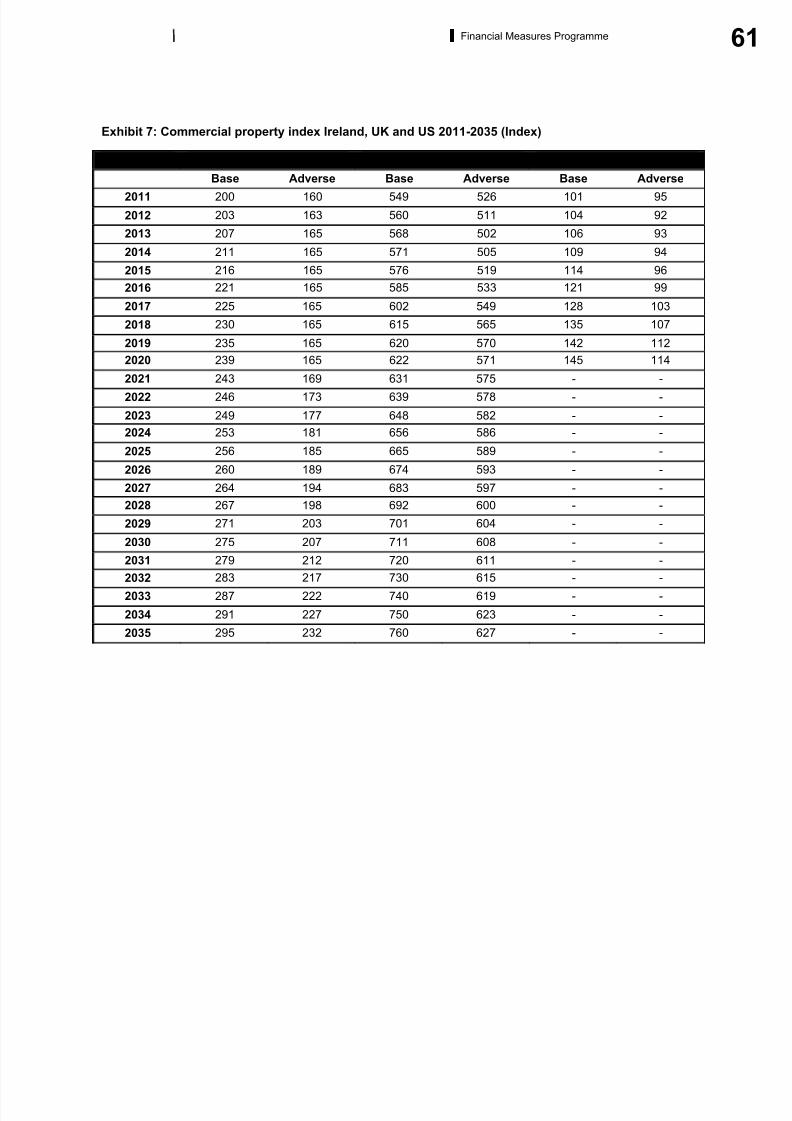
8/6/2019 The Financial Measures Programme Report
http://slidepdf.com/reader/full/the-financial-measures-programme-report 63/92
61Financial Measures Programme
Exhibit 7: Commercial property index Ireland, UK and US 2011-2035 (Index)
Ireland UK US
Base Adverse Base Adverse Base Adverse
2011 200 160 549 526 101 95
2012 203 163 560 511 104 92
2013 207 165 568 502 106 93
2014 211 165 571 505 109 94
2015 216 165 576 519 114 96
2016 221 165 585 533 121 99
2017 225 165 602 549 128 103
2018 230 165 615 565 135 107
2019 235 165 620 570 142 112
2020 239 165 622 571 145 114
2021 243 169 631 575 - -
2022 246 173 639 578 - -
2023 249 177 648 582 - -
2024 253 181 656 586 - -
2025 256 185 665 589 - -
2026 260 189 674 593 - -
2027 264 194 683 597 - -
2028 267 198 692 600 - -
2029 271 203 701 604 - -
2030 275 207 711 608 - -
2031 279 212 720 611 - -
2032 283 217 730 615 - -
2033 287 222 740 619 - -
2034 291 227 750 623 - -
2035 295 232 760 627 - -
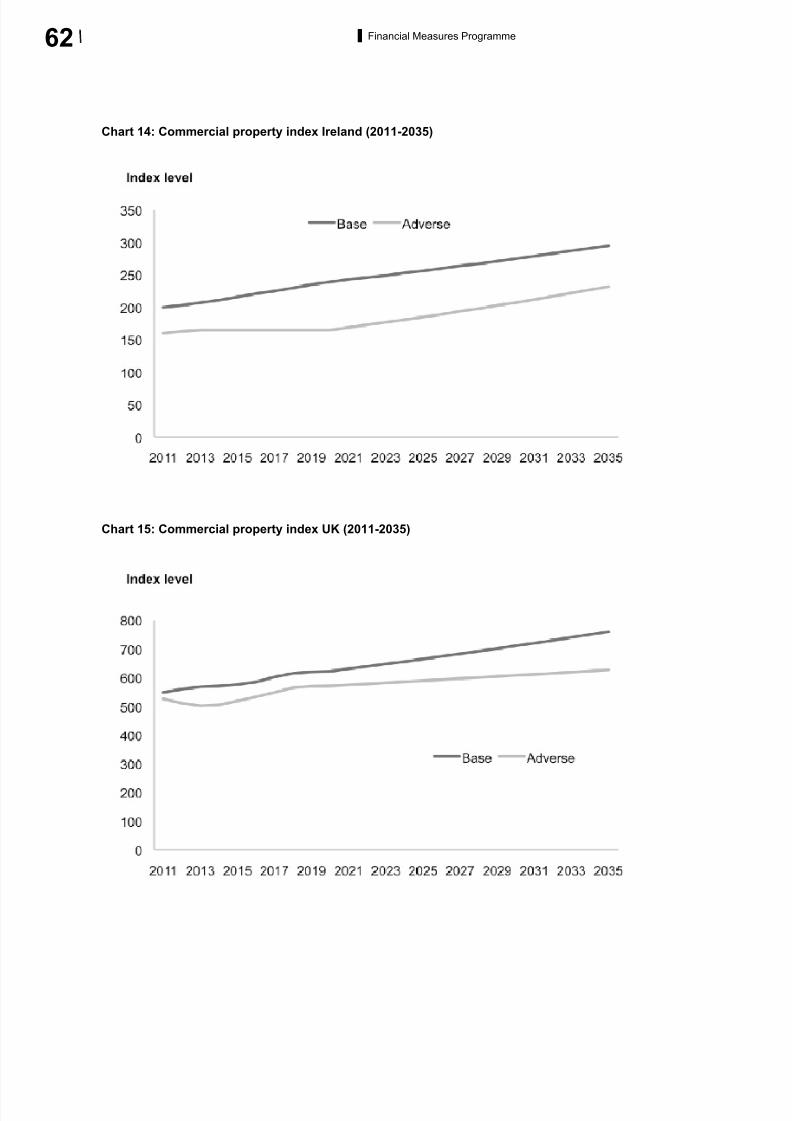
8/6/2019 The Financial Measures Programme Report
http://slidepdf.com/reader/full/the-financial-measures-programme-report 64/92
62 Financial Measures Programme
Chart 14: Commercial property index Ireland (2011-2035)
Chart 15: Commercial property index UK (2011-2035)
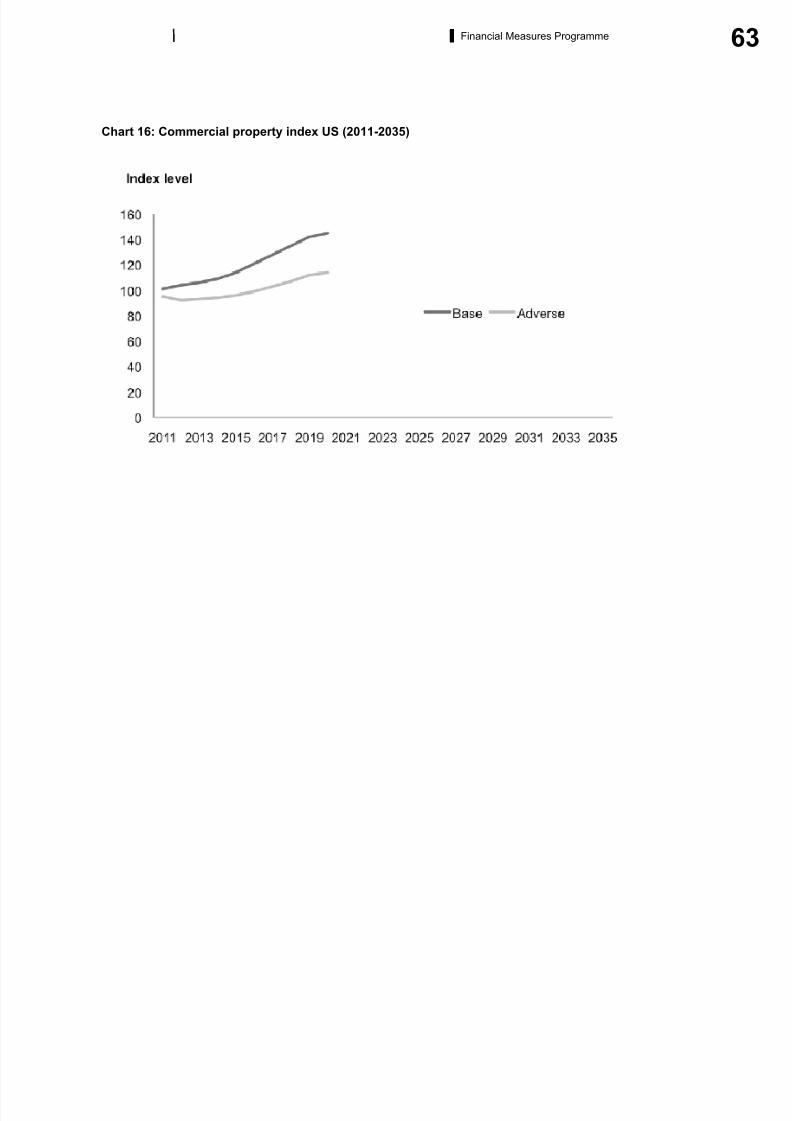
8/6/2019 The Financial Measures Programme Report
http://slidepdf.com/reader/full/the-financial-measures-programme-report 65/92
63Financial Measures Programme
Chart 16: Commercial property index US (2011-2035)
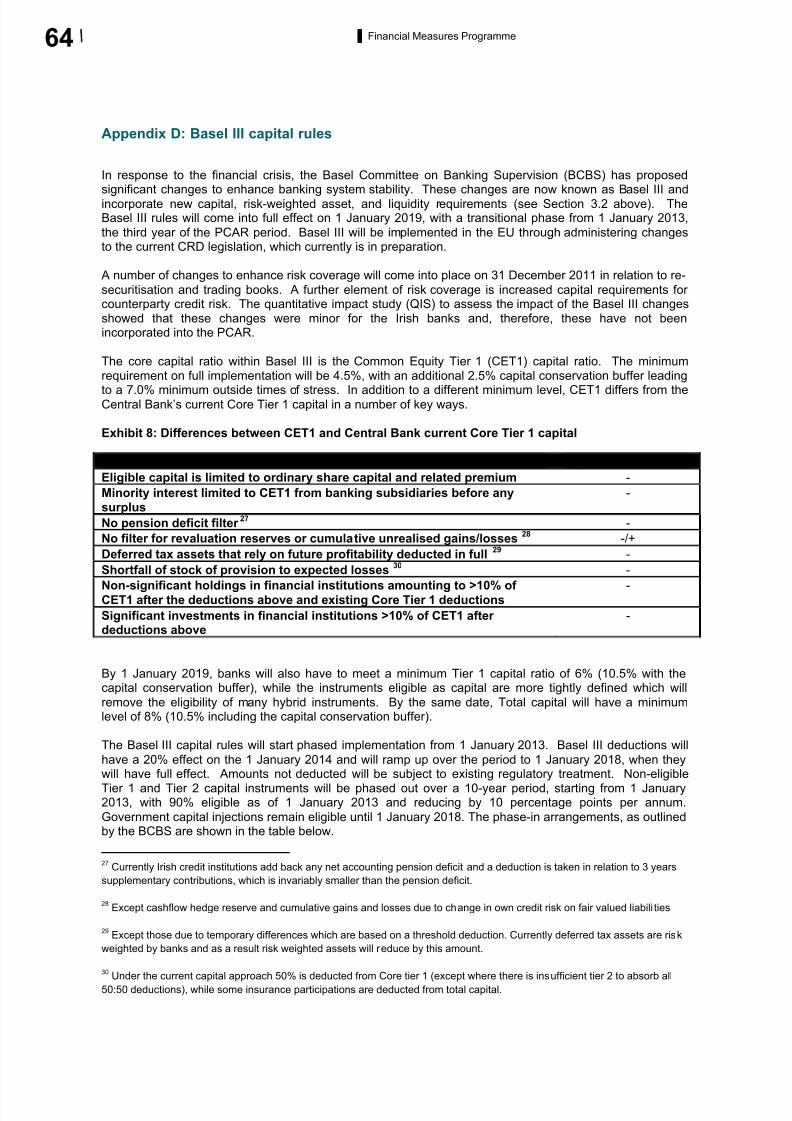
8/6/2019 The Financial Measures Programme Report
http://slidepdf.com/reader/full/the-financial-measures-programme-report 66/92
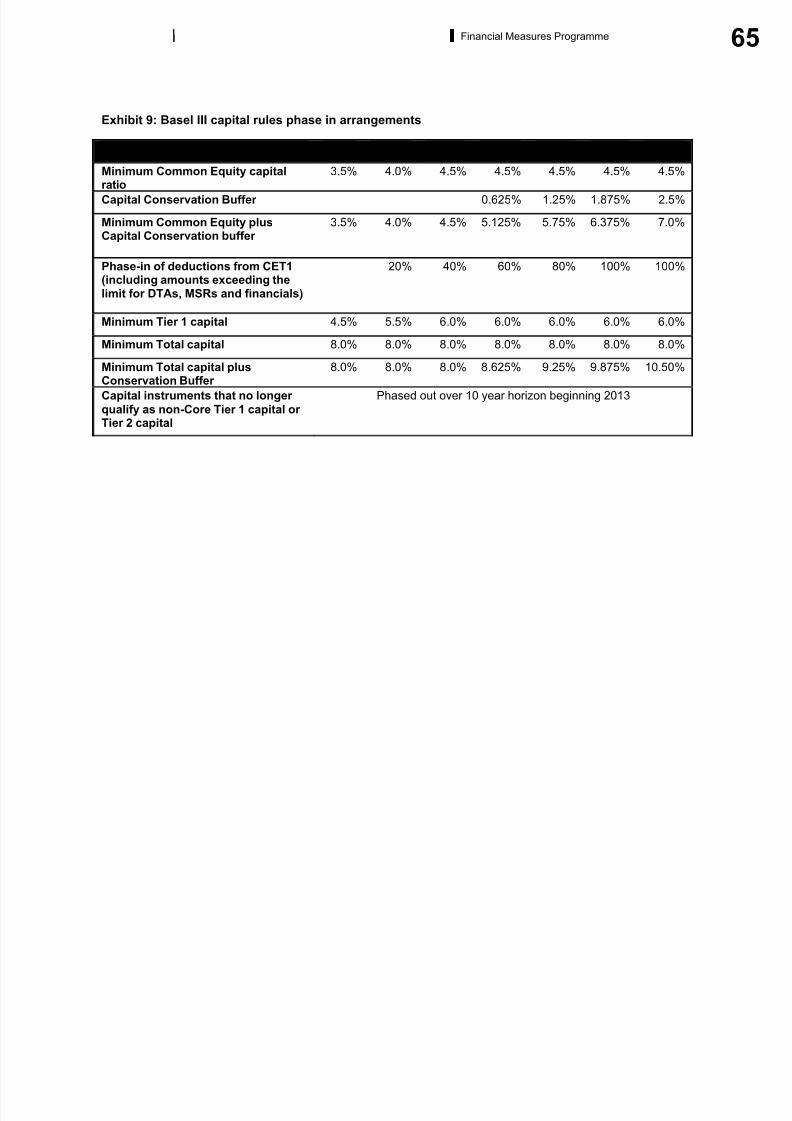
8/6/2019 The Financial Measures Programme Report
http://slidepdf.com/reader/full/the-financial-measures-programme-report 67/92
65Financial Measures Programme
Exhibit 9: Basel III capital rules phase in arrangements
1 January 2013 2014 2015 2016 2017 2018 2019
Minimum Common Equity capitalratio
3.5% 4.0% 4.5% 4.5% 4.5% 4.5% 4.5%
Capital Conservation Buffer 0.625% 1.25% 1.875% 2.5%
Minimum Common Equity plusCapital Conservation buffer
3.5% 4.0% 4.5% 5.125% 5.75% 6.375% 7.0%
Phase-in of deductions from CET1(including amounts exceeding thelimit for DTAs, MSRs and financials)
20% 40% 60% 80% 100% 100%
Minimum Tier 1 capital 4.5% 5.5% 6.0% 6.0% 6.0% 6.0% 6.0%
Minimum Total capital 8.0% 8.0% 8.0% 8.0% 8.0% 8.0% 8.0%
Minimum Total capital plusConservation Buffer
8.0% 8.0% 8.0% 8.625% 9.25% 9.875% 10.50%
Capital instruments that no longer
qualify as non-Core Tier 1 capital or Tier 2 capital
Phased out over 10 year horizon beginning 2013
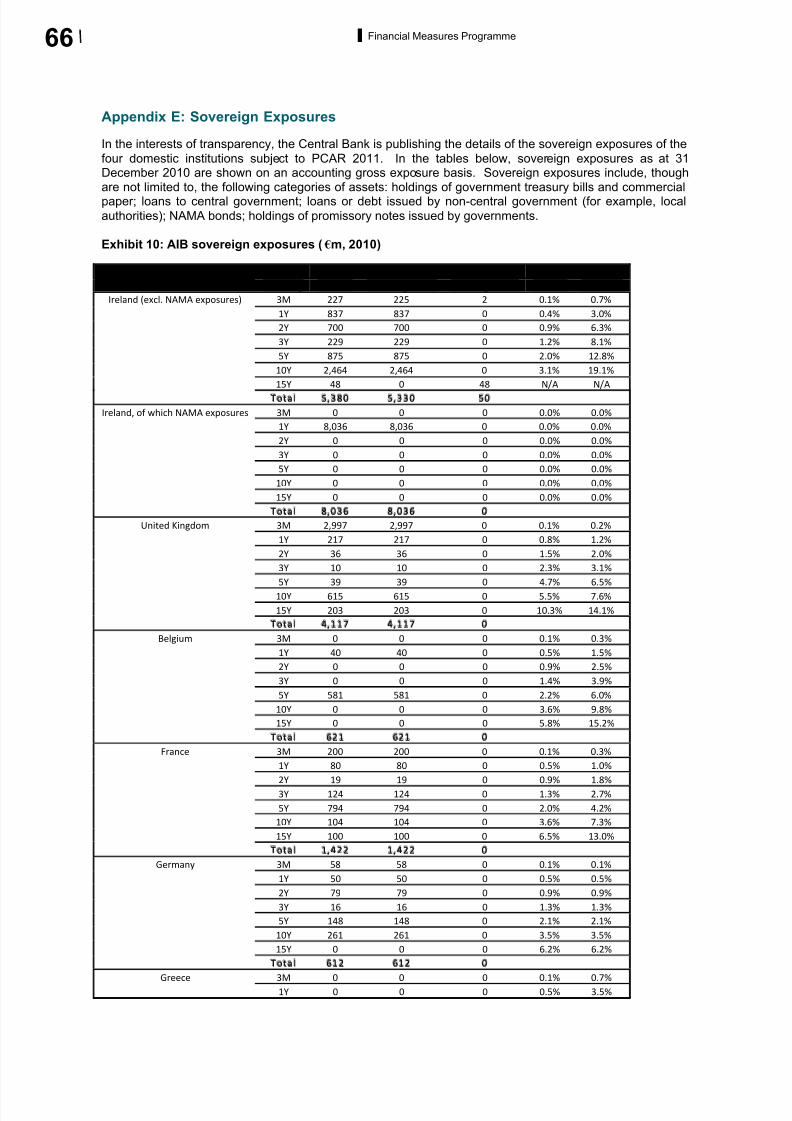
8/6/2019 The Financial Measures Programme Report
http://slidepdf.com/reader/full/the-financial-measures-programme-report 68/92
66 Financial Measures Programme
Appendix E: Sovereign Exposures
In the interests of transparency, the Central Bank is publishing the details of the sovereign exposures of the
four domestic institutions subject to PCAR 2011. In the tables below, sovereign exposures as at 31December 2010 are shown on an accounting gross exposure basis. Sovereign exposures include, thoughare not limited to, the following categories of assets: holdings of government treasury bills and commercialpaper; loans to central government; loans or debt issued by non-central government (for example, local
authorities); NAMA bonds; holdings of promissory notes issued by governments.
Exhibit 10: AIB sovereign exposures ( m, 2010)
m
Maturity Total Banking Book Trading Book Base Stress
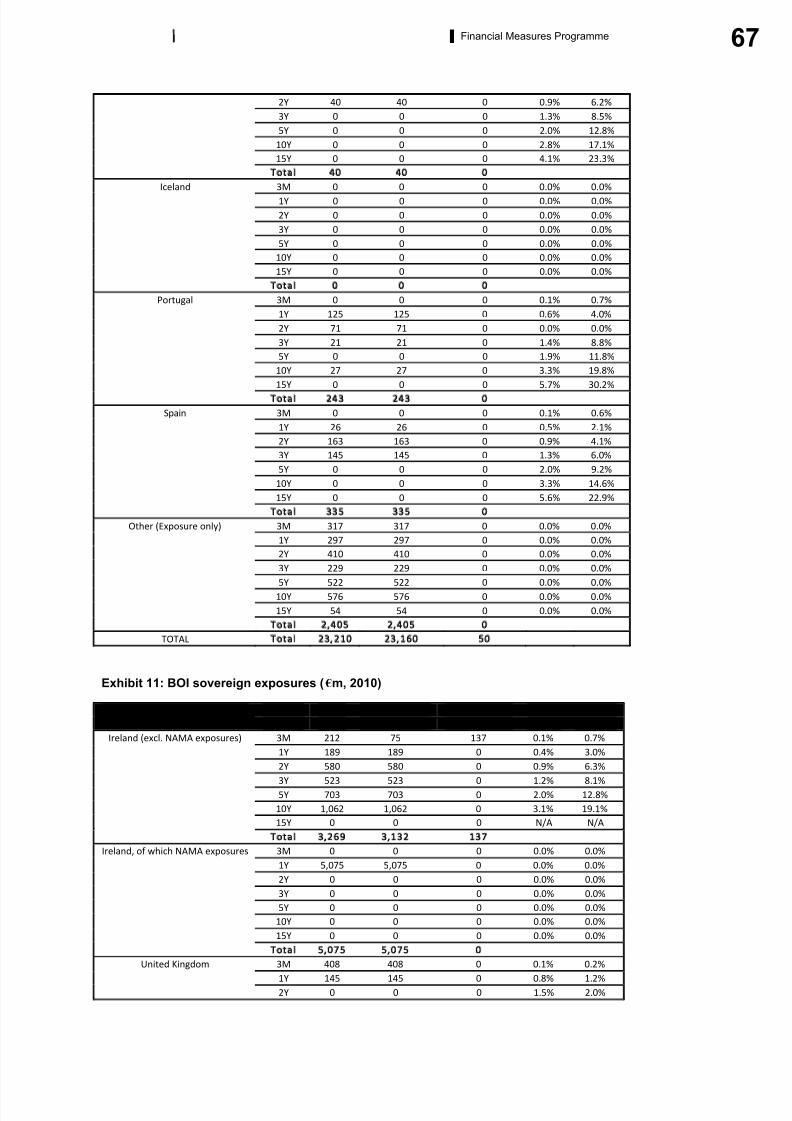
8/6/2019 The Financial Measures Programme Report
http://slidepdf.com/reader/full/the-financial-measures-programme-report 69/92
67Financial Measures Programme
Exhibit 11: BOI sovereign exposures ( m, 2010)
m
Maturity Total Banking Book Trading Book Base Stress
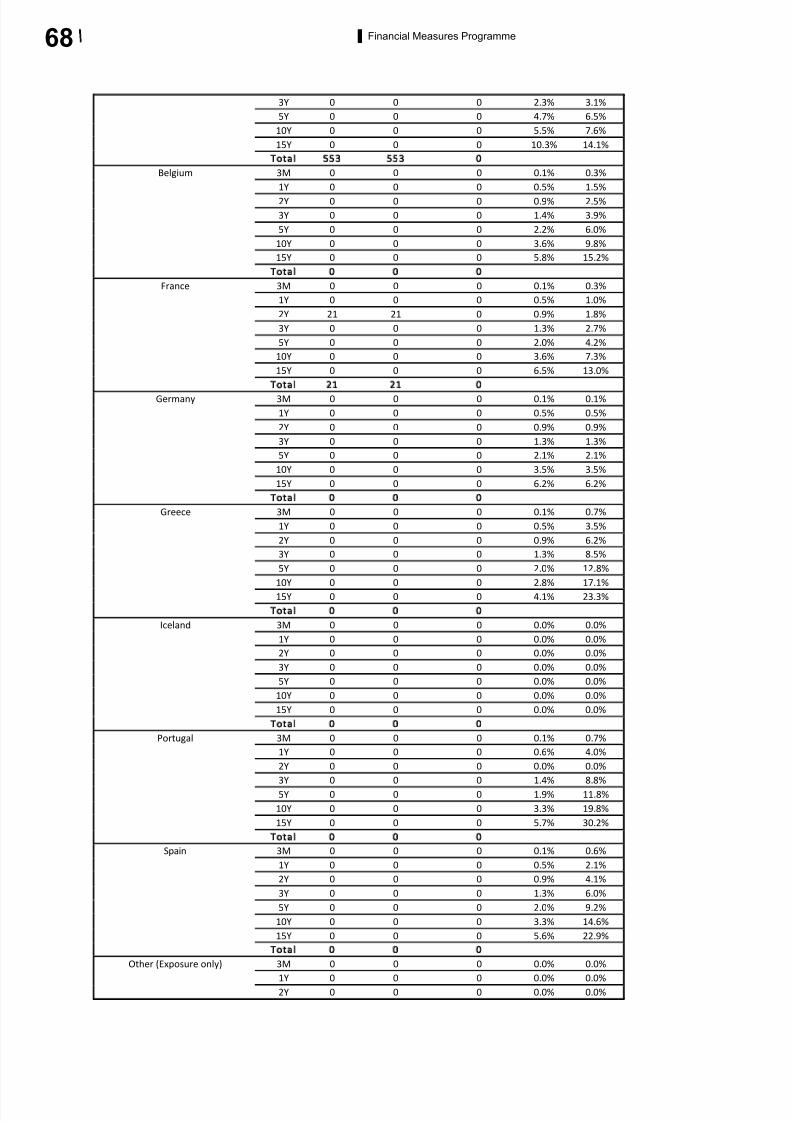
8/6/2019 The Financial Measures Programme Report
http://slidepdf.com/reader/full/the-financial-measures-programme-report 70/92
68 Financial Measures Programme
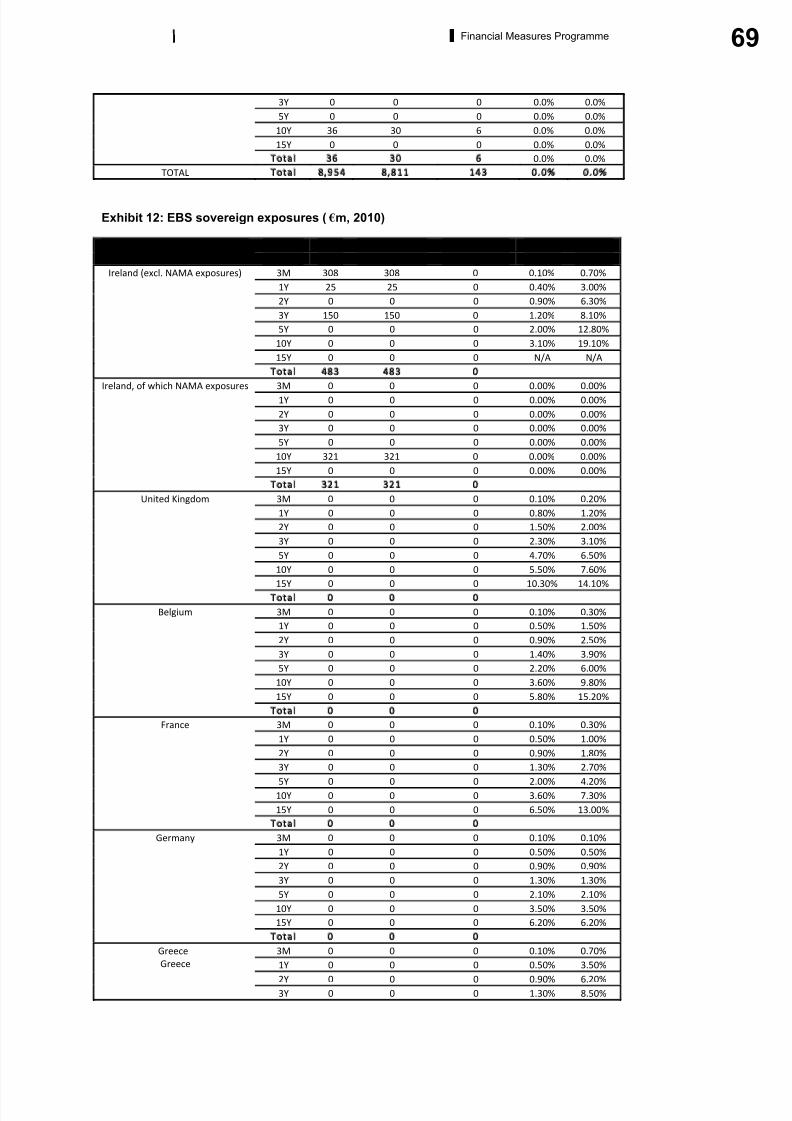
8/6/2019 The Financial Measures Programme Report
http://slidepdf.com/reader/full/the-financial-measures-programme-report 71/92
69Financial Measures Programme
Exhibit 12: EBS sovereign exposures ( m, 2010)
m
Maturity Total Banking Book Trading Book Base Stress
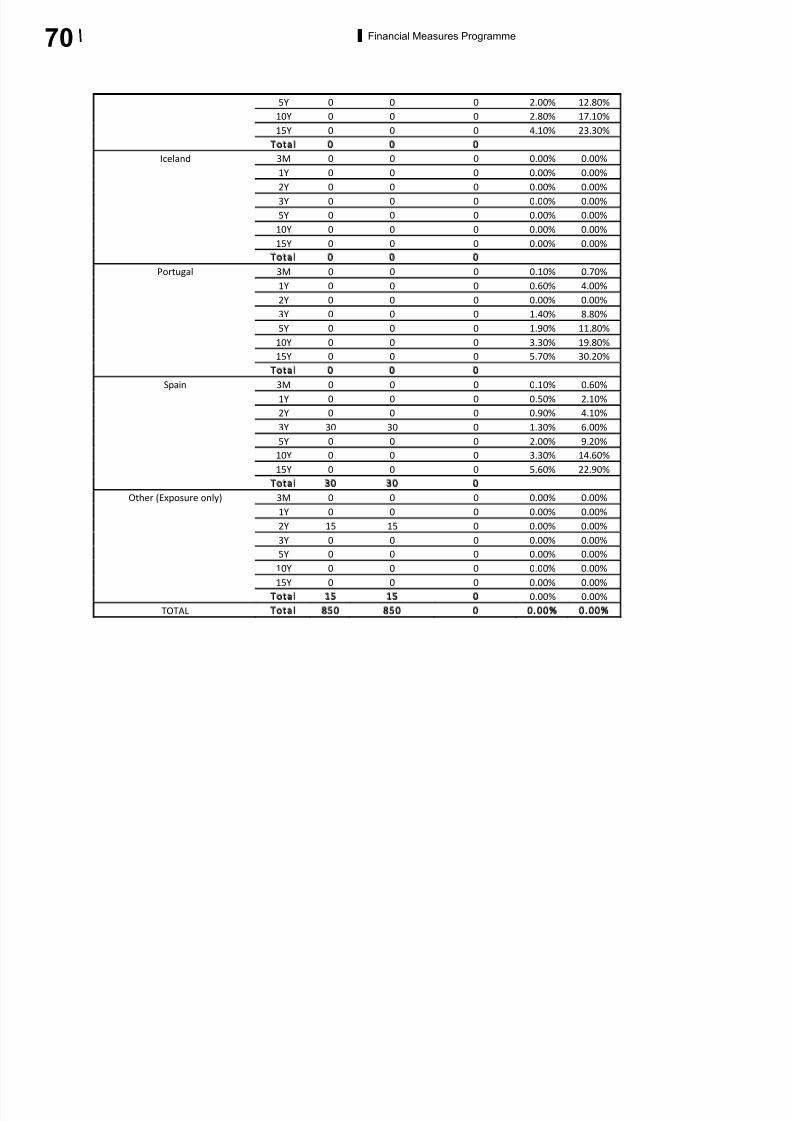
8/6/2019 The Financial Measures Programme Report
http://slidepdf.com/reader/full/the-financial-measures-programme-report 72/92
70 Financial Measures Programme
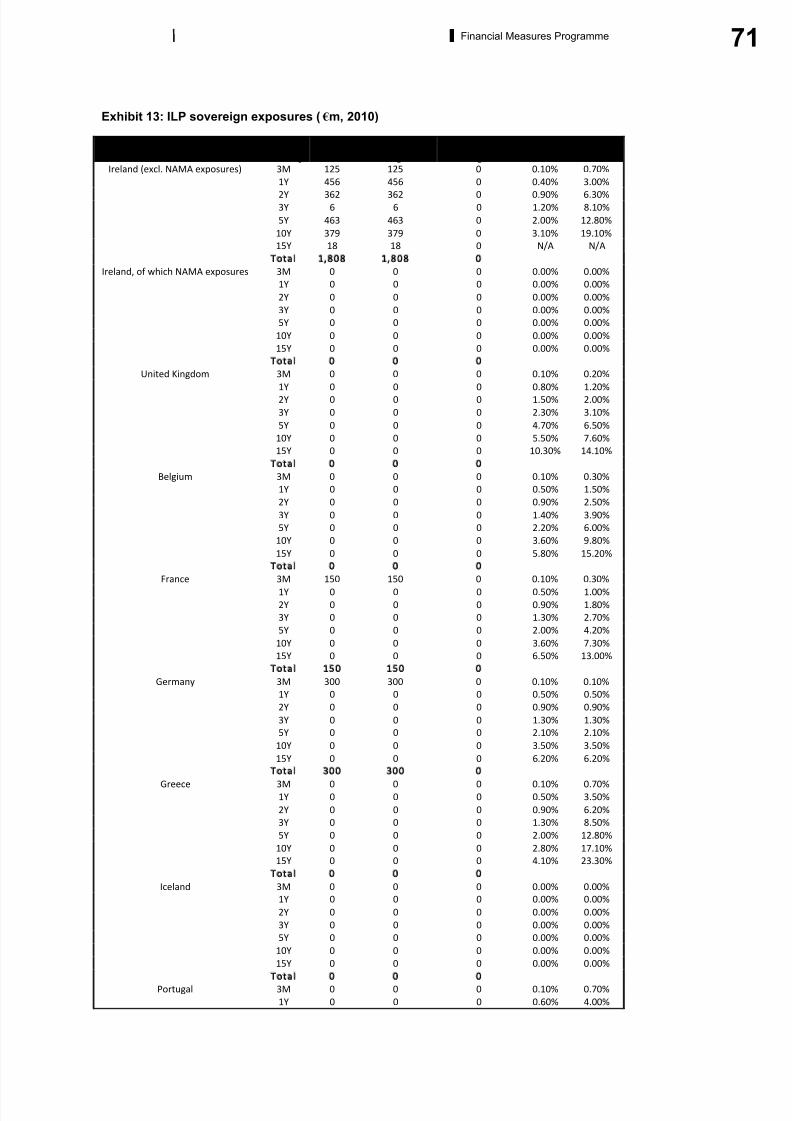
8/6/2019 The Financial Measures Programme Report
http://slidepdf.com/reader/full/the-financial-measures-programme-report 73/92
71Financial Measures Programme
Exhibit 13: ILP sovereign exposures ( m, 2010)
m
Maturity Total Banking Book Trading Book Base Stress
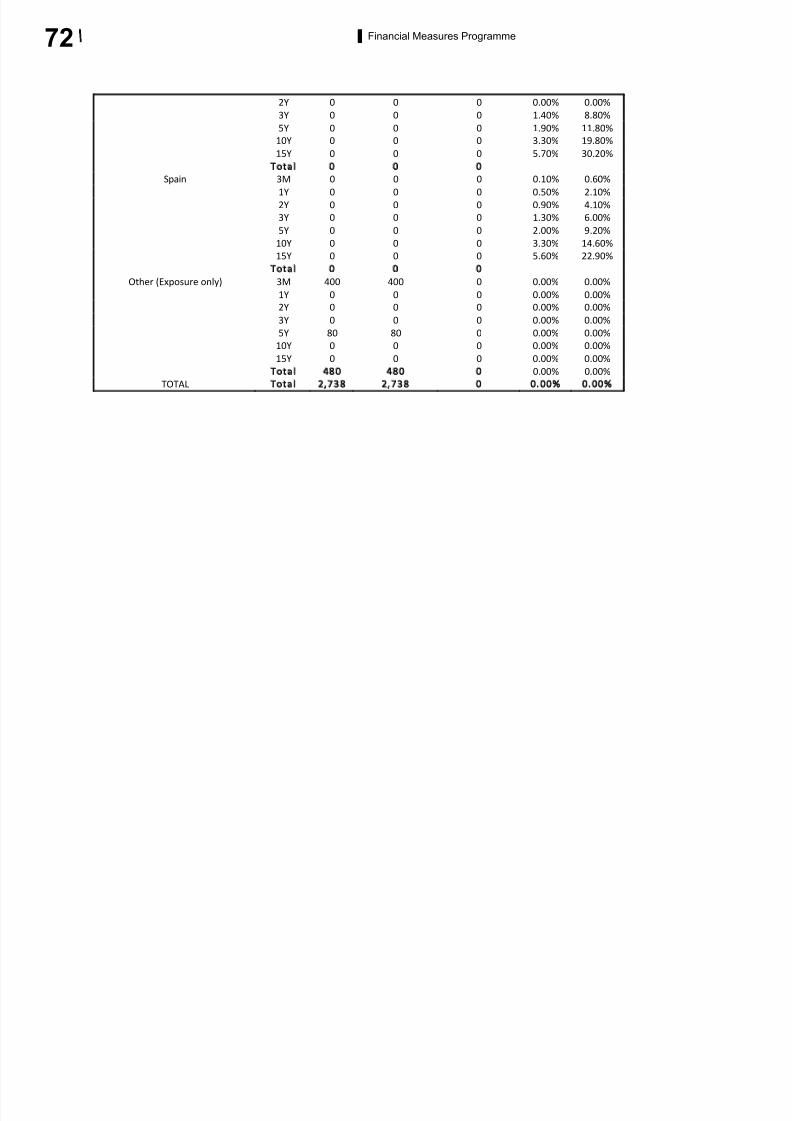
8/6/2019 The Financial Measures Programme Report
http://slidepdf.com/reader/full/the-financial-measures-programme-report 74/92
72 Financial Measures Programme
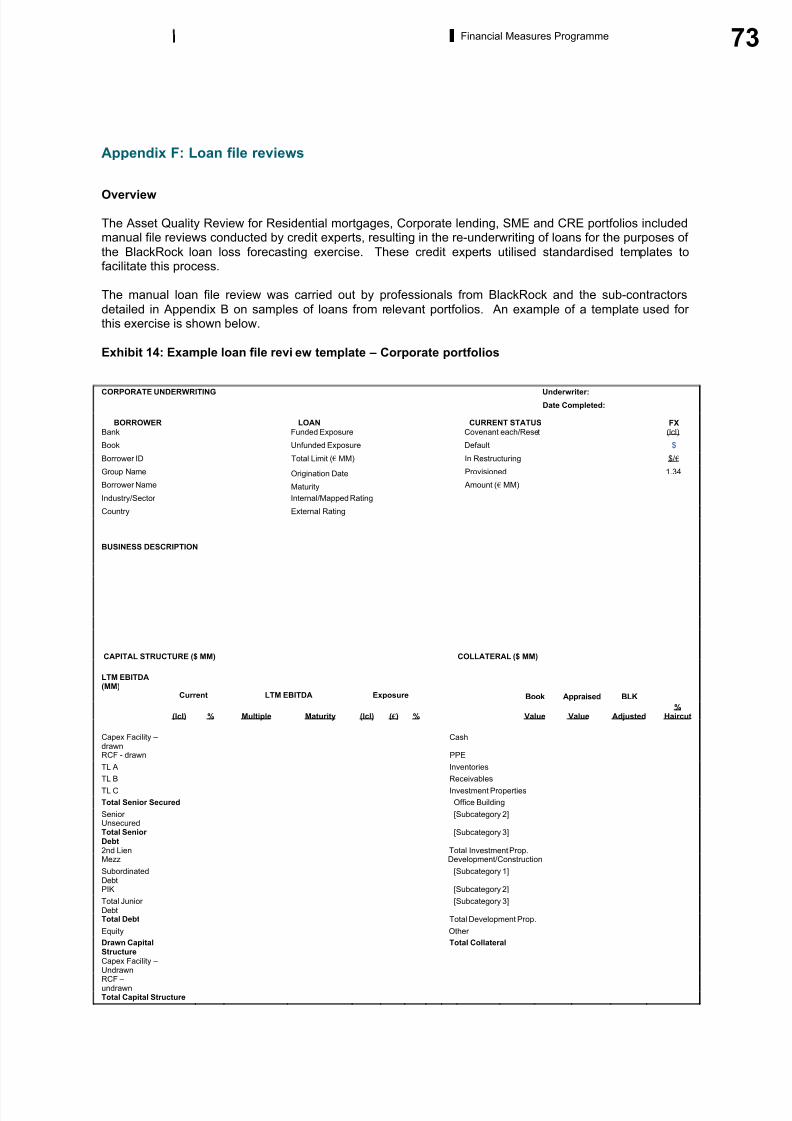
8/6/2019 The Financial Measures Programme Report
http://slidepdf.com/reader/full/the-financial-measures-programme-report 75/92
73Financial Measures Programme
Appendix F: Loan file reviews
Overview
The Asset Quality Review for Residential mortgages, Corporate lending, SME and CRE portfolios includedmanual file reviews conducted by credit experts, resulting in the re-underwriting of loans for the purposes of the BlackRock loan loss forecasting exercise. These credit experts utilised standardised templates tofacilitate this process.
The manual loan file review was carried out by professionals from BlackRock and the sub-contractorsdetailed in Appendix B on samples of loans from relevant portfolios. An example of a template used for this exercise is shown below.
Exhibit 14: Example loan file review template – Corporate portfolios
CORPORATE UNDERWRITING Underwriter:
Date Completed:
BORROWER LOAN CURRENT STATUS FXBank Funded Exposure Covenant each/Reset (lcl)
Book Unfunded Exposure Default $
Borrower ID Total Limit ( MM) In Restructuring $/
Group Name Origination Date Provisioned 1.34
Borrower Name Maturity Amount ( MM)
Industry/Sector Internal/Mapped Rating
Country External Rating
BUSINESS DESCRIPTION
CAPITAL STRUCTURE ($ MM) COLLATERAL ($ MM)
LTM EBITDA(MM)
Current LTM EBITDA Exposure Book Appraised BLK
(lcl) % Multiple Maturity (lcl) ( ) % Value Value Adjusted%
Haircut
Capex Facility –drawn
Cash
RCF - drawn PPE
TL A Inventories
TL B ReceivablesTL C Investment Properties
Total Senior Secured Office Building
Senior Unsecured
[Subcategory 2]
Total Senior Debt
[Subcategory 3]
2nd Lien Total Investment Prop.Mezz Development/Construction
SubordinatedDebt
[Subcategory 1]
PIK [Subcategory 2]
Total Junior Debt
[Subcategory 3]
Total Debt Total Development Prop.
Equity Other
Drawn CapitalStructure
Total Collateral
Capex Facility –UndrawnRCF –undrawnTotal Capital Structure

8/6/2019 The Financial Measures Programme Report
http://slidepdf.com/reader/full/the-financial-measures-programme-report 76/92
74 Financial Measures Programme
FINANCIAL OVERVIEW ($ MM) DEBT CAPACITY/ RECOVERY ($ MM)
Multiple
BLK PF BLK Sustainable FCF
2007 2008 6m '09 Sustainable Comments Financing Term
(June
YE)
(June
YE) (annualised)
Amount Bullet
Revenues Coupon
% Growth Debt Capacity
Gross Profit Leverage Ratio
EBITDA Implied Equity Value
% Margin Enterprise Value
- Capex
- Tax Expected Debt Amortisation
-/+ Changein WC
Value to Lenders
+ Material Non Cash
- Material NonRecurring Total 0 %
Free CashFlow Cap Struct (lcl) ( ) Recovery% Margin Recovery Senior
SecuredRecovery Senior Unsecured
Net Interest Expense Recovery Junior
Capex Facility Undrawn
Total Recovery
FCF Interest Cover Implied Loss
Debt toEBITDA
Total
RISK OVERVIEW
BLK VALUATION SUMMARY BLK LOSS PROJECTIONS (£ MM)
Base Case Expected Loss 0%
Amount 0.0
Timing 0
8/6/2019 The Financial Measures Programme Report
http://slidepdf.com/reader/full/the-financial-measures-programme-report 77/92
75Financial Measures Programme
Appendix G: Assessor report
Background
The MoU set out two structural benchmarks related to bank recapitalisation to be completed by the CentralBank by 31 March 2011:
The Prudential Capital Assessment Review for 2011.
To support the PCAR, a diagnostic evaluation of the integrity of banks’ financial reporting and the
credit quality of banks’ assets.
To complete these reviews, the MoU specified that the Central Bank should hire an internationally
recognised consulting firm to review banks' data and asset quality from the bottom up; and, in addition, anindependent, specialised firm to “oversee the consistency and integrity of the exercise”. In December 2010, the Central Bank appointed BlackRock Solutions to conduct the bottom-up review, and The BostonConsulting Group to oversee, or assess, the review.
Pursuant to the terms of the MoU, BlackRock reviewed the data and asset quality of four institutions: AIB,BOI, EBS and ILP.
BlackRock’s analysis covered the asset portfolios at each of the banks, comprising: Residential mortgages;Commercial real estate loans; Corporate lending; Small and medium enterprise lending; Non-mortgageconsumer and other lending (such as auto loans or credit cards); and Securities and derivatives.
BlackRock framework
BlackRock structured its analysis into three streams of work:
1. Data integrity and verification (“DIV”): An assessment of the sufficiency, quality, and validity of data
housed on bank systems as compared to official books and records.
2. Asset quality review (“AQR”): An assessment of the quality of banks’ individual assets, and of the
processes for establishing and monitoring asset quality.
o Legal review: A review of legal issues related to the enforcement of collateral claims.
3. Loan loss forecasting (“LLF”): An estimate of three-year and lifetime annual principal losses in both
the base and adverse macroeconomic scenarios.
Assessment process
BCG supervised, challenged and provided opinions on the work that BlackRock and its sub-contractorscompleted within each of the three workstreams, for each of the four institutions. It began its assessmentprocess on 23 December 2010 and concluded on 31 March 2011.
The assessment had four dimensions, which BCG generated from a variety of sources, outlined in theexhibit below.
In addition, BlackRock hosted numerous sessions for the Central Bank and other government agencies,the External Partners and the four banks to explain its methodologies, assumptions and the results. BCGattended these sessions to ensure that any questions or concerns raised were appropriately addressed.
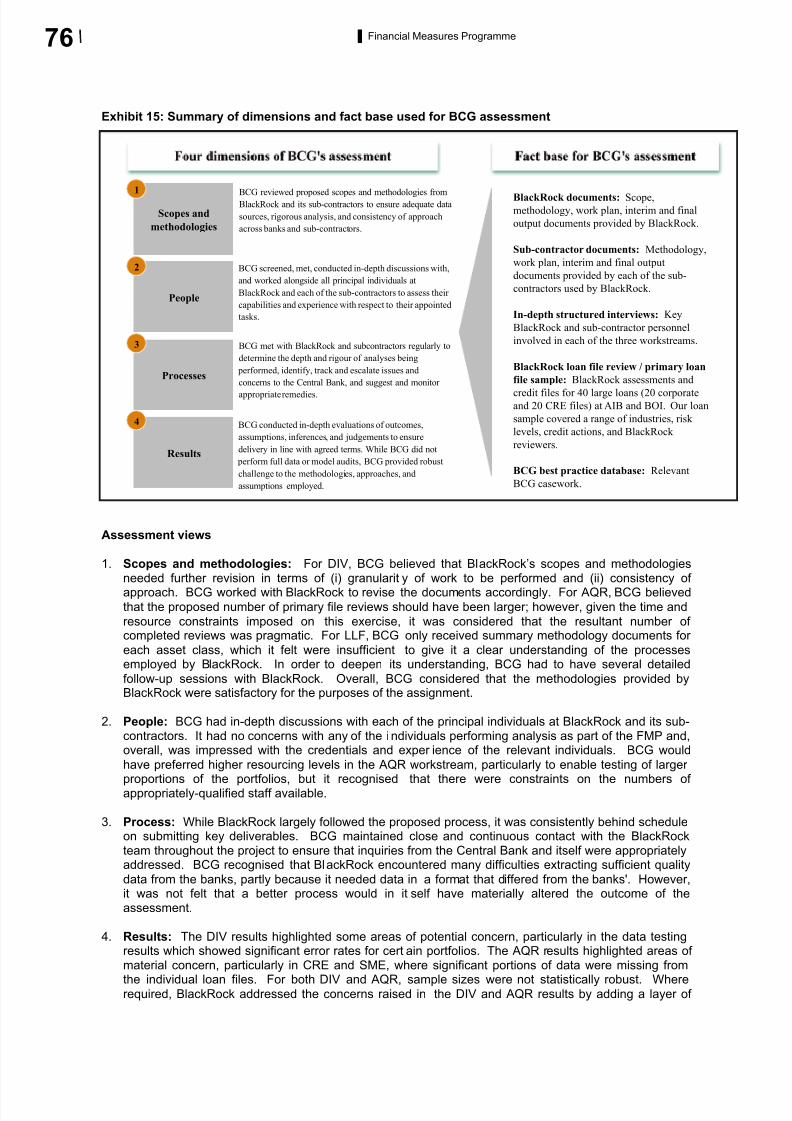
8/6/2019 The Financial Measures Programme Report
http://slidepdf.com/reader/full/the-financial-measures-programme-report 78/92
76 Financial Measures Programme
Exhibit 15: Summary of dimensions and fact base used for BCG assessment
Assessment views
1. Scopes and methodologies: For DIV, BCG believed that BlackRock’s scopes and methodologiesneeded further revision in terms of (i) granularity of work to be performed and (ii) consistency of approach. BCG worked with BlackRock to revise the documents accordingly. For AQR, BCG believed
that the proposed number of primary file reviews should have been larger; however, given the time and
resource constraints imposed on this exercise, it was considered that the resultant number of completed reviews was pragmatic. For LLF, BCG only received summary methodology documents for
each asset class, which it felt were insufficient to give it a clear understanding of the processesemployed by BlackRock. In order to deepen its understanding, BCG had to have several detailed
follow-up sessions with BlackRock. Overall, BCG considered that the methodologies provided byBlackRock were satisfactory for the purposes of the assignment.
2. People: BCG had in-depth discussions with each of the principal individuals at BlackRock and its sub-contractors. It had no concerns with any of the individuals performing analysis as part of the FMP and,overall, was impressed with the credentials and exper ience of the relevant individuals. BCG would
have preferred higher resourcing levels in the AQR workstream, particularly to enable testing of larger
proportions of the portfolios, but it recognised that there were constraints on the numbers of appropriately-qualified staff available.
3. Process: While BlackRock largely followed the proposed process, it was consistently behind scheduleon submitting key deliverables. BCG maintained close and continuous contact with the BlackRockteam throughout the project to ensure that inquiries from the Central Bank and itself were appropriatelyaddressed. BCG recognised that BlackRock encountered many difficulties extracting sufficient quality
data from the banks, partly because it needed data in a format that differed from the banks'. However,it was not felt that a better process would in itself have materially altered the outcome of theassessment.
4. Results: The DIV results highlighted some areas of potential concern, particularly in the data testingresults which showed significant error rates for certain portfolios. The AQR results highlighted areas of material concern, particularly in CRE and SME, where significant portions of data were missing from
the individual loan files. For both DIV and AQR, sample sizes were not statistically robust. Whererequired, BlackRock addressed the concerns raised in the DIV and AQR results by adding a layer of
Four dimensions of BCG's assessment Fact base for BCG's assessment
Scopes and
methodologies
People
Processes
Results
1
2
3
4
BCG reviewed proposed scopes and methodologies fromBlackRock and its sub-contractors to ensure adequate data
sources, rigorous analysis, and consistency of approach
across banks and sub-contractors.
BCG screened, met, conducted in-depth discussions with,
and worked alongside all principal individuals at
BlackRock and each of the sub-contractors to assess their
capabilities and experience with respect to their appointed
tasks.
BCG met with BlackRock and subcontractors regularly to
determine the depth and rigour of analyses being
performed, identify, track and escalate issues and
concerns to the Central Bank, and suggest and monitor
appropriate remedies.
BCG conducted in-depth evaluations of outcomes,
assumptions, inferences, and judgements to ensure
delivery in line with agreed terms. While BCG did not
perform full data or model audits, BCG provided robust
challenge to the methodologies, approaches, and
assumptions employed.
BlackRock documents: Scope,methodology, work plan, interim and final
output documents provided by BlackRock.
Sub-contractor documents: Methodology,
work plan, interim and final output
documents provided by each of the sub-
contractors used by BlackRock.
In-depth structured interviews: Key
BlackRock and sub-contractor personnel
involved in each of the three workstreams.
BlackRock loan file review / primary loan
file sample: BlackRock assessments and
credit files for 40 large loans (20 corporateand 20 CRE files) at AIB and BOI. Our loan
sample covered a range of industries, risk
levels, credit actions, and BlackRock
reviewers.
BCG best practice database: Relevant
BCG casework.

8/6/2019 The Financial Measures Programme Report
http://slidepdf.com/reader/full/the-financial-measures-programme-report 79/92
77Financial Measures Programme
conservatism to its projections (for example, in its treatment of missing data in the CRE and SME
portfolios). For the most part, the findings from the DIV and AQR work were complementary to thefindings from the LLF work, rather than raising new issues.
For LLF, BCG noted that other approaches to forecasting losses could have been used. BCG is
satisfied that the approaches taken by BlackRock were appropriate given the mandate and timeconstraints. It was recognised that a comprehensive loan-by-loan approach, such as that used for Residential mortgages, would likely have garnered more accurate results had it been applied across allportfolios, and would have possibly resulted in fewer conservative assumptions. BCG believed the
assumptions made by BlackRock were generally both reasonable and conservative. However, it notedthat the results were sensitive to some key assumptions and should be viewed in that context.
BCG noted that BlackRock had an internal quality assurance system in place, which effectively
identified and remediated issues. BCG believed it unlikely that material errors remained due to themitigating effects of the DIV and AQR exercises combined with the close examination that the
forecasts received from BlackRock, the Central Bank and other government agencies, the banks, andBCG itself. However, BCG cannot completely confirm this as, in line with its mandate, it did not
complete an audit of BlackRock’s underlying models.
Following its detailed assessment, BCG believed that the approaches taken by BlackRock were
satisfactory, and believed that the results were appropriately conservative, in line with BlackRock’s terms of reference.
8/6/2019 The Financial Measures Programme Report
http://slidepdf.com/reader/full/the-financial-measures-programme-report 80/92
78 Financial Measures Programme
Appendix H: PLAR liquidity targets – assumptions, approach and methodology
Funding Assumptions
In order to inform the setting of target funding metrics, the PLAR required banks to forecast detailedfunding profiles to end-2013. To ensure consistent and plausible assumptions around both the sources
and costs of funding, the Central Bank provided specific assumptions for banks to reflect in their forecasts.These instructions were consistent across the PLAR and the PCAR. The full details of these assumptionsare contained in Appendix C.
A maximum annual growth in deposits of 0% was specified (with specific limited exceptions to reflect, for example, deposit transfers carried out in February 2011), based on a conservative projection of the marketgrowth rate. The primary funding target set for the banks was the Loan to Deposit Ratio, which could beachieved through either loan reduction or customer deposit growth. By ensuring that the assumptions
around customer deposit growth were prudent and reflected the limited overall size of the market, therequired level of loan deleveraging could be better assessed.
The Central Bank also imposed strict restrictions on assumptions of how much growth could be achieved inwholesale funding markets and how much of this could be term (greater than one year) maturities. Thiswas to reflect the reality of current market conditions and of the banks’ credit ratings. From these, morerealistic future funding mixes could be forecast.
Instructions provided on cost of funds assumptions were designed to ensure that appropriate interestexpense was assumed in both base and stress scenarios. Underlying curve levels were prescribed basedon actual market curves, with additional upward shifts specified for the stress scenario. The banks were
instructed to assume that funding margins would stay at the elevated levels of Q4 2010 or higher based ontheir own assessment. A similarly conservative approach was taken to central bank funding both in terms
of cost of funds and collateral value.
The combination of the growth and cost assumptions would allow the calculation of the Net Stable FundingRatio (NSFR) and Liquidity Coverage Ratio (LCR), to inform target setting for these metrics as required by
the MoU. It also allowed the more prudent calculation of total cost of funds as an input into the PCAR.
Methodology
Bank submissions
Banks were required to submit detailed half yearly forecasts for their funding profiles to 2013, incorporatingagreed deleveraging plans, in a set base case macroeconomic and funding scenario described above.
Banks were not required to submit a complete PLAR submission in a stress scenario, analogous to that of the PCAR. This is because the most relevant form of stress scenario in a liquidity risk context is not ageneral deterioration in macroeconomic conditions, but a short, unexpected, severe liquidity shock. Theparameters of the LCR are designed to model precisely this type of scenario.
Iteration Process
The Central Bank established a robust process governing the collection of data from institutions. Thisprocess was harmonised across both PLAR and PCAR. It was underpinned by the core principles of regular, structured communications with banks and multiple iterations of submissions to ensure adequatereview and challenge. The key milestones in the PLAR were:
• 11 February: First forecast submission by institutions.
• 12–18 February: Central Bank review and challenge of submissions.• 9 March: Second forecast submission by institutions.
• 10–17 March: Central Bank review and challenge of second submissions.• 31 March: Completion of the PLAR and publication of results.
Validation of Submissions
The Central Bank also established procedures to ensure the comprehensive review, validation and analysisof all data submitted. These included:
8/6/2019 The Financial Measures Programme Report
http://slidepdf.com/reader/full/the-financial-measures-programme-report 81/92
79Financial Measures Programme
• An assessment of the reasonableness of funding forecasts, by: ensuring consistency withspecified scenarios; comparisons with historical trends, market forecasts, and peer banks; detailedreview by experts; and other methods.
• Validation of submissions against data reported to the Central Bank and other published data.
• Establishing the completeness and internal consistency of submissions, and their consistencyacross workstreams through structured cross-workstream reviews and checks.
Project structure
In order to ensure successful delivery, the Central Bank set up robust governance structures within the
PLAR workstream, and the Financial Measures Programme as a whole. From the outset, the structureswere designed to facilitate efficient cross-functional communication and actions. Weekly bank-by-bank
cross-workstream meetings were held to ensure a constant flow of information between the differentelements of the project, and to guarantee that developments in one area were quickly and accurately
feeding into others. Sitting across the various workstreams was a Project Management Office, run inpartnership with The Boston Consulting Group. BCG and Barclays Capital provided technical support to
the PLAR.
Inter-dependencies with other aspects of Programme
These governance structures were particularly important because of the inter-relationship between theelements of the Financial Measures Programme. Many of the forecasts which the banks submitted as part
of the PLAR were also inputs to the PCAR, and vice versa. In particular, these included forecasts of: thefunding mix; the cost of funds; the mix of assets; the contractual cash inflows from maturing assets, interestand other sources; shareholders’ equity. PCAR, via loan loss forecasts and their capital implications, alsoimpacted on the calculation of the PLAR funding metric levels.
The PLAR workstream also worked in conjunction with the Deleveraging Review workstream to define thetarget Loan to Deposit Ratio around which the deleveraging strategy has been constructed. Banks’
deleveraging plans were antecedent to the PLAR and PCAR exercises; the deleveraging plans agreedformed the basis of the forecasts banks submitted for these forecasting exercises, and impacted the stresstests results significantly.
8/6/2019 The Financial Measures Programme Report
http://slidepdf.com/reader/full/the-financial-measures-programme-report 82/92
80 Financial Measures Programme
Appendix I: Summary of work on Anglo Irish Bank and Irish Nationwide Building
Society
The future of Anglo and INBS
Anglo Irish Bank ("Anglo") has historically focussed predominantly on commercial property lending inIreland, the UK and US. Anglo was fully nationalised on 21 January 2009 following unprecedented market
events and mounting loan losses. The Bank has since required substantial State aid.
Irish Nationwide Building Society (INBS) was established primarily as a residential property lender butincreased its focus on commercial property lending from 2004-2008. It has required substantial State aid
since September 2008 and is now effectively State-owned.
In November 2010, the MoU agreed between Ireland, the EC, the ECB and the IMF mandated swift and
decisive action to resolve the position of Anglo and INBS in a way that protected depositors andstrengthened the banking system. To this end, a joint restructuring plan for the two institutions wassubmitted to the European Commission by the Irish authorities in January 2011. This plan proposed the
transfer of Anglo and INBS deposits and NAMA senior bonds to third-party institutions, and the merger of the two entities into a single Government-owned banking group focussed on working out legacycommercial property and other loans within 10 years and managing residential property loans for eventualsale.
The first element of this plan was executed in February 2011, when Anglo’s and INBS’s deposits andNAMA bonds were transferred to AIB and ILP respectively. In 2011, Anglo and INBS will be merged into asingle Government-owned banking group which will not be active in new lending or deposit markets. Themerged bank will continue to operate independently as a regulated entity with its own Board, governance
functions and group management team. The objective of this proposed model is to avoid risk of further losses from new lending and concentrate expertise in managing the work out of loans over a period of years and minimising capital losses in a single banking group. As far as possible, the merged group willseek to place a cap on State aid requirements.
Capital requirements of new entity
The capital requirements of Anglo and INBS were assessed by the Central Bank in September 2010. As a
result of this assessment, new capital of 6.42bn for Anglo and 2.7bn for INBS was injected by theGovernment in December 2010, bringing the total amount of State capital the two institutions have receivedsince 2009 to 29.3bn and 5.4bn respectively. Anglo and INBS were not included in the stress testing
exercise carried out in Q1 2011 as the institutions are in the process of implementing the restructuring plan.
Once merged, it is forecasted that group will have a Total capital ratio of 14.1% and a Core Tier 1 ratio of 12.5%. This will consist primarily of equity already injected by the State. The remaining regulatory capital
will consist of the small amounts of preference shares and subordinated debt remaining after recent liabilitymanagement exercises. The plan submitted to the Commission in January forecasts that this capital levelwill be sufficient to maintain a Total Capital Ratio above 8% until the loan management exercise is
completed, given the planned reduction in the new entity ’s required capital as its assets are worked out,and the existing levels of provisions on the Anglo and INBS balance sheets.
Future loan losses at Anglo Irish Bank
The Anglo loan book has been subject to a number of third-party reviews over the last year, detailed in Box4. Based on these reviews, the Central Bank estimates that the current capital levels held by the Bank areadequate to cover future loan losses, in a base scenario.
Loss rates applied to Anglo books are higher than the most severe of those currently forecast byBlackRock for four other Irish banks for similar books, even on a stress lifetime basis. For example, for Anglo’s cashflow portfolio the assumed loss rate of 55% is significantly higher than the 21.4% BlackRock
estimates as the lifetime loss of the SME portfolio of the worst stress test bank. For personal lending, theassumed Anglo loss rate is 68% while the estimated lifetime loss for consumer and other lending in the
worst stress test bank is 29.8%. For CRE, the assumed Anglo loss rate of 42% is higher than the 39.2%lifetime loss estimated for the worst stress test bank.
8/6/2019 The Financial Measures Programme Report
http://slidepdf.com/reader/full/the-financial-measures-programme-report 83/92
81Financial Measures Programme
Significantly, the riskier elements of Anglo book relating to development loans have already beentransferred to NAMA. The remaining loans are in relatively less risky categories relating to investment,office and retail, with over 50% in the United Kingdom and the United States.
In addition, 2010 outcomes at Anglo corresponded more closely to the stress test base case scenario,rather than the adverse scenario.
Box 4 – Anglo Loan Book Reviews
PWC provisions assessment (Q2-Q3 2010) PWC’s assessment covered a base case loss and stress
case loss for the top 100 regulatory group exposures, with Central Bank oversight of the process. These
represented 54% of the non-NAMA loan book. The losses were extrapolated to the rest of the portfolio and
reported on 27 May 2010. The review increased provisions under the stress test adverse scenario by 3bn
to 15.2bn. An updated review was conducted in September 2010 and the provisions figure was increased
to 17bn.
Independent Consultancy Provisions Assessment (Q4 2010) In Q4 2010, the Anglo loan book was
subjected to a further independent top-down review. Losses were extrapolated until 2020 and added a
"loss on disposal amount" to account for disposals until 2020. The independent assessment added 700m
to provision levels. Based on a review of these results and applying additional conservatism, the Central
Bank increased provision levels by a further 500m.
Central Bank benchmark of BlackRock stress test forecasts (March 2011) As part of the most recent
stress test exercise, BlackRock solutions carried out a detailed bottom up forecast losses on the portfolios
of four Irish banks (AIB, BOI, EBS, ILP). The Central Bank benchmarked BlackRock’s estimates of stress
case lifetime losses for the four banks against losses assumed on Anglo’s portfolios as part of its most
recent capital assessment. The exercise showed that Anglo’s assumed loss rates were higher than the
estimated lifetime losses on the corresponding portfolios in all stress test banks.
Provisions at Irish Nationwide Building Society
INBS’s loan portfolios were also reviewed in late 2010 as part of a full assessment of the Bank’s capital
requirements.
In March 2011, the Central Bank benchmarked the loss rates assumed for INBS in the 2010 review againstan even more conservative stress case lifetime losses for other banks forecast by BlackRock in Q1 2011.
This benchmarking exercise showed that, unlike for Anglo, the loan losses assumed for INBS portfolioswere slightly lower than the stress lifetime loss of the worst of the four stress test banks.
However, even if loss rates comparable to those of the BlackRock stress case worst bank were realised on
all portfolios, the resulting increase in provisions would be relatively small (estimated at up to 195m).Significantly, a large portion of the losses on mortgage portfolios would likely not be realised until after 2015. The Central Bank estimates that by this time, the surplus capital of the new merged entity (in excess
of the requirement of an 8% Total capital ratio) would be more than adequate to absorb such additionallosses.
8/6/2019 The Financial Measures Programme Report
http://slidepdf.com/reader/full/the-financial-measures-programme-report 84/92
82 Financial Measures Programme
Glossary
Asset Quality Review (AQR) An in-depth review of the quality, strength and basis for a given loan.
For the purposes of the Financial Measures Programme this included
assessment of the quality of a selection of the banks’ individual assets,
and of the processes employed by the banks for establishing and
monitoring asset quality. The AQR workstream also included a review
of legal issues related to collateral and security enforcement to provide
context and qualitative input into overall asset quality work.
Basel III A global regulatory framework for banks and banking systems,
developed by the Basel Committee on Banking Supervision of the Bank
of International Settlements (BIS). See Appendix D for further
information on Basel III.
Capital In banking, capital comprises mainly share capital, capital contributions,
reserves, alternative capital instruments or hybrid instruments. Capital
acts as a cushion against losses and a protection for depositors’
money, and it can be viewed as a measure of financial strength.
- Tier 1 capital This is high quality capital, in terms of both permanence and capacity
for loss absorption. It usually comprises share capital, capital
contributions, reserves, certain preference shares and certain hybrid or
alternative capital instruments. There are two sub-segments of Tier 1
capital which are of particularly high quality: Core Tier 1 capital and
Equity Core Tier 1 capital.
- Core Tier 1 capital This is Tier 1 capital excluding certain hybrid or alternative capital
instruments. Hybrid or alternative capital instruments are types of
instruments with both debt and equity features, for example convertible
bonds.
- Equity Tier 1 capital The best quality capital a bank can have in terms of loss absorbency as
it ranks lowest in seniority of claims and absorbs losses in the firstinstance. This capital is permanent as there is no provision for
redemption, although the holder of the share can sell the share to
someone else. Essentially this is Core Tier 1 capital excluding certain
preference shares, such as the Government’s preference shareholding
in AIB and BOI. This capital also has the greatest flexibility in payment
obligations as a dividend will only be paid in the event of shareholder
approval.
8/6/2019 The Financial Measures Programme Report
http://slidepdf.com/reader/full/the-financial-measures-programme-report 85/92
83Financial Measures Programme
Capital adequacy A measurement of the amount of capital that banks have available to
absorb future losses. Measured using a capital adequacy ratio, which
places a bank’s capital over its Risk Weighted Assets (see definition
below). The capital adequacy ratio forms the basis of capital
requirement.
Capital basisCapital basis refers to the set of rules or regulations by which capital
adequacy is assessed. In the EU the current set of rules is laid out in
the Capital Requirements Directive.
Capital buffer The amount of capital a financial institution needs to hold above
minimum requirements, calculated through an assessment of risks
which fall outside the risks evaluated in the capital ratio.
In the case of the Financial Measures Programme, the capital buffer
provides additional capitalisation against potential capital absorbing
events outside the parameters of the PCAR stress test. This includes
defaults outside the PCAR period (without taking account of post-2013
operating income) and other risks which would affect capital adequacy.
Capital requirement The capital requirement determines the amount of current and future
risk an institution must hold within a given regulatory framework. (An
example would be 6% Core Tier 1 requirement under stress scenario.)
Risk is measured by an institution’s capital adequacy ratio (see
definition above). Institutions which cannot meet the prescribed capital
requirement must find a way to increase their capitalisation or to reduce
their risk weighted assets.
Capital Requirements
Directive (CRD)
The European law which governs minimum capital requirements for all
Credit Institutions in EU Members States. Its provisions reflect, to a
large extent, the rules laid down by the Basel Committee on Banking
Supervision.
Core loan portfolios The loan portfolios identified by the banks as important in the context of
supporting the Irish economy and/or important to ensure their ongoing
financial viability. These portfolios have been retained by all institutions.
Data Validation Assessment of the quality of the underlying data that is being used to
create loan loss forecasts. For the purposes of the Financial Measures
Programme, this included an assessment of the sufficiency, quality, and
validity of data housed on bank systems as compared to official books
and records.
Deleveraging The process of reduction of non-core assets over time through asset
run-offs and disposals.
8/6/2019 The Financial Measures Programme Report
http://slidepdf.com/reader/full/the-financial-measures-programme-report 86/92
84 Financial Measures Programme
DSCR Debt Service Coverage Ratio. The ratio of cash available for debt
servicing to interest, principal and lease payments. It is a benchmark
used in the measurement of an entity's ability to produce enough cash
to cover its debt (including lease) payments.
EBA European Banking Authority. The European institution which acts as a
hub and spoke network for European financial supervisory authorities.
It replaced the Committee on European Banking Supervisors (CEBS) in
January 2011.
Haircut A haircut on a loan is the difference between the nominal value of a
loan and the purchase price paid by an investor or acquirer. The
discount applied is based on the quality of the loan, ability to repay and
underlying collateral.
Liquidity The degree to which an asset can be easily converted into cash without
an rice discount.
Liquidity Coverage Ratio
(LCR)
The LCR is a measure of short-term contingent liquidity risk. Its
objective is to ensure that a bank has sufficient liquidity to meet
potential net outflows from both on- and off-balance sheet exposures in
a stressed environment. It is defined as the ratio of a bank’s stock of
high quality liquid assets to its expected net cash outflows in the first 30
days of a specified stress scenario, in line with the parameters set out
by the BCBS in December 2010. Under current Basel III proposals,
banks must reach a minimum standard of 100% LCR by January 2015.
Loan to Deposit Ratio (LDR) The Loan to Deposit Ratio measures a bank's liquidity by expressing
customer loans net of impairment provisions as a percentage of
customer deposits.
For the purposes of the Financial Measures Programme all banks were
required to a reach an LDR of 122.5%. Given that zero deposit growth
was a key assumption for the PCAR / PLAR exercise, all banks
achieved this LDR target through measures to deleverage non-core
loans.
Loan Loss Forecasting An exercise to determine the extent to which loans will be re-paid over a
certain time horizon, based upon the probability of each loan defaulting,
the extent to which each loan is currently exposed, and the amount that
would likely default at a given point in time.
Loan-To-Value ratio (LTV) Measures the risk associated with a loan by dividing the amount of a
loan provided by a bank by the actual value of the asset. Typically,
higher LTV ratios means a higher risk loan.
8/6/2019 The Financial Measures Programme Report
http://slidepdf.com/reader/full/the-financial-measures-programme-report 87/92
85Financial Measures Programme
Loss Given Default (LGD) The credit loss incurred on a loan if a creditor defaults.
National Asset Management
Agency (NAMA)
NAMA is a State agency created in 2009 to improve the credit-
worthiness of Irish banking system. Its primary function is to take over
distressed commercial loans from Irish banks, providing banks with
bonds in return. Assets acquired by NAMA will be resolved through sale
or wind down.
Net Stable Funding Ratio
(NSFR)
The NSFR is a measure of banks’ structural liquidity mismatch. Its
objective is to ensure that a bank’s long-term assets (on- and off-
balance sheet) are funded by stable funding sources, measured by
either behavioural or contractual term. It is defined as the ratio of a
bank’s available stable funding to its required amount of stable funding,
in line with the parameters set out by the BCBS in December 2010.Under current Basel III proposals, banks must reach a minimum of
100% NSFR by January 2018.
Non-Core Loan Portfolios The businesses that the banks have identified as not specifically
supporting the Irish economy or not important in the context of their
ongoing viability.
Probability of Default (PD) Probability of Default measures the likelihood that a loan will not be
repaid and will fall into default. There are many techniques for
estimating the probability of default for a given loan type, including
logistic regression, proprietary models or a ratings based approach.
PCAR Prudential Capital Assessment Review. An exercise that estimates the
capital requirements of credit institutions under a given set of
macroeconomic variables and/or risk sensitivities.
PLAR Prudential Liquidity Assessment Review. An exercise to monitor and
enforce sound quantitative and qualitative liquidity standards.
Promissory Note A promissory note is a document issued by a borrower that represents
an unconditional promise to repay the lender a specific sum of money at
a fixed or determinable future time. The accounting treatment of the
promissory note is that it is recognised as an asset on the balance
sheet of the institution. The corresponding liability to the asset is
recognised as a capital reserve on the balance sheet of the institution.
This reserve can be recognised as Tier 1 capital in accordance with the
Capital Requirements Directive.
RIP Mortgages Residential Investment Property Mortgages, also known as buy-to-let
8/6/2019 The Financial Measures Programme Report
http://slidepdf.com/reader/full/the-financial-measures-programme-report 88/92
86 Financial Measures Programme
mortgages.
Risk Tolerance Risk tolerance describes the minimum level of capital acceptable to the
Central Bank in a particular scenario. The level of risk tolerance
determines the amounts of capital that a bank must hold to absorb
future losses and remain solvent/a going concern. For the purposes of
the Financial Measures Programme, the risk tolerance was set at 6%
Core Tier 1 capital for the PCAR stress case.
Risk-Weighted Assets (RWA) A measure of the amount of a bank’s assets, adjusted for risk. This sort
of asset calculation is used in determining the capital requirement or
Capital Adequacy Ratio, with risk weightings regulated by the local
Central Banks or other financial regulators.
Securitisation Securitisation is a structured finance process that can distribute risk by
aggregating loans into a pool, then issues new securities backed by the
pool, while also providing funding for the loans. Loans can also be
aggregated into securitisation vehicles as a means of obtaining secured
funding alone, where no risk transfer occurs.
Solvency The ability to meet short and long term liabilities and other claims on an
institution.
Sovereign Exposures As part of the PCAR, Sovereign exposures included exposures held
both within the Trading Book and within the Banking Book. Sovereign
exposures include inter alia: holdings of central government bonds,
holdings of government t-bills or commercial paper, loans to central
government, loans or debt issued by non-central government (i.e. local
authorities), NAMA bonds, and holdings of promissory notes issued by
government.
Supervisory Review and
Evaluation Process (SREP)
SREP is part of the larger Supervisory Review Process. It is a
comprehensive process which supervisors use to review and evaluate
risk exposure for relevant institutions.

8/6/2019 The Financial Measures Programme Report
http://slidepdf.com/reader/full/the-financial-measures-programme-report 89/92

8/6/2019 The Financial Measures Programme Report
http://slidepdf.com/reader/full/the-financial-measures-programme-report 90/92

8/6/2019 The Financial Measures Programme Report
http://slidepdf.com/reader/full/the-financial-measures-programme-report 91/92

8/6/2019 The Financial Measures Programme Report
http://slidepdf.com/reader/full/the-financial-measures-programme-report 92/92
T +353 1 224 6278 F +353 1 671 6561 www.centralbank.ie [email protected]