the final four formula: a binary choice logit model...
TRANSCRIPT

*Thank you to Professor Ken Brown, Ken Pomeroy, and Professor Mark Glickman fortheir assistance and guidance on this paper.
31
The Final Four Formula: A Binary Choice Logit
Model to Predict the Semi-Finalists of the
NCAA Division I Men’s Basketball Tournament
Cameron Fuqua*
ABSTRACT. The NCAA Division I men’s basketball tournament is one of the mostpopular sporting events in America. This paper dissects the tournament and attempts toaccurately predict the four semi-finalists (“the final four”) using a binary choice logitmodel. The model does better than any current rating system at predicting these fourteams. This paper also examines some common issues about predicting college basketballas a whole. Overall, this paper provides a insights for selection committees, participantsin office pools, and coaches to help them achieve their own individual goals.
I. Introduction
This year Warren Buffet offered 1 billion dollars if someone correctlypredicted all 63 games of the NCAA Division I Men’s basketballtournament, affectionately known as “March Madness.” That soundspretty good, but most estimates put the probability of predicting a perfectbracket at 1 in 128 billion (Woodruff 2012). A 2012 article in BusinessInsider estimates that 80 to 90 million dollars are gambled legally everyyear for March Madness. This ranks second to the Superbowl in terms ofbetting on sporting events (Woodruff 2012). Time magazine also reportedthe intangible cost to businesses of lost time due to employees beingpreoccupied with March Madness. Time estimated the cost in 2013 at$134 million, with an average worker watching 1-3 hours of collegebasketball during work hours in just the first two days (Sanburn 2013).While the promise of $1 billion is quite alluring, this paper does notattempt to perfectly predict the NCAA basketball tournament bracket. Itattempts to determine the factors that are most important for a team toreach the semi-finals of the NCAA Division I basketball tournament byusing a binomial choice logit model.
Major Themes in Economics, Spring 201432
II. The NCAA Basketball Tournament Structure
Tournament Structure and Seeding
The NCAA basketball tournament consists of 68 teams divided into4 regions playing in a single elimination format. These regions arecommonly labelled the Midwest, West, East, and South. Each region isset up so that the 1 seed will not face the 2 seed in its respective regionuntil the regional finals.
There are 4 play-in games called the “First Four”. These gamesconsist of the four lowest seeded at-large bids, and the four lowest seededautomatic bids. The seeding and region of these play-in games vary yearto year. For 2014 the four play-in games were: 11 seed Tennessee vs 11Seed Iowa in the Midwest region, 12 Seed Xavier vs 12 Seed NorthCarolina State in the Midwest Region, 16 Seed Texas Southern vs 16Seed California Polytechnic University in the Midwest Region, and 16Seed Mount St. Mary’s vs 16 Seed Albany in the South Region. Due toavailable data, and increased complexity this paper will ignore thesegames and consider them merely regular season games.
The second round consists of 32 games. The third round is referredto as the regional quarterfinals and consists of 16 games. The fourthround is referred to as the Sweet Sixteen or the regional semi-finals andconsists of 8 games. The fifth round is the Elite Eight, or the RegionalFinals, and consists of 4 games. The winner of the Elite Eight gamesadvance to the final four. This paper attempts to consistently predict theteams that advance to the final four better than other models.

Major Themes in Economics, Spring 201434
Selection Committee
The NCAA Division I men’s basketball tournament is controlleddirectly by the NCAA Division I men’s basketball selection committee.This committee is comprised of 10 individuals who serve five year terms.These individuals are athletic directors and conference commissioners inDivision I athletics. The NCAA attempts to have these representativesevenly distributed geographically. The primary principle of the selectioncommittee is to “ensure that fair and equitable criteria are used to selectthe most deserving at-large teams, while also focusing on administeringa fair and equitable tournament by creating a nationally-balanced bracketcomprised of the most deserving at-large teams and automatic-qualifierschosen by conferences, while assigning institutions to sites as near to theircampuses as possible” (NCAA 2014).
Selection Process
The 68 teams must be selected prior to seeding. There are 32 automaticbids. These 32 bids are each of the individual conference tournamentchampions. (See Table 1) This leaves 36 teams that will receive an at-large bid determined by the selection committee. The committee relies onstrength of schedule, winning percentage, RPI (Ratings Percentage Index,a measure of a team’s overall quality), and several subjective factors toproperly seed teams (NCAA 2014).
TABLE 1–NCAA Division I Basketball Conferences
Major Conference Mid-Major Conference Small ConferenceAtlantic Coast American Athletic America EastBig 12 Atlantic 10 Atlantic SunBig East Colonial Big SkyBig 10 Conference USA Big SouthPacific-12 Horizon League Big WestSoutheastern Mid-American Ivy League1
Missouri Valley Metro AtlanticMountain West Mid-EasternWest Coast NortheastWestern Ohio Valley
Patriot LeagueSouthlandSouthwesternSun BeltSummit League
The Ivy League does not have a conference tournament; the regular season champion1
earns an automatic bid.

Fuqua: The Final Four Formula 35
Seeding
The selection committee has three goals when seeding teams; it aims tohave all four regions evenly balanced, it aims to reduce travel costs forhigher-seeded teams, and it aims to limit the possibility of regular seasonrematches. Attempting to fulfill all three of these criteria often createstradeoffs in seeding.
The selection committee first ranks the teams from 1 to 68, with 1being the best and 68 being the worst. This is called true seeding. Afterseeding teams 1-68, the committee attempts to place teams on an S-curve.This is so each region will be equally balanced. For example the regionwith the best one seed will have the worst 4 seed. While this is a startingpoint for the selection committee it does not always hold true.Occasionally, travel expenses, avoiding in-conference matchups and othersubjective factors may play a role in seeding teams (NCAA 2014).
III. Who Cares?
There are several useful applications of a predictive NCAA basketballtournament model. The three primary uses are improving seedingefficiency, improving bracket selections for better success in generaloffice pools, and improving a coach’s knowledge about what style ofbasketball increases the chance of tournament success.
Inefficient Seeding
If the NCAA tournament were efficiently seeded, then the final fourwould always have the highest seeded team from each region (all oneseeds). Only once in the history of the tournament have all four numberone seeds reached the final four (2008). If all four number one seedsreach the final four the sum of these seeds would be four (1+1+1+1).Over the past eight years the sum of the seeds of the final four hasaveraged 12.875. This is far above a perfectly efficient bracket.
Second, if a bracket were seeded efficiently, there would be zeroupsets. Due to the nature of sports and college basketball it is not likelyto have a tournament with zero upsets. While there is no standard numberof upsets that is considered acceptable, there are some startling statisticsabout upsets in the NCAA tournament over the past eight years that maypoint towards inefficient seeding. On average there are 8.6 second round

Major Themes in Economics, Spring 201436
upsets. That means 26.9 percent of the time the lower seed wins. Over thesecond, third, fourth, and fifth rounds in the past eight years, the lowerseed won 140 times (29%). Most startling is that in the fifth round alone,the lower seed has won 56.25 percent of the time. While there may not bea rule of thumb to the number of acceptable upsets these figures appearto be high.
Office Pools
The primary purpose of this paper is not to correctly predict all 63NCAA games of the tournament. But this paper can be a foundationwhen filling out brackets for an office pool. This paper attempts todetermine what statistics are most important to a team’s probability ofreaching the final four. In most office pools, correctly predicting a finalfour team is very valuable and the person who correctly predicts the mostfinal four teams will usually win.
Style of Play
Except for 2010, Duke has been performing relatively poorly in theNCAA tournament. In 2012 as a two seed it lost to fifteen-seeded Lehigh(one of only six times a 15 seed has beaten a 2 seed). In 2011 and 2006as a one seed Duke made the sweet sixteen only to lose to fifth-seedArizona and fourth-seed LSU respectively. In 2008 as a two seed Dukelost to seventh-seeded West Virginia in only the second round. In 2007Duke lost in the first round as a six seed to eleventh seeded VirginiaCommonwealth.
Why has a school with four national championships, a winningpercentage in the tournament of 75%, and 15 final-four appearances beenunderperforming in the past 8 years?
One possible explanation may be a lack of rebounding prowess.Except for 2010 when Duke won the national championship, it has been5th, 45th, 12th, 21st, 31st, 26th, and 5th worst in rebounding rate for thetournament years 2006, 2007, 2008, 2009, 2011, 2012, and 2013respectively. Duke has been in the bottom half of the tournament teamsin rebounding in six of the past eight years.
Duke has also struggled in the past 8 year in defensive efficiency. Ithas ranked 16th, 15th, 16th, 29th, 28th, 12th, 42nd, and 23rd in allowingthe most points per 100 possessions among tournament teams from 2006

Fuqua: The Final Four Formula 37
through 2013. This is far below the level needed for tournament success.Focusing on a high scoring, volume shooting, non-defensive, non-
rebounding style of basketball has not seemed to benefit Duke in recentyears and may be one of the reasons for its recent lack of success. Thispaper provides statistical backing to this claim, and may provide insightfor college coaches on which style of basketball is best suited fortournament success.
IV. Current Literature
Despite the current popularity of predicting the outcome of sports and theeffort to create an ultimate predictive statistic, there has been very littleacademic research published on the topic. The research that does existseems to focus on professional sports, primarily baseball. There are veryfew published articles on predicting the NCAA tournament. This may bebecause people who have found credible results may not want to publishtheir results and instead use them for their own personal good. Also, theremay not be any significant results produced due to a lack of availabledata. There are primarily two approaches to predict the NCAAtournaments. One is through a capture-all statistic such as RatingsPercentage Index, Basketball Power Index, KenPom ratings, and JeffSagarin’s strength rating. The second is through limited publishedresearch.
Commonly Used Power Rankings
ESPN created the Basketball Power Index (BPI) in 2012 in an attempt toaccurately predict what teams would receive at-large bids by the selectioncommittee. ESPN claims the BPI adjusts a team’s score based on pace ofthe game, unlike other power rankings. One of the most unique aspects ofthe BPI is that it accounts for performance due to missing players(injuries, suspensions, etc.). This allows a team not to be punished whenit loses a game if their star player has a sprained ankle and is unable tocontribute (Oliver 2012).
The Ratings Percentage Index (RPI) is a tool the NCAA hasdeveloped to rate several different sports. The selection committee reliesheavily on the RPI because of its simplicity. The RPI uses only threecomponents: winning percentage, opponents’ winning percentage, andyour opponents’-opponents’ winning percentage. Winning percentage is

Major Themes in Economics, Spring 201438
weighted by a factor of .25, opponents’ winning percentage by a factor of.5, and your opponents’-opponents’ winning percentage by a factor of .25.Winning percentage is weighted for home wins and losses, away wins andlosses, and neutral site wins and losses differently. A home win is equalto .6 wins; an away win is equal to 1.4 wins. Conversely, a home loss isequal to 1.4 losses, and a road loss is equal to .6 losses. All neutral sitegames are weighted as 1 win or 1 loss (NCAA 2014).
Jeff Sagarin created his own power rating index in the 1980’s and hismetrics have been published in USA Today since 1985. Most of hisformula is shrouded in secrecy. Sagarin claims to put weight on marginof victory, an adjustment for blowouts, location of games, and strength ofschedule. The exact weights and formulas are unknown (Sagarin 2014).
Like Sagarin, Ken Pomeroy has created his own power rating topredict tournament games. His statistics go back to 2003 and are primarilyfocused on adjusting outcomes and statistics for the pace of a game. LikeSagarin, his formula has not been released and the exact weights to thesestatistics are unknown (Pomeroy 2014).
Includes RPI BPI Sagarin Kenpom
Scoring margin No Yes Yes Yes
Diminishing returns for blowouts No Yes Yes No
Pace of game matters No Yes No Yes
Home/Neutral/Road Yes Yes Yes Yes
SOS beyond Opponent's opponents'W-L
No Yes Yes Yes
All wins are better than losses (beforeOpp Adj)
Yes Yes No No
De-weighting games with missing keyplayers
No Yes No No
Fuqua: The Final Four Formula 39
Published Articles
Shi, Moorthy, and Zimmerman examined the predictive capabilities ofcurrent NCAA basketball ranking methods. They predominantly focusedon the fact that there is a “glass ceiling” of 75% predictive capabilities.They examined the predictive capabilities of the models employed by KenPomeroy, Daryl Morey, John Hollinger, and Dean Oliver. They come tothe conclusion that the limited predictive capabilities of the currentmodels is in the choice of variables, not in the models themselves. Intheory, selecting the correct variables, may lead to a proverbial busting ofthe glass ceiling (Shi, Moorthy and Zimmerman 2013).
Most predictive research on basketball has been focused on the NBA.This is because of longer and more consistent schedules. The NBAtypically plays a schedule of 82 games with a schedule set by the league.Lee and Berri have recently approached this topic by using productionfunctions to measure positional productivity in the NBA (i.e. Are guards,centers, or forwards more valuable?). They build their model on thepremise that “wins in the NBA are determined by how efWciently onescores per possession employed, relative to one’s opponent’s ability touse possessions efWciently.” Lee and Berri calculate the effectiveness ofeach position on each team. They then use a Cobb-Douglas productionfunction to estimate a log-log econometric model that breaks down thepositional quality of each team and how it contributes to wins. Ultimatelythey discovered that “big men have a greater impact on team wins thansmall forwards or guards” (Lee and Berri 2008).
On average the higher seed wins 71 percent of the time. This ledCarlin (1996) to use seed difference, Sagarin Rating difference, andbetting point spreads to predict which teams would reach the final four.His model used two linear regressions. For both models the betting pointspread was used as the dependent variable. For their first regression thelone independent variable was the seed difference squared. In the secondregression the independent variable was the difference in Sagarin ratings.They applied both of these models to the 1994 NCAA basketballtournament and correctly predicted one of the four regional champions.They state that the model they developed “requires only elementary ideasin probability theory, statistical graphics, and linear regression analysis,and as such should provide an interesting and instructive exercise forstudents” (Carlin 1996).

Major Themes in Economics, Spring 201440
V. Model
Except for Carlin, the current literature does not address the issue ofpredicting the regional champions of the NCAA Division I basketballtournament. Carlin’s model is very rudimentary and outdated but canprovide a useful foundation for predicting the final four. The modelpresented in this paper tries to expand on the use of production functionsin the NBA as laid out by Lee and Berri and apply the same principles toa binomial logit model. The focus on defensive and offensive efficienciesin this paper is mostly derived from Shi, Moorthy, and Zimmerman.
A binomial logit model can be used to predict success in the NCAAbasketball tournament. A logit model result is constrained to a numberbetween 0 and 1. This can be a useful tool in predicting success, as longas success is properly defined. For this model success is defined aswinning your respective region and thus making the Final Four. In thislogit model the dependent variable is either a 1 for a team reaching thefinal four or a 0 for teams that do not. Explanatory variables are: pointsper 100 possessions (PtsPer100Poss) to account for offensive prowess,points per100 possessions allowed (PtsPer100PossAllowed) for defensiveeffectiveness, rebounding rate (RBSRate) as a measure of ball control,strength of schedule (SOS) in order to normalize statistics based on levelof competition, and regional strength (REGSTR) to account for variationsin the strength of regions.
VI. Data and Variables
Data
Data were collected on the 510 tournament teams from 2006 to 2013from BasketballReference.com and randomly cross-referenced againstNCAA.org to ensure accuracy. All regressions were run using GnuRegression, Econometrics, and Time-Series Library (GRETL).
Dependent Variable
The nature of a binomial logit model is that the dependent variable is

Fuqua: The Final Four Formula 41
binary, taking on a value of either 1 or 0. In this model a 1 will indicatethe team made the final four while a 0 will indicate a team did not makethe final four. Strength of Schedule (SOS)
There are many calculations for strength of schedule. For example,NCAA.org typically calculates it based on your opponent’s winningpercentage and your opponent’s-opponents winning percentage. Thispaper chose to use basketballreference.com’s strength of schedule. Thatcalculation is based on an average offensive and defensive NCAADivision I team. If a team typically plays statistically above averageteams, then its strength of schedule will be higher. Strength of scheduleof 0 would mean over the course of a season the teams you played werea statistically average NCAA Division I team.
The purpose of using strength of schedule statistics is three-fold.Strength of schedule normalizes a team’s statistics based on competitionlevel, indicates that a team plays in a more competitive conference, andmay indicate that a team has been “battle tested”.
There is a difference between scoring 70 points per game against areally good defensive team and scoring 70 points per game against anextremely weak defensive team. In order to normalize a team’s statistics,the strength of schedule variable is used.
There are 32 NCAA Division I basketball conferences. The teams thatplay in the major conferences (See Table 1) typically make the final fourmore frequently. Teams in one of these six power conferences willinnately have a higher strength of schedule and therefore be more likelyto reach the final four.
When a team reaches the tournament and has played a very weakschedule it is more susceptible to upsets. It has not been challenged at thehighest level yet. Playing a weak schedule is not good preparation forentering a tournament consisting of the 64 best teams in the country.
The lowest strength of schedule for the 512 tournament teams was2013’s Southern University at -10.31. The highest strength of schedule forthe 512 tournament teams was 2011’s Michigan State at 11.67. Theaverage strength of schedule for the 512 tournament teams is 4.1353.
Major Themes in Economics, Spring 201442
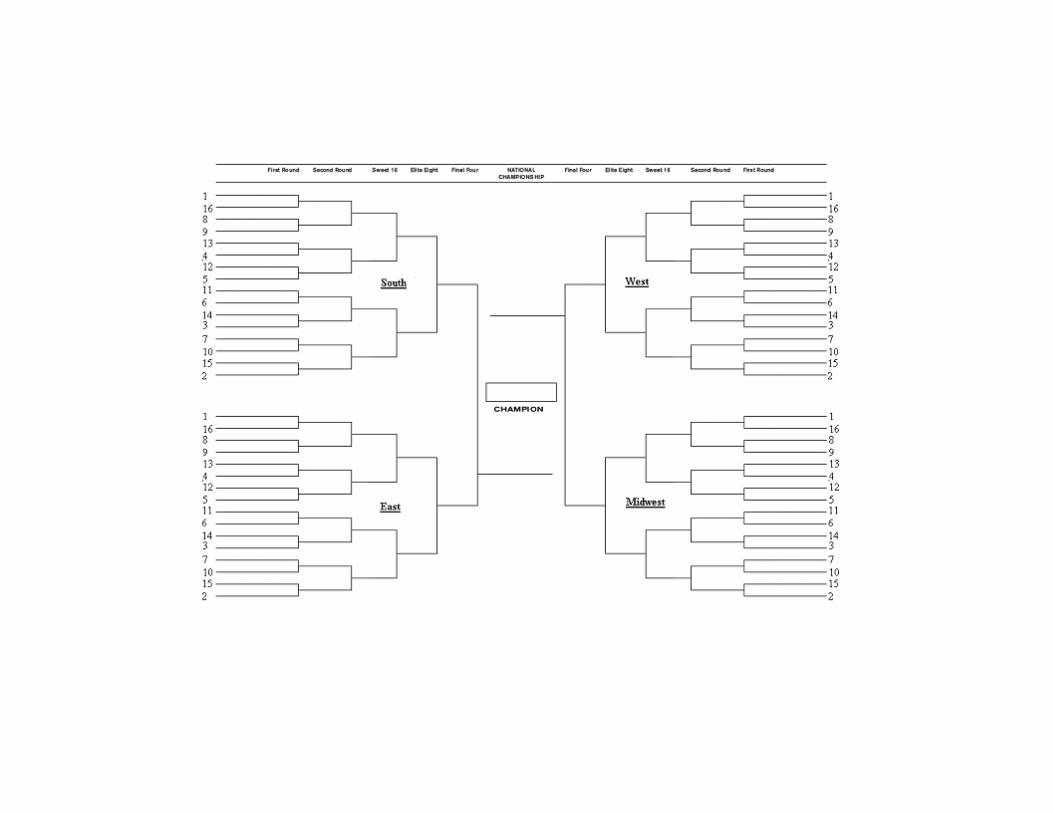
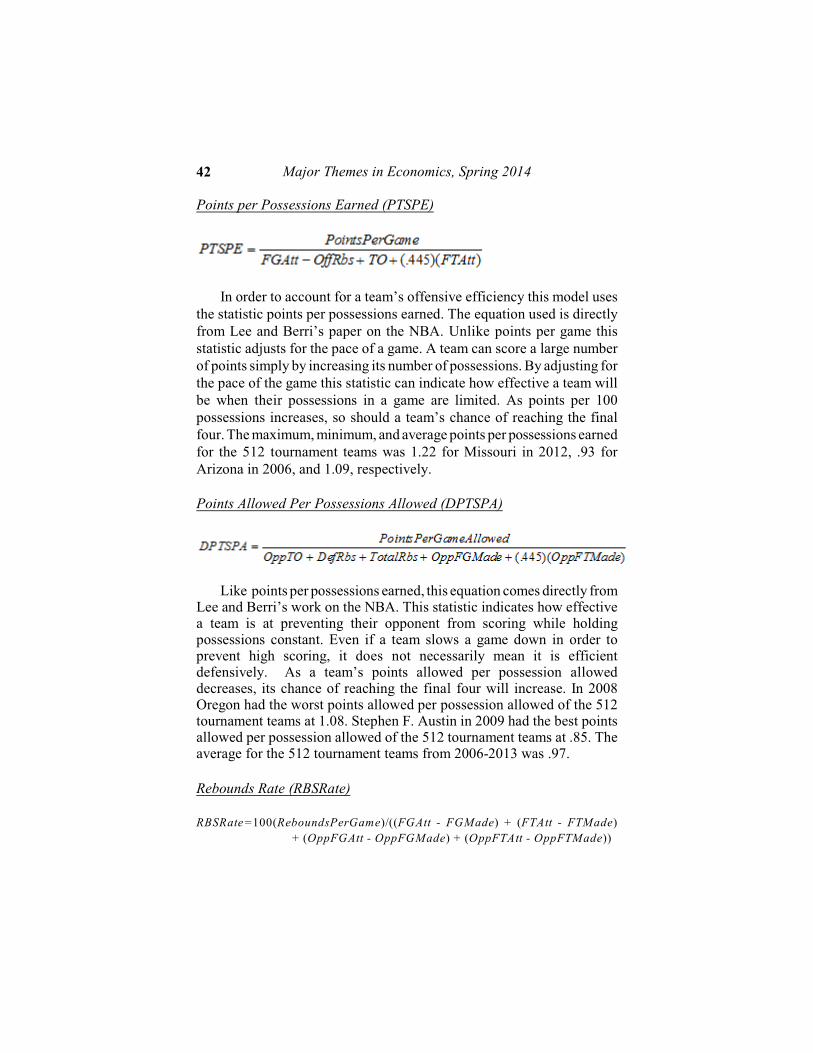
Points per Possessions Earned (PTSPE)
In order to account for a team’s offensive efficiency this model usesthe statistic points per possessions earned. The equation used is directlyfrom Lee and Berri’s paper on the NBA. Unlike points per game thisstatistic adjusts for the pace of a game. A team can score a large numberof points simply by increasing its number of possessions. By adjusting forthe pace of the game this statistic can indicate how effective a team willbe when their possessions in a game are limited. As points per 100possessions increases, so should a team’s chance of reaching the finalfour. The maximum, minimum, and average points per possessions earnedfor the 512 tournament teams was 1.22 for Missouri in 2012, .93 forArizona in 2006, and 1.09, respectively.
Points Allowed Per Possessions Allowed (DPTSPA)
Like points per possessions earned, this equation comes directly fromLee and Berri’s work on the NBA. This statistic indicates how effectivea team is at preventing their opponent from scoring while holdingpossessions constant. Even if a team slows a game down in order toprevent high scoring, it does not necessarily mean it is efficientdefensively. As a team’s points allowed per possession alloweddecreases, its chance of reaching the final four will increase. In 2008Oregon had the worst points allowed per possession allowed of the 512tournament teams at 1.08. Stephen F. Austin in 2009 had the best pointsallowed per possession allowed of the 512 tournament teams at .85. Theaverage for the 512 tournament teams from 2006-2013 was .97.
Rebounds Rate (RBSRate)
RBSRate=100(ReboundsPerGame)/((FGAtt - FGMade) + (FTAtt - FTMade)
+ (OppFGAtt - OppFGMade) + (OppFTAtt - OppFTMade))

Fuqua: The Final Four Formula 43
Rebounds Rate is a statistic that determines what percentage of availablerebounds in a game a team gets. Instead of simply using rebounds pergame, this statistic adjusts for how many available rebounds there are.Having 40 rebounds per game when there are 100 available rebounds isnot as good as having 40 rebounds per game when there are only 50available rebounds. As rebounding rate increases, a team’s chances toreach the final four should increase as well. The minimum reboundingrate for the 512 tournament is 42.54% by West Virginia in 2006. Themaximum rebounding rate for the 512 tournament teams is 58.65% byOld Dominion in 2011. The overall average rebounding rate for the 512tournament teams is 51.99%.
Regional Strength (REGSTR)
Not all regions are created equally. Despite the selection committee’sattempt to make all regions equally competitive, it is rarely achieved. Thisstatistic attempts to account for any discrepancies in the overall strengthof regions. It also will account for the quality of opponents a team mustface in its region to reach the final four. This statistic is created by firstrunning a binary choice logit model excluding regional strength. Thisresults in a predicted probability (ì) for each of the 512 tournamentteams to reach the final four. Then for each individual team I sum the ì’sfor the other 15 teams in its region. For example: In order to calculate theregional strength for 2012 Kentucky (located in the South region) youwould sum the ì’s for each of the other 15 teams in the South region. Thehighest regional strength was for North Carolina A&T in the Midwestregion in 2013 with a regional strength of 1.63. This means that the sumof the ì’s of the other 15 teams in the Midwest region in 2013 was over163 percent. The lowest regional strength was for Villanova in 2006 witha regional strength of .304. This would be that the sum of the ì’s of theother 15 teams in the 2006 Midwest region was just over 30 percent. Theaverage regional strength is .9385.

Major Themes in Economics, Spring 201444
VII. Econometric Results
Variable Coefficient P-Value
Constant -3.39291
SOS .453511 .0033
DPTSPA -20.2455 .0004
PTSPE 9.64882 .0604
RBSRATE 14.957 .2417
RegionStrength
-1.9480 .0303
The primary econometric results to note are the sign of thecoefficients, and the p-values of the coefficients.
As expected, the coefficient on strength of schedule is positive. It isalso statistically significant at the one percent level. This would indicatethat a team from a more prominent conference and is battle tested wouldhave an increased chance to reach the final four. Points allowed perpossession allowed has a negative coefficient as predicted. It is alsostatistically significant at the one percent level. Next, points perpossessions earned was hypothesized to have a positive coefficient andthis turned out to be true. The coefficient is significant at the five percentlevel. Rebounding rate was also hypothesized to have positive effect. Dueto a large p-value one cannot conclusively determine if rebounding rateis statistically different from zero. In other words, rebounding rate maynot influence a team’s chance of reaching the final four. Finally, regionalstrength would be expected to be negative. This is because the tougher aregion is and the more difficult the opponents a team faces on its way tothe final four, the less likely it is to reach the final four. This hypothesisis confirmed at the five percent level.
Common econometric measures of fit may not be relevant to thismodel. Adjusted R2 for this model is calculated as .2534. This means thatthe model is explaining 25 percent of the variation in the dependentvariable. Later in this paper it will be apparent that this is a grossunderestimation. Also, GRETL produces a measure of fit by determining
Fuqua: The Final Four Formula 45
the number of cases “correctly predicted”. GRETL uses the decision rulethat if an observation is greater than .5 that observation will be predictedas a 1. Conversely, GRETL predicts that any observation less than .5 willbe a 0. This is not always the best decision rule for this model because ateam could have a predicted probability under .5 and still be the best teamin its region. For example: In 2013 Louisville would have a predictedprobability of reaching the Final Four of 39.2 percent. While GRETLwould predict Louisville to not reach the Final Four, in the Midwestregion Louisville had the highest predicted probability and thereforewould be correctly predicted to reach the Final Four.
One other item to note about the coefficients of the variables is thedistinct magnitude difference between points per possessions earned andpoints allowed per possession allowed. The average of points perpossession earned is 1.09 and the average for points allowed perpossession allowed is .97. Despite the closeness of these averages, thecoefficient of points allowed per possession allowed is nearly double thatof points per possession earned. This would indicate that perhaps defensedoes truly win championships.
VIII. Application to 2007-2012 Tournaments
In order to determine the quality of this model it is best to compare itspredictive capabilities to that of other current power ratings. Most pre-tournament data is unavailable for current power ratings. Therefore thecomparative analysis is limited to the tournament years 2007-2012. PeterTiernan of Bracket Science and John Ezekowitz of Harvard SportsAnalysis Collective have calculated the predictive capabilities of thepreviously referred to RPI, BPI (limited information), and KenPomRatings. (There is no data on the predictive capabilities of Jeff Sagarin’smodel) They also analyze the predictive capabilities of the “true-seed”method. This method assumes that the higher seed will always win.
A good measure for overall bracket prediction is that of gamescorrectly predicted. This is a measure of how many of the 63 tournamentgames a model would correctly predict if one were to fill out their bracketpre-tournament. The Fuqua Statistic correctly predicts 42.7 (67.2 percent)games on average. This is first among all other power ratings but only byan average of approximately 1 game per year. A good predictive indicator of a power rating is how a bracket filledout prior to the tournament would do on ESPN’s bracket challenge.

Major Themes in Economics, Spring 201446
ESPN’s bracket challenge awards 1 point for correctly predicting a firstround game, 2 points for each sweet sixteen team correctly predicted, 4points for each elite eight team correctly predicted, 8 points for correctlypredicting a final four team, 16 points for correctly predicting achampionship game team, and 32 points for correctly predicting thenational champion. Using these numbers the Fuqua statistic was thirdamong current power ratings. The best rating system according to thismethod would be the true seed method. On average the true seed methodwould score 13 points better per year on ESPN than the Fuqua statistic.The Fuqua statistic struggles to predict the ultimate national championand therefore takes a hit in this scoring system. KenPom’s rating and thetrue seed method predict three and five national champions respectivelyover a six year period. The Fuqua Statistic only predicts two nationalchampions. Up to just the final four however the Fuqua statistic wouldscore the most points on ESPN. It is only the games after the final fourthat it seems other power ratings have an advantage.
One final indicator of predictive success would be its ability topredict matchups. This would mean predicting the first 32 games of theNCAA tournament and then once the next round matchups aredetermined, predict the next 16 games. For example: In 2012 Duke playedLehigh and Notre Dame played Xavier. The winner of these two gameswould face each other. This model would have predicted Xavier to beatNotre Dame (Xavier won) and Duke to beat Lehigh (Lehigh won). Thenit would have predicted Duke to beat Xavier. By filling out the bracketprior to the tournament this model would have correctly predicted onlyone game of three correct. If after the first round, however, I examined theLehigh vs. Xavier matchup my model would have correctly predictedXavier to advance. Therefore, at predicting matchups this model wouldhave predicted two of the three matchups correctly. The premise of thismeasure is flawed because one cannot change one’s predictions once thetournament begins. However, it seems that this is a popular measure ofpredictive capabilities. In this category the Fuqua statistic is second to theBPI by .6 percent.
While these overall tournament measures are useful, the purpose thispaper is to provide a method of predicting the final four. In this category,over a six year period (24 possible final four teams), KenPom, RPI, andthe true seed method would have predicted ten, nine, and ten final fourteams respectively. The Fuqua statistc would have correctly predicted 14final four teams over this same period. This is forty percent better than

Fuqua: The Final Four Formula 47
any of the current models. It appears that this model is superior to allother current ratings in the category in which it is designed to be best.
FuquaStatistic ESPN BPI NCAA RPI True Seed KenPom
Games CorrectlyPredicted
256 238 252 251
Points on ESPNBracketChallenge
479 448 472 4741 1
Points on ESPNBracketChallenge2
623 496 696 625
% of gamesCorrectlyPredicted
67.72 63.00 66.70 66.40
% of MatchupsCorrectlyPredicted
73.8 74.4 73.0 73.0
Final Four TeamsCorrectlyPredicted
14 9 10 10
1 - estimated number based on available data2 - Calculated up to the final four and not beyond
IX. Issues and Further Research
Shi, Moorthy, Zimmerman claim that there is a “glass ceiling” when itcomes to predicting NCAA basketball games. They claim this “glassceiling” is around 74-75 percent. This model seems to reach thispercentage but is unable to break through it. Shi, Moorthy, andZimmerman attribute this to “the attributes (variables) we and others use.”
There are four primary reasons for this ceiling. First, much of therelevant data in a basketball game is unavailable. For example, thenumber of passes per possession may be relevant to basketball success butno such statistic exists and would be extremely difficult to measure.Second, there are several immeasurable aspects to a basketball game.Specifically, college basketball games involve 18 to 22 year old kids with

Major Themes in Economics, Spring 201448
large variations in emotion. There is no way to measure the effect on akey player’s psyche if his girlfriend breaks up with him the night before.Next, the structure of NCAA Division I basketball creates a challengingsetting for predictive analysis. There are 351 teams, and each team has alarge range of resources. Each team is also able to select most of itsopponents, (only a certain number of conference games are required) andeach team only plays roughly 30 games (a small sample size). Thesefactors don’t allow for a good statistical sample for modeling. Finally,there is a large level of randomness involved in basketball. There are tenplayers on a 94 foot by 50 foot court and one wet spot on the floor, onebad call by a referee, or one underinflated basketball, may have a largeimpact on the game.
Further research is possible but highly tedious. There are two mainstatistics that could be calculated and may significantly affect a team’sprobability of reaching the final four. First, a statistic for consistency maybe useful. The best way of calculating this would be by taking thestandard deviation of statistics. The larger a standard deviation a teamhas, the more inconsistent a team is, and the less likely they are to reachthe final four. Secondly, it may be useful to calculate a team’s tournamentand game experience. This may be calculated by using the number oftournament minutes played by a team’s roster.
There is bound to be a breakthrough in the research of predictingsporting events. As our technology increases we are able to calculate andrecord more statistics and therefore have more precise models.
X. Conclusion
Is this just another mediocre attempt at predicting the NCAA tournamentor have any earth shattering discoveries been made? The simple answeris no. The independent variables found to be significant are commonlyagreed on by all basketball pundits. The proverbial glass ceilingdetermined by Shi, Moorthy and Zimmerman of 73-75 percent predictionaccuracy was not broken through. It appears that despite being better thanthe current power ratings in almost all predictive measures it is only bya slight margin. The only true indicator of this being a superior model isthat over the span of six years this model correctly predicted four moreFinal Four teams than other current power ratings. Overall it may be justanother run of the mill model.

Fuqua: The Final Four Formula 49
References
BasketballReference.com. Accessed April2, 2014. http://www.sports-reference.com/cbb/.Carlin, Bradley. 1996. "Improved NCAA Basketball Tournament Modeling via Point
Spread and Team Strength." The American Statistician, 50: 39-43.Lee, Young, and David Berri. 2008. "A Re-Examination of Production Functions and
Efficiency Estimates for the National Basketball Association." Scottish Journal ofPolitical Economy, 55: 51-66.
NCAA.com. Accessed April 2, 2014. http://www.ncaa.com/rankings/basketball-men/d1/ncaa-mens-basketball-rpi.
NCAA.com. 2014. "2013-2014 NCAA Division I Men's Basketball ChampionshipPrinciples and Procedures for Establishing the Bracket." Accessed April 2, 2014.http://www.ncaa.com/content/di-principles-and-procedures-selection.
Oliver, Dean. 2012. "Introducing the BPI." Accessed April 2, 2014.http://espn.go.com/mens-college-basketball/story/_/id/7561413/bpi-college-basketball-power-index-explained.
Pomeroy, Ken. kenpom.com. Accessed April 2, 2014. http://kenpom.com/.Sagarin, Jeff. January 06, 2014. USAtoday.com. Accessed April 2, 2014.
http://www.usatoday.com/sports/ncaaf/sagarin/.Sanburn, Josh. 2013. "March Madness Will Cost Employers $134 Million." Accessed
April 02, 2014. http://business.time.com/2013/03/19/march-madness-will-cost-businesses-134-million-why-arent-employers-concerned/
Shi, Zifan, Sruthi Moorthy, and Albrecht Zimmerman. Accessed April 2, 2014."Predicting NCAAB match outcomes using ML techniques-some results and lessonslearned."http://dtai.cs.kuleuven.be/events/MLSA13/papers/mlsa13_submission_12.pdf.
Woodruff, Mandi. 2012. "You've Got A 1 in 35 Billion Chance At Filling Out ThePerfect March Madness Bracket". Accessed April 2, 2014.http://www.businessinsider.com.au/youve-got-a-1-in-35-billion-chance-at-filling-out-the-perfect-march-madness-bracket-2012-3.