the feasibility study - jica
TRANSCRIPT

APPENDIX - C
Agriculture and Agro-ecomomy

i
APPENDIX - C AGRICULTURE AND AGRO-ECONOMY
Table of Contents
Page
Chapter 1 PRESENT CONDITION OF THR STUDY AREA............................... C - 11.1 Soils and Vegetation..................................................................................... C - 11.2 Population, Households and Labour Force ................................................... C - 11.3 Agriculture .................................................................................................. C - 2
1.3.1 Present Land Use............................................................................ C - 21.3.2 Land Holding and Land Tenure ...................................................... C - 21.3.3 Agriculture Production ................................................................... C - 41.3.4 Animal Husbandry ........................................................................C - 101.3.5 Inland Fisheries .............................................................................C - 12
1.4 Marketing and Processing Facilities ............................................................C - 151.5 Marketing of Farm Inputs and Outputs........................................................C - 18
1.5.1 Marketing of Agricultural Products ...............................................C - 181.5.2 Marketing of Farm Inputs..............................................................C - 201.5.3 Co-operatives and Farmer Companies ...........................................C - 211.5.4 Market Access...............................................................................C - 211.5.5 Export Market Potential.................................................................C - 211.5.6 Agricultural Prices.........................................................................C - 221.5.7 Demand and Supply of Agricultural Products................................C - 22
Chapter 2 PRESENT CONDITIONS OF THE IRRIGATION SCHEMES ...........C - 242.1 General Background of Farmers..................................................................C - 242.2 Agriculture .................................................................................................C - 25
2.2.1 Crop Production ............................................................................C - 252.2.2 Marketing and Credit.....................................................................C - 302.2.3 Extension ......................................................................................C - 31
2.3 Crop Budgeting and Farm Economy ...........................................................C - 312.3.1 Crop Budget ..................................................................................C - 312.3.2 Farm Economy..............................................................................C - 32
Chapter 3 AGRICULTURAL PRODUCTION PLAN ..........................................C - 343.1 Basic Concepts for Agricultural Production Plan.........................................C - 34
3.1.1 Present Problems and Constraints..................................................C - 343.1.2 Need and Potential for Development .............................................C - 34
ii
3.1.3 Basic Concepts for Agricultural Production Plan ...........................C - 353.2 Proposed Land Use .....................................................................................C - 383.3 Proposed Crops and Cropping Pattern.........................................................C - 393.4 Proposed Farming Practices and Crop Production .......................................C - 41
3.4.1 Proposed Farming Practices...........................................................C - 413.4.2 Anticipated Crop Yield and Production..........................................C - 43
3.5 Improvement of Land Fragmentation ..........................................................C - 443.6 Crop Budget and Farm Economy ................................................................C - 45
3.6.1 Crop Budget ..................................................................................C - 45
Chapter 4 IMPROVEMENT OF MARKETING AND CREDIT ..........................C - 474.1 Improvement of Marketing .........................................................................C - 474.2 Agricultural Credit ......................................................................................C - 49
List of Tables
Page
Table C 1.1 Fish Production in Anuradhapura District – 1999............................... CT - 1Table C 2.1 Inputs on Crop Production in the Irrigation Schemes ......................... CT - 2Table C 2.2 Problems Related to Farming............................................................. CT - 3Table C 2.3 Farmers’ Intention to Improve Farming ............................................. CT - 3Table C 2.4 Farmers’ Situation on Marketing of Inputs and Outputs on Farming .. CT - 4Table C 2.5 Extension Services ............................................................................ CT - 5Table C 2.6 Crop Budget – Present ....................................................................... CT - 6Table C 3.1 Food Balance 1992 – 1997 ................................................................ CT - 7Table C 3.2 Proposed Cropping Pattern (1/3 - 3/3) ............................................... CT - 8Table C 3.3 Proposed Crop Production............................................................... CT - 11Table C 3.4 Proposed Cropping Budget (1/4 - 4/4) ............................................. CT - 12Table C 3.5 Crop Budget with Project (1/2 - 2/2)................................................ CT - 16
List of Figures
Figure C 1.1 Present and Proposed Cropping Calendar .......................................... CF - 1Figure C 3.1 Demand and Supply of Major Crops in Sri Lanka.............................. CF - 2

C - 1
APPENDIX - C AGRICULTURE AND AGRO-ECONOMY
Chapter 1 PRESENT CONDITION OF THE STUDY AREA
1.1 Soils and Vegetation
The Study area is principally situated under three Agro-ecological zones, whichare Low-country Intermediate zone 1 (IL1), Low-country Intermediate zone 2(IL3) and Low-country Dry zone 1 (DL1) from the south to the north. Annualrainfall in IL1 is less than 1,016 mm (40 inches). The Low-country Intermediatezone 1 is situated in the southern part of the Study area and Low-country Interme-diate zone 3 is in the mid-part of Kurunegala district. The northern part ofKurunegala district to Anuradhapura district is under Low-country Dry zone 1.
Natural vegetation of the Study area belongs to the tropical semi-evergreen forestsin the intermediate zone and dry mixed evergreen forests in the dry zone. Theoriginal natural forest has been destroyed by shifting cultivation. The presentvegetation in the intermediate and dry zones in the study area is mostly the secon-dary vegetation and the trees in the dry zone are mainly microphyllous ormesophyllous and consist of both evergreen and deciduous species.
In relation with soil groups and vegetation, typical vegetation of dry mixed ever-green forest is in the reddish brown earth. The vegetation in the low humic gleysoil is not much different from that of associated with reddish brown earth or non-calcic brown soil, however, general stands are poorer in some cases due to peri-odical water logging and richer in case of favourable moisture contents. In thenon-calcic brown soil, the natural vegetation is dry mixed evergreen. Thegrowth is generally poorer than that in the reddish brown earth, although com-position of species is almost same. Under the alluvial soils, the richest and theworst vegetation occur in the dry zone, due to the high water table or the veryclayey texture. Tall trees with the other mesophytic species are found on thissoil.
1.2 Population, Households and Labour Force
The study area has a total population of 1,275,000, more than 90% being SinhalaBuddhists and 5% Muslim, and Islam. The population is divided equally amongthe sexes, and 14% is below 14 years of age. The economically active populationis about 65%. Over 18% have studied above grade 10 and less than 7% have hadno schooling at all. Female-headed families form 17.5% of the total households,

C - 2
and there is a dependent population 35-40%.
There are 292,500 housing units in the study are, and the household size is 4.3.The labour force accounts for 52% of the population, and 48% are economicallyinactive. Over 45% are engaged in agriculture, 25% are production and relatedworkers and 6% each is involved in clerical, sales and service activities.
1.3 Agriculture
1.3.1 Present Land Use
Land use information1 was obtained from the Land Use Planning Office and pub-lications of the Survey Department. The total land area of the Study area isestimated at 5,600 km2 (excluding large inland water areas) consisting of 29% ofAnuradhapura District, 13% of Matale District, 65% of Kurunegala District, and6% of Puttalam District. The present land use in the Study area with those infour districts concerned is summarised in the following table. In the Study area,farmland covers 63%, and forestland is 15%. The water area occupies about 7%of the Study area, mainly consists of reservoirs a irrigation tanks. Remaining15% is in grasslands, homestead and others.
Present Land Use
Districts/Divisions Farm Land Forest Grass-land
InlandWater
Homestead& Others
Total *2
Area by Land Use Categories (km2)Study Area *1 3,523 818 9 407 844 5,601Anuradhapura District 3,059 3,015 17 526 561 7,178Matale District 870 801 56 41 228 1,996Kurunegala District 3,764 258 1 192 562 4,777Puttalam District 1,276 1,011 42 213 374 2,916
Proportion (%)Study Area *1 62.9 14.6 0.2 7.3 15.0 100.0Anuradhapura District 42.6 42.0 0.2 7.3 7.9 100.0Matale District 43.6 40.1 2.8 2.1 11.4 100.0Kurunegala District 78.8 5.4 0.0 4.0 11.8 100.0Puttalam District 43.8 34.7 1.4 7.3 12.8 100.0
*1 Out of 30 Divisions related to the Study area, Nuwaragam P.E. and NochchiyagamaDivisions are included only 10% and 20% in the Study area, respectively.
*2 Excluding large inland water areas.
1 Land use information is provisional, due to the subdivision of Divisional Secretary divisions after 1981
and the process of revising information. The number of Divisional Secretary divisions has increased from1981 to the present from seventeen (17) to twenty-nine (29) in Kurunegala district, twenty (20) to twenty-one (21) in Anuradhapura district, ten (10) divisions to sixteen (16) divisions in Puttalam district andMatale district is from nine (9) to eleven (11). The revision of the present land use information is carryingout by the District Land Use Planning Office using more precisely categorised agricultural land uses.

C - 3
1.3.2 Land Holding and Land Tenure
(1) Land Holding
There are two distinct settlement types in the area, and land holding of farmersdefer between them.
a) Purana village
The settlements are hundreds of years old, and are originally located near themost accessible sources of fresh water for agriculture and domestic use.Agricultural holdings in Purana villages consist of both paddy land andrainfed upland.
b) Settlements (Colonies)
The settlements have been launched by government developmentinterventions, dated from before the independence (1947). The colonies arebased on irrigation schemes, mostly in major irrigation schemes. Thesettlers were allocated land in the schemes and the allotments of varioussizes contain paddy land, rainfed upland and homesteads.
Previous study of IFAD and ADB projects describe land fragmentation in bothPurana villages and settlements. The expanding population has become less andless accessible to land with a reliable year-round supply of water, and to maintainan appropriate standard of living, especially for newly established households.
(2) Land Tenure
The government legally recognised two categories of land ownership; (i) privatelyowned land and (ii) the government owned ‘Crown’ land. In addition, agricul-tural land and cultivated land are cultivated under four different conditions.
a) Privately owned land (land cultivated by the owner):
Cultivators are holding the legal title and the land is obtainable byinheritance, purchase or mortgage.
b) Tenant land (privately owned land cultivated by a tenant):
Cultivators are not owners but the tenants recognised their right to work onthe land. Tenant’s rights on the land is recognised socially, and the legalstructure on tenancy, by the Agrarian Act. Type of tenancy agreementvaries with traditions and social and economic relations of participants.
c) Permit land (Crown land cultivated under a permit):
The right of land usage for agricultural purposes is provided under the LandDevelopment Ordinance (LDO). The land has originally been encroached

C - 4
on Crown land and is in the process of being regularised. The permit doesnot represent a legally recognised claim to the land, it is only to qualify toutilise the land for certain agricultural purposes and for dwelling. The rightof using the land is on a ninety-nine (99) year lease, however it is heritableaccording to the legal order in the family during this period.
d) Non permitted land (land cultivated by encroachers without any legalstatus to their claim):
The land is encroached without any legal basis of claiming and using Crownland. Original form of Chena (slashed and burned, shifting cultivation) waspractised on this land and it is still carried on at present by landlesscultivators, micro and small landholders and refugees residing in the area.
The situation of land tenure of the Study area in the Kurunegala district is, 44.4%of the land is privately owned, 10% is under colonisation land, 31.6% is permittedland and approximately 8% is government owned crown land, however, still27,787 acres (6.0%) is classified as encroached land.
In the Anuradhapura district, reliable data on privately owned land was not avail-able. The Divisional Secretary divisions under the Study area are mostly part ofthe Mahaweli System ‘H’. Within the Study area, an average percentage of thegovernment land in the respective Divisional Secretary (DS) division area is about10%. Average permitted land of respective DS division is about 15% in theStudy area and 16.3% in entire district, and encroached land is 5.8% and 4.3%respectively. Over 342,000 acres of land has been applied for the legal permitsand is now on the process for being regularised. The permit is normally issued ata maximum of two (2) acres per applicant in case of agriculture land, but dependson the purpose of application.
1.3.3 Agriculture Production
(1) Paddy Cultivation
Main crop in the study area is paddy. It is not only in the Study area but alsovery important for farmers in entire country, especially for medium and smallscale farmers. Cultivation area and cropping intensity of paddy in the Study areaand two districts are shown in the following tables. Total cultivation area ofpaddy in the Study area in 1996/97 Maha and 1997 Yala is estimated to be 71,200ha which consist of 26,700 ha for major and medium irrigation schemes, 28,200ha for minor scheme, and 16,300 ha for rainfed field. Cropping intensity ofpaddy cultivation at the same seasons is estimated to be 96%.

C - 5
Paddy Cultivation in 1996/97 Maha and 1997 Yala (Unit: 1,000 ha)
1996/97 Maha 1997 Yala Annual TotalIrrigated Irrigated Total IrrigatedDistricts/Divisions
Major MinorRain-fed
TotalMajor Minor
Rain-fed Major Minor
Rain-fed
Total
Asweddumized AreaStudy Area*1 24.6 42.1 17.0 83.7 24.6 42.1 17.0 83.7 49.2 84.2 34.0 167.4Anuradhapura *1 29.7 39.6 2.6 71.9 29.7 39.6 2.6 71.9 59.4 79.2 5.2 143.8Kurunegala *2 12.5 35.0 29.8 77.3 12.5 35.0 28.9 76.4 25.0 70.0 58.7 153.7
Sown AreaStudy Area*1 17.0 22.4 13.3 52.7 11.0 9.8 7.0 27.8 28.0 32.2 20.3 80.5Anuradhapura *1 9.6 6.0 0.1 15.7 3.0 1.2 0.0 4.2 12.6 7.2 0.1 19.9Kurunegala *2 11.3 23.9 25.8 61.0 7.5 14.0 18.1 39.6 18.8 37.9 43.9 100.6
Harvested AreaStudy Area*1 16.9 19.9 10.5 47.3 9.8 8.3 5.8 23.9 26.7 28.2 16.3 71.2Anuradhapura*1 9.4 5.9 0.1 15.4 2.9 1.2 0.0 4.1 12.3 7.1 0.1 19.5Kurunegala *2 11.2 21.5 22.6 55.3 6.4 11.9 15.4 33.7 17.6 33.4 38.0 89.0
*1 Excluding Mahaweli System 'H'*2 Recently, Galgamuwa was divided into Galgamuwa and Ahetuwewa, and Maho was into Maho and
Ambanpola. Source: Agricultural Statistics of Sri Lanka 1997, Department of Census and Statistics,October 1998.
Cropping Intensity of Paddy Cultivation in 1996/97 Maha and 1997 Yala
IrrigatedDistricts/DivisionsMajor Minor
Rainfed Whole Area
Study Area*1 114% 76% 119% 96%Anuradhapura District*1 42% 18% 4% 28%Kurunegala District 150% 108% 152% 132%*1 Excluding Mahaweli System 'H'Note: Cropping Intensity = Total Sown Area of Maha & Yala / Asweddumized Area x 100Source: Agricultural Statistics of Sri Lanka 1997, Department of Census and Statistics, October 1998.
In 1996 and 1997, the cropping intensity of paddy cultivation in the country fellby 100%, due to a long spell of dry weather. Especially, Anuradhapura districtlocated in the dry zone extremely dropped by more than 30%. In 1998, it has im-proved to the normal level. The Kurunegala district situated in the wet zone insouthern part, intermediate zonein the middle part and dry zonein the north, and culturalpractices in the slope area tolowland wet zone in the south arerather intensive compare with theother parts.
Harvesting rate, that is, the rateby sown area to harvested area,is significantly affected by watercondition. Under major irrigationschemes, minor schemes andrainfed conditions are 99%, 89%and 79% in 1996/97 Mahaseason, 89%, 85% and 83% in
0
20
40
60
80
100
120
140
160
180
1993/94 M& 1994 Y
1994/95 M& 1995 Y
1995/96 M& 1996 Y
1996/97 M& 1997 Y
1997/98 M& 1998 Y
Crop
ping
Inte
nsity
(%
)
Anuradhapura
Whole Country
Kurunegala
Source: Agricultural Statistics of Sri Lanka 1997, Department of Census and Statistics

C - 6
1997 Yala season in the Study area, respectively. The difference of water securityunder irrigated conditions and rainfed condition is reflected to the harvesting rate.
The production of paddy in 1997 Yala and 1997/78 Maha in Anuradhapura andKurunegala districts is estimated to be 240,000 tons and 342,000 tons, respec-tively. Anuradhapura district has shown a higher unit yield, which is estimatedat 4.2 tons/ha, than 3.2 tons/ha of Kurunegala district.
The table below shows these farming practices of paddy in both districts in 1997Yala and 1997/98 Maha. Almost all farmers in Anuradhapura and KurunegalaDistricts have used new improved varieties such as BG350 and BG300, and thecultivation of traditional varieties is negligibly small. Broadcasting accounts 90%of total sown area in both districts. Most of land preparation in Anuradhapura hasbeen done by tractor, while 30-40% of sown area in Kurunegala district was byanimal power. Harvesting is completed by mid March and mid September inMaha and Yala seasons respectively. Threshing by machines coupled to the twoor four-wheel tractor is the most widely used. Application of chemical fertilisercontained N, P and K is prominent. Chemicals control of weed and pest anddisease is common practice. The fertilisers and agro-chemicals have been usedcommonly in the area, and the use of weedicide is increasing yearly along withrising wage of labour.
Paddy Production in 1997 Yala and 1997/78 Maha
1997 Yala 1997/98 Maha Annual TotalIrrigated Irrigated IrrigatedDistricts
Major MinorRain-fed Total
Major MinorRain-fed Total
Major MinorRain-fed Total
Net Harvested Area (1,000 ha)Anuradhapura*1 2.3 1.0 - 3.3 23.4 28.7 1.7 53.8 25.7 29.7 1.7 57.1Kurunegala 6.4 11.9 15.4 33.7 12.1 32.6 27.7 72.4 18.5 44.5 43.1 106.1Whole Country 128.0 40.0 54.0 222.0 232.0 129.0 139.0 500.0 360.0 169.0 193.0 722.0
Production (1,000 tons)Anuradhapura*1 8.1 3.2 - 11.3 100.6 122.3 5.6 228.5 108.7 125.5 5.6 239.8Kurunegala 25.0 31.2 33.0 89.2 44.3 123.2 85.3 252.8 69.3 154.4 118.3 342.0Whole Country 530.0 110.0 140.0 780.0 930.0 460.0 390.0 1,780
.0 1,460.0 570.0 530.0 2,560.0
Unit Yield (ton/ha)Anuradhapura*1 3.5 3.2 - 3.5 4.3 4.3 3.3 4.3 4.2 4.2 3.3 4.2Kurunegala 3.9 2.6 2.1 2.6 3.7 3.8 3.1 3.5 3.7 3.5 2.7 3.2Whole Country 4.1 2.9 2.5 3.5 4.0 3.5 2.8 3.6 4.1 3.4 2.7 3.5
*1 Including Mahaweli System 'H'Source: Agricultural Statistics of Sri Lanka 1997, Department of Census and Statistics, October 1998.
C - 7
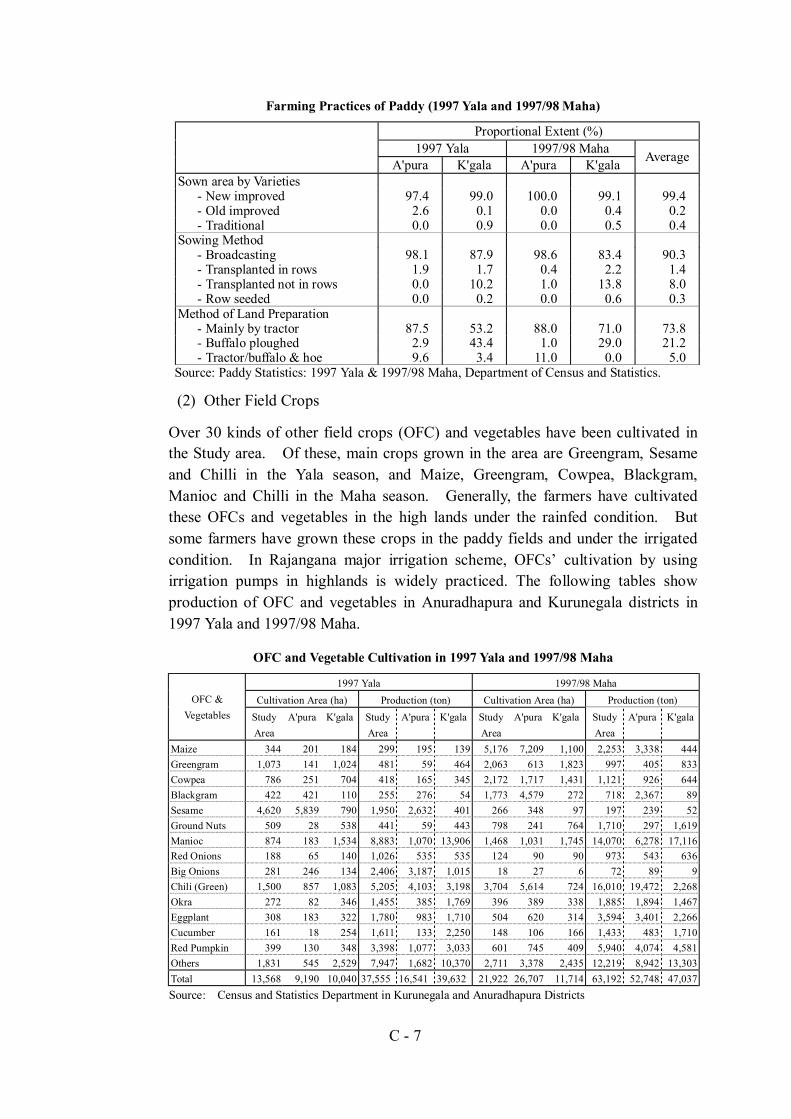
Farming Practices of Paddy (1997 Yala and 1997/98 Maha)
Proportional Extent (%)1997 Yala 1997/98 Maha
A'pura K'gala A'pura K'gala Average
Sown area by Varieties- New improved 97.4 99.0 100.0 99.1 99.4- Old improved 2.6 0.1 0.0 0.4 0.2- Traditional 0.0 0.9 0.0 0.5 0.4
Sowing Method- Broadcasting 98.1 87.9 98.6 83.4 90.3- Transplanted in rows 1.9 1.7 0.4 2.2 1.4- Transplanted not in rows 0.0 10.2 1.0 13.8 8.0- Row seeded 0.0 0.2 0.0 0.6 0.3
Method of Land Preparation- Mainly by tractor 87.5 53.2 88.0 71.0 73.8- Buffalo ploughed 2.9 43.4 1.0 29.0 21.2- Tractor/buffalo & hoe 9.6 3.4 11.0 0.0 5.0
Source: Paddy Statistics: 1997 Yala & 1997/98 Maha, Department of Census and Statistics.
(2) Other Field Crops
Over 30 kinds of other field crops (OFC) and vegetables have been cultivated inthe Study area. Of these, main crops grown in the area are Greengram, Sesameand Chilli in the Yala season, and Maize, Greengram, Cowpea, Blackgram,Manioc and Chilli in the Maha season. Generally, the farmers have cultivatedthese OFCs and vegetables in the high lands under the rainfed condition. Butsome farmers have grown these crops in the paddy fields and under the irrigatedcondition. In Rajangana major irrigation scheme, OFCs’ cultivation by usingirrigation pumps in highlands is widely practiced. The following tables showproduction of OFC and vegetables in Anuradhapura and Kurunegala districts in1997 Yala and 1997/98 Maha.
OFC and Vegetable Cultivation in 1997 Yala and 1997/98 Maha
1997 Yala 1997/98 MahaCultivation Area (ha) Production (ton) Cultivation Area (ha) Production (ton)OFC &
Vegetables StudyArea
A'pura K'gala StudyArea
A'pura K'gala StudyArea
A'pura K'gala StudyArea
A'pura K'gala
Maize 344 201 184 299 195 139 5,176 7,209 1,100 2,253 3,338 444Greengram 1,073 141 1,024 481 59 464 2,063 613 1,823 997 405 833Cowpea 786 251 704 418 165 345 2,172 1,717 1,431 1,121 926 644Blackgram 422 421 110 255 276 54 1,773 4,579 272 718 2,367 89Sesame 4,620 5,839 790 1,950 2,632 401 266 348 97 197 239 52Ground Nuts 509 28 538 441 59 443 798 241 764 1,710 297 1,619Manioc 874 183 1,534 8,883 1,070 13,906 1,468 1,031 1,745 14,070 6,278 17,116Red Onions 188 65 140 1,026 535 535 124 90 90 973 543 636Big Onions 281 246 134 2,406 3,187 1,015 18 27 6 72 89 9Chili (Green) 1,500 857 1,083 5,205 4,103 3,198 3,704 5,614 724 16,010 19,472 2,268Okra 272 82 346 1,455 385 1,769 396 389 338 1,885 1,894 1,467Eggplant 308 183 322 1,780 983 1,710 504 620 314 3,594 3,401 2,266Cucumber 161 18 254 1,611 133 2,250 148 106 166 1,433 483 1,710Red Pumpkin 399 130 348 3,398 1,077 3,033 601 745 409 5,940 4,074 4,581Others 1,831 545 2,529 7,947 1,682 10,370 2,711 3,378 2,435 12,219 8,942 13,303Total 13,568 9,190 10,040 37,555 16,541 39,632 21,922 26,707 11,714 63,192 52,748 47,037Source: Census and Statistics Department in Kurunegala and Anuradhapura Districts
C - 8
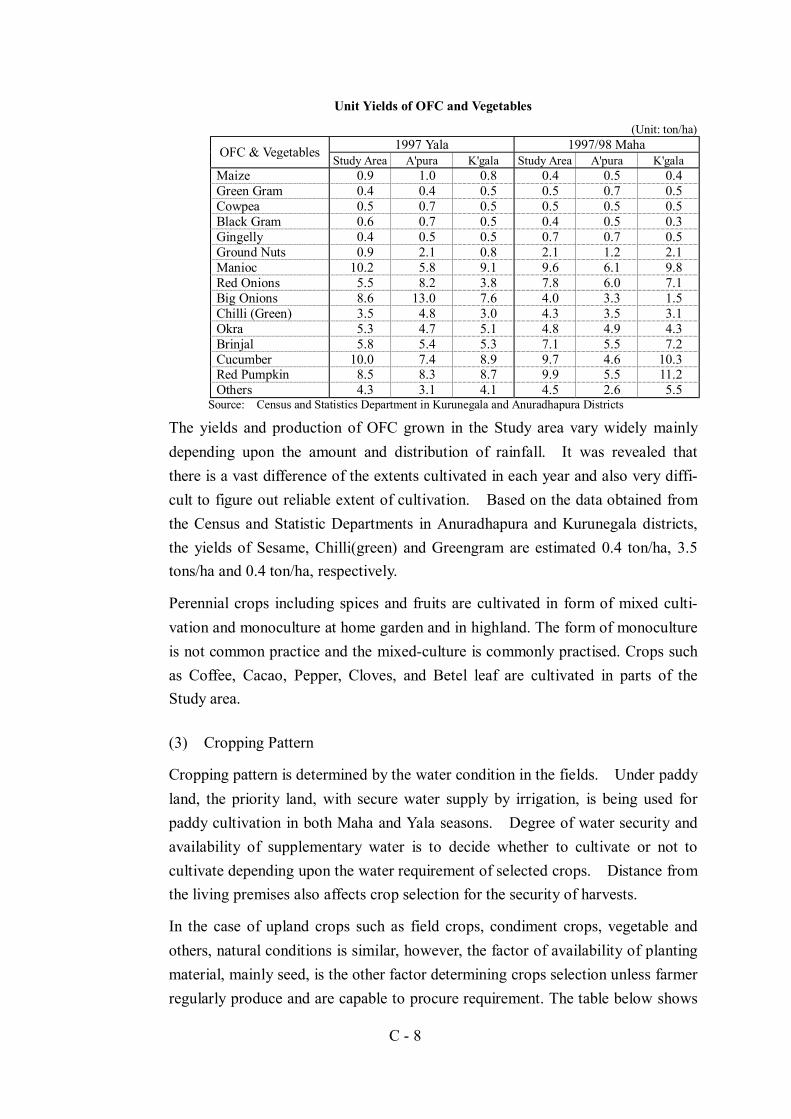
Unit Yields of OFC and Vegetables
(Unit: ton/ha)1997 Yala 1997/98 MahaOFC & Vegetables
Study Area A'pura K'gala Study Area A'pura K'galaMaize 0.9 1.0 0.8 0.4 0.5 0.4Green Gram 0.4 0.4 0.5 0.5 0.7 0.5Cowpea 0.5 0.7 0.5 0.5 0.5 0.5Black Gram 0.6 0.7 0.5 0.4 0.5 0.3Gingelly 0.4 0.5 0.5 0.7 0.7 0.5Ground Nuts 0.9 2.1 0.8 2.1 1.2 2.1Manioc 10.2 5.8 9.1 9.6 6.1 9.8Red Onions 5.5 8.2 3.8 7.8 6.0 7.1Big Onions 8.6 13.0 7.6 4.0 3.3 1.5Chilli (Green) 3.5 4.8 3.0 4.3 3.5 3.1Okra 5.3 4.7 5.1 4.8 4.9 4.3Brinjal 5.8 5.4 5.3 7.1 5.5 7.2Cucumber 10.0 7.4 8.9 9.7 4.6 10.3Red Pumpkin 8.5 8.3 8.7 9.9 5.5 11.2Others 4.3 3.1 4.1 4.5 2.6 5.5
Source: Census and Statistics Department in Kurunegala and Anuradhapura Districts
The yields and production of OFC grown in the Study area vary widely mainlydepending upon the amount and distribution of rainfall. It was revealed thatthere is a vast difference of the extents cultivated in each year and also very diffi-cult to figure out reliable extent of cultivation. Based on the data obtained fromthe Census and Statistic Departments in Anuradhapura and Kurunegala districts,the yields of Sesame, Chilli(green) and Greengram are estimated 0.4 ton/ha, 3.5tons/ha and 0.4 ton/ha, respectively.
Perennial crops including spices and fruits are cultivated in form of mixed culti-vation and monoculture at home garden and in highland. The form of monocultureis not common practice and the mixed-culture is commonly practised. Crops suchas Coffee, Cacao, Pepper, Cloves, and Betel leaf are cultivated in parts of theStudy area.
(3) Cropping Pattern
Cropping pattern is determined by the water condition in the fields. Under paddyland, the priority land, with secure water supply by irrigation, is being used forpaddy cultivation in both Maha and Yala seasons. Degree of water security andavailability of supplementary water is to decide whether to cultivate or not tocultivate depending upon the water requirement of selected crops. Distance fromthe living premises also affects crop selection for the security of harvests.
In the case of upland crops such as field crops, condiment crops, vegetable andothers, natural conditions is similar, however, the factor of availability of plantingmaterial, mainly seed, is the other factor determining crops selection unless farmerregularly produce and are capable to procure requirement. The table below shows

C - 9
simple cropping patterns under various water and other conditions;
Cropping Patterns under Various Water Conditions
Cropping PatternsMahaSeason
YalaSeason
Conditions
Paddy LandPaddy Paddy Sufficient water supply, under irrigation systemPaddy OFC Insufficient water supply, Supplemental water is availablePaddy Vegetable Insufficient water supply, Supplemental water is available, Intensive
crop management is availablePaddy Fallow Insufficient water, No available labour, No financial capability,
Other job opportunityUpland (High Land)OFC OFC Selecting short-term crops as Sesame, PulsesOFC Vegetable Supplemental water available as Agro-well, labour and intensive
crop management are available
Vegetable Vegetable Supplemental water available as Agro-well, labour and intensivecrop management are available, Homestead
OFC Fallow Only depending on rainfall
The Department of Agriculture (DOA) has prepared and published therecommended crops and a cropping calendar according to Agro-ecological zonecovering the entire country. Technology Guide for individual crops and croppingsystems are also available in public. Individual disciplinary technicalinformation has been published at a low cost.
On the other hand, further technology for paddy cultivation is available in the RiceResearch and Development Institute, Battalagoda. The institute is capable toprovide simplified colour charts of crop nutrient condition and diagnosis andrecommendation of fertiliser application based on potential of soil and economiccapability of farmers from the results and experiences of research works.
(4) Cropping calendar
Time of paddy cultivation is determined by water condition. Land preparation willinitiate by rainfall in every cropping season of Maha and Yala in most of irrigationscheme. Water in the tank is to be released when certain level of reservation isachieved. Therefore sufficient rainfall is required for field preparation and waterreservation in the tank in order to start cropping.
In the other hand, rainfall pattern is to supply sufficient water for field and tankbefore the end of October in Maha cultivation and before the middle of April inYala. These patterns will fit on time for double cropping system of paddycultivation by using recommended 3 month to 3 1/2 month varieties. It is alsomentioned late planting of Maha cultivation might encounter to insect attack andsevere drought in July and August. (Figure C 1.1)

C - 10
1.3.4 Animal Husbandry
(1) Present Condition of Livestock Husbandry
Livestock is very important component for farming community, although role ofanimal power for drafting is replaced by machinery in some extent. However,economic and social roles of the livestock sector are increasingly important onrural development.
Traditionally, Sri Lanka has a habit of consuming “Curd”. The demand of live-stock products is increasing according to social and economical changes andimprovement of national nutritional status. On the other hand, in order toconduct an effective farming system, application of livestock by-products, such asmanure and dung for all kinds of crops is highly recommended for increasingproductivity and soil management in order to achieve higher yield for highereconomic return, reduction of chemical fertiliser cost and sustainable farming.
The Study area is an important for the livestock industry in the country. A largenumber of animals are raised under various types of management. According tothe information of the Census & Statistics Department, nearly 178,000 cattle, over136,000 buffaloes, 55,600 goats and 809,000 poultry are raised in the Study area.
Population and Production of Livestock in 1998
Study Area Anuradhapura KurunegalaCattle
Milking Cow 59,500 49,900 60,800Other cows, bulls & calves 118,400 68,000 137,200Total 177,900 117,900 198,000
BuffaloesMilking Cow 28,800 24,200 18,300Other cows, bulls & calves 106,700 43,600 124,400Total 135,500 67,800 142,700
Goats 55,600 34,500 58,500Sheep 150 530 1,960Pigs 8,320 3,060 9,330Poultry
Cocks 97,000 40,000 202,000Laying hens 361,000 56,000 802,000Other hens & chicks 351,000 74,000 876,000Total 809,000 170,000 1,880,000
Ducks 550 140 730Milk Production (lit./month) 1,440,000 1,800,000 1,760,000Egg Production (No./month) 3,750,000 950,000 9,870,000Source: Department of Census and Statistics, Anuradhapura and Kurunegala Districts.
Average production of cow and buffalo milk in the Study area was 1,440,000litters/month and eggs were 3,750,000 nos./month.

C - 11
(2) Government’s Support Services
The Department of Animal Production and Health (DAPH) carry out technicalservices for livestock development. Animal health care and artificial inseminationservices are provided through the Veterinary Surgeons Centres (VSC). A centreis established in each Veterinary Surgeons Region headed by a veterinary surgeonand several livestock development instructors (LDIs). There are twenty-five (25)regions in the Kurunegala district and nineteen (19) regions in the Anuradhapuradistrict. The centre provides diagnosis of diseases free mostly and sometimecharged Rs. 10 to Rs. 20. Material as medicine is charged at the cost price or hasto purchase at shops by the farmers. Vaccinations for three epidemic diseases,Black quarter, Foot & mouth disease and Haemorrhagic septicaemia, are providedfree of charge at the centres. The artificial insemination is carried out by LDIsand charged about Rs. 20 for the first time and following two times when failed.
(3) Major Approach for Promoting Livestock Husbandry
A regional approach is taken for livestock development in the Kurunegala district,dairy and poultry in the wet zone of southern part of the district, the coconuttriangle, and dual-purpose cattle, goat and small-scale poultry is carried out in theintermediate and dry zones in north. Friesian and Jersey varieties for qualityimprovement of local dairy cows by cross breeding are used in the wet zone andSahiwal variety is used in the north for the dual purpose of meat and milk.Indian Livestock Development Co-operation (ILDC) is supporting with technicaland material for the improvement of the project. Breeding is considered as themost important to improve livestock production, especially for dairy cattle byextensively practising AI.
The Department is carrying out a “Heifer Calf Project” in Kurunegala andAnuradhapura districts, which subsidises 50% of concentrated feed for improvedheifer calves by AI from the birth to 30 months old for increasing milkproduction.
The Goats development program is conducted in the Anuradhapura district, IFADsponsored PRDP (Participatory Rural Development Project) covers sixteen (16)Divisional Secretary divisions, and ADB sponsored IRDP (Integrated RuralDevelopment Project) is in five (5) DS divisions mainly in the Mahaweli scheme.The PRDP initiated the goat program since 1996 started from nine (9) DSdivisions. Rural Economic Advancement Programme (REAP) and Prague pro-grammes are incorporated in the PRDP in a similar approach since 1998. Thegoat unit is adjusted according to the situation and sponsored program. The goat

C - 12
unit in 1996 was three (3) females with one (1) male then the unit was adjusted totwo (2) females with one (1) male after 1997 and the unit of five (5) females withone (1) male was applied under REAP in 1998.
The programme is that participant farmer provided the goats unit is to return thesame number of goats to the project in three years for distributing to other farmers.Sri Lanka has a traditional mutual-help system called “Ande” similar to theprogramme. It is that an owner provides animal to other person for taking carethen the person has to return every other born animal to the original owner.
Kurunegala district is also implementing a similar project on goat and dairy cattlewith the IFAD founded NWP Participatory Rural Development Project. Thesystem is the same as in the Anuradhapura district, however the goat unit is four(4) female with one (1) male. Over 1,000 goat units have been distributed andmore than 1,000 goats were produced in four (4) years but number of returnedgoats to the project is not known.
1.3.5 Inland Fisheries
(1) Present Condition of Inland Fisheries
An inland fishery in the Study area is carried out on the existing water resourcesfor agricultural irrigation. A large number of minor and major irrigation tanksand reservoirs are there and are closely associated with people’s life. Fishculture is a mainstream of development approach to rural communities and indi-viduals for generating income as well as improving nutritious status of peopleresiding the area.
An inland fishery is a rather new subject as a development component and it hasbeen revived in 1994. Previously established government facilities as breedingcentres for inland fishery in Kurunegala and Dambulla had been privatised some-time ago and the Dumbbell Inland Fishery Breeding Centre has been reorganisedas the government facility in order to produce and distribute fish fry andfingerlings into inland water resources for rural development. Inland fisheries isrecognised as an important and attractive component for development in ruralcommunities. Recently one JOCV volunteer has been assigned to the Centre.
(2) Fingerling Production
Fingerling production is carrying out by the Inland Fishery Breeding Centre atDambulla and is distributing, not only in the North Central and the North WesternProvinces but also in the other part of country. Fish fry and fingerling of Tilapias,

C - 13
Carps and local variety of fish are produced. Tilapia is nilotica and mozambiquespecies. Carps are Ruhu and Catula Catula, which are Indian carps, Silver carpfrom China and Common carp. Hirikaneya is a local species named in Sinhala.The centre breeds fish naturally once a year from March to July and artificialbreeding method using hormones in the other seasons. There are ten of 20m x20m ponds for fish rearing and of two are rehabilitated by the ADB funded NorthCentral Province Area Development Project in 1999.
(3) Government’s Supporting Services
The Centre provides for three major programmes in the study area. “Fish fryculture in cage” is one that cultivates fish fry in a fixed floating cage until theygrow to fingerling stage (about 5 cm) on small-scale tanks then releasing. In thisprogram, a total of 45,500 fry are distributed and 9,000 and 5,000 are distributedin Kurunegala and Anuradhapura districts in the last six months in 1999.
‘Table fish culture in pond’ is to provide fingerlings to seasonal and perennialtanks. The seasonal tank is a small irrigation tanks that are capable to reservewater for six months at least and the activity is run by farmers’ organisations ofthe minor irrigation schemes. The perennial tank is a large reservoir where wateris available throughout the year and managed by Fishery Co-operative Societyorganised by member. The centre distributed 27,200 fingerlings to seasonaltanks and 27,650 for perennial tanks in the last six months.
(4) Existing Development Plans
Wayamba (North-western province) Development Authority raised 25 potentialseasonal and 15 perennial tanks in Kurunegala and Puttalam districts under the1999 development plan. Among the potential tanks, 7 seasonal tanks and 3perennial tanks are considered as priority. The Authority has submitted therequests of grants to JICA for the provision of fishing nets and fibreglass boatsand the training programmes with the experts.
The criteria for selecting potential tanks are that; (i) water is available at least 8month period, (ii) free from water plants in 3 to 4 feet depth from the tank surfacefor plankton propagation with solar radiation and (iii) farmers’ participation forcleaning tank and management.
Required number of fingerlings is estimated by Wayamba Development Authoritythat is 2,000 to 2,500 per ha for seasonal tank and 200 to 250 per ha for perennialtank. Fish are to be harvested 500 to 700g per ha after six to eight months and aresold by Rs.40 to Rs.50 at farm gate prices. The costs for fingerlings are to be

C - 14
Rs.2 to 2.5 per fish for Carp species and Rs.1 to 1.5 for Tilapia species. Possiblereturn of Rs. 26,000 to Rs.33,000 is expected. Potential fish production by tank isinformed by the Fishery Extension Coordinator, Anuradhapura that 200 to 300kg/ha/year in Minor tank and 35 kg/ha/day in Major and Medium tank areestimated. In case of small-scale fishpond cultivation, 1,380 kg of fish productionis estimated from 1,500 fingerings in 0.5 acre pond after 8 month cultivation.
The priority area for inland fishery development is considered to be in seven (7)major tanks, thirteen (13) medium tanks and eight (8) seasonal tanks, and twenty-one (21) by ADB project and four (4) Samurdi Programme would implementcargo fry cultivation in 2000. Fishery group under Farmers’ Organisations hasbeen successfully adapted. The fish cultivation in the rural community runs byorganising fishery co-operative society in major and medium tanks, and fisheryorganisation under the farmers’ organisation in seasonal tanks. The culturalmaterials, fingerlings, fries and fishing net, were previously provided free ofcharge. However, it is charged after the 2nd supply of cultural material forseasonal tanks and after the 5th supply for major and medium tanks. The pricesof materials are Rs.0.35 for all kinds of fry, Rs.1.00 per fingering of carp speciesand Rs.0.75 per fingerling of Tilapia. The extension work also providesfingerlings to fishponds of individual farmers. Fishponds of individual farmersare advised on construction of ponds and feedings are recommended. Theconstruction cost of a pond is proximately Rs.44, 000 on 20 perches with a depthof 1.2 to 1.5 m. For increase plankton, organic materials such as cow dung,poultry manure and pig dung are applied, and supplementary feeding as rice bran,residue of coconut meal, fishmeal and kitchen leftover are utilised.
In Anuradhapura, two official institutions are carrying out inland fisheries, theMinistry of Fisheries of the Central Government and the Provincial CouncilMinistry of fisheries. Two on-going development projects, which are IFADfunded the North Central Province Participatory Rural Development Project andADB funded IRDP, are supporting the fishery development programmes. Oneaquaculturist stationed in the aquaculture extension centre in Anuradhapura townsupervises the programmes of the North Central province.
Inland fish development in the North Central province is carried out by oneaquaculturist, seven (7) Fishery Inspectors (FIs), two (2) extension officers andone 1) assistant extension officer of the central government, and one extensionofficer from the Provincial Ministry. FIs in the Anuradhapura district arestationed one in each extension centre, Padaviya, Kekirawa and Palagala DS divi-sions. Kekirawa and Palagala are in the Study area.

C - 15
In 1998, 100,000 of fries and 40,000 fingerlings were distributed in the NorthCentral province, Anuradhapura and Pollonarua districts. The other data fromFishery Extension Centre in Anuradhapura reported 6.0 ton in the same month.(Table C 1.1)
1.4 Marketing and Processing Facilities
(1) Processing and Storage Facilities
Rice consumed in the village and rural areas are milled within these areas.Marketable surplus of rice are handled by unhulled rice and milled by large-scalemillers outside the area (mainly located in the Gampaha district). Each villagehas several small rice mills, and a substantial milling capacity for paddy process-ing presently exists in the Study area. The mills, all privately owned, range fromlarge commercial enterprises to small domestic units. Processing of the raw riceis the rule, though par-boiling facilities are available in some of the larger mills.The recovery of raw rice at about 65% is satisfactory. Each village has also oneor two grinding machines for chillies and corns.
With exception of the Paddy Marketing Board, the villages in the Study area havealmost no storage facilities. Most of products have been stocked in the farmers’houses and sold them to dealers, individually.
(2) Pola
The most important market for locally grown fruits and vegetables is the periodicmarket fairs called ‘Pola’. Pola is a place where farmers, traders and consumersgather to sell or buy merchandise and is held on one or two scheduled days of theweek. The Polas in the area are operated at different locations on a rotationalsequence enabling the traders to visit every Pola on separate days of the week.All Polas in and around the Study area are under the purview of relevant Provin-cial Councils. The management of the Pola is awarded to private individualsthrough a public tender on an annual basis. The details of Pola are mentioned inSection 1.5.
(3) Milk Collecting Centres
The MILCO, Anuradhapura District Milk Producers Co-operative Society Ltd.and Nestle are the three major competitive milk collectors in the Study area.They are having freezing facilities to store at a time and transport the collection totheir relevant factories by lorries. Their collecting system and capacity aredescribed below:

C - 16
Kiriya Milk Industries of Lanka (Pvt.) Ltd.
MILCO has two regional offices covering Anuradhapura and Kurunegala districts.The Anuradhapura regional office collects milk through the Anuradhapura DistrictMilk Producers Co-operative Society, while the Kurunegala regional officepurchases directly from farmers. The farmers are provided with plastic andaluminium cans of 5, 10 and 20 litre size. The milk is brought to the villagecollecting points (centres) by the farmers in cans. The milk collected at thecentres are then transferred to 20 and 40 cans and transported to the chilling plantsin trucks (lorries) within about 2 hours. The milk is sent to the Company facto-ries, located in Colombo, Digana and Ambewela in a day or two, depending onthe total amount of milk collected. The total collection on July 1, 1999 was –Anuradhapura: 3,250 litres and Kekirawa: 2,475 litres.
The farmers are paid according to the fat and solid non-fat content of the milksupplied. A minimum rate of payment of Rs. 9.87 and a maximum of Rs. 19.61is made to the farmer. The required rate of fat content vary from a low of 2.5%to a high of 8.5% and the solid non-fat content from a low of 8.0% to a high of10.0%. The average price paid for a litre of milk is about Rs. 13.50.
There are 5 chilling plants located in the Anuradhapura district and 8 chillingplants in the Kurunegala district. The two plants are located within the studyarea; Anuradhapura and Kekirawa. The former has 5 chilling tanks with acapacity of 8,075 litres and the latter has two tanks, with a capacity of 3,600 litres.The chilled milk is then transported to the factories in Colombo, Digana andAmbewela, within a day or two. There is much scope for development becauseof the increasing demand for milk and the additional capacity at the factories.There are a number of problems facing the livestock industry:
a) There are no or very few quality cows. They are mostly ‘batu’ localcows. The artificial insemination program is only 5% successful.
b) There are no full-time dairy farmers and they primarily cultivators.c) The farmers do not use cattle sheds and the cattle are kept in the open air.d) There are no pastureland (no cattle feed) and the cattle are allowed to
roam and fend for themselves. Moreover, additional nutrients/vitaminsare rarely given.
e) The veterinary services provided are weak. The veterinary officer andthe livestock development officer visit the farms only if a request is madeby a farmer.
By way of support services, MILCO provides (i) a ready market for the milk, (ii)an insemination program in a few places, and (iii) good quality studs and cows to
C - 17
some of the farmers at 50% the cost. They are from the Digana farm, and are across between the temperate and Indian varieties. An insemination program isalso being implemented in some areas.
Anuradhapura District Milk Producers Co-operative Society Ltd.
There are 7,789 registered members in the Society, but only about 2,500 to 3,000members are active. The registration fee to become a member is Rs. 100. Themembers are provided with a guaranteed market for their produce.They are alsoprovided with plastic and aluminium cans at concessionary prices: Rs.200 for a 5-litre plastic can and Rs. 300 for a 10-litre can.15 and 20-litre cans are alsoavailable.
The milk is collected at 126 collecting centres and transported to the chilling sta-tion in 20 and 40-litre cans, by lorry (truck) daily. About 10,000 litres of milk iscollected daily. The collecting centres are distributed through the entireAnuradhapura district. The milk collected is given to MILCO. During the lowseason the production drops down to about 7,000 litres a day.
The Society provides a number of support services to its members. It provides(i) a ready market, (ii) pays a reasonable price, (iii) provides free training, veteri-nary services, medicine and nutrients at reasonable prices, studs and artificialinsemination at 50% cost.The low grade of cattle, absence of grasslands, non-useof nutrients, foot and mouth disease and ‘H.S.’ disease for calf less than 3 yearsold and poor veterinary serves are the main problems.
Nestle Lanka Limited
There are over 5,000 registered farmers in the Anuradhapura district. TheCompany also has 230 village collecting centres and 25 chilling plants.Aluminium cans are sold to the farmers. Milk that is collected from the centresis brought to the chilling plants in 1 ½ to 3 hours by truck (lorry) and is sent to thefactory in Pannala. The Company produces milk powder, condensed milk, andbaby food (cereals). Payments for the milk supplied are made on the fat and solidnon-fat content and they range from Rs.9.0 to Rs.13.5/litre for neat cattle milk(average Rs.11.5) and from Rs.9.0 to Rs.23.0/litre for buffalo milk (averageRs.15.0). The total collection per day amounts to 9,000 litres. But during thepeak season it goes up to 35,000 litres. Payments to farmers are made once intwo weeks. By way of support services the Company provides interest free loansto buy animals and also free transport. The cost of the cans is deducted in twomonthly instalments.

C - 18
1.5 Marketing of Farm Inputs and Outputs
The agricultural marketing system for the non-plantation sector in Sri Lanka hasundergone major changes over the past decade. Such changes have impacted onthe returns to the agricultural producer and on agricultural production. Themajor changes are:
● The decreasing role of public sector agencies directly involved in mar-keting of agricultural produce such as the Co-operative Wholesale Estab-lishment (CWE) and the Paddy Marketing Board(PMB);
● The withdrawal of most subsidies on inputs and of effective supportprices for agricultural outputs as well as withdrawal of public sector inpurchasing from farmers;
● The liberalisation of imports so that domestically produced commoditiesfreely competes with imports.
The major effects of these changes is that farmers are now more open to marketforces and its associated price fluctuations as well as competition from imports.In addition, the farmer pays the market price for agricultural inputs (with theexception of urea) and receives an open market price for his outputs. As thefarmer had operated for many decades with price supports and input subsidiesbehind a protective wall of import licenses and tariffs, the farmer is still adjustingto the new production environment. The net result of these changes is that agri-cultural production of most field crops other than paddy and other importantcommodities in the farm crop mix have registered a decline in the past five yearsas is seen below.
Production of Field Crops other than Paddy(Unit : 1000 MT)
Commodity 1994 1995 1996 1997 1998Big Onions 81.4 29.7 19.4 29.1 17.4Blackgram 14.5 7.9 7.4 6.3 8.2Chili 31.9 21.3 18.4 17.9 15.6Cowpea 18.0 16.1 17.0 12.8 13.4Sesame 3.5 4.5 3.8 6.8 5.7Greengram 22.9 16.0 16.6 13.8 15.6Groundnuts 16.3 5.3 5.1 8.9 6.3Finger millet 5.1 4.9 3.9 3.3 4.4Maize 67.2 34.8 33.0 22.8 33.9Potatoes 70.6 81.7 100.8 65.8 25.9Red Onions 82.3 48.4 43.9 44.4 38.0Soybeans 3.2 2.4 0.7 0.4 0.6
Source: Central Bank of Sri Lanka, Annual Report 1998
1.5.1 Marketing of Agricultural Products
The private trade is responsible for the marketing of all field crops in the country
C - 19
and in the project area. The marketing channels and market structures are differ-ent in the case of field crops and vegetables. The private traders handle about98% of the rice trade with Colombo as the main wholesale market. There is alsoa number of regional rice trading centres. The role of the CWE and the PMB arenow virtually non-existent. As the majority of holdings are less than 2 hectares,production of paddy averages around 6 tons per harvest per farm. After retentionfor seed use and home consumption, the marketable surplus is very small. Littlestorage of grain takes place on the farm with retention for seed and family con-sumption that accounts for about 45% of the crop. Paddy in the project area issold by farmers to either assemblers or collectors or directly to millers.Assemblers and collectors send the produce to the Kandy, Kegalle or Colombowholesale markets. Rice moves from the wholesale markets through petty trad-ers to the retailer. There are also a large number of retail co-operatives some ofthese also operate rice-milling operations. Mark ups at the retail level arenormally between 5-10% and the wholesale retail price spread is about 20%.
Storable field crops are procured in the rural areas by assemblers or residenttraders who sell these to commission agents or deliver to local Polas. Surveys ofthe project area indicate that only about 55% of paddy is marketed and the same istrue for other field crops. The rest is retained for home consumption and seed.The principal means of transport in the project area is the 2-wheel tractor whilethe bicycle is also used for smaller loads. The average distance a farmer has totravel to dispose of his produce is 4.8 miles.
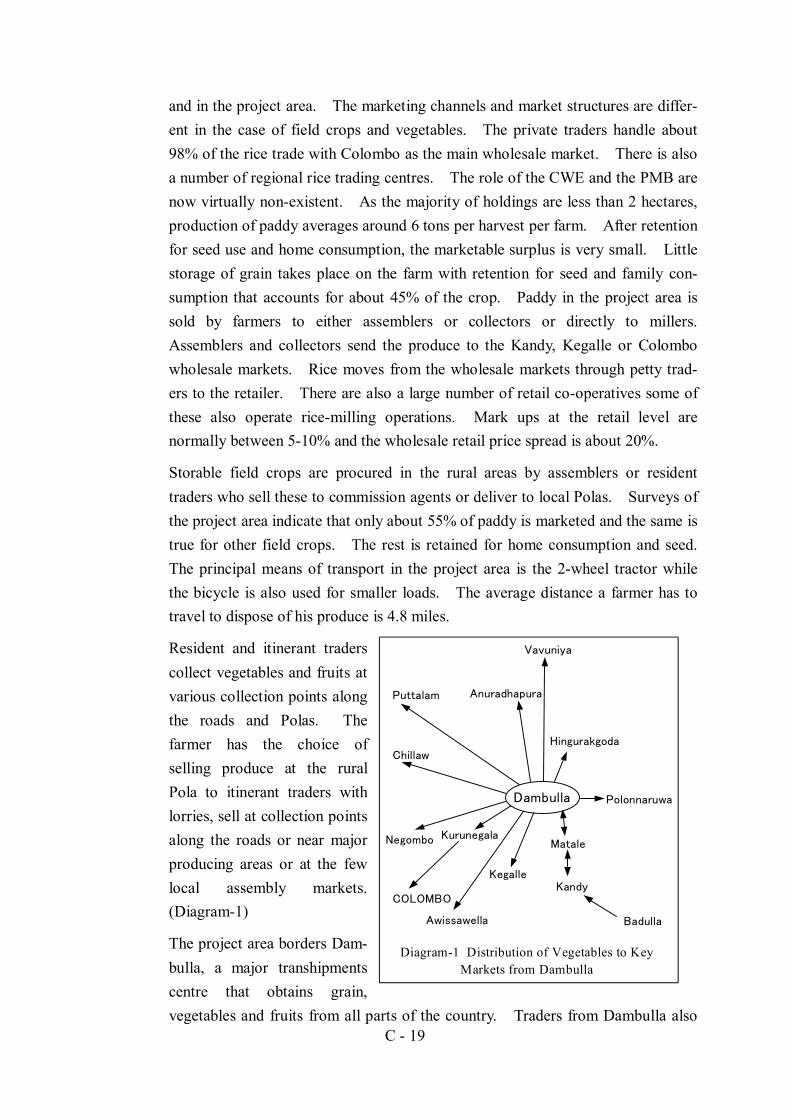
Resident and itinerant traderscollect vegetables and fruits atvarious collection points alongthe roads and Polas. Thefarmer has the choice ofselling produce at the ruralPola to itinerant traders withlorries, sell at collection pointsalong the roads or near majorproducing areas or at the fewlocal assembly markets.(Diagram-1)
The project area borders Dam-bulla, a major transhipmentscentre that obtains grain,vegetables and fruits from all parts of the country. Traders from Dambulla also
Diagram-1 Distribution of Vegetables to KeyMarkets from Dambulla
Vavuniya
Puttalam
Chillaw
Negombo
COLOMBO
Hingurakgoda
Polonnaruwa
Badulla
Matale
Kandy
Kurunegala
Anuradhapura
Kegalle
Awissawella
Dambulla

C - 20
frequently send their lorries to the project area to buy vegetables from producerPolas. In addition, the project area includes several public markets. (Diagram-2)
1.5.2 Marketing of Farm Inputs
Seeds used by the farmer may be his retained seed, seeds purchased from anotherfarmer, seeds purchased through formal suppliers or seeds from other sources suchas landlord, or merchants who contract for crop. The seed industry has under-gone major changes as part of government policy to privatise existing operations.Only in the case of paddy is government involved in seed production and 15% ofthe crop in 1998 was from quality seed. The farmer obtains most of his seedrequirements from private sector sources mainly from the village or town store.
Fertiliser is marketed through 15 registered importers, a range of distributors anddistribution bases throughout the country, including the Agrarian Service Centres.Most farmers obtain their fertiliser needs from the private traders, dealers, andagents of fertiliser importers in the town or village. The role of the AgriculturalService Centres has been declining in recent years following the withdrawal ofsubsidies on inputs. Fertilisers with the exception of urea are free of subsidies.There is an active trade in cattle manure in the project area.
Agrochemicals are marketed through a chain of importer/packer, distributor andlocal agents and there is competition as list prices are frequently discounted.Vegetable producers in the project area are the largest consumers of agrochemicalsand farmers in the project area obtain their requirements from local traders oragents.
Diagram-2 Pola Circles
Thalawa(Thursday)
Thambuttegama(Wednesday)
Rambawewa(Thursday)
Eppawela(Friday)
Galgamuwa(Friday)
Anuradhapura(Saturday)
Anuradhapura(Sunday)
Mihintale(Wednesday)
Galenbindunuwewa(Tuesday)
Kahatagasdigiliya(Monday)
Galgamua(Tuesday)
Nawagaththa(Monday)
Ambanpola(Monday)
Meegalawa(Sunday)
Galnewa(Saturday)
Rajanganaya(Saturday)
Giribawa(Thursday)
Feeding from Nuwara Eliya
C - 21
1.5.3 Co-operatives and Farmer Companies
Co-operatives played an important role in the distribution of inputs and the sale ofoutput as well as in agro-processing and post harvest activities. Although theycontinue to perform a useful role their importance has diminished with the with-drawal of subsidised inputs to farmers and the operation of public sector guaran-teed price and purchase. In the Kurunegala district there are 20 multipurpose co-operatives with a membership of over 200,000.
Several farmer companies have recently been set up in the project area. Thesecompanies are commercially organised bodies around entrepreneur farmers.Farm membership is in the form of shares and the company is managed by paidmanagers. The primary function of these companies is to identify potential mar-kets for products that have comparative advantage. One such company isengaged in paddy seed production, vegetable cultivation, fertiliser sales and orna-mental and food fish production. The companies show potential for providingfarmers with income generation activities in post harvest and agro processingactivities.
1.5.4 Market Access
The project area has a good network of roads and the survey reveals that the aver-age distance a farmer moves his produce for market is 4.8 miles. While thestudy area has a good network of gravel roads and D type roads the unsurfacedroads are subject to erosion and seasonal damage by rains. In addition erosionand cattle grazing have also damaged many of the bund roads used by farmers.Small-scale producers are denied better prices for their produce and pay higherinput costs due to lack of access roads. One C class road, which is maintained bythe Irrigation Department, is the Tambuttegama-Rajangana road, which is 18kmsand runs through heavily populated farm areas but which is in need of rehabilita-tion. Other roads requiring rehabilitation would be identified at the next prepa-ration stage.
1.5.5 Export Market Potential
Several studies and pilot programs have been attempted to analyse the exportmarket potential for Sri Lanka’s agricultural products. At present very minimalquantities of agricultural products are exported accounting for less than 1% ofproduction. These too, are mainly to the Middle East and other neighbouringcountries. Among the reasons cited for this poor performance are the following:
C - 22
- High cost of production- Post harvest technology inadequate, mainly the handling, cooling and
packaging of fruits and vegetables;- Lack of suitable production areas with year round availability of irriga-
tion water and lack of on-farm irrigation infrastructure;- Production technology inadequate- Varietal availability and climatic constraints;- Inadequate grading and product standardisation;- Unavailability of export infrastructure in cooling, packing, refrigeration
and trucking;- Air and sea transport not adequately catering to needs of sub-sector.
1.5.6 Agricultural Prices
Seasonal price fluctuations are common to all products subject to productioncycles. Monthly average prices at farm-gate, wholesale and retail level for allperishables reflect this seasonality. Prices are lowest at the time of the Mahaharvest and gradually increase over the season till the next harvest.
The retail price for rice reaches its peak in December and is lowest in March.Prices vary by about 10%. Prices for other field crops vary by about 8-12% fromthe average price within the year. The price fluctuation for vegetables and fruitsis much greater. In addition, there are price differentials due to spatial factors.
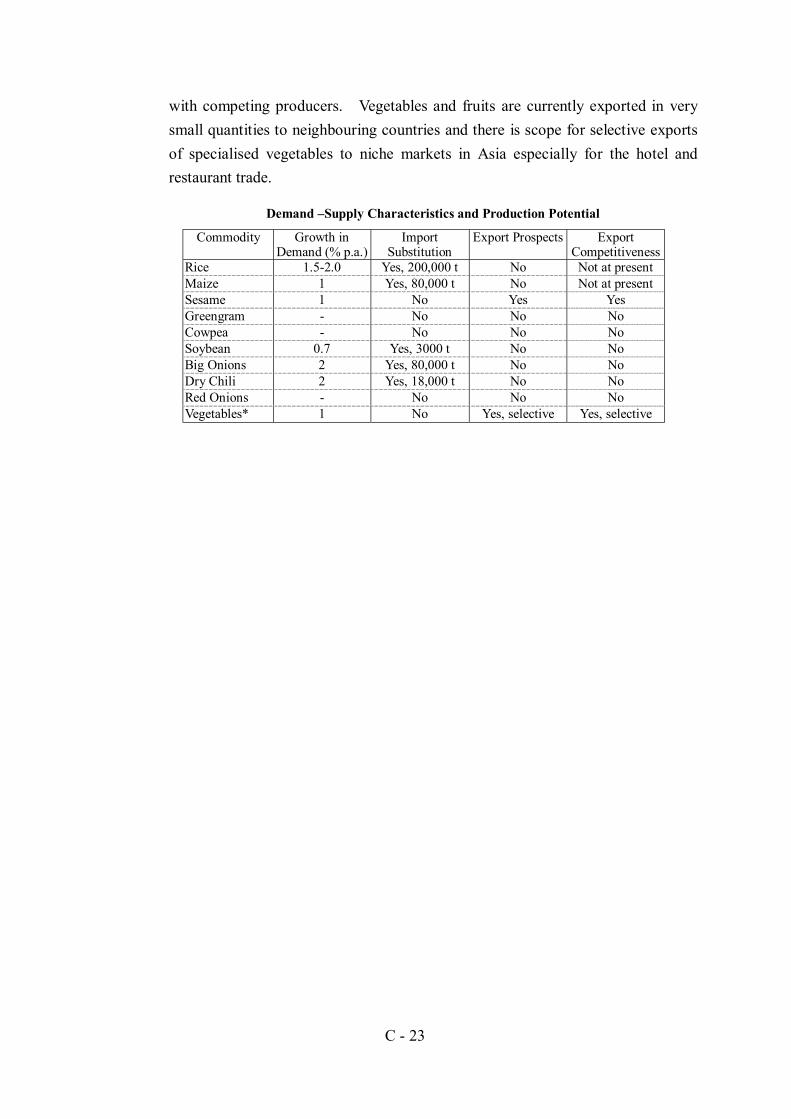
1.5.7 Demand for and Supply of Agricultural Products
An analysis of the range of non-plantation sector field crops and vegetables indi-cates that rice, maize, sesame, soybean big onions and dry chillies are importedannually while there is little external trade in greengram, cowpea, red onions andsome limited export of vegetables. At the same time demand elasticities andpopulation growth indicate an annual growth in requirements of rice, big onionsand chillies of about 2% p.a. and 1% p.a. for maize, sesame, soybean and vegeta-bles requirements. Current imports are mainly of rice (150-200,000 tons/year),maize (about 80-85,000 tons/year), big onions (75-80,000 tons/year), and drychillies (15-18,000 tons/year). Provided domestic production is competitive withimports, import substitution potential exists for the above group of commodities.Sesame is both imported and exported in processed form and as seed. Althoughproduction volume and current exports are relatively small, the prospects for someincrease in exports is favourable, provided domestic production is competitive
C - 23
with competing producers. Vegetables and fruits are currently exported in verysmall quantities to neighbouring countries and there is scope for selective exportsof specialised vegetables to niche markets in Asia especially for the hotel andrestaurant trade.
Demand –Supply Characteristics and Production Potential
Commodity Growth inDemand (% p.a.)
ImportSubstitution
Export Prospects ExportCompetitiveness
Rice 1.5-2.0 Yes, 200,000 t No Not at presentMaize 1 Yes, 80,000 t No Not at presentSesame 1 No Yes YesGreengram - No No NoCowpea - No No NoSoybean 0.7 Yes, 3000 t No NoBig Onions 2 Yes, 80,000 t No NoDry Chili 2 Yes, 18,000 t No NoRed Onions - No No NoVegetables* 1 No Yes, selective Yes, selective
C - 24
Chapter 2 PRESENT CONDITIONS OF THE IRRIGATION SCHEMES
2.1 General Background of Farmers
(1) Population and Households
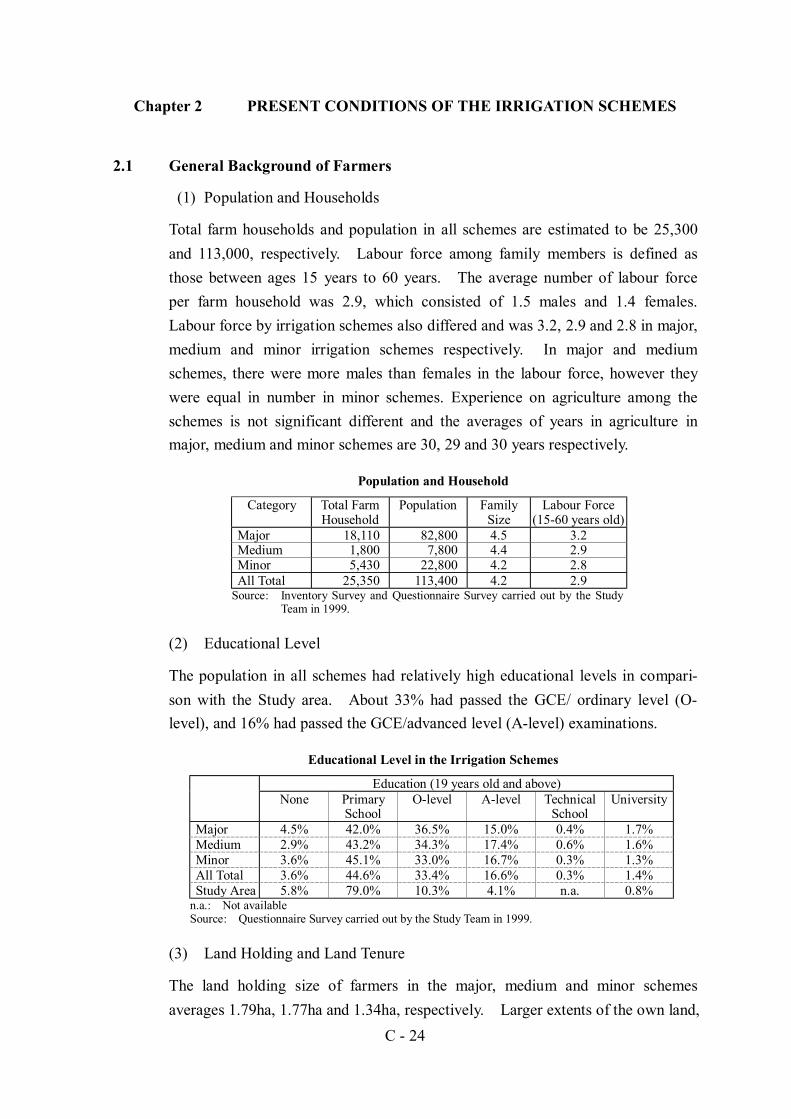
Total farm households and population in all schemes are estimated to be 25,300and 113,000, respectively. Labour force among family members is defined asthose between ages 15 years to 60 years. The average number of labour forceper farm household was 2.9, which consisted of 1.5 males and 1.4 females.Labour force by irrigation schemes also differed and was 3.2, 2.9 and 2.8 in major,medium and minor irrigation schemes respectively. In major and mediumschemes, there were more males than females in the labour force, however theywere equal in number in minor schemes. Experience on agriculture among theschemes is not significant different and the averages of years in agriculture inmajor, medium and minor schemes are 30, 29 and 30 years respectively.
Population and Household
Category Total FarmHousehold
Population FamilySize
Labour Force(15-60 years old)
Major 18,110 82,800 4.5 3.2Medium 1,800 7,800 4.4 2.9Minor 5,430 22,800 4.2 2.8All Total 25,350 113,400 4.2 2.9
Source: Inventory Survey and Questionnaire Survey carried out by the StudyTeam in 1999.
(2) Educational Level
The population in all schemes had relatively high educational levels in compari-son with the Study area. About 33% had passed the GCE/ ordinary level (O-level), and 16% had passed the GCE/advanced level (A-level) examinations.
Educational Level in the Irrigation Schemes
Education (19 years old and above)None Primary
SchoolO-level A-level Technical
SchoolUniversity
Major 4.5% 42.0% 36.5% 15.0% 0.4% 1.7%Medium 2.9% 43.2% 34.3% 17.4% 0.6% 1.6%Minor 3.6% 45.1% 33.0% 16.7% 0.3% 1.3%All Total 3.6% 44.6% 33.4% 16.6% 0.3% 1.4%Study Area 5.8% 79.0% 10.3% 4.1% n.a. 0.8%
n.a.: Not availableSource: Questionnaire Survey carried out by the Study Team in 1999.
(3) Land Holding and Land Tenure
The land holding size of farmers in the major, medium and minor schemesaverages 1.79ha, 1.77ha and 1.34ha, respectively. Larger extents of the own land,

C - 25
and larger extent of leased and tenant land were observed in the major scheme.In contrast, encroached land was seen as the larger share of the total holdings inthe medium and minor schemes.
Land Holding and Land Tenure of Irrigation Schemes
Land Holding per Farmer Land Tenure per FarmerPaddy FieldIrri-
gatedRain-fed
High-land Others Total Own
land Leased Tenure"Ande"
En-croach
(ha) (ha) (ha) (ha) (ha) (%) (%) (%) (%)Major 1.16 0.03 0.12 0.49 1.79 75 18 6 1Medium 1.05 0.03 0.20 0.48 1.77 82 8 5 5Minor 0.66 0.05 0.16 0.46 1.34 86 5 6 3 All Scheme 0.75 0.05 0.16 0.47 1.43 85 7 6 3
Source: Questionnaire Survey carried out by the Study Team in 1999.
(4) Farm Machinery and Livestock Raising
Farm machinery and equipment owned by households were very low. Rate ofmachinery owned was mostly in the same order on schemes that it is more inmajor schemes, followed by medium and minor schemes. However, for theownership of water related machines and facilities, such as water pumps andagricultural wells, were more in minor schemes.
Farm Machinery and Livestock Raising in the Irrigation Scheme
Farm Machinery / Household Livestock per Household4-W
tractor2-W
tractor Sprayer Waterpump Buffalo Cattle/
cow Goats Pigs Chicken
Major 0.05 0.16 0.54 0.16 0.20 0.89 0.12 0.01 2.58Medium 0.03 0.17 0.41 0.15 0.39 0.93 0.04 0.04 0.56Minor 0.02 0.09 0.35 0.20 0.57 1.36 0.28 0.05 0.66All Schemes 0.02 0.10 0.37 0.19 0.52 1.27 0.23 0.04 0.80
Source: Questionnaire Survey carried out by the Study Team in 1999.
Livestock is not a major activity in the majority of the households in the surveyarea. However cattle, poultry and goat are raised by few households in someschemes. Therefore income from livestock is contributing only a minor portionon household income in the survey area. Potential on this sector as an additionalincome source is recognized by providing appropriate support in the form of creditand technical such as good breeds animals, animal health and feed throughtechnical extension services.
2.2 Agriculture
2.2.1 Crop Production
(1) Crop extent and yield

C - 26
Average extent (1998) of paddy and OFC cultivation of the major, medium andminor irrigation Schemes is shown below. Largest extent is in the major onpaddy and total cultivation and followed by medium and minor. An average OFCcultivation is larger in the medium and minor than the major.
Average Crop Cultivated Area of Irrigation Schemes (Unit: ha/household)
Paddy OFCMaha Yala Irrigated Highland Sub-total
Total
Major 1.07 0.57 0.03 0.08 0.11 1.75Medium 0.68 0.36 0.02 0.17 0.19 1.23Minor 0.41 0.07 0.03 0.16 0.19 0.67Average 0.49 0.14 0.02 0.16 0.18 0.81
Source:1998 cropping, Interview survey of the Study team、1999
OFC is traditionally cultivated in highland under rainfed condition, not many inpaddy land under irrigation, except Mahaweli System-H located adjacent to theStudy area. Such OFC cultivated under rainfed condition is unstable and low yieldand high-risk farming though relatively high production cost as in chilli andvegetable. Therefore, it is important for sustainable farming to emphasis onextension works that reduction of the relative cost of production by stabilizingcrop production and increasing yield.
Total crop cultivation on the extent of the major, medium and minor irrigationschemes are shown below.
Maha Yala Total Maize Sesame Pulse Chilie
sB.
OnionRed
OnionVeget-ables Total
Major 13,580 8,588 22,168 94.0 55.5 499.2 4.0 978.1 1,630.8 23,799
Medium 1,356 639 1,995 1.5 3.6 7.5 14.1 8.0 10.0 44.7 2,040
Minor 1,648 482 2,130 5.5 3.0 7.4 63.9 14.5 4.2 31.1 129.6 2,260
All Scheme 16,584 9,709 26,293 7.0 100.6 70.4 577.2 14.5 16.2 1,019.2 1,805.1 28,098 Source: Estimate based on the Inventry survey and the Interview Survey
OFC (ha) TotalCultivation (ha)
Crop Cultivation Extent of the Irrigation Schemes
IrrigationScheme
Paddy Cultivation (ha)
Average yield in 1998 cropping by irrigation schemes is obtained from theinterview survey. Paddy yield in the major scheme was the highest in both Mahaand Yala seasons. However on OFC cultivation, significant yield trend by schemeswas not observed and yield levels is relatively low comparing with the farmer’starget yield of DOA.

C - 27
(Unit: ton/ha)
Maha Yala Maize Sesame Pulse Chilli(Dry) B' onion Red onion VegetablesMajor 4.10 3.84 - 0.44 0.91 0.64 - 1.00 7.39 Medium 3.59 3.28 1.67 0.43 0.68 0.58 6.45 0.70 4.97 Minor 3.41 3.51 1.26 0.62 0.76 0.91 8.12 1.90 4.72 Average 3.49 3.52 1.31 0.54 0.77 0.85 7.96 1.64 5.12
Paddy OFCs
Average Yield of Crop Cultivation in the Irrigation Scheme
Source:1998 cropping, Interview survey of the Study team、1999
(2) Crop Production
Overall total of paddy production in the 100 Irrigation Schemes in 1998 was66,163 tonnes in Maha and 36,764 tonnes in Yala. Total production in 1998 of themajor scheme was 55,676 tonnes and 32,976 tonnes in Maha and Yalarespectively, and 4,867 tonnes and 2,095 tonnes in the medium scheme and 5,620tonnes and 1,693 tonnes in the minor scheme. Major OFC cultivation is dependingupon chilli and various kinds of vegetables. Crop production in the irrigationschemes and the production per farm household of the schemes are shown in thetables below.
Maha Yala Total Maize Sesame Pulse Chilli B.
OnionRed
OnionVegetables Total
Major 55,676 32,976 88,653 28 33 85 4 1,428 1,578 90,231 Medium 4,867 2,095 6,962 6 9 28 40 5 1 151 240 7,202 Minor 5,620 1,693 7,313 47 10 21 144 68 9 543 843 8,156 Total 66,163 36,764 102,928 54 47 82 269 73 14 2,122 2,660 105,588 Source:1998 cropping, Interview survey of the Study team、1999
Total Crop Production in the Irrigation Schemes
Irrigation
Scheme
Production (ton/Scheme)Paddy Production
(ton/Scheme) OFC Production (ton/Scheme)Total
Produc-tion(ha)
(Unit: kg/household)
Maha YalaMajor 4,385 2,174 0.0 1.7 4.5 5.6 0.0 0.1 55.4
Medium 2,430 1,193 2.8 6.5 12.4 14.9 10.8 0.2 174.0Minor 1,385 229 7.9 4.8 3.7 34.5 30.5 2.4 101.5
All Scheme 1,715 496 6.8 4.5 5.0 29.2 25.5 1.7 112.7Source:1998 cropping, Interview survey of the Study team、1999
Vegetables
Crop Production per Farm Household
Paddy Maize Sesame Pulses Chilies(Dry)
B.Onion
RedOnion
(3) Products use
The major scheme is selling the products more and followed by the medium andminor on paddy, OFCs and vegetable production. Vegetables are sold more andfollowed by OFCs and paddy among the crops. Table below shows the rate ofproducts use in the farm household.

C - 28
(4) Crop damage
Crop damages in the irrigation schemes are principally water, pests and diseasesand wild animals especially elephant. On paddy cultivation pests and diseases israised as the first in all scheme, wild animal was high in the medium and minorand water was high in the minor scheme. OFC as pulses raised that wild animalwas the first and followed by water. Pests and diseases was the first in chilli andfollowed by water and wild animal. Pest and diseases was much higher onvegetable cultivation and other damages were not much. These differencesoccurred depending upon the water resource condition and the location ofcultivation plots. The summary of crop damages is shown in table below.
Paddy Homeconsumption
Stock athome
Kept forseed
Repayment & Gift
Sold Others
Major 20.4% 3.2% 1.9% 4.4% 70.1% 0.1%Medium 37.4% 3.0% 2.7% 4.5% 52.4% -Minor 50.1% 2.2% 3.2% 6.6% 37.9% -
All 46.2% 2.4% 3.0% 6.1% 42.2% 0.0%
OFCs Homeconsumption
Stock athome
Kept forseed
Repayment & Gift
Sold Others
Major 13.0% 0.9% 0.7% 3.2% 82.2% -Medium 14.0% 5.8% 0.6% 2.8% 76.9% -Minor 18.4% 1.3% 0.4% 2.8% 77.1% 0.0%
All 17.5% 1.8% 0.4% 2.8% 77.5% 0.0%
Vegetables Homeconsumption
Stock athome
Kept forseed
Repayment & Gift
Sold Others
Major 4.3% 0.0% - 0.5% 95.2% -Medium 2.8% 0.0% - 0.3% 97.0% -Minor 12.8% 0.7% 0.0% 0.9% 85.5% -
All 10.4% 0.6% 0.0% 0.8% 88.3% -Source:1998 cropping, Interview survey of the Study team、1999
Products Use in the Irrigation Schemes
Drought Flood Poor
drainagPests &diseases Birds Rats Wild
animals OthersMajor 4.8% 6.6% 3.6% 65.6% 5.1% 4.6% 18.5% 8.6%Medium 16.8% 2.5% 1.3% 70.0% 4.4% 3.4% 36.7% 10.6%Minor 35.6% 5.5% 1.6% 72.8% 5.9% 3.2% 34.6% 13.1%All 30.8% 5.2% 1.7% 71.9% 5.6% 3.4% 33.6% 12.5%Major 7.9% 1.7% 2.1% 58.5% 8.6% 8.4% 11.3% 7.0%Medium 17.6% 11.2% 1.1% 61.3% 2.0% 3.7% 25.7% 11.3%Minor 25.7% 1.0% 1.4% 67.3% 6.8% 2.8% 20.6% 14.3%All 21.6% 3.0% 1.4% 64.9% 6.2% 3.8% 20.1% 12.6%Major 16.7% 16.7% - 83.3% - - 16.7% -Medium 13.3% - - 26.7% 33.3% - 60.0% -Minor 46.2% - 3.8% 53.8% 23.1% 3.8% 65.4% 7.7%All 34.1% 2.4% 2.4% 51.6% 22.2% 2.4% 57.1% 4.8%Major 13.4% 5.0% 8.2% 89.6% 2.5% 5.4% 7.9% 2.5%Medium 31.9% 11.2% 7.1% 64.5% 13.1% 1.8% 33.4% 8.5%Minor 40.0% 2.6% 2.6% 69.4% 1.4% 3.1% 20.5% 14.2%All 37.2% 3.6% 3.5% 70.4% 2.6% 3.2% 20.9% 12.8%Major - - 8.3% 44.4% - - 16.7% 11.1%Medium 36.5% 1.6% 1.6% 42.7% 6.3% - 39.6% 12.5%Minor 19.0% 1.6% 7.3% 45.6% - - 11.7% 7.8%All 19.3% 1.4% 6.8% 45.2% 0.6% - 15.0% 8.5%
Source: Interview survey of the Study team、1999
Chi
lliV
eget
able
s
Crop Damages in the Irrigation Schemes
Padd
y -
Mah
aPa
ddy
-Y
ala
Pulse
s

C - 29
(5) Farm inputs
Inputs materials on crop cultivation are varied among the irrigation schemes andin the scheme. An average input level in the major, medium and minor schemes isshown below on paddy and chili for comparison. The level of inputs of seeds andfertilizer is higher than DOA recommendation on paddy and nearly double onchili. However in the other crops as sesame and pulses are quite low on fertiliserand chemical application. The inputs of respective crops are in Table C 2.1.
Major Medium Minor Major Medium Minor Major Medium Minor1) Seeds (kg/ha) 106 122 136 111 121 134 2.4 2.1 2.3 2) Fertilizers
Total 458 367 335 410 309 379 820 375 531 3) Agro-chemicals
Weedicid Liquid (lit./ha) 3.32 2.08 1.92 2.94 2.18 1.95 0.98 0.06 0.23 InsecticidLiquid (lit./ha) 1.03 0.81 1.03 1.46 0.85 1.05 3.90 2.87 2.64
Powder (kg/ha) 0.94 0.73 0.71 0.71 1.27 0.37 0.28 0.41 0.66 FungicideLiquid (lit./ha) 0.05 0.01 0.02 0.03 - 0.13 0.69 - 0.16
Powder (kg/ha) 0.60 0.13 0.24 0.51 0.01 0.09 3.84 0.84 1.73 4) Machinery
Total (ha) 1.81 1.63 1.77 1.84 1.54 1.62 1.00 0.81 0.66 5) Animal power
Total (ha) 0.07 0.13 0.07 0.06 0.11 0.15 - - 0.03 6) Labour
Family (man-day/ha) 29 41 52 32 41 65 228 189 159 Attham(man-day/ha) 3 4 5 3 4 5 7 2 2 Hired (man-day/ha) 49 37 33 53 32 31 82 53 74 Total (man-day/ha) 81 82 90 88 76 101 317 244 235
Source: Interview survey of the Study team、1999
Inputs on Crop Cultivation in the Irrigation SchemesPaddy - Maha Paddy - Yala Chilli
(6) Present farming situation
Farmers recognize that water shortage and drought are the biggest damage oncropping especially in the Medium and the Minor schemes. Water related problemin the major scheme is a little less than of the others. Factors that effect to reduceyield as pests and diseases and weeds are following to water related problem.Inputs related problem as seed and fertiliser procurements, and input cost areraised after. Summary of the interview survey is shown below and all the result isin Table C 2.2.
1 Pests and diseases 80% Pests and diseases 80% Water shortage 90%2 Weed damage 36% Water shortage 71% Pests and diseases 73%3 Water shortage 32% Wild animal 56% Wild animal 49%4 Farm roads 31% Weed damage 38% Drought 41%5 Low yield 31% Low yield 36% Low yield 38%6 Wild animal 26% Seeds procurement 32% Weed damage 32%7 Seeds procurement 25% Drought 31% Seeds procurement 27%8 Farm inputs cost 19% Farm roads 28% Farm inputs cost 21%9 Labour shortage 14% Farm inputs cost 17% Farm roads 20%
10 Others 10% Loans 13% Fertilizer procurement 11%Source: Interview survey of the Study team、1999
Problems Related to FarmingMajor Scheme Medium Scheme Minor Scheme

C - 30
Farmers’ intention on improvement of their farming is closely related the problemdescribed above. Pest and diseases and seed variety that for increase yield camehigher priority in the major and medium schemes and water related items areserious in the minor scheme. Wild animal control, elephant, is also at higherpriority especially in the medium and minor schemes. The support services asagricultural credit and agricultural extension are expected. Improvement of farmroad is required in all schemes. Summary is shown below and all the result is inTable C 2.3.
1 Pests and diseases contro 75% Pests and diseases contro 75% Irrigation water 81%2 Seed varieties 67% Seed varieties 74% Irrigation facilities 73%3 Irrigation facilities 52% Irrigation facilities 74% Seed varieties 68%4 Farming practices 49% Irrigation water 64% Pests and diseases contro 68%5 Weed control 35% Wild animal conrol 53% Wild animal conrol 45%6 Irrigation water 33% Farming practices 47% Farming practices 42%7 Farm road 29% Weed control 47% Weed control 39%8 Wild animal conrol 26% Agricultural credit servic 31% Agricultural credit servic 27%9 Agricultural credit servic 25% Farm road 27% Agri. extension services 24%
10 Agri. extension services 22% Agri. extension services 26% Farm road 24%Source: Interview survey of the Study team、1999
Farmers' Intention to Improve FarmingMajor Scheme Medium Scheme Minor Scheme
2.2.2 Marketing and Credit
(1) Marketing
According to the interview survey, an average distant to a market is 4.2 km, 7.7km and 7.9 km in the major, medium and minor schemes. Major means oftransportation is 2-wheel tractor and following by bicycle and lorry (truck). 2-wheel tractor tends to decrease according to the size of schemes from the major tominor and bicycle use is increasing from the minor to major. Farmers’ feeling onmarketing problem is a low selling prices and transport problem in the mediumand minor schemes and lack of storage facility, products quality and high cost oftransportation are also raised.
On marketing of farming inputs, farmers who has a problem on purchasing inputsand not are almost the same. The place of purchasing inputs materials is varied bymaterial but there is not significant different among the schemes. Fertiliser andagro-chemicals are purchased more in shops in towns and villages. Sources ofpaddy seeds are own seeds and followed by purchasing at ASC and from otherfarmers. OFC and vegetables seeds are also used own seeds and purchased atshops in town and ASC. On purchasing inputs material, high price and luck offinance are raised in fertilizers and agro-chemicals and low quality togetherfollowing to previous two reasons are mentioned. No availability is the mostproblem in OFC seed and vegetable and high price, lack of finance and low

C - 31
quality are mentioned. Summary regarding to marketing of the interview is inTable C 2.4.
(2) Credit
Percentages of farmer used credit facilities are 22%, 11% and 12% in the major,medium and minor schemes respectively in the interview survey. An averageamount of borrowers from banks is Rs. 18,540, Rs. 13,990 and Rs. 8,110 inrespective schemes. There are other sources for borrowing as cooperatives andnone institutional as relatives and merchants. The purposes of borrowing money ismostly for crop cultivation and very few for living expenses in the survey.Repayment to bank is lower than to cooperatives and the other private sources.The remained mount to bank in average is Rs. 10,770, Rs. 9,250 and Rs. 3,820 inthe major, medium and minor schemes. Over 60 % of farmers needs credit systemand the purpose is for crop cultivation and followed for purchasing farmmachinery. Farmers feel difficulty in obtaining credit and the major reasons arecumbersome procedure, no guarantors and no security.
2.2.3 Extension
It seems that extension services are not properly provided. Any consultation wasmade in one year with agricultural extension staff by 45%, 36% and 34% offarmers in the major, medium and minor schemes and with veterinary extensionstaff is only 11%, 15% and 19% respectively. Frequent services are provided forabout 25% of farmer who had consultation and about 50% of them receiveservices sometimes in agricultural extension. The services provided are onfertiliser application, improved seeds and chemical for pest control in agriculture.Veterinary services are mainly vaccination and medicine and animal improvementas breeding and artificial insemination and animal feeding are very few. Summaryon extension services is shown in Table C 2.5.
2.3 Crop Budgeting and Farm Economy
2.3.1 Crop Budget
Table below is the summary of average crop budget of the irrigation schemesbased on the interview survey. Cropping practices, inputs levels and yield level arevaried among the schemes and within the scheme. Inputs level on paddy onfertiliser and agro-chemical are exceeded of the recommendation and the yield isnot responded to the inputs in some cases.
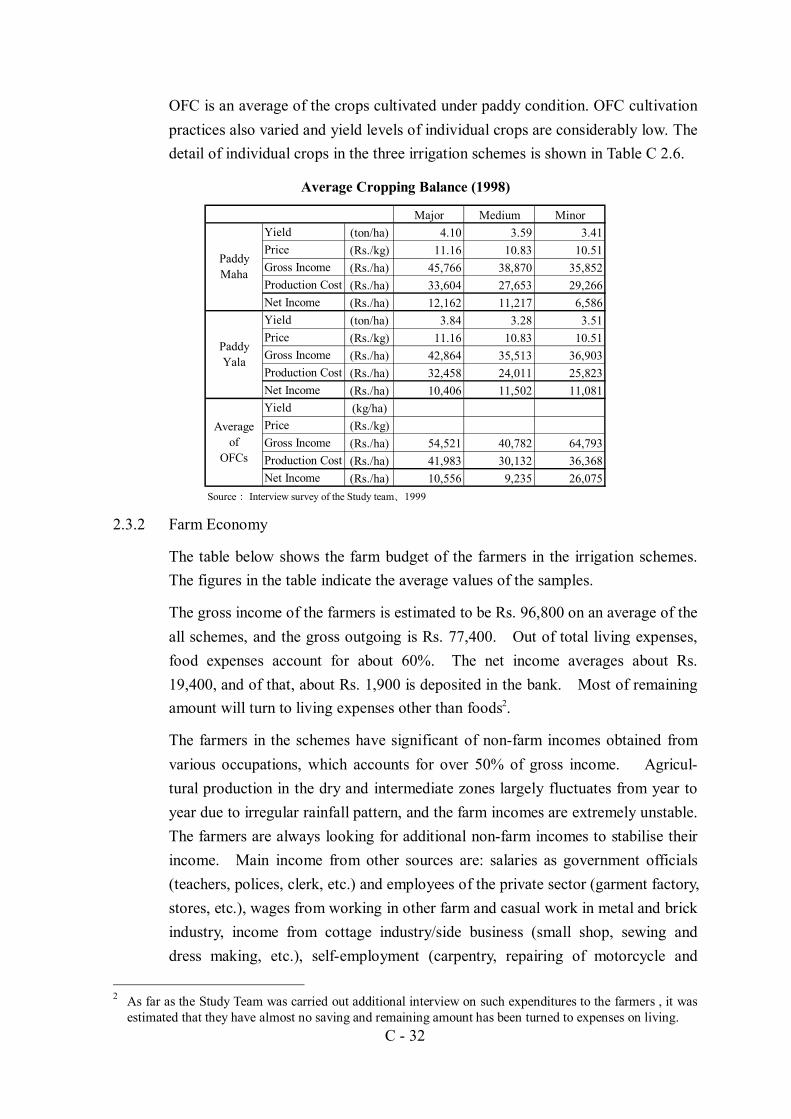
C - 32
OFC is an average of the crops cultivated under paddy condition. OFC cultivationpractices also varied and yield levels of individual crops are considerably low. Thedetail of individual crops in the three irrigation schemes is shown in Table C 2.6.
Major Medium MinorYield (ton/ha) 4.10 3.59 3.41Price (Rs./kg) 11.16 10.83 10.51Gross Income (Rs./ha) 45,766 38,870 35,852Production Cost (Rs./ha) 33,604 27,653 29,266Net Income (Rs./ha) 12,162 11,217 6,586Yield (ton/ha) 3.84 3.28 3.51Price (Rs./kg) 11.16 10.83 10.51Gross Income (Rs./ha) 42,864 35,513 36,903Production Cost (Rs./ha) 32,458 24,011 25,823Net Income (Rs./ha) 10,406 11,502 11,081Yield (kg/ha)Price (Rs./kg)Gross Income (Rs./ha) 54,521 40,782 64,793Production Cost (Rs./ha) 41,983 30,132 36,368Net Income (Rs./ha) 10,556 9,235 26,075
Source: Interview survey of the Study team、1999
Averageof
OFCs
Average Cropping Balance (1998)
PaddyMaha
PaddyYala
2.3.2 Farm Economy
The table below shows the farm budget of the farmers in the irrigation schemes.The figures in the table indicate the average values of the samples.
The gross income of the farmers is estimated to be Rs. 96,800 on an average of theall schemes, and the gross outgoing is Rs. 77,400. Out of total living expenses,food expenses account for about 60%. The net income averages about Rs.19,400, and of that, about Rs. 1,900 is deposited in the bank. Most of remainingamount will turn to living expenses other than foods2.
The farmers in the schemes have significant of non-farm incomes obtained fromvarious occupations, which accounts for over 50% of gross income. Agricul-tural production in the dry and intermediate zones largely fluctuates from year toyear due to irregular rainfall pattern, and the farm incomes are extremely unstable.The farmers are always looking for additional non-farm incomes to stabilise theirincome. Main income from other sources are: salaries as government officials(teachers, polices, clerk, etc.) and employees of the private sector (garment factory,stores, etc.), wages from working in other farm and casual work in metal and brickindustry, income from cottage industry/side business (small shop, sewing anddress making, etc.), self-employment (carpentry, repairing of motorcycle and
2 As far as the Study Team was carried out additional interview on such expenditures to the farmers , it was
estimated that they have almost no saving and remaining amount has been turned to expenses on living.

C - 33
bicycle), and remittance from family (army, working at abroad). The non-farmincomes in the minor schemes shows higher proportion than that of major/mediumschemes, because farm income is very small due to small cultivation extenttogether with severe water shortages
(Rs./household)
Major Medium Minor AllI. Gross Income 146,870 113,810 89,190 96,780
1) Farm income 77,850 48,740 26,930 33,630- Crop 75,710 47,790 26,030 32,620- Livestock 2,140 890 900 1,000- Fishery - 60 0 10
2) Non farm incom 63,140 61,600 60,010 60,4603) Loan 4,170 1,470 1,480 1,7004) Others 1,710 2,000 770 990
II. Gross outgoing 122,720 90,170 70,920 77,3701) Production cost 52,720 25,340 13,210 17,820
- Crop 49,290 24,210 12,520 16,860- Livestock 660 20 130 160- Fishery - 20 - 0- Land rent 2,770 1,090 560 800
2) Loan repayment 1,830 460 600 6903) Living expenses 67,960 64,140 56,970 58,710
- Foods 40,630 37,870 33,750 34,800- Other than f 27,330 26,270 23,220 23,910
4) Others 210 230 140 150
III. Net income 24,150 23,640 18,270 19,410(Bank deposit) 2,850 3,050 1,590 1,870
Source: Interview survey of the Study team、1999
Farm Budget in Average (1998)
Average
0
20
40
60
80
100
120
140
160
M ajor M edium M inor All
OthersLoanFarm incomeNon farm income
(Rs.1,000/Household)
Gross Income

C - 34
Chapter 3 AGRICULTURAL PRODUCTION PLAN
3.1 Basic Concepts for Agricultural Production Plan
3.1.1 Present Problems and Constraints
The agricultural sector in Sri Lanka has faced the following problems: (i) astagnant production of rice and OFC, (ii) decreasing their productivity andprofitability, and (iii) declining farm economy. To overcome these problems, theSri Lankan Government has worked out several development policies, such as, achangeover to commercial agriculture having a high productivity, and the encour-agement of export oriented crops. Emphasis has been laid on the agriculturaldevelopment in the dry and intermediate zones, which produce about 70% of totalcrops in the whole country. The Government has envisaged encouragingirrigated agriculture in these zones, with the goal of achieving more profitableagriculture and higher standards of living for rural farm households.
According to the inventory survey, questionnaire survey, and RRA, however, theirrigation schemes in the Study area located in these zones have various problems,such as (i) insufficient water resources, (ii) ineffective land use, (iii) impropercrop management, (iv) inactive FOs, (v) deterioration of irrigation facilities, (vi)decrease in farmers’ income, and (vii) escalation of farmers’ dependence onoutside support. In the meantime, the farmers in the irrigation schemes haveshown a strong desire to improve their incomes through the rehabilitation andimprovement of irrigation facilities and by increasing employment opportunities.
3.1.2 Need and Potential for Development
In the irrigation schemes, there are more than a few potentials for development;i.e., favourable natural resource for OFC cultivation, rehabilitation of irrigationfacilities aiming at effective use of water resources, advantage of human resources,community’s potential for strengthening FOs, land resources to allow furtherincreasing of farm income, etc. Although a great deal of government’s effort hasbeen put into agricultural development in the schemes in corporation with theforeign aid agencies, it is still far from achieving its goals.
Under such circumstances, as super goals, the Master Plan aims at (i) theimprovement of agricultural productivity and farm economy and (ii) sustainabledevelopment of rural agriculture. The Master Plan will focus on (i) expandingOFC and vegetable cultivation (crop diversification) with those stable production,(ii) creation of income generation activities, and (iii) the sustainable development

C - 35
of farmers’ organisations (FO) through farmers' own initiative.
Crop Diversification
Taking into account the constraints of limited water resources, the favourablecrops for the dry and intermediate zones will be OFCs, including sesame, pulses(green beans, greengram, blackgram, cowpea, etc.), chili, onions and vegetables.Furthermore, the cultivation of such crops in the Study area has the followingadvantages.
a) These crops have less water consumption than paddy, and generate a relativelyhigh income.
b) Paddy land is available for OFCs in uncultivated for insufficient water.c) The area has an advantage of location, that is being close to the metropolitan
area, where has a large market for these crops, and is also close to Dambullawhich is a relay point for marketing of agricultural products.
d) The farmers in the Study area have relatively good experience in the cultiva-tion of these crops.
On the other hand, cultivation of OFC as chili and onion and vegetables is riskybecause these crops require a considerable investment, and marketing pricefluctuates than paddy. In addition, demand and supply in the whole country andcompetition with other projects aiming at crop diversification will limit the large-scaled cultivation of such crops in the Study area. Therefore, the promotion ofcrop diversification will be developed in paddy land of the less water potentialschemes taking into account the demand and supply in the country and thecultivation risks involved. The strengthening paddy cultivation, which consumesa lot of irrigation water, will be carried out in the schemes having relativelyenough water resources. Then paddy yields should be stabilised through therehabilitation and improvement of the irrigation facilities.
In addition to crop diversification, income generation on the agricultural sectorincluding livestock, inland fisheries, processing etc. are considered in the plan.Farmers’ organizations are to be strengthened in order to attain sustainable ruraldevelopment in agriculture. Then, FOs can carry out O&M of irrigation facilitiesby themselves, and tackle crop diversification and income generation activities bytheir own initiative.
3.1.3 Basic Concepts for Agricultural Production Plan
A stable crop production and crop diversification by introducing high return cropsis proposed for increasing farm income. The plan was prepared based on theOFC balance on demand and supply and the Government agriculture development

C - 36
policy, OFC’s position in the study area, an effective use of potential waterresource by rehabilitation and improvement of irrigation facilities, farmers’intention and OFC crop cultivation on farm level.
(1) The Balance of demand and supply and the Government agriculturaldevelopment policy
The trend of production and consumption of paddy and major OFCs in Sri Lankais shown in Table C 3.1 and Figure C 3.1. The current trend of the demand and thesupply is summarised as follows:
a) Paddy consumption per capita tends to decrease but the production isalso stagnated and the import still continued.
b) The demand of onions, a major OFC, is largely increased, however theproduction is stagnated and the import tends to increase. The demandfor chillies is keeping certain demand.
c) The production and the demand of sesame is tend to decrease. Cowpeakeeps strong demand as the substitute of Dhal.
The future demand of paddy and OFC is not to increase largely; however, theactual demand is to increase according to annual population increase of 1% in thecountry3. In the National Six-year Plan, “the importation of potatoes, chillies,onions and other high value OFC are to be proceed into free-market system.” Ifsuch policy takes shape in the future, these OFC productions in the country will bein the face of competition with imported OFCs, which have inexpensive and highquality. Therefore, the productivity and the quality improvement have to betaken into account on OFC production.
(2) Potential water resource of the irrigation schemes
The potential water resource by the rehabilitation and improvement of irrigationfacilities in 100 irrigation schemes are shown in the table below.
Classification of Irrigation Schemes by Water Resource Potential
Irrigation Schemes / Hydrological GroupsPotential Increment ofCI*1 Major Medium Minor
High Over 50% 0 4 4Medium 0~50% 1 4 5Low 0% 7 3 0
*1 Increment of crop intensity on paddy cultivation after rehabilitation andimprovement of irrigation facilities.
Note: The table is not shown necessity of rehabilitation and improvement ofirrigation facilities.
3 Population and Labour Force – Projection for Sri Lanka 1991-2031, Department of Census and Statistics,
March 1994.

C - 37
The increment rate in the table above exhibits the case of entire paddy cultivationafter rehabilitation and improvement of irrigation facilities. Large increment isnot expected in seven major schemes and three medium schemes. Less waterrequirement comparing paddy and higher return crops have to be introduced forthe development for these schemes.
(3) Farmers’ intention on crop cultivation
Farmers expressed strong intention for paddy cultivation. As the result ofworkshop with farmers in RRA, 100 percent of them desired to cultivate paddy inboth Maha and Yala seasons under irrigated condition. Introduction of OFC asneeds for development was raised only in two schemes and two schemes and threecascade groups raised OFC to the question that “What do you think as sources forincome generation.” However, OFC cultivation is considered that is to bedisseminated among farmers, if necessary countermeasures are taken since theyhave strong intention for increasing income.
(4) OFC production
OFC cultivation area (1998) per farm household at present is shown in the tablebelow:
Present Crop Cultivated Area(Unit: ha/household)
Paddy OFCMaha Yala Irrigated Highland Sub-total
Total
Major 1.07 0.57 0.03 0.08 0.11 1.75Medium 0.68 0.36 0.02 0.17 0.19 1.23Minor 0.41 0.07 0.03 0.16 0.19 0.67Average 0.49 0.14 0.02 0.16 0.18 0.81
Source:Interview survey of the Study team、1999
OFC is traditionally cultivated in highland under rainfed condition, not many inpaddy land, except Mahaweli System-H. Such OFC cultivation under rainfedcondition has unstable and low yield, and has relatively high production cost andhigher risk of cultivation. Therefore, it is important on extension works in orderto reduce the relative cost of production and achieving stable production and highyield by cultivating under irrigated paddy land.
Agricultural production plan emphasising crop diversification by OFCs isprepared for increasing farm income. The plan is prepared according to thefollowing basic concepts.
a) Farm income is to increase by the introduction of OFC which requiredless water comparing with paddy and high return crops to the irrigationschemes in which large water resource is not expectable by rehabilitation

C - 38
and improvement of irrigation facilities.b) Major focus is to be on paddy cultivation by farmers’ strong intention
and OFC is partially introduced for the irrigation schemes in which waterresource potential is expected.
c) OFC cultivation in irrigated paddy land is recommended in order toincrease productivity and reduce cultivation risk by irrigation. OFC inirrigated paddy land is carrying on in the Mahaweli System-H. The dis-semination to the entire irrigation schemes is possible.
d) The method of irrigation is gravitational. The plan is to employ OFCcultivation by gravity irrigation for reducing the production cost as muchas possible, although OFC as Banana cultivation is carrying on inRajanganaya by using large pump.
3.2 Proposed Land Use
The land in irrigation schemes generally consist of farmland, forest, grassland,water area as tank, residence area and others as road, river and abandoned landand there is rock mountains in some scheme. Farmland is classified intoirrigated paddy land, rainfed paddy land, fallow paddy land and highland. Farmhousehold owns relatively wide space for residing and various crops are cultivatedin the garden.
Environmental problem byloss of forest and grasslandin the upper stream of thetank is recently takingplace in the Study area.
Chena cultivation is con-ducted in the forest andgrassland in order to recov-er agricultural income lostdue to fragmentation of theland and moreover devel-opment works by popul-ation pressure.
Forest loss is expanding.Under this background,land use in the plan is pro-posed to increase land pro-
Forest disaster
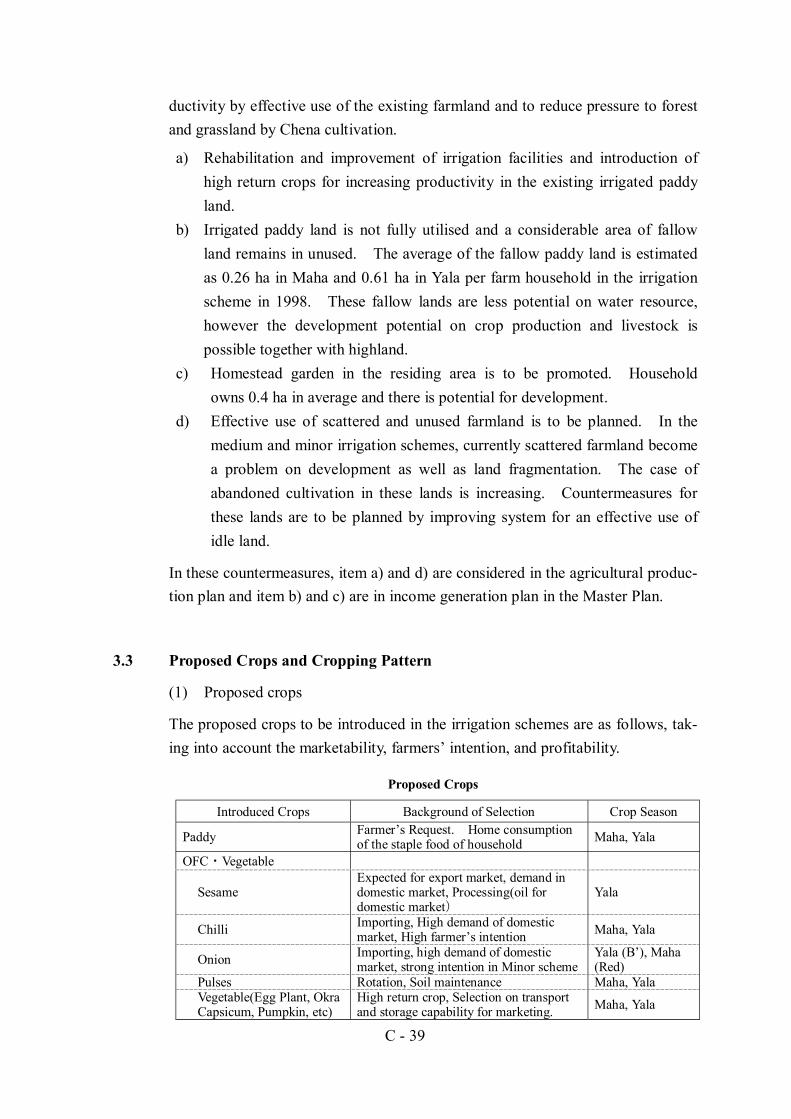
C - 39
ductivity by effective use of the existing farmland and to reduce pressure to forestand grassland by Chena cultivation.
a) Rehabilitation and improvement of irrigation facilities and introduction ofhigh return crops for increasing productivity in the existing irrigated paddyland.
b) Irrigated paddy land is not fully utilised and a considerable area of fallowland remains in unused. The average of the fallow paddy land is estimatedas 0.26 ha in Maha and 0.61 ha in Yala per farm household in the irrigationscheme in 1998. These fallow lands are less potential on water resource,however the development potential on crop production and livestock ispossible together with highland.
c) Homestead garden in the residing area is to be promoted. Householdowns 0.4 ha in average and there is potential for development.
d) Effective use of scattered and unused farmland is to be planned. In themedium and minor irrigation schemes, currently scattered farmland becomea problem on development as well as land fragmentation. The case ofabandoned cultivation in these lands is increasing. Countermeasures forthese lands are to be planned by improving system for an effective use ofidle land.
In these countermeasures, item a) and d) are considered in the agricultural produc-tion plan and item b) and c) are in income generation plan in the Master Plan.
3.3 Proposed Crops and Cropping Pattern
(1) Proposed crops
The proposed crops to be introduced in the irrigation schemes are as follows, tak-ing into account the marketability, farmers’ intention, and profitability.
Proposed Crops
Introduced Crops Background of Selection Crop Season
Paddy Farmer’s Request. Home consumptionof the staple food of household Maha, Yala
OFC・Vegetable
SesameExpected for export market, demand indomestic market, Processing(oil fordomestic market)
Yala
Chilli Importing, High demand of domesticmarket, High farmer’s intention Maha, Yala
Onion Importing, high demand of domesticmarket, strong intention in Minor scheme
Yala (B’), Maha(Red)
Pulses Rotation, Soil maintenance Maha, YalaVegetable(Egg Plant, OkraCapsicum, Pumpkin, etc)
High return crop, Selection on transportand storage capability for marketing. Maha, Yala

C - 40
In addition to these crops, limes for processing and cashew nut for export marketare potential crops. These crops are recommended for small-scale cultivation inhighland and homestead garden.
(2) Proposed cropping pattern
Proposed cropping pattern is prepared by considering potential of water resource,agro-ecological zone of the DOA and strong farmers’ intention to paddy cultiva-tion. Irrigation schemes are classified in potential water resource and agro-ecological zone as shown in the table below.
Proposed Cropping Pattern
Water Resources
IncreaseC.I. *1
Potential
Agroecologi-cal Zone
Classifica-tion
ProposedCroppingPattern*2
Name of Scheme
<50% M D MD OFC NachchaduwaD LD OFC Nuwarawewa, Tissawewa, Rajangana,
Palukadawewla, Attaragallewea,Abakolawewa
MajorNearly 0% L
I LI OFC Magalle WewaD HD Paddy Uttimaduwa Wewa,
MahananeriyawewaOver 50% H
I HI Paddy Hulugalla Wewa, Meddeketiya Wewa<50% M D MD OFC Thuruweli Wewa, Periyakulama,
Maminiya, Wewa MahabulankulamaD LD OFC Eru wewa, Mahagalgamuwawewa
Medium
Nearly 0% LI LI OFC Moragoda AnicutD HD Paddy II, IV, VIIOver 50% HI HI Paddy VIIID MD OFC I, III, V, VI
Minor
<50% MI MI Paddy IX
*1 C.I. = Cropping Intensity *2 OFC: OFC promotion pattern, Paddy: Paddy promotion patternNote: Increment of crop intensity rate in the above table is shown potential irrigation area by
75% dependability on without project and with project. Larger figure exhibits largerincrement of paddy irrigation area after the implementation of the programme. Theclassification was made into three (3) levels over 50% as high (H), less than 50% asmedium (M) and around 0% as low (L) in the table. Agro-ecological zone is divided intothe Lowland Dry zone (D) and the Lowland Intermediate zone (I). The Class is thecombination of potential water resource and agro-ecological zones.
The irrigation schemes are classified into six classes as HD, HI, MD, MI, LD andLI, as shown in the above table. Based on this classification, two type ofcropping patterns of paddy promotion pattern and OFC promotion pattern are pro-posed.
The irrigation schemes belonging to HD and HI are indicating high potential ofwater resource. MI is medium level of potential and belongs to the lowlandintermediate zone with higher rainfall. HD, HI and MI are proposed paddypromotion cropping pattern since farmers’ strong intention. These schemes areconsidered high return OFC promotion because most of them belong to the minorscheme and the management area is small scale. However they are purchasingrice for home consumption at present.

C - 41
The irrigation schemes belonging to LD and LI are hardly expected to developpaddy even though farmers’ have a strong intention of paddy. MD is themedium level of potentiality; however, it belongs to the dry zone and is adaptablefor OFC. Therefore, the irrigation schemes belonging to LD, LI, and MD arealso recommended for OFC promotion pattern.
(3) Proposed extent of cropping
The rate and the planned extent of paddy and OFC cultivation by croppingpatterns are estimated according to the proposed cropping pattern as followingsummary in the irrigation schemes. Crop cultivation in 100 schemes is in Table C3.2.
Target Extent of Paddy and OFC CultivationPaddy Strengthening Pattern OFC Promotion Pattern
Maha Yala Maha YalaPaddy OFC Paddy OFC Paddy OFC Paddy OFC
PaddyAreaTotal
OFCAreaTotal
Cultivation Rate 100% - 90 10% 90% 10% 80% 20%Cultivation AreaMajor (ha) - - - - 12,342 1,371 6,750 1,688 19,092 3,059Medium (ha) 470 - 404 45 777 86 440 110 2,091 241Minor (ha) 1,134 - 302 34 993 115 257 104 2,686 253Total (ha) 1,604 - 706 81 14,112 1,573 7,447 1,901 23,869 3,553
Note: Above OFC including Vegetable
Most of OFC is not cultivated in irrigated paddy land. Cultivation area withproject is mostly increased area. This production area is equivalent to 19% ofannual production area of Kurunegala and Anuradhapura and does not cause anextreme expansion. It will be possible to attain this figure as extension target ofOFC.
Extents of OFC Cultivated Area
Anuradhapura &Kurunegala
IrrigationScheme
Increment Rate
Maha 12,800 ha 1,580 ha 12%Yala 5,700 ha 1,910 ha 34%Total 18,500 ha 3,490 ha 19%
3.4 Proposed Farming Practices and Crop Production
3.4.1 Proposed Farming Practices
(1) Crop management
Proposed farming in the irrigated paddy land emphasises intensive crop culti-vation under diversified crop production. The risk of unreliable water supply,especially on OFC, is to be reduced through the implementation of therehabilitation of irrigation facilities, improvement of water management and

C - 42
applying proposed cropping patterns. The major technical approach on farmingpractices is on water management and crop management such as an appropriateplant density, an efficient fertiliser application, an effective pest management, aneffective labour use, and an appropriate harvest and post-harvest technique. Inaddition to crop production, livestock development and fishery development areconsidered in the income generation programmes. The following farmingpractices are applied through the implementation of the programmes.
1) Paddy cultivation
● Effective water management is to be carried out by farmers’ organisationresponsible for maintaining a secure water supply.
● Quality seeds are to be utilised arranged through quality seed productionin the schemes or in the area.
● Right amount of seeds are to be planted by appropriate seed supply andwater management.
● The right kind and amount of fertiliser is to be applied.● Straight fertilisers are to be utilised for reliable nutrient contents and
economical reasons. Re-cycling of paddy straw and other organic matterare also recommended for soil maintenance.
● Entire system of pest control as the Integrated Pest Management (IPM) isto be practiced generally for economical reason and for environmentalconsideration.
● Labour use is to taken into account on its cost-effect of use of family andhired workers on expected cropping pattern and farming.
● Inputs materials and technical supports are to be arranged by organisedproduction group or strengthened FO.
● Technical and management training and demonstration are to be appliedfor production group.
● Technical support is to be conducted through practical demonstrations.● Agricultural credit arrangement is to be applied through training.
(4) OFCs and vegetables
● Effective water management is to be carried out by farmers’ organisationresponsible for maintaining a secure water supply.
● Crop is to be selected based on market information, the adaptability andprofitability based on the available resources.
● Seeds of OFCs and vegetable are to be produced in the scheme or in thearea in the previous crop season according to the plan.
● Crop calendar is to be decided within the group before the season fornecessary arrangement.

C - 43
● Crop management as inputs materials and inputs levels is to be discussedin the group before the season for profitable management.
● Economical management is to be practiced for profitable cropping.● Marketing activities are to be emphasised for profitable farming.● Inputs materials and technical supports are to be arranged by organised
production group or strengthened FO.● Technical and management training and demonstration are to be applied
for production group.● Technical support is to be conducted through practical demonstrations.● Agricultural credit arrangement is to be applied through training.
(3) Cropping calendar
Farmer in most of the place prefers and intended to cultivate paddy and they arewaiting rainfall even after December and January. However as the past recordexhibited in crop intensity, large part of paddy field has not been used. OFCcultivation is recommended in the Lowland Dry zone in the irrigated condition forless water requirement. Switching cultivation from paddy to OFC is recommendedfor food security and income generation in the unstable water area and whenrainfall delayed. OFC cultivation under irrigated condition brings higher yieldingand stable production. The plan is to determined cultivation plot according to thecropping pattern. Planned paddy field, which required larger amount of water, isto recommend paddy cultivation before December in Maha cultivation thenswitching to OFC when rainfall has delayed. Late planting is affected by theoutbreak of insect damage and Yala cultivation. (Figure C 3.1)
3.4.2 Anticipated Crop Yield and Production
Production of paddy and proposed crops in OFC is estimated according to plannedcropping area based on the cropping rates, as shown in the table below on therespective cropping patterns. Rates are determined considering profitability,crop rotation, and labour use of the survey area. Yield levels of proposed cropsare basically set on the Department of Agriculture taking into account of thepresent cropping practices. The crop production of the major, medium and minorschemes are shown below. Crop production of proposed crops in all the irrigationschemes according to the proposed cropping patterns is shown in Table C 3.3.

C - 44
Cropping Rate of Cropping Pattern(Unit: %)
Paddy Promotion Pattern OFC Promotion PatternCrops Maha Yala Maha YalaPaddy 100.0 90.0 90.0 80.0Sesame 0.0 2.0 0.0 4.0Chillies 0.0 2.5 3.0 5.0B’onion 0.0 2.0 0.0 4.0Red Onion 0.0 0.0 2.0 0.0Pulse 0.0 2.5 3.5 5.0Vegetable 0.0 1.0 1.5 2.0
Total 100.0 100.0 100.0 100.0
Anticipated Yield of Proposed Crops(Unit: kg/ha)
Paddy Promotion Pattern OFC Promotion PatternCrops Maha Yala Maha YalaPaddy 5,000 5,000 5,000 5,000Sesame 900 900 900Chillies 1,500 1,500 1,500B’onion 10,000 10,000 10,000Red Onion 15,000 15,000 15,000Pulse 1,500 1,500 1,500Vegetable 10,000 10,000 10,000
Proposed Crop Production(Unit: ton)
Maha Season Yala SeasonCrops Major Medium Minor Crops Major Medium Minor
Paddy 61,710 6,235 10,635 Paddy 33,750 4,220 2,795Sesame - - - Sesame 304 28 25Chillies 617 38 52 Chillies 633 58 51Onion 4,114 259 346 Onion 2,375 310 275Pulse 720 45 61 Pulse 633 58 51Vegetable 2,057 473 631 Vegetable 1,688 155 137Maha Paddy 62,710 6,235 10,635 Yala Paddy 33,750 4,220 2,795Maha OFC 7,508 473 631 Yala OFC 6,632 608 540Maha Total 69,218 6,708 11,266 Yala Total 40,382 4,828 3,335
Paddy Total 95,460 10,455 13,430OFC Total 14,140 1,081 1,171Total 109,600 11,536 14,601
3.5 Improvement of Land Fragmentation
Generally, farmers in the medium and minor schemes have land fragmented intoseveral plots and are scattered in and around the village or at several tanks.Since crop cultivation has increasingly become unprofitable in recent times, thereare many instances where farmers have abandoned crop cultivation at remote plots.It is expected that such problem will be reduced through the improvement of cropproductivity proposed in the Master Plan. If it still remains in the schemes, thefollowing countermeasures will be recommended.

C - 45
1) Land consolidation: The farmers exchange mutually their plots underequal value.
2) Mutual lease of land: The farmers lease mutually their lands fragmented,or lease to other farmers, as shown below.
A radical reform for fragmentation is the land consolidation, but it won't work outin practice, because it affects directly farmers’ interests. Therefore, it will beproposed to adopt the mutual lease of land. Active communication withpowerful mediation by FO is essential to make sure the implementation of theabove countermeasure.
3.6 Crop Budget and Farm Economy
3.6.1 Crop Budget
Information of inputs and prices for the cropping budget are utilised basicallyfrom the farmers’ interview survey and the technical recommendations of DOAand other reliable sources for the budget estimation.
Price of product: Unit prices of products are principally taken from the average ofthe interview survey. However on paddy, price is taken an average of Majorscheme at Rs. 11.2 due to the reason that paddy price in the study area haschanged from 1998Yala to 98/99 Maha by Rs. 10.1 to Rs. 12.3 according to DOA“Cost of Cultivation”. Prices of pulses and vegetable in the survey includedvarious type of crop in each category, therefore the prices are adjusted from otherinformation.Seed rate: Seed rate is determined based on DOA’s recommendation.Fertiliser application: Fertiliser levels are DOA’s recommendation for the targetyield of 120 bushel/acre (6000kg/ha) and kinds of fertiliser are straight fertiliseras Urea, Triple Super Phosphate (TSP) and Muriate of Potash (MOP).Agro-chemicals: The damages of pests, as weed, insect and disease, vary theirlevels of damages by season and area. Types and amount of chemicals weredetermined by DOA’s Techno-guide and pesticide recommendation.Labour: Labour uses are taken from averages of the major scheme and themedium and minor schemes of the questionnaire survey. Wage rate is applied
Farm Plot - A
Farm Plot - B
Farmer - A
Farm Plot - B
Farm Plot - A
Farmer - B
Farm Plot - A
LeaseFarmer - C
Lease

C - 46
Rs.150 per day in all labour work from the scheme average across individualschemes.Machinery and animal power: The inputs level and charges are applied on theaverage of the major and the medium and minor schemes of the questionnairesurvey.Others: The cost for threshing and transport is based on the average cost.Miscellaneous is counted at five(5) percent of the production cost.
The summaries of the cost and return of “without project” and “with project”according to the cropping pattern are shown blow: (Detail of individual scheme isin Table C 3.4 and an individual crop budget of crop is in Table C 3.5.
Summary of Crop Budget- without Project
Yield (ton/ha) Price (Rs./kg)Gross
Income(Rs./ha)
ProductionCost
(Rs./ha)Net Return
(Rs./ha)
MahaMajor Scheme 4.10 11.2 45,800 33,600 12,200Medium Scheme 3.59 10.8 38,900 27,700 11,200Minor Scheme 3.41 10.5 35,900 29,300 6,600YalaMajor Scheme 3.84 11.2 42,900 32,500 10,400Medium Scheme 3.28 10.8 35,500 24,000 11,500
Paddy
Minor Scheme 3.51 10.5 36,900 25,800 11,100Major Scheme 54,500 42,000 12,500Medium Scheme 40,800 30,100 10,700OFCMinor Scheme 64,800 36,400 28,400
Crop Budget - With Project
Major SchemesPlanned
Yield(kg/ha)
Price(Rs./kg)
GrossIncome(Rs./ha)
ProductionCost (Rs./ha)
Net income(Rs./ha)
Paddy – Maha 5,000 11.2 56,000 33,500 22,500Paddy – Yala 5,000 11.2 56,000 32,800 23,200Sesame – Yala 900 35 31,500 22,100 9,400Pulses 1,500 29 43,500 25,400 18,100Chili 1,500 80 120,000 68,300 51,700B. Onion-Yala 10,000 33.5 335,000 70,500 264,500Red Onion-Maha 15,000 30 450,000 223,100 226,900Vegetable 10,000 16.1 161,000 68,300 92,700
Medium & MinorSchemes
PlannedYield (kg/ha)
Price(Rs./kg)
GrossIncome(Rs./ha)
ProductionCost (Rs./ha)
Net income(Rs./ha)
Paddy – Maha 5,000 10.8 54,000 33,100 20,900Paddy – Yala 5,000 10.8 54,000 32,500 21,500Sesame – Yala 900 35 31,500 21,600 9,900Pulses 1,500 29 43,500 23,900 19,600Chili 1,500 80 120,000 55,600 64,400B. Onion-Yala 10,000 33.5 335,000 71,000 264,000Red Onion-Maha 15,000 30 450,000 201,500 248,500Vegetable 10,000 16.1 161,000 70,400 90,600

C - 47
Chapter 4 IMPROVEMENTS OF MARKETING AND CREDIT
4.1 Improvement of Marketing
According to RRA, the farmers have requested the marketing improvement offarm inputs and outputs. Especially, those problems have been pointed out forover 40% of the minor irrigation schemes. In the meantime, the result of thequestionnaire survey shows that the major problems of marketing are narroweddown to i) expensive of farm inputs and ii) low farm-gate prices of products. Inaddition, the farmers have also pointed out the problems that farm inputs are notavailable when needed.
The following measures have been recommended to overcome present marketingproblems in the irrigation schemes.
a) Expansion of group purchasing system of farm inputs,b) Organising the OFCs’ producer group to establish marketing channels,c) Setting up of collecting points for products,d) Setting up of Pola, ande) Establishment of marketing information system.
(1) Expansion for Group Purchasing of Farm Inputs
Supplying farm inputs on time is one of the important factors for improving cropyields. To ensure smooth supply of farm inputs, a group purchasing systemmanaged by FO is proposed that is to be introduced in the irrigation schemes.The overall flow of group purchasing system is presented in the chart below.
Proposed Group Purchasing
Technical Guidance & Distribution of
Cropping Calendar
Prep. of Application Form
Collection of Purchasing
Order
Prep. of Application
Form
Pur- chasing Order
Storing (Storage House)
Distri- bution
of Farm Inputs
Coop- erative
Shipping
Loan Collection by Repre- sentative
Farmers
Farmers' Society
Selling / Transport
Cultivation Harvesting
Explana- tion
Meeting
Lecture on Loan Loan Disbursement Bank
Technical Guidance
Suppliers
Bank
Che
que
/
Rep
aym
ent
GIDA
Banks
(Dealers)
Supp
lier's
Acc
ount
ASC
FO

C - 48
This system is closely connected with group loan system and technical guidance,and has the following merits:
● By directly purchasing from suppliers, the farmers can obtain the neces-sary quantity of farm inputs;
● Through this system, the farmers can arrange all necessary farm inputsbefore the crop season, and they can use those inputs on time according tothe necessity;
● Under a blanket purchase system, the farmers can purchase farm inputs atdiscount prices; and
● Transportation services will be available from the suppliers.
For successful management of this system, the following factors are essential: (i)ASC’s support for access to suppliers and banks, and (ii) a good co-ordination andclose linkage between FOs and ASC. Thus, the farm inputs such as fertilisersand agro-chemicals would be supplied smoothly by the private suppliers throughthis system. In the future, it will be expected this purchase system will be cov-ered by farmers’ own fund.
(2) Organising of Producer Group of OFCs
One of the important factors for OFC and vegetable production is a close linkagebetween producers and traders. And the condition of the linkage from the trad-ers’ side is producers’ stable supply with a certain quantity. The individualfarmers are at a disadvantage due to small quantities and unstable production. Itis essential for organising particular OFC producer groups. The farmers cultivateOFC individually, but sell their products by the group.
Taking these activities into consideration, it is suggested that farmers should betrained through several kinds of courses conducted by ASC on technical andmarketing aspects of OFC. The training programs should cover, (i) cultivationtechniques of OFCs, (ii) the reasons of price variations, and time and quality tomaximise the profits, and (iii) packaging of perishables during the transportationusing locally available materials.
(3) Establishment of collecting point
In dealing with traders, it is proposed to establish collecting points of products inFarmer Centres setting up in each GN. Periodical shipping at fixed collectingpoints will have several merits for both farmers and traders; i.e., curtailingfarmers’ transportation cost, effective collection of traders, and decreasinghandling losses of products.

C - 49
(4) Establishment of Pola
For the marketing improvement within the irrigation schemes, it is proposed toestablish Pola at least one in each major/medium schemes and hydrological group.By the establishment of Pola, merchants and traders will be attracted in the area,and marketing of products will be activated. Marketable surplus produced athome garden or in the highland will be marketed through such Pola.
(5) Establishment of Marketing Information System
For the marketing improvement of products, a marketing information systemshould be established. Presently, the publications related to market informationare issuing by the Agrarian Research and Training Institution (ARTI). Thebiweekly prices of farm products not only at farm gate but also at Pettah marketare available from ARTI. It is recommended that the market information isprovided to the farmers at least every two weeks. ASC should play an importantrole for information services of marketing.
4.2 Agricultural Credit
At the initial stage of the implementation of the programmes, the farmers need aconsiderable amount of funds for purchasing farm inputs. In addition, farmerswill require some capital for commencement of activities proposed in the incomegeneration. However, there is difficulty to access individual credit in theirrigation schemes at present. To overcome this situation, the following threetypes of credit are proposed.
(1) Group Loan System
The proposed system is based on group loans, which will be managed by FO.The system will be adopted to purchase mainly farm inputs such as fertilisers andagro-chemicals. The following figure shows the outline of the proposed creditsystem:
Proposed Group Loan
Lump-sumrepayment bygroup
Farm Inputs(Loan in kind)
Loan request byindividual farmers
Farm InputsSupplier
Loan for farm inputs(by Bank Cheque to the FO )
(Blanket purchase)
Farm Inputs
Paymentby cash
Banks
Loan requestby FO
FO / Sub Committee
Farmers

C - 50
The loan procedures to be followed under the system are as follows:
a) The loan is limited only for the purchase of farm inputs and its ceiling amountis set depending on the type of crop.
b) To receive a loan, FO has to form a group and select a representative. Themembers of such a group are jointly and severally responsible for repaymentof the loan for any defaulters.
c) FO estimates the requirement of farm inputs, in comparison to the appliedamount of loan. At this time, the extension officer gives technical guidancesuch as recommended fertilisers and agro-chemicals to be used.
d) The bank provides a loan for FO on a lump-sum basis or dividing it into twoinstalments. Then FO purchase farm inputs in one lot. The bank providesthe loan money only to the suppliers of farm inputs, and FO receives farminputs in kind from the suppliers. In this way, FO and group members do notneed to deal with cash, except for the bank check to be issued to the suppliers.
e) FO collects the loan payment amount for each farmer, and repays it to thebank in a lump sum. The bank does not collect the loan payment amountfrom individual farmers.
Since this loan system is realised on the basis of the mutual trust, the borrowersshould be the farmers or the poor living in the same community. The state banksand several private banks are now providing such group loans, and these grouploans will be possible to introduce in the irrigation schemes.
(2) Revolving Loan System
The revolving loan system managed by FO is proposed for the irrigation schemes.The capital of loan is profits obtained through business activities such as co-operative purchasing of farm inputs, and shares collecting from the members.FO lends its money to the farmers at an interest rate lower than the market rate.The repayment amount from the farmers is deposited in FO’s account and FOfinances the farmers again.
Proposed Revolving Loan
Farm inputs /
GenerationCapital of Income
Rep
aym
ent
(Cas
h)
Deferredpayment
M anaging guidanceby PM U
Loan in kind under alow interest less thanmarket rate(FO purchase farminputs by a bulk andsupply to the farmers.)
FOAccount
Project Executing AgencyPM U
Farmers / Poor FamiliesGuidance / aftercare
for income generation
NGOs

C - 51
If FO will have insufficient capital, the executing agency of the programmesarranges a considerable amount of funds, and provides it to FO. Surplus fromthe revolving loan goes to payment to the investor. It is necessary that PMUprovides supporting services to FO for management of the revolving loan system,because FO, which is the managing agency of the revolving loan system, has noknowledge and experience on such banking business.
This revolving loan system is managed comprehensively with the agriculturalextension services. This loan system is adopted not only to purchase farm inputsbut also to procure equipment like rice mills under the income generationprogramme. Enough guidance with continuous aftercare by the executingagency of the programmes is essential for loan management of borrowers (farmers/ the poor), and NGO’s involvement is expected to such grass-root activities.
(3) Mutual Aid Credit System
Although the above two types are to be applied for duly organised FOs registeredwith DAS, it is important and necessary that the farmers must have a simple creditorganisation like the one called “rotating-funds credit association.” This type ofcredit aims to provide the associates with funds to cover needs not necessarily forproduction purposes but also for emergencies or consumption purposes. Theimplementation of these associations will help to “educate” the farmers on usingmutual aid mechanisms. The rotating funds credit association could be formedby 10-20 members from whom an association head is selected and the head is incharge of the administration of the system. The credit is managed by theassociation, which has no involvement of FO.
The members of a rotating funds credit association, by means of monthly fixeddeposits decided by all members, make up a communal fund from which each inturn withdraws certain amounts at regular intervals. The assignment of thesesums can be made through a “lottery” system or decided by mutual agreementamong the members. The deposits and withdrawals continue until each memberhas received the agreed standard sum of money. The duration of the associationsmay be unlimited or pre-determined, further, the association can be open or closed,in the sense that it admits or does not admit the entrance of new members or thedeparture of existing ones.
This credit system will be applied to the capital of living and the income genera-tion. Penalties for defaulting must be established in the rules governing the asso-ciation. These rules must be clearly defined and enforced. The peers’ pressureplays an important role for the enforcement of the rules.

TABLES

Table C 1.1 Fish Production in Anuradhapura District - 1999 (under Major and Medium Tank)(Unit : MT)
Jan Feb Mar Apr May Jun Jul Aug Sep Oct Nov Dec Annual Total
Kalawewa 42.1 42.3 47.6 44.3 47.3 51.6 48.0 52.0 51.0 47.1 46.0 42.0 561
Balaluwewa 35.0 32.0 34.0 35.0 37.0 38.0 41.0 42.0 44.0 39.0 37.0 36.0 450
Rajanganaya S 40.0 42.0 43.0 45.0 48.0 52.0 44.0 59.0 57.0 56.0 44.0 42.0 572
Angamuwa 17.0 16.0 17.0 18.0 20.0 24.0 21.0 27.0 26.0 22.0 21.0 20.0 249
Kalankuttiya 12.0 12.5 13.7 14.0 15.0 16.0 14.0 18.0 18.7 14.0 13.0 12.7 174
Katiyawa 14.0 16.2 16.4 17.5 17.7 18.0 16.0 19.0 24.0 22.0 19.0 16.0 216
Ranawa 10.4 10.2 11.7 11.8 12.0 12.5 11.7 12.4 11.7 10.4 10.7 10.4 136
Mahavilachchiya 10.1 10.7 10.6 10.7 12.1 14.7 10.7 24.0 27.0 26.0 14.0 8.0 179
Nuwarawewa 7.6 7.4 8.7 8.6 8.4 8.9 8.7 10.8 12.1 10.4 9.7 8.6 110
Mahakanadarawa 2.1 2.4 3.7 3.8 3.9 4.7 4.9 5.2 4.1 4.2 4.1 3.4 47
Nachchaduwa 7.4 7.7 7.9 8.7 8.6 9.2 14.7 16.8 16.7 15.0 8.7 8.9 130
Huruluwewa 10.4 10.7 11.5 12.1 14.7 15.5 14.7 16.0 14.0 9.7 9.6 9.9 149
Mahamankadawala 1.0 1.2 1.3 1.4 1.4 1.5 2.0 2.0 1.5 1.4 1.4 1.2 17
Horiwila 4.2 4.3 4.2 4.5 4.6 4.1 4.0 4.7 4.2 3.1 3.0 2.9 48
Bellankadawala 1.4 1.6 1.2 1.3 1.4 1.5 1.6 1.6 1.2 1.3 1.2 1.2 17
Kiulekada 2.7 2.8 3.0 3.1 4.5 4.0 4.5 4.1 4.2 4.0 3.5 3.0 43
Manankattiya 1.7 1.7 1.5 1.6 1.6 1.2 1.4 1.6 1.5 1.3 1.4 1.6 18
Mahadiulwewa 0.5 0.7 0.8 0.9 1.0 1.0 1.2 1.2 1.1 0.7 0.6 0.5 10
Padaviya 50.2 52.6 54.7 55.5 57.5 50.7 75.0 77.0 65.0 60.0 51.0 50.0 699
Wahalkada 14.5 15.0 15.5 17.5 17.8 18.0 15.5 24.0 22.0 22.0 20.0 18.0 220
284.3 290.0 308.0 315.3 334.5 347.1 354.6 418.4 407.0 369.6 318.9 296.3 4044
Source: Fishery Extension Coordinator, Anuradhapura : Study irrigation schemes
Total
Name of Tank
CT - 1

Major Medium Minor Major Medium Minor Major Medium Minor Major Medium Minor Major Medium Minor1) Seeds (kg/ha) 106 122 136 111 121 134 - 8 14 8 10 15 57 13 24 2) Fertilizers
Total 458 367 335 410 309 379 - 125 74 95 11 - 31 7 172 3) Agro-chemicals
Weedicides Liquid (lit./ha) 3.32 2.08 1.92 2.94 2.18 1.95 - - - - - - - - 0.08 Insecticides Liquid (lit./ha) 1.03 0.81 1.03 1.46 0.85 1.05 - - - 1.20 0.50 - 0.75 0.60 1.16
Powder (kg/ha) 0.94 0.73 0.71 0.71 1.27 0.37 - - - - - - - 0.20 -Fungicides Liquid (lit./ha) 0.05 0.01 0.02 0.03 - 0.13 - - - - - - - - -
Powder (kg/ha) 0.60 0.13 0.24 0.51 0.01 0.09 - - - 2.00 - - - - -4) Machinery
Total (ha) 1.81 1.63 1.77 1.84 1.54 1.62 - - 0.48 1.10 0.22 0.16 1.00 0.20 0.10 5) Animal power
Total (ha) 0.07 0.13 0.07 0.06 0.11 0.15 - - - - - - - - -6) Labour
Family (man-day/ha) 29 41 52 32 41 65 - 48 57 68 41 73 102 68 73 Attham (man-day/ha) 3 4 5 3 4 5 - - 4 - 2 2 - 2 -Hired (man-day/ha) 49 37 33 53 32 31 - 22 15 10 33 4 44 7 7 Total (man-day/ha) 81 82 90 88 76 101 - 70 76 78 75 79 146 77 80
Major Medium Minor Major Medium Minor Major Medium Minor Major Medium Minor1) Seeds (kg/ha) 2 2 2 - 6 8 120 100 195 5 4 2 2) Fertilizers
Total 820 375 531 - 404 655 400 300 259 536 441 446 3) Agro-chemicals
Weedicides Liquid (lit./ha) 0.98 0.06 0.23 - 3.60 4.42 - - 0.49 0.14 0.73 0.59 Insecticides Liquid (lit./ha) 3.90 2.87 2.64 - 2.00 3.26 - - 1.54 4.67 1.63 2.48
Powder (kg/ha) 0.28 0.41 0.66 - - 0.22 - - - - 6.13 0.04 Fungicides Liquid (lit./ha) 0.69 - 0.16 - 0.20 0.58 - - - 1.38 0.56 0.06
Powder (kg/ha) 3.84 0.84 1.73 - 20.00 1.20 - - - - 0.35 0.14 4) Machinery
Total (ha) 1.00 0.81 0.66 - 1.60 0.86 - 1.00 0.33 1.25 0.46 0.51 5) Animal power
Total (ha) - - 0.03 - 3.20 0.01 - - - - 0.35 0.05 6) Labour
Family (man-day/ha) 228 189 159 - 259 227 310 81 200 177 303 148 Attham (man-day/ha) 7 2 2 - - 7 - - - 2 - 2 Hired (man-day/ha) 82 53 74 - 74 152 - 15 43 66 30 40 Total (man-day/ha) 317 244 235 - 333 385 310 96 243 245 333 189
Table C 2.1 Inputs on Crop Production in the Irrigation Schemes
Paddy - Maha Paddy - Yala Maize Sesame Pulses
Chilli B. Onion Red Onion Vegetables
CT - 2

(1) Damage by pests and diseases 80% Damage by pests and diseases 80% Water shortage 90%(2) Weed damage 36% Water shortage 71% Damage by pests and diseases 73%(3) Water shortage 32% Damage by wild animal 56% Damage by wild animal 49%(4) Lack of farm roads 31% Weed damage 38% Drought damage 41%(5) Low yield of crops 31% Low yield of crops 36% Low yield of crops 38%(6) Damage by wild animal 26% Difficulty in obtaining seeds 32% Weed damage 32%(7) Difficulty in obtaining seeds 25% Drought damage 31% Difficulty in obtaining seeds 27%(8) Expensive of farm inputs 19% Lack of farm roads 28% Expensive of farm inputs 21%(9) Labour shortage 14% Expensive of farm inputs 17% Lack of farm roads 20%
(10) Others 10% Problems related to loans 13% Others 13%(11) Difficult in purchasing fertilizers 10% Difficult in purchasing fertilizers 11% Difficult in purchasing fertilizers 11%(12) Problems related to loans 8% Difficult in purchasing agro-chemicals 11% Problems related to loans 9%(13) Drought damage 8% Others 9% Difficult in purchasing agro-chemicals 8%(14) Difficult in purchasing agro-chemicals 7% Marketing problems for products 7% Marketing problems for products 7%(15) Difficult in hiring animal/mechanical power 6% Labour shortage 7% Difficult in hiring animal/mechanical power 5%(16) Marketing problems for products 6% Difficult in hiring animal/mechanical power 6% Labour shortage 4%(17) Drainage problems 6% Drainage problems 4% Lack of storage facilities 3%(18) Leveling problems in paddy field 3% Leveling problems in paddy field 2% Drainage problems 2%(19) Lack of storage facilities 3% Lack of storage facilities 0% Leveling problems in paddy field 2%
(1) To prevent pests and diseases 75% To prevent pests and diseases 75% To acquire irrigation water 81%(2) To introduce improved seed varieties 67% To introduce improved seed varieties 74% To improve irrigation facilities 73%(3) To improve irrigation facilities 52% To improve irrigation facilities 74% To introduce improved seed varieties 68%(4) To improve farming practices 49% To acquire irrigation water 64% To prevent pests and diseases 68%(5) To prevent weed damage 35% To prevent damage by wild animal 53% To prevent damage by wild animal 45%(6) To acquire irrigation water 33% To improve farming practices 47% To improve farming practices 42%(7) To improve farm road 29% To prevent weed damage 47% To prevent weed damage 39%(8) To prevent damage by wild animal 26% To improve agricultural credit services 31% To improve agricultural credit services 27%(9) To improve agricultural credit services 25% To improve farm road 27% To strengthen agri. extension services 24%
(10) To strengthen agri. extension services 22% To strengthen agri. extension services 26% To improve farm road 24%(11) To improve supplying system of farm inputs 21% To improve supplying system of farm inputs 22% farm inputs 20%(12) To introduce mechanized farming 16% To introduce mechanized farming 12% Other 14%(13) Other 7% Other 11% To introduce mechanized farming 10%(14) To drain out excess water 6% To drain out excess water 5% To improve transportation of products 3%(15) To construct storage facilities 2% To construct storage facilities 2% To drain out excess water 2%(16) To improve transportation of products 1% To construct processing facilities 1% To construct storage facilities 2%(17) To construct drying floor 1% To improve transportation of products 1% To construct drying floor 2%(18) To construct processing facilities 0% To construct drying floor 0% To construct processing facilities 1%
Major Scheme Medium Scheme Minor Scheme
Table C 2.2 Problems Related to Farming
Major Scheme Medium Scheme Minor Scheme
Table C 2.3 Farmers' Intention to Improve Farming
CT - 3

Average Distance to Market Major Medium Minorkm 4.2 7.7 7.9
Marketing Problem Major Medium Minor Major Medium Minor Major Medium Minor
Low selling prices 68% 64% 65% 11% 14% 13% 43% 48% 48%Lack of transportation facilities 9% 13% 10% 69% 59% 48% 46% 40% 44%High cost of transportation 5% 6% 5% 5% 2% 6% 12% 11% 7%Lack of storage facilities 7% 6% 1% 15% 25% 33%Problems of product quality 6% 8% 7%Lack of packaging material 0% 1% -Other 4% 2% 4%
Major Medium Minor Major Medium Minor Major Medium Minor Major Medium Minor Major Medium MinorAgriculture services center 5% 3% 4% 6% 3% 5% 28% 22% 22% 15% 6% 12% 21% 13% 11%Cooperative store 2% 2% 1% 3% 2% 2% 0% - 0% - - - - - -Town shop 49% 55% 67% 44% 52% 65% 3% 5% 9% 28% 22% 25% 22% 16% 22%Village shop 36% 31% 22% 34% 32% 23% 4% 3% 5% 7% 6% 5% - - 3%Traders/Dealers 4% 6% 4% 4% 6% 4% 0% 1% 1% 4% 4% 2% 3% 5% 1%Other farmers 0% 0% 0% 1% 0% 0% 24% 20% 22% 5% 4% 5% 6% 14% 5%Farmers Organization 3% 2% 0% 5% 2% 1% 1% 1% 1% 3% 1% 2% - 1% 2%Others 1% 1% 0% 2% 1% 0% 0% 1% 1% 2% 3% 4% - 4% 2%Own seeds - - 0% 0% 1% 0% 39% 46% 38% 23% 30% 25% 36% 23% 15%
Major Medium Minor Major Medium Minor Major Medium Minor Major Medium Minor Major Medium MinorNon availability 4% 1% 5% 3% 1% 5% 15% 5% 10% 35% 26% 13% 36% 29% 13%Not available when needed 7% 13% 9% 8% 11% 9% 12% 19% 16% 4% 6% 4% 3% 4% 3%Available only small quantity 2% 4% 1% 1% 2% 1% 4% 1% 3% - 1% - - - -Expensive 45% 42% 36% 43% 41% 34% 25% 24% 16% 31% 5% 7% 11% 6% 9%Transport problems 0% 1% 4% 0% 2% 4% 1% 1% 3% - 1% 3% - 3% 2%Lack of finance 32% 30% 37% 30% 29% 35% 22% 19% 24% 9% 13% 12% 7% 6% 9%Low quality 8% 7% 5% 13% 12% 10% 19% 27% 19% 6% 13% 6% 5% 10% 5%Other 1% 1% 1% 1% 1% 1% 2% 3% 3% 2% 1% 5% - - 2%
Seed-Paddy Seed-OFC Seed-Vegetables
Major Problem ofPurchasing Farm Inputs
Agro-chemicals Fertilizer Seed-Paddy Seed-OFC Seed-Vegetables
Bicycle
Purchasing Place of FarmInputs
Agro-chemicals Fertilizer
2W Tractor NoCart No answer
Table C 2.4 Farmers' Situation on Marketing of Inputs and Outputs on Farming
TransportMeans
Problem ofPurchasing FarmInputs
Lorry Yes
CT - 4

Major Medium Minor AllDid you have any consultations with the agricultural extension staff during the past one year ?
Yes 45% 36% 34% 35%No 52% 62% 62% 61%No answer 4% 3% 4% 3%
Did you have any services provided by the extension agent during the last one year ?1) Yes, very much 25% 26% 23% 23%2) Yes, some 58% 46% 51% 51%3) No, not helpful 17% 28% 26% 25%
What advise did you receive from the extension agent during your last consultation ?1) Improved seeds 24% 23% 22% 22%2) Fertilizer application 34% 27% 28% 29%3) Insecticide use 33% 36% 31% 32%4) Changes cultivation practices 6% 2% 5% 5%5) Other 3% 4% 5% 5%
Did you have any extension services from veterinary extension officer during the last one year?Yes 11% 15% 19% 18%No 73% 70% 64% 65%No answer 17% 15% 17% 17%
What services/advise did you receive from the veterinary extension officer ?1) Animal breeding 4% 3% 4% 4%2) Artificial Insemination 7% 4% 6% 6%3) Animal food 4% 3% 3% 3%4) Medicine 38% 31% 21% 23%5) Vaccination 48% 50% 42% 43%6) Other - 1% 5% 4%
Have you planted any tree on your land during the past 12 months ?Yes 73% 77% 74% 75%No 21% 15% 16% 16%No answer 6% 8% 10% 9%
How many trees have you planted over the past 12 months ?Numbers 0.7 0.8 0.7 0.7
Did you have any benefits from the extension services ?1) Crop production
Yes 25% 22% 23% 23%No 47% 44% 45% 45%No answer 29% 33% 32% 32%
2) Livestock raisingYes 5% 11% 13% 12%No 56% 50% 49% 50%No answer 39% 39% 38% 38%
3) Tree crop productionYes 8% 7% 8% 8%No 59% 63% 60% 61%No answer 33% 30% 31% 31%
Table C 2.5 Extension Services
CT - 5

(ton/ha) (Rs./kg) (Rs./ha) (Rs./ha) (Rs./ha) (ton/ha) (Rs./kg) (Rs./ha) (Rs./ha) (Rs./ha) (Rs./ha) (Rs./ha) (Rs./ha)
1MA01 NACHCHDUWA WEWA 4.43 11.5 50,900 39,100 11,800 3.81 11.5 43,800 38,600 5,200 42,300 91,000 -48,700
1MA02 NUWARAWEWA 4.11 10.9 44,800 34,400 10,400 2.64 10.9 28,800 38,000 -9,200 116,500 37,000 79,500
1MA03 TISSA WEWA 4.04 12.5 50,500 36,500 14,000 4.11 12.5 51,400 39,800 11,600 29,100 29,500 -400
2MA01 RAJANGANA WEWA*1 4.04 11.3 45,700 34,100 11,600 4.12 11.3 46,600 33,700 12,900 25,400 39,100 -13,700
4MA01 PALUKADAWELA 3.55 11.2 39,800 29,000 10,800 2.66 11.2 29,800 25,000 4,800 28,500 36,400 -7,900
4MA02 ATTARAGALLA WEWA 4.05 11.5 46,600 29,500 17,100 4.28 11.5 49,200 31,800 17,400 40,700 38,700 2,000
4MA03 ABAKOLA WEWA 4.26 10.4 44,300 31,800 12,500 4.22 10.4 43,900 33,700 10,200 56,100 45,100 11,000
5MA01 MAGALLAWEWA 4.34 10.0 43,400 34,500 8,900 4.48 10.0 44,800 34,200 10,600 97,500 35,000 62,500
1ME01 THURUWELI WEWA 4.18 11.2 46,800 30,500 16,300 3.59 11.2 40,200 30,100 10,100 22,200 29,100 -6,900
1ME02 ERU WEWA 3.62 10.1 36,600 24,800 11,800 3.60 10.1 36,400 22,100 14,300 83,400 64,400 19,000
1ME03 UTTIMADUWA WEWA 3.15 11.2 35,300 24,400 10,900 2.48 11.2 27,800 17,500 10,300 10,300 17,800 -7,500
1ME04 RPERIYAKULAMA 4.15 10.2 42,300 27,300 15,000 3.56 10.2 36,300 28,400 7,900 32,300 25,300 7,000
1ME05 MAMINIYA WEWA 3.98 10.6 42,200 29,000 13,200 1.71 10.6 18,100 14,200 3,900 9,500 26,700 -17,200
1ME06 MAHA BULANKULAMA 2.63 12.2 32,100 21,400 10,700 3.83 12.2 46,700 32,700 14,000 10,300 25,700 -15,400
2ME01 ANGAMUWAWEWA*2
4ME01 MAHA NANERIYAWEWA 2.71 8.9 24,100 24,700 -600 - 8.9 0 0 0 58,000 32,500 25,500
4ME02 MAHAGALGAMUWA WEWA 2.92 9.0 26,300 25,800 500 - 9.0 0 0 0 6,700 11,500 -4,800
5ME01 HULUGALLA WEWA 3.13 11.1 34,700 32,800 1,900 3.57 11.1 39,600 31,700 7,900
6ME01 MEDDEKETIYAWEWA 3.81 11.2 42,700 35,000 7,700 3.65 11.2 40,900 31,400 9,500 80,300 36,000 44,300
6ME02 MORAGODA ANICUT 3.44 11.5 39,600 28,500 11,100 2.46 11.5 28,300 26,400 1,900 67,300 47,000 20,300
I 8 Minor Schemes 3.86 10.5 40,400 32,100 8,300 - 10.5 0 0 0 37,400 40,700 -3,300
II 9 Minor Schemes 4.01 9.6 38,600 26,100 12,500 3.18 9.6 30,600 30,200 400 63,200 39,800 23,400
III 10 Minor Schemes 3.75 10.5 39,300 27,200 12,100 3.69 10.5 38,700 31,700 7,000 47,400 28,100 19,300
IV 11 Minor Schemes 2.83 11.1 31,400 27,500 3,900 2.88 11.1 32,000 28,300 3,700 113,200 44,000 69,200
V 12 Minor Schemes 3.09 10.6 32,900 31,400 1,500 3.00 10.6 31,900 33,300 -1,400 155,100 52,600 102,500
VI 13 Minor Schemes 3.18 10.5 33,300 25,700 7,600 3.89 10.5 40,700 30,300 10,400 43,900 24,500 19,400
VII 14 Minor Schemes 3.16 9.5 29,900 26,500 3,400 3.80 9.5 35,900 25,500 10,400 26,600 23,800 2,800
VIII 15 Minor Schemes 3.80 12.2 46,400 41,600 4,800 3.70 11.2 41,400 31,200 10,200 18,700 20,100 -1,400
IX 16 Minor Schemes 2.75 10.2 27,900 25,200 2,700 2.87 10.2 29,100 24,100 5,000 84,200 64,100 20,100*1: Including Angamuwawewa *2: Part of the Rajangana irrigation scheme
MinorSchemes
(Casicade)
MajorSchemes
MediumSchemes
Net Return YieldYield Price
Table C 2.6 Crop Budget - Present
Code No. Name of Scheme
Paddy OFC and VegetablesMaha Yala
GrossIncomeProduction
CostNet Return
ProductionCost
Net ReturnGrossIncome
ProductionCost
PriceGross
Income
CT-6

1992 1993 1994 1995 1996 1997Production ('000 MT)
Rice 2,339.70 2,510.17 2,683.69 2,809.89 2,061.52 2,239.37 Kurakkan & Meneri 5.28 7.57 7.07 5.14 4.10 3.62 Maize 28.80 31.66 31.60 34.84 32.96 25.69 Sorghum 0.10 0.08 0.10 0.22 0.19 0.19 Green Gram 23.14 21.29 19.03 16.01 16.59 15.00 Soya Bean 1.35 0.83 0.98 2.37 0.73 0.42 Cowpea & Dhall 17.47 19.63 18.68 16.14 17.04 14.00 Ground Nuts 3.24 5.45 5.63 5.91 5.12 5.26 Chillies-dry 18.95 23.68 23.25 21.34 18.40 18.05 Gingelly 4.78 4.88 4.65 4.50 3.82 6.64 Vegetables (Excl.Onion) 621.31 628.95 637.73 646.54 653.79 662.25 Onion 82.39 70.39 82.95 78.11 63.31 73.94 Fresh Fruits 129.62 131.51 132.90 136.49 137.85 140.19 Poultry Meats 19.00 25.20 35.47 38.78 38.89 45.73 Eggs 46.05 48.58 48.95 48.86 48.53 48.47 Fresh Fish 206.17 220.90 224.00 237.50 228.55 242.00 Cow milk 196.50 206.56 211.57 214.06 210.69 212.78 Buffaloa Milk 82.55 68.51 69.09 67.45 69.20 66.81 Tinned (Whole Dried) 8.46 8.36 8.94 10.22 11.72 9.86 Condesensed Milk 3.97 4.21 4.21 4.38 3.90 4.09 Milk Food (Yougurt,etc) 1.41 1.52 1.76 2.24 1.71 1.62
Total Demand ('000 MT)Rice 2706.67 2695.99 2757.40 2685.91 2694.65 2779.28Kurakkan & Meneri 5.28 7.57 7.07 5.14 4.10 3.62Maize 28.80 112.42 116.41 114.89 124.54 115.93Sorghum 0.10 0.08 0.10 0.22 10.29 0.81Wheat Flour 566.44 559.37 677.57 782.61 682.44 611.25Green Gram 23.14 21.29 19.03 15.56 16.94 16.73Soya Bean 1.61 3.82 15.76 18.72 3.41 0.62Cowpea & Dhall 69.48 69.13 96.46 75.22 87.27 91.98Ground Nuts 3.24 6.62 7.26 6.21 11.80 7.05Chillies-dry 25.80 24.61 31.60 32.16 28.35Gingelly 4.78 4.88 4.65 4.50 3.82 6.64Vegetables (Excl.Onion) 621.31 628.95 637.73 646.54 653.79 662.25Onion 119.89 107.09 133.17 156.32 157.14 196.56Fresh Fruits 130.53 133.44 136.25 140.70 142.31 147.37Poultry 19.38 25.54 36.08 39.23 39.60 47.05Eggs 46.05 48.58 48.95 48.86 48.53 48.47Fresh Fish 206.40 226.32 224.63 238.34 230.49 244.07Cow milk 196.50 206.56 211.57 214.06 210.69 212.78Buffaloa Milk 82.55 68.51 69.09 69.09 69.20 66.81Tinned (Whole Dried) 39.03 41.08 44.97 51.44 49.40 48.17Condesensed Milk 4.21 4.24 4.65 4.55 4.20 4.47Milk Food (Yougurt,etc) 1.46 1.56 1.97 2.44 1.78 1.74
Per Capita ( Kgm per year)Rice 96.12 94.49 95.01 91.25 91.18 93.00 Kurakkan & Meneri 0.26 0.37 0.34 0.24 0.19 0.17 Maize 1.41 1.32 2.39 2.27 2.05 1.41 Sorghum 0.01 0.03 0.01 0.01 0.20 0.04 Wheat Flour 32.24 31.46 37.59 42.82 36.93 32.65 Green Gram 1.26 1.14 1.00 0.81 0.87 0.85 Soya Bean 0.08 0.21 0.85 0.99 0.13 0.03 Cowpea & Dhall 3.85 3.78 5.21 4.01 4.60 4.79 Ground Nuts 0.12 0.29 0.32 0.26 0.56 0.30 Chillies-dry 1.48 1.40 1.77 1.78 1.55 - Gingelly 0.27 0.28 0.26 0.25 0.21 0.36 Vegetables (Excl.Onion) 35.70 35.70 35.70 35.70 35.70 35.70 Onion 3.73 3.26 4.09 4.93 5.06 6.46 Fresh Fruits 7.40 7.48 7.56 7.59 7.57 7.75 Poultry 1.11 1.45 2.02 2.17 2.16 2.54 Eggs 2.60 2.71 2.69 2.65 2.60 2.57 Fresh Fish 7.05 7.53 6.92 6.93 7.66 8.07 Cow milk 7.88 8.36 8.70 8.34 7.41 7.54 Buffaloa Milk 4.74 3.89 3.87 3.72 3.78 3.60 Tinned (Whole Dried) 2.24 2.33 2.52 2.83 2.70 2.59 Condesensed Milk 0.24 0.24 0.26 0.25 0.23 0.24 Milk Food (Yougurt,etc) 0.08 0.09 0.11 0.13 0.10 0.09
Source : Food Balance Sheet 1992 - 1997 ; Department of Census and Statistics, Ministry of Finance and Planning: Agricultural Commodity Review ; HARTI
Commodity
Table C 3.1 Food Balance 1992 - 1997
CT - 7

Major Irrigation Schemes (Unit: ha/scheme)
Major Major Major Major Major Major Major Major Total2,540 1,134 365 5,668 956 462 410 2,632 14,167
1MA-01 1MA-02 1MA-03 2MA-01 4MA-01 4MA-02 4MA-03 5MA-012,286 1,021 329 4,997 189 416 369 2,064 11,670
Sesame - Chilli 76 34 11 170 29 14 12 29 375 B'onion - Red onion 51 23 7 113 19 9 8 19 250 Pulse 89 40 13 198 33 16 14 34 438 Vegetable 38 17 5 85 14 7 6 15 188
2,286 1,021 329 4,997 189 416 369 2,064 11,670 254 113 37 567 96 46 41 97 1,251
2,540 1,134 365 5,564 285 462 410 2,161 12,920 2,032 286 34 2,428 346 165 164 1,295 6,750
OFC Sesame 102 13 2 114 17 9 8 265 Chilli 127 16 2 142 22 11 10 330 B'onion 102 13 2 114 17 9 8 265 Red onion - Pulse 127 16 2 142 22 11 10 330 Vegetable 51 7 1 57 9 4 4 133
2,032 286 34 2,428 346 165 164 1,295 6,750 509 65 9 569 87 44 41 1,324
2,541 351 43 2,997 433 209 205 1,295 8,074 Paddy 4,318 1,088 339 7,691 1,360 584 533 3,578 19,491 OFC 763 130 39 1,214 221 88 82 587 3,125 Total 5,081 1,485 408 8,561 718 671 615 3,456 20,994
Paddy 170 96 93 136 142 126 130 136 138OFC 30 11 11 21 23 19 20 22 22Total 200 131 112 151 75 145 150 131 148
SHEETCODE
CroppingIntensity (%)
Ann
ual Total
Mah
a C
ultiv
atio
nY
ala
Cul
tivat
ion
Paddy
TotalOFC Total
Total
Table C 3.2 Proposed Cropping Pattern (1/3)
Paddy Total
SCHEME
OFC
Paddy TotalOFC Total
Commanding Area
Paddy
CT - 8

Medium Irrigation Schemes (Unit: ha/scheme)
Medium Medium Medium Medium Medium Medium Medium Medium Medium Medium Medium Medium Total227 34 93 91 211 90 158 193 121 98 194 1,509
1ME-01 1ME-02 1ME-03 1ME-04 1ME-05 1ME-06 2ME-01 4ME-01 4ME-02 5ME-01 6ME-01 6ME-02168 31 93 82 189 81 158 51 121 98 175 1,246
Sesame - Chilli 7 1 3 6 3 2 6 27 B'onion - Red onion 5 1 2 4 2 1 4 18 Pulse 8 1 3 7 3 2 7 32 Vegetable 3 1 1 3 1 1 3 14
168 31 93 82 189 81 158 51 121 98 175 1,246 23 3 9 21 9 6 19 90
191 34 93 91 210 90 158 57 121 98 194 1,336 142 27 67 42 72 32 140 32 109 88 155 907
Sesame 5 1 1 2 4 2 3 2 2 2 8 32 Chilli 6 2 2 3 5 2 4 2 3 2 10 41 B'onion 5 1 1 2 4 2 3 2 2 2 8 32 Red onion - Pulse 6 2 2 3 5 2 4 2 3 2 10 41 Vegetable 2 1 1 1 2 1 2 1 1 1 4 17
142 27 67 42 72 32 140 32 109 88 155 907 24 7 7 11 20 9 16 8 12 10 39 163
166 34 74 53 92 41 156 40 121 98 194 1,069 Paddy 310 58 160 124 261 113 298 83 230 186 330 2,153 OFC 47 10 7 20 41 18 16 14 12 10 58 253 Total 357 68 167 144 302 131 314 97 242 196 388 2,406
Paddy 137 169 172 136 124 126 189 43 190 190 170 143OFC 21 31 8 22 20 20 10 7 10 10 30 17Total 157 200 180 158 143 146 199 50 200 200 200 159
CroppingInten
Ann
ual Total
Total
Yal
a C
ultiv
atio
n
Paddy
Paddy TotalOFC Total
OFC
Total
Mah
a C
ultiv
atio
n
Paddy
Paddy TotalOFC Total
OFC
Table C.3.2 Proposed Cropping Pattern (2/3)
SHEETCODE
SCHEMECommanding Area
CT - 9

Minor Irrigation Schemes (Unit: ha/scheme)Minor Minor Minor Minor Minor Minor Minor Minor Minor Total
303 278 412 349 179 318 260 271 139 2,509 I II III IV V VI VII VIII IX
232 211 354 299 153 254 215 271 138 2,127 Sesame - Chilli 8 12 7 8 35 B'onion - Red onion 5 8 4 6 23 Pulse 9 14 8 10 41 Vegetable 4 6 3 4 17
232 211 354 299 153 254 215 271 138 2,127 26 40 22 28 116
258 211 394 299 175 282 215 271 138 2,243 12 193 68 18 34 94 58 82 559
Sesame 1.0 10 2 9 2 2 1 2 28 Chilli 1.0 12 2 11 2 3 2 2 35 B'onion 1.0 10 2 9 2 2 1 2 28 Red onion 6.0 2 142 22 11 183 Pulse 1.0 12 2 11 2 3 2 2 35 Vegetable 0.3 5 1 4 1 1 1 1 14
12 193 68 18 34 94 58 82 559 10 50 150 66 20 10 6 9 322 22 243 218 84 54 104 64 91 881
Paddy 244 211 547 367 171 288 309 329 220 2,686 OFC 36 90 150 88 48 10 6 9 438 Total 280 211 637 517 259 336 319 335 229 3,124
Paddy 81 76 133 105 96 91 119 121 158 107OFC 12 0 22 43 49 15 4 2 7 17Total 93 76 155 148 145 106 123 124 165 124
Ann
ual Total
CroppingIntensity (%)
Yal
a C
ultiv
atio
n
Paddy
Total
OFC
Paddy TotalOFC Total
Total
Mah
a C
ultiv
atio
n
Paddy
OFC
Paddy TotalOFC Total
Table C.3.2 Proposed Cropping Pattern (3/3)
Cascade System
SCHEMECommanding Area
CT - 10

Sesame Chili B'onion Red onion Pulses VegetablesOFC Total Sesame Chili B'onion Red onion Pulses Vegetables Total Paddy OFC Total
1MA-01 NACHCHDUWA WEWA OFC Promotion 11,430 114 762 133 381 1,391 12,821 10,160 91 191 1,016 191 508 1,996 12,156 21,590 3,387 24,977
1MA-02 NUWARAWEWA OFC Promotion 5,103 51 340 60 170 621 5,724 337 3 6 34 6 17 66 403 5,440 687 6,127
1MA-03 TISSA WEWA OFC Promotion 1,643 16 110 19 55 200 1,842 54 0 1 5 1 3 11 65 1,696 211 1,907
2MA-01 RAJANGANA WEWA OFC Promotion 25,506 255 1,700 298 850 3,103 28,609 12,950 117 243 1,295 243 648 2,545 15,495 38,456 5,648 44,104
4MA-01 PALUKADAWELA OFC Promotion 4,302 43 287 50 143 523 4,825 2,500 23 47 250 47 125 491 2,991 6,802 1,015 7,817
4MA-02 ATTARAGALLA WEWA OFC Promotion 2,079 21 139 24 69 253 2,332 840 8 16 84 16 42 165 1,006 2,919 418 3,337
4MA-03 ABAKOLA WEWA OFC Promotion 1,845 18 123 22 62 224 2,069 820 7 15 82 15 41 161 981 2,665 386 3,051
5MA-01 MAGALLAWEWA OFC Promotion 11,056 111 737 129 368 1,345 12,401 6,832 61 128 683 128 342 1,342 8,174 17,888 2,687 20,575
1ME-01 THURUWELI WEWA OFC Promotion 1,022 10 68 12 34 124 1,146 426 4 8 43 8 21 84 509 1,447 208 1,655
1ME-02 ERU WEWA OFC Promotion 153 2 10 2 5 19 172 136 1 3 14 3 7 27 163 289 45 334
1ME-03 UTTIMADUWA WEWA Paddy Strengthen 465 465 335 1 3 15 3 7 29 364 800 29 829
1ME-04 RPERIYAKULAMA OFC Promotion 410 4 27 5 14 50 459 184 2 3 18 3 9 36 220 593 86 679
1ME-05 MAMINIYA WEWA OFC Promotion 950 9 63 11 32 115 1,065 354 3 7 35 7 18 69 423 1,304 185 1,488
1ME-06 MAHA BULANKULAMA OFC Promotion 405 4 27 5 13 49 454 139 1 3 14 3 7 27 166 544 76 620
2ME-01 ANGAMUWAWEWA
4ME-01 MAHA NANERIYAWEWA Paddy Strengthen 790 790 699 3 6 31 6 16 61 760 1,489 61 1,550
4ME-02 MAHAGALGAMUWA WEWAOFC Promotion 255 3 17 3 9 31 286 162 1 3 16 3 8 32 194 417 63 479
5ME-01 HULUGALLA WEWA Paddy Strengthen 605 605 545 2 5 24 5 12 48 592 1,150 48 1,197
6ME-01 MEDDEKETIYAWEWA Paddy Strengthen 490 490 441 2 4 20 4 10 39 480 931 39 970
6ME-02 MORAGODA ANICUT OFC Promotion 873 9 58 10 29 106 979 776 7 15 78 15 39 152 928 1,649 259 1,908
Cascade System Total I OFC Promotion 914 9 61 11 30 111 1,026 32 0 1 3 1 2 6 39 947 118 1,064
Cascade System Total II Paddy Strengthen 1,055 1,055 1,055 1,055
Cascade System Total III OFC Promotion 1,471 15 98 17 49 179 1,650 1,004 9 19 100 19 50 197 1,201 2,475 376 2,851
Cascade System Total IV Paddy Strengthen 1,459 1,459 283 1 2 13 2 6 25 307 1,741 25 1,766
Cascade System Total V OFC Promotion 756 8 50 9 25 92 848 289 3 5 29 5 14 57 346 1,045 149 1,194
Cascade System Total IV OFC Promotion 978 10 65 11 33 119 1,097 254 2 5 25 5 13 50 303 1,232 169 1,401
Cascade System Total VII Paddy Strengthen 1,075 1,075 467 2 4 21 4 10 41 507 1,541 41 1,582
Cascade System Total VIII Paddy Strengthen 1,201 1,201 271 1 2 12 2 6 24 295 1,473 24 1,496
Cascade System Total IX Paddy Strengthen 503 503 365 1 3 16 3 8 32 396 867 32 899
Major 62,964 630 4,198 735 2,099 7,660 70,624 34,493 310 647 3,449 647 1,725 6,778 41,270 97,457 14,438 111,895
Medium 6,416 41 271 47 135 494 6,910 4,196 28 58 307 58 154 604 4,799 10,612 1,098 11,710
Minor 9,411 41 275 48 137 501 9,912 2,964 20 41 219 41 110 431 3,396 12,375 932 13,308
Total 78,791 711 4,743 830 2,371 8,656 87,447 41,653 358 745 3,976 745 1,988 7,813 49,465 120,444 16,468 136,912
Minor
Major
Medium
RecommendedCropping Type
Crop Production per Schemes (ton/ha)Yala Cultivation Annual
PaddyOFC
TotalTotal
Maha Cultivation
PaddyOFC
Total
Table C 3.3 Proposed Crop Production
SCHEMESHEETCODE
Irrigation Scheme
CT - 11
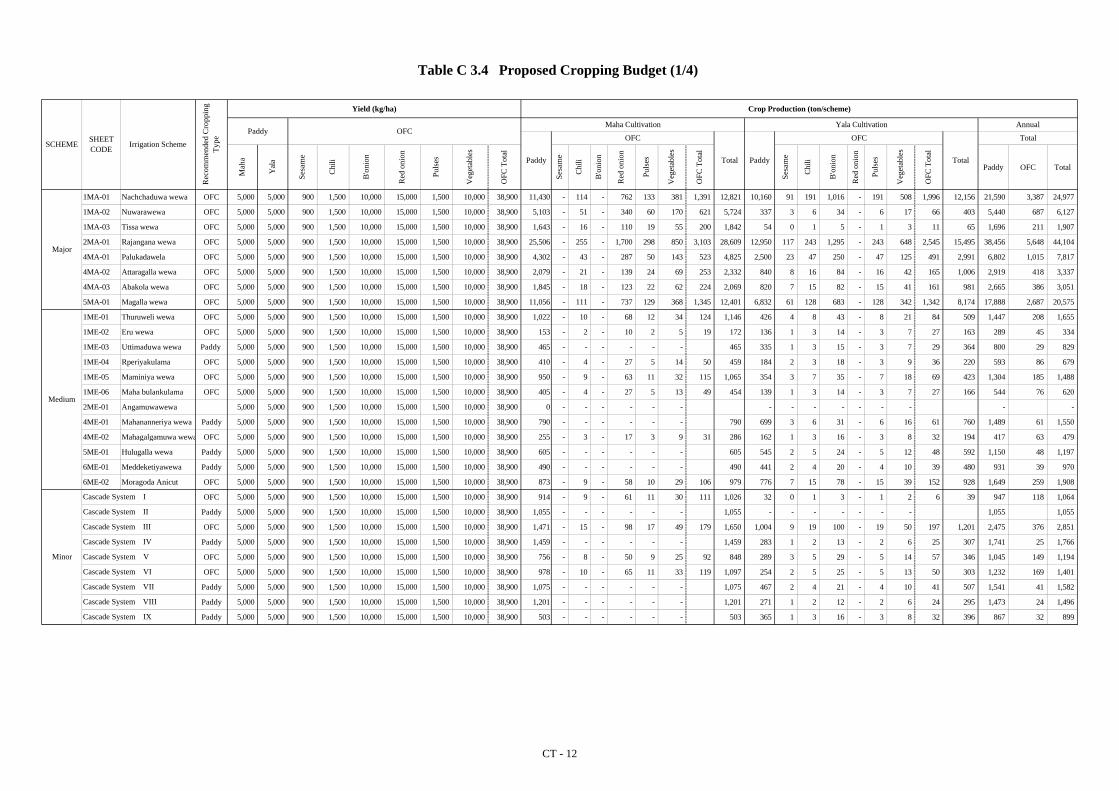
Mah
a
Yal
a
Ses
ame
Chi
li
B'o
nion
Red
oni
on
Puls
es
Veg
etab
les
OFC
Tot
al
Ses
ame
Chi
li
B'o
nion
Red
oni
on
Puls
es
Veg
etab
les
OFC
Tot
al
Ses
ame
Chi
li
B'o
nion
Red
oni
on
Puls
es
Veg
etab
les
OFC
Tot
al
Paddy OFC Total
1MA-01 Nachchaduwa wewa OFC 5,000 5,000 900 1,500 10,000 15,000 1,500 10,000 38,900 11,430 - 114 - 762 133 381 1,391 12,821 10,160 91 191 1,016 - 191 508 1,996 12,156 21,590 3,387 24,977
1MA-02 Nuwarawewa OFC 5,000 5,000 900 1,500 10,000 15,000 1,500 10,000 38,900 5,103 - 51 - 340 60 170 621 5,724 337 3 6 34 - 6 17 66 403 5,440 687 6,127
1MA-03 Tissa wewa OFC 5,000 5,000 900 1,500 10,000 15,000 1,500 10,000 38,900 1,643 - 16 - 110 19 55 200 1,842 54 0 1 5 - 1 3 11 65 1,696 211 1,907
2MA-01 Rajangana wewa OFC 5,000 5,000 900 1,500 10,000 15,000 1,500 10,000 38,900 25,506 - 255 - 1,700 298 850 3,103 28,609 12,950 117 243 1,295 - 243 648 2,545 15,495 38,456 5,648 44,104
4MA-01 Palukadawela OFC 5,000 5,000 900 1,500 10,000 15,000 1,500 10,000 38,900 4,302 - 43 - 287 50 143 523 4,825 2,500 23 47 250 - 47 125 491 2,991 6,802 1,015 7,817
4MA-02 Attaragalla wewa OFC 5,000 5,000 900 1,500 10,000 15,000 1,500 10,000 38,900 2,079 - 21 - 139 24 69 253 2,332 840 8 16 84 - 16 42 165 1,006 2,919 418 3,337
4MA-03 Abakola wewa OFC 5,000 5,000 900 1,500 10,000 15,000 1,500 10,000 38,900 1,845 - 18 - 123 22 62 224 2,069 820 7 15 82 - 15 41 161 981 2,665 386 3,051
5MA-01 Magalla wewa OFC 5,000 5,000 900 1,500 10,000 15,000 1,500 10,000 38,900 11,056 - 111 - 737 129 368 1,345 12,401 6,832 61 128 683 - 128 342 1,342 8,174 17,888 2,687 20,575
1ME-01 Thuruweli wewa OFC 5,000 5,000 900 1,500 10,000 15,000 1,500 10,000 38,900 1,022 - 10 - 68 12 34 124 1,146 426 4 8 43 - 8 21 84 509 1,447 208 1,655
1ME-02 Eru wewa OFC 5,000 5,000 900 1,500 10,000 15,000 1,500 10,000 38,900 153 - 2 - 10 2 5 19 172 136 1 3 14 - 3 7 27 163 289 45 334
1ME-03 Uttimaduwa wewa Paddy 5,000 5,000 900 1,500 10,000 15,000 1,500 10,000 38,900 465 - - - - - - 465 335 1 3 15 - 3 7 29 364 800 29 829
1ME-04 Rperiyakulama OFC 5,000 5,000 900 1,500 10,000 15,000 1,500 10,000 38,900 410 - 4 - 27 5 14 50 459 184 2 3 18 - 3 9 36 220 593 86 679
1ME-05 Maminiya wewa OFC 5,000 5,000 900 1,500 10,000 15,000 1,500 10,000 38,900 950 - 9 - 63 11 32 115 1,065 354 3 7 35 - 7 18 69 423 1,304 185 1,488
1ME-06 Maha bulankulama OFC 5,000 5,000 900 1,500 10,000 15,000 1,500 10,000 38,900 405 - 4 - 27 5 13 49 454 139 1 3 14 - 3 7 27 166 544 76 620
2ME-01 Angamuwawewa 5,000 5,000 900 1,500 10,000 15,000 1,500 10,000 38,900 0 - - - - - - - - - - - - - - -
4ME-01 Mahananneriya wewa Paddy 5,000 5,000 900 1,500 10,000 15,000 1,500 10,000 38,900 790 - - - - - - 790 699 3 6 31 - 6 16 61 760 1,489 61 1,550
4ME-02 Mahagalgamuwa wewa OFC 5,000 5,000 900 1,500 10,000 15,000 1,500 10,000 38,900 255 - 3 - 17 3 9 31 286 162 1 3 16 - 3 8 32 194 417 63 479
5ME-01 Hulugalla wewa Paddy 5,000 5,000 900 1,500 10,000 15,000 1,500 10,000 38,900 605 - - - - - - 605 545 2 5 24 - 5 12 48 592 1,150 48 1,197
6ME-01 Meddeketiyawewa Paddy 5,000 5,000 900 1,500 10,000 15,000 1,500 10,000 38,900 490 - - - - - - 490 441 2 4 20 - 4 10 39 480 931 39 970
6ME-02 Moragoda Anicut OFC 5,000 5,000 900 1,500 10,000 15,000 1,500 10,000 38,900 873 - 9 - 58 10 29 106 979 776 7 15 78 - 15 39 152 928 1,649 259 1,908
OFC 5,000 5,000 900 1,500 10,000 15,000 1,500 10,000 38,900 914 - 9 - 61 11 30 111 1,026 32 0 1 3 - 1 2 6 39 947 118 1,064
Paddy 5,000 5,000 900 1,500 10,000 15,000 1,500 10,000 38,900 1,055 - - - - - - 1,055 - - - - - - - 1,055 1,055
OFC 5,000 5,000 900 1,500 10,000 15,000 1,500 10,000 38,900 1,471 - 15 - 98 17 49 179 1,650 1,004 9 19 100 - 19 50 197 1,201 2,475 376 2,851
Paddy 5,000 5,000 900 1,500 10,000 15,000 1,500 10,000 38,900 1,459 - - - - - - 1,459 283 1 2 13 - 2 6 25 307 1,741 25 1,766
OFC 5,000 5,000 900 1,500 10,000 15,000 1,500 10,000 38,900 756 - 8 - 50 9 25 92 848 289 3 5 29 - 5 14 57 346 1,045 149 1,194
OFC 5,000 5,000 900 1,500 10,000 15,000 1,500 10,000 38,900 978 - 10 - 65 11 33 119 1,097 254 2 5 25 - 5 13 50 303 1,232 169 1,401
Paddy 5,000 5,000 900 1,500 10,000 15,000 1,500 10,000 38,900 1,075 - - - - - - 1,075 467 2 4 21 - 4 10 41 507 1,541 41 1,582
Paddy 5,000 5,000 900 1,500 10,000 15,000 1,500 10,000 38,900 1,201 - - - - - - 1,201 271 1 2 12 - 2 6 24 295 1,473 24 1,496
Paddy 5,000 5,000 900 1,500 10,000 15,000 1,500 10,000 38,900 503 - - - - - - 503 365 1 3 16 - 3 8 32 396 867 32 899
Table C 3.4 Proposed Cropping Budget (1/4)
Rec
omm
ende
d C
ropp
ing
Typ
e
Paddy
Cascade System VII
Cascade System V
Cascade System VI
Yala Cultivation Annual
Paddy
OFC
Major
Medium
Minor
Cascade System I
Cascade System II
Cascade System III
Cascade System IV
Total
Cascade System VIII
Cascade System IX
Total
Crop Production (ton/scheme)
OFCMaha Cultivation
SCHEMESHEETCODE
Irrigation Scheme
Yield (kg/ha)
Total Paddy
OFC
CT - 12

Maha Yala
Ses
ame
Chi
li
B'o
nion
Red
oni
on
Puls
es
Veg
etab
les
Ses
ame
Chi
li
B'o
nion
Red
oni
on
Puls
es
Veg
etab
les
OFC
Tot
al
Ses
ame
Chi
li
B'o
nion
Red
oni
on
Puls
es
Veg
etab
les
OFC
Tot
al
Paddy OFC Total
1MA-01 Nachchaduwa wewa OFC 11.2 11.2 25.6 81.8 34.3 42.6 27.3 19.2 128,016 0 9,350 0 32,461 3,640 7,315 52,767 180,783 113,792 2,341 15,583 34,849 0 5,201 9,754 67,727 181,519 241,808 120,493 362,301
1MA-02 Nuwarawewa OFC 11.2 11.2 25.6 81.8 34.3 42.6 27.3 19.2 57,154 0 4,174 0 14,493 1,625 3,266 23,558 80,712 3,772 78 517 1,155 0 172 323 2,245 6,017 60,926 25,803 86,729
1MA-03 Tissa wewa OFC 11.2 11.2 25.6 81.8 34.3 42.6 27.3 19.2 18,396 0 1,344 0 4,667 523 1,052 7,586 25,982 605 12 83 185 0 28 52 360 964 19,001 7,946 26,947
2MA-01 Rajangana wewa OFC 11.2 11.2 25.6 81.8 34.3 42.6 27.3 19.2 285,667 0 20,864 0 72,437 8,124 16,324 117,748 403,416 145,040 2,984 19,862 44,419 0 6,629 12,432 86,325 231,365 430,707 204,073 634,781
4MA-01 Palukadawela OFC 11.2 11.2 25.6 81.8 34.3 42.6 27.3 19.2 48,182 0 3,519 0 12,218 1,370 2,753 19,860 68,043 28,000 576 3,834 8,575 0 1,280 2,400 16,665 44,665 76,182 36,525 112,708
4MA-02 Attaragalla wewa OFC 11.2 11.2 25.6 81.8 34.3 42.6 27.3 19.2 23,285 0 1,701 0 5,904 662 1,331 9,598 32,883 9,412 194 1,289 2,883 0 430 807 5,602 15,015 32,697 15,200 47,897
4MA-03 Abakola wewa OFC 11.2 11.2 25.6 81.8 34.3 42.6 27.3 19.2 20,664 0 1,509 0 5,240 588 1,181 8,517 29,181 9,184 189 1,258 2,813 0 420 787 5,466 14,650 29,848 13,984 43,832
5MA-01 Magalla wewa OFC 11.2 11.2 25.6 81.8 34.3 42.6 27.3 19.2 123,831 0 9,042 0 31,394 3,521 7,075 51,032 174,863 76,515 1,574 10,476 23,428 0 3,496 6,557 45,532 122,047 200,346 96,564 296,910
1ME-01 Thuruweli wewa OFC 11.2 11.2 25.6 81.8 34.3 42.6 27.3 19.2 11,441 0 836 0 2,901 325 654 4,716 16,157 4,767 98 653 1,460 0 218 409 2,837 7,604 16,208 7,553 23,760
1ME-02 Eru wewa OFC 11.2 11.2 25.6 81.8 34.3 42.6 27.3 19.2 1,714 0 125 0 435 49 98 706 2,420 1,523 31 209 466 0 70 131 907 2,430 3,237 1,613 4,850
1ME-03 Uttimaduwa wewa Paddy 11.2 11.2 25.6 81.8 34.3 42.6 27.3 19.2 5,208 0 0 0 0 0 0 0 5,208 3,750 34 228 510 0 76 143 992 4,742 8,958 992 9,950
1ME-04 Rperiyakulama OFC 11.2 11.2 25.6 81.8 34.3 42.6 27.3 19.2 4,586 0 335 0 1,163 130 262 1,890 6,477 2,059 42 282 630 0 94 176 1,225 3,284 6,645 3,116 9,761
1ME-05 Maminiya wewa OFC 11.2 11.2 25.6 81.8 34.3 42.6 27.3 19.2 10,634 0 775 0 2,690 302 606 4,373 15,007 3,965 81 542 1,211 0 181 339 2,354 6,320 14,600 6,727 21,327
1ME-06 Maha bulankulama OFC 11.2 11.2 25.6 81.8 34.3 42.6 27.3 19.2 4,536 0 329 0 1,144 128 258 1,859 6,395 1,554 32 212 473 0 71 132 920 2,474 6,090 2,779 8,869
2ME-01 Angamuwawewa - -
4ME-01 Mahananneriya wewa Paddy 11.2 11.2 25.6 81.8 34.3 42.6 27.3 19.2 8,848 0 0 0 0 0 0 0 8,848 7,832 72 476 1,065 0 159 298 2,070 9,903 16,680 2,070 18,751
4ME-02 Mahagalgamuwa wewa OFC 11.2 11.2 25.6 81.8 34.3 42.6 27.3 19.2 2,853 0 209 0 725 81 163 1,178 4,031 1,812 37 248 556 0 83 156 1,080 2,891 4,665 2,258 6,923
5ME-01 Hulugalla wewa Paddy 11.2 11.2 25.6 81.8 34.3 42.6 27.3 19.2 6,776 0 0 0 0 0 0 0 6,776 6,098 56 371 830 0 124 232 1,613 7,712 12,874 1,613 14,488
6ME-01 Meddeketiyawewa Paddy 11.2 11.2 25.6 81.8 34.3 42.6 27.3 19.2 5,488 0 0 0 0 0 0 0 5,488 4,939 45 301 672 0 100 188 1,307 6,246 10,427 1,307 11,734
6ME-02 Moragoda Anicut OFC 11.2 11.2 25.6 81.8 34.3 42.6 27.3 19.2 9,778 0 714 0 2,479 278 559 4,030 13,808 8,691 179 1,190 2,662 0 397 745 5,173 13,864 18,469 9,203 27,672
OFC 11.2 11.2 25.6 81.8 34.3 42.6 27.3 19.2 10,241 0 748 0 2,597 291 585 4,221 14,463 363 7 50 111 0 17 31 216 579 10,604 4,437 15,041
Paddy 11.2 11.2 25.6 81.8 34.3 42.6 27.3 19.2 11,810 0 0 0 0 0 0 0 11,810 0 0 0 0 0 0 0 0 0 11,810 11,810
OFC 11.2 11.2 25.6 81.8 34.3 42.6 27.3 19.2 16,472 0 1,203 0 4,177 468 941 6,790 23,262 11,246 231 1,540 3,444 0 514 964 6,693 17,940 27,718 13,483 41,201
Paddy 11.2 11.2 25.6 81.8 34.3 42.6 27.3 19.2 16,335 0 0 0 0 0 0 0 16,335 3,165 29 193 431 0 64 121 837 4,002 19,500 837 20,338
OFC 11.2 11.2 25.6 81.8 34.3 42.6 27.3 19.2 8,467 0 618 0 2,147 241 484 3,490 11,957 3,239 67 444 992 0 148 278 1,928 5,167 11,706 5,418 17,124
OFC 11.2 11.2 25.6 81.8 34.3 42.6 27.3 19.2 10,957 0 800 0 2,778 312 626 4,516 15,473 2,840 58 389 870 0 130 243 1,691 4,531 13,797 6,207 20,004
Paddy 11.2 11.2 25.6 81.8 34.3 42.6 27.3 19.2 12,034 0 0 0 0 0 0 0 12,034 5,226 48 318 711 0 106 199 1,383 6,609 17,261 1,383 18,643
Paddy 11.2 11.2 25.6 81.8 34.3 42.6 27.3 19.2 13,454 0 0 0 0 0 0 0 13,454 3,039 28 185 414 0 62 116 804 3,843 16,493 804 17,297
Paddy 11.2 11.2 25.6 81.8 34.3 42.6 27.3 19.2 5,628 0 0 0 0 0 0 0 5,628 4,082 37 248 556 0 83 156 1,080 5,162 9,710 1,080 10,790
Annual
Paddy Paddy
OFC
Table C 3.4 Proposed Cropping Budget (2/4)
PaddyR
ecom
men
ded
Cro
ppin
g T
ype
Price (Rs./kg) Gross Income (Rs.1000/scheme)
OFCMaha Cultivation Yala Cultivation
Cascade System IX
Total
Total
Major
Medium
SCHEMESHEETCODE
Irrigation SchemeOFC
Total
Minor
Cascade System I
Cascade System II
Cascade System III
Cascade System IV
Cascade System V
Cascade System VI
Cascade System VII
Cascade System VIII
CT - 13
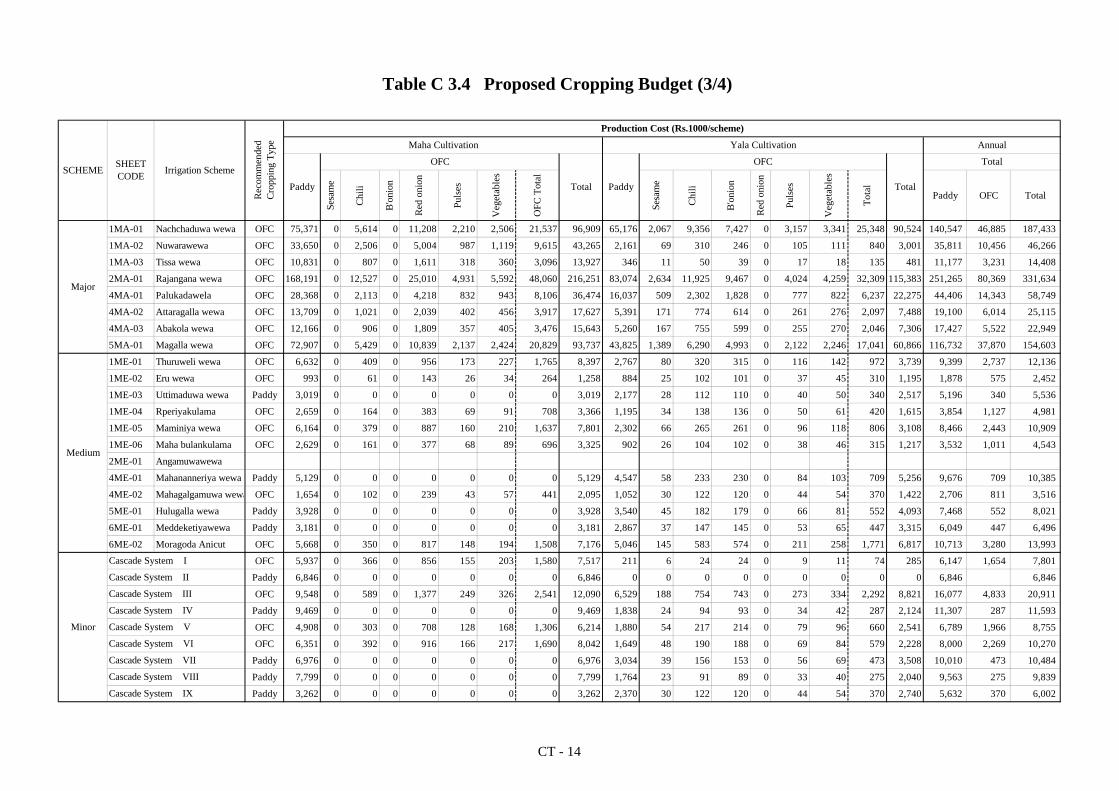
Sesa
me
Chi
li
B'o
nion
Red
oni
on
Puls
es
Veg
etab
les
OFC
Tot
al
Sesa
me
Chi
li
B'o
nion
Red
oni
on
Puls
es
Veg
etab
les
Tot
al
Paddy OFC Total
1MA-01 Nachchaduwa wewa OFC 75,371 0 5,614 0 11,208 2,210 2,506 21,537 96,909 65,176 2,067 9,356 7,427 0 3,157 3,341 25,348 90,524 140,547 46,885 187,433
1MA-02 Nuwarawewa OFC 33,650 0 2,506 0 5,004 987 1,119 9,615 43,265 2,161 69 310 246 0 105 111 840 3,001 35,811 10,456 46,266
1MA-03 Tissa wewa OFC 10,831 0 807 0 1,611 318 360 3,096 13,927 346 11 50 39 0 17 18 135 481 11,177 3,231 14,408
2MA-01 Rajangana wewa OFC 168,191 0 12,527 0 25,010 4,931 5,592 48,060 216,251 83,074 2,634 11,925 9,467 0 4,024 4,259 32,309 115,383 251,265 80,369 331,634
4MA-01 Palukadawela OFC 28,368 0 2,113 0 4,218 832 943 8,106 36,474 16,037 509 2,302 1,828 0 777 822 6,237 22,275 44,406 14,343 58,749
4MA-02 Attaragalla wewa OFC 13,709 0 1,021 0 2,039 402 456 3,917 17,627 5,391 171 774 614 0 261 276 2,097 7,488 19,100 6,014 25,115
4MA-03 Abakola wewa OFC 12,166 0 906 0 1,809 357 405 3,476 15,643 5,260 167 755 599 0 255 270 2,046 7,306 17,427 5,522 22,949
5MA-01 Magalla wewa OFC 72,907 0 5,429 0 10,839 2,137 2,424 20,829 93,737 43,825 1,389 6,290 4,993 0 2,122 2,246 17,041 60,866 116,732 37,870 154,603
1ME-01 Thuruweli wewa OFC 6,632 0 409 0 956 173 227 1,765 8,397 2,767 80 320 315 0 116 142 972 3,739 9,399 2,737 12,136
1ME-02 Eru wewa OFC 993 0 61 0 143 26 34 264 1,258 884 25 102 101 0 37 45 310 1,195 1,878 575 2,452
1ME-03 Uttimaduwa wewa Paddy 3,019 0 0 0 0 0 0 0 3,019 2,177 28 112 110 0 40 50 340 2,517 5,196 340 5,536
1ME-04 Rperiyakulama OFC 2,659 0 164 0 383 69 91 708 3,366 1,195 34 138 136 0 50 61 420 1,615 3,854 1,127 4,981
1ME-05 Maminiya wewa OFC 6,164 0 379 0 887 160 210 1,637 7,801 2,302 66 265 261 0 96 118 806 3,108 8,466 2,443 10,909
1ME-06 Maha bulankulama OFC 2,629 0 161 0 377 68 89 696 3,325 902 26 104 102 0 38 46 315 1,217 3,532 1,011 4,543
2ME-01 Angamuwawewa
4ME-01 Mahananneriya wewa Paddy 5,129 0 0 0 0 0 0 0 5,129 4,547 58 233 230 0 84 103 709 5,256 9,676 709 10,385
4ME-02 Mahagalgamuwa wewa OFC 1,654 0 102 0 239 43 57 441 2,095 1,052 30 122 120 0 44 54 370 1,422 2,706 811 3,516
5ME-01 Hulugalla wewa Paddy 3,928 0 0 0 0 0 0 0 3,928 3,540 45 182 179 0 66 81 552 4,093 7,468 552 8,021
6ME-01 Meddeketiyawewa Paddy 3,181 0 0 0 0 0 0 0 3,181 2,867 37 147 145 0 53 65 447 3,315 6,049 447 6,496
6ME-02 Moragoda Anicut OFC 5,668 0 350 0 817 148 194 1,508 7,176 5,046 145 583 574 0 211 258 1,771 6,817 10,713 3,280 13,993
OFC 5,937 0 366 0 856 155 203 1,580 7,517 211 6 24 24 0 9 11 74 285 6,147 1,654 7,801
Paddy 6,846 0 0 0 0 0 0 0 6,846 0 0 0 0 0 0 0 0 0 6,846 6,846
OFC 9,548 0 589 0 1,377 249 326 2,541 12,090 6,529 188 754 743 0 273 334 2,292 8,821 16,077 4,833 20,911
Paddy 9,469 0 0 0 0 0 0 0 9,469 1,838 24 94 93 0 34 42 287 2,124 11,307 287 11,593
OFC 4,908 0 303 0 708 128 168 1,306 6,214 1,880 54 217 214 0 79 96 660 2,541 6,789 1,966 8,755
OFC 6,351 0 392 0 916 166 217 1,690 8,042 1,649 48 190 188 0 69 84 579 2,228 8,000 2,269 10,270
Paddy 6,976 0 0 0 0 0 0 0 6,976 3,034 39 156 153 0 56 69 473 3,508 10,010 473 10,484
Paddy 7,799 0 0 0 0 0 0 0 7,799 1,764 23 91 89 0 33 40 275 2,040 9,563 275 9,839
Paddy 3,262 0 0 0 0 0 0 0 3,262 2,370 30 122 120 0 44 54 370 2,740 5,632 370 6,002
Table C 3.4 Proposed Cropping Budget (3/4)
Cascade System IV
Cascade System V
Cascade System I
Cascade System II
Cascade System III
Minor
Paddy
OFC
Cascade System VI
Cascade System VII
Cascade System VIII
Cascade System IX
SCHEMESHEETCODE
Major
Medium
Irrigation Scheme
Production Cost (Rs.1000/scheme)
Maha Cultivation Yala Cultivation Annual
Paddy Total
Rec
omm
ende
dC
ropp
ing
Typ
e
TotalOFC
Total
CT - 14

Sesa
me
Chi
li
B'o
nion
Red
oni
on
Puls
es
Veg
etab
les
OFC
Tot
al
Sesa
me
Chi
li
B'o
nion
Red
oni
on
Puls
es
Veg
etab
les
OFC
Tot
al
Paddy OFC Total
1MA-01 Nachchaduwa wewa OFC 52,645 3,736 21,254 1,431 4,809 31,229 83,874 48,616 274 6,227 27,422 2,044 6,412 42,379 90,995 101,261 73,608 174,869
1MA-02 Nuwarawewa OFC 23,504 1,668 9,489 639 2,147 13,943 37,446 1,612 9 206 909 68 213 1,405 3,016 25,115 15,347 40,463
1MA-03 Tissa wewa OFC 7,565 537 3,056 206 691 4,490 12,055 258 1 33 146 11 34 225 484 7,823 4,715 12,538
2MA-01 Rajangana wewa OFC 117,476 8,337 47,427 3,192 10,732 69,688 187,165 61,966 349 7,937 34,952 2,605 8,173 54,016 115,982 179,443 123,704 303,147
4MA-01 Palukadawela OFC 19,814 1,406 7,999 538 1,810 11,754 31,568 11,963 67 1,532 6,747 503 1,578 10,428 22,390 31,777 22,182 53,959
4MA-02 Attaragalla wewa OFC 9,576 680 3,866 260 875 5,680 15,256 4,021 23 515 2,268 169 530 3,505 7,527 13,597 9,186 22,783
4MA-03 Abakola wewa OFC 8,498 603 3,431 231 776 5,041 13,539 3,924 22 503 2,213 165 518 3,420 7,344 12,421 8,461 20,883
5MA-01 Magalla wewa OFC 50,924 3,613 20,555 1,384 4,651 30,203 81,126 32,690 184 4,186 18,435 1,374 4,311 28,490 61,180 83,614 58,693 142,307
1ME-01 Thuruweli wewa OFC 4,809 426 1,945 152 427 2,951 7,760 1,999 18 333 1,145 102 267 1,865 3,865 6,808 4,816 11,625
1ME-02 Eru wewa OFC 720 64 291 23 64 442 1,162 639 6 106 366 33 85 596 1,235 1,359 1,038 2,397
1ME-03 Uttimaduwa wewa Paddy 2,189 0 0 0 0 2,189 1,573 6 116 400 36 93 652 2,225 3,762 652 4,414
1ME-04 Rperiyakulama OFC 1,928 171 780 61 171 1,183 3,111 863 8 144 495 44 115 806 1,669 2,791 1,989 4,780
1ME-05 Maminiya wewa OFC 4,470 395 1,803 141 396 2,736 7,206 1,663 15 276 950 85 221 1,548 3,211 6,133 4,284 10,418
1ME-06 Maha bulankulama OFC 1,907 168 767 60 168 1,163 3,070 652 6 108 371 33 87 605 1,257 2,559 1,768 4,327
2ME-01 Angamuwawewa
4ME-01 Mahananneriya wewa Paddy 3,719 0 0 0 0 3,719 3,285 13 243 836 75 195 1,361 4,647 7,004 1,361 8,366
4ME-02 Mahagalgamuwa wewa OFC 1,199 107 486 38 107 737 1,936 760 7 127 436 39 102 710 1,470 1,959 1,447 3,406
5ME-01 Hulugalla wewa Paddy 2,848 0 0 0 0 2,848 2,558 10 189 651 58 152 1,061 3,619 5,406 1,061 6,467
6ME-01 Meddeketiyawewa Paddy 2,307 0 0 0 0 2,307 2,072 8 153 527 47 123 859 2,931 4,379 859 5,238
6ME-02 Moragoda Anicut OFC 4,110 364 1,662 130 365 2,522 6,632 3,645 33 607 2,088 186 487 3,401 7,047 7,755 5,923 13,678
OFC 4,305 382 1,741 136 382 2,641 6,946 152 1 25 87 8 20 142 294 4,457 2,783 7,240
Paddy 4,964 0 0 0 0 4,964 0 0 0 0 0 0 4,964 4,964
OFC 6,924 614 2,800 220 615 4,248 11,172 4,717 43 786 2,702 241 630 4,401 9,118 11,641 8,650 20,291
Paddy 6,866 0 0 0 0 6,866 1,328 5 98 338 30 79 551 1,878 8,194 551 8,744
OFC 3,559 316 1,439 113 316 2,184 5,743 1,359 12 226 778 69 181 1,268 2,626 4,918 3,451 8,369
OFC 4,606 408 1,863 146 409 2,826 7,432 1,191 11 199 682 61 159 1,112 2,303 5,797 3,938 9,734
Paddy 5,058 0 0 0 0 5,058 2,192 9 162 558 50 130 909 3,101 7,251 909 8,160
Paddy 5,655 0 0 0 0 5,655 1,275 5 94 324 29 76 529 1,803 6,930 529 7,459
Paddy 2,366 0 0 0 0 2,366 1,712 7 127 436 39 102 710 2,422 4,078 710 4,788
Cascade System VIII
Cascade System IX
Net Income (Rs.1000/scheme)
Maha Cultivation Yala Cultivation Annual
TotalOFC
Cascade System I
Cascade System II
Cascade System VII
Cascade System V
Cascade System VI
PaddyPaddy
OFC
Major
Rec
omm
ende
dC
ropp
ing
Typ
e
Table C 3.4 Proposed Cropping Budget (4/4)
Cascade System III
Medium
Minor
Cascade System IV
Total
SCHEMESHEETCODE
Irrigation Scheme
Total
CT - 15

I. Gross Income1) Yield (kg/ha) 5,000 5,000 900 1,500 1,500 10,000 15,000 10,000 2) Unit Price (Rs./kg) 11.2 11.2 35.0 29.0 80.0 33.5 30.0 16.1 3) Gross Income (Rs./ha) 56,000 56,000 31,500 43,500 120,000 335,000 450,000 161,000
Price Unit Q'ty Value Q'ty Value Q'ty Value Q'ty Value Q'ty Value Q'ty Value Q'ty Value Q'ty ValueII. Total Production Cost (Rs./ha) (Rs./ha) (Rs./ha) (Rs./ha) (Rs./ha) (Rs./ha) (Rs./ha) (Rs./ha)
1) Seeds (kg/ha) 110 1,815 110 1,815 7 420 30 1,563 1 887 8 800 1,500 150,000 0.35 490 2) Fertilizers
- Urea 7.7 (kg/ha) 270 2,079 270 2,079 50 385 35 270 300 2,310 150 1,155 150 1,155 265 2,041 - TSP 21.1 (kg/ha) 60 1,266 60 1,266 100 2,110 70 1,477 100 2,110 100 2,110 100 2,110 380 8,018 - MOP 17.2 (kg/ha) 35 602 35 602 50 860 35 602 50 860 75 1,290 75 1,290 125 2,150
3) Agro-chemicals(a) Weedicides (lit./ha) 2.5 725 2.5 725 - 1,450 1,450 1,140 1,140 - (b) Insecticides (lit./ha) 20.0 2,900 20.0 2,900 1.0 560 820 1,640 3,060 3,060 5,120
(kg/ha)(c) Fungicides (lit./ha) 1.4 1,926 1.4 1,926 - - 1,300 2,600 2,600 2,600
(kg/ha)4) Machinery & Power
- Own 0.5 1,570 0.7 2,060 2,150 2,400 1,830 2,150 1,830 3,270 - Hired 1.3 3,680 1.2 3,410 1,790 1,100 1,590 1,430 1,590 1,700
5) Animal power- Own 0.0 10 0.0 - - - - - - - - - Hired 0.1 50 0.0 40 - - - - - - -
6) Labour- Family (man-day/ha) 29 4,350 32 4,800 68 10,125 68 10,200 228 34,200 260 39,000 310 46,500 177 26,550 - Attham (man-day/ha) 3 450 3 450 - - 7 1,050 - - 2 300 - Hired (man-day/ha) 49 7,350 53 7,950 10 1,500 21 3,150 82 12,300 75 11,250 - 66 9,900
7) Threshing & Transport 3,170 1,170 1,160 1,170 3,480 1,160 1,160 2,910 8) Miscellaneous (5%) (Rs./ha) 1,597 1,560 1,053 1,210 3,250 3,357 10,622 3,252
Total (Rounded) (Rs./ha) 33,500 32,800 22,100 25,400 68,300 70,500 223,100 68,300 III. Net Income (Rs./ha) 22,500 23,200 9,400 18,100 51,700 264,500 226,900 92,700
Major SchemesPaddy-Maha Paddy-Yala Sesame Pulse (Blackgram) Chilli Big Onion Red Onion Vegetable (Brinjal)
Table C 3.5 Crop Budget - With Project (1/2)
CT-16

I. Gross Income1) Yield (kg/ha) 5,000 5,000 900 1,500 1,500 10,000 15,000 10,000 2) Unit Price (Rs./kg) 10.8 10.8 35.0 29.0 80.0 33.5 30.0 16.1 3) Gross Income (Rs./ha) 54,000 54,000 31,500 43,500 120,000 335,000 450,000 161,000
Price Unit Q'ty Value Q'ty Value Q'ty Value Q'ty Value Q'ty Value Q'ty Value Q'ty Value Q'ty ValueII. Total Production Cost (Rs./ha) (Rs./ha) (Rs./ha) (Rs./ha) (Rs./ha) (Rs./ha) (Rs./ha) (Rs./ha)
1) Seeds (kg/ha) 110 1,683 110 1,683 7 344 30 1,563 1 915 8 800 1,500 150,000 0.35 490 2) Fertilizers
- Urea 7.7 (kg/ha) 270 2,079 270 2,079 50 385 35 270 300 2,310 150 1,155 150 1,155 265 2,041 - TSP 21.1 (kg/ha) 60 1,266 60 1,266 100 2,110 70 1,477 100 2,110 100 2,110 100 2,110 380 8,018 - MOP 17.2 (kg/ha) 35 602 35 602 50 860 35 602 50 860 75 1,290 75 1,290 125 2,150
3) Agro-chemicals(a) Weedicides (lit./ha) 2.5 725 2.5 725 - 0.5 1,450 0.5 1,450 1.0 1,140 1.0 1,140 - (b) Insecticides (lit./ha) 20.0 2,900 20.0 2,900 1.0 560 0.8 820 1.6 1,640 2.0 3,060 2.0 3,060 5,120
(kg/ha) - - - - (c) Fungicides (lit./ha) 1.4 1,926 1.4 1,926 - - 2.0 1,300 2,600 2,600 2,600
(kg/ha) - - - - - - - 4) Machinery & Power
- Own 0.4 1,040 0.5 1,245 1,200 1,200 1,830 750 750 3,270 - Hired 1.3 3,565 1.1 2,505 2,100 2,100 1,590 2,970 2,970 1,700
5) Animal power- Own 0.06 60 0.08 105 - - - - - - - Hired 0.05 50 0.06 60 - - - - - -
6) Labour- Family (man-day/ha) 47 7,050 53 7,950 57 8,550 71 10,650 189 28,350 260 39,000 140 21,000 225 33,750 - Attham (man-day/ha) 5 750 5 750 2 300 1 150 2 300 - - - - 2 300 - Hired (man-day/ha) 34 5,100 31 4,650 18 2,700 7 1,050 53 7,950 75 11,250 29 4,350 35 5,250
7) Threshing & Transport 2,715 2,500 1,460 1,460 2,340 1,460 1,460 2,340 8) Miscellaneous (5%) (Rs./ha) 1,576 1,547 1,028 1,140 2,647 3,379 9,594 3,351
Total (Rounded) (Rs./ha) 33,100 32,500 21,600 23,900 55,600 71,000 201,500 70,400 III. Net Income (Rs./ha) 20,900 21,500 9,900 19,600 64,400 264,000 248,500 90,600
Medium and Minor Schemes
Table C 3.5 Crop Budget - With Project (2/2)
Paddy-Maha Paddy-Yala Sesame Pulse (Blackgram) Chilli Big Onion Red Onion Vegetable (Brinjal)
CT-17
FIGURES
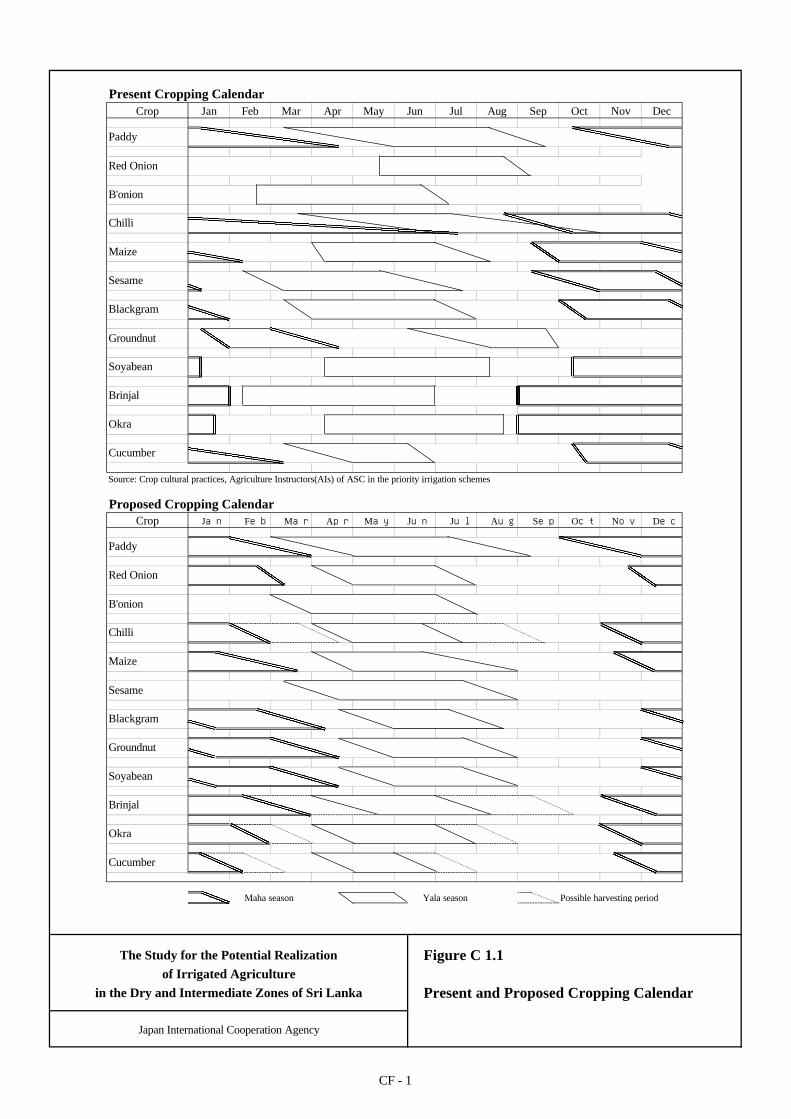
Present Cropping CalendarCrop
Source: Crop cultural practices, Agriculture Instructors(AIs) of ASC in the priority irrigation schemes
Proposed Cropping CalendarCrop
Maha season Yala season Possible harvesting period
Jan Feb Mar Apr May Jun Jul Aug Sep Oct Nov Dec
Paddy
Red Onion
B'onion
Chilli
Maize
Sesame
Blackgram
Groundnut
Soyabean
Apr May
Brinjal
Okra
Cucumber
Jan Oct Nov Dec
Paddy
Jun Jul Aug SepFeb Mar
Red Onion
B'onion
Chilli
Maize
Sesame
Blackgram
Groundnut
Soyabean
Brinjal
Okra
Cucumber
Present and Proposed Cropping Calendar
Figure C 1.1The Study for the Potential Realizationof Irrigated Agriculture
in the Dry and Intermediate Zones of Sri Lanka
Japan International Cooperation Agency
CF - 1

CF - 2
Green Gram
0.00
5.00
10.00
15.00
20.00
25.00
1992 1993 1994 1995 1996 1997
Year
Pro
duction &
Ava
ilabi
lity
Supp
ly
0 .00
0.50
1.00
1.50
2.00
2.50
3.003.50
4.00
4.505.00
Per
Cap
ita
Ava
ilabi
lity
Vegetable (excl. onion)
600.00
610.00
620.00
630.00
640.00
650.00
660.00
670.00
1992 1993 1994 1995 1996 1997
Year
Pro
duction &
Ava
ilabili
tySupp
ly
0.005.0010.0015.0020.0025.0030.0035.0040.0045.0050.00
Per
Cap
ita
Ava
ilabili
ty
Paddy
0.00
500.00
1000.00
1500.00
2000.00
2500.00
3000.00
3500.00
4000.00
1992 1993 1994 1995 1996 1997
Year
Pro
duction &
Ava
ilabili
tySupp
ly
60.00
65.00
70.00
75.00
80.00
85.00
90.00
95.00
100.00
Per
Cap
ita
Ava
ilabili
ty
On ion
0.00
50.00
100.00
150.00
200.00
250.00
1992 1993 1994 1995 1996 1997
Year
Pro
duction &
Ava
ilabi
lity
Supp
ly
0 .00
2.00
4.00
6.00
8.00
10.00
12.00
14.00
Per
Cap
ita
Ava
ilabi
lity
C illies-Dry
0.00
5.00
10.00
15.00
20.00
25.00
30.00
35.00
40.00
45.00
50.00
1992 1993 1994 1995 1996
Year
Pro
duction &
Ava
ilabili
ty
Supp
ly
0 .00
0.50
1.00
1.50
2.00
2.50
3.00
3.50
4.00
4.50
5.00
Per
Cap
ita
Ava
ilabili
ty
G ingelly
0 .00
2 .00
4 .00
6 .00
8 .00
10.00
12.00
14.00
1992 1993 1994 1995 1996 1997
Year
Pro
duction &
Ava
ilabili
ty
Supp
ly
0 .00
0 .10
0 .20
0 .30
0 .40
0 .50
0 .60
0 .70
0 .80
0 .90
1 .00
Per
Cap
ita
Ava
ilabili
ty
The Study for the Potential Realizationof Irrigated Agriculture
in the Dry and Intermediate Zone of Sri Lanka
Japan International Cooperation Agency
Figure C 3.1Demand and Supply of Major Cropsin Sri Lanka
Cowpea & Dhall
0.00
20.00
40.00
60.00
80.00
100.00
120.00
1992 1993 1994 1995 1996 1997
Year
Pru
duction &
Ava
ilabili
ty
Supp
ly
0.001.002.003.004.005.006.007.008.009.0010.00
Per
Cap
ita
Ava
ilabili
ty
Paddy
0.005000.00
1 1
Year
Pro
ductio
n &
Per
Cap
ita
Production ('000 MT)
Availability Supply ('000 MT)
Per Capita Availability (Kgm per year)