the fcocockpit –global bubble status report peter … · peter cauwels & didier sornette...
TRANSCRIPT

The FCO Cockpit – Global Bubble Status Report
Peter Cauwels & Didier SornetteChair of Entrepreneurial Risk
January 1st, 2016

The FCO Cockpit –Global Bubble Status January 1st, 2016
What is this?
This report discusses the historical evolution of bubbles in and between different asset classes and geographies.
It is the result of an extensive analysis done on the historical time series of 433 systemic assets and 219 single stocks. The systemic assets are bond, equity and commodity indices and a selection of currency pairs. The single stocks are mainly US, European, Japanese and Chinese equities.
For each of the 652 time series that were analyzed, the bubble indicators called DS LPPS Trust and Confidence+ are calculated. This allows us to observe the fraction of analyzed assets within a certain asset class that shows significantly strong bubble warning signals.
+ For an intuitive explanation of the methodology used and the specifics of these indicators we refer to: D. Sornette and
P. Cauwels, Financial bubbles: mechanisms and diagnostics. Review of Behavioral Economics 2 (3), 279- 305 (2015)
(http://arxiv.org/abs/1404.2140 and http://ssrn.com/abstract=2423790)

The FCO Cockpit –Global Bubble Status January 1st, 2016
general results

The FCO Cockpit –Global Bubble Status January 1st, 2016
Main results
There are no noteworthy positive bubble signals in any of the asset classes.
45% of the commodity indices that were analyzed show negative bubble signals. The effect is seen across all commodities: energy, soft and metals. It is the result of herding. People sell the asset class because the price goes down. This results in a positive feedback mechanisms and mispricing.
This sell off in commodities has an effect on corporate bonds. We see that 6% of all bond indices have negative bubble signals. This is mainly in mining, oil & gas, basic resources, industrial metals ...A positive bubble signal is an indication of herding when people start buying because prices go up.
A negative bubble signal is an indication of herding when people start selling because prices go down.
The FCO Cockpit –Global Bubble Status January 1st, 2016
results per asset class

The FCO Cockpit –Global Bubble Status January 1st, 2016
commodities Commodities Yearly Return DS LPPL Trust DS LPPL Confidence
Positive Bubbles
None
Negative Bubbles
Natural Gas ER Index -46% 41% 53%
Feeder Cattle ER Index -20% 20% 48%
Heating Oil ER Index -43% 19% 50%
Live Stock ER Index -21% 18% 36%
Gasoil ER Index -41% 16% 49%
Live Cattle ER Index -16% 16% 39%
Zinc ER Index -27% 16% 39%
Energy ER Index -42% 13% 42%
Platinum ER Index -29% 11% 31%
HG Copper ER Index -26% 9% 11%
Brent Crude ER Index -47% 9% 31%
Nickel ER Index -43% 8% 21%
Indtr Mtls ER Index -26% 8% 12%
Petroleum ER Index -42% 7% 25%
Metals ER Index -20% 7% 11%
Copper ER Index -25% 7% 11%
Crude Oil ER Index -45% 5% 15%
45% of the commodity indices that were analyzed show negative bubble signals.
The effect is seen across all commodities: energy, soft and metals. It is the result of herding. People sell the asset class because the price goes down. This results in a positive feedback mechanisms and mispricing.
The FCO Cockpit –Global Bubble Status January 1st, 2016
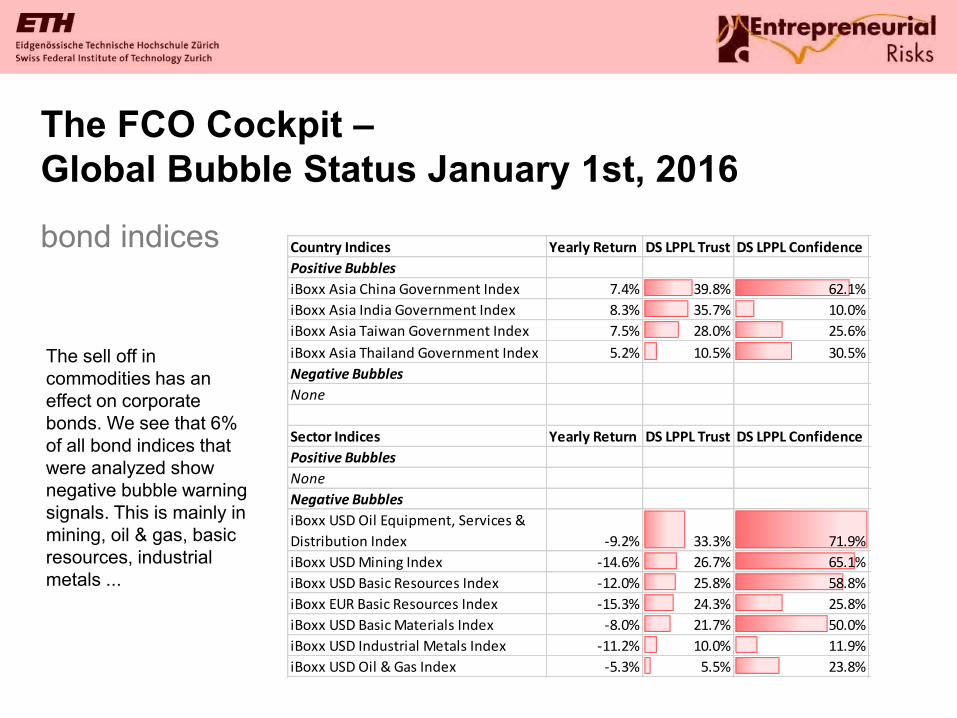
Country Indices Yearly Return DS LPPL Trust DS LPPL Confidence
Positive Bubbles
iBoxx Asia China Government Index 7.4% 39.8% 62.1%
iBoxx Asia India Government Index 8.3% 35.7% 10.0%
iBoxx Asia Taiwan Government Index 7.5% 28.0% 25.6%
iBoxx Asia Thailand Government Index 5.2% 10.5% 30.5%
Negative Bubbles
None
Sector Indices Yearly Return DS LPPL Trust DS LPPL Confidence
Positive Bubbles
None
Negative Bubbles
iBoxx USD Oil Equipment, Services &
Distribution Index -9.2% 33.3% 71.9%
iBoxx USD Mining Index -14.6% 26.7% 65.1%
iBoxx USD Basic Resources Index -12.0% 25.8% 58.8%
iBoxx EUR Basic Resources Index -15.3% 24.3% 25.8%
iBoxx USD Basic Materials Index -8.0% 21.7% 50.0%
iBoxx USD Industrial Metals Index -11.2% 10.0% 11.9%
iBoxx USD Oil & Gas Index -5.3% 5.5% 23.8%
bond indices
The sell off in commodities has an effect on corporate bonds. We see that 6% of all bond indices that were analyzed show negative bubble warning signals. This is mainly in mining, oil & gas, basic resources, industrial metals ...

The FCO Cockpit –Global Bubble Status January 1st, 2016
stock indices
There are some interesting specific bubble cases but globally, from a systemic risk point of view, equity indices do not show a significant bubble risk.
Equities Country Indices Yearly Return DS LPPL Trust DS LPPL Confidence Country
Positive Bubbles
SAX Index 31.5% 27.2% 7.9% Slovakia
Negative Bubbles
PFTS Index -37.8% 33.6% 20.8% Ukraine
CSE General Index -20.9% 24.8% 50.5% Sri Lanka
Colombia SE General Index -26.5% 18.2% 25.7% Colombia
Dubai Financial Market General -16.5% 14.7% 38.4% Dubai
Warsaw SE WIG Poland Index -9.6% 14.2% 38.1% Poland
Qatar Exchange General Index -15.1% 8.1% 16.9% Qatar
EGX 30 Index -21.5% 5.9% 10.6% Egypt
Muscat SE General Index -14.9% 5.0% 16.0% Oman
Equities Sector Indices Yearly Return DS LPPL Trust DS LPPL Confidence
Positive Bubbles
S&P 500 Internet&Catalog Retail 83.4% 24.0% 31.7%
S&P 500 Internet Software&Serv 33.3% 14.2% 21.8%
Negative Bubbles
S&P 500 Indp Pwr Prdcr&EngTrdrs -43.1% 41.3% 45.0%
S&P 500 Multiline Retail -13.0% 9.6% 2.2%
STOXX Europe 600 Basic Resources -34.9% 6.9% 15.9%

The FCO Cockpit –Global Bubble Status January 1st, 2016
single stocksSingle Stocks Yearly Return DS LPPL Trust DS LPPL Confidence Sector Country
Positive Bubbles
Amazon.com Inc 118% 26% 48% Other Department Stores US
Nike Inc 30% 26% 20% Sports & Outdoor Footwear US
Facebook Inc 34% 14% 22% Social Media & Networking US
Home Depot Inc 26% 12% 33%
Other Home Improvement Products &
Services Retailers US
Starbucks Corp 46% 10% 12% Other Restaurants & Bars US
Negative Bubbles
Electricite de France SA -41% 25% 52% Conventional Electricity EU
BHP Billiton PLC -41% 22% 58% General Mining EU
Toshiba Corp -51% 17% 25% Industrial Conglomerates JP
Qualcomm Inc -33% 13% 43% Other Communications & Networking US
There are some interesting specific bubble cases that we will discuss in more detail later in this report. But, globally, from a systemic risk point of view, stocks do not show a significant bubble risk.

The FCO Cockpit –Global Bubble Status January 1st, 2016
currencies
FX Yearly Return DS LPPL Trust DS LPPL Confidence
US Dollar/Argentine Peso 51% 14% 54%
US Dollar/South African Rand 34% 14% 50%
US Dollar/Norwegian Krone 19% 7% 14%
There are no noteworthy bubble signals in currencies.

The FCO Cockpit –Global Bubble Status January 1st, 2016
case studies

The FCO Cockpit –Global Bubble Status January 1st, 2016
Henry Hub Natural Gas– strong negative bubble signal
This is a standard output from the Financial Crisis Observatory.
It shows the historical price evolution of Henry Hub natural gas in blue (left hand scale) and the calculated bubble warning index DS LPPL Trust in red (right hand scale).
The red line is what we call a bubble end flag; it gives positive values for positive bubbles and vice versa.
We see a clear spiky negative bubble warning signal. This suggests a strong over reaction in the market; herding, when people are selling because the price drops, leading to a feedback mechanism and mispricing.
Source: Financial Crisis Observatory, Chair of Entrepreneurial Risk ETH Zurich
The FCO Cockpit –Global Bubble Status January 1st, 2016
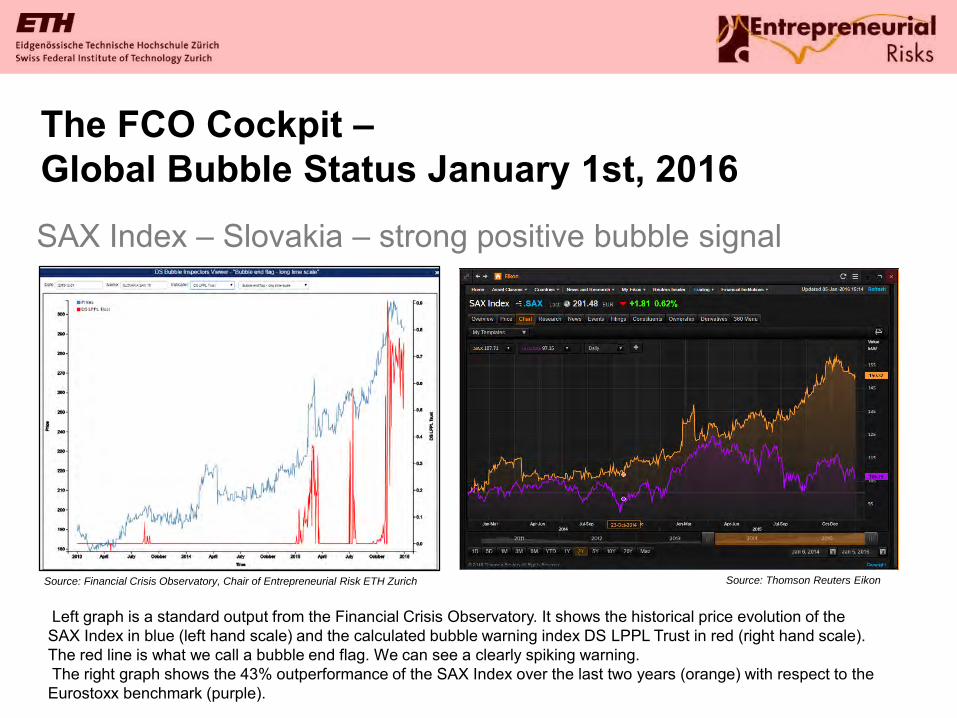
SAX Index – Slovakia – strong positive bubble signal
Left graph is a standard output from the Financial Crisis Observatory. It shows the historical price evolution of the SAX Index in blue (left hand scale) and the calculated bubble warning index DS LPPL Trust in red (right hand scale). The red line is what we call a bubble end flag. We can see a clearly spiking warning.The right graph shows the 43% outperformance of the SAX Index over the last two years (orange) with respect to the Eurostoxx benchmark (purple).
Source: Financial Crisis Observatory, Chair of Entrepreneurial Risk ETH Zurich Source: Thomson Reuters Eikon
The FCO Cockpit –Global Bubble Status January 1st, 2016
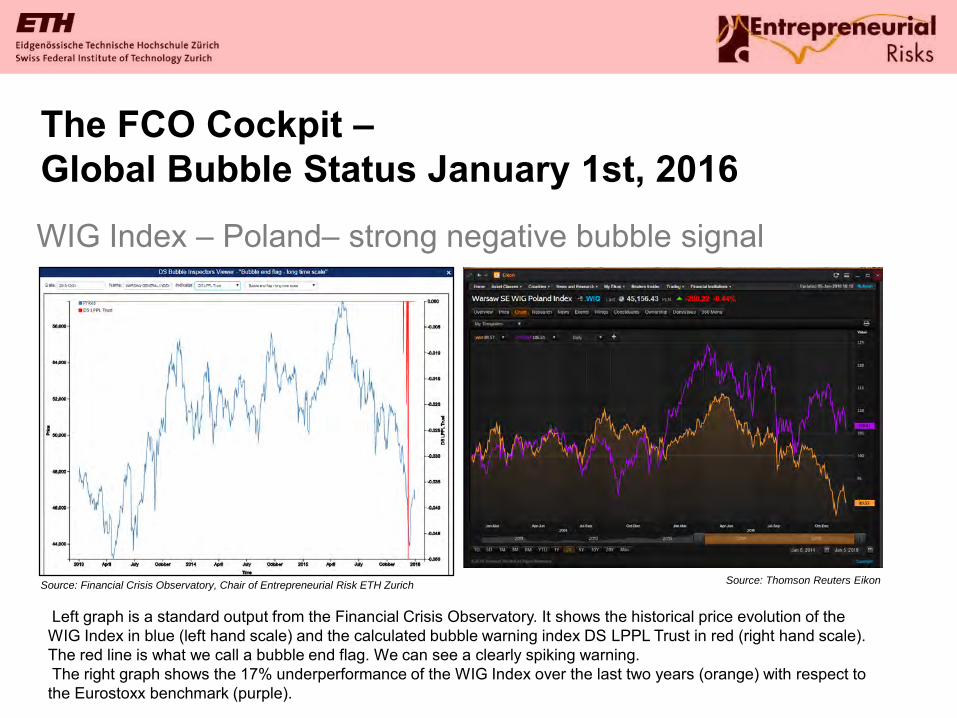
WIG Index – Poland– strong negative bubble signal
Left graph is a standard output from the Financial Crisis Observatory. It shows the historical price evolution of the WIG Index in blue (left hand scale) and the calculated bubble warning index DS LPPL Trust in red (right hand scale). The red line is what we call a bubble end flag. We can see a clearly spiking warning.The right graph shows the 17% underperformance of the WIG Index over the last two years (orange) with respect to the Eurostoxx benchmark (purple).
Source: Financial Crisis Observatory, Chair of Entrepreneurial Risk ETH Zurich Source: Thomson Reuters Eikon

The FCO Cockpit –Global Bubble Status January 1st, 2016
Starbucks – strong positive bubble signal
Left graph is a standard output from the Financial Crisis Observatory. It shows the historical price evolution of the Starbucks stock in blue (left hand scale) and the calculated bubble warning index DS LPPL Trust in red (right hand scale). The red line is what we call a bubble end flag. We can see a clearly spiking warning.The right graph shows the 44% outperformance of the stock over the last two years (orange) with respect to the S&P500benchmark (purple). Starbucks has shown solid earnings growth of 34% in the last year but is currently trading at a historical price earnings ratio around 48. This analysis suggests an overshooting in the price and a correction may be expected.
Source: Financial Crisis Observatory, Chair of Entrepreneurial Risk ETH Zurich Source: Thomson Reuters Eikon

The FCO Cockpit –Global Bubble Status January 1st, 2016
Electricité de France – strong negative bubble signal
Left graph is a standard output from the Financial Crisis Observatory. It shows the historical price evolution of the EDF stock in blue (left hand scale) and the calculated bubble warning index DS LPPL Trust in red (right hand scale). The red line is what we call a bubble end flag. We can see a clearly spiking warning suggesting a positive correction.The right graph shows the 58% underperformance of the EDF stock over the last two years (orange) with respect to the Eurostoxx benchmark (purple).
Source: Financial Crisis Observatory, Chair of Entrepreneurial Risk ETH Zurich Source: Thomson Reuters Eikon

The FCO Cockpit –Global Bubble Status January 1st, 2016
thank you