the family business risk profile - nyu stern school of business
TRANSCRIPT

The Family Business Risk Profile
Orit Vaknin
The Leonard N. Stern School of Business
Glucksman Institute for Research in Securities Markets
Faculty Advisor: Marti Subrahmanyam
April 1, 2010
I. INTRODUCTION
The family owned business is the backbone of the world economy. By some estimates,
over 90% of all business enterprises in the United States are family-owned and 60% of all
employees are in family owned businesses (Ibrahim and Elis, 1994; Colli, 2003). In the UK,
approximately 76% of the largest 8,000 companies are either family owned or controlled (Gallo,
1994). Among the largest corporations in the US, approximately 30-40% are estimated to be
family owned (Anderson and Reeb, 2003; Anderson, Duru and Reeb, 2009) Researchers have
found similar statistics for family firms around the world (Dreux, 1990; Martinez, 1994; Owens,
1994). Therefore, a better grasp of the unique characteristics of family firms is a basis for
understanding a significant part of the world’s economy.
Several papers have been written about the unique characteristics of family businesses
and their performance compared to that of non-family businesses. Most research done in the
field focused on corporate governance measures, family relationships, succession, and
performance indicators of family owned businesses. Generally speaking, there are two schools
of thought with regard to the analysis of family business performance. The first claims that due
to the family-centered nature of the family firm, it tends to be led by nepotism, irrational decision
making processes, and conflicts of interests between those of the family and those of
shareholders. The second school of thought takes the opposite view: Due to the family’s
commitment to the business, the firm is managed with a much longer time horizon than non-
family companies, employees are generally more loyal to the firm, and family members manage
the firm with prudence and care, since it is inexorably linked to the family’s heritage and pride.
Research papers focused on family business performance reveal mixed results. Again,
some indicate that family firms outperform non-family peers, while other papers show the
opposite. An analysis conducted by Thomson Financial, for example, showed evidence for the
outperformance of family companies in six European countries. Similarly, Anderson and Reeb
(2003) find that family firms have higher Tobin’s q than non-family firms. Villalonga and Amit
(2006) found that family ownership creates value in first generation family firms (i.e. the founder
serves as CEO or chairman). On the other hand, Holderness and Sheehan (1988) found that in
large US corporations, family firms have lower Tobin’s q, indicating that, due to impaired
governance and incentives mechanisms, family firms are managed less effectively and
underperform their competitors.
In this research I will focus on evaluating the financial and capital structure choices made
by family businesses in an attempt to characterize the risk profile of the family business.
Shleifer and Vishny (1986) and DeAngelo and DeAngelo (2000) found that large and
undiversified shareholders, such as those found in family firms, may induce the company’s risk
aversion by avoiding high risk projects even when they are positive NPV, consequently imposing
costs on other, well-diversified shareholders. Anderson and Reeb (2003) indicate otherwise –
the structure of the family business reduces the principal-agent issues and the asymmetric
information between shareholders and managers, therefore suggesting that monitoring erodes the
risk aversion nature of the controlling families.
The hypothesis leading this paper is that factors that are unique to family owned firms –
such as longer-term time horizon, family legacy and succession considerations – could
potentially impact capital structure choices and make family businesses more risk averse and
conservative from a financial stand point. This would suggest that family owned companies

have lower leverage and lower risk, which could be a disadvantage if it creates a sub-optimal
capital structure. At the same time, however, this may result in a lower inherent risk which could
actually benefit companies, especially in times of economic downturn.
The paper is divided in two parts. It is structured as follows: the first part will focus on
the characteristics of the family firm in terms of capital structure and leverage, and evaluate
whether there are any significant differences between the leverage and risk choices of family and
non-family firms. The second part will examine a series of bankruptcy filings in the US during
the years 2004, 2006, and 2008, and evaluate the proportion of family businesses in this sample.
II. PART I – CAPITAL STRUCTURE AND RISK PROFILE
II.1 Methodology
This section will examine the characteristics of the family firm in terms of capital
structure and leverage. I use a database created by David M. Reeb and Ronald C. Anderson for
their research on family businesses. The dataset is comprised of 403 S&P 500 firms in the years
1992-1999, excluding banks and public utilities firms. For each firm they identify founding
family presence, using manually collected data from corporate proxy statements on board
structure and characteristics, CEO attributes, equity ownership structure, and founding-family
attributes.
I focus on the most recent year in Reeb and Anderson’s database (1999), which includes
282 of the firms that were part of the initial sample in 1992. I identify the firms that are still
publicly traded under the same ticker symbol in 2010. This screen results in a sample of 193
public firms, out of which 52 (27%) are family businesses. A variety of accounting and financial

variables are then drawn from Capital IQ, including: size (number of employees, market
capitalization, total revenues, enterprise value), industry, age of firm, profitability metrics (ROE,
ROA, EBITDA margin, net income margin), leverage measures (debt to capital ratio, debt to
EBITDA ratio, interest coverage ratio), and the different variables needed to calculate Altman’s
Z-score and Z’’-score. I evaluate the capital structure using multi-variable regression analysis,
controlling for characteristics such as company’s industry, size, and age. In all the regressions,
the intercept coefficient is set to equal zero to account for the notion that when all characteristics
of a firm are zero, the leverage and risk metrics are meaningless.
II.2 Descriptive Statistics
To estimate the significance of the difference between family and non-family firms on
each of the independent variables used in this study, I used a simple T-test. The outcomes of the
different T-test are summarized in Table 1, which indicates that most the controlling variables
used in the paper are essentially the same for both types of companies. The exception is
profitability measures, in which non-family firms appear to be more profitable than their peers.
As for the dependent variables, from a simple T-test presented in Table 2, it seems that
they are the same for both family and non-family firms. However, a closer examination of the
relationship between the variables in the form of a regression is required to estimate this
relationship, while controlling for other possible explanations for the outcome we see using the
T-test.
II.3 Regression Analysis
I use a regression analysis to evaluate whether a family owned company has a different
level of leverage than a similar non-family company. As an indicator of leverage, I use two

variables: Debt/ EBITDA ratio and Interest Coverage Ratio. I did not examine the more obvious
ratio of Debt/Capital because it is influenced not only by the choice of debt level the company
makes, but also by the level of equity the company has. This would have introduced market
perception of the firm into the equation, and would not be a “clean” estimate of the leverage
choices made by the firm. I then analyze the family company risk characteristics by evaluating
not only the debt structure, but also the risk exposure the company is willing to take on,
hypothesizing that a family firm would have a tendency to be more risk averse, all other things
being equal.
II.3.1 Leverage
The summary of regression outcomes for the leverage variables is displayed in Table 3
and Table 4. Five regressions were run for each of the two dependent variables (Debt/EBITDA
and Interest Coverage Ratio). Each of the five regressions is a derivative of the following
extended regression equation:
Debt/ EBITDA = β1*Family Dummy + β2*Age + β3*Size measure + β4*Industry Dummy +
β5*Profitability measure + β6*Interaction Variables
The first regression of the Debt/ EBITDA analysis is a simple regression of family
dummy variable against the leverage measure, controlling for other possible impactful variables,
including age of firm, industry, number of employees, revenues, market capitalizations, and
profitability metrics. This regression shows no significance at the debt level. Regression 2 adds
interaction of two of the controlling variables with the family dummy, in order to examine the
cross-influence of an “older” family business on debt and a larger family firm on debt. Neither
of these variables are significant.

The three last regressions (regressions 4, 5, 6) exclude some of the controlling variables
and include some combination of interaction variables between size and family, profitability and
family, and age and family. These regression outcomes indicate that family firms actually have a
higher level of debt, all else equal. This is surprising, considering the characteristics of a family
controlled business indicated in several research papers. As discussed earlier, it is believed that
the family ownership and control would result in a more risk averse structure and a tendency to
avoid high risk activities. This study shows that the level of debt a family company takes on is,
if anything, higher than that of a non-family firm. However, the statistical significance of the
family dummy coefficient in most regressions is limited. The results of the regressions using
different combination of variables are mixed, but they certainly do not indicate a lower debt ratio
for family firms.
The same is true for the interest coverage ratio regressions. Although the regressions as a
whole are sufficiently robust, the family dummy is not significant in the vast majority of the
regressions. The interaction variables are mostly highly insignificant, suggesting there is no
measurable difference in any direction between family and non-family firms with regards to their
choice of leverage.
One reservation regarding this conclusion is that this research only looks at a sample of
the largest companies in the American economy. It could be the case that in this size company,
the market’s control mechanisms are effective, even though the company is majority-controlled
or operated by family members. Therefore, it is possible that examining a sample of smaller
firms would yield the outcome that researchers are advocating – family businesses without a
wide shareholder base make non-optimal capital structure choices. This is not the case in this
sample.

II.3.2 Risk Exposure
To get a complete picture of the risk profile of the family business, it is important to look
beyond leverage, at factors that reflect overall risk. To evaluate these factors I use the Altman’s
Z-Score, a predictive model developed by Dr. Edward Altman to measure the overall financial
health of a company and can be used to determine the company’s probability of filing for
bankruptcy in the next two years. The Z-score discriminant analysis is comprised of five
different business ratios which include the following variables: Working Capital, Sales, Total
Assets, Retained Earnings, Earnings Before Interest and Taxes (EBIT), Market Value of Equity
and Book Value of Total Liabilities.
Table 5 summarizes the results of the Z-score regressions. The same five regressions as
the leverage analysis were analyzed. Nevertheless, the story revealed by this analysis is entirely
different. The first two simple regressions show no indication for the significance of family
business as an explanatory variable of the Z-score. However, when introducing several
interactions variables into the regressions (regressions 3-5), the family dummy is not only
significant, but is also a high positive number. The interaction variables do not contribute a
meaningful explanation to the outcome, as they are mostly close to zero and insignificant. This
suggests that a family business is actually less risky than a non-family business, at any stage of
the life cycle, at any size, and at any level of profitability.
In addition to the Z-score I also analyze the Z’’-score, a development of the original Z-
score, which better fits non-manufacturing firms. The results (Table 6) are similar to those of the
Z-score analysis. The family dummy is a robust and positive variable in the explanation of the
Z’’-score.

Taking these outcomes into consideration, an interesting picture is revealed. Although
family firms do not have lower levels of leverage than non-family firms, they have lower overall
financial risk and lower probability of failure. Since the Z-score and Z’’-score introduce
variables that indicate operational outcomes of the company (e.g., Working Capital, EBIT and
retained earnings), it is plausible that the source of the higher financial health stems from the
operational management of these firms. This is a highly positive observation regarding the
family business as an investment. These companies do not have a sub-optimal structure
compared to their peers as conventionally assumed, yet they manage to conduct their operations
in a manner that exposes them to less risk. An earlier observation made in this paper regarding
the difference in profitability of family vs. non-family firms indicated that non-family firms are
doing better than family firms on metrics of profitability (EBITDA Margin, ROE, and ROA).
Taking these points together could indicate that the more conservative operation takes its toll on
the companies’ profitability, but such conclusion requires a more thorough analysis of the
difference in performance in the two types of companies, which is beyond the scope of this
research.
III. PART II – BANKRUPTCIES
After evaluating the difference in risk related characteristics of family and non family
firms, the second part of the paper attempts to answer the question: are family businesses more
resilient than non family businesses in times of economic downturn and credit constraint? Given
the outcome of the first part of the paper, which indicates that family firms have similar capital
structure but manage their operations in a less risky manner which results in a less risky
company, the answer to the question is highly valuable. I look at a series of bankruptcy filings of

public companies in the US in the years 2004, 2006, and 2008 to evaluate the ratio of family to
non-family companies in the sample. These years were selected since they represent bear
capital market environment (2008), as well as bull (2006) and stable (2004) markets in the US
economy. According to my hypothesis, bear economic periods will have a milder effect on
family firms’ bankruptcies as they compare to other firms’ bankruptcies, due to lower inherent
risk.
III.1 Methodology
I gather the data on bankruptcy filings of public firms in the US during the years 2004,
2006, and 2008, using Capital IQ. The sample includes 222 companies for which I collect data
on bankruptcy date, industry, year founded, number of employees, market cap at bankruptcy, a
list of large shareholders at bankruptcy, and a list of managers and board members at bankruptcy.
I then manually identify each company as either family or non-family company.
In determining the definition of a family company I follow the lead of many
distinguished researchers in the field (Reeb and Anderson, 2004; Villalonga and Amit, 2004) and
define a family business as follows: A company in which the founder or a member of his/her
family are insiders (directors or managers); or a company in which the founder or a member of
his/her family are blockholders in the company (hold 5% or more of shares outstanding).
In order to categorize each firm as family or non-family, I use multiple information
sources, including: company SEC filings (annual reports, bankruptcy filings, and insider
holdings reports), company website, information provided with Capital IQ, public sources of
business data such as Hoovers.com, and public sources of company history such as Wikipedia,
Answers.com and newspapers articles. For each company I find the names of the founder/s and
search whether at the time of bankruptcy the founder or a member of his/her family is an insider
or a blockholder.
After building a database of firms in which each company is categorized as either family
or non-family company, I look at the proportion of family firms in each of the years. I then use a
T-test to evaluate whether there are significant differences between family and non-family
companies with regards to two variables: the age of the firm, and the average number of
employees. I look at the age of the firm to attempt to distinguish between “young” and “old”
firms, and as a proxy of generational succession; I use number of employees as a proxy for the
company’s size, since the companies evaluated in the sample are bankrupt, and therefore
traditional size estimates such as market cap, sales, or revenues are flawed representations of
their actual size.
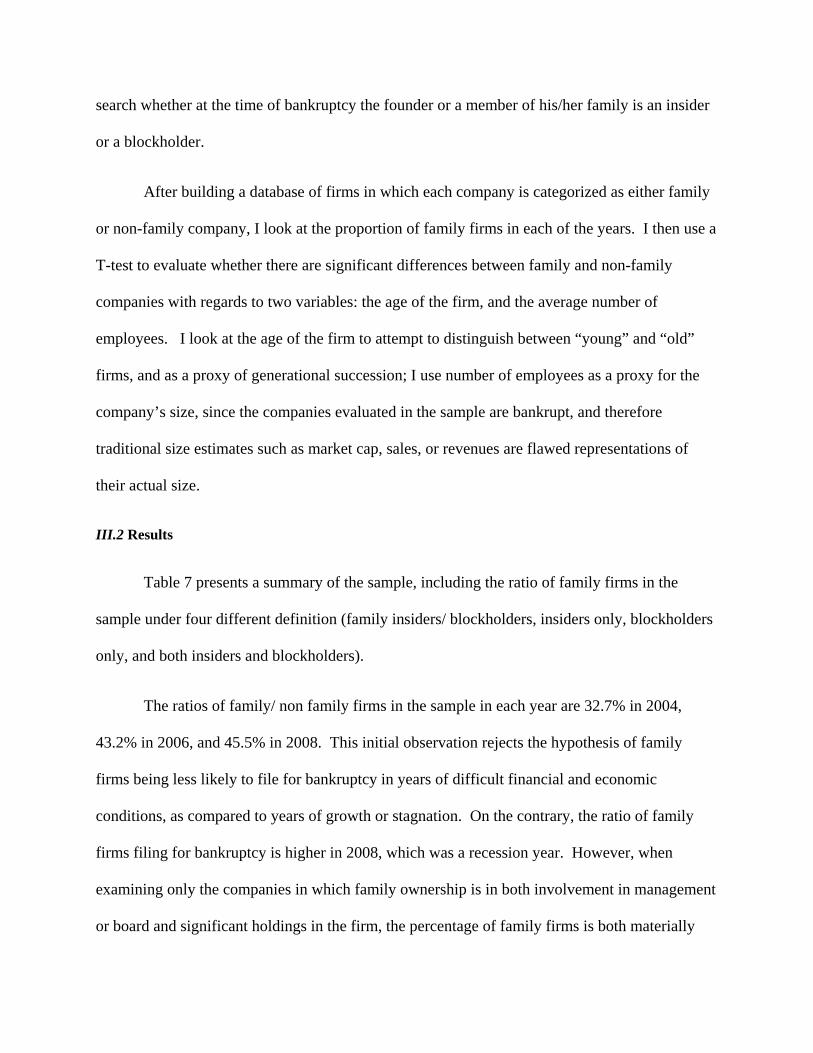
III.2 Results
Table 7 presents a summary of the sample, including the ratio of family firms in the
sample under four different definition (family insiders/ blockholders, insiders only, blockholders
only, and both insiders and blockholders).
The ratios of family/ non family firms in the sample in each year are 32.7% in 2004,
43.2% in 2006, and 45.5% in 2008. This initial observation rejects the hypothesis of family
firms being less likely to file for bankruptcy in years of difficult financial and economic
conditions, as compared to years of growth or stagnation. On the contrary, the ratio of family
firms filing for bankruptcy is higher in 2008, which was a recession year. However, when
examining only the companies in which family ownership is in both involvement in management
or board and significant holdings in the firm, the percentage of family firms is both materially

smaller and statistically significant in 2008 than in 2006. Moreover, when considering the
representation of family businesses in US economy, the findings of this study are very
meaningful. As mentioned in several research papers, approximately 90% of all businesses in
the US are family businesses (Ibrahim and Elis, 1994, colli, 2003). In this sample only 41.9%
(average over all three years examined) of the companies which filed for bankruptcy are family
companies. Furthermore, using a narrower definition of a family firm which requires both insider
and blockholder representation from the founding family, only 17.6% of the companies that have
filed for bankruptcy in those three years are family firms.
In Table 8 I take a closer look at some of the differences between family and non family
firms in the sample. Using a T-test I examine whether there is a statistically significant
difference between family and non family companies with regards to age (are family firms on
average younger than non-family?), and number of employees (are family firms on average
smaller than non-family?).
The results presented in table 8 show no significant difference between family and non
family firms with regards to number of employees (although the difference is large). When
evaluating the age of the firms in the sample, it is apparent that family firms are younger on
average. A potential explanation for this significant difference is that many of the firms
categorized as family firms following the definition I use in the study are start-ups or firms in an
early stage in their life cycle. Such young firms are at greater risk to fail as compared to more
established firms; as a result, their inclusion in the sample creates a bias.
Younger companies tend to have founder’s presence due to their phase in the life cycle
and therefore are categorized as family companies in this sample. Yet these firms do not
necessarily share the characteristics associated with family firms, such as long term time horizon,
succession planning considerations, and risk aversion. For that reason, I test the results when
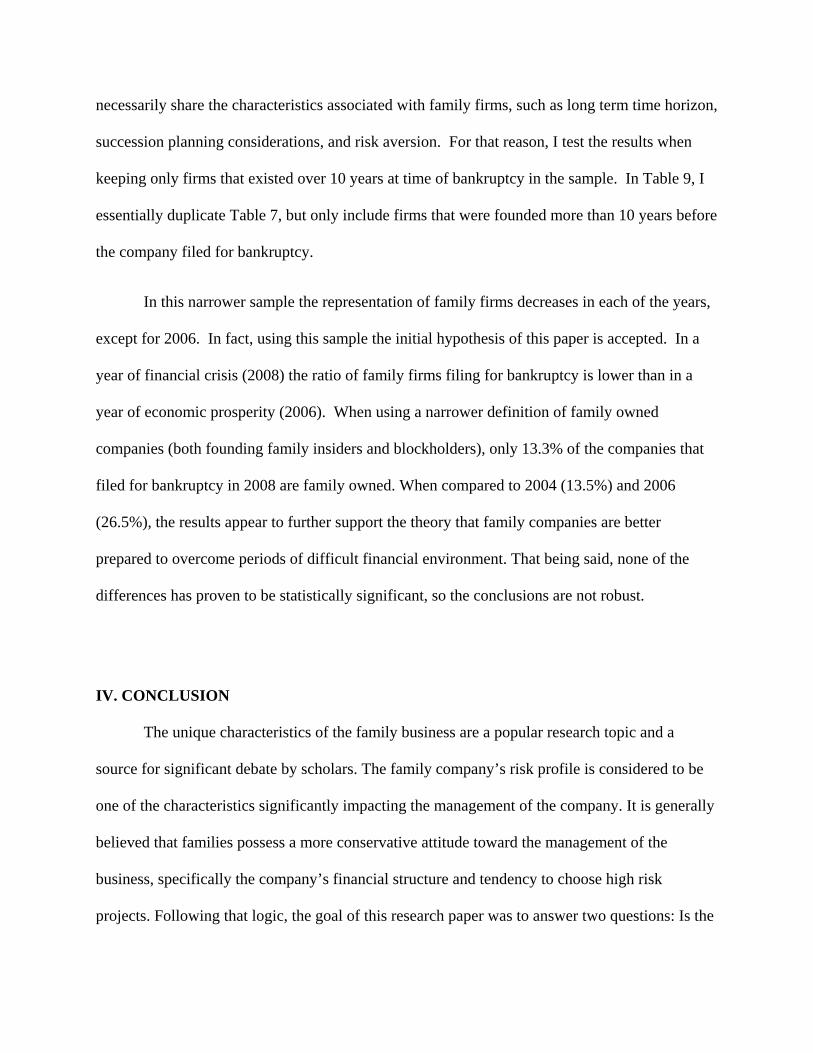
keeping only firms that existed over 10 years at time of bankruptcy in the sample. In Table 9, I
essentially duplicate Table 7, but only include firms that were founded more than 10 years before
the company filed for bankruptcy.
In this narrower sample the representation of family firms decreases in each of the years,
except for 2006. In fact, using this sample the initial hypothesis of this paper is accepted. In a
year of financial crisis (2008) the ratio of family firms filing for bankruptcy is lower than in a
year of economic prosperity (2006). When using a narrower definition of family owned
companies (both founding family insiders and blockholders), only 13.3% of the companies that
filed for bankruptcy in 2008 are family owned. When compared to 2004 (13.5%) and 2006
(26.5%), the results appear to further support the theory that family companies are better
prepared to overcome periods of difficult financial environment. That being said, none of the
differences has proven to be statistically significant, so the conclusions are not robust.
IV. CONCLUSION
The unique characteristics of the family business are a popular research topic and a
source for significant debate by scholars. The family company’s risk profile is considered to be
one of the characteristics significantly impacting the management of the company. It is generally
believed that families possess a more conservative attitude toward the management of the
business, specifically the company’s financial structure and tendency to choose high risk
projects. Following that logic, the goal of this research paper was to answer two questions: Is the

financial structure of the family company more conservative than that of a non-family company?
And is the family company less risky than a non family company, and therefore more resilient to
financial crises?
The analysis conducted in this paper yields some interesting results regarding the risk
profile of the family firm. First, family companies do not have different capital structure than
that of non-family firms. This is somewhat counter intuitive, as the prevailing perception and the
starting point of this paper assumed that due to the unique set of consideration families have, the
capital structure of the family firm would be more conservative. This was proven not to be the
case. One reservation is that this study was conducted on a database of large firms, making this
statement not necessarily true within the broad realm of family firms.
Second, family firms exhibit lower risk as captured by the Z-score and Z’’-score, two
metrics which measure the overall level of financial risk inherent in a firm. Z models include not
only capital structure measures but also measures of operational efficiency (such as Working
Capital, EBIT and Retained Earnings). The significant difference between family firms and non-
family firms on the Z-score scale indicates that the lower inherent risk of family firms stems
from the operational aspect of the business. That is, although the capital structure is not
materially different, family firms are managed with lower risk and higher overall financial
health. This conclusion is also apparent in the final part of the paper, in which bankruptcy data is
analyzed to estimate the failure ratio of family firms as it compares to non-family firms.
Although the majority of the analysis is not statistically significant, it still shows a considerably
lower ratio of family firms that file for bankruptcy, compared to their representation in the
economy. Therefore, the lower risk that was apparent in the Z-score of family firms also
translates to lower than expected bankruptcies of family firms.

The findings of this study suggest that family firms, although they potentially suffer from
various information and agency issues, are more financially healthy. Surprisingly, this is true
even without “paying the price” of a sub-optimal capital structure.

V. EXHIBITS
Table 1 ‐ Descriptive Statistics ‐ Independent Variables
Average SD Average SD Average SD T‐testAge 94.2 42.6 94.1 44.3 94.4 37.7 (0.27) 0.7 0Industry dummyConsumer Discretionary 0.21 0.41 0.18 0.39 0.29 0.46 (0.10) 1.79 *Consumer Staples 0.09 0.28 0.09 0.28 0.10 0.30 (0.01) 0.83 0Energy 0.09 0.29 0.09 0.29 0.10 0.30 (0.00) 0.73 0Healthcare 0.06 0.24 0.07 0.26 0.04 0.19 0.03 1.36 0Industrials 0.28 0.45 0.31 0.46 0.19 0.40 0.12 2.07 **Information Technology 0.04 0.20 0.04 0.19 0.06 0.24 (0.02) 1.11 0Materials 0.18 0.39 0.18 0.38 0.19 0.40 (0.02) 0.83 0Specialized Consumer Services 0.01 0.07 ‐ ‐ 0.0 0.1 (0.02) 1.4 0
Number of Employees 63,828 156,623 60,486 76,451 72,889 276,029 (12,403) 0.9 0Total Assets 31,716 90,308 31,054 75,500 33,511 122,682 (2,457) 0.8 0Market Capitalization 20,524 44,013 23,725 47,586 11,844 31,167 11,881 2.3 **Total Revenue 23,279 47,696 24,077 42,892 21,116 59,227 2,962 0.9 0Net Income Margin % 4.5 15.4 4.8 14.6 3.5 17.5 1.3 1.0 0EBITDA Margin % 15.9 10.9 16.9 11.2 13.4 9.9 3.5 2.3 **Return on Equity % 13.0 41.8 16.1 42.2 4.5 39.5 11.7 2.0 **Return on Assets % 6.8 5.1 7.3 5.0 5.7 5.2 1.5 2.1 **
Number of companies 193 141 52Note: significance levels are denoted with asterisks: *=10%, **=5%, ***=1%
Non family‐FamilyAll Companies Non‐Family Companies Family Companies Difference in means
Table 2 ‐ Descriptive Statistics ‐ Dependent Variables
Average SD Average SD Average SD T‐testTotal Debt/Capital % 55.5 119.9 58.3 139.7 48.0 25.7 10.28 1.3 0EBIT / Interest Exp. 14.48 20.06 14.65 20.53 13.96 18.80 0.69 0.81 0Total Debt/EBITDA 2.94 4.73 2.84 4.84 3.22 4.46 (0.38) 1.01 05 Year Beta 1.32 0.76 1.31 0.76 1.32 0.75 (0.01) 0.73 0Z Score 3.14 1.74 3.22 1.80 2.92 1.56 0.30 1.51 0Z'' Score 3.56 2.37 3.62 2.39 3.39 2.33 0.24 1.11 0
Number of companies 193 141 52Note: significance levels are denoted with asterisks: *=10%, **=5%, ***=1%
Non family‐FamilyAll Companies Non‐Family Companies Family Companies Difference in means


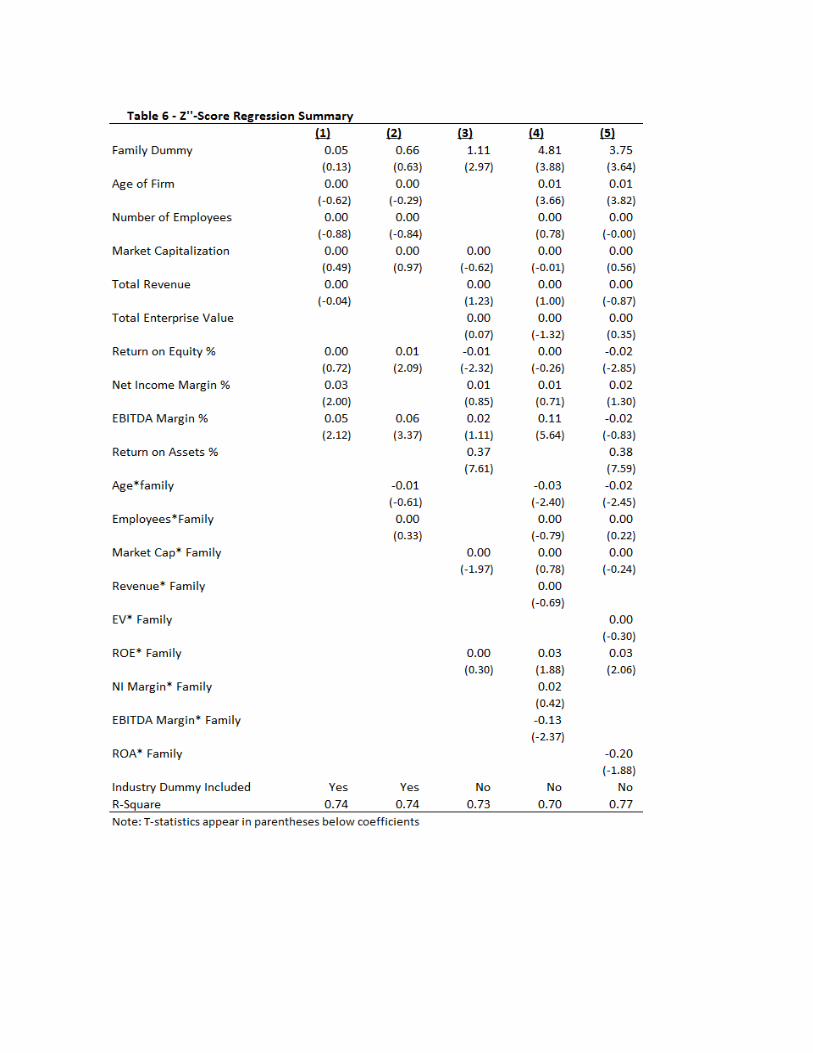

Table 7 ‐ Sample Summary2004 2006 2008 Total
Number of Companies 55 44 123 222Family OwnershipFamily Companies (%) 32.7% ** 43.2% 45.5% 41.9%
Family Insider (%) 32.7% 43.2% 42.3% 40.1%Family Blockholder (%) 12.7% 29.5% * 18.7% 19.4%Both Insider and Blockholder (%) 12.7% 29.5% ** 15.4% 17.6%
Note: significance levels of the difference from the 2008 family/non‐family ratio are denoted with asterisks: *=10%, **=5%, ***=1%
Table 8 ‐ Descriptive Statistics
2004 2006 2008 TotalAge
Average Age (All Companies) 24.5 23.6 24.6 24.4Average Age (Non‐Family Companies) 27.8 23.3 30.4 28.3
Average Age (Family Companies) 17.8 24.0 17.6 19.0Difference (non family‐family) 10.0 ‐0.7 12.8 9.3
T‐Test 1.9 0.7 2.7 2.9P‐Value 0.06 0.46 0.01 0.00
Employees
Average Number of Employees (All Companies) 1,060 955 2,032 1,349Average Number of Employees (Non‐Family Compan 1242 1191 2530 1901
Average Number of Employees (Family Companies) 626 493 1145 911Difference (non family‐family) 616 698 1385 990T‐Test 1.2 1.3 1.4 1.6P‐Value 0.24 0.22 0.16 0.11
Number of Companies 55 44 123 222
Table 9 ‐ Companies older than 10 years2004 2006 2008 Total
Number of Companies 37 34 75 146Family Ownership
Family Companies (%) 27.0% 44.1% 36.0% 35.6%Family Insider (%) 27.0% 44.1% 34.7% 34.9%
Family Blockholder (%) 13.5% 26.5% 14.7% 17.1%Both Insider and Blockholder (%) 13.5% 26.5% 13.3% 16.4%
Note: significance levels of the difference from the 2008 family/non‐family ratio are denoted with asterisks: *=10%, **=5%, ***=1%

REFERENCES
Anderson, R. and Reeb, D., 2003, Founding family ownership and firm performance: Evidence from the S&P 500, Journal of Finance 58, 1301–1329.
Anderson, R. and Reeb, D., 2004. Board composition: Balancing family influence in S & P 500 firms, Administrative Science Quarterly, 49: 209-229.
Anderson, R. and Reeb, D., 2009, R&D Spending and Capital Expenditure Decisions: The Influence of Ownership Structure, Working Paper.
Colli, A., 2003, The History of Family Business: 1850 to 2000. Cambridge: Cambridge University Press.
Deangelo, H., Deangelo, L., 2000, Controlling shareholders and the disciplinary role of corporate payout policy. Journal of Financial Economics 56, 153-207.
Dreux, D., 1990, Financing family business: Alternatives to selling out or going public, Family Business Review, 3, 225-243.
Gallo, M. A., 1994, Global perspectives on family businesses, Chicago: Loyola University, Family Business Centre.
Holderness, Clifford G., and Dennis P. Sheehan, 1988, The role of majority shareholders in publicly held corporations, Journal of Financial Economics 20, 317–346.
Ibrahim, A. B., & Ellis, W. H., 1994, Family business management: Concepts and practice, Dubuque, IA: Kendall/Hunt.
Martinez, J., 1994, Family business in Chile, Family Business Network Newsletter, No.9, p. 5.
Miller, K., 2005, Best of The Best, Newsweek Article
Owens, R., 1994, Australian family business, ethics, energy and long term commitment: The hallmarks of success, Family Business Network Newsletter, No. 9.
Shleifer, A. and Vishny, R., 1986, Large shareholders and corporate control, Journal of Political Economy 94, 461–488.
Suranjita Mukherjee, & Dr. Carol Padgett, 2005, Investment Reputation Index: family firms vs. non-family firms in the UK, ICMA Centre Discussion Papers in Finance DP2005-15.
Villalonga, B., Amit, R., 2006. How do Family Ownership, Control, and Management Affect Firm Value? Journal of Financial Economics 80, 385-417.
Villalonga, B., Amit, R., 2009, How Are U.S. Family Firms Controlled? Review of Financial Studies 22, no. 8: 3047–3091.