the fall and rise of the brazilian cotton sector · the fall and rise of the brazilian cotton...
TRANSCRIPT

THE FALL AND RISE OF
THE BRAZILIAN COTTON SECTOR
by
Johannes Lissdaniels
Fredrik Saïd Madsen
NATIONALEKONOMISKA INSTITUTIONEN
VID LUNDS UNIVERSITET
Department of Economics at the University of Lund
2011:7
Minor Field Study Series
No. 215
Mailing address: ISSN 0283-1589
Nationalekonomiska Institutionen Box 7082
S-220 07 LUND Sweden

1|84
Lund University Department of Economics Bachelor’s Thesis August 28, 2011
The Fall and Rise of the Brazilian Cotton Sector An Institutional Analysis of the Recent Success
by
Johannes Lissdaniels
Fredrik Saïd Madsen
Advisor: Yves Bourdet, Associate Professor

2|84
Abstract
Brazil has recently become the fifth largest producer and fourth largest exporter of cotton in
the world. This success story is exceptional, as the Brazilian cotton production reached record
low levels in the mid-1990s. Since then, however, production has more than recovered owing
to an impressive growth of 43 % during the last decade, which is high in comparison to the
world average of 28 %. The purpose of this thesis is to gain knowledge about the underlying
factors behind the recent success of the Brazilian cotton sector. Our findings suggest that the
emergence of a new sector structure associated with higher coordination among the actors
within the sectors and an altered incentive structure for the producers are key components in
understanding this recent success. However, there are still challenges to be solved and we
believe that further success will depend on how these challenges are met in the future.
Keywords: Brazil, cotton, structural change, co-ordination, competition.

Acknowledgements
We would like to extend our gratitude to the Swedish International Development Cooperation
Agency (SIDA) for granting us a scholarship to make this thesis possible to realize. We would
also like to thank our advisor, Yves Bourdet, for introducing us to this interesting topic.
Moreover, we would like to extend special thanks to Djalma Fernandes de Aquino at
CONAB, Hideko Tsukide Nabas at BM&F and Ricardo Zanatta Machado at the Ministry of
Agriculture for sharing their knowledge concerning data relevant for our thesis. We would
also like to express our deepest gratitude to all of the participants in the interviews we
conducted during our field study in Brazil.
3|84

4|84
Table of Contents Abstract.................................................................................................................................... 2
Acknowledgements................................................................................................................. 3
Table of Contents.................................................................................................................... 4-5
List of Charts, Tables and Figures........................................................................................ 6
List of Abbreviations.............................................................................................................. 7
1. Introduction......................................................................................................................... 8-9
Purpose and Methodology.............................................................................................. 8-9
Delimitation..................................................................................................................... 9
2. Conceptual Framework...................................................................................................... 10-11
Co-ordination and Competition.................................................................................... 10-11
3. Analytical Framework........................................................................................................ 12-14
Cotton Sector Structure and Challenges...................................................................... 12-13
Linking Cotton Sector Organization and Performance.............................................. 13-14
4. The Brazilian Cotton Sector.............................................................................................. 15-24
Historical Background................................................................................................... 15-17
Cotton Sector Structure: Traditional Cultivation....................................................... 17-19
Economic Reform and Sector Structure Transformation.......................................... 19-22
Cotton Sector Structure: Commercial Cultivation...................................................... 23-24
5. Assessing the Brazilian Cotton Sector: Process Indicators............................................. 25-55
Pricing ............................................................................................................................. 25-34
Traditional Sector Structure.................................................................................. 26-27
Market Structure for Purchase of Cotton................................................... 26-27
Government Support Programs................................................................... 27
Current Market Structure..................................................................................... 28-34
Market Structure for Purchase of Cotton................................................... 28-29
Current Governmental Price Support Policies........................................... 30-34
Credit and Input Provision............................................................................................ 34-39
Credit Provision pre-1990s.................................................................................... 35
Government Support..................................................................................... 35
Current Channels for Financing Inputs............................................................... 36-39
Public Credit Support................................................................................... 36-37
National and International Banks................................................................ 37
Agribusiness................................................................................................... 37-38
The Role of Co-operatives............................................................................. 38-39
Research........................................................................................................................... 39-45
The Development of Research through Time...................................................... 39-44
Research in the Traditional Sector Structure............................................. 39-40
Arrival of the Boll Weevil in the 1980s........................................................ 40
Intensification of Research............................................................................ 41-43
Developments in Ginning.............................................................................. 43-44
Amount of Varieties Developed............................................................................ 44-45
Extension.......................................................................................................................... 45-48
Historical Perspective on Extension..................................................................... 46-48
Traditional Extension Services..................................................................... 46
Emerging Actors in the New Sector Structure............................................ 46-48
Quality Control and Marketing..................................................................................... 48-55
History of Quality Control and Marketing......................................................... 49-53
Traditional Quality Control.......................................................................... 49
Improvements in Quality Control................................................................ 50-51
Marketing Improves Reputation.................................................................. 51-53
Performance in Quality......................................................................................... 53-55
6. Assessing the Brazilian Cotton Sector: Outcome Indicators.......................................... 56-65

5|84
Cost Base.......................................................................................................................... 56-58
Production Costs..................................................................................................... 56-58
Yields................................................................................................................................ 58-60
Trends in Yields and Production........................................................................... 58-60
Overall Competitiveness................................................................................................. 60-65
Comparative Advantages and Disadvantages...................................................... 60-61
Brazil’s Cotton Production from a World Market Perspective......................... 61-62
Measuring Overall Competitiveness..................................................................... 63-65
7. Summary & Conclusions.................................................................................................... 66-67
References................................................................................................................................ 68-78
Articles and Books.......................................................................................................... 68-74
Web Sources.................................................................................................................... 75-77
Data Sources.................................................................................................................... 78
Interviews and Meetings........................................................................................................ 79-80
Meetings .......................................................................................................................... 79
Phone Interviews............................................................................................................. 79-80
Appendix 1............................................................................................................................... 81
Appendix 2............................................................................................................................... 82-84

6|84
List of Charts, Tables & Figures Chart 1. Linking Cotton Sector Organization and Performance....................................... 14
Figure 1. Cotton Producing Regions in Brazil..................................................................... 18
Figure 2. Regional Contribution to National Production................................................... 22
Chart 2. Farm Sizes and Wealth Determining whether Having Ginning or not.............. 23
Chart 3. Brazilian Cotton Price Support System................................................................. 31
Table 1. Public Intervention in the Brazilian Cotton Sector.............................................. 33
Figure 3. Brazilian Cotton Prices.......................................................................................... 33
Figure 4. Amount of Varieties Developed, by Decade......................................................... 44
Figure 5. Performance in Quality.......................................................................................... 54
Figure 6. Input Costs.............................................................................................................. 57
Figure 7. Brazilian Cotton......................................................................................................59
Figure 8. Brazil’s Position on the World Market................................................................ 62
Figure 9. Exports & Imports................................................................................................. 64
Figure 10. RCA....................................................................................................................... 65
Figure 11. Amount of Varieties Developed, 1970-2011....................................................... 81
Table 2. Estimated Production Costs of Cotton................................................................... 82
Table 3. Regions Represented in Costs................................................................................. 83

7|84
List of Abbreviations
ABAPA – Associação Baiana dos Produtores de Algodão
ABRAPA – Associação Brasileira dos Produtores de Algodão
ACC – Adiantamento sobre Contrato de Câmbio
AGF – Aquisição do Governo Federal
AGOPA – Associação Goiana dos Produtores de Algodão
AMIPA – Associação Mineira dos Produtores de Algodão
AMPA – Associação Mato-grossense dos Produtores de Algodão
AMPASUL – Associação Sul Mato-grossense dos Produtores de Algodão
ANEA – Associação Nacional dos Exportadores de Algodão
BM&F – Bolsa de Mercadorias & Futuros
CCAB – Consórcio Cooperativo Agropecuário Brasileiro
CEPEA/ESALQ – Centro de Estudos Avançados em Economia Aplicada
CFC – Common Fund for Commodities
CFP – Companhia de Financiamento da Produção
CIRAD – Centre de Coopération Internationale en Recherche Agronomique pour le Développement
CLASPAR – Empresa Paranaense de Classificação de Produtos
COAGEL – Cooperativa Agropecária Goioerê Ltda
COAMO – Agroindustrial Cooperativa Mourãoense
COCAMAR – Cooperativa Agroindustrial Maringaense
COODETEC – Cooperativa Central de Pesquisa Agrícola
CPR - Cédula de Produto Rural
CTNBio – Comissão Técnica Nacional de Biossegurança
Embrapa Algodão – Empresa Brasileira de Pesquisa Agropecuária, Algodão
EPAMIG – Empresa de Pesquisa Agropecuária de Minas Gerais
EGF - Empréstimo do Governo Federal
FACUAL – Fundo de Apoio à Cultura do Algodão
FBET – Fundação Blumenauense de Estudos Têxteis
FOT – Free-on-Truck, Prices after Ginning
FOB – Free-on-Board, Prices when Loaded on a Boat for Export
GDP – Gross Domestic Product
GMV – Gene-Modified Variety
ha – Hectares
HVI – High-Volume Instruments
IAC – Instituto Agronômico de Campinas
IAPAR – Instituto Agronômico do Paraná
ICA – International Cotton Association
ICAC – International Cotton Advisory Committee
ICMS – Imposto sobre Operações relativas à Circulação de Mercadorias e Prestação de Serviços de Transporte
Interestadual e Intermunicipal e de Comunicação
IMAmt – Instituto Mato-grossense do Algodão
IMEA – Instituto Mato-grossense de Economia Agropecuária
INFAOL – Instituto de Fomento ao Algodão e Oleaginosas
ITMF – International Textile Manufacturers Federation
lb – Pounds
LPC – Lei de Proteção de Cultivares
MDM – Maeda Delta&Pine Land Monsanto
OCEPAR – Organização das Cooperativas do Estado do Paraná
PEP – Prêmio para Escoamento do Produto
PEPRO – O Prêmio Equalizador Pago ao Produtor
PGPM – Política de Garantia de Preços Mínimos
PPP – Public-Private Partnership
PROP – Contrato Privado de Opção de Venda
R$ – The Brazilian Currency, Real
RTCA – Regulamento Técnico de Identidade e de Qualidade para a Classificação do Algodão em Pluma
SNCR – Sistema Nacional do Crédito Rural

8|84
1. Introduction
The Brazilian cotton sector has recently experienced structural change and a tremendous
recovery in production. Before the 1990s, cotton production was mainly small-scale.1 In the
early 1990s however, the Brazilian economy underwent economic reforms leading to the fall
of the earlier sector structure as well as a profound decrease in production. Brazil became the
second largest importer of cotton in the world during this period.2 These events could have
been the end of the Brazilian cotton production, but in the mid-1990s, a new sector structure
with large-scale producers emerged. Along with the emergence of the new sector structure,
cotton production more than recovered. The growth rate in production since the mid-1990s
has averaged 3.7 % annually, which is high if compared to the world average of 2.5 %.3,4
Owing to this increase in production, Brazil managed to become the fifth largest producer and
fourth largest exporter of cotton in the world.5
The recovery of Brazilian cotton production is exceptional, especially when considering the
challenges cotton sectors generally face on the world market. Cotton prices are relatively low
in comparison to other crops and the volatility of prices also implies considerable risks for
cotton producers.6 Additionally, cotton has to compete with synthetic fibers on the world
market, making production of high-quality cotton paramount for a cotton sector to stay
competitive.
Despite these challenges, the Brazilian cotton sector has displayed a remarkable performance.
The increased cotton production since the mid-1990s has paved the way to outperforming
most cotton producing countries and resulted in success.
Purpose and Methodology
The purpose of this thesis is to gain knowledge about the underlying factors behind the recent
success of the Brazilian cotton sector. A conceptual and analytical framework recently
developed and used in a World Bank study evaluating African cotton sectors is used in this
1 Buainain & Batalha (2007), p. 48, 51; Filho & Alves (2007), p. 63.
2 Kiawu et al (2011), p. 12.
3 The numbers are based on calculations made by the authors.
4 Estur (2006), p. 10; CONAB (2011-08-01).
5 McCue (2010).
6 Tschirley et al (2009), p. 14-17.

9|84
process. By applying this framework to the Brazilian cotton sector we aim at contributing to a
deeper understanding of the recent development.
In order to obtain information for the study, semi-structured interviews with a broad range of
cotton sector stakeholders were held. Additionally, various sources of literature were
consulted together with statistics collected mainly from the Ministry of Agriculture in Brazil,
CONAB, USDA and BM&F.
Delimitation
This thesis does not consider the cotton sector as a whole. In accordance with the aim of this
thesis we solely focus on the production of seed cotton and predominately cotton lint. We
thereby exclude the resultant activities of cotton production e.g. cottonseed oil and cake
industries.
Due to scarcity of time in Brazil and the large geographical extension of the country we
choose to focus our study on the cotton production in the Cerrado,7 as the major part of
Brazil‟s cotton production is carried out there. We do not attempt to analyze current cotton
production in the South or in the North.
7 The Cerrado is irregularly distributed across 10 regions in Brazil: Goiás, Mato Grosso, Mato Grosso do Sul,
Minas Gerais, São Paulo, Bahia, Piauí, Maranhão, Tocantins and Rondônia. See Kiawu et al (2011).

2. Conceptual Framework
In order to analyze cotton sector performance in Brazil we make use of a conceptual
framework developed by Tschirley et al (2009).8 According to this framework, cotton sector
performance is closely linked with cotton sector organization, which is understood as the
institutional settings of the market and the associated degree of co-ordination and
competition.9
Co-ordination and Competition
Poulton et al (2004) argue that the neoclassical ideal model of perfect competition implies
both perfect competition and perfect co-ordination.10
In fact the only co-ordination needed in
the most basic version of the neoclassical model is vertical co-ordination of supply and
demand – co-ordination between players at different levels of the market - and this is achieved
through the price mechanism. However, North (1990) argued that “a highly sophisticated set
of institutions, which make information available and define and enforce the „rules of the
game‟ ” is implicit in the model.11
Taking institutions into account, horizontal co-ordination is
achieved through obedience of these rules that also determine the scope of the market. In this
hypothesized efficient market, there are no distractions except for the price and therefore both
competition and co-ordination are carried out effectively. In the real world of imperfections
however, where the assumptions of the model never fully hold, co-ordination can be difficult
to achieve, nor may competition be perfect.
The first concept influencing sector performance, co-ordination, is defined by Poulton et al
(2004) as “efforts or measures designed to make players within a market system act in a
common or complementary way or towards a common goal”.12
If government involvement is
low or if state capacity is weak, horizontal co-ordination – co-ordination between players at
the same level of the market – may be required for provision of public goods critical to cotton
sector performance, such as quality control and research.13
However, there are several co-
8 This framework draws on earlier work by Poulton et al (2004), Tschirley et al (2006) and Tschirley et al (2007)
among others. The framework is further presented in Tschirley et al (2009) and Tschirley et al (2010). 9 Tschirley et al (2009), p. xxv.
10 Poulton et al (2004), p. 521.
11 Poulton et al (2004), p. 521, referring to North (1990).
12 Poulton et al (2004), p. 521.
13 Tschirley et al (2010), p. 297; Kelly & Tschirley (2008).
10|84

11|84
ordination challenges that need to be solved in order for the provision to be successful.14
The
actors must first agree on what they should invest in, e.g. type of research. Secondly, they
must agree on how this should be done, e.g. how the research is to be funded and what the
distribution of responsibilities should be. Lastly, the parties need to solve how enforcement is
to be carried out, in order to handle opportunistic behavior such as free riding, e.g. consuming
the benefits of research without having participated in the production of the knowledge. If the
actors do not succeed in solving these challenges co-ordination will fail and the actors will
suffer the consequences of a lack of public goods. Alternatively, the actors organize
collectively and create institutions and organizations to handle these challenges in order to
secure provision of public goods vital to sector performance.
There is a strong link between the way in which co-ordination is carried out and the number
of actors in the cotton sector. When the sector comprises a few actors, co-ordination is likely
to be relational, “characterized by informal agreements enforced by consensus or private
sanction”.15
As the number of actors increases however, formal institutions are more likely to
co-ordinate the actors, but as Poulton et al (2004) argue, often with losses in effectiveness.
The second concept influencing sector performance is the associated degree of competition in
the market for purchase of cotton, i.e. the market to which the producers sell their product,
cotton seed or cotton lint depending on market structure. Tschirley et al (2009) define this
market as “the nature of players and entities in the sector, together with the distribution of
roles and power between them” and “the set of rules, regulations and other legal instruments
that are imposed on participants in the sector to enable it to operate and limit conflicts”.16
In
accordance with these definitions, different market structures for the purchase of cotton can
be delineated. Tschirley et al (2009) firstly distinguish between regulated marked-based
sectors.17
The former refers to national or regional monopolies and the latter refers either to a
concentrated or competitive market depending on the number of buyers.18
14
Poulton et al (2004), p. 522. 15
Ibid, p. 523. 16
Tschirley et al (2010), p. xxvi. 17
Tschirley et al (2009), p. 45. 18
Tschirley et al (2010), p. 46.

12|84
3. Analytical framework
As will be shown in the first part of this section, the degree to which co-ordination and
competition is carried out is hypothesized to influence sector performance. Different sector
structures, each with its own associated degree of the two concepts, will thus have different
hypothesized performance. In order to test these hypotheses Tschirley et al (2009) developed
an analytical framework comprising a set of empirical performance indicators, and these are
the subjects to which we will turn in the latter part of this section.
Cotton Sector Structure and Challenges
According to the conceptual framework developed by Tschirley et al (2009) cotton sector
performance is closely linked with the associated degree of co-ordination and competition.
The performances that are relevant to assess derive from four main cotton sector challenges
identified by Poulton et al (2004),19
and these challenges are:
provision of input credit to farmers
maintenance of quality control
maintenance of a high-quality research system and effective extension of resulting
research knowledge and products, and
payment of an attractive seed cotton price
Poulton et al (2004) hypothesized that small holder-based sectors with effective co-ordination
will perform better in the first three of these challenges,20,21
whereas sectors with competitive
markets for purchase of cotton are more likely to pay a higher cotton price to farmers. This
hypothesis is based on the assumption that ginners provide these services. We argue, though
that in a market structure where ginners, or more generally, the actors buying farmers‟ cotton,
have no central function as providers of these services, other actors in the sector, e.g.
19
Tschirley et al (2009), p. 51, referring to Poulton et al (2004). 20
Tschirley et al (2009), p. 47, referring to Poulton et al (2004). 21
The work by Tschirley et al (2009) serves to assess smallholder-based cotton sectors in Africa. In these sectors
ginners have a central role both as buyers of seed cotton and as providers of the services in focus of the
challenges listed by Poulton et al (2004). In these sectors there is likely to be a trade-off between competition
and co-ordination. One reason is that competition positively impacting prices paid to farmers at the same time
can undermine co-ordination among the ginneries necessary for the provision of public goods. For more
information on the reasons and consequences of the trade-off, see Tschirley et al (2009).

13|84
producers, must make sure that these services are provided. In such a market structure, co-
ordination among these actors will most certainly, ceteris paribus, facilitate this provision.
Linking Cotton Sector Organization and Performance: Empirical
Performance Indicators
Cotton sector performance depends to a great extent on how the challenges identified by
Poulton et al (2004) are met, which in turn are influenced by the institutional structure of the
market and the associated balance between competition and co-ordination. In order to assess
cotton sector performance, Tschirley et al (2009) developed empirical performance indicators
that are based on these challenges.
The performance indicators assess cotton sectors performance at various levels of the
market.22
At the producer level, the challenges identified by Poulton et al (2004) will be
analyzed by the use of five process indicators, which focus on the quality of the services
provided at producer level, as well as prices paid. The services include public good generation
– research & quality control – input provision and extension. In Chart 1, which links co-
ordination and competition to performance, the process indicators are represented by the
rectangular boxes. At the company level, the effects of how well the services are carried out
will influence cotton production and yields, as well as company cost base. Cotton production,
yields and company cost base may therefore be thought of as intermediate outcome indicators
which are also influenced by exogenous factors such as soil fertility.
Yields and cost base, along with cotton prices, taxes and subsidies, of which the latter two
largely are exogenous, are major determinants of producers‟ profitability. The cost base of
production further influences the sector‟s overall competitiveness along with quality control,
since adequate quality control results in positive sector reputation on the world market. Lastly,
a well performing cotton sector should be able to positively influence the overall economy,
i.e. have a positive macro-economic impact. These last three concepts are referred to as final
outcome indicators.
22
Tschirley et al (2009), p. 54.

14|84

15|84
4. The Brazilian Cotton Sector
This chapter serves to give the reader an overview of cotton production in Brazil. Firstly a
historical background of cotton production will be presented; both the overall development of
cotton production as well as its relation to overall economic policies will be touched on.
Thereafter follows a delineation of the sectors‟ structure in the pre-mid-1990s. Then a section
describing the events causing the collapse of cotton production in the 1990s as well as the
factors contributing to the emergence of a new production structure will be presented. Lastly,
the new sector that emerged will be described.
Historical Background
Brazil has a long history of cotton cultivation. When the Portuguese arrived in the 16th
century, cotton was already grown in the country.23
Over the course of the forthcoming
centuries cotton cultivation expanded, and by the second half of the 18th
century Brazil had
already begun exporting cotton to Europe.24
Cotton soon became an important crop for export,
along with sugar, tobacco and coffee.25
In the beginning of the 20th
century, agriculture had
become the foundation upon which the Brazilian economy was based and coffee export solely
accounted for seventy percent of Brazil‟s foreign currency revenues.26
In response to the international crisis of the 1930s, a reorientation of the Brazilian economy
began.27
The great depression had heavily affected the Brazilian export sectors and, as a
response, the Vargas regime implemented policies emphasizing self-sufficiency through
national industrialization. These new policies laid the foundation for the import-substitution
strategy that later came to dominate economic policy-making from the 1950s until the
1980s.28
The agricultural sector soon became integrated in this new national development project. The
industrialization demanded overcoming food supply and foreign reserve restrictions, and
agriculture gave, in respect to these restrictions, a supportive role.29
In order to compensate
23
Lunardon (2000), p. 1. 24
ABRAPA (2004), p. 16-17. 25
de Almeida (2009), p. 3. 26
Barros (2008), p. 3-4. 27
Guimarães (2005) p. 531. 28
Barros (2009); Guimarães (2005). 29
Barros (2009), p. 2.

16|84
the agricultural sector for the industrial bias, the government created credit and price support
programs and began investing in infrastructure and agricultural research.30
Cotton was cultivated in the state of São Paulo before the international crisis, but it was not
until the 1930s when the coffee export profoundly decreased that cotton production started to
expand.31
São Paulo soon became the leading region of cotton production in Brazil and the
state gained international reputation, as Brazil became one of the world‟s top producers.32
Cotton production continued to expand the following decades, and in the beginning of the
1960s São Paulo was still the leading region followed by Paraná.
In 1964, after the military coup, the government devaluated the exchange rate, which gave
stimulus to export. 33
In order to reduce the dependence on coffee exports, the government
initiated an agricultural diversification program, which led to further expansion of the
cultivated area in São Paulo and Paraná.34
These two policies stimulated cotton production
and a few years later Brazil became the fifth largest producer in the world, with a cotton lint
production of 600 000 tons in 1969, and the third largest cotton exporter, with an export of
400 000 tons.35
Until the 1970s, the development of the cotton sector had been closely linked to its exports, to
which the majority of the production had been designated.36
In 1973, however, the
government implemented profound restrictions on cotton exports – quantitative controls and
export taxes – in order to stimulate manufactured exports and the domestic textile industry.37
These export restrictions were in large maintained until 1988 and as a result cotton exports
fell.
In the beginning of the 1980s larger extensions of land were for the first time planted,
requiring tractors and harvesting machines.38
Production and exports increased initially. In the
mid-1980s, however, it became clear that large-scale production was not sustainable in the
30
OECD (2005), p. 69. 31
ABRAPA (2004), p. 20; Alves (2006), p. 22. 32
Brannstrom (2010), p. 169. 33
Guimarães (2005). 34
Guimarães (2005); Kiawu et al (2011), referring to Barros (2009). 35
Alves (2006), p. 23-24. 36
Ibid, p. 24, 32. 37
Ibid, p. 25. 38
Macdonald (2009).

17|84
South. At this time, the international cotton price reached low levels, which, in combination
with higher production costs and the advancement of boll weevil, resulted in decreased
production.39
During this period, although still accounting for 10% of world exports, Brazil
became a major importer of cotton for the first time.40
The import substitution strategy had indeed shown good performance until this point in time,
contributing to an average growth of 7.5 % from 1945 to 1980.41
However, growth had come
at the expense of high inflation, balance of payments problems and a large external debt.42
These factors contributed to what became known as the “lost decade” for Brazil and the
demise of the import substitution strategy. The cotton sector became profoundly affected by
the macroeconomic shift that followed and it would take almost a decade for cotton
production to recover.
Cotton Sector Structure: Traditional Cultivation
The cotton sector prior to the mid-1990s was in large small-holder based and production was
mainly carried out in the southern parts of Brazil in the states of São Paulo and Paraná, even
though the largest area was cultivated in the North East, as seen in Figure 1.43
Although
attempts at large-scale production were made in the beginning of the 1980s, cotton was, until
1997, predominantly handpicked and labor-intensive. Estimates show that over one million
cotton cultivators were active in the 1970s.44
Cotton seeds were exclusively provided by the government, through regional institutions such
as CATI in São Paulo and CAFE do Paraná in Paraná. In some parts of the country, e.g. the
North East, cotton seeds were subsidized and provided by federal states.45
After the harvest farmers sold their seed cotton directly, or through intermediaries, to
ginneries.46
Intermediaries were mostly used when the geographical distance to the ginnery
was long, or when farmers cultivated on rented land. In the latter case, farmers sold their seed
39
Buainain & Batalha (2007), p. 4. 40
Ibid, p. 50. 41
Barros (2008), p. 4. 42
OECD (2005), p. 31. 43
Filho & Alves (2007), p. 53. 44
Interview Cotton Consultoria (2011-07-27); Interview IAPAR (2011-08-02). 45
Interview ABRAPA (2011-07-21). 46
Barros & Beltrão (2008), p. 1274.

18|84
cotton to the landowner that later sold the seed cotton to a ginnery. Most commonly however
farmers sold their seed cotton directly to ginneries.
The market structure for the purchase of seed cotton,47
i.e. level of competition between
ginneries, was market-based during this period, albeit concentrated. Barros and Beltrão (2008)
describe the market as an oligopsony, i.e. a market comprising few buyers.48
After ginning, cotton lint could either be sold to the domestic market or for export. When
sold to the domestic market, brokers – so-called corretores – were often used as
intermediaries before the cotton was bought by the domestic textile industry.49
If the cotton
47
Seed cotton is the denomination of cotton directly after harvest. This type of cotton contains both fibers (lint)
and seeds. As cotton needs processing in order for textile companies to use it, seed cotton is sent to a ginnery.
When cotton has been ginned – i.e. when seeds have been separated from the lint – the cotton lint is ready to be
used in fabric production. 48
Barros & Beltrão (2008), p. 1274. 49
Ibid, p. 1275.

19|84
lint was designated for export, exporters bought cotton before selling to the importing
country.
The cotton sector during this period demonstrated a low level of co-ordination, i.e. actors in
the supply chains did not in general engage in collaboration with one another.50
However,
among farmers collaboration could be strong. In Paraná for example, farmers were organized
in co-operatives, which were largely based on knowledge and traditions of immigrating
Europeans, who had brought their associative spirits to the new land.51
Small and medium-
sized farmers sought to create economies of scale through this kind of collaboration. Co-
operatives had an important role in e.g. providing warehousing, and in a few cases the co-
operatives provided ginning services.52
Farmer collaboration through co-operatives did not
extend much beyond Paraná, and in other parts of Brazil farmers were less organized.
Economic Reforms and Sector Structure Transformation
In the late 1980s, the financial ability of the Brazilian government had collapsed and it
became apparent that the import substitution strategy was no longer affordable.53
As a
consequence, a great restructuring of the economy began. This restructuring later became
known as the Washington Consensus and entailed trade liberalization, deregulation of
domestic markets and privatization of state owned enterprises.54
Still, it was not until 1994,
when the Real Plan was implemented, that the government began to get inflation under
control. Continuing the trade liberalization, Brazil entered MERCOSUL, a customs union
with other South American countries.55
The cotton sector in particular, and agricultural sector in general, was heavily affected by the
restructuring of the economy. At the end of the 1980s the government could no longer finance
the agricultural support programs from which the cotton sector had benefited. Credit support
was curtailed, the minimum price fell sharply and liberalization of the cotton trade began in
1988.56
50
BNDES (1997), p. 4. 51
Pessa (2007), p. 92; Interview OCB (2011-07-20). 52
Pessa (2007), p. 109-110; Massuda (2005), p. 5; Interview Cotton Consultoria (2011-07-27). 53
Kiawu et al (2011) p. 11; OECD (2005), p. 70. 54
Kiawu et al (2011) p. 11; OECD (2005), p. 31. 55
OECD (2005), p. 31. 56
Kiawu et al (2011) p. 11; Alves (2006), p. 38; CONAB (2011-08-01).

20|84
Non-tariff barriers and export licensing were eliminated, and the import tariff was reduced
from 55 % in 1987 to 10 % in 1988-1989 and to 0 % in 1990-1994.57
However, agriculture also benefited from the opening of the economy. Foreign investment,
technology, inputs and machinery now became available for domestic producers who, for
some commodities, managed to increase their production despite falling commodity prices,
for instance because input prices fell more rapidly than commodity prices.58
For cotton production however, these reforms brought a severe crisis. Cotton producers, who
previously both benefited from government support and protection, now suffered from their
own inefficiency when forced to compete with the world market.59
Cotton production fell
from 750 million tons in 1988-1989 to 465 million tons in 1996/1997,60
and Brazil went from
being a net exporter of cotton in the late 1980s to becoming the world‟s second largest
importer in 1996-97.61
The cultivated area in Brazil fell from 2229.6 thousand ha in 1988/89
to 657.5 thousand ha in the 1996/97 season.62
It is estimated that the crisis in cotton
production from the mid-1980s to the mid-1990s directly caused unemployment of about 800
000 producers, leading to one of the largest and fastest urban migrations in peacetime in the
modern history of Brazil.63
Simultaneously with the ongoing crisis, a new phase in the Brazilian cotton history began.
This new phase began in 1988 in the state of Mato Grosso when Grupo Itamarati – a farm in
Campo Novo do Parecis in Mato Grosso – started to seek crop rotation alternatives for soy
produced in the region.64
Cotton turned out to be the perfect crop rotation alternative as it
consumes nitrogen, extensively left in the land by the soy plant.65
At this time there were no
seeds on the market adapted to the specific agro-ecological conditions in the Cerrado.
Responding to this situation, Grupo Itamarati began working together with Embrapa Algodão
and Fundação MT to develop varieties adapted to the region‟s specific conditions.66
The
57
Alves (2006), p. 39; Kiawu et al (2011), p. 28. 58
Kiawu et al (2011), p. 13; OECD (2005), p. 12. 59
Buainain & Batalha (2007), p. 50. 60
The authors‟ calculations based on data from CONAB. 61
Kiawu et al (2011), p. 12. 62
CONAB (2011-08-01). 63
Buainain & Batalha (2007), p. 48. 64
Freire (2007), p. 27. 65
Macdonald (2009). 66
ABRAPA (2004), p. 23; Alves (2006), p. 49.

21|84
breakthrough came with the variety CNPA ITA 90 in the 1992/93 season and the producers
subsequently started to experiment by rotating soy with cotton.67
However, it was not until the
1997/98 season that cotton production started to expand in the Cerrado.
There are several reasons why cotton production started expanding in the 1997/98 season.
Firstly, diseases had struck soy cultivation, which increased the demand for crop rotation.68
Secondly, the price of soy decreased significantly in the mid-1990s at the same time as the
cotton price increased and therefore it became more profitable to cultivate cotton in relation to
soy. Moreover, the price of land decreased in the Cerrado relative to the price of land in the
South - i.e. São Paulo and Paraná and as a consequence many soy farmers moved their
production from the South to the Cerrado where they subsequently started to cultivate
cotton.69
Prior to the cotton expansion in the Cerrado, there were no co-operatives in the region.70
Cultivation of cotton demanded expertise that could classify cotton lint and it was not viable
for every producer to set up a laboratory on the farm. Cultivators from the South had begun
moving to Mato Grosso in the 1980s taking with them their organizational experience and
know-how, and based on this knowledge producers now started to create co-operatives that
built laboratories for classification.
Cotton production was far from a safe bet. The producers faced a lot of different challenges
that had to be overcome in order for production to be viable. The producers decided to unite
to confront these challenges and, as a result, the association AMPA was created in September
1997. During the same year, producers, concerned over a tax on commercialized cotton, the
ICMS (usually 12 % on merchandise in circulation), decided to go to the federal government
in Mato Grosso. With such low margins as the producers faced, this tax had a profound
impact on the profitability and viability of the production.71
The negotiations with the federal
government resulted in the creation of PROALMAT, a cotton incentive program. It was
agreed that producers associated with AMPA would get a 75 % reduction of the ICMS if
satisfying a number of conditions specified by PROALMAT, emphasizing sustainability, e.g.
67
Pessa (2007), p. 94. 68
Buainain & Batalha (2007), p. 65. 69
Interview OCB (2011-07-20). 70
Pessa (2007), p. 110. 71
Interview Libero Commodities (2011-07-13).
22|84
0%
10%
20%
30%
40%
50%
60%
70%
80%
19
76
/77
19
78
/79
19
80
/81
19
82
/83
19
84
/85
19
86
/87
19
88
/89
19
90
/91
19
92
/93
19
94
/95
19
96
/97
19
98
/99
20
00
/01
20
02
/03
20
04
/05
20
06
/07
20
08
/09
20
10
/11
Shar
e o
f P
rod
uct
ion
(%
)
Season
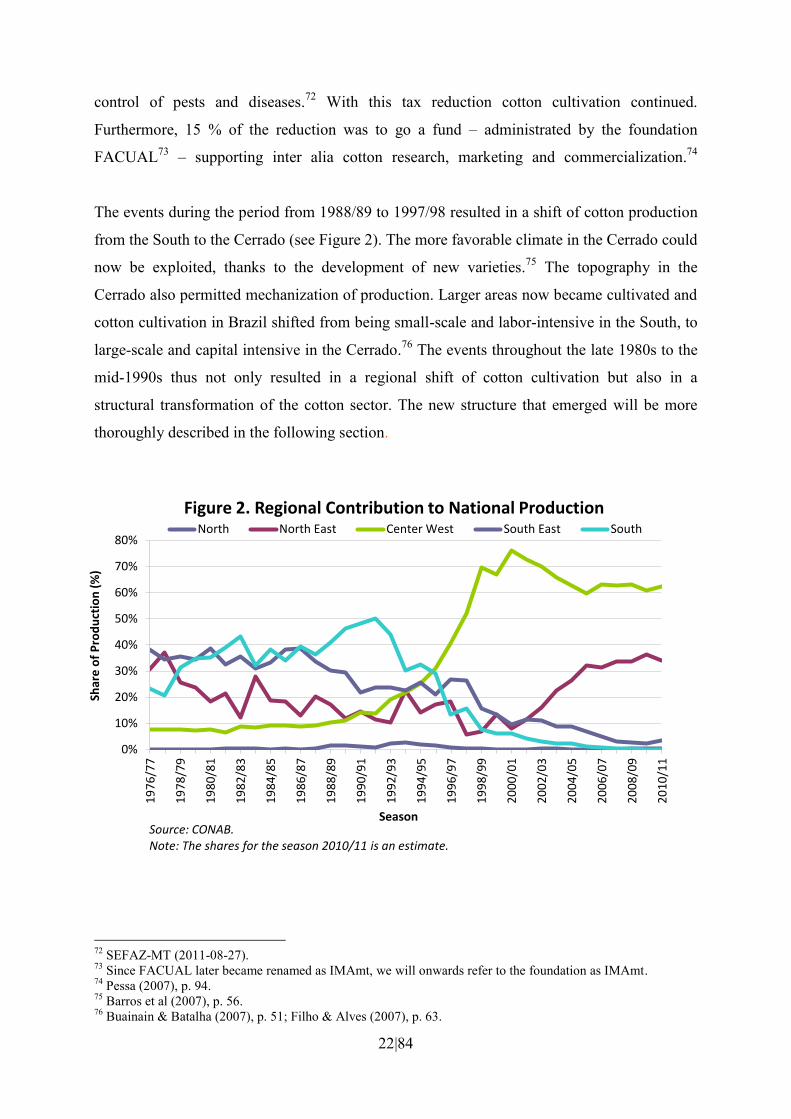
Figure 2. Regional Contribution to National Production North North East Center West South East South
Source: CONAB. Note: The shares for the season 2010/11 is an estimate.
control of pests and diseases.72
With this tax reduction cotton cultivation continued.
Furthermore, 15 % of the reduction was to go a fund – administrated by the foundation
FACUAL73
– supporting inter alia cotton research, marketing and commercialization.74
The events during the period from 1988/89 to 1997/98 resulted in a shift of cotton production
from the South to the Cerrado (see Figure 2). The more favorable climate in the Cerrado could
now be exploited, thanks to the development of new varieties.75
The topography in the
Cerrado also permitted mechanization of production. Larger areas now became cultivated and
cotton cultivation in Brazil shifted from being small-scale and labor-intensive in the South, to
large-scale and capital intensive in the Cerrado.76
The events throughout the late 1980s to the
mid-1990s thus not only resulted in a regional shift of cotton cultivation but also in a
structural transformation of the cotton sector. The new structure that emerged will be more
thoroughly described in the following section.
72
SEFAZ-MT (2011-08-27). 73
Since FACUAL later became renamed as IMAmt, we will onwards refer to the foundation as IMAmt. 74
Pessa (2007), p. 94. 75
Barros et al (2007), p. 56. 76
Buainain & Batalha (2007), p. 51; Filho & Alves (2007), p. 63.

23|84
Cotton Sector Structure: Commercial Cultivation
Currently, cotton is predominantly cultivated in the Cerrado by commercial firms that use
mechanized production techniques. The number of producers in the cotton sector has varied
over the last 5 years from about 1000 to 2000 producers.77
The majority of the producers‟
main crop is soy, which is rotated with cotton and commonly corn. Only a few producers
have cotton as a main crop.
The cost-base for cultivating cotton in the Cerrado necessitates a rather large cultivated area
in order for the production to be viable. Therefore production is carried out on a large scale.
As shown in Chart 2, most producers take advantage of the associated economy of scale and
vertically integrate ginning in their production. Today, about 90 % of the approximately 270
ginneries are owned either by single producers or co-operatives.78
Producers can also hire
independent ginning companies or traders to perform this service, where the former gin about
10 % of national seed cotton and the latter 1-2 %.
In the current sector structure cotton seeds are supplied by three sources: by companies
developing varieties, e.g. Bayer, Dow, Syngenta, by co-operatives, e.g. COMDEAGRO, or by
dealers, i.e. independent firms specialized in selling seeds.79
In contrast to in the previous
structure, the government has no role in supplying cotton seeds.
77
Interview ABRAPA (2011-07-21). 78
Buainain & Batalha (2007), p. 57; Interview ABRAPA (2011-07-21); Interview Libero Commodities (2011-
07-13). 79
Interview AMPA (2011-08-01); Interview Monsanto Algodão (2011-07-29).

24|84
After ginning, producers sell their cotton lint through intermediaries to the domestic market or
for export. Brokers operate as intermediaries on the domestic market and traders operate as
intermediaries when selling for export. We would define the market for purchase of cotton lint
as market-based and competitive. The market will be further delineated by pricing.
Concerning organization among producers, the majority are organized in co-operatives
specialized in a number of different functions. These functions are inter alia helping producers
with commercializing of cotton, purchase of inputs and provision of public goods such as
quality control. The common denominator defining a co-operative is that a co-operative is a
commercial organization comprising producers and in contrast to an association has the legal
right of selling and purchasing products and services.80
Co-operatives are usually financed
through single membership dues and have no objectives but providing the services demanded
by the members.81
It is common that producers are members of several co-operatives, thereby
accessing the broad range of services available.
Most producers are also members of producers associations inspired by AMPA. There are
now eight state associations represented nationally by ABRAPA founded in 1999.82
ABRAPA is considered to be the legitimate representative of Brazilian cotton producers and
its members represent 96 % of the total area cultivated, 99 % of the production and 100 % of
exports. ABRAPA‟s mission is to represent and promote the interest of the Brazilian cotton
producers domestically and internationally, for both public and private stakeholders.
ABRAPA also provides assistance and support to producers, to enhance profitability of
production.
80
Interview AMPA (2011-08-01). 81
Interview UNICOTTON (2011-07-08). 82
ABRAPA (2011-08-27).

25|84
5. Assessing the Brazilian Cotton Sector: Process
Indicators
The conceptual framework generates hypotheses concerning cotton sector performance based
on sector organization. More precisely, the way in which the sector is organized is
hypothesized to influence concepts vital for sector performance captured by the process
indicators. The first process indicator presented in this section – pricing – is influenced by the
organizational structure of the cotton sector through the market where producers sell their
cotton. A competitive market is expected to offer producers higher prices whereas a
concentrated market is expected to offer less attractive prices to the producers. The remaining
four process indicators – credit & input provision, research, extension and quality control –
according to the theory are influenced by the level of co-ordination among actors in the
sector, where a higher level of co-ordination, ceteris paribus, is hypothesized to facilitate
provision of these services. We will now turn to each of these process indicators in more
detail.
Pricing
The price that producers receive for cotton influences to a large extent the incentives to
cultivate the crop. Producers‟ decision to invest in cotton production is however determined
by more factors than solely the cotton price. Most producers cultivate several crops – most
commonly soy, cotton and corn – and commercial producers base their decision of which crop
to cultivate for the next season on the expected relative profitability between the crops,
influenced by relative prices and costs.83
Additionally, producers must manage the risk
associated with crop cultivation, deriving e.g. from volatile commodity prices. The investment
decision is taken under the restraint of the specific agronomical restrictions producers face
and the process mostly results in a diversification of the planted crops where cotton normally
accounts for up to 15 % of the cultivated area, a higher share of cultivated cotton entails a risk
few producers are willing to take. Given this, a higher cotton price most certainly, ceteris
paribus, stimulates increased production.
According to the conceptual framework, the degree to which producers receive an attractive
price is influenced by the market structure for purchase of cotton, i.e. the competition among
83
Interview Libero Commodities (2011-07-13).

26|84
buyers. As we have seen, this market structure changed profoundly during the 1990s. We will
therefore examine the incentive structure for cultivation of cotton before and post
restructuring of the sector in the following sections.
Moreover, as cotton prices are very volatile on a seasonal basis, the government has
developed price support programs in order to reduce the risk associated with cultivation and
stimulate production.84
We argue that in order to understand the trajectory of cotton
production in Brazil, these programs have to be taken into account. Therefore, also the
government‟s price support programs will be described before and after the restructuring of
the sector.
Traditional Sector Structure
Market Structure for Purchase of Cotton
In the traditional sector pre-mid-1990s, cotton was mainly cultivated by small and middle-
sized farmers who either directly or through intermediaries sold their seed cotton to ginneries.
According to Barros & Beltrão (2008), the market for purchase of seed cotton pre-mid-1990s
could be characterized as an oligopsony, i.e. a market comprising few buyers.85
Ginners had
considerable bargaining power under which farmers had little opportunity to influence the
price. Moreover, cotton farmers did not gain from delivering cotton of good quality. However,
if they delivered cotton of low quality, they could receive a lower price. Another sources
indicates that ginneries only paid farmers based on weight, fully leaving out the influence of
quality in setting the price.86
The gains from cotton cultivation thus did not seem to accrue to the producers in the
traditional sector structure, but to other downstream agents.87
We can furthermore conclude
that producers in the traditional structure had poor incentives to deliver cotton with good
quality. Nonetheless, producers did benefit from a government support program that
guaranteed a minimum price for their seed cotton. Given the high volatility of the cotton
84
Interview Ministry of Agriculture (2011-07-19). 85
Barros & Beltrão (2008), p. 1274. 86
BNDES (1997), p. 2. 87
There does not seem to exist any data from which we can calculate exactly how large share of the FOT price –
i.e. ex-ginnery – producers receive.

27|84
price, this program was essential for keeping producers in business during periods of low
market price. This program is the subject to which we now turn.
Government Price Support programs
The first price interventions for agricultural commodities in Brazil were introduced in the
1940s, when PGPM was established together with a governmental intervention agency CFP,
today known as CONAB.88
Since the beginning, PGPM has operated through various
instruments to establish minimum prices, using both credit programs and direct governmental
purchases (AGF).89
In the 1980s, the minimum price of seed cotton was set in relation to
production costs. AGF was the main instrument used to establish the minimum price and
purchases were carried out by CFP. In order to reduce the high cost associated with
warehousing of purchased cotton the government also offered marketing loans – EGF –
enabling farmers to withhold their cotton seed in periods of low market price. The farmers
could then, at the end of the loan term, sell their cotton at the market price and repay the loan,
or sell their product directly to CPF receiving the minimum guaranteed price.90
AGF was
however associated with high administrative and warehousing costs, and, most notably, the
program demanded a large amount of resources in order to finance the purchases. In 1985 for
example, the AGF alone accounted for purchases of 1 000 000 tons of seed cotton and in 1988
for purchases of 200 000 tons.91
At the end of the 1980s the price support program became a
heavy burden for the government‟s budget and furthermore, the required funds contributed to
inflation. Thus, as the financial ability of the Brazilian government was curtailed, the
minimum prices froze and by 1990 the price had fallen by 50 % compared to its level in 1981.
The freeze of the minimum price in the beginning of the 1990s contributed to a large extent to
the collapse of cotton production. Therefore, in response, the government continued, during a
few years, despite monetary and fiscal restrictions, to support agricultural production through
price interventions and preferential loans.92
Once again, however, these interventions led to
high costs of warehousing and fiscal stress. At this time, it became apparent that agricultural
price support policies needed to be reformed.
88
Cruz (2007), p. 4; OECD (2005), p. 71. 89
Cruz (2007), p. 4-7. 90
OECD (2005), p. 71-73. 91
CONAB (2011-08-01). 92
OECD (2005), p. 73, 76.

28|84
Current Market Structure
Market Structure for Purchase of Cotton
Today, cotton cultivation is mainly carried out by commercial firms in the Cerrado that have
control over the crop until processed to cotton lint. The market that is of interest to study is
therefore the market for purchase of cotton lint.
A producer can choose to sell cotton lint either directly or through a co-operative to a buyer.
Most producers choose to sell through co-operatives as these organizations provide services
that can be of benefit when commercializing the crop. By uniting in co-operatives producers
take advantage of economies of scale and can thereby inter alia employ professional managers
that help the members to commercialize their cotton. Producers are free to be members in
several co-operatives if preferred. When this is the case, they simply choose to sell their
cotton through the co-operative that offers the best contact. In practice these co-operatives
help producers to find buyers and elaborate information upon which producers can base their
selling decision, e.g. market prognosis. Co-operatives also have an advantage in that they can
sell larger quantities of cotton than single producers can do individually. Thereby, the
bargaining power in negotiations with buyers increases. In the Cerrado, the first co-operative
uniting cotton producers for commercializing of cotton was UNICOTTON, created in 1998 in
Mato Grosso.93
Today UNICOTTON represents 10 % of the total production in Brazil.
Producers also benefit from other entities when commercializing their cotton. IMEA created
in 1998 is one good example. The institute, created by producers, is a non-profitable
organization that aims at contributing to the development of the sector.94
IMEA provides
information and strategic analyses of which crops that are profitable to cultivate for each
season. Producers also receive market analyses and statistics on which their investment
decisions can be based.
Producers choose between selling cotton for the domestic market or for export. When selling
for the domestic market, brokers serve as intermediaries between the seller and the domestic
textile industry. For this service they receive a commission of generally 0.1 % of contract
value. Brokers thereby have incentives to offer as lucrative contracts as possible to producers.
93
UNICOTTON offers far more services than just commercialization, for example classification. 94
Interview IMEA (2011-07-13).

29|84
Producers can sell directly to the domestic industry as well, but this is less common. When
selling for the export market, producers sell their cotton to traders. There are however some
traders that sell cotton to the domestic industry as well. There are currently about fifteen
traders active on the cotton market, of which the majority entered the market in the early
2000s. Between these traders there exists a competitive environment and we find no reasons
to suspect that the producers do not receive a fair market price.95
In May 2010 a new trader entered the market, named Libero Commodities.96
This newly
established trader is a co-operative founded by producers representing 75 % of the
Brazilian cotton producers. Through this establishment the competition among the traders will
most likely increase further.97
Nevertheless, cultivating cotton entails a large risk associated with the volatile cotton price. In
order to handle this risk producers generally sell their cotton in advance using futures
contracts. Through this contract the producers hedge against future price fluctuations and can
thereby operate in a more secure environment. About 60 % of the Brazilian cotton production
is sold through this mechanism before harvest and some 15-20 % is sold already before
planting.98
Future contracts are usually used more frequently when selling to traders than for
the domestic industry. A disadvantage of using future contracts, though, is that the market
price may be higher than the exercise price when the contract expires. When this occurs, the
contract hinders the seller from taking advantage of the more lucrative market price.
According to the current president of ABRAPA, there were many producers that could not
take advantage of the high cotton price for this reason.99
95
The price traders receive when selling the cotton for export is not known to the public. Calculating the share
producers receive of the price offered to traders is therefore difficult. To calculate it indirectly is also hard since
all traders sell with future contracts. Therefore, we cannot simply take the spot world market price as an estimate
for the price offered to traders. 96
Interview Libero Commodities (2011-07-13). 97
The producers will thus soon know the previously unknown margin of the traders, as Libero Commodities
operate on the market with the same conditions as the other traders. 98
Interview COOALESTE (2011-07-06); Interview IBA (2011-07-22); Interview Libero Commodities (2011-
07-13). 99
G1 (2008-08-27).

30|84
Current Governmental Price Support Policies
The current price support program is inspired by the support program active in the US until
1988 and stems from a number of policy revisions implemented in 1996.100
In contrast to the
previous program, based on covering production cost, the current system aims at reducing
price instability while maintaining domestic prices at around world market levels. A further
goal is to reduce the fiscal burden of the system, while providing a small subsidy to producers
suffering high cost associated with underdeveloped infrastructure.101
This new price support
system operates through an interaction of various forms of governmental purchases, price
equalizations and credit support programs as delineated in Chart 3. We will now go through
the main instruments operating to ensure the minimum guaranteed cotton price.
AGF is the traditional price support program in Brazil and consists of direct governmental
purchases carried out by CONAB. In the current system, the volume of purchases is limited
by the budgetary funds allocated to the program for each season.102
The program is mostly
active when periods of excessive domestic supply coincide with limited export
opportunities.103
The cotton stocks acquired by CONAB are then ideally sold to the domestic
market when the domestic supply is weak and import is limited.
In 1996 the government introduced a government sell option contract. The aim of this
instrument was to extend the government‟s commitment to protect producers from price falls,
despite facing limited budgetary resources, while reducing the direct purchases carried out
through AGF.104
Producers and co-operatives can buy the put option, announced by CONAB
usually during harvest, by paying a price, called premium, at a public auction. The contract
gives the holder the right to sell the cotton in the future for a predestinated price, called an
exercise price, comprising the minimum price plus storage costs, when the contract expires.105
100
OECD (2005), p. 77. 101
Ibid, p. 19. 102
OECD (2005), p. 77. 103
Stefanelo (2005), p. 56-57. 104
Ibid, p. 35-36, 77-78. 105
Bitencourt et al (2008), p. 8.

31|84
The holder of the contract chooses to exercise the option if the market price at this time is
below the exercise price. In this case CONAB is responsible for buying the cotton for the
exercise price. In order to further reduce direct purchases, however, the government initiates
auctions where CONAB may buy back or transfer the option.106
In the first case – Recompra
dos Contratos de Opção de Venda – the government bays back the option from the option
holder in a reversed auction. The producer or co-operative then sells the cotton on the market
for the market price and receives the difference between market price and the exercise price
established in the option contract from the government. In the second case – Repasse dos
Contratos de Opção de Venda – the government pays a subsidy to a third party that assumes
responsibility for buying the cotton if the contract is exercised. Through these mechanisms,
the government minimizes the potential direct purchases associated with the option contract
while fewer financial resources are required.
106
Stefanelo (2005), p. 81.

32|84
PEP – introduced in 1996 – is another instrument that serves to reduce budgetary funds and
public stockholding while guaranteeing the minimum price.107
In auctions arranged by
CONAB, commercial buyers of cotton are offered a premium. The premium represents the
difference between the minimum guaranteed price and the price the buyer is willing to pay.
The buyer who is willing to accept the lowest premium in the auction wins. The producer then
receives a payment equal to the minimum price and the buyer receives the cotton. In this way
the government avoids making actual purchases.
For the 2004/2005 season a new option contract was released. This option contract – PROP –
is similar to the government sell option with the difference that in this case it is commercial
buyers that purchase the cotton, and not the government.108
The role of the government is
instead to organize auctions establishing the parties of the option contract.
In 2006 a new instrument for cotton price support was introduced – PEPRO – under the
influence of lobbying from ABRAPA.109
The premium is a subvention paid by the
government to producers and co-operatives that meet the requirements of ICMS. The
premium is based on the difference between the market price and the minimum guaranteed
price and paid to the producers when the market price is below the minimum guaranteed
price. A key difference with this program compared to the previous programs is that it
promotes exports by compensating producers when the US$ weakens in relation to the R$.110
In Table 1 the years in which the minimum price support was active is shown by charting the
development of the ESALQ/BM&F and the minimum price from 1997 until June 2011. The
ESALQ/BM&F price, which is the price in São Paulo, is higher than the price at farm gate but
can serve as reference price for regional cotton prices if transport costs are subtracted.
As shown by Figure 3, the ESALQ/BM&F price has been substantially higher than the
minimum price only in 2003, 2004 and 2011. All other years since 1997, the minimum price
support was active. In Table 1 we can further see that the minimum price support was
107
OECD (2005), p. 82. 108
Ibid, p. 79, 82. 109
ABRAPA (2008), p. 30. 110
Bitencourt et al (2008), p. 10.

33|84
0
20
40
60
80
100
120
140
19
97
19
98
19
99
20
00
20
01
20
02
20
03
20
04
20
05
20
06
20
07
20
08
20
09
20
10
20
11
R$
Year
Figure 3. Brazilian Cotton Prices Minimum price ESALQ/BMF
Source: CONAB, CEPEA/ESALQ.
Table 1. Public Intervention in the Brazilian Cotton Sector
Year Production AGF Options Executed PEP PROP PEPRO Total (b+c+d+e+f) Total/Production
a) b) c) d) e) f) g) g)/a) (%)
1990/1991 716.80 - - - - - - 0.0 %
1991/1992 667.10 - - - - - - 0.0 %
1992/1993 420.30 10.51 - - - - 10.51 2.5 %
1993/1994 483.90 5.52 - - - - 5.52 1.1 %
1994/1995 537.10 1.51 - - - - 1.51 0.3 %
1995/1996 410.00 4.19 - - - - 4.19 1.0 %
1996/1997 305.80 0.68 - - - - 0,68 0.2 %
1997/1998 411.00 0.11 - 170.03 - - 170.14 41.4%
1998/1999 520.10 70.05 45.65 229.50 - - 345.19 66.4%
1999/2000 700.30 0.47 30.27 245.52 - - 276.26 39.4 %
2000/2001 938.80 0.26 - 289.06 - - 289.32 30.8 %
2001/2002 766.20 - - 224.94 - - 224.94 29.4 %
2002/2003 847.50 5.29 - 153.00 - - 158.29 18.7 %
2003/2004 1309.40 - - - - - - 0.0 %
2004/2005 1298.66 - - 28.30 - - 28.30 2.2 %
2005/2006 1037.86 4.48 - 197.70 272.20 - 474.38 45.7 %
2006/2007 1524.00 0.39 - 1.80 - 461.70 463.89 30.4 %
2007/2008 1602.20 1.05 - - - 728.90 729.95 45.6 %
2008/2009 1213.70 - - - - 1023.70 1023.70 84.3 %
2009/2010 1194.10 - - - - 792.20 792.20 66.3 %
2010/2011 1835.00 - - - - - - 0.0 %
Source: CONAB, OECD (2005).

34|84
inactive from 1990 until the 1997/1998 season. The crisis of the cotton sector led the
government to initiate support to stimulate production that year and the minimum price was
raised with 7 % in 1997 as the program became active.111
According to our calculations 41 %
of total production benefited from the support in 1997 and in 1998 the share was 66 %. If we
take into account the option contract offered in 1998 than 91.6 % of total production was
covered by the minimum price support. It is further shown that the price support later
decreased somewhat progressively until 2003 to rebound again in 2005 to reach a cover of 84
% of production in 2008. Initially the minimum guaranteed price was established using PEP,
often in combination with EGF, and in 1998 and 1999 through the government sell option
contract. The PROP was used only one year, in 2005, and since then the instrument used for
establishing the minimum price has been PEPRO.
We thus find the government price support to be a crucial component for the rebound of
cotton production in 1997. Cotton producers who were operating in an uncertain environment
and facing low margins benefited from the reassurance that they would receive a minimum
price. Without this guarantee it is not certain that producers would have invested in cotton
production in such large extent as was done.
Credit and Input Provision
Cotton production in Brazil is to a large extent dependent on the availability of credits.
Credits are used to finance overall production costs and inputs. Compared to other crops,
cotton cultivation is expensive. Cotton cultivation faces up to 3 times as high production costs
as soy and up to 4.5 times as high production costs as corn.112
The major reasons for the high
production costs are the long cycle of cotton cultivation of 180-210 days in Brazil, the
widespread presence of diseases and pests and the poor soil fertility in the Cerrado. The
reorientation of production to Cerrado further increased the demand for financial resources, as
production became mechanized and capital-intensive. The poor availability of affordable
credits has at times been a major constraint to production. Today, the highest production costs
are costs for fertilizers and pesticides.
111
BNDES (1997), p. 4. 112
Interview Ceres Consultoria Agronômica (2011-07-08).

35|84
Credit Provision pre-1990s
Government support
Provided by the Brazilian government, rural credit has been the primary instrument for
assisting the Brazilian agriculture.113
The credits are provided through various programs in the
National Rural Credit System – SNCR – initiated in 1965. SNCR has since then played an
important role in the development of the agricultural sector by provision of subsidized credits.
In response to the macro-economic crisis in the 1980s, however, the credit support needed to
be reduced in order to combat inflation. The government subsequently introduced an
indexation of the loans granted. The indexation resulted in higher interest rates, and as the
output prices lagged in adjusting to hyperinflation, farmer‟s repayment capacity profoundly
fell. A severe debt accumulation followed and in 1995 the value of non-performing loans
reached 30 % of the total rural credit. The threat of spillover effect to the private bank sector,
lobbying from the agricultural sector and the social impact of the debt accumulation led the
government to initiate a debt rescheduling in the mid-1990s. After a number of negotiations,
it was decided in 2001 to extend the repayment period until 2025. It is now estimated that
approximately half of the overall benefits to farmers in Brazil from 1995-2004 stemmed from
this debt rescheduling.114
The crisis resulted in an 80 % decrease in credits from the 1980s to the 1990s.115
For cotton
producers that already faced low prices and higher production cost during the 1980s,
reduction of credits became yet another factor contributing to the collapse of production. The
debt crisis and hyperinflation led producers to seek alternative types of credits when the
public support curtailed.116
This process was facilitated by the liberalization and opening of
the economy as producers gained freer access to foreign markets. The legacy of
macroeconomic uncertainty is still present, though. Today, interest rates offered by domestic
commercial banks are still high and producers are generally forced to seek other financial
solutions. Subsidized credits from governmental programs still play a role although
alternative ways of accessing capital has increased significantly since the 90s.
113
OECD (2005), p. 88-90. 114
Ibid, p. 19. 115
Helfand & de Rezende (2001), p. 5-6. 116
OECD (2005), p. 91.

36|84
Current Channels for Financing Inputs
Today, producers have three main sources providing credits. These sources are public credit
support, national and international private banks and agribusiness.
Public Credit Support
Currently, the public credit support, SNCR, is administrated by the three largest banks in
Brazil – Banco do Brasil, Banco do Nordeste and Banco da Amazônia – in co-operation with
298 federal, state and co-operative banks that provides credits supported by the government to
agricultural producers.117
SNCR operates through various kinds of programs and cotton
producers have access to three categories of credits: production, marketing, and investment
credits.118
The maximum amount a single cotton producer has access to for each season, all
programs added, is 600 000 R$.119
In relation to overall cost this amount is small. Therefore,
it is mainly small producers that make use of these credits, i.e. about 30 % of all producers.
The main programs relevant for cotton producers are:
EGF is a marketing loan closely integrated with the minimum price system.120
EGF is used
when the market price is lower than the minimum price. Through this loan producers in need
of cash are able to wait to commercialize their cotton while waiting for a more lucrative
market price in the future. The size of the loan is based on the quantity of cotton times the
established minimum price, and the term of the loan is typically 180 days. Harvested cotton
serves as collateral for the loan. Simultaneously with this credit it has been common for
cotton producers to enroll in sell option programs or the PEP, as the borrowers through these
means are guaranteed the minimum price when the loan term expires which enables them to
repay the marketing loan.121
The EGF has been widely applied in the cotton sector amounting
up to 30 % of total annual funds for the program in the early 2000s, covering up to 46 % of
total cotton production.122
CPR is another instrument created by the government that enables producers to use future
contracts as collateral for receiving cash advances from the Banco do Brasil or input advances
117
Ibid, p. 72, 88. 118
Ibid, p. 92. 119
BCB (2008-08-27). 120
OECD (2005) p. 92. 121
Ibid, p. 94-95. 122
Ibid, p. 94.

37|84
from agribusiness.123
Cash advances are limited to 50 % of the future contract value. CPR has
been successful in the sense that through this legally enforced document agricultural
producers have been helped to receive private financing. For cotton producers the CPR was
used most in 2004 and 2005 and accounted during these two years for 20 % of the SNCR
designated for the cotton sector.124
In addition to the marketing loans described above, producers have access to production
loans, which aim to stimulate production through provision of subsidized interest rates, of
8.75 % (2011).125
The loans are used to buy inputs for planting and have a term of about 9
months. It is estimated that cotton producers have received up to 75 million US$ annually
during the last decade in subsidized interest rates.126
Concerning investment credits, one of the
most important programs is MODERFROTA, which give loans to farmers buying agricultural
machinery. Since the mid-1990s, this program has played an important role in agricultural
mechanization in Brazil.127
National and International Private Banks
Interest rates offered by the domestic banks are high, about 20-25 %.128
Generally, producers
do not have such high margins and are therefore forced to seek financing through other
channels. The largest producers, about 10-15 % of all producers, have been able to access the
international banking market and subsequently managed to benefit from the lower
international interest rate.129
To some extent, producers have been able to benefit from
domestic banks through ACC, which enables producers that have sold their cotton for export
to use futures contracts to receive cash advances.
Agribusiness
As credit accessibility remains a challenge, alternative solutions have emerged where
producers to a large extent finance inputs through agribusiness. To some degree producers can
receive loans from agribusiness when purchasing goods. A good example is the multinational
company John Deere, the largest firm selling machinery in Brazil, which offers financial
123
OECD (2005), p. 88; USDA (2008-08-27). 124
Kiawu et al (2011), p.15. 125
FETAG-AL (2008-08-27). 126
ICAC (2011), p. 5. 127
OECD (2005) p. 104, referring to Brandão and Rezende (2004). 128
ICAC (2011), p. 7. 129
Interview Libero Commodities (2011-07-13); Interview IBA (2011-07-22).

38|84
solutions through its own bank. About 45 % of all machinery sold to cotton producers by the
firm is financed through the John Deere Bank.130
One alternative financial method is to use
future contracts as collateral when buying inputs. Producers can thereby gain access to inputs
before planting, and later pay for the purchase when receiving the payment for the cotton
specified in the future contract. In this way, producers can access inputs used for planting
even though they may not have access to cash or credit at that time. When credit accessibility
has been particularly scarce, producers have sometimes had the opportunity to pay firms
selling inputs with cotton. This method, called barter, has been particularly used when buying
pesticides.131
However, cotton producers have not managed to obtain adequate financing through these
sources described above. The lack of available credits has been and still is one of the major
obstacles producers face. In 2007/2008 the difficulty of obtaining credits resulted in a 25 %
decrease in area for 2008/2009.132
Due to the lack of financial possibilities in that season,
producers switched to soy cultivation.133
Estimates indicate that cotton producers financed 40
% of the production from their own pocket in 2008/2009, comparing to an estimated average
of 7 %.
The Role of Co-operatives
In order to reduce cost of inputs, most producers organize in co-operatives. In this way, larger
quantities can be bought at a lower the price. One successful example is UNICOTTON which
has managed to reduce pesticide costs by 30 % for its members.134
Another example is the co-
operative CCAB that was created in order to reduce the costs of fertilizers and pesticides.
Today, CCAB unites 69 000 producers from different agricultural sectors and represents 65 %
of cotton production.135
Initially the co-operative managed to reduce the price for fertilizers
by approximately 15 %. The market for fertilizers is controlled by a few companies and for
this reason producers today have a lower possibility of influencing the price, which has
increased significantly. The role of co-operatives has been further extended to include
130
Interview John Deere (2011-07-04). 131
ABAPA (2008-08-27). 132
ABRAPA (2010), p. 104. 133
Hrapsky & Autry (2009), p. 3. 134
UNICOTTON (2008-08-27). 135
MDIC (2008-08-27).

39|84
production of certain inputs. The co-operative COOPERBIO is an example of this and was
recently created to produce energy that could be used by its members.136
In the delineation of this process indicator, we have presented the channels through which
producers access credits and inputs. According to the conceptual framework, access to capital
and inputs is influenced by co-ordination among the actors in the sector. We can conclude
though, that even though producers do collaborate, e.g. to reduce input prices, access to
capital remains low. It thus appears as if access to credits is mainly determined by exogenous
factors and that the bottleneck of accessible credits mainly stems from the poorly developed
financial sector in Brazil.
Research
The objective of research in the Brazilian cotton sector has always been to increase viability
of cotton cultivation, and research has recently also contributed to environmentally friendly
technologies. In order for research to be efficient, it has to contribute to higher fiber quality,
higher productivity, lower input costs, region-specific technologies as well as resistance to
diseases and pests. Research is of critical importance to satisfy these aims and its importance
stems from two sources. Firstly, input costs are relatively high in cotton cultivation and
research must therefore aim to lower these costs.137
Secondly, diseases tend to mutate over
time, and research must thus continue to infinity as new technologies always have
to be developed to counter new threats.
The Development of Research through Time
Research in the Traditional Sector Structure
Prior to the restructuring of the cotton sector in the 1990s, research had mainly been public. It
all began in 1921 when the Ministry of Agriculture recognized the importance of promoting
improvement of varieties, as cotton always has been subject to diseases and pests impeding
productivity.138
Owing to this recognition, the first genetic improvement program was
initiated by the public institution IAC in the state of São Paulo in 1924, aiming at developing
136
COOPERBIO (2008-08-27). 137
Bélot et al (2005), p. 492. 138
Freire et al (2007b), p. 267.

40|84
region-specific technologies.139
In the 1970s, new public institutions emerged with similar
aims, inter alia IAPAR in Paraná (1972), EPAMIG in Minas Gerais (1974) and Embrapa
Algodão in Paraíba (1975).140
Some private research initiatives were taken as well before the
restructuring in the 1990s – e.g. by INFAOL and Algodoeira São Miguel141
– but these were,
as we later will show, of limited importance in comparison to public actors‟ research
contributions.
Arrival of the Boll Weevil in the 1980s
Coinciding with the debt crisis and the end of the ISI period in the late 1980s, a severe
outbreak of the boll weevil occurred.142
The pest soon turned out to be the most devastating
pest in Brazil‟s cotton history as substantial decreases in yields followed as a consequence of
its arrival.143
Embrapa Algodão quickly realized the severity of the pest and began to conduct
research on alternative crops for cotton producers.144
Since the boll weevil not only was a
nation-specific pest, but also had migrated to Argentina and Paraguay, it soon evoked
international attention. This led to the birth of an internationally co-ordinated research project
headed by the international organizations ICAC and CFC.145
The first steps of this project
were taken in 1995, when the projects‟ participants – in Brazil‟s case IAC, IAPAR, Embrapa
Algodão and Instituto Biológico – were summoned to a workshop at IAPAR‟s headquarters in
Londrina, Paraná. This workshop had two aims; the first was to present existing knowledge of
the pest and the second was to “define the division of work between participating
institutions”.146,147
As the project progressed, three more workshops were held to present the
findings. All the countries involved benefited from the project, as the project resulted in
productivity-increasing and environmentally friendly pest management technologies, i.e.
integrated pest management. These new technologies were later transferred to extension staff
in the participating countries, and have since then contributed to an improvement of Brazilian
cotton cultivation.148
139
IAC (2008), p. 36. 140
IAPAR (2010), p. 9; Embrapa Algodão (2000), p. 9-10; EPAMIG (2011-08-20). 141
Junior (1996), p. 157. 142
Embrapa Algodão (2000), p. 11-12. 143
Praça (2007), p. 6; Sendin & Stadler (2002), p. 2. 144
Embrapa Algodão (2000), p. 11-12. 145
Stadler (2001), p. 4-8. 146
Sendin & Stadler (2002), p. 6. 147
The quote was translated from Portuguese to English by the authors. 148
Stadler (2001), p. 45-48.

41|84
Intensification of Research
Public research institutions would still prove to have a significant role in the new sector
structure, but the involvement of the private sector was soon to become increasingly
pronounced as cotton cultivation entered a new phase. When the relocation of cotton
cultivation began in 1988, no varieties adapted to the Cerrado‟s ecological conditions had yet
been developed.149
Traditional varieties were not productive enough in the new environment,
and Grupo Itamarati – which often is referred to as the pioneer of cotton cultivation in the
Cerrado – hence began importing varieties from Israel. Embrapa Algodão was later invited to
evaluate the results of the newly imported varieties, but neither the productivity nor the
quality was high enough in order for cultivation to be viable. Grupo Itamarati and Embrapa
Algodão therefore established a public-private partnership (PPP) in 1989 to increase viability
of cotton cultivation in the Cerrado. In the three-year period 1989-1991, the PPP evaluated 70
varieties, both imported varieties – for instance from the US and Egypt – as well as nationally
developed varieties from IAPAR, IAC and EPAMIG. The PPP bore fruit in 1992 as the new
variety CNPA ITA 90 had been developed. According to Suinaga (2003), much of the
development of cotton cultivation in the Cerrado can be traced back to this variety, owing to
the rise in productivity the variety led to.150
CNPA ITA 90 was more than twice as productive
as traditional varieties, and the variety was also adapted to mechanized harvest which was
perfect for the large-scale system that became implemented in cotton cultivation in the 1990s.
Although the development of CNPA ITA 90 was a huge step forward for cotton cultivation in
the Cerrado regions, yields fell dramatically in the second half of the 1990s due to the advent
of the “blue disease”.151
Cotton producers then realized that co-ordinated research investments
would be needed so as to assure the profitability of cultivation, and research thus began to be
conducted within foundations in order to combat diseases and pests. The first foundation in
which cotton producers united – together with Grupo Itamarati and Embrapa Algodão – was
within Fundação MT in Mato Grosso (1995),152
and a new PPP was hence established. From
this point onward, new foundations began to emerge throughout the Cerrado, inter alia
Fundação GO in Goiás (1997), IMAmt in Mato Grosso (1998), Fundação BA in Bahia (1999)
149
Freire (2007), p. 27-29; Freire et al (2007b), p. 269-276; Suinaga (2003), p. 14. 150
Suinaga (2003), p. 14. 151
Freire (2007), p. 34-35. 152
Fundação MT was already founded in 1993 to satisfy the needs of soy producers. However, as cotton started
to encounter difficulties, the foundation extended its research activities to cotton in 1995.

42|84
and Fundação Centro-Oeste in Mato Grosso (2000).153,154
All of these foundations established
PPPs with Embrapa Algodão with a shared aim, namely to develop region-specific varieties
by cross-breeding already existing varieties, and CNPA ITA 90 became a vital variety utilized
to satisfy that aim.
What also spurred the creation of new foundations was a change in legislation, which would
also give incentives for multinational companies to invest in research in the Cerrado.155
In
1997, a new law on variety protection – LPC – was implemented, awarding royalties to actors
that develop varieties. As LPC together with the “blue disease” spurred the creation of new
foundations, multinational companies – such as Bayer, Syngenta, Dow and the joint-venture
MDM156
– entered the market, all with the objective of developing new varieties and pest
management technologies.157
Some of these multinational companies have established PPPs together with Embrapa
Algodão, such as Monsanto (1997) and Syngenta (2010),158
and a few of them have also got
gene-modified varieties (GMVs) approved for commercialization by CTNBio, the public
institution for testing and approving GMVs. CTNBio began approving these varieties in 2005
after a change in biosafety legislation and has until now approved five types of GMVs –
Bollgard® I, Bollgard
® II, Round-up Ready
®, WideStrike™ and LibertyLink
® – originating
from Monsanto, Dow and Bayer.159
Evidence of GMVs‟ effects on the environment and on
productivity has so far been ambiguous, but most evidence nevertheless points at positive
economic and environmental effects.160
As GMVs display both resistance against pests and
resistance against weedicides that otherwise would kill the plant, cotton producers can thus
decrease the amount of chemicals used and so decrease input costs in cultivation.161
153
Freire et al (2007b), p. 42-43, 268-291; FACUAL (2006), p. 15-17; Freire (2004); Bélot et al (2005), p. 483. 154
The partnerships between Embrapa Algodão and Fundação MT, and Embrapa Algodão and Fundação Centro-
Oeste ended in 2000 and 2006 respectively. However, the rest of the partnerships mentioned in this chapter have
been intact since their establishment. 155
Bélot et al (2005), p. 482-483; do Nascimento & da Silva (2008), p. 5-6. 156
MDM was a joint venture between Grupo Maeda, Delta & Pine Land and Monsanto. As the joint venture was
acquired by Monsanto in 2007, we will henceforth refer to MDM as Monsanto. 157
Monsanto (2010), p. 4-7; Bayer (2008), p. 8; Syngenta (2010), p. 19. 158
Branco & Vieira (2010), p. 43; Syngenta (2010), p. 36. 159
Monsanto (2010), p. 6-8; Bayer (2010), p. 9-11; Levy (2009), p. 1; CIB (2009), p. 9-11; Krieger (2006), p. 1. 160
See for instance Krieger (2006), CIB (2009), Torres (2008) and Nunes (2009). 161
Interview IMAmt (2011-06-21).

43|84
Another private actor that has contributed research in the Cerrado is the co-operative
COODETEC; the research began as a project within an umbrella organization for co-
operatives OCEPAR in partnership with CIRAD – a French development agency – in Paraná
(1990). 162
As a result of an initiative taken by the thirty-eight co-operatives members of
OCEPAR, COODETEC became an own entity in 1995.163
COODETEC then continued both
the partnership with CIRAD and the research project conducted by OCEPAR, aiming at
developing new technologies. COODETEC extended its research activities to the Cerrado in
1999, and in 2008, COODETEC‟s research program was acquired by IMAmt.164
This
acquisition has been successful as new varieties with resistance to diseases, higher fiber
quality and higher productivity have been developed as a consequence.
Partnerships have also become more common between public institutions, such as between
IAPAR and IAC.165
The reason for participating in these kinds of partnerships, according to
de Almeida, researcher at IAPAR, is that the potential for technological development is
increasing. Owing to that actors involved in a partnership get access to each other‟s
germplasms,166
each actor has a bigger set of genes to work with and thus also a bigger
potential of developing improved varieties. This is a huge advantage and also a reason for
why PPPs and other types of partnerships have become increasingly common in research.167
Developments in Ginning
In the mid-2000s, it was revealed that cotton producers had problems obtaining the quality
needed to satisfy the demand on the world market.168
As ginning has a significant impact on
fiber quality, and as quality of fibers determines both prices received as well as demand for
cotton lint, associations – i.e. AGOPA in Goiás, ABAPA in Bahia and AMPA in Mato Grosso
– invested in a research program so as to improve the ginning process.169
The program
involved replacing old cotton gins with new gins in order to increase cotton quality, and
analyses were carried out during the period 2005-2006 to evaluate the results of the project.170
162
Freire et al (2007b), p. 298; Bélot et al (2005) ; p. 482-483; Alves (2006), p. 55. 163
COODETEC (2011-08-13); Biotecnologia (2011-08-15), p. 4-7. 164
Filho et al (2010), p. 10-11. 165
Interview IAPAR (2011-08-02). 166
Germplasms are collections of seeds and genes used when developing new varieties. 167
Interview Monsanto (2011-07-29); Interview Embrapa Algodão (2011-07-25); Interview IAPAR (2011-08-
02). 168
UNICOTTON (2006), p. 9. 169
Chanselme et al (2007), p. 2; Interview IAC (2011-08-02). 170
Chanselme et al (2007), p. 3, 16-20.

44|84
5
16
4 12
17
24
5
7
20
5
28
0
10
20
30
40
50
60
70
80
90
1970-1979 1980-1989 1990-1999 2000-2009
Am
ou
nt
of
Var
ieti
es
Decade
Figure 4. Amount of Varieties Developed, by Decade Private Foundations Private & Multinational Companies Public Public Private Partnerships
Source: See Appendix 1.
The net effect turned out to be positive, as the amount of thrash diminished, and middling and
reflectance improved, but the amount of neps increased.171
There is therefore still much room
for improvement, but as this program identifies the strong and weak links in the supply chain,
it will be possible, according to Ribas (2009), to obtain enhanced viability of cotton
cultivation with similar programs in the future.172
Amount of Varieties Developed
The number of developed varieties is the indicator we use to assess the performance of
research, and as can be seen in Figure 4, the development of new varieties has increased
substantially during the past two decades. Comparing the 1990s to the 1980s, an increase of
183 % can be noted. A similar comparison between the 2000s and the 1990s shows an
increase of 156 %, and the most impressive comparison would be to compare 1990-2009 to
1970-1989 where the total increase reaches 481 %.
During the 1970s and 1980s, the private sector had a limited role, when actors such as
Algodoeira São Miguel and INFAOL developed varieties, but these actors did not develop
171
Neps are tangled clusters of fibers. See section 5.1.5.2. for a description of fiber characteristics. 172
Ribas (2009), p. 53-56.

45|84
any more varieties after the 1970s. Instead, the public sector had the main role prior to the
restructuring and has since the 1970s developed more varieties with each decade. When the
restructuring took place in the 1990s, more varieties were developed as a result of new
partnerships, co-ordinated research investments by producers and the advent of multinational
companies. This trend was positive until approximately ten years ago when the
amount of developed varieties began to display a negative trend (see Appendix 1).173
The reason for this negative trend mainly stems from the fact that producers often only pay
royalties to the actors developing varieties once. Since most of the producers have their own
ginneries, many producers keep the seeds after processing. Producers can then either plant
these seeds the following season, or sell the seeds to other producers. By these means,
producers have the possibility of only buying seeds once and thereafter reproducing the seeds
themselves. Reproducing seeds of varieties developed before the implementation of LPC is
permitted according to the law, but difficulties are encountered when producers reproduce
seeds of varieties developed after the law‟s implementation. As earlier mentioned, actors
developing varieties are entitled to royalties, but as approximately 50 % of the seeds planted
each year have been reproduced by producers, opportunities to receive royalties are often lost.
Disincentives to develop new varieties have therefore appeared. The reproduction of seeds
can also lead to other problems, e.g. to the erosion of the seed market as has been the case of
soy in Rio Grande do Sul where dealers had to withdraw their activities. The Ministry of
Agriculture has realized that the law is vaguely defined and is therefore currently revising the
law in order to tackle the problem.174
It is hence likely that the law soon will be changed and
that more royalties in the future will be paid.
Despite problems of receiving royalties, however, co-ordination between producers, as well as
co-ordination between public and private actors on the market, has ensured a substantial
increase in varieties available for production. Consequently, production has become both
more viable and more environmentally friendly since the mid-1990s.
Extension
In order to cultivate cotton efficiently, cotton producers must possess knowledge in many
areas, such as how to manage pests, weeds and diseases, what products to use against them,
173
Bélot et al (2005), p. 491; Interview IMAmt (2011-06-12); Interview Ministry of Agriculture (2011-07-21). 174
Interview Ministry of Agriculture (2011-07-21).

46|84
how these threats impede production, how to manage soil, fertilization, harvesting etc.175
The
aim of extension, i.e. technical assistance, is to transfer knowledge of these areas to cotton
producers, enabling them to take decisions themselves regarding what has to be done in the
fields. Extension is therefore an important factor in cotton production, as efficient extension
results in increased viability.
Historical Perspectives on Extension
Traditional Extension Services
Extension activities began in the 1960s as a public initiative through the institutions CATI in
the state of São Paulo and EMATER in Paraná and in the Northeast.176
These institutions
provided extension to all cotton producers in Brazil, except in Paraná, where approximately
50 % of the producers received extension from co-operatives. These co-operatives – e.g.
COAMO, COOPAVEL and the umbrella organization for co-operatives OCEPAR – were
financed by cotton producers. Public institutions and co-operatives were to provide extension
until the 1990s, when public institutions and co-operatives terminated their extension
activities. Existing extension practices had not been adequate enough to handle the boll
weevil, and this pest – along with the debt crisis – ensured the demise of extension in the
traditional sector structure.
Emerging Actors in the New Sector Structure
When cultivation moved to the Cerrado in the 1990s, extension services also went through a
substantial change. Most of the to-be cotton producers in the Cerrado had never cultivated
cotton before the restructuring, and they therefore demanded knowledge in order to make
cultivation possible.177
Since cotton producers now were larger, they had access to more
capital and could therefore afford to hire private consulting firms to satisfy their needs.178
Hence, along with the expansion of cotton cultivation, the number of consulting firms in the
Cerrado also increased.179
Today, it is estimated that approximately a thousand consultants
provide extension in the Cerrado, and these consultants stay for months and even up to a year
175
Sanchez (2005), p. 1-2; Interview Ceres Consultoria Agronômica (2011-07-08). 176
Junior (1996), p. 157; Interview Cotton Consultoria (2011-07-27); Interview CATI (2011-07-28). 177
Interview Cotton Consultoria (2011-07-27). 178
Interview Ceres Consultoria Agronômica (2011-07-08). 179
Interview Cotton Consultoria (2011-07-27).

47|84
on the farms in order to solve problems encountered in the field.180
Many of the consulting
firms – such as Círculo Verde in Bahia and Ceres Consultoria Agronômica in Mato Grosso –
also have their own cultivation fields where they can assess new management technologies.181
Additionally, consulting firms often have access to a portion of a cotton producer‟s area
where they can observe how new management technologies work in practice.182
More capital does not only contribute to the possibility of hiring consulting firms, but the
largest cotton producers also have a full-time employed agronomist on their farms.183
These
agronomists provide extension and assist cotton producers in decision-making. The largest
cotton producers thereby vertically integrate extension in their activities and do not require the
services of consulting firms when they employ an agronomist.
Despite this fact, all cotton producers in the Cerrado receive extension from consulting
firms.184
In Mato Grosso do Sul and Minas Gerais, consulting firms are the only actors on the
market providing extension services. In Mato Grosso, Goiás and Bahia, however, extension is
also provided by associations and foundations. The reason is that cotton producers need
extension advice that is more general – i.e. extension that deals with problems all cotton
producers confront – and cotton producers therefore make co-ordinated investments in
extension services.185
Extension is therefore also provided by the foundations Fundação GO
and Fundação MT, and by the associations ABAPA and AMPA through their affiliated
foundations FUNDEAGRO and IMAmt.186
The associations have so-called ATRs – i.e.
extensionistas – that travel to farms regularly to collect data, and cotton producers are later
informed about problems in cultivation through field days, reports, courses etc.187
Extension services are to a certain extent also provided by multinational pesticide
companies.188
In the end of the 1990s, companies such as FMC, BASF and IHARA entered
the Brazilian cotton sector and when these companies sell pesticides to cotton producers,
180
Interview Ceres Consultoria Agronômica (2011-07-08). 181
Interview Ceres Consultoria Agronômica (2011-07-08); Interview ABAPA (2011-08-10). 182
Interview Ceres Consultoria Agronômica (2011-07-08). 183
Interview IMAmt (2011-06-21). 184
Interview AMIPA (2011-08-10); Interview AMPASUL (2011-08-10); Interview Cotton Consultoria (2011-
07-27) 185
Interview AMPA (2011-08-01). 186
Alves (2006), p. 55; Interview AGOPA (2011-08-10). 187
Interview ABAPA (2011-08-10); Interview IMAmt (2011-06-21). 188
Interview IMAmt (2011-06-21).

48|84
information on how to use these pesticides is also provided when delivered.
IHARA does not only provide extension when pesticides are sold, but the company also
participated in the creation of the group GBCA in 2000.189
The aim of the group‟s creation
was to gather the most experienced consulting firms in the Brazilian cotton sector so as to
concentrate all existing knowledge on how to solve problems in cotton cultivation. GBCA
currently consists of one extensionista from IHARA and twelve consultants from consulting
firms throughout Brazil, representing approximately 60 % of total cotton production. GBCA
regularly holds meetings to discuss problems in cultivation, and trips are also organized to
different regions in order to collect information about new management technologies. These
technologies are later evaluated in the consultants‟ own regions in order to assess the new
technologies‟ adaptability. The group therefore exhibits considerable multiplier effects as
knowledge created at one place in Brazil becomes dispersed to the rest of the country through
GBCA. Since consultants within GBCA co-ordinate their actions aiming at optimizing
cultivation, cotton producers have benefited substantially from the creation of
GBCA as both cotton producers and the group share the same aim.
Our findings indicate that the adequacy of extension has risen during the past two decades.
Co-ordination between producers, between consulting firms as well as co-ordination between
countries – i.e. the internationally co-ordinated project headed by ICAC and CFC mentioned
in research – have assured that cotton producers currently receive high-quality extension
services. Owing to these factors, extension services are today more viable than in the
traditional sector structure.
Quality Control & Marketing
Well-functioning quality control and marketing systems influence demand positively and are
vital in order for a cotton sector to stay competitive on the world market190
. When supplying
cotton of high quality, cotton producers receive a premium – i.e. a higher price – and together
with a well-functioning marketing, commercialization of cotton is facilitated due to cotton
producers gaining a good reputation. Cotton also has to compete with synthetic fibers – e.g.
polyester – and delivering cotton of high quality is therefore paramount for cotton producers‟
189
IHARA (2010), p. 36; Interview Ceres Consultoria Agronômica (2011-07-08); Interview Cotton Consultoria
(2011-07-27); GBCA (2011-08-12). 190
Tschirley et al (2009), p. 21-26, 90-91.

49|84
survival on the market. Textile companies also benefit from well-functioning quality control
as these companies gain the possibility of buying the adequate cotton needed for a specific
fabric.191
Textile companies can thus adjust their spinners to the fabric being produced and by
these means optimize the production process.
History of Quality Control and Marketing
Traditional Quality Control
Quality control was mainly carried out by public institutions and co-operatives before the
demise of the traditional sector structure. The public institutions BM&F in the state of São
Paulo and CLASPAR in Paraná – founded in 1918 and 1957 respectively – were the two first
institutions to conduct quality control in the Brazilian cotton sector.192
In the 1970s, co-
operatives in Paraná – such as COCAMAR, COAMO and COAGEL – also began conducting
quality control.193
Although these actors classified cotton and aimed at raising the awareness
of quality‟s importance among cotton producers, both the quality and reputation of Brazilian
cotton were rather poor, partly due to the traditional sector structure‟s characteristics and
partly due to inadequate quality control.194
Since cotton producers operated in an oligopsony,
buyers of cotton had a larger bargaining power than cotton producers, leaving cotton
producers without rewards for delivering high-quality cotton. No premium was to be received
for delivering cotton of high quality, and when delivering low-quality cotton, cotton
producers were penalized by receiving a lower price. Additionally, quality control was
inadequate due to deficient equipment and the character of classification. The equipment used
for classifying cotton was both slow and far from standardized, and much classification was at
the time manual and visual.195
These classification methods were not precise enough to
provide a multidimensional and adequate analysis of cotton quality. Cotton producers thus did
not have the incentives needed to produce cotton of high quality, as many fiber characteristics
could not be measured and no premia could be collected.
191
Sestren & de Lima (2007), p. 765, 772; Ferreira et al (2008), p. 1238. 192
Brannstrom (2010), p. 174; CLASPAR (2011-08-23). 193
Interview FBET (2011-08-02); Interview COCAMAR (2011-08-22); Interview COAMO (2011-08-23). 194
Barros & Beltrão (2008), p. 1273-1274; Interview EISA Interagrícola (2011-08-12). 195
Filho & Alves (2007), p. 79-80; Interview EISA Interagrícola (2011-08-12); Interview FBET (2011-08-02).

50|84
Improvements in Quality Control
Quality control remained fairly unchanged until the end of the 1990s, when new actors on the
market emerged to provide classification services. After cotton cultivation had moved to the
Cerrado, cotton producers had nowhere to classify cotton, except for public institutions and
co-operatives in the states São Paulo and Paraná. As these states were geographically distant
from the Cerrado, classifying cotton was expensive for cotton producers since cotton had to
be transported long distances to be classified.196
In order to reduce transport costs, cotton
producers decided to make co-ordinated investments in classification laboratories in co-
operatives and associations throughout the Cerrado. These investments led to the creation of
the co-operatives ALLCOTTON in Goiás (2000), and UNICOTTON (1998) and
COOPERFIBRA in Mato Grosso (2001),197
and to the inauguration of laboratories within the
associations AMIPA in Minas Gerais (2006), AMPASUL in Mato Grosso do Sul (2007),
ABAPA in Bahia (2009) and AGOPA in Goiás (2011).198
Furthermore, other actors moved to
the Cerrado to classify cotton owing to cotton producers‟ demand. BM&F has today affiliates
throughout the Cerrado, and Kuhlmann – an international company that came to Brazil in
2006 – also provide classification services.199
Coinciding with the emergence of new actors on the market, electronic and more precise
classification methods – i.e. high-volume instruments (HVI) – also became adopted.200
As
mentioned earlier, classification in the traditional sector structure was not standardized, and
manual and visual methods were utilized. In the new sector structure however, a significant
standardization has occurred owing to a new law that came into force under the Ministry of
Agriculture in 2002.201
This law – RTCA – aimed at stimulating exports through adopting
international standards in cotton classification, and HVI began to be adopted by actors on the
market already in 2003. Today, all cotton is classified using HVI and the method measures
fourteen characteristics of cotton quality.202
As HVI is more precise in comparison to manual
and visual methods, more characteristics of cotton are taken into account in classification.
196
Interview AMIPA (2011-08-10). 197
dos Santos et al (2005), p. 2; Interview UNICOTTON (2011-07-08); Interview COOPERFIBRA (2011-08-
10); ALLCOTTON (2011-08-24). 198
Interview ABAPA (2011-08-10); Interview AMIPA (2011-08-10); Interview AMPASUL (2011-08-10);
Interview; AGOPA (2011-08-10). 199
Interview Kuhlmann (2011-08-12); Interview COOPERFIBRA (2011-08-10). 200
Interview FBET (2011-08-02). 201
Fiedler (2007), p. 821. 202
Interview Multigrain (2011-07-08); Interview UNICOTTON (2011-07-08).

51|84
Since cotton producers are also more aware of cotton quality, they have greater incentives to
produce high-quality cotton.203
Classification of cotton is not compulsory according to RTCA, but if classification is to be
carried out, regulations and norms under the law have to be followed. Cotton graders204
need a
long education to classify cotton, and being acknowledged and licensed by the Ministry of
Agriculture is necessary.205
The norms – specified as ISO 9001:2008 – set standards for inter
alia color of clothes used and temperature in the laboratory, and usage of equipment.
According to international standards, the equipment used in classification must be calibrated
every hour in order to avoid distorted quality measures.
Since all actors classifying cotton do not possess the technical capacity required to follow all
these norms and regulations, some of these actors receive technical assistance and regular
audits from other actors on the market. Two of the actors providing technical assistance and
auditing are Kuhlmann and FBET.206
FBET is a foundation founded by textile companies in
1967, aiming at providing classification services to textile companies. As FBET was founded
so early, the foundation has both credibility and experience, and the co-operative
COOPERFIBRA and the associations AMIPA and AGOPA therefore have partnerships with
FBET. Since Kuhlmann also has many years of experience, the associations AMPASUL and
ABAPA have similar kinds of partnerships with Kuhlmann. In these partnerships, FBET and
Kuhlmann provide technical assistance and auditing to ensure that norms and regulations are
followed. If any of the norms or regulations are not met, FBET and Kuhlmann have the right
to terminate the partnerships, and some actors have already had to withdraw their
classification activities owing to incredibility. Since credibility is vital in order for co-
operatives and associations to classify, these actors have incentives to ensure that norms and
regulations are followed. The partnerships mentioned above have been intact so far.
Marketing Improves Reputation
Due to the poor reputation of Brazilian cotton in the end of the 1990s, Brazil encountered
difficulties exporting cotton.207
As cotton cultivation expanded, cotton producers began
203
Filho & Alves (2007), p. 79-80. 204
A cotton grader is a person whose job is to classify cotton. 205
Sestren & de Lima (2007), p. 773; Interview UNICOTTON (2011-07-08). 206
Interview Kuhlmann (2011-08-12); Interview FBET (2011-08-02). 207
Interview EISA Interagrícola (2011-08-12).

52|84
supplying more cotton than was demanded by the domestic textile industry.208
Since cotton
producers had nowhere to sell the remaining cotton owing to its reputation and lack of
networks abroad, AMPA initiated marketing activities in 1998, aiming at promoting Brazilian
cotton on the world market. When ABRAPA was founded in 1999, ABRAPA took over and
extended AMPA‟s marketing activities, and executives from all associations affiliated to
ABRAPA currently engage in marketing activities in order to promote Brazilian cotton
abroad.
Marketing activities are carried out in two ways, either by going abroad to attend international
events or by receiving guests from other countries. ABRAPA has so far both participated in
international conferences – arranged by e.g. ICA, ICAC and ITMF – and received guests from
other countries, for instance from China, Japan and Indonesia.209
When ABRAPA receives
guests, ABRAPA generally gives an overview of Brazilian cotton cultivation, and organizes
trips to ginneries and cotton fields in order to display ginning and harvesting for the visitors.
ABRAPA is not the only association that has conducted marketing activities, since ANEA –
an association founded by traders in 1999 – also has promoted Brazilian cotton abroad.210
In
2006, ANEA – together with BM&F – initiated a program to improve the reputation of
Brazilian cotton on the world market, as well as to ensure that traders prioritize cotton of the
highest quality for exports.211
If traders obey the rules of the program, they are allowed to
participate. However, if any of the traders damage the program‟s credibility, ANEA has the
right to exclude that trader.
When cotton production began to increase in the end of the 1990s, marketing activities were
of vital importance for cotton producers. As the domestic market became saturated and the
reputation was poor, co-ordinated marketing efforts through AMPA, ABRAPA, and ANEA
and BM&F ensured that cotton producers had markets to which they could sell their cotton.
Without these marketing efforts, producers would have been less prone to produce more as
domestic demand already was satisfied. Co-ordinated marketing activities thereby constituted
208
Interview AMPA (2011-08-01); Interview ABRAPA (2011-07-21). 209
ABRAPA (2010), p. 36; ABRAPA (2008), p. 26-29; ABRAPA (2007), p. 34-43; Interview AMPA (2011-08-
01). 210
ABRAPA (2008), p. 26-29; Interview EISA Interagrícola (2011-08-12). 211
ABRAPA (2008), p. 26-29; ANEA (2011-08-24).

53|84
an important factor in increasing production, as these activities improved the reputation of
Brazilian cotton and thereby made new markets accessible.
Performance in Quality
As out-lined above, fourteen characteristics of cotton are measured when classifying cotton.
These characteristics can be divided into two groups, namely intrinsic and extrinsic
characteristics.212
Intrinsic characteristics are those only affected by the type of cotton
cultivated, i.e. the inherent traits of a variety. Some of the intrinsic characteristics entail
resistance, elongation, fiber length, uniformity of fiber lengths and micronaire, which is a
measure of fiber maturity and fineness. Extrinsic characteristics on the other hand are those
affected by external factors, for instance weather, harvesting and ginning. Reflectance,
middling (whiteness), leaf grade (amount of foreign material and contamination) and the
amount of neps (clusters of tangled fibers) are some examples of extrinsic characteristics.
Cotton has to be of high quality – intrinsically and extrinsically – for a cotton producer to get
a high premium. In order for actors on the market to know how to value cotton of a certain
quality, base quotations have been implemented.213
Base quotations determine what quality
cotton should exhibit in order to be valued according to the world market price. If cotton
would be of higher quality than the base quotation, cotton producers receive a higher price
than the world market price and vice versa. This rule applies to all characteristics except for
micronaire, where the best quality is the base quotation.
In Figures 5a-5f, quality data is presented. Middling and leaf grade, resistance and uniformity,
show tendencies of improvement, and micronaire has been relatively stable. Fiber length has
also improved during the past two decades, but has historically been longer (see Figures 5e
and 5f). The reason that cotton had longer fibers before the 1990s is that another species of
cotton was cultivated, namely tree cotton.214
As upland cotton – which had shorter fibers –
was more adapted to mechanized harvesting, this species substituted tree cotton in the
restructuring, and the fiber length therefore decreased. Shorter fibers may seem to have
212
Ferreira et al (2008), p. 1248-1249; Ferreira & Freire (2008), p. 878-879; Marquié et al (2004), p. 7; de
Santana et al (2004), p. 216-219. 213
Interview UNICOTTON (2011-07-08). 214
Buainain & Batalha (2007), p. 50; Interview CATI (2011-07-28); Interview Embrapa Algodão (2011-07-25).

54|84
26
26,5
27
27,5
28
28,5
29
29,5
30
30,5
31
19
92
19
93
19
94
19
95
19
96
19
97
19
98
19
99
20
00
20
01
20
02
20
03
20
04
20
05
20
06
20
07
20
08
20
09
20
10
20
11
20
12
Ave
rage
Re
sist
ance
(gf
/te
x)
Year
a) Resistance Average Resistance Trend Base Quotation Limits
2,5
3
3,5
4
4,5
5
5,5
19
92
19
93
19
94
19
95
19
96
19
97
19
98
19
99
20
00
20
01
20
02
20
03
20
04
20
05
20
06
20
07
20
08
20
09
20
10
20
11
20
12
Ave
rage
Mic
ron
aire
Year
b) Micronaire Average Micronaire Trend Base Quotation Limits
79
79,5
80
80,5
81
81,5
82
82,5
83
83,5
84
19
92
19
93
19
94
19
95
19
96
19
97
19
98
19
99
20
00
20
01
20
02
20
03
20
04
20
05
20
06
20
07
20
08
20
09
20
10
20
11
20
12
%
Year
c) Uniformity Uniformity Trend Base Quotation
0
10
20
30
40
50
60
70
80
90
19
92
19
93
19
94
19
95
19
96
19
97
19
98
19
99
20
00
20
01
20
02
20
03
20
04
20
05
20
06
20
07
20
08
20
09
20
10
20
11
20
12
%
Year
d) Middling & Leaf Grade Over Base Quotation Over & Within Base Quotation Trends
26
26,5
27
27,5
28
28,5
29
29,5
30
30,5
31
19
92
19
93
19
94
19
95
19
96
19
97
19
98
19
99
20
00
20
01
20
02
20
03
20
04
20
05
20
06
20
07
20
08
20
09
20
10
20
11
20
12
Ave
rage
Fib
er
Len
gth
(m
m)
Year
e) Fiber Length Average Fiber Length Trend Base Quotation
23
24
25
26
27
28
29
30
31
32
33
34
19
20
19
25
19
30
19
35
19
40
19
45
19
50
19
55
19
60
19
65
19
70
19
75
19
80
19
85
19
90
19
95
20
00
20
05
20
10
20
15
20
20
Ave
rage
Fib
er
Len
gth
(m
m)
Year
f) Fiber Length, Historical View Average Fiber Length Base Quotation
Figure 5. Performance in Quality
Source: BM&F, ANEA, CONAB, Kuhlmann, USDA (2011), Gonçalves & Gonçalves (2007) and Filho & Alves (2007). Note: A detailed description on how the data was calculated is given in Appendix 2.
54|8
4

55|84
been a disadvantage for cotton producers as longer fibers equal a higher premium, but as
textile companies implemented new technologies adapted to shorter fibers coinciding with the
restructuring, the loss of fiber length was only of minor importance.215
The two factors directly contributing the most to improvements in quality during the past two
decades are research and mechanized harvesting. Co-ordinated research investments have
contributed to longer fibers and also ensured improvements in uniformity and resistance
through the development of new varieties.216
Mechanized harvesting has decreased
contamination and has therefore contributed to better results in middling and leaf grade, as
cotton today is both whiter and less contaminated. According to Beltrão, researcher at
Embrapa Algodão, the reflectance of cotton has also improved over the past two decades.
Moreover, co-ordination between producers and between associations, co-operatives and
other private actors on the market has increased the awareness of quality among producers
since standardized classification methods have been adopted. Quality – along with reputation
– has therefore improved substantially during the past two decades, giving Brazilian cotton a
competitive edge on the world market.
215
Before the restructuring, mainly ring spinning was used by textile companies. Coinciding with the
restructuring of the cotton sector, textile companies adopted rotor spinning, which did not demand as long fibers
as ring spinning. The loss of fiber length was therefore not severe for cotton producers as textile companies‟
demand still was satisfied. 216
Interview Embrapa Algodão (2011-07-25).
56|84
6. Assessing the Brazilian Cotton Sector: Outcome
Indicators217
In the previous section we have described and linked concepts vital for sector performance to
sector organization. How well these concepts and services, i.e. research, extension, quality
and input provision, are carried out is hypothesized to influence the outcome of cotton
production. In this section this outcome will be analyzed by focusing on production costs,
yields and overall competitiveness.
Cost Base
Whether production is sustainable or not from an economical perspective is largely influenced
by the overall cost of production. Overall company costs, according to the analytical
framework, are influenced by how well the process indicators perform. For example research
would have a positive impact on production costs as new varieties more resistant to pests and
diseases can be developed. New varieties could further increase production per hectare, which
would imply lower costs. An efficient extension can decrease production costs as producers
gain new knowledge of more efficient production methods and on information on how to
handle overall problems related to cultivation.
Production Costs
In this section we will examine how overall production costs have changed during the last
decade. We will pay special attention to the cost of pesticides and fertilizers, as these are the
largest costs for producers in Brazil.
As shown in Figures 6a-6d, the average production cost in Brazil has increased by 23 % since
1999 to 2009, from approximately 1.9 R$/kg to 1.5 R$/kg, according to our calculations. We
can further conclude that overall costs peaked in 2004-2005, likely under influence of the
increased costs for fertilizers and pesticides. The trend in overall production costs may come
as a surprise considering the good performance on research and extension. There are however
many factors affecting production costs that are exogenous to the framework we use, such as
weather conditions, exchange rate fluctuations, changes in taxation etc. Most likely, costs
217
Due to lack of adequate data, the final outcome indicators macro-economic impact and profitability of
companies will not be presented in this assessment.

57|84
0%
10%
20%
30%
40%
50%
60%
19
99
/20
00
20
00
/20
01
20
01
/20
02
20
02
/20
03
20
03
/20
04
20
04
/20
05
20
05
/20
06
20
06
/20
07
20
07
/20
08
20
08
/20
09
20
09
/20
10
Shar
e (
%)
Season
c) Inputs' Share of Total Costs Fertilizers Pesticides Fertilizers and Pesticides
0
0,2
0,4
0,6
0,8
1
1,2
1,4
1,6
1,8
19
99
/20
00
20
00
/20
01
20
01
/20
02
20
02
/20
03
20
03
/20
04
20
04
/20
05
20
05
/20
06
20
06
/20
07
20
07
/20
08
20
08
/20
09
20
09
/20
10
Co
sts
(R$
/kg)
Season
a) Average Total Costs Average Total Cost
00,05
0,10,15
0,20,25
0,30,35
0,40,45
0,5
19
99
/20
00
20
00
/20
01
20
01
/20
02
20
02
/20
03
20
03
/20
04
20
04
/20
05
20
05
/20
06
20
06
/20
07
20
07
/20
08
20
08
/20
09
20
09
/20
10
Co
sts
(R$
/kg)
Season
b) Costs of Pesticides Costs of Pesticides
0
0,05
0,1
0,15
0,2
0,25
0,3
0,35
0,4
19
99
/20
00
20
00
/20
01
20
01
/20
02
20
02
/20
03
20
03
/20
04
20
04
/20
05
20
05
/20
06
20
06
/20
07
20
07
/20
08
20
08
/20
09
20
09
/20
10
Co
sts
(R$
/kg)
Season
d) Costs of Fertilizers Costs of Fertilizers
Figure 6. Input Costs
Source: CONAB, Filho & Alves (2007).
57|8
4

58|84
would have increased even more if no research or extension had been carried out. The
only way to assess the exact impact of the process indicators would be to hold all other
variables constant over time, which they seldom are in real world. Drawing conclusions
therefore becomes harder.
We can conclude that costs for pesticides and fertilizers have increased by approximately
17 % and 163 % respectively. It is further shown that their share of total costs increased
by 45 % and 56 % respectively during 1999-2009. This does not necessarily mean that
the usage of pesticides or fertilizers, i.e. the quantity consumed in kg, has increased.
Instead the increased costs can stem from higher prices. Therefore, research and
extension may have resulted in decreased use of pesticides and thus contributed to lower
costs even though the actual costs of pesticides may have increased. The increased cost
for fertilizers can be explained by the increased domestic demand resulting from
increased production.218
The supply did not manage to meet this higher demand and thus
the price increased.
Yields
Cotton lint yields are a fundamental indicator of sector performance. The efficiency of
cotton cultivation influences both company profitability and sector competitiveness.
Yields are in turn influenced by the process indicators described in the previous section.
In this section the trends in yields and production will be presented.
Trends in Yields and Production
Figure 7 shows the trends in yields, production and the amount of area cultivated from
1976/1977 to the 2010/2011 season. As shown, the trend in production is positive from
1976/1977 to 1984/1985 but becomes negative from 1984/1985 to 1996/1997. Initially
the decline is mainly caused by the arrival and spread of the boll weevil in the mid-
1980s. From 1988 to the mid-1990s the decline is mainly an effect of the liberalization
of cotton trade, the freeze of government minimum prices and reduced credit support.
During this period the traditional sector collapsed. The effects on cotton production are
severe leading to a decline in production by 370.7 million tons, from a production of
218
Interview COABRA (2011-08-17).

59|84
0
500
1000
1500
2000
2500
0
500
1000
1500
2000
2500
3000
3500
4000
4500
19
76
/77
19
77
/78
19
78
/79
19
79
/80
19
80
/81
19
81
/82
19
82
/83
19
83
/84
19
84
/85
19
85
/86
19
86
/87
19
87
/88
19
88
/89
19
89
/90
19
90
/91
19
91
/92
19
92
/93
19
93
/94
19
94
/95
19
95
/96
19
96
/97
19
97
/98
19
98
/99
19
99
/00
20
00
/01
20
01
/02
20
02
/03
20
03
/04
20
04
/05
20
05
/06
20
06
/07
20
07
/08
20
08
/09
20
09
/10
20
10
/11
Yie
lds (kg/h
a) & P
rod
uctio
n (th
ou
sand
ton
s)
Are
a (t
ho
usa
nd
ha)
Season
Figure 7. Brazilian Cotton Area Production Yields
Source: CONAB.
674.5 million tons in 1983/1984 to 305.8 million tons in 1996/1997.
The relocation of production to the Cerrado and the resultant increase in production in
the 1997/1998 season leads to a trend break. As a result of research, new varieties were
developed, which for the first time enabled a larger production in the Cerrado.
Production is from this point onwards mechanized and carried out in large scale where
new technologies have been adopted. These factors increased productivity significantly.
At the same time cotton producers benefited from government support as minimum
prices and credit support were reintroduced. The positive trends in production and
productivity continue until today as research activities increase further and new varieties
are developed, albeit in a slower pace, and the new knowledge is efficiently transferred
to producers through private and associative extension. Price fluctuations and poor
access to credits have however resulted in three large production falls. The fall in 2005-
2006 was mainly a consequence of the decreased cotton prices. The international
financial crisis was the main cause of the last production fall in 2008/2009, as producers‟
access to capital sharply decreased. As a response to increased world market prices in
2010, estimated production for this season has reached a new record in Brazil with an
increase of almost 70 % in relation to last season.

60|84
Furthermore, in 2007/2008 the demand for fertilizers on the world market increased and at the
same time the domestic supply in Brazil could still not satisfy the domestic demand. These
factors consequently led to doubled fertilizer prices that year.
We thus conclude that the production cost has increased for cotton producers during the last
decade and the main reason for this increase seems to be increased fertilizer costs. Today,
fertilizer cost accounts for approximately 25 % of overall cost according to our calculations.
Overall Competitiveness
In this part of the analytical framework the competitiveness of the Brazilian cotton sector will
be examined. The section begins with a presentation on Brazil‟s comparative advantages and
disadvantages in cotton production. Thereafter, we will show Brazil‟s position on the world
market for 2009/2010. Lastly, Brazil‟s cotton trade will be presented together with the RCA
indicator of comparative advantage.
Comparative Advantages and Disadvantages
Brazil has a comparative advantage in agriculture that stems from the abundance of land.219
The area in the Cerrado alone accounts for 25 % of Brazil‟s land mass, and despite an already
large agricultural use of land there are approximately still 90 million hectares available for
cultivation.220
The possibility of extending the area for cotton cultivation is rare in an
international perspective. Together with China and Turkey, Brazil is one of a few countries in
the world with this possibility.221
The climate conditions in the Cerrado are ideal for cotton production. Cultivation benefits
from a regular rain period during the growing season from October to March, which allows
for cotton to be rain fed and not dependent on irrigation.222
This is an advantage, as cotton
plants need large amounts of water in order to grow. When the rain period is over in March,
the dry season follows. Cotton bolls then open and the plants are no longer exposed to rain,
which after the opening of the cotton bolls can contaminate the fibers. The well-defined rain
and dry periods are in this way ideal for cultivating cotton of high quality. The Cerrado being
219
OECD (2005), p. 22. 220
Macdonald (2010). 221
Bélot et al (2005) p. 492. 222
Interview Ceres Consultoria Agronômica (2011-07-08); Interview IMAmt (2011-06-21).

61|84
a savanna has furthermore a topography that permits mechanical farming, as adequate
machines cannot be used if the ground is steeper than 10 degrees.223
Cultivation in the Cerrado also has drawbacks. The poor soil fertility requires a large amount
of fertilizers and the winter lacks cold periods that kill off pests.224
For these two reasons the
usage of both fertilizers and pesticides is high.
The major obstacle for agricultural producers in Brazil is the poorly developed infrastructure.
Only 10 % of the roads in Brazil are paved and for cotton, which is solely transported by truck
within the country, often with a journey of 1500 km to the closest port, transportation costs
become high.225
For agricultural products in general, transportation costs amount to 15-20 %
of the FOB price.226
For this reason, the cost of transporting cotton in Brazil becomes about
twice as high as the cost of shipping cotton from Brazil to China.227
Brazil’s Cotton Production in World Market Perspective
Since the collapse of production in the 1990s, Brazil has emerged as a significant actor on the
world market. Figures 8a-8d show Brazil‟s position on the world market during 2009/2010. It
is shown that Brazil in that season had become the fifth biggest producers in the world
surpassed by only China, India, the US and Pakistan. In terms of yields, i.e. productivity,
Brazil has become the third most productive cotton producing country in the world, with the
highest yields of rain fed cotton of all countries.228
Concerning export, Brazil was the fourth
biggest exporter in 2009/2010 with most of the exports going to Asian countries. The biggest
importer of Brazilian cotton was Indonesia followed by South Korea, China, Pakistan and
Turkey. It is not unlikely that Brazil will become the fourth largest producer in the world
surpassing Pakistan for the 2010/2011 season. It will most likely also climb in the export
league this season.
223
Buainain & Batalha (2007), p. 22. 224
Interview Ceres Consultoria Agronômica (2011-07-08); Interview IMAmt (2011-06-21). 225
OECD (2005), p. 57; McCue (2010). 226
USDA (2008-.08-27). 227
McCue (2010). 228
Ibid.

6850
5050
2654 2019
1187
2009/2010
a) Production - World Top Ranking China India US Pakistan Brazil
2613
1390
820
433 420
2009/2010
b) Exports - World Top Ranking
US India Uzbekistan Brazil Australia
62|8
4
1844 1762
1480 1357 1313
2009/2010
c) Yields - World Top Ranking
Israel Australia Brazil Turkey Mexico
72345 66039
51763
23366 22717
2009/2010
d) Principal Destinations of Brazilian Cotton Exports
Indonesia South Korea China Pakistan Turkey
Figure 8. Brazil’s Position on the World Market
Source: ABRAPA (2010).

63|84
Measuring Overall Competitiveness
A direct indication of whether a sector is competitive or not comes from its ability to generate
surpluses,229
which can be calculated by using FOT or FOB costs and revenues. As this thesis
assesses how sector performance has changed over time, in relation to sector structure and
organization, a rather extensive FOT or FOB costs and revenues data, covering up to 20 years,
would be preferred. However, historical data on FOT or FOB costs and revenues does not
seem to exist. Therefore, we will measure cotton sector competitiveness indirectly under the
assumption that competitiveness can be “revealed” by observing trade patterns. The indicator
we will use is the revealed comparative advantage RCA.
There exist a number of different RCA measures.230
As Brazil both exports and imports cotton
we have chosen to use the RCA(3) index. The RCA(3) index is calculated for a single country
and refers solely to that country‟s own trade performance in a single commodity. The index is
calculated as follows:
Where X represents exports and M is imports and the index ranges from -1 to +1. If the index
is negative, it indicates that the country has a comparative disadvantage in that commodity
and if the index is positive the country has a comparative advantage. If the index gives values
around zero no clear conclusion can be made. As exports and imports, and thus also the
index, are affected by political restrictions on trade, we present the RCA values from 1988
and onwards as cotton trade liberalized that year.
Before we present the RCA values however, we show how exports and imports have changed
throughout the years. In Figure 9 it is shown that exports were high in the late 1960s, and as
already mentioned, Brazil became the third largest exporter in the world for a few years in the
late 1960s. In the beginning of the 1970s export fell as export restrictions were implemented.
When cotton trade liberalized in 1988, imports increased dramatically, indicating that
domestic production could not satisfy the textile industries‟ demand for cotton, which was
229
Tschirley et al (2010), p. 314. 230
Utkulu & Seymen (2004), p. 9.

64|84
0
100
200
300
400
500
600
700
19
60
19
62
19
64
19
66
19
68
19
70
19
72
19
74
19
76
19
78
19
80
19
82
19
84
19
86
19
88
19
90
19
92
19
94
19
96
19
98
20
00
20
02
20
04
20
06
20
08
20
10
Exp
ort
s an
d Im
po
rts
(th
ou
snd
to
ns)
Year
Figure 9. Exports & Imports Exports Imports
Source: USDA.
around 800 000 tons annually during the 1990s.231
In 1996, Brazil became the second largest
importer of cotton in the world. After two years without any exports, 1996 and 1997, Brazil
began exporting cotton again in 1998, as a result of expanded production in the Cerrado.
Since then exports have increased substantially and Brazil has grown to be one of the largest
exporters in the world.
Based on exports and imports shown Figure 9, the RCA index is calculated in order to
indirectly measure Brazil‟s comparative advantage in cotton production. As shown in Figure
10 the RCA value is close to or equal to -1 during the entire 1990s, indicating a comparative
disadvantage. As production moved to the Cerrado however, the new sector that emerged
managed to exploit the potential comparative advantage that Brazil indeed had in cotton
production. From that point onwards RCA value has increased and since 2003 the RCA has
been positive, indicating a comparative advantage.
231
CONAB (2011-08-01).

65|84
-1
-0,8
-0,6
-0,4
-0,2
0
0,2
0,4
0,6
0,8
11
98
7
19
88
19
89
19
90
19
91
19
92
19
93
19
94
19
95
19
96
19
97
19
98
19
99
20
00
20
01
20
02
20
03
20
04
20
05
20
06
20
07
20
08
20
09
20
10
20
11R
CA
Year
Figure 10. RCA RCA
Source: USDA.

66|84
7. Summary and Conclusions
In the mid-1990s, cotton production in Brazil collapsed. A decade later nonetheless, Brazil
had become the fifth largest producer and fourth largest exporter of cotton in the world. The
aim of this thesis has been to gain knowledge about the underlying factors behind this recent
success. For that purpose, we have used a framework which links performance with sector
organization and the associated degree of co-ordination and competition.
We have shown that the Brazilian cotton sector underwent a profound structural
transformation in the 1990s. Prior to this change, cotton was mainly grown in the southern
regions by small-scale farmers. The market for purchase of seed cotton was dominated by a
few ginneries, which offered low prices to farmers. Co-ordination within the sector was low,
resulting in poor extension, quality control and research. In the late 1980s, a series of
accumulated problems in combination with decreasing world market prices and ceased
governmental support had an adverse impact on production. Subsequently, production fell
sharply. Coinciding with the ongoing crisis, a new phase in the Brazilian cotton production
began when producers in the Cerrado started to seek crop rotation alternatives for soy
produced in the region. At this time there were no seeds on the market adapted to the specific
agro-ecological conditions in the Cerrado. Responding to this situation, producers started to
organize and fund research that could contribute to new varieties adapted to the regions‟
specific conditions. When the breakthrough finally came in the 1997/98 season, cotton
production expanded rapidly. Thanks to the new varieties, the more favorable climate in the
Cerrado could now be exploited. Furthermore, the topography in the Cerrado allowed for
mechanized production. Production from this point on was on a large scale where many
producers took advantage of the associated economy of scale and vertically integrated
ginning in their production. Simultaneously, a competitive market to which producers could
sell their cotton gradually emerged. Producers started to organize in co-operatives and as a
result co-ordination within the sector increased which facilitated provision of public goods
vital for production. A new structure thus emerged on which, we argue, the later success
rested.
In the new structure, co-ordination improved significantly on several levels of the market,
among producers, private consultants and traders. Research, extension, quality control and
marketing improved considerably owing to enhanced co-ordination. The change in market
67|84
structure for purchase of producers‟ cotton from an oligopsony to a competitive market has in
the meantime resulted in an altered incentive structure which has stimulated cotton
production, as producers now receive higher prices for their cotton. Producers have also
benefited from governmental support that helps offset low market prices, and the new
minimum price policy in Brazil has become more sustainable by requiring less public funds
since the revision in 1996. Altogether, these changes have resulted in both increased yields
and production, and Brazil has currently the highest yields in the world of all rain-fed cotton
sectors. These changes have enabled Brazil to become a significant and competitive actor on
the world market.
Despite the recent success, the Brazilian cotton sector faces several challenges. The
availability of affordable credits is low and transportation costs resulting from the poor
infrastructure remain high. Furthermore, production costs have increased during the last
decade mainly due to increased costs of fertilizers. Also, research activities within the sector
have recently slowed down. Brazil does indeed have a huge potential in cotton production and
is currently one of a few countries in the world with the possibility of increasing the area of
cultivation. We thus believe that further success will depend on how these challenges are met
in the future.

68|84
References
Articles and Books
ABRAPA (2004), A Saga do Algodão: Das Primeiras Lavouras à Ação na OMC, ABRAPA, Brasília, Distrito
Federal.
ABRAPA (2007), Relatório de Atividades 2007, ABRAPA, Brasília, Distrito Federal.
ABRAPA (2008), Relatório de Atividades: Biênio 2006-2008, ABRAPA, Brasília, Distrito Federal.
ABRAPA (2010), Relatório de Gestão: Biênio 2008-2010, ABRAPA, Brasília, Distrito Federal.
Alves, Lucilio Rogério Aparecido (2006), A Reestruturação da Cotonicultura no Brasil: Fatores Econômicos,
Institucionais e Tecnológicos, Universidade de São Paulo, Escola Superior de Agricultura “Luiz de Queiroz”,
Piracicaba, São Paulo.
Barros, Geraldo Sant‟Ana de Camargo Barros (2008), Brazil: The Challenges in Becoming an Agricultural
Superpower,” in Lael Brainard and Leonardo Martinez-Diaz (eds.)(2009), Brazil as an Economic Superpower?
Understanding Brazil’s Changing Role in the Global Economy, Brookings Institution Press, Washington, DC.
Barros, Geraldo Sant‟Ana de Camargo Barros (2009), Brazil: The Challenges in Becoming an Agricultural
Superpower,” in Lael Brainard and Leonardo Martinez-Diaz (eds.)(2009), Brazil as an Economic Superpower?
Understanding Brazil’s Changing Role in the Global Economy, Brookings Institution Press, Washington, DC.
Barros, Geraldo Sant‟Ana de Camargo Barros, Lucilio Rogério Aparecido Alves, Humberto Francisco Spolador,
Mauro Osaki, Daniela Bacchi Bartholomeu, Andreia Cristina De Oliveira Adami, Simone Fioritti Silva,
Guilherme Bellotti de Melo & Matheus Henrique Scaglica P. de Almeida (2007), The Brazilian Cerrado
Experience with Competitive Commercial Agriculture: A Critical Review, Background Paper for the Competitive
Commercial Agriculture in Sub–Saharan Africa (CCAA) Study, CEPEA/ESALQ, Piracicaba, São Paulo.
Barros, Maria Auxiliadora Lemos & Napoleão Esberard de Macêdo Beltrão (2008), Comercialização, in
Napoleão Esberard de Macêdo Beltrão &.Demóstenes Marcos Pedrosa de Azevedo (eds.)(2008), O Agronegócio
do Algodão no Brasil, Embrapa, Brasília, Distrito Federal. Vol. 2. pp. 1269-1277.
Batista, Silas (2011), Embrapa Lança Duas Novas Cultivares para a Cotonicultura Brasileira, Portal do
Algodão.

69|84
Bayer (2008), Reforçando as Colheitas: Contribuindo com a Produtividade, Brochura Corporativa 2007/2008,
Bayer CropScience.
Bélot, Jean, Ivo Marcos Carraro, Patricia C. de Andrade Vilela, Osmério Pupim Jr., José Martin, Pierre Silvie &
Catherine Marquié (2005), Novas Variedades de Algodão Obtidas no Brasil: 15 Anos de Colaboração Entre A
COODETEC e o CIRAD, Cadernos de Ciência & Tecnologia, Vol. 22. No. 2. pp. 479-494.
Bitencourt, Mayra Batista, Silvio Silvestre Barczsz & Andrei Almeida Andrade (2008), Análise da PGPM no
Mercado Brasileiro de Algodão em Pluma, Milho e Trigo, Utilizando Como Instrumento de Intervenção a AGF,
Contrato de Opção, PEP e PEPRO, XLVI Congresso da SOBER, Rio Branco, Acre.
BNDES (1997), Algodão: Crise e Retomada, Informe Setorial, Agroindústria, No. 11.
Branco & Vieira (2007), Inovação e Proteção às Patentes no Agronegócio, Custo Brasil.
Brandão, A. & G.C. de Rezende (2004), Brazilian Agriculture in the 1990s and Ahead: The Role of Government
Programmes to Support Development and Challenges Ahead, Background Paper Prepared for the
OECD.
Buainain, Antônio Márcio & Mário Otávio Batalha (eds.)(2007), Cadeia Produtiva do Algodão, Serie
Agronegócios, BINAGRI, Vol. 4.
Chanselme, Jean-Luc, Paulo Vicente Ribas & Bruno Bachelier (2007), Melhoria do Processo e das Práticas de
Beneficiamento de Algodão no Brasil, VI Congresso Brasileiro do Algodão, Uberlândia, Minas Gerais.
Cia, Edivaldo, Imre Lajos Gridi-Papp, Ederaldo José Chiavegato, Nelson Paulieri Sabino, Júlio Isao Kondo,
Maria Angelica Pizzinatto, Nelson Bortoletto & Luiz Henrique Carvalho (2001), Melhoramento do Algodoeiro
no Estado de São Paulo: Obtenção da Cultivar IAC 21, Revista de Ciências Agronómicas, Campinas, São Paulo.
Vol. 60. No. 1. pp. 9-17.
CIB (2009), Guia do Algodão: Tecnologia no Campo para uma Indústria de Qualidade, Conselho de
Informações sobre Biotecnologia.
Cruz, Kelma Christina Melo dos Santos Cruz (2007), As Intervenções Públicas de Apoio à Comercialização do
Algodão em Pluma Brasileiro na Safra 2005/06, XLV Congresso da SOBER, Conhecimentos para Agricultura
do Futuro, Londrina, Paraná.
de Almeida, Anna Ozório (2009), Exports, Energy, Food: The Multiple Functions of Brazilian Agriculture,
CeSPI, Working Paper 61, Paper Prepared for Presentation at the 2009 LASA Congress, Rio de Janeiro,.

70|84
de Santana, João Cecílio Farias, José Claudio da Silva Santana & Napoleão Esberard de Macêdo Beltrão (2004),
Fibras do Algodão, in Embrapa (2004), Algodão – 500 perguntas, 500 Respostas: O Produtor Pergunta, a
Embrapa Responde, Embrapa, Brasília, Distrito Federal. pp. 213-220.
do Nascimento, Andressa Fernandes & Juliana Cristina da Silva (2010), Melhoramento Genéteico do Algodoeiro
no Brasil; Breves Considerações, Enciclopédia Biosfera, Centro Científico Conhecer, Goiânia. Vol. 6. No. 11.
pp. 1-12.
dos Santos, João Celso, Eliza Emília Rezende Bernardo Rocha & Rosângela Mazzia Inocêncio Rodrigues
(2005), As Cooperativas Diante do Desafio de Manterem-se Fiéis aos seus Princípios Fundamentais, XLIII
Congresso da SOBER, Ribeirão Preto, São Paulo.
Embrapa (2003), Impacto das Novas Cultivares de Algodão sobre Área Plantada no Centro Oeste Brasileiro,
Embrapa Algodão (2000), 25 Anos: Gerando e Transferindo Tecnologia, Embrapa-CNPA, Campina Grande,
Paraíba.
Estur, Gérald (2006), Le Marché Mondial du Coton: Évolution et Perspectives, Macroéconomie et
Mondialisation, Cahiers Agricultures. Vol. 15. No. 1. pp. 9-16.
FACUAL (2003), Desenvolvimento de Novas Cultivares de Algodoeira para as Condições de Mato Grosso,
Safras 1998/1999, 1999/2000 e 2000/2001, Fundação MT & FACUAL.
FACUAL (2006), FACUAL: Ações Setoriais e Sociais 1998-2005, Cuiabá, Mato Grosso.
Farias, Francisco José Correia (2005), Índice de Seleção em Cultivares de Algodoeira Herbáceo, Universidade
de São Paulo, Escola Superior de Agricultura “Luiz de Queiroz”, Piracicaba, São Paulo.
Ferreira, Isaura Lopes & Eleusio Curvelo Freire (2007), Industrialização da Pluma, in Freire, Eleusio Curvelo
(ed.)(2007), Algodão no Cerrado do Brasil, ABRAPA. pp. 871-877.
Ferreira, Isaura Lopes, Eleusio Curvelo Freire, Armindo Bezerra Leão & Demóstenes Marcos Pedrosa de
Azevedo (2008), Industrialização, in Napoleão Esberard de Macêdo Beltrão &.Demóstenes Marcos Pedrosa de
Azevedo (eds.)(2008), O Agronegócio do Algodão no Brasil, Embrapa, Brasília, Distrito Federal. Vol. 2. pp.
1235-1268.
Fiedler, Hélvio Alberto (2007), Comercialização e Exportação do Algodão do Cerrado, in Freire, Eleusio
Curvelo (ed.)(2007), Algodão no Cerrado do Brasil, ABRAPA. pp. 821-852.

71|84
Filho, Joaquim Bento de Souza Ferreira Filho & Lucilio Rogério Aparecido Alves (2007), Aspectos Econômicos
do Algodão no Cerrado, in Eleusio Curvelo Freire (ed.)(2007), Algodão no Cerrado do Brasil, ABRAPA. pp.
53-89.
Filho, Joaquim Bento de Souza Ferreira, Lucilio Rogério Aparecido Alves & Luiz Cezar Bonfim Gottardo
(2010), Aspectos Econômicos do Algodão no Cerrado: Ajustes Estruturais e Consolidação, in Eleusio Curvelo
Freire (ed.)(2010), Algodão no Cerrado do Brasil, ABRAPA, Brasília, Distrito Federal.
Freire, Eleusio Curvelo (2004), Projeto: Estruturação Física do Campo Experimental de Primavera do Leste,
Primavera do Leste, Mato Grosso.
Freire, Eleusio Curvelo (2007), História do Algodão no Cerrado, in Freire, Eleusio Curvelo (ed.)(2007),
Algodão no Cerrado do Brasil, ABRAPA. pp. 21-52.
Freire, Eleusio Curvelo & Luiz Paulo de Carvalho (2004), Cultivares do Algodoeiro, in Embrapa (2004),
Algodão – 500 perguntas, 500 Respostas: O Produtor Pergunta, a Embrapa Responde, Embrapa, Brasília,
Distrito Federal. pp. 33-46.
Freire, Eleusio Curvelo, Joaquim Nunes da Costa & Francisco Pereira de Andrade & (1998), Recursos Genéticos
e Melhoramento do Algodão no Nordeste do Brasil, Recursos Genéticos e Melhoramento de Plantas para o
Nordeste Brasileiro, Campina Grande, Paraíba.
Freire, Eleusio Curvelo, João Luiz da Silva Filho, Francisco José Correia de Farias & Adelardo José da Silva
Filho (2007a), Ensaios Regionais de Competição de Cultivares do Cerrado Conduzidos no Mato Grosso na
Safra 2004/2005, VI Congresso Brasileiro do Algodão, Uberlândia, Minas Gerais.
Freire, Eleusio Curvelo, Camilo de Lelis Morello & Francisco José Correia de Farias (2007b), Melhoramento do
Algodoeira no Cerrado, in Eleusio Curvelo Freire (ed.)(2007), Algodão no Cerrado do Brasil, ABRAPA. pp.
267-317.
Gonçalves, José Sidinei & Simone Pereira Gonçalves (2007), Regulação e Progresso Técnico no Algodão
Meridional Brasileiro 1930-1990, XLV Congresso da SOBER, Conhecimento para Agricultura do Futuro,
Londrina, Paraná.
Guimarães, Alexandre Queiroz (2005), Historical Institutionalism and Economic Policymaking – Determinants
of the Pattern of Economic Policy in Brazil, 1930–1960, Bulletin of Latin American Research, Vol. 24. Issue 4.
Helfand, Steven M. & Gervásio Castro de Rezende (2001), The Impact of Sector-Specific and Economy-Wide
Policy Reforms on Agriculture, 1980-98, Working Paper 01-34, Department of Economics, University of
California, Riverside.

72|84
Hrapsky, Alan D. & Elizabeth Autry (2009), Cotton and Products Annual: 2009 Annual Cotton Report, Global
Agricultural Information Network Report, USDA.
IAC (2008), Ciência da Terra: O Instituto e a Pesquisa em Benefício da Qualidade de Vida, IAC, Campinas,
São Paulo.
IAPAR (2010), Ciência, Tecnologia e Inovação na Agropecuária do Paraná, IAPAR, Londrina, Paraná.
ICAC (2002), Production and Trade Policies Affecting the Cotton Industry, Washington DC, USA.
ICAC (2011), Production and Trade Policies Affecting the Cotton Industry, Washington DC, USA.
IHARA (2010), Relatório de Sustentabilidade 2010, IHARA, Agricultura é Nossa Vida.
Junior, Sebastião Nogueira (1996), A Importância da Pesquisa na Modernização da Cotonicultura, Agricultura
em São Paulo, SP, Vol. 43. No. 1. pp. 155-166.
Kelly, Valerie & David Tschirley (2008), Seed Cotton Market Structure and Cotton Sector Performance: Many
Lessons but No Fixed Prescriptions, WACIP, USAID.
Kiawu, James, Constanza Valdes & Stephen MacDonald (2011), Brazil’s Cotton Industry: Economic Reform
and Development, A Report from the Economic Research Service, USDA Outlook.
Krieger, Milton (2006), Uma Crítica à Liberação Imediata e sem Maiores Cuidados dos Transgênicos, II Fórum
Ambiental da Alta Paulista, ANAP, Tupã, São Paulo.
Levy, Clayton (2010), Pesquisa da Embrapa com Transgênico tem Gene Nacional, Portal do Algodão.
Lunardon, Maurício Tadeu (2000), Algodão, Secretaria da Agricultura e Abastecimento, Governo do Estado,
Paraná.
Marquié, Catherine, Joaquim Bento de Souza Ferreira Filho, Augusto Hauber Gameiro, Carlos Eduardo Cameiro
Ballaminut, Shirley Martins Menezes & Jean-Louis Bélot (2004), Análise Prospectiva dos Mercados da Fibra
do Algodão, na Indústria Têxtil, em Relação com a Qualidade, FACUAL, Primavera do Leste, Mato Grosso.
Massuda, Ely Mitite (2005) , Produção e Consumo de Algodão e as Indústrias de Fiações de Algodão no
Paraná, Departamento de Administração, Faculdade Integrada de Campo Mourão, Campo Mourão, Paraná.
Monsanto (2010), Perfil Monsanto, Monsanto Imagine.

73|84
North, Douglass C. (1990), Institutions, Institutional change and Economic Performance, Cambridge University,
United Kingdom.
Nunes, Daiane Heloisa (2010), Efeitos do Algodoeiro Geneticamente Modificado (Bollgard®) em Organismos
Não-Alvo, Universidade de São Paulo, Escola Superior de Agricultura “Luiz de Queiroz”, Piracicaba, São Paulo.
OECD (2005), OECD Review of Agricultural Policies: Brazil, Organization for Economic Co-operation and
Development, OECD Publishing.
Pedrosa, Murilo Barros, João Luiz da Silva Filho, Camilo de Lelis Morello, Eleusio Curvelo Freire, Arnaldo
Rocha de Alencar, Francisco Pereira de Andrade, Luis Gonzaga Chitarra, Francisco José Correia de Farias &
Francisco das Chagas Vidal Neto (2009), BRS 286; Cultivar de Algodão com Alta Produtividade de Pluma e de
Porte Baixo, Para Cultivo no Estado da Bahia, VII Congresso Brasileiro do Algodão, Foz do Iguaçú, Paraná.
Pessa, João Luiz Ribas (2007), A Organização do Produtor de Algodão, in Freire, Eleusio Curvelo (ed.)(2007),
Algodão no Cerrado do Brasil, ABRAPA. pp. 91-140
Poulton, Colin; Peter Gibbon, Benjamine Hanyani-Mlambo, Jonathan Kydd, Wilbald Maro, Marianne
Nylandsted Larsen, Afonso Osório, David L. Tschirley & Ballard Zulu (2004), Competition and Co-ordination
in Liberalized African Cotton Market Systems, World Development. Vol. 32. No. 3. pp. 519- 536.
Praça, Lilian Botelho (2007), Anthonomus Grandis Boheman, 1843 (Coleoptera: Curculionidae), Embrapa,
Brasília, Distrito Federal.
Ribas (2009), Situações de Impacto ao Desempenho e Produtividade do Beneficiamento no Brasil, VII
Congresso Brasileiro do Algodão, Foz do Iguaçú, Paraná.
Sanchez, Guido Aguilar (2005), Viabilização do Manejo de Pragas do Algodoeiro: Eficácia, Gestão, Custos,
Benefícios e Interação com o Setor Produtivo, V Congresso Brasileiro do Algodão, Salvador, Bahia.
Sendin, Paulo Varela & Teodoro Stadler (2002), Gestão de Parcerias de Desenvolvimento Tecnológico; O
Projeto Trinacional de Manejo Integrado do Bicudo Algodoeiro na Argentina, Brasil e Paraguai –
CFC/ICAC/04, XXII Simpósio de Gestão da Inovação Tecnológica, Salvador, Bahia.
Sestren, José Antônio & Jorge José de Lima (2007), Característica e Classificação da Fibra de Algodão, in
Eleusio Curvelo Freire (ed.)(2007), Algodão no Cerrado do Brasil, ABRAPA. pp. 765-819.
Stadler, Teodoro (ed.)(2001), Integrated Pest Management of the Cotton Boll Weevil in Argentina, Brazil and
Paraguay, Technical Paper No. 16. SENASA.

74|84
Stefanelo, Eugênio Libreloto (2005), A Política de Garantia de Preços Mínimos no Brasil: Classificação e
Operacionalização dos seus Instrumentos no Período 1990-2004, Tese de Doutorado, Universidade Federal de
Santa Catarina, Florianópolis.
Suinaga, Fábio Akiyoshi (2003), Impacto das Novas Cultivares de Algodão sobre Área Plantada no Centro
Oeste Brasileiro, Embrapa-CNPA, Campina Grande, Paraíba.
Syngenta (2010), Alimentar Nosso Maior Desafio 2010-2050: Relatório de Sustentabilidade, Relatório de
Sustentabilidade 2010, Syngenta.
Torres, Jorge B. (2008), Controle de Pragas do Algodoeiro: Expectativas de Mudanças, Ciência Agrícola, Vol.
8. No. 1. pp. 37-49.
Tschirley, David L., Colin Poulton & Duncan Boughton (2006), The Many Paths of Cotton Sector Reform in
Eastern and Southern Africa: Lessons from a Decade of Experience, Working Paper No. 18. Food Security
Research Project.
Tschirley, David L., Colin Poulton, Nicholas Gergely, Patrick Labaste, John Baffes, Duncan Boughton & Gérald
Estur (2007), Comparative Analysis of Organization and Performance of African Cotton Sectors: Learning from
Experience of Cotton Sector Reform in Africa, World Bank.
Tschirley, David L. Colin Poulton, Nicholas Gergely, Patrick Labaste, John Baffes, Duncan Boughton & Gérald
Estur (2010), Institutional Diversity and Performance in African Cotton Sectors, Development Policy Review,
28 (3). pp. 295-323.
Tschirley, David L. Colin Poulton & Patrick Labaste (eds.) (2009), Organization and Performance of Cotton
Sectors in Africa: Learning from Reform Experience, The International Bank for Reconstruction and
Development.
UNICOTTON (2006), Melhoria do Beneficiamento de Algodão no Estado de Mato Grosso: Relatório Final,
Algodão de Mato Grosso, Projeto FACUAL, Processo 146/2004.
USDA (2011), Weekly Cotton Market Review, Memphis, Tenessee. Vol. 93. No. 3.
Utkulu, Utku & Dilek Seymen (2004), Revealed Comparative Advantage and Competitiveness: Evidence for
Turkey vis-à-vis the EU/15, European Trade Study Group 6th Annual Conference, Nottingham.

75|84
Web Sources
ALLCOTTON - Cooperativa dos Produtores de Acreúna, accessed 2011-08-24.
Homepage: http://www.connectradio.com.br/allcotton/index.php
Specific Link: http://www.connectradio.com.br/allcotton/coophist.php
ABAPA – Associação Baiana dos Produtores de Algodão, accessed 2011-08-27.
Homepage: http://www.abapaba.org.br/
Specific Link: http://www.abapaba.org.br/noticia/275/
ABRAPA – Associação Brasileira dos Produtores de Algodão, accessed 2011-08-27.
Homepage: http://www.abrapa.com.br/
Specific Links: http://www.abrapa.com.br/associadas.asp & http://www.abrapa.com.br/legislacao.asp &
http://www.abrapa.com.br/quemsomos.asp
ANEA – Associação Nacional dos Exportadores de Algodão, accessed 2011-08-21.
Homepage: http://www.aneacotton.com.br/
Specific Link: http://www.aneacotton.com.br/qualityprogram.html
BCB – Banco Central do Brasil, accessed 2011-08-27.
Homepage: http://www.bcb.gov.br/
Specific Link: http://www.bcb.gov.br/pre/bc_atende/port/scr.asp
BTNE – Brazil Travel North East, accessed 2011-08-28.
Homepage: http://www.brazil-travel-northeast.com/
Specific Link: http://www.brazil-travel-northeast.com/maps-of-brazil.html
Biotecnologia - Ciência e Desenvolvimento, accessed 2011-08-15.
Homepage: http://www.biotecnologia.com.br/
Specific Link: http://www.biotecnologia.com.br/revista/bio10/bio10.pdf
CLASPAR - Empresa Paranaense de Classificação de Produtos, accessed 2011-08-23.
Homepage: http://www.claspar.pr.gov.br/
Specific Link: http://www.claspar.pr.gov.br/modules/conteudo/conteudo.php?conteudo=4
COCAMAR - Cooperativa Agroindustrial Maringaense, accessed 2011-08-23.
Homepage: http://www.cocamar.com.br/
Specific Link: http://www.cocamar.com.br/historia.php

76|84
COODETEC - Cooperativa Central de Pesquisa Agrícola, acessed 2011-08-13.
Homepage: http://www.coodetec.com.br/
Specific Link: http://www.coodetec.com.br/site.php
COOPERBIO – A Cooperativa Mista de Produção, Industrialização e Comercialização de Biocombustíveis do
Brasil Ltda, accessed 2011-08-27.
Homepage: http://www.cooperbio.com.br
Specific Link: http://www.cooperbio.com.br/artigos/artigos.php
Cotton 24/7 – Meistermedia Worldwide.
Homepage: http://www.cotton247.com/
Specific Articles:
Macdonald, Andrew (2009), Learning from History, Cotton 24/7, accessed 2011-08-27.
Macdonald, Andrew (2010), A Sleeping Giant Stirs, Cotton 24/7, accessed 2011-08-27.
McCue, Mike (2010), Country Report Brazil, Cotton 24/7, accessed 2011-08-27.
EPAMIG – Empresa de Pesquisa Agropecuária de Minas Gerais, accessed 2011-08-20.
Homepage: http://www.epamig.br/
Specific Link: http://www.epamig.br/index.php?option=com_content&task=view&id=12&Itemid=51
FETAG-AL – Federação dos Trabalhadores e Trabalhadores na Agricultura do Estado de Alagoas, accessed
2011- 08-27.
Homepage: http://www.fetagal.org.br/
Specific Link: http://www.fetagal.org.br/links.asp?id=4
Fundação BA – Fundação Bahia, accessed 2011-07-28.
Homepage: http://www.fundacaoba.com.br/
Specific Link: http://www.fundacaoba.com.br/index.php?p=cultivares-algodao
Fundação GO – Fundação Goiás, accessed 2011-07-28.
Homepage: http://www.fundacaogo.com.br/
Specific Link: http://www.fundacaogo.com.br/cultivares.html
G1 – O Portal de Notícias da Globo, accessed 2011-08-27.
Homepage: http://g1.globo.com/
Specific Link: http://g1.globo.com/economia/noticia/2011/05/com-safra-recorde-exportacao-de-algodao-do-pais-
dobra-em-1112-2.html

77|84
GBCA – Grupo de Consultores de Algodão, accessed 2011-08-12.
Homepage: http://www.consultoresdealgodao.com.br/
Specific Links: http://www.consultoresdealgodao.com.br/sobre/conheca-o-gbca.php &
http://www.consultoresdealgodao.com.br/agenda/detalhe-agenda.php?id=9
IAC – Instituto Agronômico de Campinas, accessed 2011-07-29.
Homepage: http://www.iac.sp.gov.br/
Specific Link: http://www.iac.sp.gov.br/Centros/Graos_Fibras/
IAPAR – Instituto Agronômico do Paraná, accessed 2011-07-29.
Homepage: http://www.iapar.br/
Specific Link: http://www.iapar.br/arquivos/File/zip_pdf/cult_iapar1980_2008.pdf
MDIC – Ministério do Desenvolvimento, Indústria e Comércio Exterior, accessed 2011-08-27.
Homepage: http://www.mdic.gov.br/
Specific Link: http://www.mdic.gov.br/sistemas_web/aprendex/cooperativismo/index/popup/id/330
Monsanto Algodão, accessed 2011-08-01.
Homepages: http://algodaomonsanto.com.br/ & http://www.monsanto.com.br
Specific Links: http://algodaomonsanto.com.br/novamarca.asp &
http://www.monsanto.com.br/institucional/monsanto-no-brasil/historia/historia.asp
SEFAZ-MT – Secretaria de Estado de Fazenda, accessed 2011-08-27.
Homepage: http://www.sefaz.mt.gov.br/
Specific Link:
http://app1.sefaz.mt.gov.br/Sistema/Legislacao/legfinan.nsf/709f9c981a9d9f468425671300482be0/ebe2436b373
cf3c404256da400741c41?OpenDocument
UNICOTTON – Cooperativa dos Produtores de Algodão, accessed 2011-08-27.
Homepage: http://www.unicotton.coop.br
Specific Link: http://www.unicotton.coop.br/site/site.html
US Department of State – Background Note: Brazil, accessed 2011-08-28.
Homepage: http://www.state.gov/
Specific Link: http://www.state.gov/r/pa/ei/bgn/35640.htm
USDA – United States Department of Agriculture, accessed 2011-08-27.
Homepage: http://www.ers.usda.gov/
Specific Link: http://www.ers.usda.gov/AmberWaves/November06/Features/Brazil.htm &
http://www.ers.usda.gov/Briefing/Brazil/domsupport.htm

78|84
Data Sources
BM&F – Bolsa de Mercadorias e Futuros, accessed 2011-08-13.
Homepage: http://www.bmfbovespa.com.br/
CEPEA/ESALQ – Escola Superior de Agricultura, Luiz de Queiroz, accessed 2011-08-15.
Homepage: http://www.esalq.usp.br/
Specific Link: http://www.cepea.esalq.usp.br/english/cotton/
CONAB – Companhia Nacional de Abastecimento, accessed 2011-08-01.
Homepage: http://www.conab.gov.br/
Specific Links: http://www.conab.gov.br/conteudos.php?a=1252&t= &
http://www.conab.gov.br/conteudos.php?a=518&t=2
Ministério da Agricultura, Pecuária e Abastecimento – Ministry of Agriculture, accessed 2011-07-29.
Homepage: http://www.agricultura.gov.br/
Specific Link: http://extranet.agricultura.gov.br/php/proton/cultivarweb/cultivares_registradas.php
Portal Brasil, accessed 2011-08-25.
Homepage: http://www.portalbrasil.net/
Specific Link: http://www.portalbrasil.net/ipc.htm
USDA – United States Department of Agriculture, accessed 2011-08-15.
Homepage: http://www.usda.gov/
Specific Link: http://www.usda.gov/oce/commodity/wasde/index.htm

79|84
Interviews & Meetings
These references are divided into two parts, where the first part presents interviews conducted
in person, and the second part presents interviews conducted over the phone. Due to
geographical distances in Brazil, we could not visit all stakeholders of interest, and that is why
we decided to conduct some of our interviews over the phone. When language is not
mentioned, interviews were carried out in Portuguese. Although we have not referred to all
interviews in our thesis, we have benefited a lot from all information provided during the
interviews.
Meetings
2011-06-21 IMAmt – Primavera do Leste, Mato Grosso.
2011-07-01 IMAmt – Cuiabá, Mato Grosso.
2011-07-01 IAS – Cuiabá, Mato Grosso.
2011-07-04 John Deere – Primavera do Leste, Mato Grosso.
2011-07-05 Multigrain – Primavera do Leste, Mato Grosso.
2011-07-06 COOALESTE – Primavera do Leste, Mato Grosso.
2011-07-07 Algodoeira Nativa – Primavera do Leste, Mato Grosso.
2011-07-08 UNICOTTON – Primavera do Leste, Mato Grosso.
2011-07-08 Ceres Consultoria Agronômica – Primavera do Leste, Mato Grosso.
2011-07-13 Libero Commodities – Cuiabá, Mato Grosso. (in English)
2011-07-13 IMEA – Cuiabá, Mato Grosso.
2011-07-19 Ministry of Agriculture – Brasília, Distrito Federal. (in English)
2011-07-20 OCB – Brasília, Distrito Federal.
2011-07-21 ABRAPA – Brasília, Distrito Federal.
2011-07-21 Ministry of Agriculture – Brasília, Distrito Federal.
2011-07-22 IBA – Brasília, Distrito Federal.
2011-07-22 CONAB – Brasília, Distrito Federal.
2011-07-25 Universidade Federal de Mato Grosso – Cuiabá, Mato Grosso.
2011-08-01 AMPA – Cuiabá, Mato Grosso.
Phone Interviews
2011-07-25 Embrapa Algodão – Campina Grande, Paraíba.
2011-07-26 Cargill – São Paulo, São Paulo.
2011-07-27 Cotton Consultoria – Campina Grande, Paraíba.
2011-07-28 CATI – Campinas, São Paulo.

80|84
2011-07-29 Monsanto Algodão – São Paulo, São Paulo.
2011-08-02 FBET – Blumenau, Santa Catarina.
2011-08-02 IAPAR – Londrina, Paraná.
2011-08-02 IAC – Campinas, São Paulo.
2011-08-09 Instituto Biológico – Campinas, São Paulo.
2011-08-10 COOPERFIBRA – Campo Verde, Mato Grosso.
2011-08-10 BM&F – São Paulo, São Paulo.
2011-08-10 AGOPA – Goiânia, Goiás.
2011-08-10 AMIPA – Patos de Minas, Minas Gerais.
2011-08-10 AMPASUL – Chapadão do Sul, Mato Grosso do Sul.
2011-08-10 ABAPA – Luis Eduardo Magalhães, Bahia.
2011-08-12 EISA Interagrícola – São Paulo, São Paulo.
2011-08-12 Kuhlmann – Paranaguá, Paraná.
2011-08-17 COABRA – Cuiabá, Mato Grosso.
2011-08-22 COCAMAR – Maringá, Paraná.
2011-08-23 COAMO – Campo Mourão, Paraná.
2011-08-24 CEPEA/ESALQ – Piracicaba, São Paulo.
2011-08-24 ABIT – São Paulo, São Paulo.

81|84
1 1 1 2 2
4
1 1 3
2 1 1 1
2 1 1 1 1
2 1
2 2 3
1 1
2
1 1
2 1
2
5
3
4
5
1 2
6
2 4
1 1 2
2
1
5
1
2
4 3
2
3
1
2 3
2 2
1
4
6
2
1
7 7
3 2
4
0
2
4
6
8
10
12
14
16
18
20
19
70
19
71
19
72
19
73
19
74
19
75
19
76
19
77
19
78
19
79
19
80
19
81
19
82
19
83
19
84
19
85
19
86
19
87
19
88
19
89
19
90
19
91
19
92
19
93
19
94
19
95
19
96
19
97
19
98
19
99
20
00
20
01
20
02
20
03
20
04
20
05
20
06
20
07
20
08
20
09
20
10
20
11
Am
ou
nt
of
Var
ieti
es
Year
Figure 11. Amount of Varieties Developed, 1970-2011 Public Private Partnerships Public Private & Multinational Companies Private Foundations
Source: Batista (2011), Bélot et al (2005), Branco & Vieira (2007), Cia et al (2001), Embrapa Algodão (2000), FACUAL (2003), Farias (2005), Freire (2004), Freire & de Carvalho (2004), Freire et al (1998), Freire et al (2004), Freire et al (2007a), Freire et al (2007b), Pedrosa et al (2009), Suinaga (2003), Ministry of Agriculture (2011-07-29), IAPAR (2011-07-29), IAC (2011-07-29), Fundação BA (2011-07-28), Fundação GO (2011-07-28), Monsanto Algodão (2011-08-01).
Appendix 1

82|84
Appendix 2
This appendix serves to present how we have calculated costs and quality. As data was not
available for all regions in Brazil, we weighted available data in order to obtain as
representative a result as possible. In order to calculate the costs, we used a composition of
costs exemplified by the data in Table 2. The years for when cost data was available are
further presented in Table 3. Since the cost data was in current values, we calculated a
Table 2. Estimated Production Cost of Cotton Summer Harvest - 2009/2010
Location: RONDONÓPOLIS
Average Productivity (Seed Cotton): 3 750 kg/ha
PRICES IN: 2009-05-31 SHARE OF
COMPOSITION OF COSTS
PRODUCTION COSTS
(R$/ha) R$/15 kg (%)
I - FARM COSTS
1 - Airplane operations 0.00 0.00 0.00%
2 - Machinery operations 413.51 1.50 7.60%
3 - Rental of machinery / services 0.00 0.00 0.00%
4 - Labor (temporary) 257.60 1.04 4.74%
5 - Labor (fixed) 51.16 0.20 0.94%
6 - Seeds 86.25 0.44 1.59%
7 - Fertlizers 1 777.90 7.12 32.68%
8 - Pesticides 1 630.25 6.56 29.97%
9 - Others 28.92 0.11 0.53%
TOTAL FARM COSTS (A) 4 245.59 16.97 78,04%
II - POST-HARVEST COSTS
1 - Insurance costs 165.58 0.66 3.04%
2 - Technical assistence 84.91 0.34 1.56%
3 - External transport 37.50 0.15 0.69%
4 - Ginning 212.50 0.85 3.91%
5 - Wharehousing 15.48 0.06 0.28%
Total post harvestCosts (B) 515.97 2.06 9.48%
III - FINANCIAL COSTS
1 - Interest 231.81 0.93 4.26%
Total financial costs (C) 231.81 0.93 4.26%
VARIABLE COSTS (A+B+C = D) 4 993.37 19.96 91.78%
IV - DEPRECIATION
1 - Depreciation of installations and benefactors 76.25 0.31 1.40%
2 - Depreciation of implements 19.58 0.08 0.36%
3 - Depreciation of machinery 59.10 0.24 1.09%
Total costs of depreciation (E) 154.93 0.63 2.85%
V - OTHER FIXED COSTS
1 - Periodic maintenance of machinery/implements 56.33 0.23 1.04%
2 - Social taxes 30.18 0.12 0.55%
3 - Insurances for immovables 4.12 0.02 0.08%
Total costs for other fixed costs (F) 90.63 0.37 1.67%
Custo Fixo (E+F = G) 245.56 1.00 4.51%
OPERATIONAL COSTS (D+G = H) 5 238.93 20.96 96.30%
VI - RETURNS OF PRODUCTION FACTORS
1 - Expected return on fixed capital 36.36 0.15 0.67%
2 - Land 165.00 0.66 3.03%
Total Returns of Production Factors (I) 201.36 0.81 3.70%
TOTAL COSTS (H+I = J) 5 440.29 21.77 100.00%
Source: CONAB. Note: The authors’ translation.
82|84

83|84
deflator based on CPI in order to make the values constant and indexed to 2010.232
When the cost data had been deflated, we weighed the data according to shares of total
production each year. This method was also used to calculate quality as data for all regions
was not available. Consider the following example of how the data was calculated:
During a certain year, Mato Grosso had 30 % and Bahia had 20 % of total production, and
quality and cost data are only available for these regions. Mato Grosso and Bahia must thus
represent all cotton produced in Brazil during this year. We know that Mato Grosso and Bahia
together represented 50 % total production, and weights for each region are thereby calculated
as follows:
Mato Grosso thus represents 60 % of the sample during this year, and Bahia 40 %. These
weights are then used to calculate quality and costs. Suppose that the fiber length in Mato
Grosso and Bahia was 30 mm and 20 mm respectively. The average fiber length for the whole
country would then be calculated as follows:
232
Portal Brasil (2011-08-25).
Table 3. Regions Represented in Costs City Rondonópolis Campo Novo do Parecis Sorriso Rio Verde Chapadão do Sul Barreiras Campo Mourão
State Mato Grosso Mato Grosso Mato Grosso Goiás Mato Grosso do Sul Bahia Paraná
1999/2000 x
x x x 2000/2001 x
x x x
2001/2002 x
x x x 2002/2003 x
x x x
2003/2004 x x
x x x 2004/2005 x x
x x x
2005/2006 x x
x x x x
2006/2007 x x x x x x x 2007/2008 x x x x x x x 2008/2009 x x x x x
2009/2010 x x x x x
Source: CONAB.
84|84
The average fiber length was thus 26 mm during this year. All quality and cost data was
calculated using this method, and by these means we maximize the representativeness of the
data available.
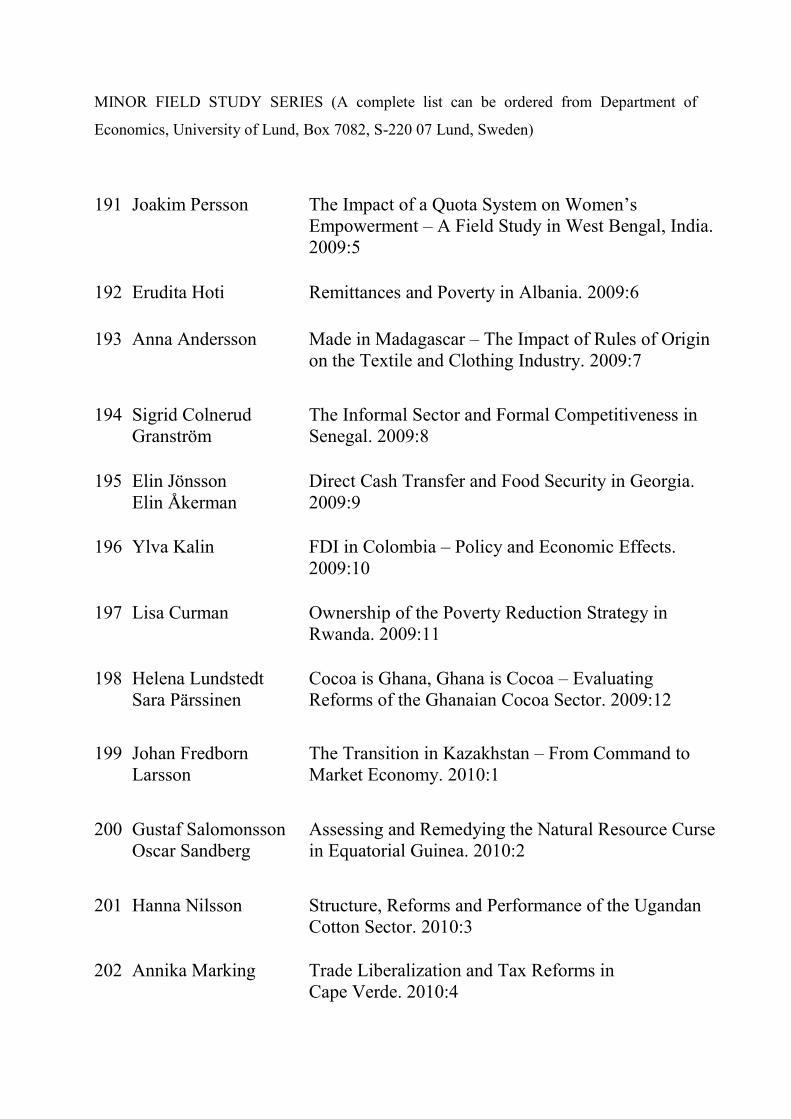
85|84
MINOR FIELD STUDY SERIES (A complete list can be ordered from Department of
Economics, University of Lund, Box 7082, S-220 07 Lund, Sweden)
191 Joakim Persson The Impact of a Quota System on Women‟s
Empowerment – A Field Study in West Bengal, India.
2009:5
192 Erudita Hoti Remittances and Poverty in Albania. 2009:6
193 Anna Andersson Made in Madagascar – The Impact of Rules of Origin
on the Textile and Clothing Industry. 2009:7
194 Sigrid Colnerud
Granström
The Informal Sector and Formal Competitiveness in
Senegal. 2009:8
195 Elin Jönsson
Elin Åkerman
Direct Cash Transfer and Food Security in Georgia.
2009:9
196 Ylva Kalin FDI in Colombia – Policy and Economic Effects.
2009:10
197 Lisa Curman Ownership of the Poverty Reduction Strategy in
Rwanda. 2009:11
198 Helena Lundstedt
Sara Pärssinen
Cocoa is Ghana, Ghana is Cocoa – Evaluating
Reforms of the Ghanaian Cocoa Sector. 2009:12
199 Johan Fredborn
Larsson
The Transition in Kazakhstan – From Command to
Market Economy. 2010:1
200 Gustaf Salomonsson
Oscar Sandberg
Assessing and Remedying the Natural Resource Curse
in Equatorial Guinea. 2010:2
201 Hanna Nilsson Structure, Reforms and Performance of the Ugandan
Cotton Sector. 2010:3
202 Annika Marking Trade Liberalization and Tax Reforms in
Cape Verde. 2010:4

86|84
203 Karin Göransson
Anna Östergren
Is Trust a Necessity? A Case Study of Group Lending
within Microfinance in the Mbarara District, Uganda.
2010:5
204
Ylva Wide
Assessing the Competitiveness in Mozambique.
2010:6
205
Martin Larsson
Sofie Sjöborg
The Effects of Growth and Inequality on Poverty in
Honduras. 2010:7
206 Karl McShane
Johan Nilsson
Determinants of Corruption – A Study of Zambian
Ministries. 2010:8
207
208
209
210
211
Emma Lindqvist
Ebba Littorin
Martin Eriksson
Fredrika Cruce
Erik Bustad
Linn Glimeus
Linnéa Ödén
The Way the Cookie Crumbles? A Study of the
Relationship Between Gender and Corruption in Ghana.
2010:9
Reciprocity, Nepotism or Costly Signaling – Evidence
from Mobile Phone Money Transfers in Nairobi. 2010:10
Evaluating Value Added Tax in Morocco. 2011:1
Evaluating Fiscal Decentralization in Peru. 2011:2
Efficiency of the Rice Market Channel in the Office du
Niger. 2011:3
212
Annie Emilsson
The Impact of Remittances on Labor Supply – The Case
of Jordan. 2011:4
213
John Svending
The Institutional Channels of the Resource Curse – A
Case Study of Bolivia. 2011:5
214
Christopher Wingård
Tariffic Tuna – A Study on the Impact of Rules of Origin
on Thailand‟s Tuna Trade. 2011:6
215
Johannes Lissdaniels
Fredrik Saïd Madsen
The Fall and Rise of the Brazilian Cotton Sector – An
Institutional Analysis of the Recent Success. 2011:7