the factors influencing economic growth in …
TRANSCRIPT
International Journal of Arts and Commerce Vol. 6 No. 7 October 2017
1
THE FACTORS INFLUENCING ECONOMIC GROWTH IN
INDONESIA PERIOD 1981-2014 ERROR CORRECTION
MODEL APPROACH
Imamudin Yuliadi
University of Muhammadiyah Yogyakarta
Email: [email protected]
Nadya Rose .P
University of Muhammadiyah Yogyakarta
Email: [email protected]
ABSTRACT
This study aims to analyze the factors influencing economic growth in Indonesia. The study
employed the quantitative approach by using secondary data from 1981 to 2014. Analysis tool that is
used in this study is Error Correction Model (ECM). Variables that are used namely Foreign Direct
Investment (FDI), Export, Infrastructure (Road Length), and Inflation Rate, in which economic growth
represented by Gross Domestic Product (GDP).
The result of this study indicates that Foreign Direct Investment (FDI) and export have
positive and significant impact in short and long run. Meanwhile, both in short and long run, the
inflation rate has negative and significant impact. The different result shows by infrastructure (Road
Length) that has negative and insignificant relationship on economic growth in Indonesia, both in
short and long run.
Keywords: Foreign Direct Investment (FDI), Export, Infrastructure (Road Length), Inflation Rate,
Gross Domestic Product (GDP), Error Correction Model (ECM)

International Journal of Arts and Commerce ISSN 1929-7106 www.ijac.org.uk
2
INTRODUCTION
Economic performance is an assessment of its success in areas related to its assets, liabilities
and overall market strength. Many countries take regular stock in either formal or less formal basis of
the general economic performance of their countries to make sure that it remains on the right track
financially. Economic performance can be seen from economic growth. Economic growth is an
indicator to perceive a country’s performance whether in good or bad performance. The success of the
development of a country can be seen from the level of economic growth. Therefore, each country
always set target of high economic growth rates in the planning and development objectives. By high
sustainable economic growth means as the main condition for sustainable development economy.
In the narrow sense, economic growth means the increase in total production of both goods and
services. This is measured by the change in real gross domestic product (GDP) and by the change of
real gross domestic product per capita. GDP is the total value of all final goods and services produce
in a country in a one-year period. The value of GDP would give a view of how a country’s ability to
manage and utilizing existing resources.
Indonesia is one of the developing countries in the world. As a developing country Indonesia
has been joined as a member in G-20 major economies and classified as the newly industrialized
country. Based on the data from world-bank in 2013, the gross domestic product of Indonesia reached
3,475.25 USD. Indonesia experienced a GDP growth of 5.8% per 2013, it is of course a good hope for
the Indonesian’s government to realize the improvement of people's welfare.
Source: World Bank
FIGURE 1. The Annual GDP Growth in Indonesia
The graph above explained about the development of economic growth in Indonesia for 34
years from 1981 until 2014. Given the fact from World Bank, it can be concluded that the economic
growth in Indonesia moving into fluctuation ways for 34 years. In the crisis 1998, the economic
growth in Indonesia decreased dramatically around -13.12%. As for Indonesia, the main cause of
financial crisis happens because of the internal source at that time. The crisis started when huge capital
flight out from Indonesia. The direct result of capital flight that occurred in Indonesia, result in
Indonesia's national currency (rupiah) then deteriorated against the US dollar. Moreover, many
companies bankrupted and the national banking sector collapsed (Tambunan T. , 2010).
In macroeconomic analysis, besides explaining the supporting factor that possibly affect the
economic growth, it also discusses on the issues such as; inflation. Inflation is a process of rising
prices in general and continuous (continuous) for a certain time. In other words, inflation is also a
-15
-10
-5
0
5
10
15
1970 1980 1990 2000 2010 2020
GDP growth (annual %)

International Journal of Arts and Commerce Vol. 6 No. 7 October 2017
3
process in which the declining in currency values continuously. Inflation is a process of an event, not
the high-low level of a price. That is, if the high price level it has not conclusively point to inflation. If
a process of price increase continues to happen and influence each other means there is inflation. To
achieve sustainable economic growth along with price stability continues to be the main objective of
economic policy macro to most countries in the world today.
Based on the data from World Bank, the rate of inflation in Indonesia has fluctuated over the
time. The highest level of inflation is happen when Asia financial crisis in 1997. Because of that
problem, the inflation rate reach 58.3% and 20.48% in 1999. It became the hardest-hit country because
the crisis not only had economic but also significant and far-reaching political and social implications.
And after that, the inflation rate in Indonesia gradually back to normal.
In this globalization era, foreign direct Investment (FDI) plays an important role in
international business. Economic integration occurs between the countries in the world encourage the
emergence of cooperation in the economic, political, social and cultural. As the developing country in
the world, Indonesia requires substantial funds in implementing national development. It is due to the
undertakings in pursuit of the underdevelopment of the developed countries in the world globally. The
fact that Indonesia itself is not able to provide the fund for development itself.
Foreign investment in Indonesia, has become a funding source that can be used as financing for
development and economic growth. By using foreign investment, it is intended to replace the use of
foreign debt as a source of financing. Because with the increasing uncontrolled interest rates on
foreign debt and the rupiah exchange rate against foreign currencies make Indonesia will decrease the
difficulties in the repayment of the debt.
Beside investments, Export also play an important role in the economic activities of a country.
Exports will generate income that will be used to finance imports of raw materials and capital goods
needed in the production process that will create value-added. Aggregation value added generated by
all production units in the economy is the value of products GDP (Sutawijaya & Zulfahmi, 2010).
Through productivity gains, from the micro level, infrastructure can promote economic growth.
Kuznets in his theory mentioned that the economic growth of a country is affected by the
accumulation of capital, natural resources, human resources, with a view of quantity and quality. On
the other hand, infrastructure can be categorized as capital accumulation. So, infrastructure can be
used as inputs to production indirectly.
The developing countries has made an investment of 200 billion US dollars each year for the
construction of the new infrastructure (World Bank, 1994). With the investments were acquired, the
expected increase value of infrastructure will be better in the future, in fact sometimes the
performance of infrastructure is disappointing. One of the causes is an error in the allocation of funds.
For example, the development of infrastructure continued without maintaining the existing
infrastructure.
The effort to revamp the infrastructure conditions to realize an important role in reducing
inequalities of income and long-term effects for gross domestic product is important. Improvements in
infrastructure have contributed to increasing productivity and is expected to support economic growth
in the long term (Maryaningsih, Hermansyah, & Savitri, 2014). In this research, it focuses on the long
road infrastructure in Indonesia in Kilometer units. By having the best quantity and quality road
infrastructure in Indonesia, country will able to provide convenience in the distribution of economic
activities in the community. Based on World Bank in 2013, Roads are the main transport in Indonesia,
and the total road network recorded more than 477,000 km with an asset value of more than 15% of
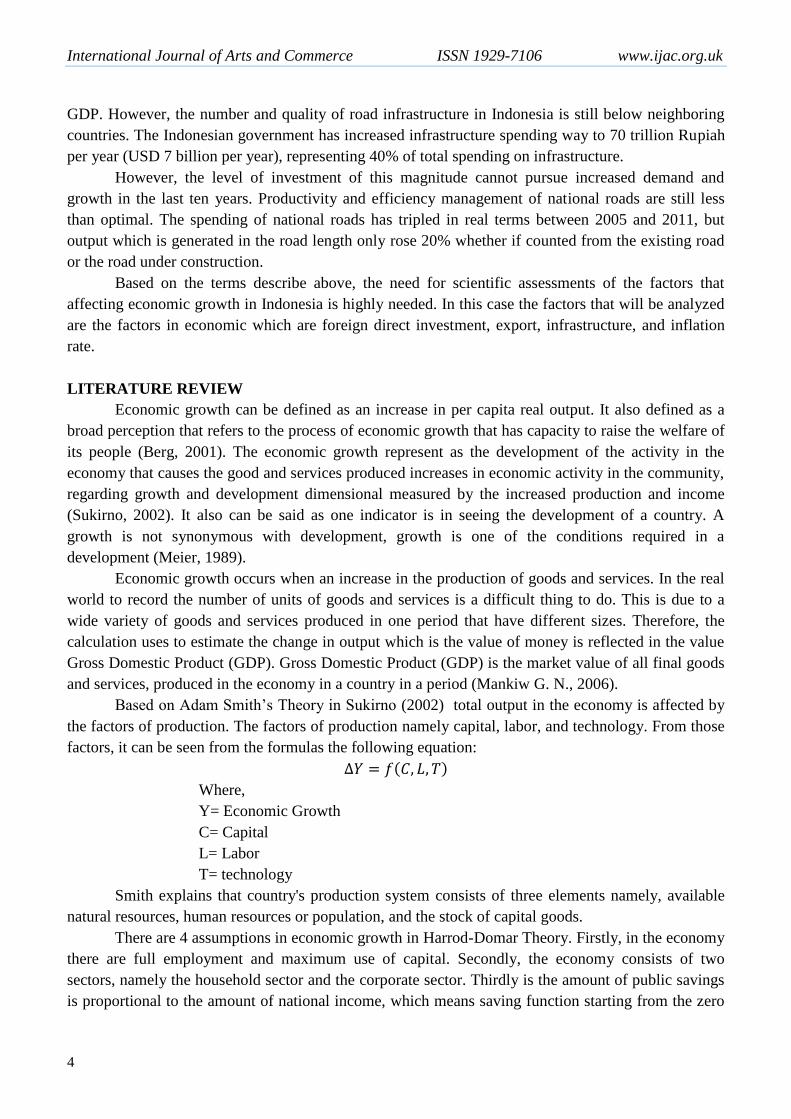
International Journal of Arts and Commerce ISSN 1929-7106 www.ijac.org.uk
4
GDP. However, the number and quality of road infrastructure in Indonesia is still below neighboring
countries. The Indonesian government has increased infrastructure spending way to 70 trillion Rupiah
per year (USD 7 billion per year), representing 40% of total spending on infrastructure.
However, the level of investment of this magnitude cannot pursue increased demand and
growth in the last ten years. Productivity and efficiency management of national roads are still less
than optimal. The spending of national roads has tripled in real terms between 2005 and 2011, but
output which is generated in the road length only rose 20% whether if counted from the existing road
or the road under construction.
Based on the terms describe above, the need for scientific assessments of the factors that
affecting economic growth in Indonesia is highly needed. In this case the factors that will be analyzed
are the factors in economic which are foreign direct investment, export, infrastructure, and inflation
rate.
LITERATURE REVIEW
Economic growth can be defined as an increase in per capita real output. It also defined as a
broad perception that refers to the process of economic growth that has capacity to raise the welfare of
its people (Berg, 2001). The economic growth represent as the development of the activity in the
economy that causes the good and services produced increases in economic activity in the community,
regarding growth and development dimensional measured by the increased production and income
(Sukirno, 2002). It also can be said as one indicator is in seeing the development of a country. A
growth is not synonymous with development, growth is one of the conditions required in a
development (Meier, 1989).
Economic growth occurs when an increase in the production of goods and services. In the real
world to record the number of units of goods and services is a difficult thing to do. This is due to a
wide variety of goods and services produced in one period that have different sizes. Therefore, the
calculation uses to estimate the change in output which is the value of money is reflected in the value
Gross Domestic Product (GDP). Gross Domestic Product (GDP) is the market value of all final goods
and services, produced in the economy in a country in a period (Mankiw G. N., 2006).
Based on Adam Smith’s Theory in Sukirno (2002) total output in the economy is affected by
the factors of production. The factors of production namely capital, labor, and technology. From those
factors, it can be seen from the formulas the following equation:
∆𝑌 = 𝑓 𝐶, 𝐿, 𝑇
Where,
Y= Economic Growth
C= Capital
L= Labor
T= technology
Smith explains that country's production system consists of three elements namely, available
natural resources, human resources or population, and the stock of capital goods.
There are 4 assumptions in economic growth in Harrod-Domar Theory. Firstly, in the economy
there are full employment and maximum use of capital. Secondly, the economy consists of two
sectors, namely the household sector and the corporate sector. Thirdly is the amount of public savings
is proportional to the amount of national income, which means saving function starting from the zero

International Journal of Arts and Commerce Vol. 6 No. 7 October 2017
5
point. The last is the propensity to save in fixed amount, as well as the capital output ratio and the
incremental capital output ratio (Jones, 1975).
Harrord-Domar theory doesn’t focus the requirement to reach the maximum capacity if the
economic is consisted with 3 sectors or 4 sectors. On that condition, the capital increases if AE1 = C +
I1 + G1 + (X – M)1, where equal with I1 + G1 + (X – M)1. The conclusion from Harrord Domar
theory is that the theory completes the Keynesian analysis. Keynesian focuses on the short-term
economic problem. While on Harrord Domar theory, it describes the long-run economic problem. It
describes the long aggregate is needed to be reached to realize the economic growth. The robust
economic growth can be reached if I + G + (X – M) increases significantly with positive relationship.
Moreover, Harrod- Domar theory model focuses on how the population growth, capital
accumulation, technological progress and outputs interact each other in the process of economic
growth (Boediono, 1982). Although the general framework of the Solow-Swan model is similar with
Harrod- Domar model, the Solow- Swan model is more flexible. This is because the Solow- Swan
models more easily manipulated algebraically.
In contradict to the Harror-Domar theory that assumes a constant return with raw coefficients,
meanwhile the neo-classical solow growth model uses the concept of diminishing return from worker
and capital amount, if the two use distinct analysis. When analyzed simultaneously, the assumption of
neoclassical also use the concept of constant return to scale. The advances in technology are just set as
residual factor to explain the long-term economic growth. High or low growth is assumed to be
exogenous or not influenced by other factors.
Foreign Direct Investment
There are two kinds of foreign investments in Indonesia which are foreign direct investment
and foreign indirect investment. Foreign direct investment is the investment that apply in Indonesia
territory by foreign investor which investment comes in form of building and buying a company or
acquiring a company. Based on the UU No. 25 year 2007 in (Agma) represent the purpose of
investment as follows: increase national economic growth, to create a vocation, to Increase the
sustainable economic development, to increase the capacity and capability of national technology, and
to develop community economy. Meanwhile, indirect foreign investment is made by the capital
market instrument such as securities, stock, and bond.
Export
Export is the activity of selling and sending goods from the origin country to other countries.
These activities can bring the flow of expenditure will be flowed into the enterprise sector.
Furthermore, the aggregate expenditure will increase, this is because the export activities of goods and
services, and therefore the national income will also increase. If net exports in a positive state, the
aggregate expenditure will increase. Then this will increase the national income and employment
(Sukirno, 2013).
Exports are one of the component in aggregate spending on the open-economy. Aggregate
expenditure in an open economy means that the household expenditure on domestic production,
investment, government spending, spending on imported goods and foreigner who spend the export
goods. The aggregate expenditure can be expressed by this following formula:
𝐴𝐸 = 𝐶𝑑𝑛 + 𝐼 + 𝐺 + 𝑋 − 𝑀

International Journal of Arts and Commerce ISSN 1929-7106 www.ijac.org.uk
6
Another theory that is used in the export is the basic theory of export. The basis theory is that
the economic basis that is developing from the basis export becomes the city basis. From all of the
theories, all are stressing on the demand from the external sides. On the city theory, there is a division
which is its environment and external.
In export theory it can be described as the autonomic factor. It means that export is a factor to
increase the income and economic growth directly. To reach the high export level, then it needs the
strategy to increase the appropriate export value and appropriate investment with the high technology
to be implemented punctually (Adisasmita, 2013).
Infrastructure
Infrastructure is the capital stock that provides public goods and services. Infrastructure will
affect the production activities and quality of life for the households. Infrastructure is a fundamental
factor behind economic growth. This variable has shown its long-enduring significance (Yoshino &
Nakahigashi, 2000).
Infrastructure refers to the physical facility and organizational framework, knowledge and
technology that is essential to society and economic growth. Infrastructure includes laws, public health
and education systems, distribution systems, and transportation systems and public utilities.
In the economics, infrastructure is a form of public capital, which formed from the investment
made by the government. In this study, infrastructure including roads, bridges, and sewer system
(Mankiw G. , 2003).
Inflation Rate
Inflation is an increase in the general price level of commodities and services during a specific
time period. Inflation is regarded as a monetary phenomenon due to the impairment of the monetary
calculation unit to a commodity (Greenwald, 1998).
Inflation is one of the problems that need most attention by the government. The long term
goal of government is to keep the inflation rate at the lowest level. The three kinds of inflation based
on the causes of inflation that is demand-pull inflation, cost-push inflation, and imported inflation
(Sukirno, 2013).
Besides inflation give a bad effect on the country, inflation can also give a bad effect on the
individual and society. Firstly, inflation will reduce the real income of the people who have a fixed
income. Generally, the increasing of wage level not as fast as the increasing of price level. Therefore,
inflation will decrease the individual real wage who have the fixed income. Secondly, inflation will
reduce the amount of wealth (money-from). Thirdly, inflation makes the distribution of wealth unwell.
As explained earlier, the fixed income will experience the degradation in the real-income, but the
owner of the fixed asset such as; land, houses can maintain or increase the value of real asset.
Previous Studies
According to Pranoto (2016), simultaneously exports has a significant and positive effect on
the gross domestic product, while foreign direct investment has a significant and negative impact in
Indonesia 2004 until 2013. This analysis was performed using linear regression analysis.
Based on Irsania and Noveria (2014) in their research titled “the Relationship among Foreign
Direct Investment, Inflation Rate, Unemployment Rate, and Exchange Rate to Economic Growth”
reveals that FDI, inflation rate, and exchange rate has a significant influence towards economic
International Journal of Arts and Commerce Vol. 6 No. 7 October 2017
7
growth. But FDI and unemployment have a positive correlation. The rest variables have negative
correlation. This research used multiple regression as a method.
From the result of Koojaroenprasit (2012) by using the multiple regression, the findings shows
that foreign direct investment has a strong positive impact on South Korean Economic Growth.
Furthermore, this finding indicates that human capital, employment and export also have positive and
significant impact, while domestic investment has no significant impact on economic growth in South
Korea.
Research from Mofrad (2012) shows the study on The Relationship between GDP, Export, and
Investment: Case Study Iran shows that there exist a positive and significant long-term and short-term
relationship between investment and export with GDP in 95% confidence level. This study used the
vector error correction model as the method period 1991 until 2008.
According to Sojodi, et al. (2012) the research that used ARDL Method indicated the
transportation facilities distinctively length of railway. Roadway, and telecommunication
infrastructure (fixed phone line) have positive and significant impact on economic growth.
Study from Wibowo (2016) explains that the road infrastructure has no significant impact on
economic growth in Indonesia period 2006 until 2013. On the other hand, electricity, health, and
education has positive significant impact on economic growth in Indonesia.
The development of infrastructure in a country is a major influence on economic growth in a
country (macro and micro) and the development of a country. However, it is not easy to apply in
Indonesia. Moreover, since the 1997 crisis which eventually widened into a multidimensional crisis
impact can still be felt today (Haris, 2005).
The other study finds that foreign direct investment has significant impact on gross domestic
product in Indonesia and vice versa. This study shows that there is two way relationship between FDI
and GDP. This study used Engle Granger (EG-ECM) based on the theorem of granger’s representation
(Wuryaningsih, Setyowati, & Kuswati, 2008).
Research from Kasidi and Mwakanemeda (2013) investigated that inflation has a negative
impact on economic growth in Tanzania. There was no co-integration between inflation and economic
growth during the period 1990 until 2011. In addition, no long-run relationship between inflation and
economic growth in Tanzania. This research used regression equation as the method.
Study from Acyumida and Eko (2013) employs that the Granger Causality of GDP has no
causality relationship on inflation. On the contrary, there is a causality relationship between Inflation
on GDP in Indonesia period 2000 until 2013.
Finally, from the result of Izuchukwu and Patricia (2015) noted in their study about the Impact
of Inflation on Economic Growth in Nigeria period 2000 until 2009 that the inflation has a significant
impact on economic growth in Nigeria. In addition, exchange rate has a positive impact on economic
growth and that high interest rate discourages investment and hence forestalls economic growth.
Hypotheses
On the paragraph below are the hypotheses based on the previous study and theoretical
framework:
1) Foreign Direct Investment has a significant and positive impact on economic growth in
Indonesia both in long-run and short-run.
2) Export has a significant and positive impact on economic growth in Indonesia both in long-
run and short-run.

International Journal of Arts and Commerce ISSN 1929-7106 www.ijac.org.uk
8
3) Infrastructure has a significant and positive impact on economic growth in Indonesia both
in long-run and short-run.
4) Inflation has a significant and negative impact on economic growth in Indonesia both in
long-run and short-run.
RESEARCH METHODOLOGY
The study employed the quantitative approach by using secondary data from 1981 to
2014.Quantitative method is a method that stems from numerical data to be processed into
information. So that the quantitative method is a method that is numeric and statistical analysis and
then processed into information (Kuncoro, 2003).
Variables that are used namely Foreign Direct Investment (FDI), Export, Infrastructure (Road
Length), and Inflation Rate, in which economic growth represented by Gross Domestic Product
(GDP).Data collection technique that is used in this study was a non-participant observer, where
researchers only looked at data that is already available without become part of a data system.
The analysis method in this research is Error Correction Model (ECM). By using descriptive
quantitative approach, error correction model is used to determine the effect of independent variables
on the dependent variable in the long term and short term. The steps to be performed first before
conducting the ecm step is Classical Assumption. This test use to determine whether it meets the
assumptions BLUE or not, it needs to do some testing such as multicollinearity test, autocorrelation
test, heteroscedasticity test and normality to ensure that the data are normally distributed. After
performing the classical assumption test, the further step is dynamic test encompassing stationary test,
integration test, co- integration test, and the last is performing the error correction model. This
research will be run by using E-views 4.
RESULT AND ANALYSIS
Classical Assumption Test
1. Autocorrelation Test.
In this study, to determine whether there is autocorrelation in a model or not, then it
will be used the Lagrange Multiplier test (LM test). This test useful to determine there is a
correlation between the independent variable with the disturbance variable. If the Obs*R-
Squaredvalue less than the table value, so there is no autocorrelation in the model. Besides
that, the autocorrelation can be seen by the chi-squares probability value. If the probability
value is more than the value of α = 10%, it is safe to say that; there is no autocorrelation
problem (Basuki & Yuliadi, 2014). Based on the result, LM test in short term with the smallest
Akaike value on the first lag can be seen that the probability value of Obs*R-Squared is
0.113302. Because the probability value of the Obs*R-Squared is more than α = 10%, so there
is no autocorrelation problem in the Error Correction Model.
2. Normality Test.
The aims of normality test is to know the variable normally distributed or not. This test
can be done through Jarque-Berra test (J-B test). If the J-B test is more than α = 10%, so it
shows that the datanormally distributed. But, if the J-B test is less than α = 10%, so the data is
not normally distributed.Based on the result, the p- value of J-B test is 0.533376. The result
shows that the p- value is more than α = 10%, so it means that the data in the Error Correction
Model is normally distributed.

International Journal of Arts and Commerce Vol. 6 No. 7 October 2017
9
3. Heteroskedasticity Test
Heteroskedasticity is one of the regression problems which becomes the factor of
disturbance has no similar variant. In other word, there is no consistency in its variant. It means
that the heteroskedasticity has no similar variant for all the research. Because the
heteroskedasticity problem, the result will be bias. In this research, the heteroskedasticity will
be tested by the White Heteroskedasticity (cross term) test. If the probability of Obs*R-Squared
is smaller than the critical value of α = 10%; so that, there is heteroskedasticity occurred in the
Error Correction Model. But, if the probability Obs*R-Squared is more than the critical value
of α = 10%; so that, there is no heteroskedasticity occurred in the model. Based on the result,
the probability of Obs*R-Squared in Error Correction Model is 0.216175. The probability of
the Obs*R-Squared is more than α = 10%. It can be concluded that there is no
heteroskedasticity problem in Error Correction Model.
4. Multicollinearity Test.
Multicollinearity is useful to test the regression model whether it has correlation among
independent variables or not. Multicolinearity can be detected by seeing the coefficient value
of independent variables in the matrix result. If the value of coefficient is less than 0.8, it
means there is multicolinearity problem in the variables. But, if the coefficient value is less
than the 0.8, it can be concluded that there is multicollinearity problem in the variables. It can
be conclude from the result that, the correlation among two independent variables is less than
0.8. It means that there is no multicollinearity problem in the regression model.
Dynamic Assumption Test
1. Stationary Test
Stationary test is the first step in dynamic assumption test before estimating time series
data. If the estimation is not stationary, it will cause the spurious regression and the model cannot
be used.
The concept that used to test the stationary is a unit root test. A variable is said to be
stationary if the average value and variance constant over time and the value of the covariance
between the two time periods only depending on the difference or interval between the two time
periods is not the actual time when the covariance is calculated (Gujarati, 2003).
This study will be used Augmented Dickey-Fuller test to determine whether a time series
data contains the root unit or non-stationary. If the ADF t-statistic value is more than the critical
value, so that the variable has a unit root, then it can be said that the variable is stationary in the
certain level. In the contrary, if the ADF t-statistic is less than the critical value, so that the
variable has no a unit root, then it can conclude that the variable is non-stationary.
Unit root test can be tested through each variable that will be analyzed either dependent
variable or independent variables. This can be seen by the table below:

International Journal of Arts and Commerce ISSN 1929-7106 www.ijac.org.uk
10
TABLE 1. The Unit Root Test Result in Level Degree by Augmented Dickey-Fuller Test Method
The result shows the unit root test through the Augmented Dickey-Fuller (ADF) test
method. The result shows that there is only one variable which is stationary in level degree,
and the rest variables are non-stationary in this degree because the ADF t-statistic is less than
the critical value.
If the data is not stationary in level degree, so that the data cannot be used in the model,
because it will cause of the spurious regression. In conclusion, in order to get the stationary
variables, it is urgent to do the unit root test in the first difference degree.
2. Integration Degree Test.
The integration test is a continuation of the unit root test, if the data is not stationary in
the level degree. So that, the unit root test will be tested into first difference degree. The
integration degree test will be used the Augmented Dickey-fuller method. But if the data is not
stationary in first difference degree, so that it will continue into second difference, until the
data is stationary. Then, the result of the unit root test in first difference degree can be seen
from the following table:
TABLE 2. The Unit Root Test Result in First Difference Degree by Augmented Dickey-FullerTest
Method
ADF
T-Statistic 1% 5% 10%
LOG(GDP)
0.173178 -3.646342 -2.954021 -2.615817
LOG(FDI)
-2.488691 -3.646342 -2.954021 -2.615817
LOG(EX)
0.527809 -3.646342 -2.954021 -2.615817
LOG(INFR)
-3.169615 -3.646342 -2.954021 -2.615817
INFL
-4.792234 -3.646342 -2.954021 -2.615817
Non Stationary
Non Stationary
Stationary
VariableCritical Value
Note
Non Stationary
Non Stationary
ADF
T-Statistic 1% 5% 10%
LOG(GDP)
-5.639789 -3.65373 -2.95711 -2.617434
LOG(FDI)
-8.162684 -3.65373 -2.95711 -2.617434
LOG(EX)
-5.368711 -3.65373 -2.95711 -2.617434
LOG(INFR)
-4.741483 -3.65373 -2.95711 -2.617434
INFL
-6.970533 -3.661661 -2.960411 -2.619160
Stationary
Stationary
VariableCritical Value
Note
Stationary
Stationary
Stationary

International Journal of Arts and Commerce Vol. 6 No. 7 October 2017
11
The result shows that the unit root test result in the first difference degree by the ADF
test. The result shows that the all variables are already stationary in first difference degree,
including foreign direct investment, net export, infrastructure, and inflation rate. All in all,
based on the ADF test, the data that is used in this research integrated in the first difference
degree.
3. Co-integration test.
Co-integration test is the next procedure that should be passed after the integration
degree test. In this test, there will be a test of time series data validation through co-
integration test. Co-integration test is required to provide an early indication that the model
has a long-term relationship in this study.
The method that is used in the co-integration test is the Engle-granger (EG). The co-
integration test can be done, if the all variables integrated in the same degree. The first step of
the co-integration test is by doing the regression of the ordinary least square equation between
dependent variable and independent variables. The result from the co-integration test is that we
can obtained the residual. The regression equation is as follow:
𝐿𝑂𝐺 𝐺𝐷𝑃 = 𝛽0 + 𝛽1 𝐿𝑂𝐺 𝐹𝐷𝐼 + 𝛽2𝐿𝑂𝐺 𝐸𝑋 − 𝛽3𝐿𝑂𝐺 𝐼𝑁𝐹𝑅 − 𝛽4𝐼𝑁𝐹𝐿 + 𝑒
The result of the Eagel-Granger co-integration test is as follow:
𝐿𝑂𝐺 𝐺𝐷𝑃 = 𝛽0 + 𝛽1 𝐿𝑂𝐺 𝐹𝐷𝐼 + 𝛽2𝐿𝑂𝐺 𝐸𝑋 − 𝛽3𝐿𝑂𝐺 𝐼𝑁𝐹𝑅 − 𝛽4𝐼𝑁𝐹𝐿 + 𝑒
𝐿𝑂𝐺 𝐺𝐷𝑃 = 2.162427 + 0.028365 𝐿𝑂𝐺 𝐹𝐷𝐼 + 1.053247 𝐿𝑂𝐺 𝐸𝑋 − 0.223223𝐿𝑂𝐺 𝐼𝑁𝐹𝑅
− 0.010121 𝐼𝑁𝐹𝐿
TABLE 3. The Result of Co-integration Test in Long Term
Based on the result above, the variable of FDI, export, and inflation rate give the
significant result on GDP (economic growth) at level 10%. Meanwhile, the infrastructure
variable is not significant. The determination coefficient (R-squared) is 0.980389 which means
the endogen variable can be explained in linear way by the independent variables in the
Variable Coefficient Standard Error Probability
C 2.162427 0.700476 0.0044
LOG(FDI) 0.028365 0.006596 0.0002
LOG(EX) 1.053247 0.087556 0.0000
LOG(INFR) -0.223223 0.149462 0.1461
INFL -0.010121 0.002681 0.0007
R-squared
Adjusted R-squared
Durbin-Watson stat
F-statistic
Prob(F-statistic) 0.000000
0.980389
0.977684
1.122951
362.4409

International Journal of Arts and Commerce ISSN 1929-7106 www.ijac.org.uk
12
equation for about 98% and the remaining which is 2% can be explained with the other factors
outside equation.
From the regression equation, then it will be estimated the residual variable, as explain
below:
𝑒𝑐𝑡 = LOG(GDP) = 𝛽0+𝛽1𝐿𝑂𝐺(𝐹𝐷𝐼) + 𝛽2𝐿𝑂𝐺(𝐸𝑋) + 𝛽3𝐿𝑂𝐺(𝐼𝑁𝐹𝑅) +
𝛽4𝐼𝑁𝐹𝐿 +e
If the residual variable is already obtained, it will be followed by testing it. The test
aims to observe whether the variable is stationary or not. Form the result of data processing can
be seen as follow:
TABLE 4. The Unit Root Test Result toward the Residual Long Term Equation
Based on the result above, the variable passed because of the probability is lower than
critical value 1%, 5%, 10% which is 0.0010. Thus, it proofs that the co-integration occurs in
the model, so that Error Correction Model can be performed. And it also means that the
stability occurs in the variable of this research.
4. Error Correction Model Test.
The next step is to create the Error Correction Model (ECM) equation. The equation
that will be formulated by this following equation:
∆𝐿𝑂𝐺(𝐺𝐷𝑃) = ∆𝛽0 + ∆𝛽1𝐿𝑂𝐺(𝐹𝐷𝐼) + ∆𝛽2𝐿𝑂𝐺(𝐸𝑋) + ∆𝛽3𝐿𝑂𝐺(𝐼𝑁𝐹𝑅)+ 𝛽4𝐼𝑁𝐹𝐿 +
∆𝛽5𝐸𝐶𝑇 − 1 + 𝑒
Information:
LOG(GDP) = Gross Domestic Product ( reps of economic growth)
LOG(FDI) = Foreign Direct Investment
LOG(EX) = Export
LOG(INFR) = Infrastructure (in KM2)
INFL = Inflation rate
ECT-1 = Residual Equation
The equation is formulated based on the variable which is stationary in first difference
degree that is being showed as ∆ notation. The Error Correction model aims to determine the
short term model of Economic Growth (GDP). By using the ECM, it can combine the short
term effect and long term effect that is caused by the fluctuation and time lag from each
variable. Based on the ECM result, then it will obtain the following result:
ADF
T-statistic 1% 5% 10%
Ect -4.512906 -3.6463 -2.954 -2.6158 0.0010 Stasionary
Variable MacKinnon Critical Value
Prob. Note

International Journal of Arts and Commerce Vol. 6 No. 7 October 2017
13
TABLE 5. The Result of Error Correction Model Estimation
The equation from error correction model can be seen as follow:
∆𝐿𝑂𝐺 𝐺𝐷𝑃
= ∆𝛽0 + ∆𝛽1𝐿𝑂𝐺 𝐹𝐷𝐼 + ∆𝛽2𝐿𝑂𝐺 𝐸𝑋 − ∆𝛽3𝐿𝑂𝐺 𝐼𝑁𝐹𝑅 − 𝐼𝑁𝐹𝐿
− ∆𝛽5𝐸𝐶𝑇 − 1 + 𝑒
∆𝐿𝑂𝐺 𝐺𝐷𝑃
= 0.034813 + 0.012275𝐿𝑂𝐺 𝐹𝐷𝐼 + 0.55736𝐿𝑂𝐺 𝐸𝑋
− 0.052909𝐿𝑂𝐺 𝐼𝑁𝐹𝑅 − 0.011567𝐼𝑁𝐹𝐿 − 0.417701𝐸𝐶𝑇 −1 + 𝑒
The result shows the dynamic model of gross domestic product in short term, where
the variable of gross domestic product as the denotation of economic growth is not only
influence by FDI, export, infrastructure, and inflation rate but also influence by the error
correction term (ECT) variable. The less value of ECT the faster of correction process
through the long run equilibrium. Besides that, the error correction term variable is also said
as the factor of inaction which has a value less than zero (ECT<0). In this research the value
of ECT is less than zero. The coefficient of ECT reach -0.417701 which means the gross
domestic product higher than its long term value.
Based on the calculation above through error correction model, the constant value
about 0.034813 which means that if all the variables are constant, so that the gross domestic
product or the economic growth is about 0.034813 %. Then, the estimation result in long term
shows that the value of R-squared is 0.855998 which means 85.59% of GDP(economic
growth) model can be explained by these variables, namely: FDI, export, infrastructure (in
KM2), and inflation rate. Meanwhile, 14.41% of the model can be explained by the other
factors outside the model.
Variable Coefficient Std. Error t-Statistic Prob.
C 0.034813 0.023264 1.496471 0.1461
D(LOG(FDI)) 0.012275 0.004883 2.513597 0.0182
D(LOG(EX)) 0.557367 0.112073 4.973265 0.0000
D(LOG(INFR)) -0.052909 0.373788 -0.141547 0.8885
D(INFL) -0.011567 0.00131 -8.830922 0.0000
ECT(-1) -0.417701 0.137322 -3.041768 0.0052
R-squared 0.855998 0.071001
Adjusted R-squared 0.829331 S.D. dependent var 0.193346
S.E. of regression 0.079875 -2.053732
Sum squared resid 0.172262 -1.781640
Log likelihood 39.88658 32.09946
Durbin-Watson stat 1.456933 0.000000
Mean dependent var
Akaike info criterion
Schwarz criterion
F-statistic
Prob(F-statistic)
International Journal of Arts and Commerce ISSN 1929-7106 www.ijac.org.uk
14
CONCLUSION
Based on the research and data analysis, the result from regression model by using Error
Correction Model aims to measure the relationship among foreign direct investment, export,
infrastructure, and inflation on economic growth which is represented by gross domestic product in
Indonesia.
As one of the alternatives financing in Indonesia, based on the result, FDI has positive and
significant influence on the economic growth in Indonesia, whether in short or long run which is
relevant with the research done by Mofrad (2012). The capitalization is a media to pool the saving and
investment to be allocated to the more productive, such as the land opening that lead to the more job
opportunities. In the end it will stimulate the economic growth. In order to increase the FDI,
government should evaluate the policy performance to ease the bureaucracy for the foreign companies.
The government should also keep the decent condition in order to have stabile foreign investment in
this country.
The export has positive and significant influence in short and long run. It also becomes the
highest contributor for the economy. This result is relevant with a number of researches such as
Pranoto (2016), Koojaroenprasit (2012) and Mofrad (2012). According to Pranoto (2012), with the
high export, it helps to maintenance the trade balance and add more state budget to be used as the
capital in the economic development that results in economic growth. Export has an important role in
the economic growth in Indonesia, because it is one of the variables in the spending aggregate
equation. Government has to keep and to protect the goods made within the country. From time to
time, there are a number of foreign goods invade the country. The protection should be done to keep
the positive influence on the export value.
Infrastructure variable that is represented by road length has no significant and negative
influence on the economic growth in Indonesia in short run and long run which is relevant with the
research from Wibowo (2016). It can be causes that this variable is not the principal variable on the
economic growth nationally. It is estimated that there is the decreasing quality on the road in
Indonesia. That leads to the negative sign of the coefficient in short run, it also caused, by the huge
capital from government that is used for establishing the road. Despite having a negative relationship,
but the relationship between the length of road infrastructure and the Indonesian economic growth
(GDP) is not significant it is proved that the budgetary resources for the length of road infrastructure
in Indonesia is not only derived from the GDP, but also from other sources such as investments.
Infrastructure is an important thing in Indonesia economy, because it eases the distribution from one
region to another. From the finding, the government is hoping to allocate the budget efficiently in
order to avoid mistakes. With the road development in Indonesia, the maintenance should be
performed as well as the pivot in doing the economic activities.
Inflation has significant and negative influence on the economic growth both for short and long
run. The negative value might be caused by the decreasing of economic growth that results in the
decreasing of income and it hampers the economic growth in Indonesia. This result is relevant with the
research Kasidi and Mwakenda (2013) that inflation has negative and significant influence on
economic growth. With the inflation problem, it is a need to have a precise decision from Central
Bank (BI) as a monetary decision maker. It needs an appropriate strategy to anticipate the inflation
rate which is the Inflation Targeting Framework (ITF).The government should do strict action on
deciding which instrument to be used, either base money or the interest rate, to keep the price stabile.
International Journal of Arts and Commerce Vol. 6 No. 7 October 2017
15
REFERENCES
Acyumida, D., & Eko, U. (2013). Analisis Hubungan Antara Inflasi dan Pertumbuhan Ekonomi
Menggunakan Pendekatan Kointegrasi dan Kasualitas Granger Pada Periode 2000-2012.
Adisasmita, R. (2013). Teori-Teori Pembangunan konomi Pertumbuhan Ekonomi dan Pertumbuhan
Wilayah. Yogyakarta: Graha Ilmu.
Agma, S. F. (n.d.). Peranan Foreign Direct Investment terhadap Pertumbuhan Ekonomi Indonesia.
Basuki, A. T. (2017). Ekonometrika dan Aplikasi dalam Ekonomi (Dilengkapi Aplikasi EVIEWS 7).
Yogyakarta.
Basuki, A. T., & Yuliadi, I. (2014). Elektronik Data Prosesing (SPSS 15 dan EVIEWS 7).
Berg, H. V. (2001). Economic Growth and Development. McGraw-Hill Higher Education.
Boediono, D. (1982). Teori Pertumbuhan Ekonomi. BPFE Yogyakarta.
Greenwald, D. (1998). Encyclopedia of Economic. London: The MIT Press Cambridge.
Gujarati, D. (2003). Ekonometri Dasar. Jakarta: Erlangga.
Haris, A. (2005). PENGARUH PENATAGUNAAN TANAH TERHADAP KEBERHASILAN
PEMBANGUNAN INFRASTRUKTUR DAN EKONOMI.
Irsania, D. V., & Noveria, A. (2014). The Relationship among Foreign Direct Investment, Inflation
Rate, Unemployement Rate, and Exchange Rate to Economic Growth in Indonesia. Journal of
Business and Management.
Izuchukwu, D., & Patricia, N. (2015, June). Impact of Inflation on Economic Growth in Nigeria
(2000-2009). International Journal of Business and Management Review.
Jones, H. G. (1975). An Introduction to Modern Theories of Economic Growth. Great Britain: Thomas
Nelson and Sons, Ltd.
Kasidi, F., & Mwakanemeda, K. (2013). The Impact of Inflation on Economic Growth: A Case study
of Tanzania. Asian Journal of Empirical Research .
Koojaroenprasit, S. (2012, November). The Impact of FDI on Economic Growth: A Case Study of
South Koreaa. International Journal of Business and Social Science, 3.
Kuncoro, M. (2003). Metode Riset Untuk Bisnis dan Ekonomi. Jakarta: Erlangga.

International Journal of Arts and Commerce ISSN 1929-7106 www.ijac.org.uk
16
Mankiw, G. (2003). Teori Makroekonomi.
Mankiw, G. N. (2006). Pengantar Ekonomi Makro-Edisi Tiga. Jakarta: Salemba Empat.
Maryaningsih, N., Hermansyah, O., & Savitri, M. (2014, July). Pengaruh Infrastruktur terhadap
Pertumbuhan Ekonomi Indonesia. Buletin Ekonomi Moneter dan Perbankan, 14.
Meier, G. M. (1989). Leadding Issues in Economic Development. Cambridge: Oxford University
Press.
Mofrad, M. A. (2012). The Relationship between GDP, Export, and Investment: Case Study IRAN.
Business Intelligence Journal.
Pranoto, O. S. (2016, February). Pengaruh Ekspor dan Foreign Direct Investment terhadap
Pertumbuhan Domestik Bruto Indonesia. Jurnal JIBEKA.
Sojodi, S., Mohsoni, F., & Mehin, N. (2012). The Role of Infrastructure in Promoting Economic
Growth in IRAN. Iranian Economic Review.
Sukirno, S. (2002). Makroekonomi Modern: Perkembangan Pemikiran dari Klasik Hingga Keynesian
Baru. Jakarta: Raja Grafindo Persada.
Sukirno, S. (2013). Makroekonomi Teori Pengantar. Jakarta: Rajawali pers.
Sutawijaya, A., & Zulfahmi. (2010, March). PENGARUH EKSPOR DAN INVESTASI TERHADAP
PERTUMBUHAN EKONOMI INDONESIA TAHUN 1980-2006. Jurnal Organisasi dan
Manajemen, 6.
Tambunan, T. (2010). Socio-Economic Impacts of the Global Economic Crisis: The Indonesian Story.
Afro Asian Journal of Social Sciences, 1.
Wibowo, A. B. (2016). Pengaruh Infrastruktur Ekonomi dan Sosial Terhadap Pertumbuhan Ekonomi
Indonesia. Skripsi.
Wuryaningsih, Setyowati, E., & Kuswati, R. (2008, April). KAUSALITAS INVESTASI ASING
TERHADAP PERTUMBUHAN EKONOMI: Error Correction Model. 9.
Yoshino, N., & Nakahigashi, M. (2000). The Role of Infrastructure in Economic.