the-eye.eu archive/the_cathode-ray_… · otherboo\s by johnf.rider servicingsuperheterodynes...
TRANSCRIPT

THECATHODE-RAY TUBE
AT WORK

Other Boo\s
by
JOHN F. RIDER
Servicing Superheterodynes
Servicing Receivers by Means of Resistance
Measurement
Perpetual Trouble Shooter’s Manual
Volume III
Volume IVVolume VVolume VIVolume VII
Volume VIII
Volume IXVolume XVolume XIVolume XII
Volume XIII
Volumes I to V Abridged
Automatic Record Changers and Recorders
Aligning Philco Receivers, Volumes I and II
Automatic Frequency Control Systems
Frequency Modulation
Servicing by Signal Tracing
The Oscillator at Work
The Meter at Work
Vacuum Tube Voltmeters
An Hour a Day with Rider
on
Resonance and Alignment
Automatic Volume Control
Alternating Currents in
Radio Receivers
D-C. Voltage Distribution in
Radio Receivers

THE
CATHODE -RAY TUBE
AT WORKby
JOHN F. RIDER
AUTHOR OF
Perpetual Trouble Shooter’s Manual, Servicins
Superheterodynes, Automatic Frequency Con-
trol Systems, and other Radio Texts
PUBLISHED BY
JOHN F. RIDER PUBLISHER, INC
404 Fourth Avenue New York City

CopyrishI 1935, by
JOHN F. RIDER
All rishfs reserved, includins lhat of IranslaHon
info the Seandifiavian and other foreign languages
FIRST PRINTING, AUGUST, 1935
SECOND PRINTING, OCTOBER, 1935
THIRD PRINTING, JUNE, 1936
FOURTH PRINTING, APRIL, 1937
FIFTH PRINTING, DECEMBER, 1937
SIXTH PRINTING, APRIL, 1939
SEVENTH PRINTING, JULY, 1940
EIGHTH PRINTING, MAY, 1941
NINTH PRINTING, NOVEMBER, 1941
TENTH PRINTING, MARCH, 1942
ELEVENTH PRINTING, MARCH, 1942
TWELFTH PRINTING, MAY 1942
THIRTEENTH PRINTING, AUGUST, 1942
FOURTEENTH PRINTING, DECEMBER, 1942
FIFTEENTH PRINTING, FEBRUARY, 1943
SIXTEENTH PRINTING, APRIL, 1943
Printed in the United States of America

Dedicated to Janet(3 years old)
who displayed tremendous interest
in cathode-ray oscillography by
destroying the manuscript (or the
first three chapters


TABLE OF CONTENTS
Chapter I—THE THEORY OF THE TUBE—1. What the Cathode-ray
Tube is and What it will do— 1. Types of Cathode-ray Tubes—2. What is
in the Cathode-ray Tube?—6. The Western Electric 224 Tube
—
1 . TheRCA 906 Tube—8. How the Cathode-ray Tube Works—10. Optical Analogy
of Focusing—11. Focusing the RCA type Tube—14. Focusing in Other types
of Tubes—17. Magnetic Focusing—-19. Beam Deflection—20. Tubes with
No Plates or One Pair—20. Beam Deflection in Different types of Tubes
—
21. Spot Positioning—30. Persistency of Vision—37. Varying Voltages
Applied to Deflector Plates—41. Magnetic Deflection—44.
Chapter II—SWEEP CIRCUITS—47. Spreading the Image— -48. Time
Sweep Frequency Changed—52. Sweep Frequency that is Half that of
Wave—55. Electronic Sweep Circuits—58. Linearity of Sweep Circuits—64.
Use of 885 tube in Sweep Circuits—66. Other Types of Saw Tooth WaveOscillators—70. 60-cycle Sweep Circuit—73. Distortion of Images Due to
Non-linearity of Sweep—74.
Chapter III—A-C. VOLTAGES ON BOTH SETS OF PLATES—77. Sine
Waves of Equal Frequency and Amplitude—78. Phase Relations of TwoWaves—80. Development of Lissajous Figures—86. Voltages with Variable
Frequency and Amplitude—90.
Chapter IV—COMMERCIAL CATHODE-RAY OSCILLOGRAPHS—93.
National Union Model 3-5 Oscillograph—95. Dumont Model 145 Oscillo-
graph—99. RCA Model TMV-122-B Oscillograph—99. Kaltman-Romander
Oscillograph—103. National Oscillograph—105. Clough Brengle Model
CRA Oscillograph—107. Other Oscillographs—108.
Chapter V—PRACTICAL APPLICATION OF THE CATHODE-RAYOSCILLOGRAPH—110. Spot Position—110. Spot Focusing—114. Sweep
Circuit Control—117. The Sweep Frequency—118. The Synchronizing Con-
trol—119. External Synchronization—127. 60-Cycle Synchronization—128.
Vertical Amplitude—129. Horizontal Amplitude—130. Distortion Due to
Non-linear Sweep—131. General Operating Conditions—132. Phase Differ-
ence Measurement—133. Frequency Comparison—137. Frequency Limits
—
138. Frequency Standards—139. Relative Amplitude of Two Voltages—139.
Interpretation of Completed Loop Patterns—141. Typical Lissajous Patterns
—
142. Phase Splitting Circuits—154. Linear Sweep Circuit as Frequency
Standard—156. Oscillator Calibration—157. Interpreting Ratio Patterns—158.
Dynamic Tube Characteristics—160. Magnetic Deflection Practice—163.
Hysteresis Measurements—166. D-C Voltage Measurements—168. Sensitivity
Ratings of Various Types of Cathode-ray Tubes—171. Direct Current Measure-
ments—172. A-C. Voltmeter Applications—173. A-C. Ammeter Applications
—177. Study of Waveforms—178. Complex Wave Charaaeristics—180.
Development of Complex Waves—180. Amplifier Distortion Measurements
—
vii

Viii TABLE OF CONTENTS
185. Checking Audio Amplifier Overload—188. Checking I-F. Amplifier
Overload—193. Checking Demodulator Output Waveform—198. Checking
Phase Distortion—199. Checking Class ”B” A-F. Amplifier—201. Distortion
in Demodulator—204. Condenser Power Factor Tests—206. Phase Inversion
—207. Checking Test Oscillators—209. Hum Measurements—220. Testing
Tone Controls—224.
Chapter VI—ALIGNMENT OF TUNED CIRCUITS—226. The Motor
Driven Frequency Modulated Oscillator—228. Electrically Operated Frequency
Modulated Oscillators—233. Motor Driven Frequency Modulators—235.
Relation Between Rotating Condenser and Frequency Sweep—239. Synchroniz-
ing Rotating Condenser and Horizontal Sweep—242. Single Image Motor
Driven Frequency Modulator—254. Commercial Frequency Modulated R-F
Oscillators—255. Rectification of the Frequency Modulated Signal—357.
Resonance Curves and Coupled Circuits—261. The Dimensions of the Image—
-
263. Connecting the Oscillograph for Visual Alignment—264. Images with
Spurious Voltages—267. Excessively Strong Frequency Modulated Signal
—
268. Conditions of Alignment—269. Synchronization of Double Image Pat-
tern-—272. Band Width in Variable Band Width Double Image Systems—273.
Constant Band Width Single Image Systems—274. Checking Effect of Damp-ing upon Tuned Circuit Response—278.
Chapter VII—THE A-F. FREQUENCY MODULATOR—280. Determining
Overall A-F Response Curves—280. Practical Applications of the A-F Fre-
quency Modulator—282.
Chapter VIII—AUTO RADIO VIBRATOR TESTING—287. Checking
Non-Synch ronous Vibrators—288. Testing Synchronous Vibrators—290.
Chapter IX—TRANSMITTER ADJUSTMENT—294. Modulation Measure-
ment and Analysis—294. Developing the Trapezoidal Pattern—297. Stopping
Modulated Wave Patterns—301. Transmitter Adjustment—302. Improper
Test Procedure—310.
Chapter X—OTHER APPLICATIONS OF THE CATHODE-RAY OSCIL-LOGRAPH—312. Beat Patterns-—312. CW Reception and Detection—313.
Industrial Applications—313. Other Radio Applications—314.
Appendix—315. Testing Mixer Circuits—315. Checking Test Oscillators
—
315. Photographing the Image—316. Simultaneous Traces—317. Articles on
Cathode-Ray Oscillography—318. Dumont Model 148 Oscillograph—319.
United Sound Engineering Model CR-3 Oscillograph—320. United Sound
Engineering Model CR-5 Frequency-Modulated Oscillator—320. Visual Align-
ment at 600 KC.-—320. Dayrad Series 65 Oscillograph—323. Supreme Model555 Oscillograph—325. RCA Model TMV-122-B Oscillograph Chance—327.
Hickok Model RFO-1 Oscillograph—327. Triumph Model 180 Frequency-
Modulated Oscillator—329. Triumph Model 800 Oscillograph—330. RCA913 Cathode-Ray Tube—331. Alignment of A.F.C. Circuits—332.

INTRODUCTION
The cathode-ray oscillograph is not a new device. It is years old. In fact
the writer employed the instrument almost a decade ago and there were very
many who employed it many years before then. However, its exploitation dur-ing the past six months removed it from the laboratory class and made it aninstrument of general practical utility to an extent far greater than that whichwas accomplished during the past ten years. . . Radio service technicians—^de-
sign engineers—college laboratory technicians—amateur transmitter operators
—
have become cathode-ray oscillograph conscious. This is by no means strange,
for no piece of equipment possesses the versatility and utility equal to that of
this device.
While it is true that "The Cathode-Ray Tube At Work” is intended primar-
ily for the radio servicing industry as a reference text covering the operating
principles and practical applications, it is felt that the contents will be of
value to the design engineer as well, for he, too, has in very many cases searched
in the dark for the conclusions he hoped to reach.
This volume is not intended as an engineering text. It is intended as a
practical book and should be viewed from that angle. The theory covers
the principles underlying the operation of the cathode-ray tube as used in
oscillographs of the type intended for general use in the radio and allied
fields in connection with servicing, design research and "ham” transmitter op-
eration and adjustment. The practical applications covered herein relate to
the servicing of radio receivers and the observation of electrical phenomenaassociated with receiver, amplifier and transmitter components.
The subject of television has been omitted entirely, because we felt that
it did not belong in this volume. However, the theory given in this text
should be of some value in the effort to comprehend the operation of the
cathode-ray tube in television systems. We have omitted discussion of the
application of the cathode-ray tube to fields associated with radio, but far re-
moved from receivers, amplifiers and transmitters as we consider them. We are
referring to the application of the cathode-ray tube for direction finding, study
of static, prevention of collision, blind flying, etc. . . .
We made brief reference to the application of the cathode-ray oscillograph
to the industrial field. But as far as radio servicing is concerned, we feel that
we have covered the subject as fully as it will permit, without making the
text an involved engineering discussion. No doubt, revisions of this volumewill take place in years to come. Changes will take place. The servicing
field in particular is fast approaching an engineering status and as such will
use more and more equipment originally native to the laboratory only. Whenthat time arrives, such a volume will of necessity become more of an engineer-
ing text.
The engineer responsible for the design of cathode-ray equipment will not
find much of value in this volume. This is not an apology, but a statement of
fact. However, the man who is going to apply the cathode-ray oscillograph,
it is hooed, will find a great deal of value.
It is our sincere wish that students will find material of value in these pagesand that more and more educational institutions will find the cathode-ray oscil-
lograph to be of value during instrunion.
It may be of interest to note that all the oscillograms in this book were repro-
duced from unretouched photographs made in the author’s Successful Servicing
Laboratory.
We desire to extend our thanks tor the wholehearted cooperation extendedby Mr. G. C. B. Rowe and Mr. J. Avins, during the preparation of this volume.August 13, 1935. JOHN F. RIDER
ix


CHAPTER I
THE THEORY OF THE TUBE
In the discussion of the cathode-ray tube during the course of this
roliune, it should be understood that we are referring to the types
used in the commercial oscillographs of today, unless in discussion of a
type, the contrary is mentioned.
What Is the Cathode-Ray Tube?
The cathode-ray tube is essentially a special type of vacuum tube,
wherein electrons emitted from a cathode are concentrated into a beam,
which beam is placed under the influence of electric or magnetic, or a
combination of both, fields—and then caused to impinge upon a spe-
cially prepared screen, located within the tube. This screen becomes
fluorescent at the point of impaa of the electron beam and thus makes
visible the trace of the beam in the form of a pattern or image. The
persistency of the pattern is dependent upon the nature of the phenom-
ena, i.e., if transient or recurrent. The shape of the pattern or image
likewise is determined by the nature of the electric or magnetic field,
which has been caused to act upon the electron beam.
Obviously, what has been said is nothing more than a very brief and
general explanation of the tube, leaving much more to be said about
the actual operation of the various elements within the tube and the
utility of the complete cathode-ray oscillograph, wherein the cathode-
ray tube is the basic unit. Much more and detailed information will
follow as you progress through this volume. In order to comprehend
fully the versatility of the device, it is imperative that its operation be
fully understood.
What the Cathode-Ray Tube Will Do
The statements made under this heading assume that the tube is
used in an oscillograph with the proper related apparatus, for as weStated in the preceding paragraph, the tube itself is but one part of the
1

2 THE CATHODE-RAY TUBE AT WORK
complete device. The trace or pattern or image, which appears upon
the viewing screen, provides a visual means of studying transient or
recurrent electric or magnetic phenomena. The nature of the phenom-
ena, which can be studied, is extremely diversified, due primarily to the
fact that the electron beam or stream is practically free of inertia;
consequently it can respond to cyclic variations from a fraction of a
cycle per second to several hundred million cycles. Frankly, at the
time of this writing, the tube itself is more versatile than the ingenuity
of man in being able to design related equipment of equal latitude.
The tube is not limited to use only in the electrical or radio field.
It can be employed for the determination and observation of physical
and mechanical phenomena, by translating the physical or mechanical
phenomena into electric or magnetic phenomena, which then will be-
come visible upon the screen and be suitable for interpretation.
The ability to interpret a pattern or image into its true significance
demands that the operator be familiar with the principles underlying
the operation of the device or devices producing the phenomenon, as
well as with the operation of die cathode-ray tube and its related appa-
ratus comprising the oscillograph.
We shall refrain from listing specific applications of the device at
this time, because detailed discussion of these applications, with illus-
trations, is given in subsequent chapters. To make references at this
time would be so much repetition, without anything being gained.
However, we feel free to speak in generalities and to say that the tube
is suitable for application to the design and servicing of all types of
radio receiving and transmitting apparatus, inclusive of the investigation
of the performance of all of the components employed in receivers and
transmitters. For that matter, we can say that it is suitable for the
investigation of the performance of complete or parts of units which
generate oscillations, modulate, demodulate, rectify and amplify. This
about covers all of the items which are within the province of the radio
serviceman, for whom this volume is primarily intended.
Types of Cathode-Ray Tubes
Speaking once more about the types of cathode-ray tubes used in the
field encompassed by this volume, we find two, which while similar in
many respects, particularly actual performance, have certain points of
dissimilarity. One type of tube is typified by the Western Electric 224
series. This tube employs comparatively low operating voltages, be-
tween 300 and 400 volts, and has a slight gas content, using argon.

THE THEORY- OF THE TUBE 3
The gas employed in this tube aids in the concentration of the beam.
Just what is meant by "concentration of the beam” will become evident
in a subsequent paragraph. This same type of tube employs a cathode
which is a part of the filament structure, as will become evident, when
we show and discuss the actual components of cathode-ray tubes.
The other general type of cathode-ray tube employed in commercial
oscillographs and typified by the RCA 905, 906, 907 and 908 and
National Union and other makes of similar tubes, operates at a higher
voltage and higher vacuum without any gas content. In these tubes,
the cathode is a separate structure, indirectly heated by the heater.
It is obvious from the foregoing that cathode-ray tubes differ in
operating potential. As a result of this difference in operating poten-
tials, and other related controlling factors, cathode-ray tubes have what
is known as different degrees of sensitivity. This would be somewhat
like the different degrees of power output with different types of
amplifying tubes, except that in the cathode-ray tube, the degree of
sensitivity determines the si2e of the image appearing upon the screen
with respect to the amplitude of the electric or magnetic field required
to influence the beam. Perhaps this may be clarified if we stated that
one tube may require a deflecting voltage of 40 volts to produce a one-
inch image on the viewing screen, whereas a less sensitive tube may
require a deflecting voltage of 75 volts to produce an image one inch
long upon the viewing screen. In the cases cited, the deflecting voltage
is secured from the source being investigated. A similar difference in
sensitivity exists with magnetic, as well as electrostatic, deflection. (By
electrostatic deflection is meant defleaion due to voltage.)
Speaking about sensitivity and operating potentials, you should not
take for granted that two tubes of unlike operating voltages (anode
voltages) are widely different in sensitivity. A number of factors com-
bine to produce the variation in sensitivity, so that it is possible for
two tubes of unlike operating voltage, produced by two different manu-
facturers, to have a like rating of sensitivity. Voltage rating and position
of elements influence the sensitivity rating. Just how this sensitivity is
established will be shown later.
Cathode-ray tubes differ in the size of the viewing screen and also in
the type of screen material used. Perhaps you have already noted that
certain tubes will fluoresce green, that is, show a green image, whereas
others may show a blue image or some variation of blue or green. This
is a matter of the chemical composition of the preparation employed for
the viewing screen, which is a coating upon the inner surface of the top-

4 THE CATHODE-RAY TUBE AT WORK
most and widest portion of the tube. Such variations in color are
photographically more or less active and certain tubes are made to
fluoresce blue in order to be suitable for photographic recording of the
image; that is, a photo-active image is desired. Then again, various
compounds fluoresce at different rates and some screens are specially
designed for the observation of high speed transients, which exist for
several microseconds, whereas others require that the image be recurrent
in order that it be satisfactorily visible. Certain materials, such as
would be used for single high speed transients, will remain flourescent
for a short time after the impulse has passed. Generally, screens are
identified as "fast” or "slow” screens; although some have been iden-
tified as general purpose screens. Composite screens are being developed.
General purpose screens are used for the oscillographs being offered to
the radio industry at large. These screens are photographically active.
Examples of photographs taken, with data relative to type of lens,
speed, focus, film, etc., will be given in the section devoted to the
making of oscillograms in the Appendix. Materials used for screens
are willemite, xinc silicate, cadmium tungstate, calcium tungstate and
others.
Concerning the size of the viewing screen, the larger the better
naturally. At the same time the larger the tube, the larger the equip-
ment and the greater the cost and if satisfactory operation is available
with the smaller tube, then there is no reason for the larger tube. Of
course, for photographic purposes, the larger tube is preferable, because
the image to be photographed is larger.
Referring once more to sensitivity, we are speaking about the tube
itself without any related amplifiers. The introduction of the ampli-
fiers used with cathode-ray tubes increases the sensitivity—not because
the tube characteristic is altered in any way, but because the signal
applied to the tube is magnified or strengthened by the amplifiers, so
that a basic 1-voIt signal may be raised to as high as 40 or 50 volts
in the amplifiers, and then applied to the cathode-ray tube. This com-
bination of cathode-ray tube and related amplifiers changes the sensi-
tivity of the combination, making it much greater than with the tube
alone. If the amplifiers were removed and we considered the tube
alone, it would still possess the original degree of sensitiviry.
Although not of the type of tube which service technicians and
radio engineers may have occasion to use, it might be well to say a fewwords about the "cold” cathode type of cathode-ray tube. This is like
the "hot” cathode type of cathode-ray tube, with which we are con-

THE THEORY OF THE TUBE
Type 903 has a 9-inch screen and is designed /electromagnetic deflection.
Type No. 904 has a S-inch screen and but onepair of plates, these being connected to two ofthree caps on the tube's side. This tube was designed for simultaneous electromagnetic and
electrostatic deflection.Type No. 905 has a 5-inch screen and two pairs
of deflecting plates, which are connected to the
four caps on the tube’s side.
Type No. 906 has a 3-inch screen and two pairs
of deflecting plates. All connections to the tubeare made through the prongs on the base.
Courtesy RCA Mfg. Co., Inc.
Types No. 34-8, 54-8, 94-8 (left) have 3, 5and 9-inch screens respectively and four de-
flecting plates that are connected to the terminalson the base. These are gas-focus tubes.
Types Nos. 54-8-C, 94-8-C (middle) have 5- and9-inch screens respectively. The ele-
^ ments are at an angle, making the normal^position of the spot at one side of the
^ screen instead of the centerW Courtesy Allen B. DuMont Laboratories
(y Type No. 908 (right) has a 5-inch screen
I and four deflecting plates connected to t”I prongs on the base. y
Courtesy Rational Umon Radio Core
.IfeKliot/O '’I

6 THE CATHODE-RAY TUBE AT WORK
cerned, but diifers in that the electron emitter, the cathode, is not
heated and the electrons are drawn from the cathode by a nearby
element (anode), to which has been applied a voltage of from 10,000
to 20,000 volts, which is positive with respect to the cathode. In the
hot-cathode type of tube, the emitter emits electrons freely.
Some of the conventional cathode-ray mbes differ in physical dimen-
sions and in the arrangement of connections to the various elements.
Figure 1 illustrates various types of cathode-ray tubes. As is evident,
some types have all the connections in the tube base, whereas others
employ a tube base for certain contacts and have connecting caps on the
sides of the mbes for connection to the remaining elements within the
glass envelope.
What Is in the Cathode-Ray Tube?
You wonder about the strucmre of a cathode-ray tube. Once more
we repeat that our discussion, consequently our descriptions, relate to
those tubes that are used in commercial oscillographs, which employ
the cathode-ray tube and which are being offered to the radio servicing
industry and related industries for the work previously mentioned. Weinclude these qualifications in order to obviate the necessity of describ-
ing other types of cathode-ray tubes, of the very high voltage variety
used in other fields. It is realized that omission of such data imposes
a limitation upon the utility of this volume, yet we feel that the space
and time can be devoted to better advantage by elaborating about
things much closer to home.
We have made reference to two major types of tubes. These are
the Western Electric 224 series and the RCA 906 series and its equiva-
lents. When speaking about types in connection with what elements
are in them, we will omit the tubes which have their connections
through both the side of the glass envelope and through the tube base,
since the actual elements within these tubes are identical to the elements
within similar tubes, wherein all connections are made through the
mbe base.
In the descriptions which follow, we shall merely refer to the elec-
trodes and their general function. After these descriptions are com-
pleted, a more detailed explanation of the operation of the tube and
the function of the electrodes will follow. Our reason for progressing
in this manner, is that we feel that an understanding of the operation
of the components of the tube will be facilitated if you compare the
operation with a conventional optical system, which discussion would
THE THEORY OF THE TUBE 7
be premature if introduced at this time. However, if the optical system
analogy is presented after the description of the elements within the two
types of tubes, the facts gleaned will be more readily associated with
tube operation and action.
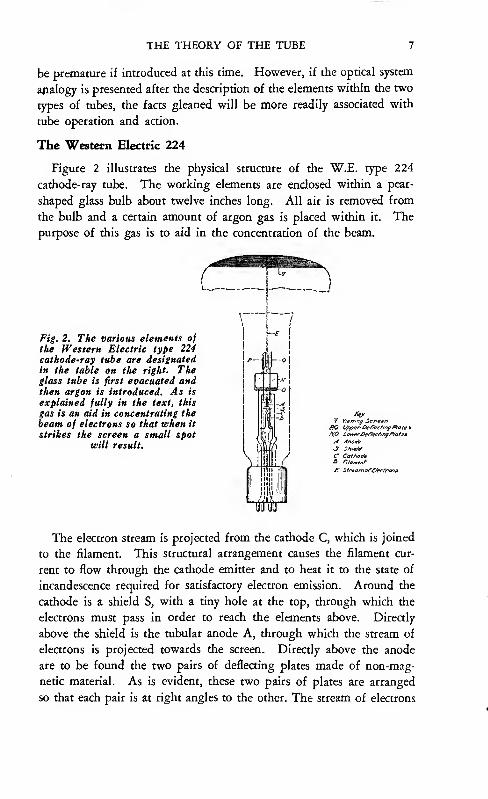
The Western Electric 224
Figure 2 illustrates the physical structure of the W.E. type 224
cathode-ray tube. The working elements are enclosed within a pear-
shaped glass bulb about twelve inches long. All air is removed from
the bulb and a certain amount of argon gas is placed within it. The
purpose of this gas is to aid in the concentration of the beam.
Fig. 2. The various elements of
the Western Electric type 224cathode-ray tube are designatedin the table on the right. Theglass tube is first evacuated andthen argon is introduced. Asexplained fully in the text, this
gas is an aid in concentrating the
beam of electrons so that when it
strikes the screen a small spotwill result.
The electron stream is projected from the cathode C, which is joined
to the filament. This structural arrangement causes the filament cur-
rent to flow through the cathode emitter and to heat it to the state of
incandescence required for satisfactory electron emission. Around the
cathode is a shield S, with a tiny hole at the top, through which the
electrons must pass in order to reach the elements above. Directly
above the shield is the tubular anode A, through which the stream of
electrons is projected towards the screen. Directly above the anode
are to be found the two pairs of defleaing plates made of non-mag-
netic material. As is evident, these two pairs of plates are arranged
so that each pair is at right angles to the other. The stream of electrons

8 THE CATHODE-RAY TUBE AT WORK
projected from the cathode, after passing through the tubular anode,
pass between these two sets of deflecting plates. If you viewed these
two pairs of plates from the top of the tube and could also see the
electron stream, it would appear as shown in figure 3, the stream coming
Beam o* vrovld
appear from fhr top.
Vertical Defltcf-
inp Plotez
_yHoniontai De
Fig. 3. If it were possible to see through the screenat the tube's end, the electron stream would appearas a small dot in the middle of a square formed bythe two sets of deflection plates, on which no
deflecting voltage was impressed.
through in the center of what is a small square. The fluorescent screen
is spread over the inner surface of the top of the tube. So much for
the arrangement of the elements within the W.E. type 224 tube.
The RCA 906 Type
Now for the arrangement of the elements in the tubes typified by
the RCA 906, shown in figure 4. H is the heater. Around the heater
is the cathode C. Surrounding the cathode is a shield G, with a small
opening directly above the emitter portion of the cathode. This is
known as the control grid. This cathode is fastened to one side of an
insulating member. To the other side of this insulating member is
attached another cylinder with a small aperture. This is known as
anode number 1. The aperture in this anode is in line with the aper-
ture in the grid sleeve anode. Above anode 1 is anode 2. Above the
anodes are the two sets or pairs of deflecting plates. Whereas in the
Western Elearic tube, each pair is mounted parallel, in the RCAtube, and in some others, they are mounted in an oblique manner,
although in some other tubes of this type, the two pairs of deflecting
plates are mounted perpendicularly. The viewing screen is spread
across the inner surface of the uppermost portion of the tube. The
beam of electrons emitted from the cathode, after passing through the
various electrodes, pass between the two sets of plates, as in the case of
the previous type of mbe. However, this statement should not be
construed as being a positive statement applicable to all tubes.
In some of the higher powered tubes of this type, such as are em-
ployed in connection with the observation of high powered transient
phenomena, one or both pairs of deflecting plates are adjustable from
the outside. These tubes are, of course, special tubes, somewhat beyond
the type in which we are interested.

THE THEORY OF THE TUBE 9
There are also in use tubes similar to that illustrated in figure 4,
but wherein one pair of deflecting plates are used. In some, all plates
are omitted. How this arrangement is employed will be discussed
after we explain the basic facts underlying the operation of the tube.
In all of the tubes, which have been mentioned up to this point,
the mechanical arrangement of the electrodes is such that when the
electron beam is projected to strike the viewing screen, the fluorescent
spot appears in the center of the viewing screen. However, there is
another type of tube, similar in electrode complement, wherein the
entire assembly is definitely tilted, so that the original spot appears
at one edge of the screen rather than in the exact center. This special
purpose tube provides a greater operating area upon the screen for
certain types of observations. Just how such a tube is beneficial at times,
will become evident when we consider the practical applications.
Fig. 4. In the sketch of the RCA type 906 tube the following letters indicate
the various elements: H, the heater; C, cathode; G, shield grid; Al, first
anode; A2, second anode. The two pairs of deflecting plates are to the right
of A2. It will be noted that these plates are at an angle to the main axis of
the tube. This arrangement of elements in a glass envelope or bulb constitutes
what is sometimes referred to as an "electron gun."
If you review the electrode arrangement in the Western Electric type
of the tube and in the RCA and equivalent types of tubes, you cannot
help but note certain differences. It is true that certain electrodes
appear in both types of tubes, that is, are common to both types, but
there are certain differences in the number of electrodes employed in
these tubes between the electron emitter and the deflecting plates. At
the same time, it is imperative that you understand that both tubes will
perform the same functions in cathode-ray oscillographs. You will
learn in the subsequent section, how the same objective is attained in
these tubes, although the number of electrodes is not the same.

10 THE CATHODE-SAY TUBE AT WORK
How the Cathode-Ray Tube Works
As is true in any number of instances, best utilization of a piece of
equipment is obtained when the operator is thoroughly familiar with
the operation of the device. That is why we place such importance in
knowing how the electron beam in the cathode-ray tube is controlled
at the various electrodes. If the focusing of the tube and the effect of
the various electrodes is fully comprehended, some of the peculiar
effects encountered with these tubes will be recognized and corrective
measures instituted. However, to apply the cathode-ray tube by me-
chanically following specific instructions, will be found to introduce
myriad limitations. Consequently, we feel that it will be to your
advantage if you read again and again the text relating to the basic
operation of the tube itself. Assimilate this portion of this volume
and you will develop a solid foundation upon which to build the
structure of successful cathode-ray oscillograph application.
The focusing of the electron beam is one of the important points
of information, which should be imderstood by the man who intends
applying the tube to his work. While it is true that this is but one of
the many operations relating to the application of the tube, no harm
can come from thoroughly understanding what happens during the
process of focusing.
Focusing of the beam is an important operation. Without it, the
utility of the tube would be praaically nil. The stream of electrons
projected from the cathode travels in all directions from the cathode.
To place it under the influence of the electric or magnetic fields, it is
necessary that the emitted electrons first be concentrated into a beam
and then be properly located, so that these fields be enabled to act
upon the beam. Concentration into a beam is essential in order that
the trace upon the viewing screen be readily distinguishable, particu-
larly the fine variations which may appear in the pattern. Furthermore,
proper acceleration of the electrons is required, so that when they strike
the viewing screen, the impact will be sufficiently great to cause fluor-
escence. Focusing is a function of this acceleration.
If the emitted electrons are not concentrated into a beam, the image
position will not be under control. Neither will it be possible for the
electric or magnetic fields, whichever are used, to act uniformly and to
produce an image which will be of value in studying the phenomena,
unless the beam is properly focused. An incorrectly focused beam in a
cathode-ray tube results in a large spot with a halo around it. In

THE THEORY OF THE TUBE 11
some instances, improper focusing results in a very wide spot, which,
when spread as a result of the deflection, produces extremely wide lines
of non-uniform width in the pattern. Considering all of the factors,
focusing of the beam should be imderstood.
To expedite comprehension of the focusing operation, we deem it
worthwhile to present a simple optical analogy. While it is true that
this analogy is more readily applicable to the RCA type of tube than
to the W.E. type, it should also be remembered that it is more true
with the type of tube most frequently employed in connection with
radio servicing. At the same time, comprehension of the analogy is all
that matters in order to facilitate the understanding of what takes place
within the cathode-ray tube.
Optical Analogy of Focusing
Suppose that we consider a simple optical system, such as that shown
in figure 5. The variables which present themselves in this analogy,
Fig. S, A sketch of an optical system that is analogous to the elements of anRCA cathode-ray tube. L is a light source, whose output can be controlled bythe variable opening of the shutter S. O and P are lenses, which concentrate
the beam to a spot on the screen Sc.
are very much like the variables which are found in the RCA type of
cathode-ray tube. You will realize this as we continue the discussion.
This optical system consists of a source of light L, a stop, or light gate,
S, two lenses, O and P, and a screen Sc.
The purpose of the system is to projea the light from the lamp L
upon the screen Sc, in the form of a small but intense spot of light.
More than likely, you have focused the sun’s rays onto your hand with
a lens, and if you were of an experimental nature, one of your pranks
during your youth was to start a fire by focusing or concentrating the
rays from the sun onto a piece of paper. The nature of the light gate
or stop, is like that of a stop on a camera; in other words, a device
with an opening of variable size. By means of this device the amount
of light passed from the lamp L to the lens O, is definitely under
control. At the same time, we can further assume that the intensity of

12 THE CATHODE-RAY TUBE AT WORK
the lamp, L, is also under control. In other words, a rheostat can be
assumed to exist in the power supply circuit feeding the lamp.
The two lenses are of the type which will pick up the light from
some source, concentrate the beam and project a pin point of light
upon a screen at a definite distance from the lens. In the process of
projection from lens P, the light from lens P is caused to converge into
a spot upon the screen.
We stated that the objective of the system, shown in figure 5, is to
project a spot of light of suitable intensity and proper size and defini-
tion, upon the screen Sc. Let us consider first, the first of these require-
ments, namely, the intensity of the spot. Obviously, this depends upon
the amount of light available from L. If the original light source is
not sufficiently luminous, all the concentration in the world is not going
to produce a sufficiently luminous spot. On the other hand, while the
light source may be sufficiently intense, any adjustment, as for example
some setting of the stop S, which may reduce the amount of light
conveyed from L to the lens O, will interfere with the intensity of the
spot and if this adjustment is such that the light transferred is insuffi-
cient, the intensity level of the spot upon the screen will not be suitable.
Bear in mind that at this time, we are concerned solely with the
intensity or the brightness of the spot or image.
As is evident two variables are existent, which are directly asso-
ciated with the intensity or luminosity of the spot. If we desire to
vary the intensity of the light, we have two variable controls, either or
both of which may be used. If we should decide to keep the brilliancy
of the lamp L, fixed, adjustment of the opening of the stop S would
give us the desired control. On the other hand, if we desired to keep
the adjustment of the stop opening fixed, the filament control in the
lamp circuit would give us the intensity control. Naturally, there is
no reason for a dual control of the same thing, so that we can forget
for the moment any variation in the brilliancy of the lamp and use only
the stop opening as our intensity control. When the stop is opened
wide, the full intensity is realized, because the maximum amount of
light goes through. When the stop opening is closed, no light passes
through. It should be understood that the only way that light from
lamp L can reach lens O is through the stop S. Any setting of the
stop opening, between wide open and fully closed, will provide a range
of intensity.
Now for the concentration of the light into a beam, which will
converge at some distance from the lens P, and become a spot upon the
THE THEORY OF THE TUBE 13
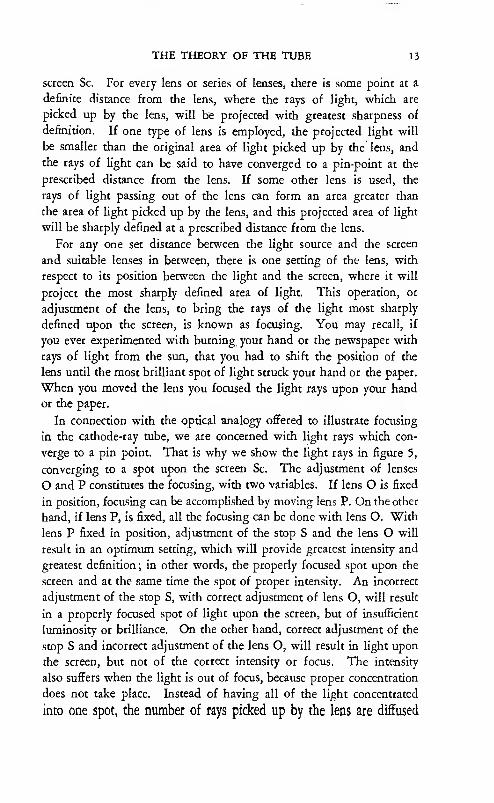
screen Sc. For every lens or series of lenses, there is some point at a
definite distance from the lens, where the rays of light, which are
picked up by the lens, will be projected with greatest sharpness of
definition. If one type of lens is employed, the projected light will
be smaller than the original area of light picked up by the lens, and
the rays of light can be said to have converged to a pin-point at the
prescribed distance from the lens. If some other lens is used, the
rays of light passing out of the lens can form an area greater than
the area of light picked up by the lens, and this projected area of light
will be sharply defined at a prescribed distance from the lens.
For any one set distance between the light source and the screen
and suitable lenses in between, there is one setting of the lens, with
respect to its position between the light and the screen, where it will
project the most sharply defined area of light. This operation, or
adjustment of the lens, to bring the rays of the light most sharply
defined upon the screen, is known as focusing. You may recall, if
you ever experimented with burning your hand or the newspaper with
rays of light from the sun, that you had to shift the position of the
lens until the most brilliant spot of light struck your hand or the paper.
When you moved the lens you focused the light rays upon your hand
or the paper.
In connection with the optical analogy offered to illustrate focusing
in the cathode-ray tube, we are concerned with light rays which con-
verge to a pin point. That is why we show the light rays in figure 5,
converging to a spot upon the screen Sc. The adjustment of lenses
O and P constitutes the focusing, with two variables. If lens O is fixed
in position, focusing can be accomplished by moving lens P. On the other
hand, if lens P, is fixed, all the focusing can be done with lens O. With
lens P fixed in position, adjustment of the stop S and the lens O will
result in an optimum setting, which will provide greatest intensity and
greatest definition; in other words, the properly focused spot upon the
screen and at the same time the spot of proper intensity. An incorrect
adjustment of the stop S, with correct adjustment of lens O, will result
in a properly focused spot of light upon the screen, but of insufficient
luminosity or brilliance. On the other hand, correct adjustment of the
stop S and incorrect adjustment of the lens O, will result in light upon
the screen, but not of the correct intensity or focus. The intensity
also suffers when the light is out of focus, because proper concentration
does not take place. Instead of having all of the light concentrated
into one spot, the number of rays picked up by the lens are diffused

14 THE CATHODE-RAY TUBE AT WORK
over a greater portion of the screen, with reduced light at any one point.
It is significant to note that with the position of the light source L,
the opening of stop S and the screen Sc permanently fixed, the pro-
jection of the best defined spot is determined by the relative positions
of the lenses O and P. Incidentally, such focusing can be done with
but a single lens in place of O and P.
Focusing the RCA Type Cathode-Ray Tube
Let us now associate figure 5 with the electrodes used in the RCAtype cathode-ray tube and see how closely the optical analogy of focus-
ing is like the electrical means employed in the tube. Examine figure 6.
H is the heater. C is the cathode, which is the electron emitter and
equivalent to the light source. G is the control grid and is the equiva-
lent of the light gate, or stop S. Just why this is so will be stated
later. Anode Al is the equivalent of lens O and anode Al is the
equivalent of lens P. The viewing screen Sc is the equivalent of the
screen Sc in figure 5.
Fig. 6. The path of the electron stream through an RCA cathode-ray tube is
here shown. The heater, H, warms the cathode, C, from which the electronsare emitted. The stream is concentrated and accelerated by the two anodes,A I and A2, finally appearing as a spot on the screen. Sc. See Fig. S for
optical analogy.
The control grid G, which is not really a grid in the normal sense,
functions as an electron gate or stop, just as the stop S, serves as a
light gate because of the following: The electrons which are emitted
from the cathode are negative particles. For any one temperature of
the cathode, the maximum number of electrons are emitted by the
cathode for that temperature. However, in operation, if we desire
control of the intensity of the spot, we must have some means of con-
trolling the number of elearons allowed to pass into what finally
becomes the beam, it being acknowledged that the intensity of the spot
upon the viewing screen is dependent upon the number of elearons in
the beam, just as the intensity of the spot in the optical analogy is
dependent upon the amount of light allowed to pass to the lenses.
Control of the number of electrons, which are permitted to pass
THE THEORY OF THE TUBE 15
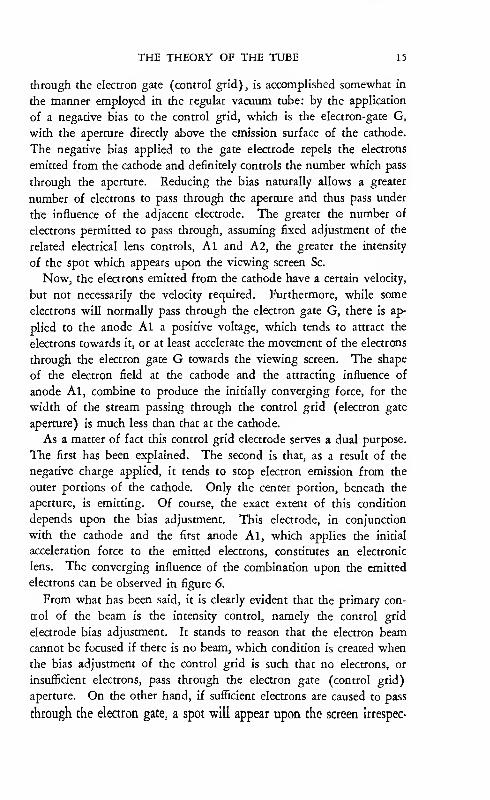
through the electron gate (control grid), is accomplished somewhat in
the manner employed in the regular vacuum tube: by the application
of a negative bias to the control grid, which is the electron-gate G,
with the aperture directly above the emission surface of the cathode.
The negative bias applied to the gate elearode repels the elearons
emitted from the cathode and definitely controls the number which pass
through the aperture. Reducing the bias naturally allows a greater
number of electrons to pass through the aperture and thus pass under
the influence of the adjacent electrode. The greater the number of
electrons permitted to pass through, assuming fixed adjustment of the
related electrical lens controls, Al and A2, the greater the intensity
of the spot which appears upon the viewing screen Sc.
Now, the electrons emitted from the cathode have a certain velocity,
but not necessarily the velocity required. Furthermore, while some
electrons will normally pass through the electron gate G, there is ap-
plied to the anode Al a positive voltage, which tends to attract the
electrons towards it, or at least accelerate the movement of the electrons
through the electron gate G towards the viewing screen. The shape
of the electron field at the cathode and the attracting influence of
anode Al, combine to produce the initially converging force, for the
width of the stream passing through the control grid (electron gate
aperture) is much less than that at the cathode.
As a matter of fact this control grid electrode serves a dual purpose.
The first has been explained. The second is that, as a result of the
negative charge applied, it tends to stop electron emission from the
outer portions of the cathode. Only the center portion, beneath the
aperture, is emitting. Of course, the exact extent of this condition
depends upon the bias adjustment. This electrode, in conjunction
with the cathode and the first anode Al, which applies the initial
acceleration force to the emitted electrons, constitutes an electronic
lens. The converging influence of the combination upon the emitted
electrons can be observed in figure 6.
From what has been said, it is clearly evident that the primary con-
trol of the beam is the intensity control, namely the control grid
electrode bias adjustment. It stands to reason that the electron beam
cannot be focused if there is no beam, which condition is created when
the bias adjustment of the control grid is such that no electrons, or
insufficient electrons, pass through the electron gate (control grid)
aperture. On the other hand, if sufficient electrons are caused to pass
through the electron gate, a spot will appear upon the screen irrespec-

16 THE CATHODE-RAY TUBE AT WORK
live of the adjustment of the anode A1 voltage, just as in the case of
the simple optical system, shown in figure 5, where, if light is caused
to pass through the stop, light will be visible upon the screen, even if
the adjustment of the lens O is not correct.
In the case of the tube shown in figure 6, the voltage applied to the
anode Al is the primary focusing voltage, since the first focusing action
takes place in the region of the first anode Al, as illustrated in figure 6.
There is a small aperture at the end of anode Al, which is nearest
anode A2. The function of Al is to converge the initial beam for
passage through this aperture. Those elenrons, which are too diver-
gent from the beam, are stopped by this aperture. A comparison
between the optical system shown in figure 5 and the electrical optical
system in the cathode-ray tube shown in figure 6, shows a parallel
between L, S and O in figure 5 and between C, G and Al in figure 6.
The main focusing action in the cathode-ray tube, shown in figure 6,
takes place between anodes 1 and 2. A fixed high voltage is applied
to the anode A2. This voltage is fixed and positive with respect to
the cathode and from 4 to 5 times as great as the voltage applied to
anode Al. Anode A2 voltage accelerates the electrons to the velocity
required to produce fluorescence, when they strike the screen. The
electrons, which pass through the beam defining aperture on Al,
are brought to a focus as a result of the combined action of Al and A2,
but this time are caused to converge into a spot at a certain distance
from anode A2, namely, upon the screen. Anode A2 also has a beam
defining aperture, so that elearons which are too divergent from the
main beam are not permitted to pass through.
You recall, during the discussion of the optical system, that lens P
was fixed and that focusing was carried on by adjustment of lens O.
With the position of L and the adjustment of S also fixed, it is obvious
that focusing of the light upon the screen Sc is governed by the rela-
tive positions of the two lenses, O and P. The same is true in the
cathode-ray tube, figure 6, but in this case, with cathode emission fixed,
the focusing of the beam upon the screen is determined by the ratio of
voltages applied to anodes Al and A2. With anode A_2 voltage fixed,
the proper focusing adjustment is made by varying the voltage applied
to anode Al.
We made the statement that if the intensity adjustment, or the bias
applied to .the control grid, was correct, electrons would strike the
viewing screen irrespective of the setting of the anode Al (focusing)
voltage. That is true, but it is also important to remember that if the

THE THEORY OF THE TUBE 17
adjustment of the control grid voltage is such that insulEcient electrons
are passed, or if the emission from the cathode is insufficient, variation
of the focusing voltage may cause the spot to disappear from the
screen. There are several possible reasons for this. One is that as a
result of incorrect focusing, insufficient acceleration is given to the
electrons and comparatively few reach the high voltage anode A2.
Second, is the diffusion of the beam, which results in less than the
required light to appear as an image.
The production of a bright and sharply defined spot upon the
screen is accomplished by correaly conrrolling the intensity and the
focusing. The size of the spot is influenced by both the intensity and
the focusing controls.
Focusing in Other Types of Tubes
You may have noted that the focusing of the beam in the RCA type
of tube is a result of the fields developed by the voltages applied to
the anodes. In other words, the concentration of the electrons into a
beam is accomplished by these fields. The Western Electric tube
employs a somewhat different manner of concentration. We stated
in connection with the electrode arrangement shown in figure 2, that
the tube contained a cathode, a shield and an anode. In contrast to
the fixed potential cathode employed in the RCA tube, the W.E. tube,
figure 7, employs a variable potential cathode C, By this we mean that
Fig. 7. In a Western Electric
cathode-ray tube, the cathode, C,is a part of the filament, F. This
is in turn connected to the
shield, G. A fixed positive vol-
tage is applied to the anode. A,for acceleration purposes.
A
the current flowing through the cathode is varied by means of a rheo-
stat and thereby controls the emission. The shield or electron gate Gis elearically connected to the cathode at one point. The anode A is
connected to a fixed voltage source, which applies a positive voltage
to this electrode. Further, a certain amount of inert gas is placed
within the glass envelope.
How is this tube focused.^ It is lacking the focusing electrode. It
has the intensity control, although not in the same manner as the other
18 THE CATHODE-RAY TUBE AT WORK
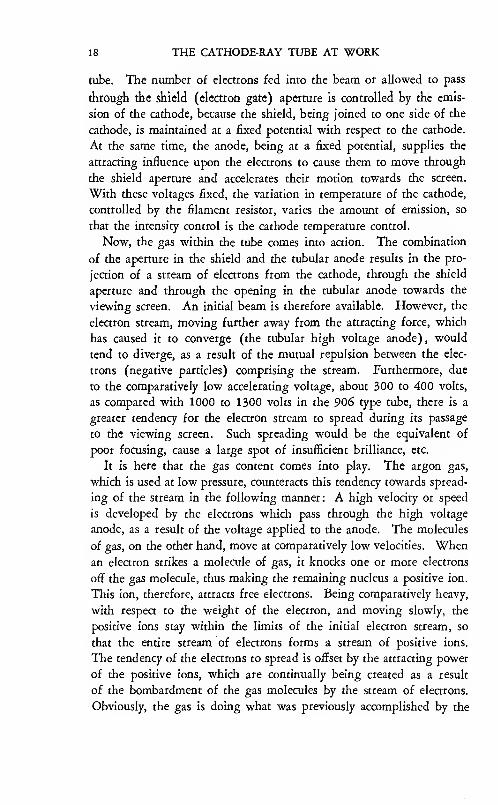
tube. The number of electrons fed into the beam or allowed to pass
through the shield (electron gate) aperture Is controlled by the emis-
sion of the cathode, because the shield, being joined to one side of the
cathode, is maintained at a fixed potential with respect to the cathode.
At the same time, the anode, being at a fixed potential, supplies the
attracting influence upon the electrons to cause them to move through
the shield aperture and accelerates their motion towards the saeen.
With these voltages fixed, the variation in temperature of the cathode,
controlled by the filament resistor, varies the amount of emission, so
that the intensity control is the cathode temperature control.
Now, the gas within the tube comes into action. The combination
of the aperture in the shield and the tubular anode results in the pro-
jection of a stream of electrons from the cathode, through the shield
aperture and through the opening in the tubular anode towards the
viewing screen. An initial beam is therefore available. However, the
electron stream, moving further away from the attracting force, which
has caused it to converge (the tubular high voltage anode), would
tend to diverge, as a result of the mutual repulsion between the elec-
trons (negative particles) comprising the stream. Furthermore, due
to the comparatively low accelerating voltage, about 300 to 400 volts,
as compared with 1000 to 1300 volts in the 906 type tube, there is a
greater tendency for the electron stream to spread during its passage
to the viewing screen. Such spreading would be the equivalent of
poor focusing, cause a large spot of insufficient brilliance, etc.
It is here that the gas content comes into play. The argon gas,
which is used at low pressure, counteracts this tendency towards spread-
ing of the stream in the following manner: A high velocity or speed
is developed by the electrons which pass through the high voltage
anode, as a result of the voltage applied to the anode. The molecules
of gas, on the other hand, move at comparatively low velocities. Whenan electron strikes a molecule of gas, it knocks one or more electrons
off the gas molecule, thus making the remaining nucleus a positive ion.
This ion, therefore, attracts free electrons. Being comparatively heavy,
with respect to the weight of the electron, and moving slowly, the
positive ions stay within the limits of the initial electron stream, so
that the entire stream of electrons forms a stream of positive ions.
The tendency of the electrons to spread is offset by the attracting power
of the positive ions, which are continually being created as a result
of the bombardment of the gas molecules by the stream of electrons.
Obviously, the gas is doing what was previously accomplished by the

THE THEORY OF THE TUBE 19
focusing anodes and voltages, namely, concentrating the stream of
electrons.
The only variable control, which is found in this type of tube, is
the rheostat, controlling the cathode temperature. The adjustment of
the cathode temperamre, or elearon emission, serves the dual purpose
of controlling intensity as well as focus. Both are simultaneously ac-
complished, because there is a critical temperature, at which the spot
upon the viewing screen is small and brilliant. If the adjustment of
the cathode temperature is such that insufficient electrons are emitted,
the spot will not be bright. On the other hand, if the emission is too
great, the spot becomes too wide for practical use.
Some of the commercial cathode-ray tubes of the type which have
separate intensity and focusing controls are equipped with but one
continuously variable control on the face of die panel. This is the
intensity control. The focusing control, that is, the adjustment of the
accelerating anode voltage (Al in figure 6) ,is a screw control on the
side of the box housing the equipment. Such an arrangement is
deemed advisable by some manufacturers on the ground that the
focusing adjustment for any one tube is changed but little during
normal operation of the tube. This is a matter of opinion and also is
dependent upon the type of observation work being carried on.
Magnetic Focusing
The methods of focusing the beam, as described thus far, have
employed electrostatic fields. It is also possible to focus the beam with
a magnetic field. Incidentally, this reference to focusing should not
be confused with the application of electrostatic or magnetic fields for
the purpose of deflecting the beam during the observation of electric
or magnetic phenomena. The reference to focusing is that relating to
the proper concentration of the beam so as to enable the application of
the deflecting voltages and to create the proper image.
In magnetic methods of focusing, powerful magnetic fields are
developed by passing current through coils located outside the tube,
coaxially around the tube’s neck. In view of the fact that magnetic
focusing is not used in the field, which is the destination of this
volume, and since this volume is not intended as a text for those asso-
ciated with the design of cathode-ray oscillograph apparatus, it is
deemed best to make nothing more than this brief reference.

20 THE CATHODE-RAY TUBE AT WORK
Tubes With No Plates or One Pair
There are tubes, as has been stated, which contain but one pair of
deflecting plates and outside magnetic deflection coils must be em-
ployed. Then again, there are cathode-ray tubes without any deflecting
plates within the glass envelope and magnetic deflection must be used.
These are general descriptive references. The types of tubes, which are
used in connection with radio receiver design and servicing, invariably
are of the type equipped with two pairs of internal deflecting plates,
and are suitable, when such is desired, for use with external magnetic
defleaion coils. This is the type we shall consider in this text, showing
its application to radio receiver and component design and servicing.
Incidentally, elearostatic defleaing plates may also be located outside
the tube, but such tubes are not commonly used in the radio industry.
The Deflection of the Beam
There are two important functions performed in the cathode-ray
tube oscillograph. The first is the focusing of the electron stream into
a narrow concentrated beam of electrons. The second is the placement
of this beam under the influence of an electric or magnetic, or combi-
nation of both, types of field, in order to secure the proper deflection
of the beam. Deflection of the beam results in a pattern or image
visible upon the fluorescent viewing screen, which pattern furnishes the
information desired.
The illustrations showing the focusing of the electron beam create
the impression that the beam is quite wide. An illustration, which
would really show the properly focused beam as narrow as it really is,
would make comprehension of the process of focusing much more
difficult. Consequently, we show the properly focused beam muchwider than it actually is within the tube. When the tube is properly
operated, the beam is a very narrow pencil of electrons, which produces
a spot with a diameter not greater than perhaps to A of an
inch. Such is the diameter of the spot found in tubes of the W.E.
224 type and the usual run of cathode-ray tubes with 3-inch diameter
viewing screens. Some of the tubes with larger screens have larger
spots, since the type of elearodes used are comparably larger. At any
rate, the beam, when placed under the influence of the defleaing fields,
should be understood to be a narrow stream of electrons. That is howwe will show them.
We made the statement that two types of deflection were available;
namely, elearostatic (electric) and magnetic. All of the smaller tubes

THE THEORY OF THE TUBE 21
are arranged for electrostatic deflection and contain the two pairs of
deflecting plates, which enable the application of deflecting fields in two
directions. However, even these tubes may be used for magnetic deflec-
tion, by the location of the proper deflecting coils around the outside
of the neck of the tube.
When considering the process of deflection, it is imperative that
you realize several pertinent facts. These are;
1. Electrons are particles, bearing a negative charge at all times.
2. Electrons are repulsed by a negative field produced by any
medium.
3. Electrons are attracted by a positive field produced by any
medium.
4. The electrons which pass through the deflecting fields are in a
narrow stream or beam.
In this discussion of the deflection of the beam, we will consider first
the deflection with an electrostatic field and then with magnetic fields.
In this connection, whatever is said, is equally applicable to the RCAtype of tube and the W.E. type of tube. As far as deflection is con-
cerned, the nature of the electron emitter and the type of accelerating
anode or anodes used are of no consequence. The primary consideration
is the existence of the electron stream within the deflecting field. There
is a relation between the means of focusing and the strength of the de-
flecting field in order to produce a certain deflection, but this subject can
await its discussion until the proper time. Figure 8, illustrates the beam
passing through two pairs of deflecting plates on its way to the screen.
There is no necessity for showing the cathode, control grid and anode
structure. These can be assumed.
The position of the beam, without any voltages applied to the deflec-
tion plates, is midway between the plates, which should place the spot in
the center of the viewing screen. The positioning of this spot is the
same irrespective of the physical arrangement of the plates; that is, if
they are perfectly straight with respect to each other, as in figure" 8A,
or if they are tilted as in figure 8B.
There are electrical and mechanical influences, wholly undesired,
which will tilt the beam, so that it does not strike the viewing screen
exactly in the middle. Incorrect positioning of the deflecting plates,
static charges upon the bulb, external magnetic bodies, etc., are some
of these influences. However, many of the tubes have means of posi-
tioning the beam, so that the spot impinges upon the screen at the
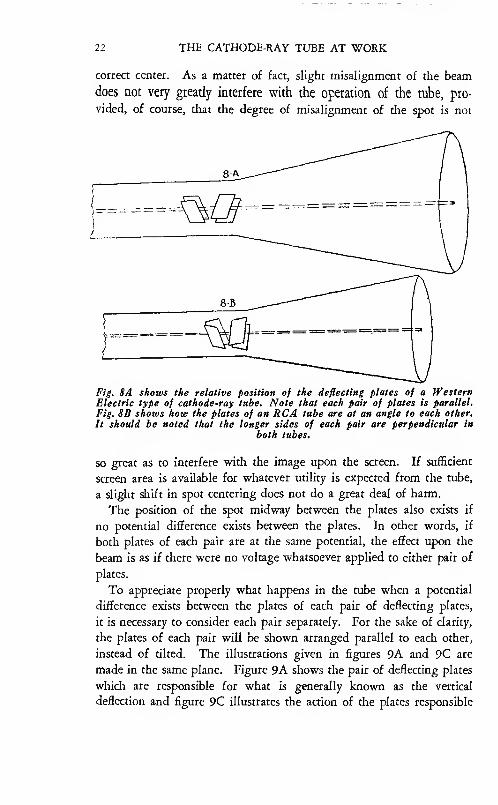
22 THE CATHODE-RAY TUBE AT WORK
correct center. As a matter of fact, slight misalignment of the beam
does not very greatly interfere with the operation of the tube, pro-
vided, of course, that the degree of misalignment of the spot is not
Fig. SB shows how the plates of an RCA tube are at an angle to each other.
It should be noted that the longer sides of each pair are perpendicular in
both tubes.
so great as to interfere with the image upon the screen. If sufficient
screen area is available for whatever utility is expected from the tube,
a slight shift in spot centering does not do a great deal of harm.
The position of the spot midway between the plates also exists if
no potential difference exists between the plates. In other words, if
both plates of each pair are at the same potential, the effect upon the
beam is as if there were no voltage whatsoever applied to either pair of
plates.
To appreciate properly what happens in the tube when a potential
difference exists between the plates of each pair of deflecting plates,
it is necessary to consider each pair separately. For the sake of clarity,
the plates of each pair will be shown arranged parallel to each other,
instead of tilted. The illustrations given in figures 9A and 9C are
made in the same plane. Figure 9A shows the pair of deflecting plates
which are responsible for what is generally known as the vertical
deflection and figure 9C illustrates the action of the plates responsible

THE THEORY OF THE TUBE 23
for the horizontal deflection. Explanations of what constitutes vertical
and horizontal deflections will follow immediately after the discussion
of why the deflection occurs.
Fig. 9A shows the pair of deflecting plates that cause the electron beam to
move vertically and Fig. 9C, the plates that are responsible for the horizontal
movement. Figs. 9B and 9D show the direction of the electric fields and the
motions of the beam for each of the two pairs of plates.
We made particular reference to the fact that the electron stream or
beam consists of a bundle of moving negative charges. Also that these
charges are repelled by similar negative charges or by a negative field
and that they are attracted by positive charges or a positive field. Sup-
pose then, that the beam of electrons is moving between the two deflect-
ing plates in figure 9A. By means of the connections to these plates,
it is possible to apply a positive voltage to the upper plate DP-1 and
to make the lower plate DP-2 negative. With such connections, the
positive charge upon the upper plate, DP-1, will attract the stream
towards it, whereas the negative charge upon the lower plate, DP-2,
will repel the stream, so that the entire beam will be deflected towards
the upper plate, DP-1.
24 THE CATHODE-RAY TUBE AT WORK
Now, the normal direction of the beam is as shown by the middle
dotted line and the position of the spot upon the screen is 0. Whenthe difference of potential previously described exists between the plates,
the beam is pulled out of line as it passes between the plates and the
spot upon the screen is moved to the point indicated by the number 1,
the beam being shown as a dotted line. The extent that the spot is
moved up away from its normal position, or the extent of the pull upon
the beam towards the upper plate DP-1, is determined by the pre-
ponderance of the positive charge upon this plate, with respect to plate
DP-2. If the difference of potential existing between plates DP-1 and
DP-2, with DP-1 positive, is very small, the pull upon the beam is
very little, so that the spot upon the viewing screen is moved slightly
up from its normal position O. However, if the difference of potential
between DP-1 and DP-2, with the former positive, is very great, say
several hundred volts, it is possible to deflect the beam, so that the
spot moves off the screen. Obviously, such a condition is of no value,
as far as utility of the tube is concerned, since with the spot off the
screen, there is no indication of the degree of deflection. Consequently,
each tube has its limits of deflecting voltage, so that the spot will stay
on the screen.
From what has been said, it is easy to understand how calibration
of a tube is possible in terms of the potential difference between plates
DP-1 and DP-2, in order to move the spot a definite distance away
from its normal center position.
The limitation of the movement of the spot, or the deflection of the
beam, with a certain potential difference between the two plates, is
presented as a result of the voltage applied to the accelerating anodes.
These voltages have projected the electrons in a stream towards the
screen. The velocity of these electrons in motion being very great, a
certain force is necessary to deflect them or pull them away from their
normal line of travel. The potential difference between the deflecting
plates is the force which tends to pull the stream out of its normal
axis of travel. The higher the accelerating voltage, which starts the
stream in motion, the greater the force required to pull it out of line.
In this conneaion, however, it is also necessary to understand that
there are other faaors present in the rube, which may offset the effect
of the high accelerating voltage, so that two tubes of unlike accelerat-
ing voltage may require a like value of deflecting voltage, in order to
move the beam or spot the same distance.

THE THEORY OF THE TUBE 25
A certain amount of amplification in displacement on the screen is
obtained as a result of the distance between the deflecting plates and
the saeen. In other words, the vertical movement of the beam from
its normal axis at the deflecting plates is small compared with the move-
ment at the screen. This is due to projeaion of the angle of dis-
placement.
Referring once more to the deflection of the beam, one of the advan-
tages claimed for the low-accelerating-voltage, gas-concentrated beam
cathode-ray tube, such as the W.E. described herein, is the fact that
a lower value of deflecting voltage is required to move the spot a
predetermined distance upon the screen, than would be required with
a high-vacuum, high-accelerating-voltage cathode-ray tube. However,
there are certain advantages found in the high-vacuum tube which are
not found in the gas-filled tube, so that it becomes a matter of personal
fancy and consideration of all factors.
If now we reverse the voltage to the two deflecting plates shown in
figure 9A, so that DP-1 is negative and DP-2 is positive, we have a
shifting of the beam and the spot in a direction opposite to that which
took place before. The basis of this shift is exactly as stated before,
except that the polarity of the deflecting plates has been changed. Now,
DP-2 attracts the electron beam and DP-1 repels the beam. Since the
hypothetical voltage applied to the two defleaing plates is the same as
before, the potential difference between the plates is the same as before
and the spot moves the same distance in the opposite direction to
point 2.
Whatever has been said about the relation between the potential
difference between the plates and the distance the spot moves towards
point 1, is wholly applicable when the spot moves to point 2. If you
could visualize a device whereby the voltage applied to the two plates
was automatically reversed at a very slow rate, you would see the
beam shift from position 0 to position 1, back through position 0 to
position 2.
At this time we want to call to your attention one very significant
fact. A large number of men who have viewed the deflecting plates
within a cathode-ray tube have been confused about the mode of deflec-
tion. The electric field existing between these plates is like the
electric field existing between the plates of a two-plate condenser. (As
a matter of fact a certain amount of capacity exists between the plates of
a pair of deflecting plates.) The electric field exists perpendicular to
the plane of the plates, so that the plates which are horizontal with

26 THE CATHODE-RAY TUBE AT WORK
respect to the front of the tube, cause the vertical deflection. The
motion of the beam is parallel with the electric field. This is shown
in figure 9B. The term “vertical defleaion plates” refers to the
motion given to the beam and the spot by those plates, with respect to
the normal position of the tube, and not to the orientation of the plates
with respect to the normal position of the tube. As a matter of fact,
the plane of the plates is at right angles to the axis of the beam and
spot movement.
Now for the horizontal deflection plates. Examine figure 9C. DP-1
and DP-2 are these two plates; their position in the tube with respect
to the vertical deflection plates is such that they are closer to the view-
ing screen. The illustration of the tube in 9C, has been shifted slightly
from the normal, in order to show the shifting of the beam. If this
were not done, the three positions of the beam would fall atop each
other, and the three spot positions 0, 1 and 2, would be in the same
straight line. The operation of these plates is like that previously
mentioned; that is, attraaion of the beam by the positively charged
plate and repulsion of the beam by the negatively charged plate is just
as in the case of the vertical deflection plates. However, in this in-
stance, the spot moves in a plane which is at right angles to the spot
motion shown in figure 9A.
If deflector plate DP-1 is positive with respect to plate DP-2, the
spot would move from spot 0 to position 1, spot 0, being the normal
position without any potentials applied to the deflector plates or with
equal distribution of the charges to both plates. The pull towards
plate DP-1 is away from the reader and is the furthermost end on the
screen. If the polarity of the charges is reversed, so that DP-2 attracts
the stream, the beam is pulled towards the reader, and the spot moves
to position 2. The relation between the plane of the plates, the direc-
tion of the electric field and the motion of the beam and spot is shown
in figure 9D. Once again the motion of the beam is at right angles
to the plane of the plates.
There are other important facts which we wish to call to your
attention. The first is that the placement of the deflecting plates is
such that the beam is acted upon first by the vertical deflecting plates.
In other words, the first displacement of the electron beam, for normal
operation of the tube, is the vertical displacement. Then the horizontal
field or force acts upon the beam. The second significant fact, one
which you will have occasion to remember, is that displacement of the
beam from its normal axis of travel re.sults in displacement of a SPOT.
THE THEORY OF THE TUBE 27
The third significant fact is that the concentrated beam moves as a
single unit. The electron stream is not broken up into groups of
electrons. It is deflected as a beam, terminating in a single spot. If
your imagination is sufiiciently great, you can visualize deflection of a
single SPOT. If you consider the screen only and forget about the
deflection of the electron beam, the application of the deflection voltage
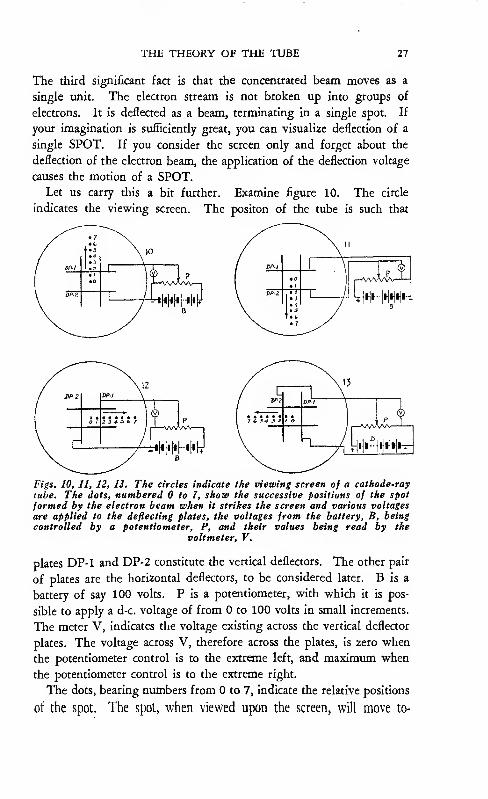
causes the motion of a SPOT.Let us carry this a bit further. Examine figure 10. The circle
indicates the viewing screen. The positon of the tube is such that
Figs. 10, 11, 12, 13, The circles indicate the viewing screen of a cathode-ray
tube. The dots, numbered 0 to 7, show the successive positions of the spot
formed by the electron beam when it strikes the screen and various voltages
are applied to the deflecting plates, the voltages from the battery, B, being
controlled by a potentiometer, P, and their values being read by the
voltmeter, V.
plates DP-1 and DP-2 constitute the vertical deflectors. The other pair
of plates are the horizontal deflectors, to be considered later. B is a
battery of say 100 volts. P is a potentiometer, with which it is pos-
sible to apply a d-c. voltage of from 0 to 100 volts in small increments.
The meter V, indicates the voltage existing across the vertical deflector
plates. The voltage across V, therefore across the plates, is zero when
the potentiometer control is to the extreme left, and maximum when
the potentiometer control is to the extreme right.
The dots, bearing numbers from 0 to 7, indicate the relative positions
of the spot. The spot, when viewed upon the screen, will move to-

28 THE CATHODE-RAY TUBE AT WORK
wards DP-1, because that electrode is positive with respect to DP-2,
for any setting of the potentiometer P, other than the zero setting.
Seven uniform increases of the P adjustment will cause the shifting of
the spot from 0 to position 7. If you would vary P at an extremely
slow rate, you would note a steady spot, of uniform intensity and size,
vary its position, although always remaining a spot, from point 0 to
point 7. If you moved the potentiometer adjustment fast, a spot of
light would move across the screen. If you stopped at any one
point, the image upon the screen would be a stationary spot at some
point, between position 0 and position 7. At no time can the spot
move closer to plate DP-2 than positon 0, because at no time does
a diflFerence of potential exist which makes plate DP-1 negative with
respect to plate DP-2.
Suppose that we reverse the voltage, as in figure 11. Now, plate
DP-1 is negative and plate DP-2 is positive. The d-c. voltage supply
source is the same battery B. The voltage control unit is still the
potentiometer P and the voltage indicator is the voltmeter V. Nowwe find that the beam and spot move towards the plate DP-2, since
potential difference between the two plates is such that the electron
stream is deflected towards DP-2. Since the maximum potential dif-
ference between the two plates is the same as before, the spot moves
the same distance for the same swing of the potentiometer control, but
in this case, the beam and spot move in the opposite direction.
It should be understood that while only seven spot positions are
shown, it is conceivable that the number of spot positions is limited
solely by the diameter of the spot and the potential difference existing
between the two vertical deflector plates. In other words, the spot can
be placed at the extreme limit of the viewing screen, which would place
it at the edge of the circle. For that matter, if the deflection voltage,
that is the potential difference between the two plates, is sufficiently
great, the spot would be moved off the screen. Furthermore, the spot
positions shown do not limit the positioning of the spot to that exact
location. The blank space between the positions indicated may be
occupied by a spot, if the potential difference, that is, the adjustment
of the potentiometer P, is such that the voltage required to place the
spot at that position exists. Each increment of voltage will move the
spot to another position.
The arrows indicate the direaion of the deflection. The variation
of the potentiometer P, in figures 10 and 11, under normal circum-
stances would move the spot in a straight line from the center of the

THE THEORY OF THE TUBE 29
screen to its limits. Naturally, a voltage, which tends to move the
spot off the screen, is excessive, for it is only upon the screen that we
see the spot, since luminosity exists only at the point where the beam
of electrons strikes the fluorescent material.
What is true about the vertical deflector plates is applicable to the
horizontal deflector plates, as shown in figure 12. The voltage source
is the same as before. However, now the potential difference is
established between the horizontal deflector plates. With DP-1 posi-
tive with respect to DP-2, the beam is going to be attracted by defleaor
plate DP-1 and the spot moves in the direaion of the arrow. The
exact positioning of the spot is determined by the potential difference
as previously described. If we reverse the polarity of the voltages
applied to the two horizontal deflector plates, as in figure 13, wherein
DP-2 is positive with respect to DP-1, the beam will be attracted
towards DP- 2, and the spot will move in the direction of the arrow.
Fig. 14. By connect’
ing one vertical de-
fleeting plate to the
mid-point of the bat-
tery and the other to
the arm of a potentio-
meter, P, connectedacross the battery,
the polarity of the
plates may be re-
versed and the spotmay be moved to anyposition in the ver-
tical direction.
What will happen if the potential difference applied to the two
vertical deflector plates undergoes a change in polarity? Suppose that
we arrange a circuit such as shown in figure 14. Here the battery and
potentiometer circuit is arranged so drat by moving the arm of the
potentiometer P, we can reverse the polarity of the voltage applied to
the two deflector plates. With the potentiometer arm set to the mid-
point and the battery tapped at its mid-point, the potential difference
between the two plates is zero, hence the spot occupies the position
designated as 0. If the arm is moved to the extreme left position, the
plate DP-1 is made maximum negative with respect to DP-2, and the
spot moves towards DP-2. If, however, the potentiometer arm is
moved to the extreme right, DP-1 is made positive with respea to
DP-2 and the spot moves towards DP-1. Therefore, by moving the

30 THE CATHODE-RAY TUBE AT WORK
potentiometer arm between its limits we can cause the spot to move
across the viewing screen in a vertical direction to limits which are
prescribed by the voltage difference existing between the two plates,
which limits are determined by the positon of the potentiometer arm.
Starting at the mid-point, the spot would move, say from 0 to 7 in the
upward direction, back to 0 in the downward direction and continue
downward to 7 and then return to 0, when the arm is again brought
to rest at the mid-point on the potentiometer resistance. The dash-
line in figure 14 represents the horizontal deflector plates.
Fig. IS. The hori-
zontal positioning of
the spot is accom-plished in the sameway as it was movedvertically in Fig. 14.
Note that in this
and other figures
the seven spots in-
dicate ANY posi-
tions of the beam’strace in the direc-
tions indicated.
What is true about the vertical deflector plates is true about the
horizontal deflector plates, as shown in figure 15. In figures 14 and
15, the active plates are those which are shown as solid lines. By
swinging the arm of the potentiometer P, we can cause the spot to
traverse the screen in the horizontal direction, as shown by the position
of the dots in figure 15. Once more we repeat that the seven dots
representative of spot positions do not signify that the total number
of spot positions is seven each side of the 0 position. These are
purely illustrative of what represents a movement of the fluorescent
spot position along the horizontal axis, which incidentally is known as
the "X” axis of the tube. The vertical axis, as shown in figure 14, is
known as the "Y” axis of the mbe.
Let us now consider the possible range of spot positioning, with
respect to the complete viewing screen. Up to the present time, we
have considered but one deflecting force applied to the beam which
passes between the two sets of deflecting plates. From now on we
shall work with two sets of deflecting voltages, one voltage applied
to one set of plates and another voltage applied to the other set of
plates. As before, we are employing d-c. voltages secured from bat-
teries, with the voltage controlled by means of a potentiometer. As
far as the source of voltage is concerned, the d-c. power supply can be
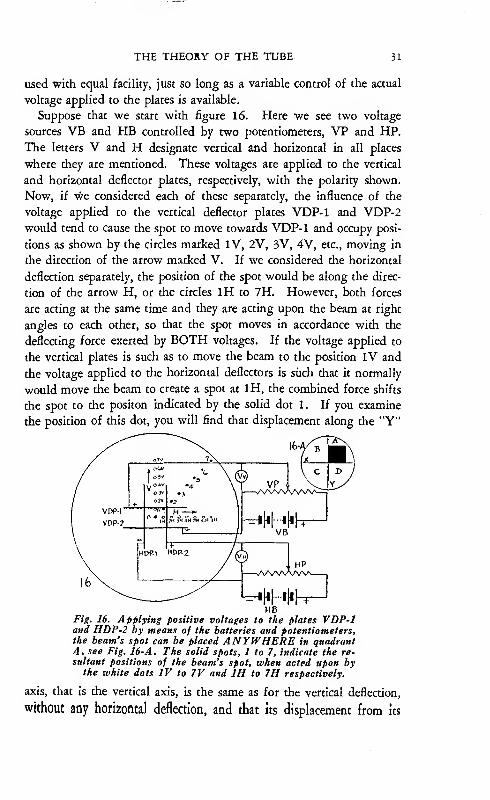
THE THEORY OF THE TUBE 31
used with equal facility, just so long as a variable control of the aaual
voltage applied to the plates is available.
Suppose that we start with figure 16. Here we see two voltage
sources VB and HB controlled by two potentiometers, VP and HP.
The letters V and H designate vertical and horizontal in all places
where they are mentioned. These voltages are applied to the vertical
and hotizontal deflector plates, respectively, with the polarity shown.
Now, if we considered each of these separately, the influence of the
voltage applied to the vertical deflector plates VDP-1 and VDP-2would tend to cause the spot to move towards VDP-1 and occupy posi-
tions as shown by the circles marked IV, 2V, 3V, 4V, etc., moving in
the direction of the arrow marked V. If we considered the horizontal
deflection separately, the position of the spot would be along the direc-
tion of the arrow H, or the circles IH to 7H. However, both forces
are acting at the same time and they are acting upon the beam at right
angles to each other, so that the spot moves in accordance with the
deflecting force exerted by BOTH voltages. If the voltage applied to
the vertical plates is such as to move the beam to the position IV and
the voltage applied to the horizontal deflectors is such that it normally
would move the beam to create a spot at IH, the combined force shifts
the spot to the positon indicated by the solid dot 1. If you examine
the position of this dot, you will find that displacement along the "Y"
Fig. 16. Applying positive voltages to the plates VDP-1and HDP-2 by means of the batteries and potentiometers,the beam’s spot can be placed ANYWHERE in quadrantA, see Fig. 16-A. The solid spots, 1 to 7, indicate the re-
sultant positions of the beam’s spot, when acted upon bythe white dots IV to 7V and IH to 7H respectively,
axis, that is the vertical axis, is the same as for the vertical deflection,
without any horizontal deflection, and that its displacement from its

32 THE CATHODE-RAY TUBE AT WORK
basic position along the "X” axis that is, the horizontal axis, is the
same as for the horizontal deflection, without any vertical deflection.
If the individual voltages, with the polarities shown are such as to
cause the basic 2V and 2H deflections, the resultant deflection sets
the spot at the position, solid dot 2. The same applies to the other
positions of the horizontal and vertical deflections, which are produc-
tive of the solid dot positions 3 to 7.
Now, from what has been said, it should not be a difficult matter
to comprehend the placement of the spot as a result of the combined
deflection in any position of the quadrant A. (By quadrant is meant
a fourth part of the area of a circle.) However, since the viewing
screen surface is not perfectly flat and since the entire portion of the
screen is not suitable for use, we have shown a square area within this
quadrant as being the useful area. To expedite comprehension, see
figure 21. Examine quadrant A*. Here you find positions of the
beam spot for vertical and horizontal deflecting forces, when the
polarity of the voltages applied to the deflecting plates is as shown in
figure 16. If the vertical deflection voltage is varied in equal steps
from 1 to 7 and the horizontal deflecting voltage is kept constant at
1 unit, the spot will occupy the positions shown by the line parallel to
the "Y” axis and terminating in the IH unit designation on the "X”
axis. If on the other hand, the vertical deflection is kept constant at
1 unit and the horizontal deflection is varied in steps of one unit
through the illustrated range of 7 units, the spot will occupy the posi-
tions shown by the line which runs parallel to the "X” axis. For the
sake of illustration, to show that the positions selected are purely arbi-
trary and that the spot may occupy any position in this quadrant, we
show the position of the spot for a vertical deflection of 3% units and
a horizontal deflection of 5% units. From what has been said you
can understand how it is possible to show the useful area in "A”
quadrant of figure 16-A, filled solid.
The selection of the quadrant "A”, and the position of the spot in
figures 16 and 16-A, is not one of choice or preference. It depends
upon the polarity of the voltages applied to the plates. In geometry
there are four quadrants in a circle. If this circle is divided by two
reference lines, a vertical reference line, the "Y” axis, and a horizontal
reference line, the "X” axis, four areas are available in the complete
circle. One of these is the area to the right of the "Y” axis and
above the "X” axis. Another is the area to the left of the "Y” axis
and above the "X” axis. Still another is the area to the left of the
*In engineering this quadrant would be designated as quadrant I. References aremade to quadrants B, C and D. These are also designated as quadrants n, HI and IV,respectively.
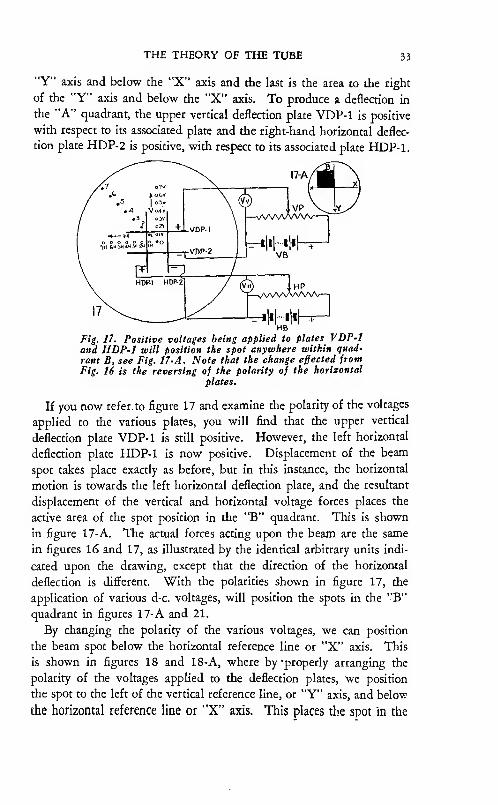
THE THEORY OF THE TUBE 33
"Y” axis and below the "X” axis and the last is the area to the right
of the "Y” axis and below the "X” axis. To produce a deflection in
the "A” quadrant, the upper vertical deflection plate VDP-1 is positive
with respect to its associated plate and the right-hand horizontal deflec-
tion plate HDP-2 is positive, with respect to its associated plate HDP-1.
Fig. 17. Positive voltages being applied to plates VDP-1and HDP-1 will position the spot anywhere within quad-
rant B, see Fig. 17-A. Note that the change effected fromFig. 16 is the reversing of the polarity of the horizontal
plates.
If you now refer to figure 17 and examine the polarity of the voltages
applied to the various plates, you will find that the upper vertical
deflection plate VDP-1 is still positive. However, the left horizontal
deflection plate HDP-1 is now positive. Displacement of the beam
spot takes place exactly as before, but in this instance, the horizontal
motion is towards the left horizontal deflection plate, and the resultant
displacement of the vertical and horizontal voltage forces places the
active area of the spot position in the "B” quadrant. This is shown
in figure 17-A. The actual forces acting upon the beam are the same
in figures 16 and 17, as illustrated by the identical arbitrary units indi-
cated upon the drawing, except that the direction of the horizontal
deflection is different. With the polarities shown in figure 17, the
application of various d-c. voltages, will position the spots in the "B”
quadrant in figures 17-A and 21.
By changing the polarity of the various voltages, we can position
the beam spot below the horizontal reference line or "X” axis. This
is shown in figures 18 and 18-A, where by ‘properly arranging the
polarity of the voltages applied to the deflection plates, we position
the spot to the left of the vertical reference line, or "Y” axis, and below
the horizontal reference line or “X” axis. This places the spot in the
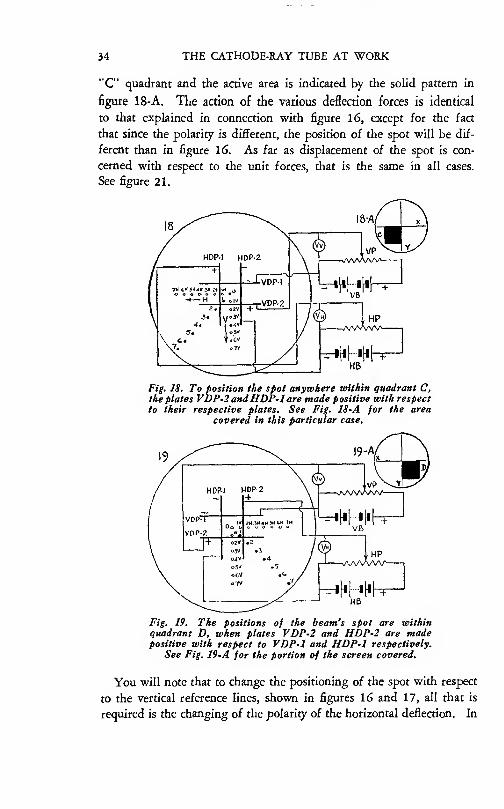
34 THE CATHODE-RAY TUBE AT WORK
"C” quadrant and the active area is indicated by the solid pattern in
figure 18-A. The action of the various deflection forces is identical
to that explained in connection with figure 16, except for the faa
that since the polarity is different, the position of the spot will be dif-
ferent than in figure 16. As far as displacement of the spot is con-
cerned with respect to the unit forces, that is the same in all cases.
See figure 21.
Fig. IS, To position the spot anywhere within quadrant C,the plates VDP-2 andHDP-1 are made positive with respect
to their respective plates. See Fig. 18-A for the area
covered in this particular case.
Fig. 19. The positions of the beam’s spot are within
quadrant D, when plates VDP-2 and HDP-2 are madepositive with respect to VDP-1 and HDP-1 respectively.
See Fig. 19-A for the portion of the screen covered.
You will note that to change the positioning of the spot with respect
to the vertical reference lines, shown in figures 16 and 17, all that is
required is the changing of the polarity of the horizontal deflection. In

THE THEORY OF THE TUBE 35
other words, to swing from quadrant "A” to "B”, all that is required
is a change in the polarity of but one deflecting force, the horizontal
deflection. To change from quadrant "B” to quadrant "C", shown in
figure 18-A, the polarity of the vertical deflection is changed, whereas
the horizontal deflection plate polarity remains as before. From what
has been said so far, it is obvious that to position the spot below or
above the horizontal reference line, or "X” axis, the vertical defleaion
plate polarity must be changed and to position the spot to the right or
to the left of the vertical reference line, or *'Y” axis, the horizontal
deflection plate polarity must be changed.
Placement of the spot in the fourth or "D” quadrant is shown in
figures 19, 19-A and 21. As far as the resultant displacement of the
vertical and horizontal forces is concerned, that which was said in con-
nection with figure 16 is applicable to figure 19, bearing in mind, of
course, that the direction of the displacement has been changed.
Fig. 20. Above is shown a composite diagram of Figs. 16, 17, 18 and 19. Thepolarities of the plates are indicated adjacent to the lines of spots, whichcaused them to assume the positions indicated. Fig. 20-A shows the useful
area of the screen within which the beam’s spot can be placed.
Consolidating figures 16, 17, 18 and 19 and also figures 16-A, 17-A,
18-A and 19-A, we obtain figure 20. This illustration shows two
sources of voltages (d-c.) for the deflecting plates. Each of these

56 THE CATHODE-RAY TUBE AT WORK
voltage sources is of the type whereby rhe polarity of the voltage ap-
plied to each set of deflecting plates may be changed, similar to figures
14 and 15. Wirh proper adjustment of the potentiometers, VP (ver-
tical plates) and HP (horizontal plates), the potential difference
between each set of plates is substantially zero and the spot occupies
the position indicated by the large circle with the dot in its center.
Radiating from this center position are the basic vertical and horizontal
deflection spot positions, indicated by circles. These spot positions
exist when no other force, acting at right angles, is existent. The direc-
tion of the deflections, as has been stated upon several occasions, is
dependent upon the polarity of the voltages applied to the deflector
plates and the distance that the spot moves from its normal center
position depends upon the potential difference between the plates.
The greater this difference, the greater the distance that the spot moves
from the center.
When voltages are applied simultaneously to both sets of plates so
that the electric field ser-up between each set of plates acts upon the
beam, the displacement of the spot is determined by the two forces
acting at right angles. The direction of this displacement is determined
by the polarity of the voltages applied to the plates and the extent of
the displacement of the spot from its normal center position is deter-
mined by the strength of the fields or forces. For uniform voltages
applied to the both sets of plates with the polarity shown, the spot is
caused to occupy the positions indicated by the solid dots. The position
of the spot with respect to the quadrant is determined by the polarity
of the voltage applied to the plates, just as in the case of the original
spot position. Thus, if the vertical deflector plate VDP-1 is positive
and the horizontal deflector plate HDP-2 is positive, the spot will be
in quadrant A. If VDP-1 is positive and HDP-1 is made positive, the
spot will be in quadrant B. If HDP-1 is positive and VDP-2 is posi-
tive, the spot will occupy a position in quadrant C. If VDP-2 is
positive and HDP-2 is positive, the spot will occupy a position in
quadrant D. The spot positions shown in solid dot form indicate the
maximum displacement in all directions for uniform voltages applied
to each set of plates. The furthermost spot in each quadrant consti-
tutes the four boundaries of a square, which represents the active useful
area within which a spot could be positioned by the application of the
proper potentials to the two sets of plates. This active area is shown
by the solid portion in figure 20-A. For any voltage applied to the
horizontal and vertical deflector plates, within the limits determined by

THE THEORY OF THE TUBE 37
the maximum values governing the boundary of the active area, the
spot would occupy some position within the solid square of figure 20-A.
If we varied potentiometer VP through its entire range and varied
potentiometer HP through one-half of its range, so that horizontal
deflector plate HDP-2 always remained positive with respect to its
associated deflector plate HDP-1, the spot would be placed within the
solid square of figure 20-A, to the right of the "Y” axis, or to the
right of the line Y-Y'. If we varied the potentiometer VP through
its range and varied potentiometer HP through one-half of its range,
so that horizontal deflector plate HDP-1 was always positive with
respect to its associated horizontal deflector plate HDP-2, the spot
would be positioned within the active area to the left of the Y-Y' line,
which is half of the square shown in figure 20-A. By the application
of proper voltages, we can place the spot, within the upper half of the
solid square shown in figure 20-A, or within the active area above the
"X” axis, or above the X-X' line. The same is true of the area beneath
the X-X' line. By operating both VP and HP through their complete
ranges, we can cover the entire active area.
Persistency of Vision
At this time it is imperative to bring one pertinent fact to your
atrention. You have read repeated references to SPOT positions.
While these may have appeared repetitive and perhaps superfluous,
the frequent references were premeditated. We want to impress upon
you that the electron beam causes a fluorescent spot to appear upon the
screen at the point where the beam strikes the screen. Irrespective of
the nature of the voltage impressed upon the deflecting plates, it is
only a single spot which appears upon the screen. It is this SINGLESPOT which is caused to move as a result of the deflecting voltages.
You who read this page may have seen an image upon the cathode-
ray oscillograph viewing screen. Just how simple or complex the image
was, you alone know. Yet, no matter how complex the image, it was
made by a single spot in motion. Do not confuse the solid areas in
figures 16-A, 17-A, 18-A, 19-A and 20-A as being a spreading out of
the beam as a result of the deflecting voltages and the generation of a
fluorescent spot which covers the active area. By proper manipulation
of the two deflecting voltages shown in figures l6 and 16-A, it is
possible to make the active area, shown as a solid black drawing in
figure 16-A, a fluorescent area, yet it would not be due to the spreading
of the beam, but to the fact that THE NATURE OF THE MANIPU-

38 THE CATHODE-RAY TUBE AT WORK
LATION OF THE VOLTAGES WOULD BE SUCH AS TO CAUSETHE BEAM TO SHIFT ITS POSITION BY SMALL INCREMENTSAND TO PRODUCE A FLUORESCENT SPOT WHICH WOULDAPPEAR PERIODICALLY AT EVERY POINT IN THAT ACTIVEAREA. THE REPEATED APPEARANCE OF THE SPOT INEACH OF THE RESPECTIVE POSITIONS DETERMINED BYTHE VOLTAGES EXISTING AT THAT INSTANT WOULDCREATE THE ILLUSION BY PERSISTENCE OF VISION, ANDWHILE IT IS TRUE THAT THE FLUORESCENT SPOT EXISTSAT ANY ONE POINT FOR A VERY SMALL FRACTION OF ANINSTANT, IT SEEMS TO THE OBSERVER AS IF THE ENTIREACTIVE AREA IS MADE FLUORESCENT BY A SPOT SUFFI-
CIENTLY LARGE TO COVER THE AREA.
This persistency of vision is an optical illusion, created by the limita-
tion of the eye to respond to changes which occur faster than a certain
rate. Perhaps you may recall some of your pranks of childhood. Doyou remember placing some burning wood or glowing coal into a
metal container, usually an old discarded canned-soup container.? This
container with the glowing embers was attached to a string. Youwould then rotate the can at the end of the string at arm’s length so
that it described a circle. You no doubt recall the ring of fire which
was visible as this glowing can was swung around and around. The
ring of fire was nothing more than an optical illusion, for you well
know now that at any one moment the can was occupying some position
along the circumference of the circle you described. But the speed of
movement of the can and the inability of the eye to spot the can at any
one position, because of its rate of travel, caused the optical illusion,
described as persistence of vision. You thought you saw a ring of
fire. All that you really witnessed was the movement of the glowing
can from point to point along the circumference, but its course of
travel appeared as a continuous circle. The every-day motion picture
is an optical illusion. While the eye sees continuous motion, what
really happens is the presentation of a series of still pictures, each of
which is stationary for a very short time, usually 1/I6th of a second.
The eye cannot follow change at this speed, hence the motion appears
continuous.
This illusion of persistency of vision (discounting screen retentivity,
which shall be described elsewhere) is the basis for the observation of
phenomena with the cathode-ray tube. If we arranged the two poten-
tiometers, VP and HP in figure 20, to be motor driven over their com-

THE THEORY OF THE TUBE 39
plete ranges, the entire active area shown in black, in figure 20-A,
would appear fluorescent upon the viewing screen. The elearon beam,
displaced as a result of the voltages applied to the two sets of places,
would trace and retrace a number of spots as shown in figure 21. This
pattern would appear if the potentiometer were arranged to change
the voltage in steps of seven units each side of the zero position. If,
Fig. 21. Although the examples of the
spot’s positioning are given for quadrant A,
it should be understood that the samereasoning applies to any of the four quad-
rants. Compare this illustration with Figs.
20 and 20A.
however, the voltage applied to the plates changed in very small incre-
ments, the spot would appear so close to the previous position that
when recurrent at a rate, say 16 to 20 times per second, the entire
active area would appear fluorescent.
By the same token, if the potentiometer P in figure 14 were motor
driven, so that the spot would move faster than 16 times per second
and the potentiometer unit was a continuously variable resistor, the
trace of the spot would appear as a line or image, instead of a series
of individual spots. The same is true of figure 15, or for that matter,
any variation in position of the spot, which would occur at a rate fast
enough to create the optical illusion of persistency of vision.
From what has been said and as will be shown later, you must com-
prehend that displacement of the electron beam results in displacement
of a SINGLE SPOT and that it is this single spot, moving over the
screen, which appears as the image. No matter how complex you may
find the image, always remember that the pattern is being traced by a
FLUORESCENT SPOT WHICH MOVES ACROSS THE SCREEN.Referring to figure 20, if potentiometers VP and HP are varied very
slowly but at a constant rate, it is possible to follow the movement of
the SINGLE SPOT over the screen. With seven steps of voltage varia-
tion, the spot positions upon the screen would appear as in figure 21.
With the horizontal deflection voltage kept constant, that is with HPset at one point and left there, and sufficiently rapid variation of the
vertical deflection potentiometer VP, which means sufficiently rapid
40 THE CATHODE-RAY TUBE AT WORK
variation of the vertical deflection voltage, any one of the columns of
the dots, parallel to the vertical reference line, that is the "Y” axis,
would appear as a straight line, instead of a series of dots. If the
vertical deflection voltage were fixed and the horizontal voltage were
varied at a sufficiently rapid rate and the variations made recurrent,
any one of the horizontal line of columns, representative of the dis-
placement due to the voltage applied, would appear as a straight line,
instead of a series of dots.
Positioning of the Spot
From what has been said thus far, you can no doubt appreciate that
by the application of a fixed voltage from a battery, it is possible to
position the spot wherever desired. We have mentioned time and
again that under normal conditions, with zero potential difference
between the plates of each pair of deflector plates, the normal position
of the spot is at the center of the screen. Now it is possible that for
some reason, it may be desirable to place the normal position of the
spot somewhat off-center, above or below the horizontal reference line,
or "X” axis, or to the right or left of the vertical reference line, or
"Y” axis. This can be done by the application of a fixed potential
from a battery of the value required to position the spot as desired.
This battery voltage may be a few volts, or perhaps ten or twenty
volts, or as great as may be desired.
Such positioning of the spot may be employed for normal operation
of the tube, that is with varying voltages applied to the tube. The
positioning voltage has no bearing upon the actual application of the
tube. It is used essentially to position the spot as desired. In some
instances, due to a defect in the tube, stray voltages, etc., the normal
position of the spot is not in the center. To center the spot properly,
the positioning voltage is applied to the horizontal or vertical deflec-
tion plates, as required. The method of applying such voltages for
proper positioning of the spot during application of the tube for the
observation of varying voltage phenomena, is described elsewhere in
this volume.
Commercial cathode-ray units are equipped with spot centering con-
trols, known as "X” and "Y” position controls, whereby it is possible
to locate properly the spot as desired. These adjustments are usually
on the side or to the rear of the unit’s housing and are of the screw
type, since once adjusted they do not require further manipulation.
They are incorporated to enable proper centering of the spot, when

THE THEORY OF THE TUBE 41
tubes are changed. Often, a replacement mbe may not have its deflect-
ing plates exactly as in the tube previously used and the normal position
of the beam may be slightly off center, hence the spot will be off center.
Adjustment of these controls enables proper centering. In some in-
stances, some of the units have but one adjustment, that which is along
Fig.22.Thetwoarrows at the
upper side of
the oscillo-graph's chassis
indicate the lo-
cations of the
two controls
for centeringthe beam’s spot
horizontallyand vertically
the "X” axis, but it is becoming more common to provide both center-
ing controls. Figure 22 shows the spot positioning controls’ locations
on a commercial oscillograph.
Varying Voltages Applied to Deflector Plates
Up to the present time, we have devoted our attention to deflection
of the electron beam by means of d-c. voltages applied to the vertical
and horizontal plates. Let us now consider the application of varying
voltages, such as a-c. potentials. What is the effect of such voltages
when applied to the deflecting plates?
In the first place, the process of deflection is exactly as before, that
is, with d-c. voltages. The displacement of the beam from its normal
center position is again a function of the field strength existing between
the two plates of each pair of deflection plates. However, when speak-
ing about a-c. voltages, you have been accustomed to working with
r.m.s or root mean square values, as indicated upon the every-day a-c.
voltmeter. The deflection in the cathode-ray tube is determined by the
peak voltage, which is 1.414 times the r.m.s value.
As in the case of the previous examples, the displacement of the spot'
from its normal center position is a measure of the voltage difference
existing between the two plates of a pair, be they the vertical or the
horizontal deflection plates. An a-c. peak voltage of 10 volts will
displace the spot or deflect the beam the same distance each side of the
center position, as d-c. voltage of 10 volts applied in both directions, as
shown in figures 14 and 15. If the nature of the a-c. voltage is such

42 THE CATHODE-RAY TUBE AT WORK
that the amplitude of its alternations is not equal, then the displace-
ment of the Spot both sides of the normal center position along the
vertical or "Y” axis will not be the same, but will be in accordance
with the peak voltage of the alternations.
There is one other significant fact which must be mentioned in con-
nection with varying voltage applied to the deflection plates. In actual
practice, the image which will appear upon the viewing screen will be
a line image or pattern, because, as a general rule, the frequency of
these varying voltages is too high to allow observation of the motion
of the spot from point to point along the screen. However, for the
sake of illustration and, we hope, clarity of comprehension, we shall
employ, in a few examples, varying voltages of very low-frequency and
imagine that the travel of the spot is discernible by the naked eye.
Suppose that we apply a very low-frequency a-c. voltage to the
vertical deflector plates of a cathode-ray tube. Suppose that the fre-
quency of this a-c. voltage is 1 cycle per second. This cycle is shown
in figure 23. Since only one force is acting upon the electron beam.
Fig. 23. The change in polarity of an a-c. voltage sine wave, when connectedto the vertical deflection plates, will cause the spot to assume the positions
indicated by the series of vertical dots. No voltage is impressed on the
horizontal deflecting plates.
Fig. 24. The solid line along the vertical axis, Y-Y', is the actual trace madewhen a sine wave is impressed on the vertical deflecting plates with no voltage
on the other pair of plates.
the field set up by the applied deflecting voltage is determined by the
instantaneous amplitude of this applied voltage. The normal position
of the spot is indicated by the dot within the circle in the center of the
screen. The applied voltage starts at zero and increases in one direc-
tion until maximum is reached. We shall assume that the polarity of
this alternation is such as to make VDP-1 positive with respect to
VDP-2, so that the beam and spot move upward. As the voltage
increases, the spot moves through the various positions shown, until it
reaches its maximum position when the peak of the alternation, or half
circle, is reached. Then the downward half of this alternation starts,
and the spot moves downward towards its initial starting position,

THE THEORY OF THE TUBE 43
which is reached when the first alternation is completed and the a-c.
voltage is zero. Now the alternation starts in the opposite direction,
making plate VDP-2 positive with respect to VDP-1, so that the beam
is deflected downward and the spot moves in that direction. As the
downward alternation increases in amplitude, the spot moves further
and further away (down) from its normal center positon until it
reaches its furthermost point when the peak amplitude is reached. Then
as the voltage starts to decrease, that is the last quarter of the complete
cycle is occurring, the spot moves back (upward) towards its initial
starting point, until it is again in the middle of the screen, when the
a-c. voltage is zero.
The foregoing is the basis for the line image shown in figure 24.
In normal practice the frequency of the varying voltages applied to the
plates is such that it is impossible to see the spot moving from point
to point. Instead, the recurrent action of the a-c. voltage causes the
spot to trace and retrace its path at such speed that the illusion of
persistence of vision is created and we see a solid line pattern. Now,
you may wonder, why the initial a-c. voltage is represented as a wave,
whereas the image upon the screen is but a straight line. The reason
for this is that the original voltage waveform is illustrated as possessing
displacement along both the "X” and "Y” axes. In other words, the
original voltage is shown as possessing amplitude with respect to time.
The image upon the cathode-ray tube, however, possesses only ampli-
tude, since the beam is displaced along its "Y” axis only. Incidentally,
when operating the cathode-ray tube in practice, you will find that the
image, which will appear when an a-c. voltage is applied to the vertical
plates without any defleaion applied to the horizontal plates, will be a
single straight line, like that shown in figure 24.
What is true about the vertical plates is true about the horizontal
plates. If a varying voltage of very low frequency is applied to the
horizontal plates without any vertical deflection and if this frequency
is sufficiently low, so that movement of the spot may be observed, wewould observe the positioning of the spot as shown in figure 15. If
this frequency would be too high for observation of the travel of the
spot, a straight line, without any vertical displacement, would be seen
upon the screen.
If you will examine figure 24, you will note that the line image
appears in the center of the tube, along the "Y" axis. If desired, it is
possible to place this line either to the right or to the left of the "Y”
axis, the use of a spot positioning voltage. The same is true of

44 THE CATHODE-RAY TUBE AT WORK
the horizontal deflection. By means of a spot-positioning battery or
adjustment of the spot-positioning control available with most cathode-
ray units, it is possible to place the horizontal line image above or
below the "X” axis.
Magnetic Deflection
All of the comments made thus far concerning deflection of the
electron beam referred to the application of voltages to the deflecting
plates. The beam may also be deflected by means of a magnetic field,
by placing the electron beam under the influence of a magnetic field.
The magnetic field is created by means of a pair of coils located out-
side the tube near the neck. The extent of the deflection is determined
by the strength of the magnetic field, which in turn is determined by
the current flowing through the deflecting coils.
In contrast to electrostatic deflection, electro-magnetic deflection
does not require deflection plates. This does not mean that cathode-
ray tubes, which were originally designed for electrostatic deflection
and contain deflection plates, cannot be used for electro-magnetic de-
flection. However, the application of magnetic deflection to such
tubes is not the most ideal arrangement.
current flow through the coils. (Fig. 24C.)
The fact that deflection plates are contained in the tube is of no
consequence. The deflection coils are used just as if the tube did not
contain any deflection plates. The deflection voltages are applied to

THE THEORY OF THE TUBE 45
the coils, instead of to the plates. Deflection in each direction re-
quires two coils, as shown in figures 24-A and 24-B. The field exists
between the coils. Orientation of the coils provides deflection in the
proper direction. Deflection in the vertical direction requires twocoils and deflection in the horizontal direction requires another pair
of coils. The action of the magnetic field upon the electron beam is
at right angles to the direction of the magnetic field. In other words,
if the direction of the magnetic field is along the "X” axis of the tube,
the deflection of the beam is in the vertical direction, or along the
"Y” axis. Conversely, if the direction of the magnetic field is along
the "Y” axis, the displacement of the beam is along the “X” axis.
Examine figure 24-B. Note the positions of these coils. If weassume that the tube is so positioned that the face of these coils is
parallel to what would be the vertical deflection plates, the flow of
current through the coils would cause displacement of the spot along
the "X” axis, instead of along the "Y” axis, which would be the case
if a voltage were applied to the two plates. This is shown in figure
24-C. Simultaneous displacement of the beam in two directions re-
quires four coils, arranged in two pairs of two each. The two coils of
each pair are connected in series, as indicated in the case of the one
pair of coils in figure 24-A.
The actual deflection of the beam can be accomplished with direct
current or with alternating current. If direct current is used, the
magnetic field created is constant as long as the direct current is flowing
through the windings. The result is displacement of the spot to a
distance detetmined by the strength of the current, and in a manner
(not direction) which obtains when a d-c. voltage is applied to the
deflection plates.
When alternating cutrent is caused to flow through the deflection
coils, the field is varying and the spot traces an image across the screen,
just as if an a-c. voltage were applied to the proper set of plates to
cause a trace in the same direction.
There are certain disadvantages to the use of magnetic deflection for
routine operations such as we cover. First is the limitation of fre-
quency. Coils which are suitable for deflecting the beam in high-
voltage, high-vacuum tubes must of necessity have quite a large
number of turns in order to provide the required number of ampere-
turns, bearing in mind the relatively low signal voltages found in
practice. Such coils would possess a high value of inductance and,
consequently, would be suitable for use over the low audio band. At

46 THE CATHODE-RAY TUBE AT WORK
higher frequencies, the reactance and impedance of the windings would
materially impair the operation of the unit.
Deflection coils arranged in pairs and so built into a unit are
available for certain uses ready to use with the usual cathode-ray tube.
The neck of the cathode-ray tube slides through an opening of the
housing containing the four coils, as shown in figure 24-D. A metal
strap located to the rear of the housing and attached thereto can be
Fig. 24D. Magnetic deflection apparatus. The circular housing contains the
lour coils, which are brought close to the tube’s neck when it is inserted in
the opening. The lead at the rear connects the tube’s base to its socket in
the oscillograph so that its power supply unit can be used.
fastened around the neck of the tube, keeping it rigidly in place. The
cable and plug arrangement connects the cathode-ray tube to its
respective terminals at the socket contained in the conventional cathode-
ray oscillograph. The connecting terminals to the deflection coils are
mounted upon the coil housing.
We want to take this opportunity of stating that while we say that
magnetic deflection is not as satisfaaory as electrostatic deflection, we
are referring in particular to the 3-inch and 5 -inch tubes intended for
electrostatic deflection and for applications to problems in the radio
receiver field, amplifier design and servicing and for "ham” transmitter
adjustment. We recognize that certain cathode-ray tubes have been
designed for magnetic defleaion only, such as the RCA 903, and that
magnetic deflection has its field of utility, but when viewed from the
practical angle, with respect to our problems, we cannot come to any
but the conclusions which have been voiced.
CHAPTER II
SWEEP CIRCUITS
The greatest amount of the discussion presented thus far concerned
the action of the deflecting fields upon the electron beam and the
positioning of the spot. We progressed through the application of d-c.
voltages to the vertical and horizontal deflection plates and have made
very brief mention of the application of a varying or a-c. voltage to
the deflection plates.
Now, the primary function of the cathode-ray tube as used in oscillo-
graphs employed in connection with radio receiver and amplifier design
and servicing, “ham” transmitter adjustment and other related activ-
ities, is the observation of a-c. phenomena of one type or another. The
first step then can well be an exposition of the spreading of the a-c.
wave, so that the waveform of a-c. and pulsating currents and voltages
can be examined by viewing the cathode-ray screen.
Investigation of electrical phenomena such as waveforms of voltage
and current with the cathode-ray tube, requires that some means be
available whereby the electron beam, which has been placed under the
influence of the phenomenon to be examined or observed, will be caused
to move also in accordance with a predetermined time base, because
investigation of electrical waveforms can be carried out only if one can
determine the variation in amplitude with respect to time. If such a
time base or sweep circuit is available, the pattern or image is given
two dimensions: one, time and the other amplitude.
The time base deflection must position the spot at a certain point upon
the screen, move the spot across the screen at a definite known rate
and instantly return to its original position to begin a new cycle. This
time base is referred to as the sweep voltage or sweep signal and the
rate at which it moves or sweeps across the screen is known as the
sweep frequency. Application of the term sweep seems quite appro-
priate, since its action is to sweep the beam across the screen. As a
general rule, the deflection representing amplitude is usually applied to
47

48 THE CATHODE-RAY TUBE AT WORK
the vertical deflection plates and the deflection representative of the
time is applied to the horizontal deflection plates. You can very easily
comprehend the absence of the time base, by examining figure 24.
While it is true that the deflecting force applied to the vertical plates
is that of an a-c. voltage wave, the image upon the screen is a single
straight line—of Just one dimension. The time base is absent. Such
would be the image for any type of waveform applied to the vertical
deflection plates—until such time when a voltage providing the hori-
zontal deflection is applied.
To reproduce the original wave shown in figure 24, it is necessary
to apply to the horizontal deflection plates a voltage which will cause
the electron beam and resultant spot to move in accordance with the
amplitude of the wave and the instantaneous displacement with respect
to time. The simplest means of illustrating this action is to apply an
a-c. wave to the vertical plates and to apply a varying d-c. voltage to
the horizontal plates. By arranging that the horizontal deflection takes
place at a definite time rate, we establish a known time base. If this
horizontal deflection be of a-c. character, and it were desired to estab-
lish a definite time base, a voltage of known frequency would be
applied. However, that is for later discussion. In the meantime, let
us sweep the beam across the "X” axis, by means of rotating poten-
tiometer, thereby developing the time base.
Figure 25 illustrates a very low frequency signal, say 1 -cycle, applied
across the vertical deflection plates. We select this frequency because
it enables observation of the motion of the spot. The horizontal voltage
is developed across the potentiometer P. This potentiometer is ar-
ranged in the form of a circle with a rotating arm. You will note that
contacts are provided and are numbered from plus 14 to 0 to minus 14.
You will have to visualize a minute Jump which the arm makes as it
rotates and moves from the minus 14 to the plus 14 terminal. The
spacing between these two terminals will have to be assumed to be
extremely small, so that the time interval elapsing during the Jump is
extremely small with respea to the time interval existing when the
contact arm moves between the resistance steps or taps upon the poten-
tiometer arm. You must also assume that this contact arm is rotated
by a motor at a predetermined and constant speed.
The circles shown in figure 25 for the vertical and horizontal deflec-
tions indicate the spot positions during the deflection of the beam,
when only one deflection exists at one time. In other words, the
column of spot positions along the "Y” axis exists without the hoti-
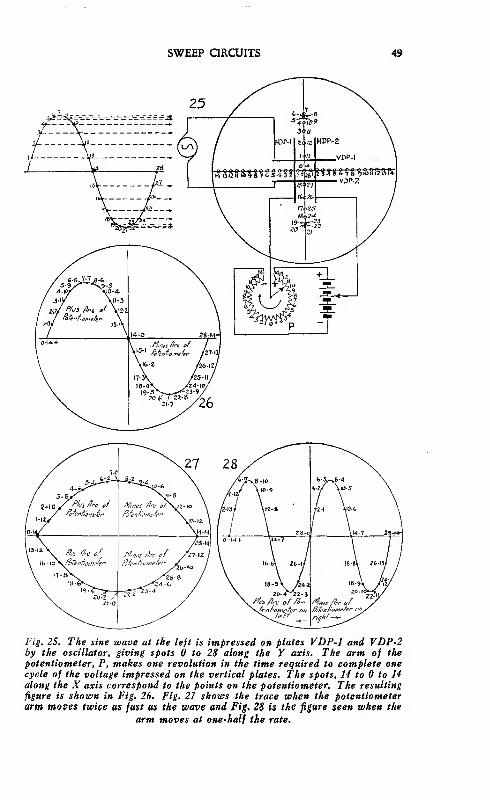
SWEEP CIRCUITS 49
Fig. 2S. The sine wave at the left is impressed on plates VDP-1 and VDP-2by the oscillator, giving spots 0 to 2S along the Y axis. The arm of the
potentiometer, P, makes one revolution in the time required to complete onecycle of the voltage impressed on the vertical plates. The spots, 14 to 0 to 14
along the X axis correspond to the points on the potentiometer. The resulting
figure is shown in Fig. 26. Fig. 27 shows the trace when the potentiometerarm moves twice as fast as the wave and Fig, 28 is the figure seen when the
arm moves at one-half the rate.
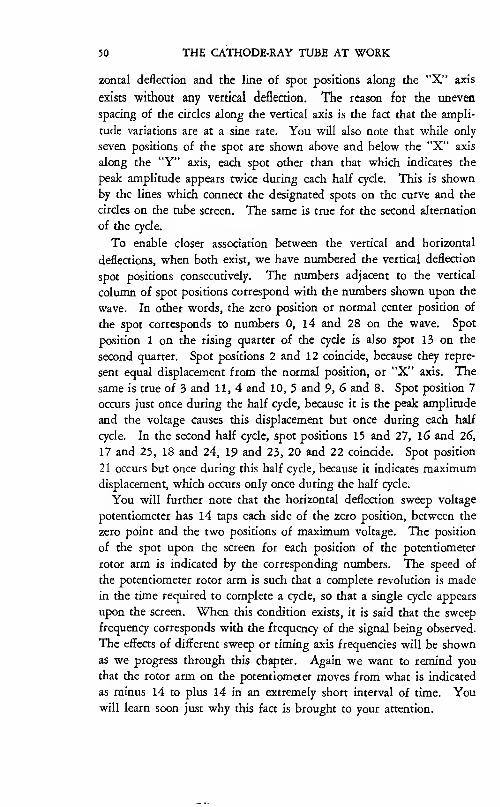
50 THE CATHODE-RAY TUBE AT WORK
zontal defleaion and the line of spot positions along the "X” axis
exists without any vertical deflection. The reason for the uneven
spacing of the circles along the vertical axis is the fact that the ampli-
tude variations are at a sine rate. You will also note that while only
seven positions of the spot are shown above and below the "X” axis
along the "Y” axis, each spot other than that which indicates the
peak amplitude appears twice during each half cycle. This is shown
by the lines which connect the designated spots on the curve and the
circles on the tube screen. The same is true for the second alternation
of the cycle.
To enable closer association between the vertical and horizontal
deflections, when both exist, we have numbered the vertical deflection
spot positions consecutively. The numbers adjacent to the vertical
column of spot positions correspond with the numbers shown upon the
wave. In other words, the zero position or normal center position of
the spot corresponds to numbers 0, 14 and 28 on the wave. Spot
position 1 on the rising quarter of the cycle is also spot 13 on the
second quarter. Spot positions 2 and 12 coincide, because they repre-
sent equal displacement from the normal position, or "X” axis. The
same is true of 3 and 11, 4 and 10, 5 and 9 , 6 and 8. Spot position 7
occurs just once during the half cycle, because it is the peak amplimde
and the voltage causes this displacement but once during each half
cycle. In the second half cycle, spot positions 15 and 27, 16 and 26,
17 and 25, 18 and 24, 19 and 23, 20 and 22 coincide. Spot position
21 occurs but once during this half cycle, because it indicates maximumdisplacement, which occurs only once during the half cycle.
You will further note that the horizontal deflection sweep voltage
potentiometer has 14 taps each side of the zero position, between the
zero point and the two positions of maximum voltage. The position
of the spot upon the screen for each position of the potentiometer
rotor arm is indicated by the corresponding numbers. The speed of
the potentiometer rotor arm is such that a complete revolution is made
in the time required to complete a cycle, so that a single cycle appears
upon the screen. When this condition exists, it is said that the sweep
frequency corresponds with the frequency of the signal being observed.
The effeas of different sweep or timing axis frequencies will be shown
as we progress through this chapter. Again we want to remind you
that the rotor arm on the potentiometer moves from what is indicated
as minus 14 to plus 14 in an extremely short interval of time. Youwill learn soon just why this fact is brought to your attention.

SWEEP CIRCUITS 51
Let us now develop the image upon the screen by combining the
two deflections shown in figure 25. We shall assume that the rotor
arm of the potentiometer is set at the plus 14 tap when the motor starts
and that this position coincides with the start of the a-c. cycle or the
0 point on the wave. With the rotor arm at plus 14, horizontal deflec-
tion plate HDP-1 is 14 units positive and in accordance with figure 25,
the beam spot at that instant has a horizontal displacement of 14 units
towards HDP-1 but no vertical displacement, hence occupies the
position 0-14 in figure 26. At the next instant, the rotor arm is at
plus 13 tap and the voltage wave amplitude has advanced to position 1.
The resultant displacement of the spot then is 1 unit up along the
"Y” axis and plus 13 units along the "X” axis and the resultant spot
position is shown in figure 26 as 1-13. The first of these numbers
designates the vertical displacement with respect to the numbers shown
in figure 25 and the second number represents the horizontal displace-
ment due to the potentiometer voltage, with respect to the numbers
indicated in figure 25.
At the next instant the potentiometer rotor arm is at plus 12 tap
and the amplitude of the wave has advanced to point 2. The resultant
displacement is 12 units along the horizontal axis and 2 units along
the vertical axis and the resultant position of the spot is 2-12 as indi-
cated in figure 26. The potentiometer rotor arm continues revolving
and as it makes contact with taps 11, 10, 9, 8 it causes resultant dis-
placement of the beam spot in accordance with the vertical deflection
to the positions 3-11, 4-10, 5-9, 6-8 and 7-7. Now the a-c. voltage
starts on its downward half of the half cycle, but the potentiometer
rotor arm continues revolving and makes contact with taps 6, 5, 4, 3,
2, 1 and 0. The resultant displacement of the spot is indicated by the
numbers 8-6, 9-5, 10-4, 11-3, 12-2, 13-1. At the moment when the
voltage of the a-c. wave reaches the point marked 14, which is zero,
the potentiometer arm has also reached the zero voltage tap, so that
there is no deflecting force exerted upon the beam, hence the spot
remains in its normal center position.
You now see half the wave upon the viewing screen. The upper
half of the straight line image, existing when the vertical displacement
is without horizontal displacement, has been spread out with a time
base or sweep. Let us now develop the remaining half cycle. Thelower half of the voltage wave, making VDP-2 positive with respect to
VDP-1, causes the spot to move downward, below the "X” axis and
the movement of the potentiometer rotor arm, past the 0 point, causes

52 THE CATHODE-RAY TUBE AT WORK
HDP-2, to become positive with respect to HDP-1, so that the image
will appear in the D quadrant, namely below the "X” axis and to the
right of the "Y” axis. As the rotor arm moves to new tap 1, the
voltage wave increases in the reverse direaion and the resultant dis-
placement places the spot in position 15-1 in figure 26. Further
motion of the rotor arm in synchronism with the voltage wave, causes
resultant spot displacements of 16-2, 17-3, 18-4, 19-5, 20-6, 21-7, 22-8,
23-9, 24-10, 25-11, 26-12, 27-13 and 28-14. The last position is zero
voltage or deflection along the vertical axis, but maximum deflection
along the horizontal or "X” axis.
Continued operation of the rotor and application of the voltage wave
repeats the process, for, as previously stated, an extremely short in-
terval after the spot 28-14 has been positioned, the horizontal timing
voltage sweeps back to its original position of plus 14, which is in
time with the start of the cycle, at point 0. This return from the
maximum sweep voltage position to its original return position is
known as the "return of the sweep voltage.” The rate at which this
return takes place is usually made to occupy a time interval which is
from l/25th to 1/lOOth of the time required for the completion of a
single cycle.
You have seen how the time base is introduced and how what is
first an image of the amplitude only (figure 25), becomes an image of
the wave by simultaneously applying the vertical deflection and the
horizontal time base deflection. At this point we want to mention that
the time base here shown is not applied commercially with the type
of apparatus described here. However, this description will serve to
explain the manner in which the sweep voltage, developed by some
other means, spreads the wave. It might also be well if you under-
stood that the slow speed of the rotor arm and the very low frequency
of the a-c. wave were purposely selected in order to expedite compre-
hension. With both frequency and potentiometer rotor speed increased,
it is impossible to follow the movement of the spot, but the positioning
of the spot remains the same. The image, instead of being shown as a
spot, which moved from place to place, assumes the form of a solid
line, of the wave shape shown.
Time Sweep Frequency Changed
The example cited, that is when just one cycle appears upon the
screen, is obtained when the time sweep speed or frequency is the same
as the frequency of the phenomenon being observed. What happens

SWEEP CIRCUITS 53
if the time sweep frequency is twice as great as that of the wave being
observed? . . . If it is one-half the frequency of the wave being
observed? . . . Let us analyze the former. The frequency of the
sweep circuit is twice the frequency of the voltage wave being exam-
ined. This means that the potentiometer rotor arm makes two revolu-
tions during the period required to complete one cycle of the wave
being observed. In the case being discussed, the potentiometer rotor
arm completes two revolutions during one second. During this dis-
cussion we must assume that a certain phase condition exists between
the varying d-c. voltage applied to the horizontal deflection plates and
the a-c. wave applied to the vertical defleaion plates. By phase rela-
tion, we mean that the potentiometer rotor arm starts moving simul-
taneously with the start of the a-c. wave. With the wave and the arm
moving at constant frequencies, they will stay in phase.
The basic data is furnished in figure 25. For proper comprehension
of what is being explained, it will be necessary to correlate figures 25
and 27. Since the potentiometer rotor moves twice as fast as the
voltage wave under observation, it completes half of its complete rota-
tion during the time that the voltage wave under observation completes
one-fourth of the complete cycle. Referring to figure 25, the rotor
starts moving at the plus 14 tap when the voltage wave is at zero.
Since there is no vertical displacement, but there is a horizontal dis-
placement towards HDP-1, because this plate is positive with respect
to HDP-2, the resultant displacement places the spot at 0-l4 in figure
27. By the time that the voltage wave has advanced to point 1 in
figure 25, the rotor arm has advanced to tap 12, which represents a
vertical displacement of 1 unit and a horizontal displacement of 12
units, resulting in the positioning of the spot at 1-12 in figure 27. By
the time that the wave has advanced in amplitude to point 2, the rotor
has moved to tap 10 and the resultant displacement is shown as 2-10
in figure 27. Maintaining the same rate of rotation, the rotor is at
tap 8, when the wave amplitude has reached point 3, thus positioning
the spot as 3-8 in figure 27. Continuing, the next three spots are
positioned at 4-6, 5-4, 6-2, in figure 27. When the wave reaches its
maximum amplitude, point 7 in figure 27, the rotor arm has reached
the 0 tap. With no horizontal defleaion and 7 units vertical deflection,
the spot is positioned on the "Y” axis, as 7-0 in figure 27. It is evident
that one-quarter cycle of the wave has been covered for one-half of the
complete arc of the rotor arm.
The amplitude of the wave now decreases and passes through the

54 THE CATHODE-RAY TUBE AT WORK
points 8, 9, 10, 11, 12, 13 and finally to 14, which is zero. At the
same time, the rotor arm is advancing iii its arc of travel. Having
passed the zero point, it is making horizontal deflector plate HDP-2
positive with respect to HDP-1, so that the spot is positioned to the
right of the "Y” axis, or vertical reference line. Furthermore, the
wave is still above the "X” axis or horizontal reference line and ver-
tical defleaor plate VDP-1 is still positive with respect to VDP-2, so
that the spot positions are still above the horizontal axis. During the
time that the wave is passing through its second quarter cycle, the rotor
arm is passing through its second half of the complete revolution and
the spots are positioned at 8-2, 9-4, 10-6, 11-8, 12-10, 13-12 and as
the wave reaches its zero point, designated as 14 in figure 25, the rotor
arm is also at 14.
At this instant, the arm moves from minus 14 to plus 14, which
means that the sweep goes back to its original starting point and makes
horizontal deflection plate HDP-1 14 units positive with respect to
HDP-2 and brings the spot back to the 0-14 position, as shown in
figure 27. If you can view this return from minus 14 tap to the plus
14 tap upon the potentiometer rotor as taking place in an extremely
small interval of time, it can be said that there is no time lost between
the movement of the horizontal sweep from spot 14-14 in figure 27 to
spot 0-14 in the same figure, with respect to the continued motion of
the wave. According to the wave illustrated in figure 25, it now starts
upon its half cycle below the zero reference line. When so doing it
makes vertical defleaor plate VDP-2 positive with respect to VDP-1,
so that the beam is defleaed towards the former plate and the spot
is positioned below the "X” axis. At the same time, the rotor arm,
moving on the plus side, also positions the spot to the left of the "Y”
axis. By the time that the wave has increased in amplitude to point 15
in figure 25, the rotor arm has moved to tap 12 and the spot is posi-
tioned as 15-12 in figure 27. Continued operation during the same
quarter cycle of the wave results in motion of the rotor arm over the
entire half of the potentiometer, from plus 14 to 0 and the spot is
positioned as 16-10, 17-8, 18-6, 19-4, 20-2 and 21-0. When the
maximum amplimde is reached during the second alternation of the
wave, the rotor arm has reached zero. Since there is no horizontal
displacement and there is maximum vertical displacement, the spot is
positioned on the vertical or "Y" axis. The wave now starts on its
last quarter cycle, while the rotor arm starts advancing in that segment
which makes horizontal deflection plate HDP-2 positive with respea to

SWEEP CIRCUITS 55
HDP-1, so that the spot is positioned in the D quadrant. The resultant
displacement causes the spot to move through positions 22-2, 23-4,
24-6, 25-8, 26-10, 27-12 and when the wave reaches its zero point,
number 28 in figure 25, the rotor arm is at minus 14 and maximum
horizontal displacement with zero vertical displacement positions the
spot at 28-14. Continued operation repeats the cycle, and the recurrent
action results in the line image shown as figure 27.
If you examine figure 27, you will see that operation of the sweep
at a frequency which is twice that of the wave being observed places the
alternation below the zero line, directly beneath the alternation above
the zero line.
Sweep Frequency Reduced to Half That of Wave
What happens when the horizontal displacement occurs at a rate or
speed which is one-half of that of the wave under observation; in other
words, when the sweep frequency is one-half of the frequency of the
wave under observation.^ Again we refer to figure 25 as the source of
the basic facts. We refer you to figure 28 as the illustration of the
wave when so developed. Now, the wave under observation moves
twice as fast as the sweep, which means that a complete cycle will
occur during the time that the rotor arm is passing through one-half
of its total arc of travel. The result is the presence of two cycles upon
the screen. In this connection, we want to stress that the number of
cycles which appears upon the viewing screen is a function of the
frequency relation between the sweep frequency and the frequency of
the wave being observed, not solely that of the wave being observed. It
is possible, by proper adjustment of the horizontal displacement fre-
quency, to place but one cycle of a 5,000-cycle signal or ten cycles of
a 600-cycle signal upon the screen.
Once again the rotor starts at plus 14, when the a-c. wave is at 0
in figure 25. Since the wave is moving twice as fast as the sweep, a
half wave will be spread or swept by one-quarter of the arc of travel
of the rotor, or one-quarter of the total sweep. This is evident in
figure 28, where the wave moves through its half cycle, during the time
that the sweep moves from plus 14 to the plus 7 tap. The second
alternation is swept by the horizontal deflection voltage as the rotor
moves from tap 7 to 0, so that the complete cycle is swept during half
of the sweep cycle. The second cycle is swept by the horizontal deflec-
tion voltage, as the rotor moves through its arc in the negative side,
from 0 to minus 14. The placement of the first two alternations to the
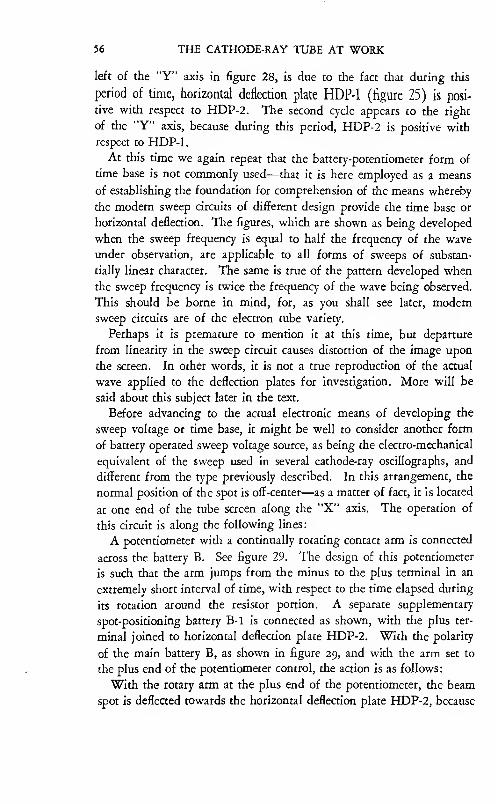
56 THE CATHODE-RAY TUBE AT WORK
left of the "Y” axis in figure 28, is due to the fact that during this
period of time, horizontal deflection plate HDP-1 (figure 25) is posi-
tive with respect to HDP-2. The second cycle appears to the right
of the "Y” axis, because during this period, HDP-2 is positive with
respect to HDP-1.
At this time we again repeat that the battery-potentiometer form of
time base is not commonly used—that it is here employed as a means
of establishing the foundation for comprehension of the means whereby
the modern sweep circuits of diflferent design provide the time base or
horizontal deflection. The figures, which are shown as being developed
when the sweep frequency is equal to half the frequency of the wave
under observation, are applicable to all forms of sweeps of substan-
tially linear character. The same is true of the pattern developed when
the sweep frequency is twice the frequency of the wave being observed.
This should be borne in mind, for, as you shall see later, modern
sweep circuits are of the electron tube variety.
Perhaps it is premature to mention it at this time, but departure
from linearity in the sweep circuit causes distortion of the image upon
the screen. In other words, it is not a true reproduction of the aaual
wave applied to the deflection plates for investigation. More will be
said about this subject later in the text.
Before advancing to the actual electronic means of developing the
sweep voltage or time base, it might be well to consider another form
of battery operated sweep voltage source, as being the electro-mechanical
equivalent of the sweep used in several cathode-ray oscillographs, and
different from the type previously described. In this arrangement, the
normal position of the spot is off-center—as a matter of fact, it is located
at one end of the tube screen along the "X” axis. The operation of
this circuit is along the following lines:
A potentiometer with a continually rotating contact arm is connected
across the battery B. See figure 29. The design of this potentiometer
is such that the arm jumps from the minus to the plus terminal in an
extremely short interval of time, with respect to the time elapsed during
its rotation around the resistor portion. A separate supplementary
spot-positioning battery B-1 is connected as shown, with the plus ter-
minal joined to horizontal defleaion plate HDP-2. With the polarity
of the main battery B, as shown in figure 29, and with the arm set to
the plus end of the potentiometer control, the action is as follows:
With the rotary arm at the plus end of the potentiometer, the beam
spot is defleaed towards the horizontal deflection plate HDP-2, because

SWEEP CIRCUITS 57
of the deflecting force of the battery B-1. This positions the spot on
the "X” axis, but quite distant from the exact center of the screen.
Deflection plate HDP-1 is negative with respect to HDP-2. The arm
starts rotating and as it moves in the direction shown, the voltage from
battery B starts bucking the voltage of battery B-1, and the potential
difference existing between HDP-2 and HDP-1, with the former posi-
tive with respect to the latter, becomes less and less, and the spot moves
29. An electro-mechanical equivalent of the sweep circuit used in several
oscillographs. The normal position of the spot is at one side of the screen onthe X axis instead of at the center.
towards the center of the screen away from plate HDP-2. As the rotor
arm moves towards the minus end of the potentiometer resistance strip,
the greater voltage of battery B nullifies the positive charge from
battery B-1, making deflection plate HDP-2 negative with respect to
plate HDP-1 and the spot moves towards HDP-1. At the instant
when the rotor arm reaches the most negative point on the poten-
tiometer resistance strip, HDP-1 is most positive with respect to HDP-2and the beam spot has moved the greatest distance from its original
position and has swept across the screen. At the next instant, an
extremely small interval of time, as stated before, the arm jumps from
the most negative point on the potentiometer strip to the most positive
point on the strip and instantaneously returns the spot to its original
starting position. The return of the spot occurs during the interval
when the rotor arm shifts from the most negative to the most positive
points on the potentiometer resistance strip. If the speed of rotation
of the arm is sufficiently great, and the rotation is recurrent, the trace
of the beam spot constitutes a single line across the screen. The return
sweep, occurring at an extremely rapid rate is not visible. An example
of an electronic sweep circuit, functioning in this manner, will be
given later.

58 THE CATHODE-RAY TUBE AT WORK
Electronic Sweep Circuits
There are available a number of ways of developing the sweep or
time base voltage. The rotating potentiometer and battery method
has been shown. There are other arrangements which employ the
charge of a condenser, controlled by a breaking contact, but since these
are seldom if ever used, we do not feel justified in devoting space to a
discussion. Whatever space we have available can be utilized to better
advantage by discussing various types of electronic sweep circuits,
since they find application in modern cathode-ray oscillograph apparatus.
The most commonly used unit is what is known as a relaxation
oscillator. By a relaxation oscillator is meant a generator of distorted
currents in which the variations are due to the charge and discharge
of a condenser through a resistor. This is in contrast with the normal
signal generator, wherein anything but distorted waves are desired.
Furthermore, whereas the normal electron tube oscillator develops a
fundamental frequency determined by the values of capacity, inductance
and resistance in the circuit and the order of the harmonics present is
kept as low as possible, the relaxation oscillator’s frequency is a product
of the capacity and the resistance and its harmonic content is greatly
desired. Generally speaking, the frequency generated by such relaxa-
tion oscillators is increased as the capacity and resistance over which
the charge and discharge occur are decreased, and is decreased as the
capacity and/or resistance are increased. Similar variations in funda-
mental frequency and, naturally, the harmonic frequencies can be
developed, by varying but one of the constants, say the condenser or
the resistance, with the other maintained at a constant value. The
frequency varies inversely with capacity and resistance.
There are several reasons why such relaxation oscillators are better
suited as time base or sweep voltage sources than other types of oscil-
lators, The first of these is the nature of the output voltage developed
by the unit. The relaxation oscillator develops an output voltage which
rises slowly to maximum and then very rapidly decreases to zero, i.e.,
a saw-tooth wave. The rate of decrease from maximum to zero occurs
in an extremely small portion of the time required for the rise to
maximum. This extremely rapid decrease from maximum to zero is
utilized to return the beam to its original position and, naturally, the
spot to its original position. The rise in voltage constitutes the deflec-
tion field which swings the beam across the screen in the horizontal
direction, along the "X” axis. The drop to zero is the return trace.

SWEEP CIRCUITS 59
which is desired to return at such a fast rate that it produces a minimum
trace upon the screen. The brilliance of the return trace depends upon
the fundamental frequency, for if the fundamental frequency is very
high, the return trace, while much faster than the original sweep across
the screen, may still be sufficiently slow to produce a trace. The
decrease from maximum voltage to zero, when returning the spot to
its original starting position, is the equivalent of the movement of the
potentiometer rotor in figure 29 from the extreme minus end of the
resistor strip to the extreme positive end of the strip.
The second reason is that by proper design, the increase from zero
to maximum of the output voltage, utilized to sweep the beam, can be
made linear, so that a uniform time base is available. A supplementary
reason is that a fairly wide range of fundamental frequencies may be
had with comparative ease and also that synchronization between two
frequencies is easily accomplished. In other words, relaxation oscilla-
tors can be stabilized and kept constant by frequencies which are
multiples or submultiples of the fundamental.
Fig, 30. A glow-discharge tube
used as a relaxation oscillator
is here shown. The frequencycan be changed by varying the
d-c. voltage, the capacity or the
resistance.
The simplest form of relaxation oscillator is the glow-discharge tube
used in conjunction with a resistor and condenser and a d-c. voltage
source. This is shown in schematic form in figure 30. The oscillator
portion of the circuit consists of the d-c. voltage source, the variable
condenser C and the glow tube, which is a neon or argon gas-filled
tube of the common variety. The .5-mfd. condenser is the output
condenser. According to the circuit shown, the discharge tube is
connected across the frequency controlling condenser. The resistor R,
being variable, also can be used to control frequency, but for the sake
of illustration, we can consider the unit as being fixed in value.
Operation of the device is along the following lines: Current from
the d-c. voltage source flows through the resistor, charging the con-
denser to a certain voltage. Normally, were it not for the presence of
the glow discharge tube, the d-c. voltage would charge the condenser
to its full value, but with the tube connected across the condenser, this
does not occur for the following reason: These tubes contain gas. Whenthe voltage across the two anodes of the tube reaches a certain value,

60 THE CAT'HODE-RAY TUBE AT WORK
the gas within the tube ionizes, the tube flashes and becomes a con-
ductor. When this happens—and it is an instantaneous action—the
tube short circuits the condenser and dissipates its charge.
Now, it is a characteristic of such gas-filled tubes, that when ignition
or ionization has occurred, it will persist for a period of time, which
means that while the flashing point may be a certain voltage, once the
flash has occurred it will persist, even if the voltage across the tube
elearodes is somewhat reduced. However, when the voltage across the
tube anodes reaches the lower critical value, ionization ceases and the
tube again becomes a non-conductor arjd the condenser charging cycle
starts all over again. Once the tube has again become a non-conductor,
it will require the original upper critical voltage to cause ionization
again. Thus the tube can be said to have two values of critical voltage,
namely, that which will cause ionization and that which is the lower
limit required to maintain ionization, once that it has been started.
The usual arrangement is to use a glow discharge tube, that has a
breakdown voltage rating which is appreciably lower than the voltage
of the voltage supply source, which in this case is the 110-volt d-c.
line. Suppose for the sake of illustration that the tube used is rated
at a critical voltage of 60 volts. When, during the initial charge
cycle, the voltage across the condenser reaches 60 volts, the tube ionizes
and the condenser is instantaneously discharged through the tube.
When this happens, the voltage across the condenser falls to a value
less than that required to keep the gas within the tube in a state of
ionization and the tube again becomes an infinite resistance and the
condenser starts its charging cycle.
When a system of this type is used to supply the sweep voltage or
time base, the charging voltage across the condenser is used as the
voltage which sweeps the beam spot across the screen and the discharge
cycle is the voltage which returns the spot to its initial starting position.
Consequently, the output voltage waveform of such a circuit is in effect
a picture of just what is happening during the charge and discharge of
the condenser. The glow-discharge tube serves the purpose of dis-
charging the condenser at the predetermined instant. Just what this
instant is in the units which are used in actual praaice is a matter of
design. The discharge at a certain instant, with respect to the voltage
across the condenser, bears a definite relation, as will be shown, to the
frequency and to the degree of linearity.
Figure 31 shows two cycles of the output voltage waveform of the
neon tube oscillator illustrated in figure 30. You can, if you wish.

SWEEP CIRCUITS 61
consider the sloping line which rises from zero to maximum as the
charging cycle, since it indicates the rise in voltage across the condenser.
The discharge trace is the steep drop from maximum to zero and
which is barely visible. This pattern is for a 400-cycle wave, so that
the duration of each cycle is about l/400th of a second. You can
therefore see that the duration of the discharge period is extremely
small with respect to time.
The frequency of a relaxation oscillator can be varied in three ways:
With the flashing voltage and the resistance constant, variation of the
capacity will vary the frequency. With capacity and flashing voltage
Fig. 31. Two cycles of the voltage
wave taken across the output terminals
of Fig. 30. The charging portion of the
cycle is the sloping line and the vertical
line is the discharge from maximumvoltage to zero.
constant, variation of the resistance will vary the frequency. With
resistance and capacity fixed, variation of the flashing voltage will vary
the frequency. The frequency variation with respect to capacity and
resistance has been mentioned. The variation with respect to the flash-
ing voltage is such that the higher the ionization or ignition or flashing
voltage of the tube, the lower the frequency; and the lower the flashing
voltage, the higher the frequency. Just how this is done will be shown
in a subsequent paragraph.
It is relatively simple to understand why these variations in capacity,
resistance and flashing voltage vary the frequency. With fixed resist-
ance, fixed supply voltage and fixed capacity, the time required to
charge the condenser to the flashing voltage of the tube is finite. If
the flashing voltage is reduced, the time required to reach this value of
charge or voltage across the condenser will be less, hence the number of
times the condenser will reach that charge and discharge across the tube
in a definite time will be greater, which means that the frequency will
be higher. If the flash voltage is raised, then the period of time
required to charge the condenser to the critical voltage will be longer
and the number of times the condenser will reach that charge and be
discharged by the tube in a definite period will be less and the fre-
quency of the output voltage will be lower.
With a constant supply voltage source, fixed resistor and fixed flash
voltage, the vatiation of frequency with capacity variation is due to the

62 THE CATHODE-RAY TUBE AT WORK
time required to charge a condenser to the proper voltage. The higher
the value of capacity, the greater is the time required to charge that
condenser to a certain voltage, and if this certain voltage is the critical
ionization voltage, the less will be the number of times that the
condenser will be properly charged and discharged in a definite amount
of time. This means that the frequency will be lower than if the
capacity value of the condenser were smaller. The smaller the capacity,
the less is the time required to charge it to a critical voltage and the
more frequently will this condenser reach its proper charge and be
discharged in a definite amount of time. Hence the frequency will be
higher than for a condenser of greater capacity.
As far as the resistance is concerned, the greater the value of the
resistor for fixed supply voltage, fixed capacity and fixed flash voltage,
the longer is the time required to charge the condenser to the critical
voltage. Hence the lower the number of charges and discharges in a
definite period of time; consequently, the lower the frequency. The
lower the value of the resistance, the more rapidly will the condenser
receive its required charge in a finite time, and the greater the number
of charges and discharges; hence the higher the frequency, for a definite
time interval.
What is said here is applicable to all such relaxation oscillators, be
they much more complicated than the one illustrated in figure 30 and
when the fixed or variable resistance is replaced by some other device.
If you examine figure 31, you will of necessity note certain significant
details. If you examine the portion of the cycle representing the rise
in voltage or the charging period, you cannot help but note that it does
not progress at a uniform rate with respect to time. In other words,
the rise in voltage for each fraction of the charging cycle is not the
same. The steepest portion is that which occurs as the charging cycle
starts. The slope of the curve is greatest here. Then the slope becomes
less and less until, when nearing the maximum amplitude (which
means, approaching the critical voltage), the rise of the charge in the
condenser is very little for the few moments before the maximum is
reached. If this rising voltage is applied to the horizontal deflection
plates so as to swing or sweep the spot across the screen, the speed of
the spot across the screen would not be uniform with respect to
intervals of time. The spot would move fastest at the start of its
journey and gradually slow down its rate of travel as it approached the
other limit of the screen. Its start of travel is the start of the charging
cycle and it slows down as it approaches the other side of the screen.

SWEEP CIRCUITS 63
because the rate of voltage increase with time (figure 31) is reduced.
In sum and substance, the output voltage is not linear with respect
to time.
A relaxation oscillator of this type can be used, but it would not
be wholly satisfactory because it would develop a distorted image upon
the screen. Nevertheless it has utility, because a certain portion of the
charging cycle possesses sufficient linearity to enable examination of the
pattern upon the screen, provided that a number of cycles of the wave
being observed are caused to appear upon the screen. The cycle or
cycles positioned near the start of the spot travel would be substantially
true images of the waveform being examined.
In connection with linearity of the sweep voltage, the mode of
application of the cathode-ray oscillograph to servicing, public address
and "ham” transmitter adjustment, or where quantitative observations
are of not prime importance, is such that a certain departure from
perfect linearity is permissible. As a matter of fact the commercial
cathode-ray oscillographs now available possess sweep circuits which
enable observations of various kinds and are of extreme value to the
industry, yet which are not 100 percent, linear. Of course, all of these
are more linear than the representation in figure 31, but a departure of
from 10 to as high as 20 per cent., is not sufficient to cause trouble.
Fig. 32. The ideal saw tooth wave. Note that the charging portion of eachcycle of this wave is linear, i.e. a straight line, indicating a constant increase
in voltage with respect to time. The discharge from maximum to zero voltage
is perpendicular, indicating an instantaneous return to the starting point.
The primary reason for the lack of linearity with the oscillator,
shown in figure 30, is that the use of a fixed or even variable resistor
of the common type does not keep the flow of charging current at a
constant rate, which requisite must be fulfilled if linearity is to be
attained. There are two simple ways of obtaining at least a close
approach to linearity of the sweep voltage. One of these is commonly
employed in the majority of commercial cathode-ray oscillographs.
The other is used in some few isolated cases and, while somewhat more
complicated, affords a closer approach to the ideal.

64 THE CATHODE-RAY TUBE AT WORK
The ideal saw-tooth wave output of a relaxation oscillator is that
shown in figure 32. This was drawn and affords a good comparison
with the photograph of the neon tube oscillator output shown in figure
31. Note that the rise in voltage in figure 32 is constant with respect
to time and that the discharge time is theoretically zero, since it is a
straight line from maximum to minimum. The variation of the voltage
increase, being a straight line, is linear, in contrast with the exponential
variation of figure 31. With figure 32 as a basis, we can compare ways
and means of securing the closest approach to the ideal and note the
discrepancies of various forms of sweep circuits. Incidentally, very
satisfactory application of the cathode-ray tube is possible with an
approach to the ideal saw-tooth sweep voltage.
The most commonly used method of obtaining a fairly linear,
although not really linear, sweep voltage, consists of an arrangement
whereby the gas discharge mbe ionizes at a certain voltage, appreciably
less than the full charging voltage. Consider figure 33. Figure 33-A
shows two cycles of a saw tooth wave supposedly developed by a fixed
resistor-condenser-discharge tube combination, wherein the tube trips
or flashes at 105 volts. The charging voltage or supply voltage is 110
volts. From what has been said, it is obvious that this type of sweep
voltage would be unsatisfactory. If we consider the ordinates or
vertical reference lines, as representing time; each heavy vertical line
represents 1/100 of a second. For the first 1/100 second, the voltage
rises approximately 32.5 volts. For the next, it rises about 29.5 volts.
For the next, it rises about 15.5 volts. For the next, it rises about 11.5
volts. For the remaining equal time variations, this voltage rises in
steps of 7.3 volts, 6.7 volts, 4.1 volts, 3.5 volts, 2 volts and 1 volt,
respectively, when the tube flashes and the discharge occurs. (We are
assuming an ideal case, where the discharge is instantaneous from
maximum to zero. In actual practice, a certain amount of time would
elapse for the discharge period, because the rube possesses resistance,
even when it is ionized and the condenser possesses resistance. Also
that the tube does not become a non-conductor until the voltage has
reached zero. In practice this is not so, as stated earlier in the refer-
ence to the upper and lower critical values of voltage.)
It is evident that the rate of charge and voltage increase is very
irregular. If we assume that this is a cycle of a 10-cycle wave, the rise
in voltage mentioned before would occur in each 1/100 of a second.
Suppose that we arrange for the tube to flash at 87.7 volts. The
charging voltage, resistance and capacity remain the same. The dis-

SWEEP CIRCUITS 65
charge then occurs after an interval of 5/100 of a second. Hence the
frequency is 20 cycles. See figure 33-B. What are the effects?
They are two in number. The first is that the amplitude of the
sweep voltage is reduced. The second is that the portion of the charge
curve actually used is steeper than the entire curve previously used and
Fig. 33-A. Two cycles of a theoretical saw-tooth wave such as would be
developed by a resistor-condenser-discharge tube combination with the tube
tripping at 105 volts. Fig. 33-B shows the waveform when the tube flashes at
87.7 volts and Fig. 33-C shows the wave when the tube flashes at 52 volts.
When the flashing voltage is reduced to 32.5 volts, Fig. 33-D, the charging
portion of the wave is fairly linear.
while it is true that linearity is still far from attainment, the rate of
travel of the spot across the screen will not vary as much as it did when
the amplitude was greater as a result of using most of the charging
voltage. It is to be understood that the rise in voltage with respect to
time is not yet a close approach to being constant, but the change in
speed from the start to the finish is not as great as before. From this
we can gather a very important bit of information. Namely, that if any
attempt is made to employ the maximum amplitude by utilizing almost

66 THE CATHODE-RAY TUBE AT WORK
the full charging voltage, the departure from the required linearity is
greatly increased. The change in frequency also brings to light the
fact that under certain conditions, that is, if the adjustments of the
sweep circuit change the amplitude very much, it is possible to cause
a change in frequency of the sweep voltage.
Suppose that we reduce the flash voltage still more, say to 52 volts.
See figure 33-C. The charge and discharge period now occurs in 2/100
of a second. This means that the frequency of the sweep is 50 cycles.
It is obvious that the slope of the voltage curve is a closer approach
to the ideal straight line than the curves of either figures 33-A or 33-B.
Since figure 32 shows the ideal curve, wherein we know the variation
to be linear, we can take for granted, without going into a discussion
of actual figures, that the condition obtained, when the flash voltage is
as stated in figure 33-C, is improved over that of the other curves.
Suppose that we reduce the flash voltage still more, say to 32.5
volts, as shown in figure 33-D. The charge and discharge cycle occurs
in 1/100 of a second, hence die frequency has been increased to 100
cycles. At the same time the amplitude has also been decreased.
However, we are producing what appears to be a fairly linear wave. At
no time is it possible to produce a truly linear wave, unless the control
of the charging current is such that the flow is kept at a constant rate
during the entire charging cycle. We have seen how, by utilizing a
certain portion of the complete charging voltage to constitute the
charging cycle, we can definitely improve the degree of linearity. This
is done in a number of instances in commercial cathode-ray oscillo-
graphs.
It might be well at this time if we made mention of the fact that the
voltage values mentioned in connection with figure 33 were purely
arbitrary. They do not designate the actual charging voltage values
employed in commercial devices. The similarity, however, between
these values and commercial equipment lies in the fact that the voltage
used to charge the condenser, through whatever current limiting device
is used, is much greater than the actual voltage developed across the
condenser and employed to flash the gas discharge tube.
The method of employing the type 885 gas-discharge tube to provide
the sweep circuit for commercial oscillographs is shown in simplified
form in figure 34. This tube differs somewhat from the two-anode
neon or argon gas tube. The 885 is a gas content grid controlled triode.
The heater heats the cathode, which is the electron emitter, just as in
the ordinary indirectly heated a-c. triode. The tube contains an inert

SWEEP CIRCUITS 67
gas, which will ionize when the voltage between the cathode and the
plate reaches a certain value. The voltage at which ionization will
occur depends upon the bias applied to the grid. In other words, the
flash voltage is a function of the grid voltage. With a certain negative
bias applied to the control grid, the tube will flash at a certain plate
voltage. This is the voltage developed across the condenser. Whenthe flash occurs, the condenser discharges through the tube. When the
voltage across the condenser is reduced to the lower critical potential
of the tube, the grid again takes control and the tube becomes a non-
conductor and the charging cycle starts all over again.
The potentiometer P in this case is used solely to establish the proper
flash voltage to produce the most linear sweep possible. In practice P
is fixed, or at least the bias voltage is fixed, so that when R and C are
varied to produce the sweep voltage at the required frequencies, the
sweep voltage will be linear. Some commercial units employ a poten-
tiometer across the bias battery, in order to provide an amplitude con-
trol, whereas other commercial units employ the power supply voltage
divider as the source of the bias voltage and by properly tapping this
source, provide the correct bias and eliminate the potentiometer. The
Fig. 34. A simplified schematicdiagram showing the use of an 385gas discharge tube for providing
a sweep circuit. This circuit is
typical of those used in severalcommercial oscillographs.
charging cycle of the system, shown in figure 34, is exactly like that of
the system shown in figure 30, hence requires no detailed discussion.
Some commercial oscillographs do not employ the tube as such but
employ the G.E. Thyratron, known as such. However, as far as opera-
tion is concerned, both are of like character, except that the 885 type
of tube is rated at a much lower plate voltage, so that its output under
correct conditions is not as great as may be secured from the thyratron.
We are referring to amplitude of the sweep. It is to be understood
that the 885 and the tube known as the grid-controlled gas discharge
thyratron are of substantially the same design.
The effect of amplitude control of the gas discharge tube, whichmeans operation at various portions of the charging or adjustment of
the flash voltage, is illustrated in figures 35, 36 and 37. Figure 35
shows the output waveform of a commercial sweep circuit which has
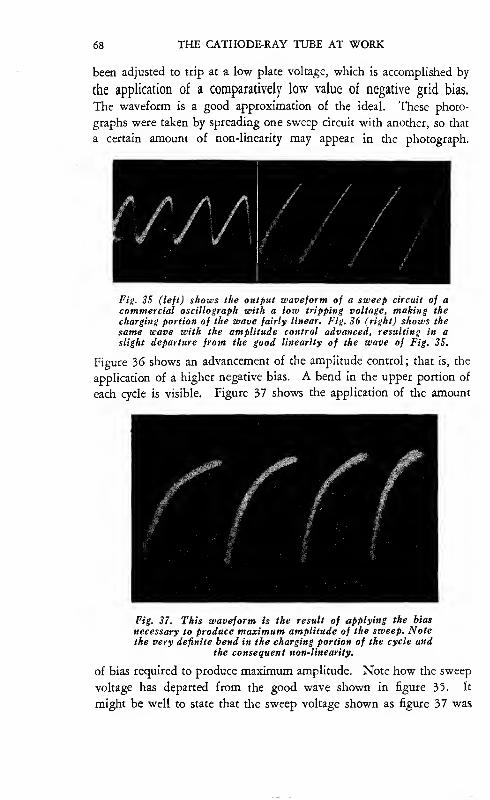
68 THE CATHODE-RAY TUBE AT WORK
been adjusted to trip at a low plate voltage, which is accomplished by
the application of a comparatively low value of negative grid bias.
The waveform is a good approximation of the ideal. These photo-
graphs were taken by spreading one sweep circuit with another, so that
a certain amount of non-linearity may appear in the photograph.
Fig. 35 (left) shows the output waveform of a sweep circuit of acommercial oscillograph with a low tripping voltage, making the
charging portion of the wave fairly linear. Fig. 36 (right) shows the
same wave with the amplitude control advanced, resulting in a
slight departure from the good linearity of the wave of Fig. 35.
Figure 36 shows an advancement of the amplitude control;that is, the
application of a higher negative bias. A bend in the upper portion of
each cycle is visible. Figure 37 shows the application of the amount
Fig. 37. This waveform is the result of applying the bias
necessary to produce maximum amplitude of the sweep. Notethe very definite bend in the charging portion of the cycle and
the consequent non-linearity.
of bias required to produce maximum amplitude. Note how the sweep
voltage has departed from the good wave shown in figure 35. It
might be well to state that the sweep voltage shown as figure 37 was

SWEEP CIRCUITS 69
not passed through any amplifiers. It is the output of the sweep oscil-
lator, fed directly to the plates of the test oscillograph.
A modification of the relaxation oscillator shown in figure 34 is
shown in figure 38. This is substantially the same as that shown in
figure 34, except that a current limiting tube is used in place of the
current control resistor R. Also that the unit is shown with output
connections to the deflection plates of the oscillograph tube. The
function of the type 34 pentode—incidentally, it is not imperative that
this tube be exactly this pentode—is to keep the flow of current charg-
ing the condensers Cl, C2 or C3, whichever is in the circuit, at a
constant value during the entire charging cycle. If this is done, then
the rise of the voltage is at a constant rate and the output is linear.
Fig. 38. The type 34 tube replaces the resistor, R, (Fig, 34) as a current
limiting device in this relaxation oscillator sweep circuit. The constant
current flow tends to charge whatever condenser is in the circuit at a constant
rate, making the voltage rise constant thereby supplying a linear output to the
deflecting plates.
This current limiting tube functions somewhat like a ballast, and, in
general, sweep circuits equipped with current limiting tubes function
as follows: When the d-c. voltage is first applied, no voltage exists
across the frequency control condensers Cl, C2 or C3, whichever one
is in the circuit; consequently, the entire supply voltage is impressed
across the plate and cathode. As the condenser begins to charge and
the voltage across the condenser starts to increase, it decreases the
voltage across the pentode and eventually the voltage built up across
the frequency control condenser is suflicient to flash the 885 tube.
It is obvious from the wiring diagram that the voltage applied to the
plate of the pentode controls the current through the pentode and the
balance between the supply voltage and the voltage across the frequency
control condenser results in uniform current flow through the pentode
during the charging cycle, The 700-ohni fixed resistor between the
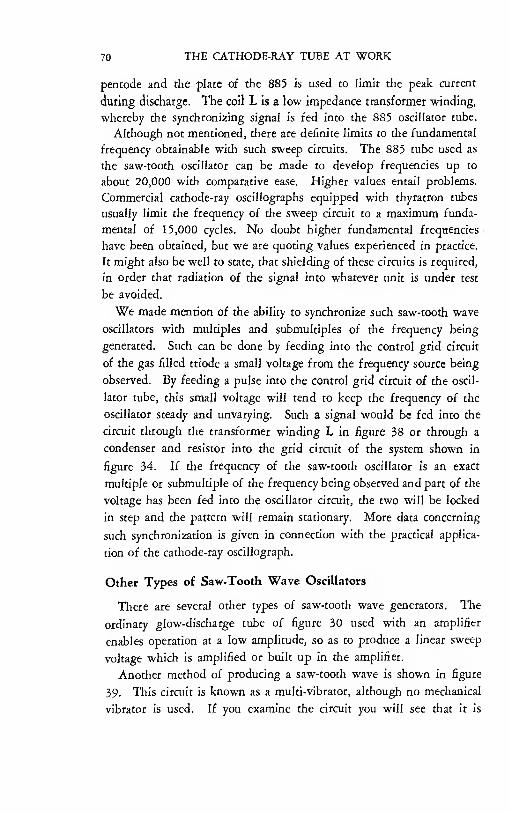
70 THE CATHODE-RAY TUBE AT WORK
pentode and the plate of the 885 is used to limit the peak current
during discharge. The coil L is a low impedance transformer winding,
whereby the synchronizing signal is fed into the 885 oscillator tube.
Although not mentioned, there are definite limits to the fundamental
frequency obtainable with such sweep circuits. The 885 tube used as
the saw-tooth oscillator can be made to develop frequencies up to
about 20,000 with comparative ease. Higher values entail problems.
Commercial cathode-ray oscillographs equipped with thyratron tubes
usually limit the frequency of the sweep circuit to a maximum funda-
mental of 15,000 cycles. No doubt higher fundamental frequencies
have been obtained, but we are quoting values experienced in practice.
It might also be well to state, that shielding of these circuits is required,
in order that radiation of the signal into whatever unit is under test
be avoided.
We made mention of the ability to synchronize such saw-tooth wave
oscillators with multiples and submultiples of the frequency being
generated. Such can be done by feeding into the control grid circuit
of the gas filled triode a small voltage from the frequency source being
observed. By feeding a pulse into the control grid circuit of the oscil-
lator tube, this small voltage will tend to keep the frequency of the
oscillator steady and unvarying. Such a signal would be fed into the
circuit through the transformer winding L in figure 38 or through a
condenser and resistor into the grid circuit of the system shown in
figure 34. If the frequency of the saw-tooth oscillator is an exact
multiple or submultiple of the frequency being observed and part of the
voltage has been fed into the oscillator circuit, the two will be locked
in step and the pattern will remain stationary. More data concerning
such synchronization is given in connection with the practical applica-
tion of the cathode-ray oscillograph.
Other Types of Saw-Tooth Wave Oscillators
There are several other types of saw-tooth wave generators. The
ordinary glow-discharge tube of figure 30 used with an amplifier
enables operation at a low amplitude, so as to produce a linear sweep
voltage which is amplified or built up in the amplifier.
Another method of producing a saw-tooth wave is shown in figure
39. This circuit is known as a multi-vibrator, although no mechanical
vibrator is used. If you examine the circuit you will see that it is

SWEEP CIRCUITS 71
nothing more than a two-stage resistance-capacity coupled amplifier
which is so arranged as to feed back upon itself. The unit is extremely
rich in harmonics and has an exceptionally high range of fundamental
frecjuencies. By proper design it is capable of generating fundamental
frequencies as high as 30,000 to 40,000 cycles per second. For such
high frequencies, it is necessary that all parts be of high quality and
constancy, particularly the diode tube employed as a variable resistance.
This circuit differs from the normal sweep, in that the voltage used to
sweep the spot across the screen is the discharge of one of the con-
densers, rather than the charge. The diode tube used as a variable
resistor provides a discharge path through which the current is inde-
pendent of the voltage, so that the rate of the condenser discharge
becomes uniform and a linear time axis is available.
Fig. 39. Schematic diagram of the so-called multi-vibrator circuit. Note thatthis is nothing more than a two-stage resistance-capacity coupled amplifierarranged to feed back on itself. It is possible to generate fundamental
frequencies up to 30 or 40 kilocycles.
Condensers C and Cl are alternately and very rapidly charged. Con-
denser C discharges through rhe diode tube, in which the plate current
is limited by the filament temperature, hence control of the filament
current of T-3 provides a wide range of frequencies. The time axis
output of the unit is secured through the two 2-mfd condensers. Theconstants shown are those which were used by the writer for many years.
The tubes originally employed were W.E. 203B for T-1 and T-2 and a
215-A for tube T-3. The circuit is adaptable to the conventional tubes,
rated at from 10,000 to 20,000 ohms plate resistance. By making Cand C-1, fixed condensers of from .0005 mfd. to the value shown,arranged in switch controlled steps, additional control of frequency is
available. A synchronizing pulse can be fed into the circuit in series
with the 48,000-ohm grid leak.
Still another form of relaxation oscillator, whereby higher sweep

72 THE CATHODE-RAY TUBE AT WORK
frequencies are available is the ordinary oscillator circuit arranged in
such manner that the grid circuit will periodically block. The dis-
charge of the grid condenser is arranged through a diode tube with a
controlled filament, so that the current through the tube is governed by
the filament temperature. The filament temperature is the rough fre-
quency adjustment and the variable grid condenser is the fine frequency
adjustment.
The circuit is shown in figure 40. The oscillator is adjusted to some
high frequency, say, within the broadcast band. The grid condenser,
consisting of the two condensers C and Cl, becomes charged. As a
result of the value of the grid leak, which is the diode tube, the grid
of the oscillator tube becomes highly negative and the tube blocks.
block periodically. The filament temperature of the diode is the rough
frequency adjustment and the condenser C is the fine frequency adjustment.
Oscillations cease. The charge which has accumulated across the con-
densers now leaks off through the diode tube. After a time interval,
sufficient charge has leaked off, so that oscillations start again. The
charge again accumulates and the process is repeated. The time interval
required for the charging of the condenser can be controlled by the
tuning of the resonant circuit. The period of the discharge is adjust-
able by means of the grid condenser and the diode tube filament
resistor. The discharge curve of the grid condenser-diode tube combi-
nation is sufficiently linear to provide a satisfactory time base. However,
the amplitude of this voltage may not be high enough to provide the
correct width of the sweep without amplification and this is somewhat
of a problem at high frequency, particularly when this frequency must
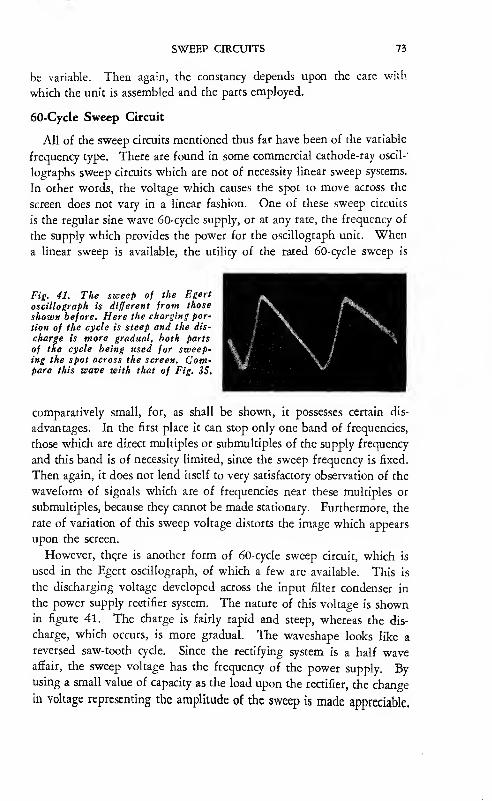
SWEEP CIRCUITS 73
be variable. Then again, the constancy depends upon the care with
which the unit is assembled and the parts employed.
60-Cycle Sweep Circuit
All of the sweep circuits mentioned thus far have been of the variable
frequency type. There are found in some commercial cathode-ray oscil-
lographs sweep circuits which are not of necessity linear sweep systems.
In other words, the voltage which causes the spot to move across the
screen does not vary in a linear fashion. One of these sweep circuits
is the regular sine wave 60-cycle supply, or at any rate, the frequency of
the supply which provides the power for the oscillograph unit. Whena linear sweep is available, the utility of the rated 60-cycle sweep is
Fig. 41. The sweep of the Egerl
oscillograph is different from those
shown before. Here the charging por-
tion of the cycle is steep and the dis-
charge is more gradual, both parts
of the cycle being used for sweep-ing the spot across the screen. Com-pare this wave with that of Fig. 3S.
comparatively small, for, as shall be shown, it possesses certain dis-
advantages. In the first place it can stop only one band of frequencies,
those which are direct multiples or submultiples of the supply frequency
and this band is of necessity limited, since the sweep frequency is fixed.
Then again, it does not lend itself to very satisfactory observation of the
waveform of signals which are of frequencies near these multiples or
submultiples, because they cannot be made stationary. Furthermore, the
rate of variation of this sweep voltage distorts the image which appears
upon the screen.
However, thqre is another form of 60-cycle sweep circuit, which is
used in the Egert oscillograph, of which a few are available. This is
the discharging voltage developed across the input filter condenser in
the power supply rectifier system. The nature of this voltage is shownin figure 41. The charge is fairly rapid and steep, whereas the dis-
charge, which occurs, is more gradual. The waveshape looks like a
reversed saw-tooth cycle. Since the rectifying system is a half waveaffair, the sweep voltage has the frequency of the power supply. Byusing a small value of capacity as the load upon the rectifier, the change
in voltage representing the amplitude of the sweep is made appreciable.

74 THE CATHODE-RAY TUBE AT WORK
We have said a great deal about different types of sweep circuits
—
about distortion which occurs when a sweep is not linear and the need
for linearity. It might be a good thing to develop several sine waves
with linear and non-linear sweep voltages. These are shown in figures
42, 43, 44 and 45. Figures 42 to 44, inclusive, illustrate how a normal
fairly linear sweep voltage spreads one, two and three cycles. You
will note that in each and every case, there is some effect upon the
shape of the developed pattern as a result of the discharge portion of
portion of the sweep cycle takes place during a part of the waveform
cycle being observed, so that there is a tendency towards distortion.
However, as you see in figure 44, if three or more cycles are placed
upon the screen, the first cycle is substantially an undistorted representa-
tion of the sine wave applied to the vertical deflection plates. The
effect of a non-linear sweep in distorting the developed image is evident
in figure 45. You can very easily imagine the effect upon a single or
two-cycle images. In a single-cycle image one of the alternations would
appear normal and the other half of the cycle would be crowded. In
the two-cycle pattern, one of the cycles would appear normal, whereas
the other would be crowded.
SWEEP CIRCUITS 75
However, we do not want you to forget the statement made earlier
in this chapter to the effect that even a non-linear sweep may enable
observation of the character of a waveform, if a sufficient number of
cycles are shown upon the screen. This is so, because, as you note, one
portion of the non-linear sweep voltage is a fair approximation of
linearity. Hence with three or four cycles upon the screen, those slightly
The three cycles of the sine wave at theright are spread by a linear sweep in
Fig. 44 and by a non-linear sweep in
Fig. 4S, Note the distortion that
occurs in the second and third cyclesdue to the curvature of the sweep. It
should be noted that in Figs. 42 to 45the return of the sweep occupies agreater percentage of the cycle than is
used in practice. Compare the angle ofthe return sweep of these drawingswith the oscillograms of Figs. 35, 35
and 37.
in from the position which is the start of the beam may be fairly true
representations of the waveform voltage applied to the vertical deflec-
tion plates. The sweep voltage frequency in figures 42, 43, 44 and 45
has been kept constant and the voltage being observed has been
changed in frequency. In practice to obtain a greater number of cycles
upon the screen, for any one frequency input to the vertical defleaion
plates, the sweep frequency is changed.
Although we do not definitely tie in the sweep voltage shown in
figures 42 to 45, inclusive, with the basic electro-mechanical sweep of
figure 25, it is to be understood that the operation of the electronic
sweep in tracing the pattern is like diat which has been described for
the electro-mechanical sweep consisting of the battery voltage and
potentiometer. In the electronic sweep the trace and return of the

76 THE CATHODE-RAY TUBE AT WORK
beam spot from one end of the screen to the other is done automatically.
You should realize that the sweep voltages shown in figures 42 to 45,
inclusive, are divided into uniform time intervals just as the sweep
voltage in figure 25 is divided into uniform time intervals. Also that
the waveforms being observed and developed upon the screen are
likewise divided into uniform time intervals. The fact that a screen
is not shown in figures 42 to 45, inclusive, should not confuse you.
The sweep voltage is being applied to the horizontal deflection plates
and the voltage to be observed is applied to the vertical deflection
plates. The developed pattern is assumed to appear upon the screen.
So much for the general discussion of sweep circuits. The associa-
tion between the basic electronic sweep circuits shown in this chapter
and the commercial arrangements used in cathode-ray oscillographs
will follow in a subsequent chapter.

CHAPTER III
A-C. VOLTAGES ON BOTH SETS OF PLATES
Before embarking upon the discussion of the commercial cathode-
ray oscillographs and the practical application of such units, there is
one very important subject which must receive attention. This is the
result of applying a-c. voltages to both sets of deflector plates. In this
connection one very important point comes to the fore. This is phase
relation. The phase relation between the a-c. voltage applied to the
vertical deflection plates and the a-c. voltage applied to the horizontal
deflection plates has a tremendous effect upon the shape of the pattern
which appears upon the screen. It is extremely important that you
realize this qualification.
After all is said and done, the pattern which appears upon the screen
is the result of displacement of the spot in two dimensions, at right
angles to each other. Assuming any one value of voltage, a uniform
voltage applied to both plates, the shape of the pattern is going to be
determined by the phase relation between the instantaneous deflecting
voltage fields. At the same time, if the phase relation is constant, the
shape of the pattern is also going to be influenced by the relative ampli-
tudes of the horizontal and vertical deflection fields.
Fortunately, certain information is possible with the cathode-ray
oscillograph, even when the phase relation is unknown, despite the
fact that the existing phase relation does influence the pattern. This is
so, because the pattern, if understood as a pattern, conveys the informa-
tion desired, despite the fact that the existing phase relation has mani-
fested its effect. Also because the same information may be conveyed
to the observer for any one of a number of different phase relations.
At the same time, it is extremely valuable to comprehend the reason
why the shape of the pattern is as it is.
It is also of interest to realize that simple and complex patterns
result from the application of a-c. voltages to both plates. However,
irrespective of the nature of the pattern, be it simple or complex, it is
77

78 THE CATHODE-RAY TUBE AT WORK
important to understand that the pattern is created by the movement of
a single spot—that each of the lines, no matter how many appear upon
the screen, is being traced by a single spot in motion and the line or
lines are the result of the recurrent tracing of that path by the moving
spot.
The nature of the a-c. voltages, which are applied to the two sets of
plates, is of no consequence. They can be sine waves or distorted waves.
They can be modulated waves or unmodulated waves. As far as the
latter two classifications are concerned, certain limitations are imposed
and these relate to the ability of the amplifiers within the oscillograph
to pass or amplify the voltages at these carrier frequencies. Simplest
patterns appear when the simplest waves are placed upon the respective
plates, and when they bear some simple relation to each other with
respect to frequency. If the nature of the voltages applied to both
sets, or to one set of plates, is complex, due to distortion or modulation,
the resultant pattern will show the complexity of one of the voltages.
Two voltages, which are of such frequency that they are not integral
multiples of each other, will produce complicated patterns. So much
for that. Let us now see how two simple sine waves deflect the electron
beam.
Suppose that we apply two sine waves of like amplitude and like fre-
quency, one voltage to each set of plates. The two voltages are exactly
in phase. What is the final pattern upon the screen.^ . . . Examine
figure 46. The normal position of the spot is in the center of the
screen. The horizontal and vertical deflecting fields start at zero. Con-
sequently, at the start of each voltage cycle, the deflecting force exerted
by the two voltages is zeto. The numbers for each spot upon the screen,
in each direction, correspond with the numbers shown upon the waves.
Each spot, with the exception of the zero and the peak points, has two
numbers, corresponding to the two times that the spot passes through
that point during each alternation. The zero point has three numbers,
because the wave reaches that point three times in a complete cycle.
The peak points have but one set of numbers, because the wave passes
through the peak amplitude but once in each alternation. The time
interval between the amplitude designations is uniform for both volt-
ages.
At the start the spot remains at rest in the center of the screen.
This is indicated as zero on figure 46-B. After the passing of the first
time interval, the vertical field has a deflection of 1 unit and the
horizontal field has a deflection of 1 unit, positioning the spot as 1-1

AC VOLTAGES ON BOTH SETS OF PLATES 79
in figure 46-B. As time passes, the voltage of each wave increases and
the resultant spot displacement for each time interval is shown as 2-2,
3-3, 4-4, 5-5, 6-6 and 7 in figure 46-B. Borh waves now have reached
their peak amplitude on the rising half of the first alternation. Now,
one below is impressed on the horizontal deflection plates. Each spot on the
screen bears two numbers, except the peaks, as the voltage varies from zero
to maximum and returns. The resulting figure is shown in Fig. 46-B. Thesewaves are in phase.
they both decrease in amplitude at a constant rate and the spot positions
pass through the same points as before, since the time interval is the
same. To correspond with the spot positions shown in figure 46-A,
for the second half of the first alternation, we have also numbered the
resultant displacement positions of the spot to correspond. These are
8-8, 9-9, 10-10, 11-11, 12-12, 13-13, and 14 is again zero. The posi-
tioning of the spots in this quadrant is due to the polarity of the
plates as a result of the voltages applied.

80 THE CATHODE-RAY TUBE AT WORK
We now start upon the second alternation. As a result of the
polarity of the respective vertical and hori2ontal deflecting plates, the
spot now is positioned in the D or fourth quadrant. The increase in
amplitude of the second alternation causes displacement equal to ampli-
tudes indicated as 15, 16, 17, 18, 19, 20 and 21 in the vertical direction
and amplitudes indicated as 15, 16, 17, 18, 19, 20 and 21 in the hori-
zontal direction. The resultant spot positions are 15-15, 16-16, 17-17,
18-18, 19-19, 20-20 and 21-21 in figure 46-B. During the last half
of the second alternation, the vertical and horizontal amplitudes
decrease and they cause resultant displacement of the spot through
positions 22-22, 23-23, 24-24, 25-25, 26-26, 27-27 and 28-28 in figure
46-B. As is evident, the result is a diagonal line of spots. If these
two voltages are recurrent, instead of number of spots, we have an
image which is a straight line.
A pattern of this type indicates certain definite conditions. First
that the frequency of the two voltages applied to the vertical and
horizontal plates is identical and, second, that they are exactly in phase
with each other. In other words, that the instantaneous values of the
two voltages are exactly alike with respect to time. A pattern of this
type is independent of frequency. That is to say, such would be the
pattern for any frequency, provided that both voltages were of the
same frequency and exactly in phase or have a zero phase difference.
(Two voltages or currents or a voltage and a current are said to be
in phase if they pass through their maximum and zero points in the
same direction, at the same time.)
What other significant information can we glean from figures 46-A
and 46-B.^ ... In the first place, the bisection of the angles of the
second and fourth quadrants by the image is attained, because the
amplitude of the two deflecting fields is the same. Try to visualize
the horizontal deflection equal to half of that which is shown and the
vertical amplitude as shown. What would happen? Since the vertical
amplitude would be the same, but the horizontal displacement would
be less, the line would tend to approach the vertical reference line, the
"Y” axis. If the horizontal deflection is decreased in steps, the resultant
pattern would gradually approach the vertical line, until, when the
horizontal deflection becomes zero, the image is a straight line along
the "Y” axis. If the reverse were true, that is, the horizontal deflection
is maintained constant and the vertical deflection is decreased, the line
would tend to move towards the horizontal or "X” axis, until, when
the vertical deflection is zero, the pattern is a straight line along the

A-C. VOLTAGES ON BOTH SETS OF PLATES 81
"X” axis. In practice, variation of the horizontal or vertical amplitude
controls, seems to rotate the pattern around the zero point.
The exact position of the single line pattern as it appears in the
B and D quadrants (see figure 46-B) is not of great importance, for it
indicates a zero phase difference as long as the pattern is a single line
and is the result of the presence of both deflecting fields. The exact
Fig. 47. The development of the resulting image seen on the screen in Fig.
47-B is the same as Fig. 46, but in this case the two sine waves impressed onthe deflecting plates of the tube are 180° out of phase; hence the image slopes
to the right instead of the left, as in Fig. 46.
angle is an indicator of the relative amplitudes of the two voltages
applied to the plates. The fact that the image is a single line pattern
is the indicator of the zero phase relation between the two voltages.
Suppose that one of the voltages is 180 degrees out of phase with the
other voltage. (Two waves are said to be 180 degrees out of phase,

82 THE CATHODE-RAY TUBE AT WORK
if they pass through their maximum and minimum points at the same
time but move in opposite directions.) Suppose that the two voltages
of like frequency and like amplitude shown in figure 46-
A
are now 180
degrees out of phase. Wave B has been turned through 180 degrees.
See figure 47-A. Both voltages start at zero, but increase in amplitude
in opposite directions. With the individual spot positions as shown in
figure 47-A, the resultant pattern is as shown in figure 47-B. Note that
the pattern now occupies space in quadrants A and C or if you designate
the quadrants by numbers, in quadrants 1 and 3. What was said about
amplitude variations in connection with figure 46-B is applicable to
figure 47-B, except for the difference introduced by the orientation of
the pattern upon the screen. A similar pattern would be obtained, if
wave B had been left intaa as in figure 46-A, and wave A had been
changed through 180 degrees. If both waves are turned through 180
degrees, the result is the original zero degree phase difference. Exactly
180-degree phase difference is indicated only if the pattern is a single
line, located in the quadrants shown. Additional details concerning
the phase relation indicated by such patterns will be found in the
chapter devoted to practical applications of the tube for the determi-
nation of phase relation.
The phase relation of two voltages applied to the vertical and hori-
zontal plates, respectively, is not limited to 0 or 180 degrees. Any
phase difference between 0 and 180 degrees may be recognized upon
the screen. In connection with phase difference, while it is true that
the complete cycle of angular rotation is 360 degrees, certain phase
angle representations appear alike, when viewed upon the cathode-ray
tube screen. Phase difference patterns representative of angles between
0 and 90 degrees find their duplicates in patterns which vary in phase
from 270 to 360 degrees. Patterns, which vary in phase from 90 to
180 degrees, find their duplicates in patterns which vary in phase from
180 to 270 degrees. In other words, a pattern which indicates a 45-
degree phase difference may also be 315 degrees; 90-degree phase shift
may also be 270 degrees and 135 degrees may also be a 225-degree
phase shift. For ordinary purposes, however, in connection with radio
receiver, public address amplifier and "ham” transmitter adjustment,
phase difference observations between 0 and 180 degrees are entirely
sufficient.
Continuing with like frequency signals supplied to the two sets of
deflecting plates, if these signals differ in phase by 90 degrees, the
resultant pattern is a circle, providing that the amplitudes of both waves

AC VOLTAGES ON BOTH SETS OF PLATES 83
are alike. The development of this circular pattern is shown in figure
48. Any deviation from like amplitudes results in an elliptical pattern,
instead of a circle. However, the shape of the pattern cannot be con-
fused with one of different phase difference, because the "Y” axis
divides the image in two, when the exact 90-degree phase difference
exists. For that matter, the "X” axis is also a bisecting line. For
higher or lower values of phase difference, the image tilts one way or
the other.
Fig. 48. The sine wave at B is 90” out of phase with the one shown at C, sothat the resulting pattern is a circle. Note that the time axis here is dividedinto degrees of a circle instead of fractions of a second as in previous
drawings.
You will note, if you examine figure 48, that the time reference line
has been designated in degrees, the divisions being in uniform time of
30 degrees. This should make it easier to comprehend the resultant
movement of the spot through a circle of 360 degrees. A general idea
of the effect of waveshape and phase relation upon the pattern devel-
oped, when both voltages are of like amplitude, is given in figure 49

84 THE CATHODE-RAY TUBE AT WORK
Fig. 49. In each case A is the resultant image that will appear upon thescreen when the wave at B is impressed on the vertical deflecting plates andthe wave at C on the horizontal plates. These waves are of equal amplitude
and have the same frequency.
In each of these, A is the resultant image, B is the vertical deflection
voltage and C is the horizontal deflection voltage. Furthermore, the
frequency of both voltages is the same. From these patterns one can

A-C. VOLTAGES ON BOTH SETS OF PLATES 85
gather an idea of the resultant pattern, under the conditions cited,
when the wave shape lies between limits represented by sine waves as
one limit and linear waveforms as the other limit. (The idea to ptesent
such limits was obtained from the Western Electric Bulletin No. 176.)
In each case, the resultant can be computed from the two deflecting
voltages, because all three patterns are based upon the same time interval
and also upon a uniform amplitude basis.
Photographs of various phase relations for different kinds of deflect-
ing voltages will be found in the chapter devoted to practical application
of the cathode-ray tube.
Whether or not the patterns shown in figures 46-B, 47-B, 48 and 49
will remain stationary for any one condition, or will drift from shape
to shape, that is, drift from a single line to an ellipse and to a circle
and reverse, depends upon the constancy of the frequency and phase
relation. If one of the frequency sources, or if the frequency of one of
the deflecting voltages is continuously changing, no matter how slight
this drift, the pattern will not remain stationary. It is going to be in
motion and change its shape continually, because the phase relation is
continually changing. Normally two signals which bear a certain phase
relation to each other remain in that phase relation as long as the
frequencies remain constant, and other controlling factors remain
constant. The movement of a pattern resulting from the application
of two frequencies, which are substantially identical, takes place at a
rate equal to the difference frequency. In other words, the rate of
change of a pattern through the complete 360 degrees is an indication
of the frequency difference between the two frequencies.
From what has been said so far, it is evident that these patterns are
suitable for frequency comparison. In other words, a stationary pattern
indicative of any phase relation, and which is a single line, circle or
ellipse, shows that both frequencies are identical. If one of these
voltages be of known frequency and the other of an unknown fre-
quency, the adjustment of the unknown to produce the patterns men-
tioned, is that for the known frequency and can be so calibrated. As
a matter of fact, one of the important functions of the cathode-ray
oscillograph is frequency comparison, as will be shown later. In this
connection, it affords an excellent and extremely accurate means of
comparing audio frequencies, which normally require very elaborate
and expensive standards. By proper operation, as shall be shown, one
or two audio standards of single frequencies are sufficient to calibrate a
range as great as from 30 to 10,000 cycles.
86 THE CATHODE-RAY TUBE AT WORK
The patterns formed when two varying voltages are applied to the
two sets of deflecting plates, one such voltage to each set of plates, are
known as Lissajous' figures. These figures can be developed under
various conditions and they will assume various shapes. It is the
namre of the pattern which enables its use for frequency comparison.
When both voltages are sine waves, or for that matter, if both contain
several harmonics, or if only one contains several harmonics, one type
of pattern is developed. If one of the waves is a sine wave and the
other is a saw-tooth wave, another type of pattern is developed. It
might be well at this time to distinguish between Lissajous’ figures,
which result from the application of sine-wave voltages to both sets of
plates, modulated or unmodulated, and the figure which appears when
one of the voltages is a saw-tooth wave. It has been customary in the
past to apply the term Lissajous’ figures to those patterns which occur
when two varying voltages ate applied to the two plates, in any phase
relation and in any frequency ratio. Also to apply the name to the
pattern which appears when one of the voltages is a saw-tooth wave
and the frequency ratio between the two voltages is not a simple integral
ratio, with the saw-tooth voltage being the lower of the two frequencies.
The reason for making this qualification is that under certain con-
ditions, namely, when the saw-tooth voltage is of a frequency which is
an exact submultiple of the other voltage, the pattern which appears
upon the screen is the waveform of the other voltage. It would be incor-
rect to call such a pattern a Lissajous’ figure.
Lissajous’ figures may be of varied shapes. They may be complex or
simple, depending upon the frequency ratio between the two varying
voltages and the characteristics of these voltages, whether modulated
or unmodulated, sine or distorted, relative amplitudes and phase rela-
tion. As a general rule, when used for the comparison of frequencies,
the known and unknown signals are secured from oscillators, so that
a certain type of pattern is usually developed. Fortunately, when the
frequency ratio between the two voltages is higher than a certain order,
a stationary pattern is not desired. Instead, a slowly changing pattern
is arranged. This means that the two frequencies are not in exact ratio
and a continual change in phase relation is taking place. The determi-
nation of the frequency is made during the time that the pattern is
rotating very slowly. Then the exact calibration is accomplished by
stopping the pattern and noting the exact setting of the oscillator being
calibrated. All of this is practical data. Let us devote some attention
to the development of a Lissajous’ pattern.

AC VOLTAGES ON BOTH SETS OF PLATES 87
We have shown the pattern resulting from the application of two
sine waves of like frequency. Suppose that we make one frequency
three times as high as the other. The exact numerical values are of
no importance, just so long as the amplitude of the voltages is sufficient
to cause the proper deflection, and the ratio of the two frequencies is
as 3 is to 1. The higher of the two frequencies is applied to the
vertical deflection plates and the lower of the two frequencies is applied
to the horizontal deflection plates.
Fig. 50. The sine wave at A is three times the frequency of that at B and is
90° out of phase. Both waves are divided into equal time intervals. Thenumbers on the resultant image at C indicate the amplitude displacement of
each wave at the same instant.
Fig. 51. By drawing tangents to the loops at the horizontal and vertical sides
of the pattern and counting the number of loops that each touches, the ratio
between the two frequencies impressed upon the plates of the tube can beeasily found.
In figure 50, A is the vertical deflection voltage, B is the horizontal
deflection voltage and C is the resultant pattern. You will note that

88 THE CATHODE-RAY TUBE AT WORK
the two voltages are 90 degrees out of phase. Both vertical and hori-
zontal deflection voltages are divided into the same equal time intervals.
To develop the resultant pattern, you position the spot as a result of the
amplitude displacement of both waves. This is indicated by the num-
bers. The pattern shown is quite common for various frequency ratios.
Once again we want to call to your attention that the pattern is made
by a single spot which moves through these various positions. The fact
that the image is in line form is due to the repeated movement of the
spot through the same positions. The pattern is uniform, that is,
tangents drawn to each side would produce a square. This is shown
because of uniform amplitude of both of the deflecting voltages. If
the verticil deflection voltage is greater than the horizontal deflection
voltage, the pattern would be higher and the image formed by the
intersections would be narrower. Conversely, if the horizontal voltage
is greater than the vertical deflecting voltage, the pattern widens and
becomes f atter.
By drawing a tangent to one vertical side of the image and one
horizontal side of the image, it is possible to determine the frequency
ratio. The frequency ratio is the ratio between the number of loops
which tou:h the tangents. See figure 51. With such simple patterns,
it is not r ecessary to draw tangents to determine the frequency ratio.
The number of loops upon each side can be counted without any
additional aids.
The niunber of patterns which may result from the application of
two equal such voltages are quite numerous, and as has been stated,
depend u])on the phase relation. Figure 50 illustrates a pattern
obtained when the two voltages are 90 degrees out of phase. Figure 52
illustrates die pattern which is produced when these two voltages are
in phase. If you check the development of this pattern, you will find
that certain loops are in back of others, so that only two peaks are
seen, instetd of the six peaks in figure 50. Peak 10 is directly behind
peak 2. Peak 14 is directly behind peak 22. Peak 6, appears as a
straight line at the left and peak 18 appears as a straight line at the
right. To comprehend properly such Lissajous’ figures, it is necessary
to imagine the wave traveling around a transparent glass cylinder,
through which the front and rear patterns are visible. The view
' obtained is the elevation or side view. At certain time intervals in a
moving pal tern, certain parts of the pattern would be directly behind
each other, so that all parts of the wave would not be visible. This is
shown latei in this book.

A-C. VOLTAGES ON BOTH SETS OF PLATES 89
The transition from the pattern in figure 50 to that shown in figure
52, occurs in the time requited for a 90-degree travel of the wave. For
the purpose of frequency comparison, phase relations other than 0 or
180 degrees are preferable. The 0-degree and 180-degree patterns
are very similar, lacking all intersections, but differ in the positions of
the peaks shown in figure 52. In the 180-degree pattern, the whole
image would be turned upside down. The appearance of the pattern
for 90-degrees and 270 degrees is also identical, except for the fact that
the image would be turned upside down. However, since the image
is symmetrical, turning it upside down, would not change the appear-
ance of the pattern. Separation of the peaks, which are directly behind
each other in the 3-1 patterns for 0 and 180 degrees, is accomplished
by changing one frequency very slightly. A fraction of a cycle change
is sufficient to separate the peaks.

90 THE CATHODE-RAY TUBE AT WORK
Ratios as high as 10 to 1 can be easily observed with patterns such
as that shown in figure 50. In each case tangents drawn to two sides
and counting the number of loops or peaks which touch these tangents
will identify the frequency ratio. Such identification requires that one
frequency be known and further that the plates to which this voltage
has been applied, be known. The relation between the frequency of
the voltage and the plates to which the voltage has been applied is
important, because it places the loops along the proper axis.
Space does not permit a complete explanation with full data concern-
ing the development of all types of Lissajous’ figures. We feel that
illustrations of various types of these figures, given in connection with
the practical application of the tube to frequency comparison, will serve
its purpose better than a detailed accounting of how the final pat-
terns are developed. Development of the most intricate pattern pro-
gresses exactly as outlined for the simplest of patterns. However, the
actual work is naturally more detailed and more intricate because of
the greater number of spot positions which must be established.
As far as the positioning of the beam spot to produce any one type
of pattern, it should be understood that it is applicable to all types of
voltages. While it is true that the pattern resulting from a 4-3 ratio,
obtained by applying two sine voltages, will differ from that developed
when one of these voltages is a saw-tooth wave, the actual method of
development remains the same. If you are interested in solving such
a problem, draw four cycles for the vertical deflection plates and three
cycles of a saw-tooth wave for the horizontal axis, employing the same
time interval for both. Mark off the respective amplitudes and project
the resultant spot displacement as has been done for a number of illus-
trations in this chapter. We take this opportunity of advising you
that it will be an arduous task.
We feel that it is not necessary to advance any further with the
actual development of Lissajous’ figures, because far more valuable
information can be conveyed by showing the types of figures which are
actually experienced in practice, and explaining the applications of
these figures.
Voltages with Variable Frequency and Amplitude
Before closing this chapter, we must make reference to one other
combination of varying voltages applied to the two sets of deflecting
plates. This is the arrangement wherein the voltage applied to the
vertical deflection plates varies both in frequency and in amplitude and

AC VOLTAGES ON BOTH SETS OF PLATES 91
wherein the horizontal voltage is a saw-tooth wave. This material is
related to what takes place during visual alignment. There is much
more to be said about the subject, but what is here presented should
be of value in comprehending the basic development of the pattern
upon the screen. Reference to the chapter devoted to the practical
application of the tube for visual alignment will establish the remaining
details, as they relate to the various methods in use at the time of this
writing.
Fig. S3. The sweep frequency is
such that one cycle occurs during
the time that the oscillator's fre-
quency varies from 4SS to 48S he.
The tuned circuit to which this
band of frequencies is applied is
resonant at 470 kc. The frequency
response curve taken across the
detector load appears at the right
and its image, as seen on the screen
is at the left, above the sweep.
Examine figure 53. Let us assume that an oscillator is arranged to
vary in frequency of output from 455 kc. to 485 kc., once each second.
The signal from this oscillator is applied to a detector tube through a
tuned circuit. This tuned circuit is made resonant to a frequency of
470 kc., which is the mean frequency of the band covered by the con-
tinuously variable oscillator. There is supplied to the detector tube
a signal voltage, which varies in amplitude with the response charac-
teristic of the tuned circuit. As a result the rectified voltage across the
detector load varies in accordance with the response characteristic of
the tuned circuit. If this voltage is applied to the vertical deflection
plates of the cathode-ray tube, it is the equivalent of applying to these
plates a voltage which varies in amplitude at a definite rate, namely, the
rate at which the oscillator covers the frequency band specified. The
sweep frequency is adjusted so that one full sweep cycle takes place
during the oscillator frequency change over the band. The result is
that the sweep voltage displaces the spot in one direction (horizontal)
and the signal voltage applied to the vertical plates displaces the spot
in the other direction (vertically) . The resultant displacement of this

92 THE CATHODE-RAY TUBE AT WORK
Spot develops the resonance curve. The pattern is stationary, because
the sweep is in step with the frequency variation and the position of
the spot is recurrent during each cycle.
Actual visual alignment devices employ this basis of developing the
resonance curve. There are, of course, certain differences between the
design of the practical units and the explanation here given, but the
basis of operation, as here presented, is substantially that experienced in
practice. Although this reference and explanation covers what is the
i-f. band, let it be known that it is applicable to the r-f. band and also
to the a-f. band. As far as the latter is concerned, the shape of the
resonance curve differs, as a result of the difference between an a-f.
system response characteristic and an i-f. or r-f. system response char-
acteristic, but the basis of operation remains unchanged. What has
been said, as will be shown later, is applicable to all types of frequency
modulator circuits and to single and double pattern systems.

CHAPTER IV
COMMERCIAL CATHODE-RAY OSCILLOGRAPHS
We now are ready to consider the structure of the cathode-ray oscillo-
graphs offered for commercial use. Let it be known that it is our
intention to discuss those devices which are being offered for use by the
radio servicing industry for radio receiver design and servicing, public
address design and servicing and to the amateur radio fraternity, for
the adjustment of “ham” transmitters. There are in use a large number
of cathode-ray units intended for the industrial field and college labora-
tories. In many respects these devices are like the ones to be described
in the pages following, but since we are catering to a limited field, we
deem it best to devote very little space to the application of the tube
to fields and industries other than those named. At the same time,
we recognize that many of the industrial applications are similar to
those found in out fields, because the method of utilizing the cathode-
ray tube is to convert mechanical and other physical impulses into
electrical impulses and to interpret the cathode-ray tube image ac-
cordingly. As such we hope that some of the information con-
tained in this volume will be of value to the men, who will employ the
cathode-ray tube in the industrial field.
To analyze properly the structure of the commercial cathode-ray
oscillographs available at this writing, for use in the fields named, wemust of necessity classify the instruments in basic types. Perhaps others
may not agree with our method of classification, but since no definite
standard classification is available, we take the liberty of establishing
our own.
1. The basic unit is the cathode-ray tube with its power supply.
2. An elaboration upon this basic unit, which forms class 2, the
most popular is the cathode-ray tube with its power supply and
to which has been added amplifiers for the vertical and horizontal
deflection plates and a linear (saw-tooth oscillator) sweep circuit
93

94 THE CATHODE-RAY TUBE AT WORK
These are the two basic divisions. Elaboration upon basic units 1
and 2, are accomplished in several ways, dependent upon the nature of
the service involved. Basic unit 1 can be converted into basic unit 2,
thereby greatly expanding upon its field of application, by the addition
of the component circuits stated.
Elaboration upon basic unit 2, is also possible by the addition of
some means, generally known as a frequency modulated multi-wave-
band oscillator covering the i-f. and broadcast band, sometimes the
high frequency band, whereby a frequency modulated signal is avail-
able. (By frequency modulated signal is meant a constant voltage
output which changes over a pre-determined frequency band, as a result
of some action associated with the oscillator, or as a result of a separate
unit intended to perform that funaion.) This is the unit intended for
visual alignment work.
Investigation of the cathode-ray instrument market brings to light
the fact that certain instruments intended solely for such visual align-
ment and not possessing controlled sweep circuits, are available. It is
possible that this type of unit constitutes a third classification, but we
feel that it is not justified. Recognizing the tremendous versatility of
the cathode-ray tube as used in basic unit 2, the addition of equip-
ment for alignment is just an expansion of its functions, particularly
so when a unit, such as that stated as basic unit 2, can be expanded
to include alignment by means of simple external equipment. Conse-
quently, we openly state that it is preferable to expand basic unit 2 to
include alignment than to expand a cathode-ray system, developed
solely for alignment, to include the functions and capabilities of the
tube equipped with power supply, amplifiers and linear sweep circuit.
We make this statement with the full knowledge that it is possible
that several visual alignment cathode-ray units, intended solely for such
work may make their appearance upon the market. As such, they fill
only one need. When expanded upon, as stated before, the ease of
operation, so much required, is not achieved.
It is true that certain types of units of limited utility are suitable,
if they fill certain needs—when it is definitely known that the needs
considered are all which will ever be required. Thus, the basic unit 1
is suitable for the modulation percentage checking of transmitters, with-
out any additional equipment. But as will be shown later in this vol-
ume, there is much more to the adjustment of a "ham” transmitter than
merely determining the percentage of modulation, so that basic unit 2,
is by far preferable.

COMMERCIAL CATHODE-RAY OSCILLOGRAPHS 95
No serviceman, after analyzing the servicing field, can say that the
only function he can see for the cathode-ray tube is its use for visual
alignment. With this thought in mind, we will embark upon the
discussion of the various types of cathode-ray oscillograph units avail-
able in this country and the structure of each. It is not the purpose of
this volume to compare the merits of each of the instruments described
herein. All that we shall do is to discuss the structure of each. De-
cision to buy one or the other must come from the prospective pur-
chaser. The only aid we can give is to describe the operating capabil-
ities of the devices presented.
It might be well at this time to call to your attention something which
you may or may not notice as you examine the wiring diagrams of the
commercial units. The examples of spot displacement, cited in an
earlier chapter, showed all four deflecting plates free and with separate
connections. This is contrary to the electrical connections actually
found in the usual run of three and five-inch tubes. As a general rule,
one plate of each set is joined to the other and connected to anode
number 2, so as to keep these two plates at ground potential. This
gives rise to a slight amount of distortion of the pattern, in the form
of a departure from a perfect square when equal amplitude voltages
are applied to the two sets of plates. However, this amount of dis-
tortion in no way interferes with the normal operation of the tube when
making tests of the type outlined in this volume.
National Union Model 3-5 Cathode-Ray Oscillograph
Various views of this unit are given in figure 54. The schematic wir-
ing diagram is given in figure 55. Referring to the mechanical struc-
ture of the device, the unit will accommodate either a 3-inch or a
5-inch tube. The major variable operating controls are located upon
the front of the panel and the switching controls, to be outlined, are
located in the rear of the metal housing. Incidentally, the construction
just mentioned is undergoing a change during this writing. Advice
has been received that the connecting terminals, now located upon the
rear, will be mounted in front with the variable controls.
Referring to the variable controls, they consist of a rough frequency
adjustment of the linear sweep circuit; a fine frequency adjustment of
the same circuit and an amplitude control, whereby the length of the
sweep beam across the screen is controlled. Also a synchronizing con-
trol, for synchronizing the sweep voltage with the frequency of the volt-
age under observation and the control which adjusts the intensity of the

96 THE CATHODE-RAY TUBE AT WORK
spot. A spot positioning control, operating along the “X” axis is mount-
ed on one side and is accessible through a hole in the housing. From in-
formation gathered at the time of this writing, the new units will also
PhotOfjraph at left courtesy National Union hadio Corp.
Fig. 54. Left, panel of the National Union oscillograph. The cross-section lines
are ruled on a transparent shield that clamps over the screen of the tube.
Middle, chassis showing the S-inch cathode-ray tube in position. Right, rear
panel to which connections are made to the deflecting plates.
possess a "Y” axis positioning control. A focusing control is also
available through the side of the metal housing. It controls the anode
number 1 voltage.
Referring to the schematic wiring diagram, the unit consists of the
cathode-ray tube, a full-wave rectifier power supply for all of the
voltages, a thyratton sweep circuit oscillator and two single stage re-
sistance-capacity coupled audio amplifiers. By means of pin plugs and
pin jacks, designated as A, D, S, D and A upon the wiring diagram, it
is possible to arrange the single stage amplifiers in such manner that
voltages to be observed and applied to the vertical and horizontal plates,
are amplified. These amplifiers are rated at a voltage step-up of 35
for each stage. It is possible, if so desired, to feed the sweep circuit
through one amplifier to the horizontal plates. It is also possible to
connect the sweep circuit directly to the horizontal deflection plates;
in which case, both amplifiers may be connected in cascade to amplify
the signal being applied to the vertical deflection plates.
By means of these pin jacks, plugs and terminals, direct connection
may be made to the horizontal and vertical deflection plates without
passing through the amplifiers or without involving the sweep circuit.
Each of the amplifiers is independent of the other, so that either one
may be used in conneaion with the horizontal or vertical deflection
voltages, without making it necessary to employ the other amplifier.

COMMERCIAL CATHODE-RAY OSCILLOGRAPHS 97
Provision is made by means of the connecting terminals to employ in-
ternal or external synchronizing pulses. According to the manufac-
turer’s rating, the amplifiers used in the unit are linear from 20 to
100,000 cycles. The range of the linear sweep circuit, according to
the manufacturer is such that frequencies up to 20,000 may be studied.
(Editor’s Note. By using the 5-inch tube, frequencies up to about
100,000 cycles have been studied, although a more reasonable limit
would be about 80,000 to 90,000 cycles.)
Fig. 55. The schematic diagram of the National Union Model 3-5 oscillo-
graph. The terminals within the dotted square and the two amplifier gain
controls are on the rear of the instrument.
Perhaps it would be well to say a few words about the sweep circuit
used in this instrument. When this sweep voltage is applied to the
horizontal deflection plates without going through the amplifier, the
position of the spot, with the amplitude control set at minimum, is to
the extreme right end of the screen. As the amplitude control is varied,
the spot moves towards the left and the sweep voltage results in a
line, which can be lengthened until it extends across the screen. The

98 THE CATHODE-RAY TUBE AT WORK
operation of this system, may prove puzzling, hence this short descrip-
tion. When the unit is placed into operation with the sweep ampli-
tude control set to minimum, the potentiometer adjustment across the
thyratron control grid bias battery is such that the tube is fully ionized
and is, in effect, short circuiting the frequency control condensers.
With the horizontal deflection connection plug in the pin-jack S, the
thyratron cathode potential is approximately that of the plate and since
the free horizontal deflection plate is joined to the cathode, this plate
is positive with respect to its associated horizontal plate and the beam
is deflected towards the free plate and away from the center of the
screen. During this state, the voltage developed across the frequency
control condensers is substantially zero. It is conceivable that a small
amount of voltage is being built up across these condensers, or that
the amplitude of the sweep voltage is a finite value, rather than zero,
but it is more convenient to think of the sweep voltage at zero, since
the spot is not moving at all and does not appear to be larger than
originally adjusted with the focusing control.
As the amplitude control is varied, a higher voltage is necessary be-
tween the thyratron plate and cathode, in order that the tube trip or
flash. This means that a finite value of voltage is being built up across
the frequency control condensers. As a result of the electrical connec-
tion of the free horizontal plate to the cathode of the thyratron and
since the cathode is connected to what is the negative side of the fre-
quency control condensers, the voltage developed across the frequency
control condensers nullifies a portion of the original potential differ-
ence existing between the two horizontal plates. Also since the free
horizontal plate now is not at the same positive potential with respect
to its associated plate, the spot moves away a certain distance from the
free plate. With this adjustment of the amplitude control, the tube trips
at a definite rate and each time that it flashes, it returns the spot to
its original starting position. As the voltage builds up across the fre-
quency control condensers, the spot again moves across the screen. This
is repeated and the result is a line part way across the screen representa-
tive of the sweep voltage.
As the amplitude control is increased, a greater value of voltage
builds up across the frequency control condensers and the spot is
moved further across the screen and away from its original position,
thus making the sweep voltage line longer. To aid in the movement
of the spot past the center of the screen, the thyratron plate receives
a positive voltage as a result of its junction on the power supply voltage

COMMERCIAL CATHODE-RAY OSCILLOGRAPHS 99
divider. The sum total result is that by means of the sweep circuit
amplitude control, it is possible, as has been stated, to increase the
sweep voltage until the line spreads across the entire screen. This
sweep circuit has its potentiometer sweep analogy in the sweep cir-
cuit shown in figure 29.
As is the case with all thyratron circuits, the linearity of the sweep
voltage is influenced by the amplitude. The lower the amplitude, the
more linear the saw-tooth wave output. More about this later. Re-
ferring to the amplifiers, both have variable gain controls. Synchroniza-
tion of the sweep voltage and the voltage waveform being observed is
accomplished by feeding a small portion of the voltage fed to the ver-
tical deflection plates into the control grid of the thyratron. A poten-
tiometer controls the magnitude of this synchronizing pulse, obtainable
internally or externally. The letters V, H and G designate the ter-
minals;for the free vertical plate as V, for the free horizontal plate as
H and the common ground as G.
In the operation of the sweep circuit, the rough frequency adjust-
ment is accomplished by varying the condensers, five being used and
selected by means of a switch. Fine frequency control is accomplished
by varying the resistot in series with the frequency control condenser
bank. As has been stated in connection with sweep circuits earlier in
this text, adjustment of the amplitude control has an effect upon the
frequency, so that when any adjustment is made upon the amplitude
control to spread the image, a supplementary adjustment will be re-
cjuired in order to stop the image, so that it is stationary upon the
screen. The fine frequency control is used for this putpose. The in-
strument does not contain a sinusoidal sweep.
Much more can be said about the synchronization control, but per-
haps it is best to wait until we discuss the practical application of these
devices, since the effect of the synchronization adjustment is general
with respect to all units which possess such a control.
Dumont 145 Cathode-Ray Oscillograph
The details given in connection with the National Union model 3-5
cathode-ray oscillograph are applicable in their entirety to the Dumontmodel 145 instrument. See Appendix for Dumont Model 148
Oscillograph.
RCA Model TMV-122-B Cathode-Ray Oscillograph
Various views of this unit are shown in figure 56. The schematic
wiring diagram is shown in figure 57. As far as components are con-

100
THE
CATHODE-RAY
TUBE
AT
WORK

COMMERCIAL CATHODE-RAY OSCILLOGRAPHS 101
cerned, the instrument consists of a type 885 grid controlled gas triode,
which is in effect a thyratron, as the saw-tooth wave-time axis oscillator,
two individual resistance-capacity coupled amplifiers, a two-tube recti-
fying system, one tube functioning as a full-wave rectifier supplying
the plate and grid voltages for the two amplifiers and the other tube
functioning as a half-wave rectifier supplying the various operating
potentials required for the 906 cathode-ray tube.
Fig, S6, At the right is the front panel view of
the RCA Model TMV-122-B oscillograph and
above is the bottom view. Fig. 22 on page 41
shows the top view of the chassis with the case
removed. All controls are on the front panel
with the exception of the two spot positioning
controls, which are on the side.
All of the continuously variable controls are mounted upon the
front of the panel. The spot positioning controls for the "X” and
"Y” axes are accessible through holes in the side of the metal housing.
Referring to the controls on the front of the panel, they are the spot
intensity control, the spot focusing control, on and off control for the
vertical deflection plate amplifier, gain control for the vertical deflection
plate amplifier, on and off control for the horizontal deflection plate
amplifier, which also controls the connection of the sweep circuit to the
horizontal deflection plate amplifier, rough frequency adjustment con-
trol, fine frequency adjustment control, gain control for the horizontal
deflection plate amplifier, switch for selecting the internal or external
synchronization pulse and synchronization control. Also the terminals
for the horizontal and vertical deflection plates and external synchroni-
zation pulse.
Referring to the schematic wiring diagram, the type 879 tube is used
as the half-wave rectifier. The type 80 tube is the full wave rectifier.
The type 885 tube is the time axis voltage oscillator. The two type 57
tubes are the individual amplifiers. A 3-inch type 906 tube is used as

102 THE CATHODE-RAY TUBE AT WORK
the cathode-ray tube. There are several significant features which must
be brought to your attention. Selection of the amplifiers is done by
means of switches. Provision is made to feed the vertical deflection
voltage through an amplifier or to the vertical plates without the am-
plifier. However, at no time is direct connection to the plates available
without entering the chassis. A 0.25-mfd. condenser is connected into
the circuit lead to the vertical plates. This condenser is in the circuit,
with or without the amplifier. The same is true of the horizontal de-
flection plate input circuit. The input systems of the two amplifiers
have a blocking condenser of 0.1 mfd. in each grid lead. The gain
control is in the grid circuit of each of the amplifier tubes.
The sweep circuit is tied in with the horizontal deflection plate ampli-
fier, so that whenever the sweep circuit is used, its output voltage is
amplified by the horizontal deflection plate amplifier. Whenever the
switch is set for internal synchronization, a portion of the signal voltage
at the plate of the vertical deflection plate amplifier is fed into the
grid circuit of the sweep oscillator. The amplitude of the synchroniza-
tion pulse is controlled by means of a 1000-ohm gain control poten-
tiometer across the input of the synchronizing pulse transformer. In-
ternal synchronization cannot be used, unless the vertical deflection
plate amplifier also is used. The external synchronization pulse may be
applied with or without the vertical deflection plate amplifier in use.
It is possible that if you try to correlate the four frequency con-
densers, shown in the schematic wiring diagram, with the eight ter-
minals used for the rough frequency control, that confusion may arise.
A variation in frequency is accomplished by automatically switching
different values of fixed resistance into each of the condenser circuits.
The rough frequency control gang switch is in two sections. The first,
third, fifth and seventh positions place the fixed condensers into the
circuit in series with the fine frequency control variable. This takes
care of four of the eight positions. The second, fourth, sixth and
eighth positions of the switch connect a fixed resistor in series with
the rough frequency control condensers, which combination in turn
is connected in series with the fine frequency control resistor. This
takes care of the remaining four tap positions. The design of the
unit is such that each position of the switch changes the frequency of
the sweep in such manner that multiples of the lowest frequency are
available, and with sufficient synchronization, the image remains locked
and all that varies is the number of cycles appearing upon the screen.
The basic equivalent of this sweep circuit is that shown in figure 34.
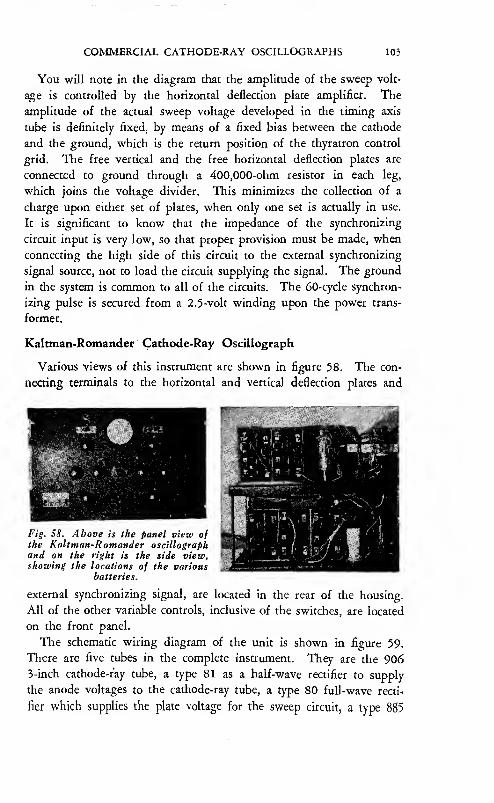
COMMERCIAL CATHODE-RAY OSCILLOGRAPHS 103
You will note in the diagram that the amplitude of the sweep volt-
age is controlled by the horizontal deflection plate amplifier. The
amplitude of the actual sweep voltage developed in the timing axis
tube is definitely fixed, by means of a fixed bias between the cathode
and the ground, which is the return position of the thyratron control
grid. The free vertical and the free horizontal deflection plates are
connected to ground through a 400,000-ohm resistor in each leg,
which joins the voltage divider. This minimizes the collection of a
charge upon either set of plates, when only one set is actually in use.
It is significant to know that the impedance of the synchronizing
circuit input is very low, so that proper provision must be made, when
connecting the high side of this circuit to the external synchronizing
signal source, not to load the circuit supplying the signal. The ground
in the system is common to all of the circuits. The 60-cycle synchron-
izing pulse is secured from a 2. 5 -volt winding upon the power trans-
former.
Kaltman-Romander Cathode-Ray Oscillograph
Various views of this instrument are shown in figure 58. The con-
necting terminals to the horizontal and vertical deflection plates and
Fig. 58. Above is the panel view ofthe Kaltman-Romander oscillographand on the right is the side view,showing the locations of the various
batteries.
external synchronizing signal, are located in the rear of the housing.
All of the other variable controls, inclusive of the switches, are located
on the front panel.
The schematic wiring diagram of the unit is shown in figure 59.
There are five tubes in the complete instrument. They are the 9063-inch cathode-fay tube, a type 81 as a half-wave rectifier to supply
the anode voltages to the cathode-ray tube, a type 80 full-wave recti-
fier which supplies the plate voltage for the sweep circuit, a type 885

104 THE CATHODE-RAY TUBE AT WORK
thyratron and a type 34 pentode, used as the constant current tube in
the sweep circuit. The knobs upon the panel control the rough ad-
justment of the linear sweep frequency, the fine adjustment of the
sweep frequency, the amplitude of the linear sweep, the degree of
synchronization, the intensity of the signal voltage applied to the
horizontal defleaion plates, the intensity of the signal applied to the
vertical deflection plates, the spot intensity, spot focus, selection of
Fig. S9, The schematic diagram of the Kaltman-Romander oscillograph.
internal or external synchronization, direct connection to the vertical
defleaion plates, connection to the vertical deflection plates through a
series condenser, exclusion of the vertical deflection plate potentiometer,
internal or external sweep voltage to the horizontal deflection plates
and on-off switch. This unit does not incorporate amplifiers for the
horizontal or vertical deflection plates.
The screen and control grid voltages for the constant current control
tube in the sweep circuit are secured from batteries. Battery form of
supply is used for the filament current of this tube. A battery form
of supply is used for the control grid of the 885 thyratron. The
synchronization control potentiometer is located in the secondary circuit
of the input transformer, but the impedance of this input circuit is still
comparatively low, about 1,000 ohms.

COMMERCIAL CATHODE-RAY OSCILLOGRAPHS 105
The design of the sweep circuit used in this unit is substantially
the same as that illustrated in figure 38. There is no means of posi-
tioning the spot along the "X” or "Y” axis.
National Cathode-Ray Oscillograph
This is what may be classed as being a “basic” unit. Several views
are shown in figure 60. The schematic is given in figure 6l. Con-
Fig. 60. Above is shown the interior of the
National oscillograph and on the right is the
panel view with the 3-inch screen of the cathode-ray tube.
Fig. 61. Below is the schematic diagram of theNational oscillograph. No sweep is provided ex-cept the 60-cycle sinusoidal voltage from thepower transformer. Other types of sweeps must
be externally supplied.
Diagram courtesy National Co.
side. The spot intensity and spot focusing controls are mounted upon
the front panel; also the power supply switch. The horizontal and
vertical deflection plate connection posts are mounted on the side;
also the potentiometer controlling the amplitude of the voltage sup-
plied to the horizontal plates. The unit is equipped with a 60-cycle

Fig. 62. Above is the schematic diagram of the Clough Brengle Model CRAoscillograph. The tube complement is as follows: Type 906 cathode-ray tube
with 3-inch screen; SI rectifier for the anode of the cathode-ray tube andvarious control voltages; SO rectifier for supplying the amplifier voltages;
SSS tube as the timing axis voltage oscillator; type 2AS as the timing axis
voltage amplifier and a type 57 for amplifying the voltage fed to the vertical
deflecting plates.

COMMERCIAL CATHODE-RAY OSCILLOGRAPHS 107
sinusoidal sweep, which can be placed into or taken out of the circuit
by means of a switch located on the side of the housing. This same
switch makes provision for the connection of an external sweep to
the horizontal deflection plates. The sinusoidal sweep voltage is se-
cured from a winding upon the power transformer, hence the fre-
quency of the voltage supplied by this winding is that of the power
supply voltage. Two tubes are used in this instrument, namely the
906 3-inch type cathode-ray tube and an 81 half-wave rectifier, sup-
plying the anode and control voltages for the cathode-ray tube. This
unit is not equipped with a linear time axis oscillator. Direct con-
nection to the horizontal and vertical plates is available through the
terminal posts. There is no means of positioning the spot along
either the "X” or "Y” axis.
Clough Brengle CRA Cathode-Ray Oscillograph
The schematic wiring diagram of this unit is shown in figure 62.
Six tubes are used. These are the 906 3-inch cathode-ray tube, an 81
as a half-wave rectifier for the cathode-ray tube anode and control volt-
ages, an 80 as a full-wave rectifier supplying the amplifier voltages, an
885 tube as the timing axis voltage oscillator, a 2A5 as the timing axis
voltage amplifier and a 57 as the amplifier for the signal voltage fed
to the vertical deflection plates. Variable controls are available for
the spot intensity, spot focus, spot positioning along the "X” and "Y”
axis, including or excluding the vertical deflection amplifier, gain con-
trol for the vertical deflection, gain control for the horizontal deflection,
rough linear sweep frequency adjustment, fine linear sweep frequency
adjustment, synchronization pulse amplitude, and choice of internal,
external or 60-cycle synchronization pulse. Synchronization between the
sweep and the voltage applied to the vertical deflection plates is avail-
able, with or without the vertical deflection amplifier in the circuit. Theamplifier, which is used to amplify the linear sweep voltage, is not
available for separate use in connection with application of a voltage,
other than the sweep, to the horizontal deflection plates.
The timing axis oscillator is of the type shown in figure 34, with
the addition of an amplifier. The actual amplitude of the sweep volt-
age, developed by the timing axis oscillator, is fixed, as the result of a
fixed bias. The variation in sweep voltage amplitude is achieved by
varying the intensity of the amplified sweep voltage. The amplitude
of the synchronizing pulse is governed by a potentiometer across the
secondary of the input transformer, The primary winding of this trans-

108 THE CATHODE-RAY TUBE AT WORK
former is not grounded. However, the impedance of this input cir-
cuit is comparatively low, so that care must be taken when connecting
this circuit to an external source of synchronizing pulse. Photographic
views of the unit are shown in figure 65 .
Fig. 63. On the left is the panel view
of the Clough Brengle oscillograph.
Provision is made for using either a
3-inch or S-inch cathode-ray tube.
Above is the top view of the chassis.
Photo at left courtesy Clough Brengle Co.
According to the manufacturer’s rating, the linear sweep circuit
has a frequency range of from about 20 to 15,000 cycles as fundamental
frequencies. As such, with about 6 cycles on the screen, observation
of frequencies up to about 90,000 cycles is possible.
Other Cathode-Ray Oscillographs
There are available a number of other cathode-ray oscillograph units,
produced by manufacturers not mentioned. The exact nature of these
units is not known, but from available information, we can hazard the
statement that they do not depart from what constitutes the features
of the instruments described thus far. There may be slight variations,
but as a general rule, recognizing existing requirements, most of the
devices within a certain price class, are very similar in imit design,
components and capabilities. One of the prominent manufacturers of
oscillographs, intended for laboratory and industrial work, but whose
units are not described herein because the data was not available, is
General Radio Co. The absence of schematic and other data is due
primarily to the fact that it was not supplied. The other schematics
shown were supplied with the equipment which was purchased for use
in connection with the preparation of this volume in the Successful
Servicing Laboratory, owned by the publishers of this volume.

COMMERCIAL CATHODE-RAY OSCILLOGRAPHS 109
It is necessary at this time to call your attention to the fact that we
consider alignment operations as just another practical application of
the cathode-ray oscillograph, hence we will describe the cathode-ray
instruments, intended solely for alignment or the development of
response curves, when we discuss the development of response curves.
Furthermore, since any one of the cathode-ray oscillographs described
thus far can be used for the development of a response curve by the
addition of other equipment, we shall show and discuss those units,
when we apply the cathode-ray oscillograph to alignment operations.

CHAPTER V
PRACTICAL APPLICATION OF THE CATHODE-RAY OSCILLOGRAPH
Practical applications of the cathode-ray oscillograph, there are
plenty. To present a list of its practical uses and to enumerate again
these units in connection with the actual work, would be just so much
duplication. Accordingly, we shall omit the usual list and consider
each application in turn.
When talking about certain operating characteristics of cathode-ray
oscillographs, we must take for granted that you who read these pages
possess the type of equipment which is covered by this text. Of course,
it is possible that the unit you own or operate may not be as versatile as
that which we discuss. In that event a portion of what is said in these
pages will apply to your equipment and you will be familiar with what
other effects are experienced or introduced as a result of the manipu-
lation of the controls existing in more elaborate equipment. However,
there are certain subjects which can be discussed with total freedom,
since they encompass operating features common to all types of cathode-
ray oscillographs.
In as much as the general operation of the instruments is generally
useful information, we shall start the discussion of practical applica-
tions by describing those points which come under the general opera-
tion category.
Spot Position
Spot positioning is a very important operation. While it is true
that tubes should be manufactured in such manner that the normal
position of the spot is in the center of the screen, certain slight dis-
crepancies may arise, which will cause the spot to be off-center. This
may be experienced when cathode-ray tubes are changed, or as a result
of aging of the spot positioning resistors, or perhaps imperfect ad-
justment during some test. Unless the tube is so designed, that the
normal position of the spot is off center (which is not the case in units
now being sold), the first adjustment is the correct positioning of the
110

PRACTICAL APPLICATION OF CATHODE-RAY OSCILLOGRAPH 111
spot. If the unit on hand does not include spot positioning controls,
then some other means, to be mentioned later, must be used. In the
meantime, we shall assume that spot positioning controls are available.
The spot can be moved in two directions, vertically and horizontally
across the tube. Figure 64 illustrates nine positions of the spot upon
the cathode-ray screen. You will note a slight halo around the spot.
This indicates an incorrect adjustment, as will be described later.
However we deliberately made the spot larger than normal and ex-
posed the film for a long time in order to bring out the full limits
of the tube screen. Consider these illustrations from the angle of spot
position only and not from the size of focus of the spot. These position
adjustments were obtained by varying the vertical and horizontal spot
position controls. Of these nine, only one is the correct position, and
that is figure A. All the other pictures indicate location of the spots
in incorrect positions.
Location of the spot in the correct position is important, because
it influences the placement of the image upon the screen. The screen
is not a perfectly flat surface and with the spot off-center, examination
of a waveform, which may not have equal amplitudes for its positive
and negative alternations, may place one portion of the image off the
screen. Then again, spot positioning is also important, in order to
permit the viewing of just such an image which does not have equal
amplitudes both sides of the zero line. Whereas under one condition,
the spot must be in the center of the screen, in the other, it may be
necessary to move the spot above or below the center along the "Y”
axis.
Often, when viewing resonance curves, when a comparison of ampli-
tude is being made, the spot may move off the screen at the peak point.
To bring the image within the screen limits the spot would be moved
down from the center, along the "Y” axis. For an inverted resonance
curve, with the conditions cited, the spot would be moved up from the
exact center, along the "Y” axis. However, normal operation requires
exact centering. After each change, for certain types of test, the spot
should be moved back to its original position.
Whatever the type of cathode-ray instrument, the horizontal and
vertical plates must be connected to ground, when adjusting the spot
position. This ground can be effected by connecting a 500,000-ohm
resistor between the free vertical deflecting plate and ground and a
similar resistor between the free horizontal plate and ground. In-
struments, which are equipped with gain control in both deflecting

112 THE CATHODE-RAY TUBE AT WORK
Fig. 64, A shows the correct position of the spot at the screen’s center.
B, C, D and E show the spot above, below, to the right and to the left of the
center respectively. The spot in E happened to coincide with the reflection
of the light on the external surface of the tube. F, G, H and I show the spot
in the different quadrants. It should be noted that the size of the spot wasmade very large intentionally and it was too intense, as is evidenced by the
halo surrounding it.
PRACTICAL APPLICATION OF CATHODE-RAY OSCILLOGRAPH 113
plate circuits, automatically are connected to ground. However,
units which are arranged in such manner that direct connection is pos-
sible to the plates of the cathode-ray tube, require such ground-
ing resistors. If the plates are allowed to float, they will collect elec-
trical charges, which will interfere with correct positioning of the spot.
Referring to figure 64, A is the correct position. In B, the spot
has been moved up along the "Y” axis. In C, the spot has been moved
down along the "Y” axis. In D, the spot has been moved to the right
along the ”X” axis. In E, the spot has been moved to the left along
the "X” axis. In F, the spot has been moved into the first quadrant,
to the right of the vertical reference line and above the horizontal
reference line. In G the spot is in the second quadrant, to the left
of the vertical reference line and above the horizontal reference line.
In H, the spot is in the third quadrant, below the horizontal reference
line and to the left of the vertical reference line. In I, the spot has
been moved to the fourth quadrant, to the right of the vertical refer-
ence line and below the horizontal reference line.
There are several ways of positioning the spot when the normal
voltage divider adjustments are not available. The old suggestion to
position the spot by means of an external magnet, placed near the
deflecting plates on the outside of the tube is not satisfactory, because
it distorts the image formed when the spot is made to move. For
that matter, such a condition must be guarded against. Time and
again, an external field may cause the spot to be out of position. To
insure against such action, the metal case housing the cathode-ray unit,
must be grounded. If the tube is used without a metal housing or
shield, it should be kept away from all steel or from units which de-
velop strong, magnetic fields, unless, of course, a test is being made,
which requires that a strong magnetic field act upon the spot.
A fairly satisfactory method of centering the spot, when the proper
controls are not available, is to sweep a horseshoe magnet back and
forth across the tube, near the plates. By properly orienting the mag-
net with respect to the plate and noting the movement of the spot,
correct placement will be achieved. The magnet need not be closer
than perhaps six inches from the tube. The average horseshoe magnet
about 3 inches long is big and powerful enough. It may be necessary
to place the magnet closer to the tube. Experience will indicate the
correct distance. As a general rule, the amount of correction required
is not very great, for a fairly high degree of uniformity exists between
tubes. The magnet should be moved past the tube, parallel with the

114 THE CATHODE-RAY TUBE AT WORK
neck of the tube and then the change in spot position noted.
Take care that such a remedy is applied, only when it is needed.
Make certain that the off-center position of the spot is not due to cir-
cuit adjustment, as, for example, in the National Union instrument,
the normal position of the spot, when the sweep is in operation and
adjusted to minimum amplitude, is at the extreme right hand side of
the viewing screen.
The use of a biasing battery in the vertical or horizontal defleaion
plate circuit is quite in order. The battery is connected into the free
deflection plate lead. However, this battery can be utilized only if
direct conneaion to the plates is possible. If a blocking condenser is
used in the circuit, the battery biasing arrangement cannot be employed.
The amount of voltage required for the battery is dependent upon the
amoimt of spot position shift desired. The battery voltage may be
controlled with a potentiometer. The complete biasing voltage source
in series with a 3.0 or 5.0 megohm resistor may be connected between
the free deflecting plate and the ground plate. The signal voltage to
be observed or applied across the same set of plates, then is applied
to the cathode-ray tube in normal fashion. The high resistance in
series with the battery serves to maintain the input impedance of the
biased set of plates at a reasonably high value. The circuit which sup-
plies the signal voltage to be observed is connected across the free plate
and the grounded plate. This signal feed circuit may incorporate the
blocking condenser if desired. Since most of the commercial units
incorporate blocking condensers, it will be necessary to make proper
contact inside the unit, in order to apply the biasing voltage.
Spot Focusing
We have made reference to the fact that the spot intensity or bril-
liancy and focus influenced the detail of the image appearing upon the
screen. Once the spot has been properly centered, which operation
need be carried out but once for each tube, the next item is the focus-
ing and brilliancy adjustment. As a general rule, for any one focus
adjustment arrived at in conjunction with the brilliancy adjustment,
it is necessary to operate but one control, to maintain the same detail
of image. This is true for certain periods of time. Naturally, as the
tube ages, the emission characteristic varies and the rectifier tube emis-
sion varies, so that both brilliancy or intensity and focus controls must
be readjusted.
Figure 65 shows three photographs of spot images. A is the cor-

PRACTICAL APPLICATION OF CATHODE-RAY OSCILLOGRAPH 115
rect spot size, attained by proper adjustment of the intensity and focus
controls. Note that the spot is uniformly round, without any jagged
edges. B shows a spot which is out of focus. Note that the spot is
somewhat elliptical and has a slight fringe. C shows a spot which
1
Fig. 65’A. Left. The proper size of the spot. Note that it is round and has
smooth edges. Fig. 66-A. Right. The line resulting when a voltage is
impressed on the horizontal deflecting plates. Note that it is uniform in
thickness.
Fig. 65-B. The spot is here out of focus, evidenced by its elliptical shape.Fig. 66-B shows the resulting line when this spot is spread across the screen.
Note its non-uniformity of thickness.
is too intense. You can see the halo around the spot. The effect that
the intensity and focusing adjustment has upon the image is shown in
figure 66. A voltage was applied to the horizontal deflection plates,

116 THE CATHODE-RAY TUBE AT WORK
for each of the conditions shown in figure 65. A is the line developed
when the spot is correctly focused and of proper intensity. As a mat-
ter of fact, it is necessary to readjust slightly the intensity control when
the spot is spread into a line or image, to maintain the intensity of
Fig. 6S-C. Here the intensity control was too far advanced, this being
evidenced by the halo around the spot. Fig. 66-C. The spot of Fig. 6S-C showsa trace that is broad at one end and narrow at the other.
the spot. This is so because the spot is in motion. Note that the in-
tensity of the line is uniform, its width is even throughout its length
and that the width is equal to the diameter of the spot. Aaually,
correct intensity and focusing produces a spot which is about 1/64 or
perhaps 1/32 inch in diameter.
The out of focus adjustment, shown in figure 65 -B, develops a line
which is wider at one end than at the other. Improper intensity and
focusing adjustments may switch the wide portion from the right side
to the left side, but one side will always be wider than the other. Ex-
cessive intensity is indicated in figure 66-C. Note the ragged edges
and the excessive width of the line. Such a spot adjustment would
kill all detail in a pattern.
As far as intensity adjustment is concerned for any one correct focus
adjustment, let it be known that the minimum brilliancy consistent
with ease of examination of the image, is the best adjustment. Of
course, if the image is to be photographed, as we have done, then far
more brilliancy is required. Nothing is gained, when viewing the
image with the eye, by making the image very brilliant. As a matter
of fact, a stationary image of excessive brightness is apt to damage the
screen of the tube, if the image is allowed to stay on the screen for

PRACTICAL APPLICATION OF CATHODE-RAY OSCILLOGRAPH 117
too long a time. A single brilliant spot should not be allowed to stay
on the screen for too long a time. It will burn the screen and that
part of the screen will thereafter not fluoresce as brilliantly as the bal-
ance of the screen.
Sweep Circuit Control
The oscillograph is valuable because it enables observation of various
alternating phenomena. One of the reasons why such observation
is possible is that the device provides a time base. In the majority
of cathode-ray tube instruments, the greater majority at that, this time
base is of a variable frequency. In a few isolated cases, the time base
is the 60-cycle supply. Since this type of time base, and we are speak-
ing about what is known as the 60-cycle sweep, is of very little, if any
value, we do not deem it worthwhile to devote space to it as a sweep
circuit. Instead it shall be considered as just a sinusoidal wave applied
to the horizontal plates in connection with the development of Lis-
sajous’ figures. ... Do not confuse this reference to a 60-cycle sine
wave sweep with a 60-cycle synchronizing pulse, which will be dis-
cussed in a subsequent paragraph. The two are very definitely differ-
ent, although the original signal is secured from the same place. In
the immediate paragraphs to follow, we shall dwell upon what has
been presented as being the linear sweep or timing axis.
There are numerous pertinent facts relating to the operation of a
sweep circuit which you should know and understand. The frequency
relation between the sweep circuit voltage and the voltage being ob-
served or to be observed, has very much to do with the ease of making
such observations. If it is necessary to make photographic records of
the pattern upon the screen, even greater stress must be placed upon
proper application of the sweep system. As we stated in a preceding
paragraph, the amplitude of the sweep voltage has a bearing upon the
shape of the image and it is necessary for the person, who is using the
equipment, to understand the nature of the circuit employed in the
instrument, so that he can employ the device to greatest advantage and
with greatest accuracy.
Subsequent paragraphs will be devoted to what can be generally
called “the ways and means of developing waveform images upon the
screen.” However, we hasten to say that this discussion will not in-
clude what is really the interpretation of waveforms. That will fol-
low later. Before walking, we crawl. So it is with the operation of
the oscillograph, for if the proper means are not employed when

118 THE CATHODE-RAY TUBE AT WORK
establishing the wave upon the screen, the imperfect shape of the wave,
due perhaps to improper handling of the instrument, may result in
false conclusions. You may find it necessary, as we progress through
this discussion, to refer back to some of the earlier diagrams showing
the development of waves of various types by means of spot position.
As has been stated earlier in this chapter, linear sweep circuits, used
in modern cathode-ray oscillographs, are of the variable frequency type.
As a result of the controls available upon the panel, it is possible to
select any one frequency within the range of the device and to produce
a sweep voltage, or timing axis voltage, of the pre-determined fre-
quency. In as much as these sweep circuits are only partly calibrated,
a rough and fine frequency adjustment is available. The band selection
is made by means of the rough adjustment and the final adjustment to
the required frequency is made by means of the fine control, which, as
has been shown, is a resistance of one type of another, which controls
the rate of charge in one type of sweep circuit and the rate of dis-
charge in another type of sweep circuit. The process of distinguishing
whether the charge or discharge portion of the cycle is being used for
the sweep, is nothing more than an examination of the circuit being
used. As a matter of fact, knowledge of this type is not essential to
the proper application of the instrument.
The Sweep Frequency
The frequency selected for the sweep circuit usually is a sub-multiple
of the frequency of the voltage wave to be observed. In other words,
the frequency of sweep circuit is less than the frequency of the voltage
wave to be examined. The result is that several cycles of the wave to
be observed are developed on the screen. Of course, it is not im-
perative that several cycles be developed upon the screen. One cycle
would do, but since better judgment of the true shape of the wave
under examination is possible when several cycles, say two or three or
three or four, are upon the screen, the sweep frequency is varied until
this number of cycles appear upon the screen. Irrespective of what the
frequency of the wave to be observed, providing that it is within the
limits of the cathode-ray oscillograph, which means about 100,000
cycles with today’s equipment, the number of cycles which appear upon
the screen vary directly in proportion with the integral ratio between
the frequency of the wave being observed and the sweep frequency.
If the wave being observed is at 5000 cycles and the sweep fre-

PRACTICAL APPLICATION OF CATHODE-RAY OSCILLOGRAPH 119
quency is 1000 cycles, five cycles will appear upon the screen. If the
sweep frequency is 2500 cycles, two cycles appear upon the screen. If
the sweep frequency is 500 cycles, ten cycles will appear upon the
screen. If the sweep frequency is 5000 cycles, one cycle will appear
upon the screen.
Now, it is important to understand that some form of pattern will
exist upon the screen for all ratios between the sweep frequency and
the frequency of the wave to be examined. However, the nature of
these patterns is too complicated to be of any value and, as a general
rule, the patterns are moving. To establish the waveshape of the
voltage applied to the vertical deflection plates, it is necessary that the
pattern appearing upon the screen be the simplest showing the wave
shape. Such a pattern is established when the relation between the
sweep frequency and the frequency of the voltage under observation,
is a simple integral ratio and not a fractional ratio. Whenthis simple ratio exists, such as 2-1, 3-1, 4-1, 5-1, etc. and the lower
frequency is that of the sweep circuit, the maze of lines moving across
the screen will develop into a simple waveform. Whether or not this
wave will be sine or distorted, depends upon a number of factors,
which need not be discussed at this time. At any rate, the pattern
desired is that which has a single line waveform of one or more cycles.
The greater the ratio between the sweep frequency and the frequency
of the voltage under observation, the greater the number of lines which
appear in the pattern, during the time that a fractional ratio exists
between the two frequencies. However, as the sweep frequency is
changed and approaches that value which provides the simple integral
ratio, the number of lines in the pattern becomes less and less, until a
single line waveform pattern appears. This adjustment is reached by
manipulating the fine frequency control.
The Synchronizing Control
Before showing you examples of various patterns, we want to re-
mind you of the synchronizing control, which is also available on the
majority of cathode-ray oscillographs. This part of the instrument is
the means whereby the image upon the screen is kept stationary for
observation. What is accomplished, as a result of the synchronization
adjustment, is that the sweep frequency is "locked in step" with the
frequency of the signal being observed. This is done by feeding a
small portion of the voltage to be observed, which has been applied
to the vertical plates, to the input circuit of the timing axis or sweep
voltage oscillator tube. These pulses will maintain the freauency of

120 THB CATHODE-RAY TUBE AT WORK
the sweep oscillator at the setting made to develop the proper image.
As Stated before, one of the properties of a relaxation oscillator, such
as is used to produce the timing axis, is to keep step with a frequency
which is applied to the input circuit of the oscillator. The sweep
oscillator will keep step with this synchronizing pulse, be the pulse a
sub-multiple or a multiple of the frequency of the sweep oscillator.
This locks the image and it stands stationary upon the screen.
Hence, after the preliminary adjustment of the sweep frequency to
produce the required pattern, the synchronizing control is manipulated
so as to keep the image stationary upon the screen. For operation of
the type being described, the synchronizing selector switch would be
set to the "internal” position. Just what is meant by this internal
position can be gleaned by examination of the RCA, National Union
or Clough-Brengle oscillograph circuits. In the first unit you will
find that a portion of the signal voltage, developed across the vertical
deflection plate amplifier, is fed to the synchronizing circuit of the
sweep oscillator. In the case of the other two units, you will find that
a portion of the signal voltage fed to the free vertical deflection plate
is also fed to the synchronizing circuit of the sweep oscillator. At times,
a slight readjustment of the fine frequency control is required after the
synchronizing control is manipulated. This is so because of the change
in frequency of oscillations created in the sweep circuit, as a result of
the application of the synchronizing pulse. The greater the amount of
synchronization voltage, as determined by the setting of the control,
which usually is a potentiometer, the greater the effect upon the fre-
quency of the sweep circuit. At times, as shall be shown, the degree of
synchronization also influences the shape of the pattern.
It is necessary that you understand the operation of the synchroniz-
ing adjustment, otherwise you will find it extremely difficult to pro-
duce a stationary pattern upon the screen. The frequency adjustment
of the sweep circuit, when correct, will stop the image, but the image
will not stand stationary, because of slight drift in the source of the
voltage being observed and in the relaxation oscillator. But when the
sweep has been synchronized with the voltage under observation, the
pattern will remain stationary despite slight changes in frequency of
the voltage being observed, because these changes in frequency, being
transmitted to the relaxation oscillator tube, also tend to change slightly
the relaxation oscillation, and thus keep the sweep circuit in step with
the frequency being observed.
Let us now assume the application of a 700-cycle sine wave voltage

PRACTICAL APPLICATION OF CATHODE-RAY OSCILLOGRAPH 121
to the vertical plates. This figure is mentioned because it happened
to be the frequency used to make the photographs which follow. With
the synchronization control advanced somewhat beyond its minimum
setting and the rough adjustment of the linear sweep frequency set to
around 700 and then followed by the manipulation of the fine adjust-
ment until a single line pattern appears, we develop an image such as
Fig. 67. The sine-wave voltage impressed on the vertical plates and thesweep voltage are both 700 cycles, resulting in the appearance of a single
cycle on the screen. In A and B, the sweep amplitude is insufficient to givea true image; whereas in C the wave is spread out enough to present a
substantially undistorted image.
in figure 67-A. This is a single cycle of the 700-cycle voltage applied
to the vertical plates. The sweep and signal frequencies are the same.
Obviously, it is not the most perfect looking wave. The image stands
still. There are several reasons why a perfectly symmetrical wave is
not upon the screen. One of these is the amplitude of the sweep. The
second is that the sweep is not absolutely linear and tends to distort
a single cycle. Also there exists too much synchronization; that is,
the synchronization control is advanced too far. Also there is imperfect
phase relation between sweep and signal. With this single cycle upon
the screen, we can experiment with the action of the sweep amplitude
We increase the sweep amplitude control. In the unit we were using,
the sweep amplitude control was the horizontal deflection plate ampli-
fier. The actual sweep voltage developed by the thyratron was fixed
in amplitude. The amplitude variation was accomplished by the am-
plifier gain control. The amplitude is increased and the image shown
in figure 67-A now looks like 67-B. The fact that the remrn trace is
not in the middle of the pattern is due to the phase relation between the
sweep and signal voltages. The phase can be altered by slowly adjust-
ing the fine frequency control.
We now reduce the frequency of the sweep circuit and after a number
of complex images appear, we develop three cycles upon the screen.

122 THE CATHODE-RAY TUBE AT WORK
The sweep amplitude adjustment is the same as it was for figure 67-C.
The three cycles are shown in figure 68-A. It now is possible to judge
the character of the wave. We reduce the amplitude of the sweep
voltage by varying the amplifier control. The vertical deflection plate
amplifier has not been changed, as is shown by the uniform vertical
amplitude. The new image appears as in figure 68-B. If you compare
figures 68-A and 68-B, you will note that the rounded tops of the sine
waves appear more pointed in figure 68-B. The reason for that is the
reduced sweep amplitude. It is possible to judge the character of tlic
wave by examining figure 68-B, but not so well as in figure 68-A.
Obviously, a certain sweep amplitude is required for the development
of an image which is suitable for inspection.
Fig. 6S. The sweep amplitude of A is the same as that in Fig. 67-C, but the
sweep frequency has been reduced so that three cycles appear on the screen.
When the amplitude of the sweep is reduced, as in B, the peaks of the wavesbecome sharp and make it difficult to get a true idea of the wave’s 'shape.
In C the sweep frequency has been further reduced with the result that the
peaks are more pointed than in B.
We reduce the sweep frequency still further and we now have 8
cycles upon the screen, as in figure 68-C. The character of the wave
can be judged by examining this image, but not so well as in figure
68-A, hence we come to the conclusion that between three and four
cycles upon the screen is most satisfactory for wave form examination.
What information can we glean from the images shown in figures
67-A to C and 68-A to C.^ First, that the greater the number of cycles
upon the screen, the more crowded the image ; that is, the closer is one
cycle to the other and the more difficult is it to examine the character
of the wave. A rounded peak looks like a sharp peak, when the cycles
are crowded. Second, that it is difficult to judge a wave by looking at
one cycle, so that more than one cycle should be placed upon the screen.
Third, that irrespective of the number of cycles shown upon the screen,
the width of the image is determined by the sweep amplitude. Fourth,
that by varying the sweep frequency, we can vary the number of cycles

PRACTICAL APPLICATION OF CATHODE-RAY OSCILLOGRAPH 123
upon the screen. We hasten to add, that the character of the sweep
circuit which produced these waveforms is fairly linear. The effect of
non-linearity, as a result of increased amplitude will be shown later.
Suppose that the synchronization control is not properly adjusted.
There are two conditions of incorrect adjustment: insufficient synchroni-
zation, in which case the image will not be stationary, and over syn-
chronization, which will distort the pattern somewhat and also change
the frequency of the sweep. Neither one of these adjustments is cor-
rect. Insufficient synchronization is due to insufficient voltage fed into
the sweep circuit oscillator. Over-synchronization is caused by excessive
voltage fed into the sweep circuit oscillator. Both are, as a rule, due to
incorrect adjustment of the synchronization potentiometer. It is also
necessary that you realize that the synchronization voltage adjustment
is influenced by the sweep amplitude adjustment, when using a sweep
circuit, which has as its amplitude control a unit which actually in-
creases the amplitude of the sweep voltage out of the relaxation oscilla-
tor tube. As this voltage is increased, it may be necessary to advance
the synchronization control, thereby the synchronization voltage, in
order to keep the image "locked.”
Fig. 69, left. Fig. 70, right. Two examples of patterns that are under-synchron-ized. The fine lines in Fig. 69 can be seen to follow the usual outline of a
sine wave. This can be readily seen in Fig. 70.
As a general rule, the greatest variation in the image takes place
when the image is under-synchronized. Then the pattern drifts. Ofcourse, this is a matter of design of the instrument. An example of a
complex image which is under-synchronized and which has become
steady after synchronization, is shown in figures 69 and 70. Two more
examples are given in figures 71 and 72. The images in figures 70

124 THE CATHODE-RAY TUBE AT WORK
and 72 are still not perfectly synchronized. Correct synchronization
adjustment comes with experience, because it is a variable and is often-
times closely allied with other controls in the unit. Not that this latter
condition is desired, but it is an actual condition in practice.
Fig. 71, left. Fig. 72, right. The pattern shown in Fig. 72 resulted from adjust-
ing the synchronization control a trifle after the pattern in Fig. 71 wasphotographed. The pattern in Fig. 72 is still under-synchronized.
Referring once more to images appearing upon the screen as a result
of the relation between the sweep frequency and the frequency of the
voltage to be examined, we have considered sweep frequencies lower
than the frequency of the voltage applied to the vertical deflection
plates. Suppose that we consider the reverse, where the sweep fre-
quency is higher than the signal frequency. The patterns resulting
from such conditions are seldom experienced in practice, because they
have no real value. However, since the image may appear, you might
just as well be familiar with its appearance.
The image which appears when the sweep frequency is twice the
27 for graphic example.) Under ideal
Fig. 73. The image resulting when the
sweep frequency is twice the frequency ofthe wave being observed. Compare Fig. 27.
Such a pattern is difficult to stop on the
screen, as the points are moving on the
fastest portion of the cycle. The top andbottom halves of the wave should coincide.
conditions, which are quite difficult to attain, because it is necessary to
get two points, moving at the most rapid rate during a cycle, to coincide,
the image which appears upon the screen is shown in figure 73. The
two half cycles should coincide. The open gap between the two ends
resulted from imperfect timing of the photograph, although quite some
time was spent trying to secure a perfect pattern. The most commontype of pattern which appears when the sweep frequency is two times
that of the voltage being observed is that shown in figure 74. This
;ignal frequency. (See figun
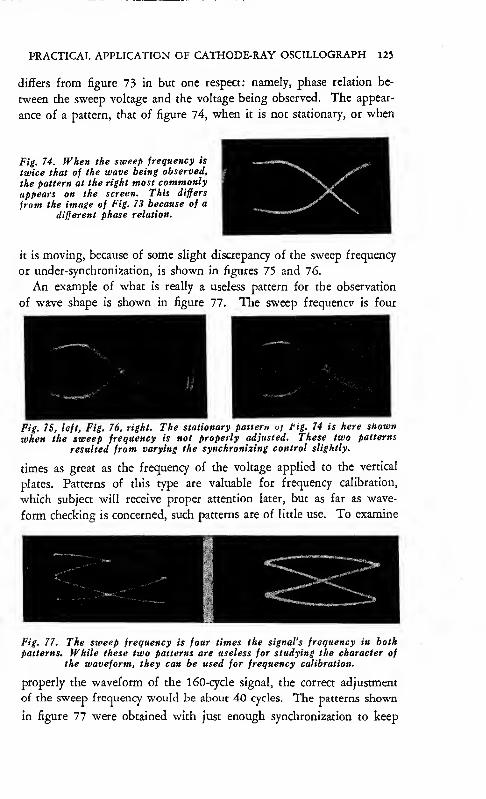
PRACTICAL APPLICATION OF CATHODE-RAY OSCILLOGRAPH 125
differs from figure 73 in but one respect: namely, phase relation be-
tween the sweep voltage and the voltage being observed. The appear-
ance of a pattern, that of figure 74, when it is not stationary, or when
Fig. 74. When the sweep frequency is
twice that of the wave being observed,
the pattern at the right most commonlyappears on the screen. This differs
from the image of Fig. 73 because of a
different phase relation.
it is moving, because of some slight discrepancy of the sweep frequency
or under-synchronization, is shown in figures 75 and 76.
An example of what is really a useless pattern for the observation
of wave shape is shown in figure 77. The sweep frequencv is four
Fig. 75, left. Fig. 76, right. The stationary pattern uj big. 74 is here shown
when the sweep frequency is not properly adjusted. These two patterns
resulted from varying the synchronizing control slightly.
times as great as the frequency of the voltage applied to the vertical
plates. Patterns of this type are valuable for frequency calibration,
which subject will receive proper attention later, but as far as wave-
form checking is concerned, such patterns are of little use. To examine
Fig. 77. The sweep frequency is four times the signal’s frequency in bothpatterns. While these two patterns are useless for studying the character of
the waveform, they can be used for frequency calibration.
properly the waveform of the l60-cycle signal, the correct adjustment
of the sweep frequency would be about 40 cycles. The patterns shown
in figure 77 were obtained with just enough synchronization to keep

126 THE CATHODE-RAY TUBE AT WORK
them stationary long enough to photograph. For visual observation of
waveform the image can be moving slowly, so that even less synchroni-
zation can be used. An idea of what happens when too much synchro-
nization voltage is applied to the patterns of figure 77 is shown in
figure 78. Note how the sides have been pulled in.
Fig. 78. By applying too much syn-chronization to the pattern of Fig, 77,
the image at the left was obtained.Note that the pattern is no longer
symmetrical,
A better idea of what happens when the synchronizing voltage is too
great is shown in figures 79 and 80. Figure 79 shows a single cycle
stopped by applying the synchronizing voltage. The application of
the maximum synchronizing voltage available changed the pattern to
that shown in figure 80, an excellent case of distortion.
Fig. 79, left. Fig. SO, right. The proper amount of synchronizing voltage wasapplied to get the single cycle of Fig. 79. When the maximum amount of
synchronizing voltage was applied, the distorted figure of Fig. SO resulted.
The various illustrations offered in connection with the development
of a wave upon the screen employed a sine-wave voltage applied to the
vertical plates. This voltage may be distorted without changing mat-
ters in the slightest. This is shown in figure 81, which picture illus-
trates two cycles of a distorted wave. Actually this is the waveform of
the voltage developed by one of the generators used in our laboratory.
Varying the length of the sweep would dose the pattern or open the
pattern still more. The width of the alternations would be greater or
smaller, depending upon the manipulation of the sweep amplitude con-

PRACTICAL APPLICATION OF CATHODE-RAY OSCILLOGRAPH 127
trol, assuming that this adjustment did not vary the linearity of the
sweep voltage. The sweep frequency used to produce figure 81 was
about 30 cycles. An example of incorrea frequency adjustment of the
sweep circuit is shown in figure 82. The pattern also shows over-syn-
chronization, evidenced by the fact that the terminations of the two-line
Fig. 81, left. Fig. 82, right. Even though the wave impressed on the vertical
plates of the cathode-ray tube is distorted, as in Fig. 81, the same need for
proper synchronization exists. Improper adjustment of the synchronizing
control is responsible for the pattern of Fig. 82
pattern are not beneath each other. A slight variation of the sweep
frequency produced the image shown in figure 81. The vertical ampli-
tude in figure 82 is slightly less than that of the image in figure 81.
External Synchronization
All of the patterns shown thus far were synchronized, when so
stated, by adjusting the synchronizing control switch or circuit to inter-
nal synchronization. Similar patterns would be developed if the switch
were adjusted to external synchronization. However, in this case, it
would be necessary to connect the external synchronization terminals
upon the cathode-ray tube unit to the source of the voltage, which
supplies the vertical defleaion plates.
Normally, one would imagine that the two terminals provided for
the external synchronization voltage input could be connected across the
voltage source feeding the signal to the vertical deflection plates. Such
is not the case, because of the very low input impedance of the synchro-
nizing circuit. Accordingly, when connecting the "high" terminal of
the synchronizing circuit to the voltage source, insert a 50,000 or
100,000-ohm resistor in series. The ground terminal can be connected
to the grounded side of the voltage source. In the event that the ar-
rangement of grounds is such that a common lead cannot be used, a
condenser may be connected into the circuit. In the event that the use

128 THE CATHODE-RAY TUBE AT WORK
of a 50,000 or 100,000-ohm resistor does not supply sufficient synchro-
nization voltage, use a lower value, but bear in mind that the input
impedance of the synchronizing circuit is comparatively low.
60-Cycle Synchronization
It is customary to provide a 60-cycle synchronizing signal with
cathode-ray mbe units. This voltage is selerted by means of the switch
which controls the source of the synchronizing signal; that is, whether
it is "internal,” "external” or "60-cycle.” The 60-cycle voltage is se-
cured from some part of the power supply system. It is necessary to
understand that this 60-cycle voltage is not the sweep voltage. All it
does is to actuate the sweep oscillator, depending upon the frequency
setting, to generate saw tooth pulses, which are multiples or sub-
multiples of 60 cycles or whatever the frequency of the power supply
operating the cathode-ray tube unit may be.
Reference has been made to the fact that some oscillographs contain
a 60-cycle or so called "harmonic” sweep. It should be understood that
Fig. 83, left. Fig. 84, right. The vertical amplitude in Fig. 83 is correct for
observation of the waveshape. The same wave was photographed for Fig. 84,
but the vertical deflection plate voltage was increased to such an extent that
one peak of the wave is blurred as it touches the rounded portion of the screen.
this arrangement possesses a limited utility in that it can not be used
for the examination of waves other than those at frequencies which are
multiples or sub-multiples of 60 cycles. Even at these frequencies, ex-

PRACTICAL APPLICATION OF CATHODE-RAY OSCILLOGRAPH 129
amination of the wave form is extremely difficult and the ordinary
linear sweep is gready to be preferred. However, in large communities,
which maintain an accurate check on the power frequency, the harmonic
sweep can conveniently be used as a frequency standard for calibration
work at audio frequencies. Bear in mind that while the average power
frequency over a period of time is kept at a high degree of accuracy, the
frequency at any given time may be off to an appreciable degree.
Vertical Amplitude
The various images shown thus far were made with the vertical
amplitude of the proper level to place the image in the center of the
Fig. SS. The same wave as wasshown in Figs. 83 and 84 is illus-
trated at the right. When this
photograph was made the vertical
amplitude voltage was increased so
that the peaks of the wave wereentirely off the screen, and the pat-
tern is useless for observation of the
shape of the wave.
screen. It is quite natural to assume that .such would be done in
practice. Excessive amplitude of the vertical voltage will cause the
image to be partly on and partly off the screen. The peaks of the
waves will be off the screen. As a matter of fact, if the vertical ampli-
tude adjustment is such that the peaks of the wave are located at the
boundaries of the tube screen, these peak images will be distorted,
blurred and hard to distinguish. These facts are shown in figures 83,
84 and 85. The image shown in figure 83 is ample for all observation.
The adjustment of the vertical deflection plate voltage was increased
too much and the pattern shown in figure 84 resulted. The peaks of
the wave are at the boundaries of the tube and are blurred. Figure 85
shows the peaks off the screen.

130 THE CATHODE-RAY TUBE AT WORK
It is difficult to designate the correct size of the image. That is up
to the operator and is also limited by the intensity of the original volt-
age. At times the gain in the amplifier, contained in the cathode-ray
tube unit, is not sufficient to produce an image which is more than
perhaps .5 or .75-inch high. Unless additional amplification is used,
one will have to be satisfied with an image of such vertical proportions.
There are times when even this amplitude is not available.
A certain relation exists between the adjustment of the vertical de-
flection voltage gain control, or vertical amplitude, and the synchroni-
zation adjustment. This is so in every one of the cathode-ray tube
units adjusted for internal synchronization. The reason is easy to un-
derstand when you examine the wiring diagram. The synchronization
voltage is secured from either the plate circuit of the vertical deflection
amplifier or from the vertical deflection plate circuit of the cathode-ray
tube. As such, the higher the level of the vertical deflection voltage, as
determined by the setting of the vertical deflection amplifier gain
control, the greater the synchronization voltage, for any one adjust-
ment of the synchronization control. That is why you may find that
when the synchronization control has been advanced beyond its mini-
mum setting, an adjustment of the vertical deflection amplifier gain
control acts upon the degree of synchronization.
Horizontal Amplitude
Although we have made mention of the horizontal amplitude with
respect to the number of cycles which appear upon the screen and the
Fig. 86, left. Fig. 87, right. The same wave is shown in both
illustrations with the same vertical deflection voltage applied.
The horizontal deflection voltage has been increased in
Fig. 87, so that the wave appears to be much flatter,
relation between this number and the ease of examining a waveform or
image, whatever it may portray, we did not state that excessive ampli-
tude in the horizontal direction, when the vertical deflection is not
very great, will change the apparent shape of the pattern. Examine
figures 86 and 87. Figure 86 shows a pattern of a small vertical de-
flection voltage and small horizontal deflection voltage. The sine

PRACTICAL APPLICATION OF CATHODE-RAY OSCILLOGRAPH 131
character of the wave form is evident. In figure 87, the vertical deflec-
tion voltage was maintained constant, but the horizontal defleaion
(sweep amplitude gain control) was increased. Note how much flatter
the wave appears. Accordingly, it is obvious that an optimum setting
between the horizontal deflection, or sweep amplitude gain control, and
the vertical deflection gain control is necessary in order to cause no
apparent distortion of the image.
Distortion Due to Non-linear Sweep Voltage
We have shown a graphic example of how a non-linear sweep volt-
age distorts the image upon the screen. The distortion takes the form
Pig. 88, left. Fig. 88-A, right. The sweep of Fig. 88 is almost a straight line
and so a sine wave swept by such a linear wave will be undistorted, as that
shown in Fig. 88-A. The curvature of the left-hand trace of Fig. 88 is due to
the curvature of the tube’s viewing screen.
of non-uniform spreading of the wave along the horizontal axis. Asine wave spread by a linear sweep voltage (see figure 88) appears like
that shown in figure 88-A. The same vertical deflection voltage when
Fig. 89, left. Fig. 90, right. The same wave as shown in Fig. 88-A is shownin Fig. 90 when spread across the screen with a non-linear sweep, as illus-
trated in Fig. 89. Note how the right side of the image is crowded due to the
non-linearity of the sweep.
Spread by a non-linear sweep voltage, such as that shown in figure 89;
appears as shown in figure 90. If you examine figure 90, you will
note that the right-hand portion of the image corresponds to the top of
the charging cycle, where the rate of charge is the slowest, resulting

132 THE CATHODE-RAY TUBE AT WORK
in a slowing down of the movement of the spot across the screen. The
spot is sweeping from the left side to the right side of the screen to
trace the pattern and the return trace is from right to left, as is evident
in the photograph.
Distortion of this type does not cause a great deal of confusion when
examining a sine wave, since the wave itself is not distorted. However,
in the event that a distorted wave is spread by a non-linear sweep, the
pattern does not show the extent of the distortion present in the wave
in the proper perspective. The portion of the pattern, which is spread
more than the other, tends to flatten peaks, due to the presence of the
harmonic frequencies which constitute the distortion, and the portion of
the wave which is crowded also disguises the presence of the distortion.
The greater the extent of non-linearity of the sweep voltage, the greater
is this effect.
Such distortion also occurs when the sweep voltage is of sinusoidal
character, as for example with the 60-cycle sine wave sweep mentioned
earlier in the text, and when the frequency of the voltage being ob-
served is not a multiple or sub-multiple of 60 cycles. As a sweep volt-
age, the 60-cycle sinusoidal wave is of very little, if any, value. Under
certain conditions, as will be shown later, the use of the sinusoidal
sweep voltage results in the development of a Lissajous figure.
General Signal Voltage Considerations
A mote detailed resume of this subjea is given in the discussion
concerning the use of the cathode-ray tube as a voltmeter.
General Operating Considerations
It might be well to make brief mention of a few pertinent points
which are of interest in connection with all types of praaical applica-
tions of the cathode-ray tube.
If either the vertical or horizontal pair of deflection plates is not in
use, the free plates should be grounded, thus obviating the possibility
of stray charges accumulating upon the plates of the free pair and influ-
encing the beam and pattern.
The free plate of either the vertical or horizontal deflection plates,
when connected to the associated amplifier and not in use, should be
placed at zero potential by grounding the input circuit of the amplifier
connected to the unused defleaion plate. If this is not done, the input
circuit to the amplifier may pick up stray voltages and cause a spurious
defleaion in the related direction.

PRACTICAL APPLICATION OF CATHODE-RAY OSCILLOGRAPH 13}
If the saw tooth sweep is in operation and the vertical deflection
plates are connected to the input amplifier, but not to a source of signal
voltage, stray voltage patterns may appear upon the screen and will give
misleading indications, unless the reason for their appearance is
recognized.
The ground terminal upon the cathode-ray tube unit should be
connected to some grounded point in the operating circuit.
Phase Difference Measurement
There are a number of tests which require that the phase relation
between two voltages or a current and voltage be established. There
are various ways in which this information can be gleaned, but no one
is as handy as the cathode-ray oscillograph, for it enables practically
instantaneous determination by examination of the pattern which ap-
pears upon the screen. An idea of the development of phase differ-
ence or phase relation patterns can be had by reference to figures 46
to 48 inclusive. A phase difference pattern is a Lissajous figure for a
1-1 ratio.
The 1-1 frequency ratio obtains, because a single source of signal
voltage is used; that is, the frequency of the signal applied to the
vertical plates is the same as the frequency of the signal applied to the
horizontal deflection plates. Hence, the ratio of the two voltages acting
at right angles upon the beam is as 1 is to 1.
For phase difference tests, several of which will be shown during
the discussion of the practical applications of the cathode-ray tube, the
sweep circuit is not used. By means of the various controls available
upon the cathode-ray oscillograph unit, one of the signal voltages is
applied to the vertical plates through or around the related amplifier,
depending upon the intensity of the voltage, and the other voltage is
applied to the horizontal deflection plates, through or around its asso-
ciated amplifier. See figure 92. It is best, in order to interpret the
image correctly without involving the action of the amplifiers, to use
amplifiers in the vertical and horizontal deflection circuits, or to leave
them out of both circuits. If an amplifier is used in one of these
circuits, it is necessary to recognize the existence and presence of this
amplifier, when finally interpreting the pattern upon the screen.
The following illustrations are given solely for reference purposes
and for what possible value they may have in connection with phase
difference measurements. A phase difference image may assume any one
of a number of shapes, ranging from a straight line tilted to the right
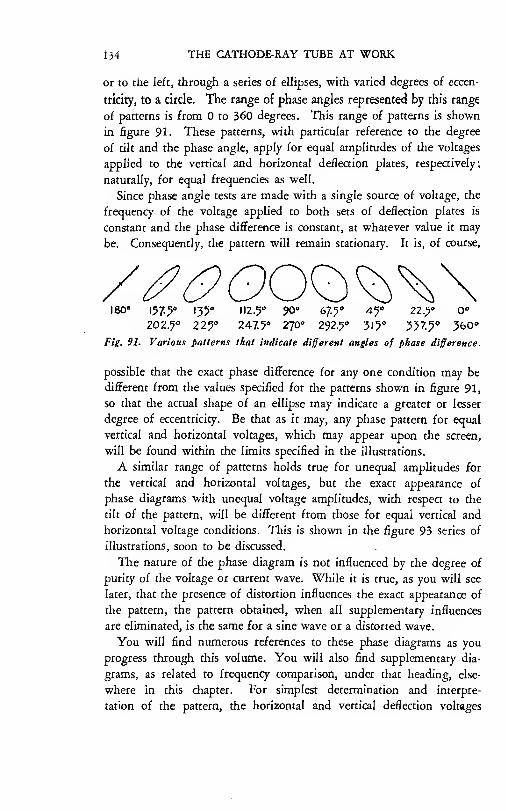
i34 THE CATHODE-RAY TUBE AT WORK
or to the left, through a series of ellipses, with varied degrees of eccen-
tricity, to a circle. The range of phase angles represented by this range
of patterns is from 0 to 360 degrees. This range of patterns is shown
in figure 91. These patterns, with particular reference to the degree
of tilt and the phase angle, apply for equal amplitudes of the voltages
applied to the vertical and horizontal deflection plates, respectively;
naturally, for equal frequencies as well.
Since phase angle tests are made with a single source of voltage, the
frequency of the voltage applied to both sets of deflection plates is
constant and the phase difference is constant, at whatever value it may
be. Consequently, the pattern will remain stationary. It is, of course,
Fig. 91. Various patterns that indicate different angles of phase difference.
possible that the exact phase difference for any one condition may be
different from the values specified for the patterns shown in figure 91,
so that the actual shape of an ellipse may indicate a greater or lesser
degree of eccentricity. Be that as it may, any phase pattern for equal
vertical and horizontal voltages, which may appear upon the screen,
will be found within the limits specified in the illustrations.
A similar range of patterns holds true for unequal amplitudes for
the vertical and horizontal voltages, but the exact appearance of
phase diagrams with unequal voltage amplitudes, with respect to the
tilt of the pattern, will be different from those for equal vertical and
horizontal voltage conditions. This is shown in the figure 93 series of
illustrations, soon to be discussed.
The nature of the phase diagram is not influenced by the degree of
purity of the voltage or current wave. While it is true, as you will see
later, that the presence of distortion influences the exact appearance of
the pattern, the pattern obtained, when all supplementary influences
are eliminated, is the same for a sine wave or a distorted wave.
You will find numerous references to these phase diagrams as you
progress through this volume. You will also find supplementary dia-
grams, as related to frequency comparison, under that heading, else-
where in this chapter. For simplest determination and interpre-
tation of the pattern, the horizontal and vertical deflection voltages

PRACTICAL APPLICATION OF CATHODE-RAY OSCILLOGRAPH 135
should be so adjusted that the amplitudes of the two deflections is the
same in each direction. This is accomplished by adjusting, first one
defleaion to a definite known length, according to any standard of
measurement, which may be an ordinary ruler. Then the deflection
voltage is removed from that set of plates without changing the gain
Fig. 92. The schematic diagram on the right
indicates the manner in which two voltages,
E-1 and E-2, are connected to the deflection
plates of the tube so that the phase differ-
ence between them may be found.
control, and the amplitude of the deflection in the other direction is
made equal to the first. See figure 92. One voltage is applied to
one set of plates and the other voltage in quadrature is applied to the
other set of plates.
Several examples of actual phase difference or phase angle patterns
or images, which appear upon the cathode-ray tube’s viewing screen,
are shown in figures 93-A to 93-H. You will note two types of
Fig. 93-A, left,
Fig. 93-B, right.
A phase differ-
ence of 180“ ex-
ists in both pat-
terns. That of Ais for equal
amplitudes of
horizontal andvertical voltage,
while that of Bhas a greater
vertical deflec-
tion voltage.
illustrations in this group. One type shows the vertical and horizontal
reference lines as well as the phase difference pattern. The other group
shows only the phase diagram, that is, the actual pattern, as it appears
upon the screen. The illustrations with the 'Y” and "X” axes and
the phase diagram are triple exposures and were made to show the
change in the resultant pattern as the consequence of a change in the
amplitude of the vertical and horizontal voltages. The "Y" and "X”axes, in this case, are really the two voltages, photographed separately
as individual deflections. The phase diagram is the resultant of the
two deflections. At the same time, these two deflections serve well as
reference lines.
You will have no trouble noting how the tilt of the phase pattern
changes when one of the amplitudes is changed. The triple exposures

136 THE CATHODE-RAY TUBE AT WORK
were made in the following manner: One voltage was applied, say to
the vertical plates. The result was a line. This was photographed
The film was allowed to remain in the camera. Then the voltage was
applied to the hori2ontal plates and the vertical deflection was removed
and the film was again exposed, but remained in the camera. Then
Fig. 93.C, left.
Fig. 93-D, right. Aphase difference
of 0° exists be-
tween the twovoltages. In Cequal amplitudeson both axes give
the pattern a 45°
angle with the
horizontal, butwhen the horizon-
tal amplitude is increased, as in D, then the pattern approaches the X-axis.
the horizontal and vertical voltages were simultaneously applied to the
tube and the phase difference image developed. This was photo-
graphed and the result is shown.
Figure 93-A indicates a 180-degree phase difference, with equal
horizontal and vertical amplitudes of voltage. The same phase differ-
ence, but with the vertical defleaion greater than the horizontal deflec-
Fig. 93-E, left.
Fig. 93-F, right.
Pattern fora phasedifference of about45°. Both E andF are the samepattern, but the Xand Y axes wereomitted from F.
tion, is shown in figure 93-B. Note how the phase image has moved
up towards the vertical reference line or "Y” axis. Figure 93-C shows
the image for 0-degree phase difference, with equal amplitudes along
the vertical and horizontal axes. Figure 93-D is for the same phase
difference, but the horizontal voltage was greater than the vertical
deflection voltage. Note how the phase diagram has shifted towards the
horizontal or "X” axis.
As stated earlier in this volume, the orientation of these phase dia-
grams depends upon the polarity of the respective voltages. The
positioning of the images, for the phase angles stated, is that to be
found in existing commercial cathode-ray tube oscillographs, wherein
one plate of each pair is connected to a common ground within the
unit The plates which are grounded are the same in all of the tubes

PRACTICAL APPLICATION OF CATHODE-RAY OSCILLOGRAPH 137
offered to the radio industry, with 3 and 5-inch screens, inclusive of
the W.E. 224. In this connection we exclude the General Radio
tube, which has individual connections to each of the four plates, com-
prising the two pairs of deflection plates. Furthermore, the orienta-
tion is to be found in existing equipment, when the positioning of the
tube is according to normal practice.
A phase difference of slightly more than 45 degrees is indicated in
figures 93-E and 93-F. The former illustration also shows the two
Fig. 93-G, left.
Fig. 93-H, right.
Pattern for aphase difference
of approximately135°. The pattern
of H is the sameas that of G with-
out the horizontal
and vertical refer-
ence axes.
reference voltage lines and the resultant image, whereas the latter
shows only the image which is seen upon the screen. Figures 93-G
and 93-H show the same phase pattern, with and without the reference
voltage lines, for a phase difference of slightly less than 135 degrees.
So much for stationary phase difference patterns or images. You
will have occasion to examine many more, as related to certain specific
applications and to refer to those shown in figure 91 and in the 93
series.
Frequency Comparison
Herein lies one of the very valuable functions of the cathode-ray
tube, namely, the comparison of two frequencies. This can be carried
out to a very high degree of accuracy. The comparison of two fre-
quencies or the calibration of an unknown by means of a known fre-
quency, is carried out by interpreting the Lissajous figure which is
created when two alternating voltages are applied to the vertical and
horizontal deflection plates, respectively. Just how these images or
patterns are produced, by the combined action of these two voltages
upon the electron beam, was described briefly in connection with figures
50, 51 and 52. In connection with the discussion of this subject at
this time, we shall give details as to how such calibration is carried
out and furnish a number of reference patterns, which should prove
of value during actual operation. However, before starting upon the
actual interpretation of the patterns, it might be well to furnish a few

138 THE CATHODE-RAY TUBE AT WORK
pertinent facts pertaining to the application of the cathode-ray tube
oscillograph to this type of work.
Frequency Limits
As a general rule, frequency comparison or frequency calibration
with the cathode-ray tube is usually applied to frequencies from 0 to
about 100,000 cycles. Not that the cathode-ray tube is encumbered
by this figure as its upper limit, but rather because this figure is the
upper limit of amplifiers, which can develop sufficient voltage to pro-
vide suitable deflection upon the screen. As a matter of fact, the
frequency limit of the conventional cathode-ray tube for the purpose
of frequency comparison is about 100,000,000 cycles, but it is not used
at such high frequencies, because suitable means of providing the
correct deflections, required for proper intepretation of the image, is
not available. Consequently, we can say that the frequency limit is
determined by the ability to provide suitably high voltages for the
vertical and horizontal deflection plates. If at any one point of utility,
the related amplifiers can provide sufficient vertical and horizontal de-
flection voltages up to 100,000 cycles, the frequency limit at that point
of operation is 100,000 cycles. If somewhere else, amplifiers are avail-
able which will provide sufficient voltage from the known and un-
known frequency sources up to 1,000,000 cycles, then the frequency
limit is 1,000,000 cycles. The fact that the oscillators or signal gen-
erators are capable of developing test voltages up into the 5.0 to 10.0-
megacycle band is of no consequence, unless these signals are of suffi-
cient voltage to provide a suitable deflection upon the tube’s screen.
The frequency limit of the cathode-ray tube is the ability of the electron
beam to follow the variations of the field.
Generally, it is necessary to work through amplifiers. Up to about
200,000 cycles can be handled by the amplifiers contained in cathode-
ray oscillographs, although they are rated at only 100,000 cycles. The
gain of the amplifier falls off above 100,000 cycles, but sufficient gain
is still available at 200,000 cycles to enable satisfactory operation. With
special amplifiers of the resistance-capacity coupled type, such as wehave used in our laboratory, operation up to about 800,000 cycles is
conveniently possible. With high gain tuned-radio-frequency amplifiers,
operation up to the several megacycles is possible, so that coverage of
from- 0 to several million cycles is available to the man who is suffi-
ciently interested.
As far as audio-frequency work is concerned, that is extremely simple.

PRACTICAL APPLICATION OF CATHODE-RAY OSCILLOGRAPH 139
incidentally, we feel that the variable audio-frequency oscillator is going
to play an extremely important part in servicing of the future.
Frequency Standards
In order to be able to compare two frequencies, one must be known
and the known one, naturally, becomes the standard. This standard
should be an oscillator of one type or another, be it a vacuum tube
oscillator, simple or elaborate, an electrically driven mning fork, with
output circuit connections, etc. The range of the oscillator used as a
standard is not so important, provided that its highest frequency is
at least one-tenth of the highest frequency to be calibrated upon the
unknown. Thus, with a single 1000 cycle standard, it is possible to
calibrate a range of Irom 100 to 10,000 cycles.
If the standard is continuously variable and has a range fully as
great as the supposed range of the unknown or uncalibrated oscillator,
calibration is greatly simplified. At any rate, known standard oscillators
are a better source than the a-c. line. The 60-cycle power
supply makes a perfect standard ,—ifone knows definitely the
exact frequency at the time of measurement. . . . The power supply
frequency usually is constant, but not suitable for use as a standard be-
cause of its instantaneous changes and the lack of knowledge of the
exact frequency at the time that its value is thought to be 60 cycles and
set up as a standard.
Under certain conditions, the linear sweep circuit in the cathode-ray
oscillograph may be used as a standard, but only after certain frequency
settings of this system have been definitely established and are accur-
ately known. The use of the linear sweep as a frequency standard will
be described later but its use as such is not recommended.
Sine waves, distorted waves and modulated waves may be used during
such frequency comparison, but not with equal facility. The greatest
ease of interpretation, which means the most rapid and accurate opera-
tion, will occur when two sine-wave voltages are being compared for
frequency determination. Photographic examples of these three will
be shown and you will have the opportunity to judge for yourself.
What has been said is particularly true when complex ratios are in-
volved; that is, when the two frequencies bear some fractional relation
to each other, and not fat removed from an integral ratio.
Relative Atniplitude of the Two Voltages
Much can be said about the relative amplitudes of the two voltages
applied to the vertical and horizontal deflection plates. However, effi-

140 THE CATHODE-RAY TUBE AT WORK
dent operation is best accomplished by having the image upon the
screen, formed as a result of the two voltages being compared, as large
as possible, yet not too large; that is, so large that the boundaries of
the pattern extend to the limits of the screen. If such is done, the
edges of the pattern will be hazy and interpretation of a complex
pattern will be difficult.
There is very little choice between a square pattern and a rectangular
pattern; whichever suits the requirements for best interpretation should
be used. The simpler the frequency ratio between the two voltages,
the smaller may be the pattern. The more complex the frequency ratio
between the two voltages, the larger must be the image, so as to enable
visual inspection and proper interpretation. At the same time, it
should also be realized that the larger the image, the less its intensity
and the less distinct will be the lines, loops and intersections, all of
which may be involved in making the correct interpretation. Any
effort to make the image brighter may result in impairment of the
focus, thus making the boundaries of the image even more indistinct
and difficult to interpret.
Basic Circuit
The basic circuit utilized to produce normal Lissajous figures for
frequency calibration or frequency comparison is shown in figure 94.
The units are illustrated in block form. The known oscillator is the
Fig. 94. The basic circuit used for producing Lissajous figures, which are usedin the comparison of two frequencies or for frequency calibration.
Standard. The gain control or amplifier unit can be the amplifier
within the cathode-ray tube unit, or may be an external amplifier, being
used to provide the required signal voltage. The standard or known
frequency is applied to the vertical deflection plates. The unknownor uncalibrated oscillator also has its gain control or amplifier and the

PRACTICAL APPLICATION OF CATHODE-RAY OSCILLOGRAPH 141
signal is fed to the horizontal deflection plates. Whether or not ex-
ternal amplifiers are used, is a matter of individual need and discretion.
There are a number of circuit arrangements, in addition to that shown
in figure 94, whereby Lissajous patterns are made possible. Of these,
the simplest is that shown in figure 94, and incidentally, the images
produced are those most commonly found to be of value during fre-
quency comparison or calibration. The images to which we are re-
ferring are the completed loop patterns, such as was developed in
figure 50. Here the loops are completed and open to view. Additional
examples of such patterns will be given soon.
Under certain conditions, as for example when the frequency ratio
is quite complex or when it is quite high, it is convenient to separate
the front and back portions of the pattern, as a means of expediting
the determination of the number of loops present in the pattern. Ex-
amples of the circuit required to produce such patterns and the means
of interpreting the pattern will be given later.
There is another type of pattern, which will be discussed at greater
length, wherein the loops are not completed. These will be shown,
but it might be well to state at this time that these patterns are not
very satisfactory for calibration work, because it is generally difficult
to stop the pattern long enough to make the necessary count of loops
and intersections.
Interpretation of Completed Loop Patterns
We have made mention of the means of determining the frequency
ratio existing between two voltages which have been applied to the
deflection plates and which have produced a completed loop pattern.
This was shown in figure 51, with tangents drawn to two sides. Thenumber of loops or peaks which touch these tangents are counted and
the ratio between them is the frequency ratio between the two voltages.
It may not even be necessary to draw these tangents. It is possible
to determine the frequency ratio simply by counting the number of
peaks or loops existing on two sides of the pattern. The important
thing is to be able to recognize the existence of the loops or peaks.
In certain cases, it may be necessary to vary the voltage applied to
either the horizontal or vertical deflection plates, in order to bring
out more clearly the existence of the loops in the pattern.
Another extremely important consideration is exact knowledge rela-
tive to the direction of the standard frequency voltage; that is, if it
has been applied to the vertical plates or to the horizontal plates and

142 THE CATHODE-RAY TUBE AT WORK
the exact frequency of the standard voltage. If these facts are not
known, calibration cannot progress. The former is of particular im-
portance, because if the standard frequency is maintained constant, the
loops in the pattern will be positioned in a certain way over a certain
frequency range. In other words, if the standard frequency is higher
than the unknown and is applied to the vertical plates, the loops on the
top of the pattern will be greater than the number of loops on either
side of the pattern, until a 1-1 ratio is reached, when the image will be
a circle. If the standard frequency is held constant at its original
value and the unknown is advanced, the greater number of loops will
appear on the side of the pattern and the smaller number of loops will
appear on the top boundary of the pattern. Because of this change in
the number of loops on the side or top of the pattern, it is necessary to
know which plates are being supplied with the standard voltage.
A third important consideration, when working with completed
loop patterns, is to make certain that all of the loops in the image are
being disclosed and that none are covered by others. That is why it
is best to work with a pattern which is moving very slowly. Experi-
ence is a good teacher in this respect.
So much for the general details. Elaboration upon each of these
details will be made as we progress through the actual comparison of
frequencies.
Typical Patterns
We have shown how the phase relation between the two voltages
influences the shape of the pattern. The development of the two
images for the identical frequency ratios in figures 50 and 52 showhow it is possible for a person to become confused and at the same
time how different patterns may indicate the same frequency ratio.
Fig. 95. A, left,
B, right. Bothpatterns show a1-1 ratio be-
tween the fre-
quencies. Thephase difference
in A is 180° andthat in B is 0°.
As Stated a moment ago, the most satisfaaory pattern to use for fre-
quency ratio interpretation is the one which has the uncovered com-
pleted loops. The uncovering of the loops can be accomplished by

PRACTICAL APPLICATION OF CATHODE-RAY OSCILLOGRAPH 143
changing the unknown frequency ever so slightly, so that the pattern is
in motion. The most minute change from a stationary condition is
satisfactory. Once the frequency ratio has been determined, the pat-
tern may be stopped, irrespective of how many of the loops are covered
at the instant and the calibration for the known frequency recorded.
The actual frequency difference between the setting required to set
the pattern into slow motion, so as to enable determination of the num-
ber of loops or peaks, and the stopping of the pattern is so little as
to be entirely negligible.
The phase relation has no bearing upon the calibration, other than,
as has been stated, in the production of certain patterns, which, if they
Fig. 95. C, left, D, right. Each pattern indicates a 1-1 ratio. The phase diff-
erence in C is about 45” and that in D is about 90°.
are not understood, may cause incorrect interpretation. However, if
the pattern is understood, so that correct interpretation can be made,
the exact phase relation indicated by the shape of the pattern is of no
consequence.
The ratio indicated in the pattern is a function of the respective fre-
quencies of the two voltages. It matters not what the exact numerical
value of these frequencies, the pattern will be the same for any one
particular ratio. In other words, a 1000-cycle and a 2000-cycle voltage
will create a 2-1 ratio pattern and this pattern will remain the same
if the two frequencies are changed to 5000 and 10,000 cycles, 2250
cycles and 4500 cycles, 50,000 and 100,000 cycles, etc. The same is
true of all other ratios.
Figure 95 A, B, C and D illustrates four 1-1 ratio patterns for twosine waves of voltage. Figure 95 E, F and G indicate 1-1 ratio pat-
terns, but with one of the voltages distorted. Such 1-1 patterns maytake the form of anything between a straight or even crooked line.

144 THE CATHODE-RAY TUBE AT WORK
through an ellipse of any degree of eccentricity, to a circle. Whether
or not the pattern will remain srationary, depends upon the frequency
adjustment of the two oscillators. It may be difficult to stop any
pattern formed, when a standard is being compared with an unlmown
Fig. 95. E, left, F, middle, G, right. The three Lissajous figures here shownindicate a 1-1 ratio. One of the voltages impressed on the plates was not a
pure sine wave; hence the distortion.
oscillator, because either one of the oscillators may not be absolutely
constant in its output. The drift, however, may be so small as to
cause a slow change, which will not interfere with the calibration.
However, you are the one to judge the degree of constancy which you
want in an oscillator.
The frequency difference, existing between the two oscillators and
indicated by the motion of the pattern, can be checked by timing the
movement of the pattern. A complete cycle of rotation of the pattern
in one second is equal to a frequency difference between the settings
of the two oscillators of 1. cycle. If a complete cycle of rotation is
completed in four seconds, the difference in frequency adjustment is
cycle. If four complete rotations of the pattern are made in one
second, the frequency difference between the two oscillators is 4. cycles.
Figures 96 A, B and C show three patterns for a 2-1 ratio, with
both voltages of sine character and unmodulated. These three pat-
Fig. 96. A, left, B, middle, C, right. Lissajous figures showing a 2-1 ratio.
terns indicate three phase relations. These three patterns were made by
causing the two oscillators to differ very slightly in frequency, so that
the pattern progressed through the complete range of phase relations
between 0 and 360 degrees. Figure 96-A is an example of a completed
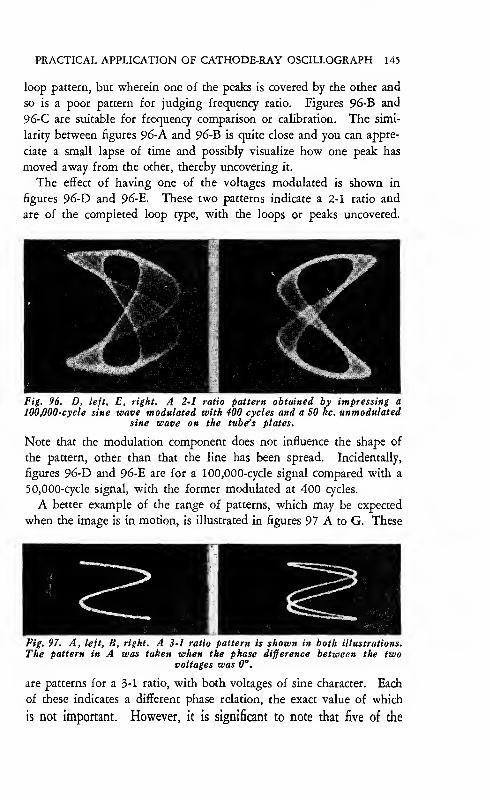
PRACTICAL APPLICATION OF CATHODE-RAY OSCILLOGRAPH 145
loop pattern, but wherein one of the peaks is covered by the other and
so is a poor pattern for judging frequency ratio. Figures 96-B and
96-C are suitable for frequency comparison or calibration. The simi-
larity between figures 96-
A
and 9d-B is quite close and you can appre-
ciate a small lapse of time and possibly visualize how one peak has
moved away from the other, thereby uncovering it.
The effect of having one of the voltages modulated is shown in
figures 96-D and 96-B. These two patterns indicate a 2-1 ratio and
are of the completed loop type, with the loops or peaks uncovered.
Fig. 96. D, left, E, right. A 2-1 ratio pattern obtained by impressing a
100.000-
cycle sine wave modulated with 400 cycles and a SO kc. unmodulatedsine wave on the tube's plates.
Note that the modulation component does not influence the shape of
the pattern, other than that the line has been spread. Incidentally,
figures 96-D and 96-B are for a 100,000-cycle signal compared with a
50.000-
cycle signal, with the former modulated at 400 cycles.
A better example of the range of patterns, which may be expected
when the image is in motion, is illustrated in figures 97 A to G. These
Fig. 97. A, left, B, right. A 3-1 ratio pattern is shown in both illustrations.
The pattern in A was taken when the phase difference between the twovoltages was 0°.
are patterns for a 3-1 ratio, with both voltages of sine character. Each
of these indicates a different phase relation, the exact value of which
is not important. However, it is significant to note that five of the

146 THE CATHODE-RAY TUBE AT WORK
seven patterns are suitable for frequency comparison, because all of the
loops or peaks are uncovered. Figure 97-A is like that shovi^n in figure
52, illustrating the resultant image when two voltages are in phase and
Fig. 97. C, left, D, right. 3-1 ratio patterns obtained by using two different
phase relationships.
Fig. 97. E, left, F, right. The 3-1 pattern in E was photographed with a phasedifference between the waves of 90°, and that of F above 90°.
Fig. 97. G, left, H, right. The 3-1 pattern of G was made when the voltages
had a phase difference of 130°. In H one of the voltages was modulated.
the frequency of one is three times the frequency of the other. Figure
97-E is like the pattern developed in figure 50, illustrating the two
voltages 90 degrees out of phase. The pattern shown in figure 97-G
indicates a phase difference of 180 degrees. 97-H indicates a 3-1
ratio with one of the voltages modulated.
Figure 98 illustrates a ratio of 3-2. Note three loops or peaks along
one side and two loops or peaks along the adjacent side. Tangents
drawn along these sides would touch the number of loops stated.

PRACTICAL APPLICATION OF CATHODE-RAY OSCILLOGRAPH 147
Figures 99-A and 99-B illustrate a 4-1 pattern, with both voltages
sine (figure 99-A) and with one of the voltages distorted, shown in
figure 99-B.
Fig. 98. A 3-2 Lissajous patteru. Notethat there are two loops horizontally
and three loops vertically.
Figure 100 shows a 4-3 ratio pattern. Note the four loops on one
side and the three loops on the other side. At the same time, we want
to call to your attention the fact that often the loops are more distinct
upon one side of the pattern than upon the other. For example, the
Fig. 99. A, left, B, right. Both these patterns indicate a 4-1 ratio. Both sine
waves were pure when A was photographed, but one was distorted when Bwas taken.
four loops are more distinct upon the right side of the pattern than
upon the opposite parallel side. Also that the three loops are more
distinct upon the bottom side of the pattern than upon the top boundary.
Fig. 100. On the right is shown a 4-3
ratio pattern. The four loops may beeasily distinguished along the right side
of the figure and three loops alongeither the top or bottom.
Figures 101-A and 101-B illustrate 5-1 ratios, but it would be most
difficult to anyone but an experienced person to determine that figure
101-B indicates a 5-1 ratio, because the loops have been covered by
Other loops. On the other hand, the pattern of 101-A shows all of the

148 THE CATHODE-RAY TUBE AT WORK
loops completed and uncovered, the ideal pattern for frequency com-
parison.
Fig. 101. A, left, B, right. Both patterns are of a S-1 ratio. The one shownin B has its peaks coinciding.
Fig. 102. A, left, B, right. The Lissajous figure in A has a ratio of 5-2 and that
in B has a ratio of 5-3. Note the number of loops at the top of each figure.
Figures 102-A and 102-B illustrate 5-2 and 5-3 ratios, respectively.
Figure 103 illustrates a 6-1 ratio. Figures 104-A and 104-B illustrate
6-5 ratios, with the loops covered in the former case and uncovered
in the latter photograph.
Fig. 103. The ratio between the volt-
ages impressed on the tube’s plates was6-1 when this Lissajous figure wasphotographed. The six loops are easily
seen on the right side of the pattern.
A 7-1 ratio is shown in figure 105 ;a 7-2 ratio is illustrated in figure
106 and 7-3 ratio is shown in figure 107. Figures 108 and 109 illustrate
ratios of 7-5 and 7-6, respectively. Note that a portion of the pattern

PRACTICAL APPLICATION OF CATHODE-RAY OSCILLOGRAPH 149
Fig. 104. A, left, B, right. Both patterns were made with a 6-S ratio. Theone shown in A was photographed when the loops were "closed" and that in
B when the loops were "open!'
Fig. 105. A 7-1 ratio pattern. Fig. 107. A 7-3 ratio pattern.
Fig. 106. A 7-2 ratio pattern. Fig. 108. A 7-5 ratio pattern.
is out of focus and that it becomes increasingly difEcuIt to establish the
identity of the frequency ratio. The bottom boundaries of both of
these patterns are useless for identification of the number of loops
present in the picture.
An 8-1 ratio is indicated in figure 110. Note that while the ratio
is high, the pattern is still relatively simple. Compare the nature of

150 THE CATHODE-RAY TUBE AT WORK
this pattern with the 8-3 ratio shown in figure 111-A and the 8-7 ratio
illustrated in figure 111-B. Identification of the latter pattern is too
complicated for ordinary frequency measurement. Extremely stable
Fig. 109. A 7-6 ratio pattern. Fig. 110. An 8-1 ratio pattern.
Fig. 111. A, left, B, right. The pattern in A is an 8-3 ratio and that in B is
8-7 ratio.
Fig. 113, right. A 9-4 ratio pattern.
oscillators must be used, if these patterns are to be identified directly
upon the cathode-ray tube viewing screen. They must be stationary

PRACTICAL APPLICATION OF CATHODE-RAY OSCILLOGRAPH 151
for any sort of determination. There are entirely too many lines in the
pattern to permit identification with the image in motion.
A 9-1 ratio is shown in figure 112. Ratios of 9-4, 9-5, 9-7 and 9-8
are shown in figures 113, 114, 115, 116, respectively. A 10-1
ratio is shown in figure 117.
Fig. 114. A 9-S ratio pattern. Fig. 115. A 9-7 ratio pattern.
Fig. 116. A 9-S ratio pattern. Fig. 117. A 10-1 ratio pattern.
So much for the completed loop patterns. While this by no means
completes the subject of Lissajous figures used for frequency calibration,
the illustrations given so far should serve as guides in establishing the
ratio of patterns secured when two voltages are fed into the cathode-
ray tube oscillograph in conformity with the circuit shown ki figure 94.
Since the majority of calibrations of oscillators are carried out with
ratios of from 1-1 to 10-1, with the type of circuit shown in figure 94,
we shall devote most of our attention to these completed loop patterns.
The other types of patterns, which are available with the cathode-ray
tube, will be discussed later in this chapter.
Proper interpretation of the frequency ratio requires more than just
the knowledge of the ratio as indicated upon the screen by the loops

152 THE CATHODE-RAY TUBE AT WORK
in the pattern. Each ratio can be interpreted two ways, namely, where
one frequency is so many times higher than the standard, or is that
fraction of the standard. In other words, a 3-1 ratio may mean that
the standard frequency is three times as great as the unknown or is
one-third the frequency of the unknown. Which case applies for any
one ratio can be determined by examination of the image, assuming
that the connections to the horizontal and vertical deflection plates
have not been changed. The information is conveyed to the operator
by the positioning of the loops upon the screen.
Let us assume that the standard frequency, adjusted to 3000 cycles,
is applied to the vertical deflection plates. The unknown signal gen-
erator is connected to the horizontal deflection plates. This unit is
Fig. 118. The tangent that is drawnparallel to the X axis touches the loopsthat result from the voltage applied to
the vertical plates and the tangent
drawn vertically touches those loops
that are produced by the voltage ap-
plied to the horizontal plates. As the
former was 3000 cycles and as the
figure shows a 3-1 ratio, the other
voltage must be 1000 cycles.
varied until the image of figure 118 is seen upon the screen. Ob-
viously, the ratio is 3-1, but in which direction? Is the standard higher
or lower than the unknown? Let us see.
The tangent drawn parallel to the horizontal reference line or "X”
axis of the tube will cut or touch the loops produced by the vertical
deflection. A tangent to the pattern, drawn parallel to the vertical or
"Y” axis, will cut or touch the loops due to the horizontal deflection.
The voltage applied to the vertical deflection plates has caused the pro-
duction of three loops, whereas the voltage applied to the horizontal
plates has caused but only one loop. We know that the standard fre-
quency, applied to the vertical plates, is 3000 cycles, hence the frequency
of the standard is to the unknown as 3 is to 1, and the frequency of
the unknown is 1000 cycles.
Now suppose that instead of the image shown in figure 118, we
see upon the viewing screen the image shown in figure 119. Counting
the number of loops, we still find a 3-1 ratio. However, a tangent
drawn parallel to the "X” axis would touch but one loop, which is
due to the vertical deflection. A tangent drawn parallel to the “Y”
axis, however, would touch three loops, which are due to the voltage
applied to the horizontal plates. There are three loops due to the

PRACTICAL APPLICATION OF CATHODE-RAY OSCILLOGRAPH 153
horizontal deflection voltage and only one loop due to the vertical
defleaion voltage. We know that the frequency of the voltage applied
to the vertical deflection plates is 3000 cycles. If the horizontal de-
flection voltage produces three loops for the one loop due to the vertical
defleaion voltage, the frequency of the voltage applied to the horizontal
Fig. 119. The Lissajous pattern here
shown is the reverse of that in Fig. IIS.
By identical reasoning, the ratio of the
frequencies applied to the plates is
here 1-3, instead of 3-1. The 3000-
cycle wave is applied to the vertical
plates, the ratio is 1-3, so the secondvoltage must have a frequency of 9000
cycles.
deflection plates must be three times the standard, or the frequency
of the standard is to the unknown as 1 is to 3, and the frequency of
the unknown is 9000 cycles.
It is evident from the foregoing, that what may be a 3-1 ratio in one
case is a 1-3 ratio in another. Any one of the ratios mentioned thus far
may be used to indicate that the standard frequency is higher than
the unknown, by the ratio stated, or is lower than the unknown, in
the ratio stated. This is why it is so important during calibration work
to know the direction in which the voltage from the frequency standard
is acting upon the beam.
The frequency ratios given thus far are not all which exist between
any two frequencies and which produce patterns upon the viewing
screen. However, more complicated ratios have very little value for
calibration, because it is extremely difficult to stop the image for ex-
amination. Furthermore, there is no reason why recourse to these com-
plicated ratios should be made when both oscillators are continuously
variable through their ranges. This is so even if the oscillators are
not continuously variable. If one is variable in steps and the other
is continuously variable, perfect calibration will be possible by using
simple integral ratios and complete elimination of complex fraaional
ratios.
After you have had experience viewing some of these Lissajous fig-
ures, particularly when they are in motion, you will find it much easier
to comprehend just what is meant by the statement that these patterns,
when viewed upon the screen, appear as if the wave were traveling
around a glass cylinder.

154 THE CATHODE-RAY TUBE AT WORK
Phase Splitting Circuits
In order to facilitate observation or to simplify the pattern, it is fre-
quently desirable to separate the front and rear patterns. In other
words, patterns, such as we have shown, can be said to have front and
rear portions, which are on the same horizontal plane. That is why,under certain phase conditions, certain peaks or loops are covered by
120. This circuit is used forseparating the front and rear por-tions of a pattern, making the inter-
pretation of high ratio figures muchsimpler. For a circular pattern the
reactance of C should equal resis-
tance of R at the base frequency.
Other loops. When the frequency ratio is greater than 10 to 1, compre-
hension of these patterns is not easy. To simplify them, or at least
to make interpretation easier, the pattern can be displaced on a circle
or an ellipse.
The circuit used is shown in figure 120. It is substantially the
same as that used in figure 94 for securing conventional patterns, except
for the addition of a phase splitting system, whereby the front and
tear portions of the pattern are separated. The 10-1 pattern of figure
117 now looks like the pattern shown in figure 121. A 13-2 pattern
spread out as an ellipse is shown in figure 122. A 19-2 pattern, with
the front and rear traces spread, is shown in figure 123. Frankly, we
Fig. 121. A 10-1 ratio Fig. 122. A 13-2 ratio Fig. 123. A 19-2 ratio
pattern. Compare Fig. pattern. pattern.
117.
do not feel that there is any real need for such Lissajous figures during
routine frequency calibration. With careful operation with ratios up
to 10-1, complete coverage can be had with a high degree of accuracy.
However, we show the schematic diagram and several examples for
those who may want to develop such patterns. To establish the fre-

PRACTICAL APPLICATION OF CATHODE-RAY OSCILLOGRAPH 155
quenq^ ratio of single line patterns, count the number of loops and
the ratio is the number of loops to 1.
In patterns which indicate fractional ratios, count the number of
loops and the number of lines of intersections made by the loops. In
figures 122 and 123, there is one such line of intersections. The fre-
quency ratio is equal to the number of loops or peaks on the circumfer-
ence divided by the term (one plus the number of lines of intersec-
tions). Thus figure 122 shows a ratio of 13—2 and figure 123 shows
a frequency ratio of 19 to 2.
Another form of pattern, due to N. V. Kipping, is the gear-shaped
figure on a circular axis. This produces a pattern such as that shown
in figure 124. The circuit is shown in figure 125. One voltage is
applied across both sets of plates in quadrature, by means of the phase
splitting circuit. As a result of this circuit, the beam spot traces a
Fig. 124, above, Fig. 12S, right. Thecircuit in Fig. 125 will produce agear-shaped pattern like that in Fig.
124. The condenser reactance shouldequal the resistance for the fre-
quency used.
CZl CZH T
PiHODE *ZI
UNK/40WN Ox/LLflro/Z.
circle upon the screen. The other voltage, the unknown, is connected
in series with the accelerating anode (anode J2). The operation of
the system is predicated upon the fact that as a result of the varying
voltage in series with the fixed accelerating voltage, the anode potential
will fluctuate through a maximum and minimum, in accordance with
the frequency of the varying voltage. At the same time, voltage applied
in quadrature to the two sets of deflection plates will cause the spot
to describe a circle. The varying voltage will cause the anode potential
to fluctuate a number of times (depending upon the frequency of the
varying voltage) during each circulation of the spot, with the result
that the final pattern will be an image which indicates the frequency
ratio between the varying voltage in series with the anode and the
frequency of the voltage which is causing the circular motion of the
spot. If the ratio between the two is exact, the image will be sta-
tionary. If the ratio is not exact, the image will revolve.
This arrangement has several disadvantages when viewed from the

156 THE CATHODE-RAY TUBE AT WORK
practical angle. First is the danger entailed by working around the
high anode voltage found in present-day cathode-ray tube equipment.
The second is that it is quite a problem to break into the finished cath-
ode-ray oscillograph in order to make the proper contact with the circuit.
The third is the defocusing effect of this varying potential, and the
resultant blurring of the image. The fourth is that ample information
for calibration is possible with the regular completed loop patterns.
Linear Sweep Circuit As Frequency Standard
The use of the linear sweep circuit as a frequency standard for fre-
quency comparison or calibration is beset by so many limitations that
we do not deem it worthwhile to describe the use of the patterns thus
created for frequency calibration. These patterns are of the uncom-
pleted loop, open end type. Two examples are shown in figures 126
and 127. These are created as a result of the condition that the fre-
quency of the signal and the sweep are not exact multiples of one
another. When the sweep frequency is an exact sub-multiple of the
other frequency applied to the vertical plates, the pattern is the regular
single line waveform, of one two or more cycles, depending upon the
ratio between the sweep frequency and the other frequency. The effect
of making the sweep frequency an exaa multiple of the frequency being
observed has been shown.
While it is true that these patterns can be used for frequency com-
parison, they are not worthwhile. We do not mean to assume a nega-
tive attitude, or to disparage the efforts of others who have shown such
patterns for frequency comparison, but we are considering the value of
a pattern from the practical as well as the technical angle. It is our
belief that the use of the linear sweep circuit for frequency comparison,
is not justified for the following reasons:
1. It is difficult to stop any such pattern without recourse to the
synchronizing circuit. Unless the pattern is made stationary, it
cannot be interpreted. When the synchronization control is ap-
plied, it is very apt to change the frequency of the sweep circuit
and thereby nullify its value as a standard.
2. The possibility of errors with these uncompleted loop patterns
is very much greater than with completed loop patterns, because
the patterns are far more complex and require more detailed
study in order to enable correa interpretation ; that is, if the pat-
tern can be made stationary, which in itself is quite a problem.

PRACTICAL APPLICATION OF CATHODE-RAY OSCILLOGRAPH 157
3. Linear sweep circuits contained in conimercial cathode-ray units
are not calibrated with sufficient accuracy to enable their use as
a standard. The amount of calibration required to enable the
use of the sweep for waveform observation need not be more than
the knowledge concerning the range of frequencies covered by the
band switch positions, but this is certainly not enough for the
calibration of unknown frequencies.
For those who may desire to use some of these patterns, the frequency
ratio is determined by counting the number of loops or peaks and the
number of lines of intersections, and adding “one” to the number of
Fig. 126, left. Pig. 127, right. The pattern in Fig. 126 shows two loops andtwo lines of intersections. By adding one to the number of intersections, theratio of 2-3 or 3-2 is established for the pattern. The five loops and five inter-sections of Fig. 127 indicates a ratio of S-6 or 6-S, by adding one to the
number of intersections.
intersections. In other words, figure 127 shows five loops and five
lines of intersections. The ratio, therefore, is 6-5. Always add one
to the number of lines of interseaions. Figure 126 shows two loops
and two lines of intersections. Adding one to the number of lines of
intersections, makes the frequency ratio 3-2 or 2-3, depending upon the
base frequency with respect to the frequency of the unknown oscillator.
The haziness of the patterns shown in figures 126 and 127 is occasioned
by the fact that the image was in motion when the photographs weremade.
Oscillator Calibration
What is the exact method of calibrating an oscillator? We need notspeak about the frequency ranges possible, because that subject was cov-
ered earlier in this chapter.
Two methods of calibration are possible, using the cathode-ray tubeas the visual indicator. One is to adjust the known and the unknownoscillators so as to produce a 1-1 pattern upon the screen, for which ad-

158 THE CATHODE-RAY TUBE AT WORK
justment the frequency of the unknown oscillator is equal to the known
frequency of the standard oscillator. The other method is to keep the
standard oscillator fixed at one frequency, say the lowest base fre-
quency, and to vary the unknown oscillator through a range which
will produce patterns of from 1-1 to 10-1 ratio, calibrating at eadi ad-
justment of the unknown, in accordance with the frequency ratio in-
dicated upon the screen.
The former of these two methods is to be preferred. First, because
it enables more accurate adjustment at each frequency, since the fre-
quency ratio is 1-1. Second, it minimi2es the error to that existent for
the standard, at that one frequency. If the second method is used and
the base frequency adjustment is "off,” the discrepancy is carried on
through each of the other calibrations based upon the original stand-
ard frequency. However, the second method is faster, in that only
one oscillator is adjusted for a number of frequency calibrations. It is
more economical and perhaps more common because of the minimum
expense involved to secure the single frequency standard. If the
first method is used, each oscillator is advanced step by step. The
closer the calibration points, the greater the number of tuning changes
required.
The degree of accuracy obtained is determined by two factors. First
is the accuracy of the calibration of the standard oscillator for any one
setting. The second is the care with which the unknown is varied in
order to stop the image. Absolute accuracy of calibration is achieved
when the image is stopped. However, it is possible that the drift in one
or the other of the two oscillators being used will prevent the stopping
of the image. At any rate a very slow drift of the pattern is permissible.
The point of calibration should be set as that for which the image has
stopped or is moving at the slowest speed.
The attempt to stop the image, or to bring the pattern into some
even ratio, should be carried out by varying the unknown oscillator
—
never the standard oscillator. The standard oscillator adjustment,
once fixed for any one frequency, should remain fixed.
Interpreting Ratio Patterns
Very little need be said about 1-1 ratio patterns. When these ap-
pear and are stopped, the imknown oscillator frequency is equal to the
standard frequency. If full coverage of the standard and unknown
oscillator ranges is carried out in this manner, there is no need for cal-
culation of any sort. However, if the frequency calibration is carried
out with ratios other than unity, some calculation is required. This cal-

PRACTICAL APPLICATION OF CATHODE-RAY OSCILLOGRAPH 159
culation is not difficult. Operating in this manner, it is best to make
the standard frequency, the base frequency and lower than the unknown
frequency. This means that the patterns will indicate ratios, wherein the
unknown frequency is the greater. Thus if a pattern indicates a 4-1
ratio, the lower frequency is the standard and the high frequency is
the unknown. If the base or standard frequency for this pattern is 100
cycles, the unknown frequency, for the setting which develops the 4-1
ratio pattern is 100x4/1 or 400 cycles. In other words, the base fre-
quency is multiplied by the numerator of the ratio fraction and the prod-
uct of the two figures is divided by the denominator of the ratio fraction.
Thus if the base frequency (standard) is 1200 cycles and is the lower of
the two frequencies which produces the pattern, and the frequency ratio
indicated by the pattern is 4-3, the frequency of the unknown for that
setting is 1200x4/3 or 1600 cycles. For a base frequency of 100
cycles, the following would be the frequency of the unknown for vari-
ous ratios, assuming that in all cases the base frequency is the lower
of the two frequencies.
Ratio Frequency of Unknown
1/1 100 cycles
5/4 125
4/3 133
3/2 150
5/3 167
7/4 175
2/1 200
9/4 225
7/3 233
5/2 250
8/3 267
11/4 275
3/1 300
These thirteen patterns, produced for various base frequencies, will
enable calibration in extremely small steps. Thus suppose that the
thirteen ratios named have been established. By increasing the base
frequency to 300 cycles, as the second adjustment, the ratios listed will
provide calibration points for 300 cycles, 375 cycles, 400 cycles, 450
cycles, 500 cycles, 525 cycles, 600 cycles, 675 cycles, 700 cycles, 750
cycles, 800 cycles, 825 cycles, 900 cycles. By moving the base fre-
quency up to 900 cycles and producing the same ratio patterns, by vary-
ing the adjustment of the oscillator being calibrated, calibration up to

160 THE CATHODE-RAY TUBE AT WORK
2700 cycles is obtained. By advancing the base frequency up to
2700 cycles and producing the same ratio patterns, by adjusting the un-
known, calibration up to 8100 c)rcles can be made, etc.
The frequency ratio can be expressed in two ways: as the ratio be-
tween two integers, as has been done, or as the ratio between a whole
number and a fraction to unity, which requires conversion of the ratio
between the two integers into the ratio between the whole number and
fraction to unity. This conversion is nothing more than dividing the
numerator of the integral ratio by the denominator. This is shown in
the following table:
Integral Ratio Whole Number and Fr
1:1 1 :1
5:4 1 1/4 :1
4:3 1 1/3 :1
3:2 1 1/2 :1
5:3 1 2/3 :1
7:4 1 3/4 :1
2:1 2 :1
9:4 2 1/4 :1
7:3 2 1/3 :1
5:2 2 1/2 :1
8:3 2 2/3 :1
11:4 2 3/4 :1
3:1 3 :1
This can be carried out for any number of ratios. It is necessary that
you understand that these ratios are independent of frequency, that they
apply irrespective of the exact numerical value of the base frequency.
In other words, a 5-4 ratio pattern may exist for a base frequency of
100 cycles, 500 cycles, 2,000 cycles, 50,000 cycles or 1,000,000 cycles,
provided that the arrangement of the equipment is such that these fre-
quencies are those for voltages which are of sufficient amplitude to act
properly upon the electron beam and to cause the required pattern.
Dynamic Tube Characteristics
While it is true that the cathode-ray tube enables determination of the
actual dynamic tube characteristic, we do not believe that it will ever
reach any value in that direction, at least not in the service and allied
fields. This is so, because the nature of the tests required upon vacuum
tubes for field work is such that dynamic data is not necessary. The
present day tube-checking equipment available to the service field and

PRACTICAL application OF CATHODE-RAY OSCILLOGRAPH 161
to the engineer sufEces for all normal purposes. However, since this
volume is intended to convey information concerning the application of
the cathode-ray tube, its use for determining tube characteristics must
be included.
There are numerous types of tube tests which can be made with
the cathode-ray oscillograph. These are grid voltage and plate current,
grid voltage and plate voltage, and plate current-plate voltage tests.
The tests can be made for tubes functioning as detectors, amplifiers or
generators, in other words, oscillators. We have selected as an ex-
ample of such application, tube characteristic tests in which are indicated
the relation between a-c. grid voltage and a-c. plate voltage. As a mat-
ter of fact, this same test indicates grid voltage against plate current,
because the a-c. plate voltage is taken off across a fixed resistor in the
plate circuit of the tube and the a-c. voltage across this resistor is pro-
portional to the plate current.
Fig. 12S. Schematic diagram of cir-
cuit for determining the character-
istics of a vacuum tube. The a-c.
grid voltage actuates the horizontalplates and the a-c. plate voltage or
current the vertical plates.
The method of making this test is to employ the a-c. grid voltage to
provide the horizontal deflection and the a-c. plate voltage or plate
current to provide the vertical deflection. Electrostatic deflection is used,
so that the a-c. voltage developed across the resistor in the plate circuit
supplies the vertical deflection voltage. The schematic wiring diagram
is shown in figure 128. The oscillograph unit is adjusted to enable
the application of signals to the vertical and horizontal plates. Thesweep circuit is not used. Synchronization is not used. Referring to
the schematic wiring diagram, E^ is the grid bias battery; is the plate
voltage battery; resistor is the load resistor; and resistor R is a fixed1000-ohm unit across which is developed die a-c. voltage required forthe vertical deflection.
The amplifiers contained in the cathode-ray oscillograph and feed-
ing the vertical and horizontal plates can be used. By means of the
set-up shown in figure 128, it is possible to determine the effect ofvarying any one of the controlling factors, namely the effect of elec-
tron emission change, grid voltage, plate voltage and load-resistance
change. The tube used for the tests was a type 51. Figures 129, 130
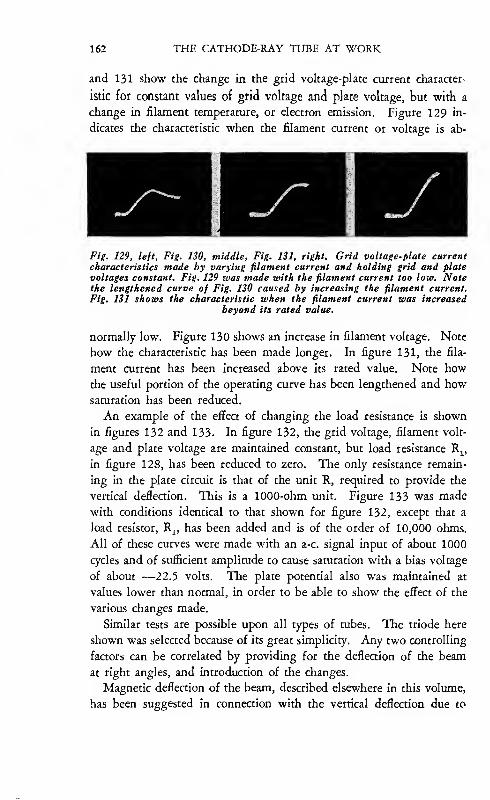
162 THE CATHODE-RAY TUBE AT WORK
and 131 show the change in the grid voltage-plate current character-
istic for constant values of grid voltage and plate voltage, but with a
change in filament temperature, or electron emission. Figure 129 in-
dicates the characteristic when the filament current or voltage is ab-
Fig. 129, left. Fig. 130, middle. Fig. 131, right. Grid voltage-plate current
characteristics made by varying filament current and holding grid and plate
voltages constant. Fig. 129 was made with the filament current too low. Notethe lengthened curve of Fig. 130 caused by increasing the filament current.
Fig. 131 shows the characteristic when the filament current was increasedbeyond its rated value.
normally low. Figure 130 shows an increase in filament voltage. Note
how the characteristic has been made longer. In figure 131, the fila-
ment current has been increased above its rated value. Note how
the useful portion of the operating curve has been lengthened and how
saturation has been reduced.
An example of the effect of changing the load resistance is shown
in figures 132 and 133. In figure 132, the grid voltage, filament volt-
age and plate voltage ate maintained constant, but load resistance R^,
in figure 128, has been reduced to zero. The only resistance remain-
ing in the plate circuit is that of the unit R, required to provide the
vertical deflection. This is a 1000-ohm unit. Figure 133 was made
with conditions identical to that shown for figure 132, except that a
load resistor, R^, has been added and is of the order of 10,000 ohms.
All of these curves were made with an a-c. signal input of about 1000
cycles and of sufficient amplitude to cause saturation with a bias voltage
of about —22.5 volts. The plate potential also was maintained at
values lower than normal, in order to be able to show the effect of the
various changes made.
Similar tests are possible upon all types of tubes. The triode here
shown was selected because of its great simplicity. Any two controlling
factors can be correlated by providing for the deflection of the beam
at right angles, and introduction of the changes.
Magnetic deflection of the beam, described elsewhere in this voliune,
has been suggested in connection with the vertical deflection due to

PRACTICAL APPLICATION OF CATHODE-RAY OSCILLOGRAPH 163
the plate current. This is not as satisfactory as electrostatic deflection,
because of the variation introduced by frequency. Such magnetic de-
Fig. 132, left. Fig. 133, right. Tube characteristics
obtained when the filament, grid and plate voltages wereheld constant and changes made in the load resistance, /?>
of Fig. 12S. The pattern of Fig. 132 was photographedwhen Iti — 0 and that of Fig. 133 when Ri = 10,000 ohms.
flection would consist of the use of a pair of deflecting coils in place
of the resistor R, shown in figure 128. These coils would be arranged
to provide the vertical deflection.
Magnetic Deflection Practice
Despite what has been said about magnetic deflection, you may still
feel that you wish to employ magnetic deflection along the vertical di-
rection. Such being the case, the circuit suitable for such operation
is shown in figure 134. We assume that you will feed the linear sweep
Fig. 134. Circuit for obtaining
vertical displacement by magneticdeflection. Note that the two ver-
tical plates are grounded.
voltage, if such is used, to the horizontal deflecting plates and use a
combination of magnetic and electrostatic deflection. Note that the
free vertical plate is grounded. The sweep voltage connections to the
horizontal plates may be made externally, if an external sweep voltage is
used, or may be made internally, if an internal sweep voltage is used.
In the latter event, ignore the connections shown to the horizontal
plates.
When using magnetic deflection in the vertical direaion, you can-
not make use of the vertical deflection amplifier contained in the
cathode-ray oscillograph. If amplification is required to produce the
required defleaion, such an amplifier must be connected between the
VOf/aqe fnpul Lfor vertical
Deflection

164 THE CATHODE-RAY TUBE AT WORK
source of the signal voltage used for the vertical deflection and the
deflecting coils.
The exact design of the deflecting coils is something into which we
cannot enter. The design of the tube has a controlling influence in this
conneaion. The magnetic sensitivity of all tubes is not alike, so that
for any one voltage input, different types of coils will produce different
results. The important consideration is the ampere turns. In the case
of the Western Electric type 224 tube, with coils 4.3 cm. in diameter
and 4. cm. apart, an anode potential of 400 volts, the magnetic sen-
sitivity was about 1. mm. per ampere turn. At other anode potentials,
the sensitivity would be diflferent. The RCA 904 is rated at 0.8 milli-
meter per ampere turn at 1000 volts applied to anode J2. The coils
suggested for this tube are of 15,000 turns each, air core, with a core
27 mm. by 12 mm. The length of the coil is 27 mm. and its height is
40 mm. The magnetic sensitivity rating of the RCA 906 or its equival-
ents, is not known. It should be understood that the ratings given
herein are those contained in literature relating to the products men-
tioned. As stated, the design of the coils depends upon application.
The coils, shown in figure 24-D, were made for the author, by Ralph
R. Batcher. These coils are rated at about 15,000 turns each and 500
ohms d-c. resistance. Their size conforms with the specifications given
for the coils used with the 904 tube, although we used the coils with
the 906 tube.
As is to be expected, the position of the deflecting coils has a great
effect upon the deflection indicated upon the screen, or the position of
the trace. This effect relates to the size of the deflection as well as the
direction of the deflection with respect to what is the correct deflection
along the "Y” axis, assuming that the coils are being used to produce
the deflection in the vertical direction.
Fig. 135. Theoretically this pat-
tern, obtained with magnetic de-
flection applied vertically andelectrostatic deflection horizon-tally, should be a perfect rectangle,
but it is not, due to tube distortion.
A pattern produced as a result of magnetic deflection along the
vertical axis and electrostatic deflection along the horizontal axis is
shown in figure 135. The solid pattern is due to the fact that the sweep
frequency was made so low that many cycles of the vertical deflection

PRACTICAL APPLICATION OF CATHODE-RAY OSCILLOGRAPH 165
voltage appear upon the screen, to form a solid pattern. The fact that
the image is not a perfect rectangle, is due to the distortion which exists
in commercial tubes, wherein one of the plates of each pair of deflecting
plates is connected to the anode. This is quite a commonplace action
in all commercial cathode-ray tubes, not equipped with separate leads
from each of the deflecting plates. It is to be found with electrostatic
deflections in both directions, as well as with a combination of electro-
static and electromagnetic deflection. (Such distortion, while not a
desirable feature, does not interfere with the routine operation of the
tube, or at least with the routine operation of the cathode-ray oscillo-
graphs described herein.)
Fig. 136. The waveform of the
voltage produced by magnetic de-
flection applied vertically. Thefrequency of the wave is the sameas in Fig. 135, the horizontal sweepfrequency having been changed to
get two cycles on the screen.
An increase in the sweep frequency, in order to show two waveforms
upon the screen, produced the pattern shown in figure 136. (The
vertical deflection, that is, the voltage being observed, was applied
Fig. 137, When the coils are in-
correctly positioned with respectto the horizontal, the resultingpattern on the screen will be at anangle, as is shown on the right.
Fig. 138, left. When the sweepfrequency was increased after thepattern of Fig. 137 was photo-graphed, the three cycles of thewave, shown on the left, indicatethe necessity for having the de-flecting coils properly oriented
with respect to the sweep
through the deflecting coils.) The effect of improperly orienting the
vertical deflection coils, is shown in figures 137 and 138. The former
is the solid pattern, but with the deflection coils turned slightly so that
the beam was deflected improperly. The tilting of the pattern, as a re-
sult of the incorrect orientation of the vettical defleaing coils, with sev-
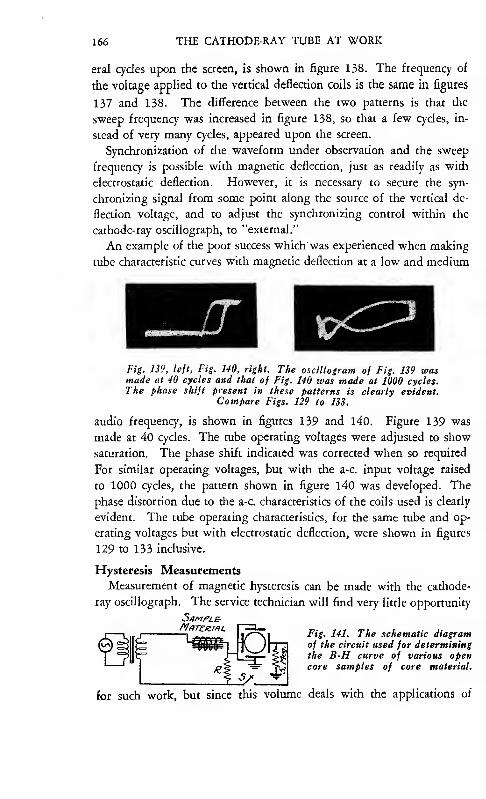
166 THE CATHODE-RAY TUBE AT WORK
eral cycles upon the screen, is shown in figure 138. The frequency of
the voltage applied to the vertical deflection coils is the same in figures
137 and 138. The difference between the two patterns is that the
sweep frequency was increased in figure 138, so that a few cycles, in-
stead of very many cycles, appeared upon the screen.
Synchronization of the waveform under observation and the sweep
frequency is possible with magnetic deflection, just as readily as with
electrostatic deflection. However, it is necessary to secure the syn-
chronizing signal from some point along the source of the vertical de-
flection voltage, and to adjust the synchronizing control within the
cathode-ray oscillograph, to ''external.”
An example of the poor success which'was experienced when making
tube characteristic curves with magnetic deflection at a low and medium
Fig, 139, left. Fig. 140, right. The oscillogram of Fig, 139 wasmade at 40 cycles and that of Fig. 140 was made at 1000 cycles.The phase shift present in these patterns is clearly evident.
Compare Figs. 129 to 133.
audio frequency, is shown in figures 139 and 140. Figure 139 was
made at 40 cycles. The tube operating voltages were adjusted to show
saturation. The phase shift indicated was corrected when so required
For similar operating voltages, but with the a-c. input voltage raised
to 1000 cycles, the pattern shown in figure 140 was developed. The
phase distortion due to the a-c. characteristics of the coils used is clearly
evident. The tube operating characteristics, for the same tube and op-
erating voltages but with electrostatic deflection, were shown in figures
129 to 133 inclusive.
Hysteresis Measurements
Measurement of magnetic hysteresis can be made with the cathode-
ray oscillograph. The service technician will find very little opportunity
Fig. 141. The schematic diagram
of the circuit used for determiningthe B-H curve of various opencore samples of core material.
for such work, but since this volume deals with the applications of

PRACTICAL APPLICATION OF CATHODE-RAY OSCILLOGRAPH 167
the cathode-ray oscillograph, magnetic measurements find their place.
The schematic wiring diagram employed to develop the B-H curve of
various open core samples of core material is shown in figure 141. The
circuit is so arranged that the flux density establishes the vertical de-
flection. The flux is produced by passing alternating current of the
required frequency and sufficient intensity to provide a suitable field
strong enough to deflect the beam. Consequently, the vertical deflec-
tion is indicative of B, or the flux density. At the same time, the
circuit provides for a deflection at right angles to that of the flux density,
Figs. 142, 143, 144, 145 (reading from left to right). These hysteresis curveswere made at 100 cycles. The greater the saturation, the flatter become the
ends of the curve. Fig. 142 indicates the greatest saturation of these fouroscillograms. Note that the area of these patterns (indicating the core loss
due to hysteresis) is less than that of Fig. 147.
and which is proportional to the magnetizing field or the magnetizing
current. This deflection is developed by the voltage drop across the re-
sistor R. The magnetizing current and voltage across this resistor are
in phase.
The sample core material is placed within the solenoid and held
near the neck of the cathode-ray tube, with the face of the solenoid
parallel to the plane of the horizontal deflection plates. Since the
deflection of the beam is at right angles to the magnetic field, position-
ing of the testing solenoid as stated will produce the required vertical
deflection. The switch numbered S is normally closed, this switch being
provided, so that, if desired, the two axes may be produced upon the
screen for photographic purposes. When switch S is open the vertical
deflection alone is on the screen. To produce the horizontal deflection
only, without the vertical deflection, switch S is closed and the solenoid
and core sample are bodily removed from the tube neck.
Sample B-H curves are shown in figures 142, 143, 144, 145, 146 and
147. These are curves as they appear upon the screen, without the
vertical and horizontal axes. They were made at a frequency of 100
cycles. The value of the resistor R is a function of the signal voltage
available. This is so because, with limited input signal voltage, satura-
tion of the core, indicated by departure from a straight line, is controlled

168 THE CATHODE-RAY TUBE AT WORK
by the current limiting action of this resistor. To show the saturation,
we used very low values for R, as low as 10 or 12 ohms. However,
with higher values of input voltage, so that saturation can be estab-
lished by varying the input signal voltage, the value of this resistor mayconveniently be a 100 ohms or more.
The ideal B-H curve is a single straight line. Saturation of the core,
with its detrimental effects, is indicated by the flattening of the ends of
the loop, as indicated in figures 142, 143, 144 and 145. The most
pronounced case of saturation, with respect to the instances being shown,
is that indicated in figure 142. Cases of reduced saturation are indi-
HFig. 146, left, Fig. 147, right. Theamount of saturation in these twooscillograms is appreciably less thanthat shown in Figs. 142 to 145. The coreloss due to hysteresis, indicated by the
size of the area enclosed by the curve,
is fairly large in Fig. 147.
cated in figures 146 and 147. These patterns also indicate the core
loss, due essentially to hysteresis. (This means the loss introduced as
a result of the heat generated because of the molecular change which
takes place during the process of magnetization.) The extent of this
loss is indicated by the area of the loop. The greater the area of the
hysteresis pattern, the greater the hysteresis loss. Thus, core loss due
to hysteresis is indicated in each of the patterns, but figure 147 shows
the greatest amount of core loss due to hysteresis, yet minimum amount
of core saturation.
When making such magnetic measurements, the sweep circuit is not
used. The cathode-ray oscillograph is adjusted so that independent
voltages may be applied to the vertical and horizontal plates through the
amplifiers feeding these deflection plates.
In the event that the cathode-ray oscillograph being used is not
equipped with amplifiers for the two sets of deflection plates, or for
either set of deflection plates, it will be necessary to apply sufficient
signal voltage to the sample coil and rheostat circuits, so that suit-
able deflections are obtained, despite the absence of the amplifiers. The
test frequency is not limited to 100 cycles. It can be whatever frequency
is desired, in accordance with the requirements of the test.
D-C. Voltage Measurements
For this type of work, the cathode-ray oscillograph is essentially a
high resistance voltmeter of universal range. Its adaptability to a-c.
and d-c., depends upon its design. For d-c. voltage measurements, it
is essential that direct connection to the deflection plates be available.

PRACTICAL APPLICATION OF CATHODE-RAY OSCILLOGRAPH 169
This means without any condensers or amplifiers in the circuit. The
adjustment of the cathode-ray oscillograph for d-c. voltage measure-
ments is for the application of independent voltages to either the hori-
zontal or vertical deflection plates. The sweep circuit is not used, nor is
any amplification utilized. Either set of deflection plates may be em-
ployed for d-c. voltage measurements.
It should be stated at the outset that if the oscillograph unit used for
d-c. voltage measurements, contains a spot positioning circuit, this must
be disconnected from the deflecting plates before making any measure-
ments. Of course, no change is required for those oscillographs which
have facilities for making direct connections to the plates and which
do not have spot positioning circuits.
The indication of voltage is the distance that the spot moves from
its normal no-input voltage position. In contrast to a-c. measurements,
wherein a complete line appears upon the screen, the application of d-c.
voltages causes the spot to move, as described in the earlier chapters of
this volume.
The direction of movement of the spot from its normal center posi-
tion, will depend upon the polarity of the voltage applied; that is,
which of the free deflecting plates receives the positive charge. It is
assumed that the grounded plates will be connected to the negative
side of the d-c. voltage source being measured, and that either the free
vertical or free horizontal plate will be connected to the positive side
of the d-c. voltage source being measured. One set of plates is used.
The distance that the spot moves is an indication of the amount of
voltage applied across the plates. How accurately you will be able to
interpret the excursion of the spot in d-c. voltage measurements depends
upon several factors: First, upon how accurately you can measure the
distance. (A calibrated scale, with fine lines and a large number of
divisions per inch, is very helpful for such observation.) The best
means is to use a very fine spot, that is a very small spot, and to measure
from center to center of the spot. The second controlling influence
is accurate knowledge concerning the sensitivity of the tube. At best,
even the manufacturer’s quoted calibrations of so many volts-per-inch
deflection is only an approximation. This sensitivity specification varies
with the manufacturer of the cathode-ray oscillograph. It is also a func-
tion of the operating potentials, that is the voltages applied to the anode
J2. Consequently, tubes of different anode voltage rating, as em-
ployed in the different commercial units, will be rated at different values
of sensitivity.

170 THE CATHODE-RAY TUBE AT WORK
The RCA cathode-ray oscillograph, which employs the 906 tube, is
rated at about 72.5 volts per inch. In other words, if a d-c. voltage of
72.5 volts is applied across either set of plates, the spot will move a dis-
tance of about 1.0 inch from its normal center position. However,
this calibration holds true only if the tube is being operated at the
specified potentials, so that for any type of quantitative work, pre-cali-
bration by means of known values of d-c. voltage is suggested, as a mat-
ter of fact, actually required.
Based upon this rating, it stands to reason that the cathode-ray tube
is not the most satisfactory for low voltage measurements. At the same
time, with definite screen limitations, it is not satisfactory for high
voltage d-c. measurements unless a supplementary voltage divider is
used. The use of a voltage divider, however, cancels the advantage
gained by using the cathode-ray tube, namely an extremely high input
resistance, so that there is no loading effect upon the voltage source. If
a voltage divider is used, in order to adapt the screen limits to the
voltage being measured, it must be of very high resistance, up into the
megohms, in order to retain the high input impedance and freedom
from loading.
Normally, only one half of the screen is available for such d-c. voltage
measurement, because the spot moves away from the center. How-
ever, the complete screen can be made available, by suitably biasing
the spot, so that its normal, no-test voltage input position is one limit
of the screen, instead of the center.
An idea of the sensitivity of the various cathode-ray units can be
had by noting the sensitivity ratings of the various cathode-ray tubes.
Just how closely these ratings correspond with the actual sensitivity of
the tubes, when used in the finished commercial units, is very uncer-
tain. To establish the number of volts required to develop a 1.0-inch
deflection, when the sensitivity in millimeters per volt is known, divide
25.4 by the sensitivity rating, in millimeter per volt. The ratings of
some of the better known cathode-ray tubes available at the time of
this writing are given herewith.
After all is said and done, we feel that the cathode-ray tube is not
very well suited to replace the voltmeter. There are several reasons
why we say this. The first is that the degree of accuracy available with
the standard voltmeters is greater than that available with the cathode-
ray oscillograph, because of the uncertainty of calibration. Second, it is
easier to read low values of voltage upon a calibrated d-c. voltmeter,
and the loading effect is not very great. Third, the sources which sup-

PRACTICAL APPLICATION OF CATHODE-RAY OSCILLOGRAPH 171
Sensitivity Ratings of Various Types of Cathode-Ray Tubes
These ratings of sensitivity obtain at specified values of anode voltage,
and indicate the sensitivity with electrostatic deflection.
Anode
Manufacturer Type Rating mm/volt Voltage
Dumont 34, 34-8, 34-H .38 1000
54, 54-8, 54-H .68 2000
94, 94-8 .79 2000
54-8-C .45 1000
94-8-C .79 1000
94-8-H .85 1000
National Union 908 .38 1000
907 .68 1000
903 .85 1000
907-A .68 1000
RCA 904 .33 1000
.11 3000
.07 4600
905 .38 * 1000
.19 * 2000
.46 ** 1000
.23 ** 2000
906 .33 * 1000
.35 ** 1000
907 .38 * 1000
.19 * 2000
46 ** 1000
.23 ** 2000
908 .41 * 800
.33 * 1000
44 ** 800
.35 ** 1000
* This is the sensitivity rating between the two top plates, that is the
top set of plates.
** This is the sensitivity rating between the two lower plates, that is,
the lower set of plates.
ply high voltage, are not troubled by the loading effect of standard volt-
meters, which are rated at from 1000 to 2000 ohms-per-volt.

172 THE CATHODE-RAY TUBE AT WORK
The schematic wiring diagram for d-c. voltage tests is shown in figure
148. It is best if the voltage to be measured is caused to produce a
deflection in the horizontal direction. Care must be taken when mak-
ing these measurements, because one set of plates goes to ground,
which would ground the negative side of the voltage source being
measured. This is quite in order if that side is normally grounded,
but if the entire voltage source is above ground, the condition must
be recognized when making the test. Note that the unused plate is
grounded.
Fig. 148, left, Fig. 149, right. The schematic diagram of Fig. 148 shows the
connections for making d-c, voltage readings with the cathode-ray tube.
Fig. 149 shows the circuit for measuring direct current, this being calculated
by Ohm’s Law when the voltage drop across R is indicated on the tube’s
screen. Note the grounding of the vertical plates.
Direct Current Measurements
Direct current measurements are made exactly like d-c. voltage meas-
urements. The current to be measured is caused to flow through a
known resistor and the voltage drop across this resistor is measured.
The current then is determined by applying Ohm's law. The circuit
utilized is shown in figure 149. Unfortunately, such operation is very
greatly limited by the voltage sensitivity of the tube. The use of
a low value of R, whereby the insertion of this additional unit into the
circuit would have very little effect upon the actual current in the cir-
cuit, is not very satisfactory, because of the low voltage developed across
the resistor. In certain cases, the influence of a high value of resistance
is immaterial, just as long as it is possible to determine the actual cur-
rent in the circuit, so that a suitable voltage deflection is possible.
However, as in the case of d-c. voltage measurements, we feel that
greater satisfaction will ensue through the use of the standard direct-
current indicating instruments for direa current measurement. Note
that the unused plate is grounded.

PRACTICAL APPLICATION OF CATHODE-RAY OSCILLOGRAPH 173
A-C. Voltmeter
The cathode-ray oscillograph is far more suitable as an a-c. voltmeter
than it is as a d-c. voltmeter. As a matter of fact, it is superior to the
run of standard a-c. meters, but for one thing and that is calibration.
If calibration can be arranged, the cathode-ray oscillograph, employed
as an a-c. voltmeter, affords certain very definite advantages. One of
these is the high input impedance, with minimum loading effect upon
the voltage source being measured. Another is the extremely wide
frequency range, which under certain conditions, can be as high as
100,000,000 cycles. A third advantage is realized when measuring
low values of a-c. voltage. The amplifiers available with the cathode-
ray oscillographs provide very excellent indications, with sufficiently
high input resistance, so that loading of the circuits is reduced to a
negligible minimum.
The image resulting from the application of an alternating voltage
in one direction, that is to one set of deflecting plates, without any
voltage whatsoever applied to the other plates, is a straight line. The
relation between the length of this line and the voltage required to pro-
duce the line, depends upon the voltage sensitivity of the tube. Now,
the voltage sensitivity identifies the magnitude of the deflection of the
beam from its normal center position, in any one direction. When an
a-c. voltage is applied, the excursion of the spot is in two directions,
due to the change in polarity of the voltage during each cycle. Conse-
quently, half of this line is an indicator of the voltage actually applied,
because it indicates the voltage representative of one alternation. The
entire line represents a voltage equal to twice the value actually applied
across the plates.
The deflection of the beam, when an alternating voltage is applied,
is determined by the "peak" voltage, and NOT the root-mean-squate,
or r.m.s. value. Because of the changing polarity of the applied volt-
age, the voltage indicated by the total length of the line, is the peak
to peak value in each complete cycle. The actual peak voltage, therefore,
indicated by the line, is the length of the line times the voltage sensi-
tivity rating of the tube. Thus, if the length of the line is measured and
found to be 2 inches and the tube is rated at 72.5 volts per inch, the ap-
proximate peak to peak voltage, being applied across the plates, is
2x72.5 or 145 volts. This is the voltage between the two peaks. Hence
the peak voltage for one alternation would be exactly half of this, or
the length of the line divided by two and then multiplied by the sen-
sitivity rating of the tube, when expressed in volts per inch deflection.

174 THE CATHODE-RAY TUBE AT WORK
The usual meters used for a-c. measurements indicate the r.m.s., or
root-mean-square value, which is equal to the peak value divided by
1.414. Thus, if the peak value of voltage indicated upon the screen
is 72.5 volts, the actual r.m.s. value is 72.5/1.414 or 51.25 volts. It is
necessary that you realiae the relation between the length of the line
upon the screen and the voltage which causes this image. To determine
the r.m.s. value of voltage, you must do one of two things: Either you
use only half of the total length of the line and divide by 1.414 or you
use the entire length, determine the voltage between the peaks and di-
vide by 2.828 to establish the r.m.s. value.
What has been said applies directly to the deflection plates. If the
voltage being measured is applied directly to the plates, without using
either the vertical or horizontal amplifiers, then the voltage measured
is that which is applied. However, if one of the two other amplifiers
is used, it is necessary to know the gain or amplification taking place
in the amplifier. Without this information, calculation of the actual
voltage being measured is impossible. In sum and substance, and this
presents one of the complications besetting the use of the cathode-ray
tube as an a-c. voltmeter, it is necessary that the amplifiers be calibrated.
At low values of input voltage, it is possible to use the amplifier full on
or wide open and to divide the voltage indicated upon the screen by
the known rated gain of the amplifier. The resultant figure is an ap-
proximation of the a-c. voltage fed into the cathode-ray oscillograph.
Thus, if the voltage indicated upon the screen is 51.25 volts r.m.s. and
the gain of the amplifier used in the circuit is 30, the voltage fed into
the amplifiet is 51.25/30 or 1.708 volt.
Once again, the use of the tube as a voltmeter depends upon the
calibration, knowledge of the exact voltage sensitivity of the tube
and knowledge of the gain of the amplifier, when full on and for vari-
ous positions of the gain control. At the same time, it is necessary
to realize that the manufacturer’s rating of voltage sensitivity and am-
plifier gain is only an approximation. Then again, the amplifiers, when
used, have very definite frequency limits. They are supposed to be
linear in operation over a 20 to 100,000 cycle band, but experience
shows that a variation in amplification exists around the lower and
upper limits, so that if any kind of quantitative work is to be done,
calibration is required. This is really unfortunate, because the cathode-
ray tube as a voltmeter would be a very handy thing when working with
frequencies other than the regular commercial 25 to 60-cycle band.
Speaking about frequency limitations, the amplifiers built into the

PRACTICAL APPLICATION OF CATHODE-RAY OSCILLOGRAPH 175
various commercial cathode-ray oscillographs are good up to about
100,000 cycles. A certain amount of gain is available upon higher
frequencies, but we are tempted to say that 200,000 cycles is the top,
if gain, rather than loss is desired. The previous reference to a voltage
sensitivity of 72.5 volts per inch, refers specifically to the RCA TMV-122-B unit equipped with the 3-inch type 906 tube and operated at
the normal potentials.
Operation at radio frequencies, or frequencies higher than 100,000
cycles, requires additional external amplifiers and we wonder, if, since
these amplifiers are required, it would not be preferable to employ the
old fashioned, but still reliable vacuum-tube voltmeter. After all is
said and done, there are so many salient features found in the cathode-
ray oscillograph, that nothing much is lost, if it cannot be used as a
voltmeter.
For ordinary qualitative or comparative operations, the mbe can be
used as a voltmeter over a very wide frequency band and approxi-
mation of the voltage applied is possible. It is to be understood that
our expressions concerning the utility of the cathode-ray tube a? an a-c.
voltmeter are founded upon practical experience, yet remain just our
own expression, without any intent to contradict statements that the
tube is suitable for calibrated voltage measurements.
When employing the tube for a-c. voltage measurements beyond the
audio-frequency spectrum, it is essential to realize that the input cir-
cuits have resistance and capacity. Just what these constants are, de-
pends upon the mode of application and the specific unit in question.
The input capacity varies from 10 to 15 micromicrofarads when connec-
tion is made directly to the plates. The input resistance across the
plates is about 4.0 to 5.0 megohms. These are the constants for the
Dumont and National Union units mentioned in this volume. Whenthese units are used with the associated internal amplifiers, the input
capacity becomes about 20 to 30 micromicrofarads and the input re-
sistance becomes about 400,000 to 500,000 ohms.
The RCA TMV-122-B, described herein, affords the following
constants when used without the internal amplifiers: input resistance
about 400,000 ohms, and input capacity about 10 micromicrofarads.
With the amplifiers in use, the input resistance is 500,000 ohms and
the input capacity is about 20 micromicrofarads.
When employed for a-c. voltage measurements, the cathode-ray oscil-
lograph must be adjusted for independent voltage applicable to both
sets of plates. Only one set of plates is used for making such measure-

176 THE CATHODE-RAY TUBE AT WORK
ments. The other free plate should be grounded. What can be done
is to short the input terminals to the set of plates which are not In
use. The sweep circuit is not used. Neither is the synchronization
control placed into operation. Either the vertical or horizontal plates
can be utilized. When making such voltage tests, remember that one
terminal of the cathode-ray oscillograph is grounded.
As is to be expected, all obstacles can be overcome if the desire is
sufficiently strong. Calibration of the gain of the deflection amplifiers
in the cathode-ray oscillograph and also of the voltage sensitivity ot the
tube can be carried out without very much difficulty. The 60-cycle
power supply is a very satisfactory source of the test signal.
Calibration can be carried out by applying to the input circuit of
cathode-ray oscillograph, through or around the amplifiers, a known
a-c. voltage. This can be secured from a low voltage a-c. transformer,
or direct from the power supply, with a voltage divider and voltmeter
connected across the supply voltage, so as to establish definitely the
magnitude of the voltage being fed into the cathode-ray tube. By feed-
Fig. ISO. Schematic diagram of the
circuit used for determining the
voltage sensitivity of a cathode-raytube. This is found by measuringthe length of the line on the screen,
noting the voltage on V and follow-
ing the directions given in the text.
ing to the plates, around the amplifier, and noting the input voltage and
the length of the line upon the screen, it is possible to establish the
voltage sensitivity of the tube. The circuit used for such calibration is
given in figure 150. Calibration is carried out by establishing a line,
say two inches long, upon the screen and noting the magnitude of the
voltage (indicated upon V) required to produce this deflection. The
voltage shown upon V, times 1.4 is equal to the voltage sensitivity of
the tube, namely the number of volts (peak) required to produce a
deflection of 1.0 inch.
Thus if the voltage (shown on V) required to produce a line 2.0
inches long is 40 volts, the voltage sensitivity of the tube is 40xl.4l4 ot
56.56 peak volts. The relation between the length of the line and the
voltage sensitivity per inch was described in a previous paragraph.
Once the voltage sensitivity has been determined, it is possible to
calibrate the two deflection amplifiers, or whichever of these amplifiers
is used for voltage measurement. The circuit is shown in figure 151.
The voltage is secured from the 60-cycle power supply through a low
2tcp-up AOOv.

PRACTICAL APPLICATION OF CATHODE-RAY OSCILLOGRAPH 177
voltage step-down transformer with a 3.0 volt output. The 100 ohm
potentiometer will enable variation of the voltage over a satisfactory
range. The voltmeter V indicates the voltage fed into the amplifier.
The amplifier should be operated wide open. The potentiometer
should be adjusted until a 2-inch line appears upon the screen. The
voltage sensitivity of the tube being known, the gain of the amplifier is
equal to Eg /E^, where Eg is the voltage indicated upon the screen and
Ej is the voltage indicated upon the voltmeter.
Fig. ISl. Schematic dia-
gram for calibrating the
gain of the amplifiers
used for voltage meas-urements.
3t£F- Dow/o '3v.
TiZftrrsroie/^c/e-
Calibration carried out in this manner at 60 cycles will be found to be
substantially correct over the range of the amplifier, providing that the
amplifier gain control is full on. The linearity of these amplifiers is
disturbed if the gain control is not full on. This is so at frequencies
higher than 10,000 cycles. If possible, with the equipment available,
calibration can be carried out along similar lines at different fre-
quencies. Furthermore, with the voltage sensitivity of the tube known,
calibration of the amplifier, at various settings of the gain control,
is possible, providing that it is possible to mark definitely the position
of the gain control for each calibration point, so as to be able to return
to that same setting in the future. Referring once more to the linearity
of the amplifier, it has been our experience that variation of the gain
control over a calibrated range is suitable, as has been stated, only up
to about 10,000 cycles, perhaps 15,000 cycles, as the top limit.
A-C. Ammeter Applications
The cathode-ray tube can be used as an a-c. ammeter, by utilizing it
as an a-c. voltmeter with an external shunt. The connection diagram
Fig. 1S2. Schematic dia-
gram for using cathode-ray oscillograph as an
a-c. ammeter.
Current _ ^rt/'cat CfiTU(?p£ Kny
Circuit \5huntOxiiLO^^artl
1 r QrounJ ompt f/er in.
is shown in figure 152. The cathode-ray tube is arranged for inde-
pendent voltages to the horizontal and vertical plates. The vertical

178 THE CATHODE-RAY TUBE AT WORK
amplifier is used. The horizontal amplifier input post is grounded.
The sweep circuit is not used.
The range of current measurements depends upon the: value of the
shunt R. The higher this shunt, the lower is the current range. Thecurrent flow through the shunt is established by noting the: voltage indi-
cated upon the screen and applying Ohm’s law. Care must be taken
when employing the cathode-ray tube in this manner, to realize that the
gain control within the receiver is also shunted across the external
shunt through the blocking condenser. The effect of this shunt upon
the current computation is important when the external shunt is higher
than 100,000 ohms. It is not of any importance when the external
shunt is a low resistance unit, such as 1000 or 2000 ohms. Once more
we suggest the use of the conventional current meters for current
measurement, rather than the use of the oscillograph as a calibrated
current indicator.
Study of Waveforms
One of the most salient features of the cathode-ray oscillograph is
its ability to present waveshapes of current and voltage, for whatever
type of analysis may be required. The subject of waveforms is one of
extreme importance in connection with audio-frequency amplifier opera-
tion, for that matter even in connection with general receiver servicing.
However, the subject of waveform analysis, when considered as a part
of radio servicing, has not been received with a great deal of favor
among those men who are associated with the radio service industry.
The reason behind the negative attitude is quite sound, namely that
the servicing group as a unit is not very familiar with waveform analy-
sis. Admitting this to be so, we still feel that it can be remedied and
that waveform analysis can be employed by the servicing group to
great advantage.
Perhaps the scope of such work is limited to fairly narrow borders,
yet no matter how narrow these borders, it still means advancement of
the servicing industry. Proper application of the cathode-ray tube,
combined with a certain amount of study, will do very much towards
familiarizing the servicing industry with the significance of waveshapes,
other than pure sine waves. There is much truth in the old adage that
"a little knowledge is dangerous”; yet, that little knowledge judiciously
applied can be very helpful. It is our intention to furnish data relative
to the application of the cathode-ray tube, to show how simple facts,
pertaining to waveform analysis, can be established and how this infor-
mation can be used in the servicing field.

PRACTICAL APPLICATION OF CATHODE-RAY OSCILLOGRAPH 179
A complex wave differs from a sine wave in that the former contains
a number of different frequencies, whereas the latter is one frequency
only. Furthermore, a complex wave consists of a number of sine waves.
One of these sine waves is the fundamental frequency and the other
sine waves are harmonics of the fundamental. The shape of the com-
plex wave is determined by a number of different factors. First is the
number of harmonics present, which may be few or many, depending
upon the nature of the equipment being considered. Second is the
relative amplitude of the component frequencies which comprise the
complex wave. The third is the phase relation between the component
frequencies. Passing a sine wave through an electrical network may
cause distortion of the wave, during which process the resultant wave
is no longer sine, but has become complex, because new frequencies
(harmonics), not present in the original wave, have been introduced.
Passing a complex wave through an elearical network may cause dis-
tortion of the wave, in three ways. One of these, known as "frequency
distortion,” is the unequal amplification of the respective component
frequencies, so that the relative amplitudes of the component frequencies
present in the original wave are different in the output from those in
the input. (See the second reason concerning the nature of complex
waves, as mentioned. in the preceding paragraph.) The second form of
distortion of a complex wave is "phase distortion,” wherein the phase
relation between the component frequencies has been changed. Ex-
pressed in a different manner, phase distortion arises from the fact
that a difference in time exists for the passage of the various com-
ponent frequencies, with respect to frequency, through the amplifier.
The third form of distortion is amplitude or non-linear or harmonic
distortion, wherein frequencies, not present in the input, are introduced
into the signal during its passage through the network and appear in the
output. All of these forms of distortion will receive proper attention in
subsequent paragraphs.
The cathode-ray tube lends itself admirably to the study of the de-
velopment of complex waves. It is a relatively simple manner to com-
bine several voltages of different frequency and of sine character, to
establish the resultant complex wave and to note the effect of a change
in the amplitude of the component frequencies. At the same time, it
is also possible to note the characteristics of complex waves with respect
to the even and odd harmonics. Once again we repeat that this text
and these illustrations are not offered as a complete resume of waveform
analysis for the purpose of study; they are offered merely to show the

180 THE CATHODE-RAY TUBE AT WORK
individual, who is in possession of a cathode-ray tube and who is inter-
ested in the subject, how he can develop complex waves and familiarize
himself with their characteristics, in accordance with certain changes.
At the same time, it is possible that these lines may influence the course
of instruction in class rooms.
Admittedly, the cathode-ray tube can be put to good use without this
discourse upon waveform development, but if these few words help
the operator understand the nature of what he sees during the practical
application of the cathode-ray tube, the space devoted will have been
well spent.
Complex Wave Characteristics
Complex waves have certain characteristics. Waves which have a
preponderance of odd harmonics may approach either the square topped
or triangular shaped variety, depending upon the phase relation exist-
ing between the fundamental and the harmonics. In connection with
this reference to square top waves, it is necessary to mention that this
comment should not be confused with the square top wave which is the
result of imperfect vacuum tube operation, wherein the upper and lower
peaks of the signal voltage cycle are cut off, as will be shown later. Anexample of a complex wave, which has a large number of even and
odd harmonics, is the saw tooth wave shown in figures 32 and 35.
Complex waves which contain both even and odd harmonics do not
possess mirror symmetry, whereas complex waves which contain odd
harmonics only, do possess mirror symmetry. By mirror symmetry is
meant that if the top alternation is folded down below the zero line, its
appearance would be like that of the lower alternation.
Development of Complex Waves
Referring once more to the application of the cathode-ray tube for
the development of complex wave images, the circuit used during this
interesting operation is shown in figure 153. Three sine wave output
audio oscillators. A, B, and C, each with its attenuator control, are
joined in series. Each of these affords a range of audio frequencies,
which may be multiples of the other, so that a range from the funda-
mental to the fourth harmonic is available. The amplifier in the oscil-
lograph affords linear operation over the range of frequencies used,
which is from 1000 cycles to 4000 cycles. What is shown to occur at
these frequencies, occurs at other frequencies, providing that similar
conditions with respect to the ratio of component frequencies and rela-

PRACTICAL APPLICATION OF CATHODE-RAY OSCILLOGRAPH 181
live amplitudes, obtain. This amplifier also is free from phase distortion.
The voltage from the three oscillators, connected in series, is fed
to the vertical plates of the cathode-ray oscillograph. The gain control
in the unit determines the si2e of the image upon the screen. The syn-
chronization control is set to "internal” and the sweep circuit is ad-
justed to a frequency equal to about one-fifth of the fundamental, which
in our case is 200 cycles, the fundamental frequency being 1000 cycles.
The gain controls associated with the three audio oscillators, provide
the means of varying the amplitudes of the fundamental and harmonic
frequencies.
By means of the controls, selection of one, two or three oscillators is
possible, so that one, two or three voltages may be fed in series into
Fig. 1S3. Schematic diagram showing how three oscillators are in series to
develop a composite wave. The lowest frequency is the fundamental and the
two other waves are its harmonics.
the oscillograph. This circuit, with one possible exception, that of fixed
phase relation, simulates the component sine wave voltages of a com-
plex wave. That is to say, one of the oscillators. A, may be considered
as the source of the fundamental frequency, oscillator B is the source of
a harmonic and oscillator C, is the source of another harmonic. Thus
if A, is adjusted to 1000 cycles, B to 3000 cycles and C to 5000 cycles,
the composite wave would then consist of the fundamental of 1000
cycles, the 3rd harmonic, 3000 cycles and the fifth harmonic, 5000
cycles. For what we have in mind, we did not feel that it was necessary
to use six or seven oscillators, so as to provide a much wider range
of harmonics.
Figures 154, 155 and 156 illustrate a sine wave of 1000 cycles, its
second harmonic of 2000 cycles and the resultant complex wave, re-
spectively. It is to be noted, that the phase relation between the oscil-
lator voltage is not as fixed as it would be in actual practice, but, foi
any one complex wave photograph, a definite phase relation exists,
and it is possible that that phase relation would exist in practice. As
is evident in figure 155, the amplitude of the 2000-cycle, or 2nd har-
monic, voltage is almost equal to that of the fundamental, or 1000-cycle

182 THE CATHODE-RAY TUBE AT WORK
voltage. The effect of reducing the amplitude of the 2000-cycle, or
2nd harmonic, voltage, but with practically no change in phase be-
tween the two sine waves, is illustrated in figure 157.
A change in phase relation, with the original amplitudes shown in
figures 154 and 155, develops the waveform shown in figure 158. The
lack of mirror symmetry is clearly evident. A reduction in the am-
Figs. 1S4, lejt, ISS, middle, 156, right. A 1000-cycle sine wave, shown in
Fig. 154, and a 2000-cycle sine wave. Fig. 155, result in the composite wave.Fig. 156. Note that the 2000-cycle wave (the second harmonic of the 1000-cycle wave) is almost equal in amplitude to the fundamental frequency.
Compare the amount of the dip in Fig. 156 with that of Fig. 157.
plitudes of the two component voltages and adjustment of the harmonic
frequency amplitude to be equal to about half of the fundamental
frequency amplitude, develops the composite wave shown in figure
159. Note that the amplitude of the 2nd harmonic, the 2000-cycle
voltage, is what develops the dip in the composite wave.
Figs. 157, left, 158, middle, 159, right. The amplitude of the wave in Fig. 155was reduced and caused the reduction of the dip tn' the composite wave of
Fig. 157. Compare Fig. 156. By shifting the phase between the waves jof
Figs. 154 and 155, the composite wave of Fig. 158 was obtained. Fig. 159 wasobtained by reducing the amplitude of the wave of Fig. 154 and making that
of Fig. 155 about one-half its amplitude. Compare Figs. 156 and 157.
A 400-cycle voltage and an 800-cycle voltage, with the latter fre-
quency of an amplitude greater than the fundamental frequency (400

PRACTICAL APPLICATION OF CATHODE-RAY OSCILLOGRAPH 183
cycles),
if we may call it that, develops the composite wave shown in
figure 162. The relative amplitudes of these two component frequen-
cies are shown in figures I6O and 161. Figure I60 illustrates the
fundamental frequency of 400 cycles and figure I6l illustrates the 800-
Figs. 160, left, 161, middle, 162, right. The 400-cycle wave of Fig. 160 has anamplitude smaller than its second harmonic, S0O, cycles. Fig. 161, and a greater
dip can be readily noted in the composite wave of Fig. 162 than those com-posite waves shown in earlier illustrations.
cycle voltage. Note the increase in the depth of the dip, as a conse-
quence of the amplimde of the higher frequency.
The presence of a 1000-cycle voltage and a 3000-cycle voltage of
the relative amplitudes shown in figures 163 and 164 and in a certain
Figs. 163, left, 164, right. A 1000-cycle wave. Fig. 163, and a 3000-cycle wavewere used as fundamental and third harmonic respectively to obtain the
composite waves shown below.
Figs. 165, left, 166, right. The composite wave of the waves shown in Figs. 163and 164, Note the effect on the shape of the composite wave that a shift in
phase has. See Fig. 166.

184 THE CATHODE-RAY TUBE AT WORK
phase relation, develops the composite wave shown in figure 165.
With a slight shift in phase, the composite wave becomes like that
shown in figure 166.
An increase in the amplitude of what would be the third harmonic,
namely the 3000-cycle voltage, develops the composite wave shown in
figure 167. The two component voltages, which make up this comp^
site wave, are shown in figures 168 and 169. The relative amplitudes
are as shown in the two illustrations. The phase relation is practically
Figs. 167, left, 168, middle, 169, right. By increasing the 3000-cycle waveamplitude. Fig. 169, the composite wave of Fig. 167 is obtained. The 1000-cycle wave of Fig. 168 is the fundamental. Compare the composite wave
of Fig. 166.
that which existed when figure 166 was made. Note the increased
depth of the dips in both alternations as a consequence of the increased
amplitude of what may be classified as the 3rd harmonic. At the same
time, note the mirror symmetry of the wave.
Figs. 170, left, 171, middle, 172, right. The 1000-cycle wave. Fig. 170, is the
fundamental and the 4000-cycle wave. Fig. 171, is its fourth harmonic. Thecomposite wave is shown in Fig. 172. Compare with Fig. 167 for changes in
the shape due to the substitution of the fourth for the third harmonic.
Combining two sine waves of 1000 and 4000 cycles, shown in figures
170 and 171 respectively, with the relative amplitudes shown, develops
the composite wave shown in figure 172. Increasing the amplitude of
the 4000-cycle voltage to that shown in figure 173, and with the ampli-
tude indicated in figure 171, develops the composite wave shown in
figure 174. A change in phase relation from that which developed the
waves shown in figures 172 and 174, develops the composite wave
shown in figure 175.
Combining three frequencies, 1000 cycles, 2000 cycles and 3000
cycles, with the relative voltage amplimdes as indicated in figures 176,

PRACTICAL APPLICATION OF CATHODE-RAY OSCILLOGRAPH 185
177 and 178 respectively, results in the composite wave shown in fig-
ure 179. This wave is developed when a certain phase relation be-
tween the various voltages exists. Any change in phase will naturally
change the shape of the wave.
Figs, 173, left, 174, middle, 175, right. The 4000-cycle wave of Fig. 171 wasincreased in amplitude to that shown in Fig. 173 and the composite resulting
from the waves of Figs. 170 and 173, is shown in Fig. 174. A change in the
phase relation produced the composite wave of Fig. 175.
What has been shown in figures 154 and 179 inclusive should be
sufficient to illustrate the application of the cathode-ray tube to the study
of the development of complex waves and the study of the effect of
amplitude variations. We could furnish hundreds of additional photo-
Figs. 176, 177, 178, 179, reading fromtop to bottom. The 1000-cycle waveof Fig. 176 is the fundamental and the
2000-cycle and 3000-cycle waves.Figs. 177 and 178, are the second andthird harmonics respectively. Theircomposite wave, shown in Fig. 179, is
for a certain phase relation, anychange of which will result in achange in the shape of this composite
wave.
graphs illustrating various combinations of frequency and amplitude,
but we feel that the illustrations given will suffice. It is our earnest
hope that service technicians who own cathode-ray oscillographs will
use them for such study as well as for practical service operations.
Amplifier Distortion Measurements
The ability of the cathode-ray oscillograph to portray waveform has
made the instrument of inestimable value in connection with operations
186 THE CATHODE-RAY TUBE AT WORK
carried out upon audio amplifiers. These operations are not limited to
servicing only, but are equally valuable in connection with design work.
The purpose of an amplifier is to magnify the electrical equivalent of
whatever impulse was fed into the unit. The prime requisite of an am-
plifier is to provide in its output circuit a voltage which is identical in
every respect, other than amplitude, to the voltage which was fed into
the amplifier. Functioning as an amplifier, the output voltage should
be greater than the input voltage by an amount dependent upon the
characteristics of the amplifier.
The ideal amplifier must accomplish certain ends. First it must be
equally responsive to all frequencies; that is, it must amplify all fre-
quencies within its prescribed range with equal facility. Accentuation
or attenuation of certain frequencies will cause distortion, known as
'frequency distortion.” The ideal amplifier with a “flat” response
curve is theoretically free of frequency distortion.
This ideal amplifier must not introduce frequencies which were not
present in the original signal that was fed into the unit. Distortion of
this type is known as amplitude, harmonic or non-linear distortion.
By these terms is meant a non-linear relation between the input cur-
rent or voltage and the output voltage. Such non-linearity may be
due to the curvature of the characteristic of the tubes used in the
amplifier or it may be due to the characteristic of the device. Non-
linearity of the input circuit of a tube results when the tube grid is
allowed to swing positive. Non-linearity in the plate circuit of a
vacuum tube results when the operating conditions are such, with par-
ticular reference to the load impedance, that the plate voltage-plate cur-
rent characteristic is curved.
The usual consequences of amplitude, harmonic or non-linear dis-
tortion is the introduction of frequencies not present in the original
signal voltage fed into the amplifier or device. Such distortion need
not originate in the vacuum tubes, but may also arise in iron-core trans-
formers or inductors operated over a large amplitude of magnetization
or when saturation takes place. Such amplitude distortion, due to any
reason, is one of the most important problems relating to audio am-
plifier operation.
The third form of distortion, which may prevent correct performance
of an amplifier, is "phase distortion.” By phase distortion is meant a
change in the phase relation of the component frequencies, during their
passage through the amplifier. Expressed in another manner, phase dis-
tortion is unequal transtnissjon with respect to time of the various fre-

PRACTICAL APPLICATION OF CATHODE-RAY OSCILLOGRAPH 187
quendes passing through the amplifier, so that the phase relation between
two frequendes present in the output is not the same as it was when
that signal voltage was fed into the amplifier. It is to be understood that
such phase distortion may occur without any change in the amplitude
of the component frequencies, or without the addition of any additional
frequencies. Fortunately, phase distortion is not a serious matter in
audio amplifiers, which are used for sound reproduaion, because an
appreciable change in phase may occur, without being recognized by
the ear. However, amplifiers, which are being used for quantitative
waveform observations, as for example with the cathode-ray oscillo-
graph, must be free from phase distortion, otherwise the image, as seen
upon the screen, is not the true picture of the wave under observation.
Each of these forms of distortion may be checked with the cathode-
ray oscillograph. Frequency distortion may be determined by means of
the overall response curve, developed by feeding a continuously variable
frequency signal of constant voltage into the amplifier and develop-
ing the overall curve upon the screen of the cathode-ray tube. Such a
test may be applied to determine the existence of frequency distortion
from any cause, deliberate or otherwise. As a matter of fact, such tests
are described elsewhere in this volume and are applied to establish the
correct operation of those devices, which are incorporated in audio
amplifiers, in order to create a certain amount of frequency distortion.
Amplitude distortion is determinable by observation of the output
waveform, when a sine-wave test signal is applied to the receiver. Any
condition, which will cause non-linear operation, will influence the
shape of the wave and will be readily distinguished. Just how this is
done will be described later.
Phase distortion is checked by feeding a complex signal voltage,
wherein a definite phase relation exists between the component fre-
quencies, and noting the output waveform. Assuming that no amplitude
or frequency distortion exists, a change in waveform will be indicative
of phase distortion.
Considering the forms of distortion which are actually experienced in
audio frequency amplifier operation, we find that a great deal of excel-
lent investigation can be carried on by the introduction of a sine-wave
signal voltage and by observation of the output waveform and compari-
son between the input and output voltage waveforms. While it is true
that all types of distortion are not determinable in this manner, it is
fortunate, nevertheless, that such a simple means of checking affords
such a wide range of applications. This is so, because it minimizes

188 THE CATHODE-RAY TUBE AT WORK
the necessity of analysing complex waves and because it overcomes the
objections of so many men who seem to feel that no information is
possible, unless one is thoroughly conversant with the most complicated
methods of waveform analysis.
The sum and substance of such tests is to establish the presence of
distortion of one form or another. This is possible with the cathode-
ray oscillograph in a manner which cannot even be approached by the
older routines and it is our contention that the service technician is
quite capable of establishing the reason for the distortion, if he knows
that such distortion exists. We admit that the greater the knowl-
edge concerning the operation of the components within an amplifier,
the greater is the amount of information which can be gleaned oscillo-
graphically. At the same time, we also say that with such a tool avail-
able for operation, increased knowledge on the part of the operator is
merely a matter of routine, for now he can establish that which he
guessed at in the past. We are even tempted to say that we prefer
the state, wherein the man can establish such distortion, rather than the
older state, wherein amplifiers were never properly serviced, because the
existing servicing equipment did not provide the means of definitely
determining the presence of distortion.
The routine application of the cathode-ray oscillograph to each stage
in an amplifier enables localization of the fault, even if the operator
knows no more than that the departure of the image from the original
sine wave indicates the presence of distortion in the specific stage of
amplification under investigation. So much for that. Let us now con-
sider various tests upon audio amplifiers.
Checking Audio Amplifier Overload
The application of signal voltages in excess of that permitted by the
operating parameters of the vacuum tubes used in the amplifier, results
in the creation of distortion. Such overloading, when carried beyond
a certain point, becomes noticeable to the listener. However, it is pos-
sible that overloading exists, without becoming noticeable to the lis-
tener. This is so because the generation of harmonics, due to tube over-
loading, is a function of the amount of overloading. Departure from
operation along the linear portion of the tube characteristic results in the
development of harmonics. However, the amplitude of these harmonics
does not reach maximum for slight overload. The greater the over-
load, the greater the amplitude of the harmonics, with the third har-
monic occupying a very dominant position. When these harmonics

PRACTICAL APPLICATION.OF CATHODE-RAY OSCILLOGRAPH 189
reach a certain amplitude, distortion becomes evident to the ear. Until
such time, the listener would have difficulty in noting whether or not
the quality has "gone bad,” despite the faa that overloading exists.
The cathode-ray oscillograph lends itself excellently to the determina-
tion of such overload, even the smallest amount.
The application of excessive signal voltage may result in several
conditions in the vacuum tube circuit, depending entirely upon the
design of the amplifying system. Under certain conditions the grid
may swing positive and draw current. Under other conditions the
amplimde of the input signal voltage may be sufficient to swing the
grid voltage-plate current characteristic beyond the saturation point.
Then again, excessive signal strength may swing the grid voltage past
the cut-off point. All of these effects may be noted, by feeding a sine-
wave voltage into the input circuit and noting the waveshape of the out-
put voltage in each stage or a comparison between the input waveform
and the whole amplifier output waveform.
If the overall output indicates the presence of overload, a supple-
mentary stage-to-stage test can be applied to localize the stage at fault.
Correaive remedies then can be applied.
Simultaneously, or at least with very little additional work, it is pos-
sible to arrange for a pattern which would indicate the relation be-
tween the input and output signal voltages and show overload, without
the necessity of examining the waveform. For that matter, this test
alone, without the waveform test, is sufficient for checking overload.
To illustrate the versatility of the cathode-ray oscillograph for such
work, we have made a number of overload tests of the two types men-
tioned. The second type of test is based upon the fact that when over-
load occurs, the amplifier cannot respond to the full signal voltage
swing. The ease and rapidity with which such tests can be made is
surprising.
The schematic arrangement is shown in figure 180. An audio oscil-
lator of suitable frequency range and sine-wave output is the source of
the test signal. Our tests were made at 1000 cycles. Any other fre-
quency desired by the operator and within the range of the oscillator
may be used. The attenuator provides control of the test signal ampli-
tude. By means of a switch, S-1, the vertical deflection plates may
be joined to the output circuit of the audio oscillator, for checking of
the waveform of the test signal or for providing deflection of the beam
in the vertical direction, when checking for overload. The same switch,
by means of contact B, provides for the connection of the output of the

190 THE CATHODE-RAY TUBE AT WORK
amplifier under test to the vertical deflection plates. When this circuit
is used, switch S-2 is open and the regular sweep circuit in the cathode-
ray oscillograph is brought into play for observation of the output wave-
form. When such waveform tests are made, the synchronizing circuit
within the cathode-ray tube oscillograph is set to ''internal.” As a con-
sequence of the design of certain cathode-ray oscillographs, the switch
S-2 is found within the oscillograph.
lNPuT-ourf>ur voLrftee: «£li9r/e>A/ r£sT.
Fig. ISO. Schematic diagram of apparatus for checking overload of a-f.
amplifier.
With the circuit arranged in such manner (S-1 at B and S-2 closed),
or the cathode-ray oscillograph connected in such manner that the input
voltage causes a horizontal deflection and the output voltage causes a
vertical deflection, the resultant pattern upon the screen takes the shape
of what we may call the input-output signal voltage characteristic of the
amplifier. If overloading is not taking place, the pattern upon the
screen is a diagonal line. If overloading exists, either or both ends of
the line, depending upon the amount of overloading, bends towards the
horizontal. The bending of the end or ends during overload is due
to the fact that the voltage in the vertical direction is not increasing
during that portion of the grid swing (horizontal deflection), when
overload is taking place.
The series of photographs we shall show will illustrate the input-
output voltage operating characteristic and the consequent output wave-
Figs. 181, left, 182, right. The input-output voltage char-acteristic for distortionless operation is shown in Fig. 181.That it is distortionless is shown by the undistorted sine
wave output of Fig. 182.
form, for sine-wave input. We do not think it necessary to repeat the
waveform of the input voltage for each of the other sets of photographs.
Let it suffice to say that a check of the input wave form was made each

PRACTICAL APPLICATION OF CATHODE-RAY OSCILLOGRAPH 191
time that the input signal voltage was increased. This test was purely
a precautionary measure.
Figure 181 is the input-output voltage characteristic for the sine-wave
output shown in figure 182. This would be the equivalent of distor-
Figs. ms, left, 184, right. When the input voltage to the
amplifier was increased, the input-output signal curve ends
flattened a trifle, as shown in Fig. 183. Note the departure
from a true sine wave in the output waveform in Fig. 184.
tionless operation, without overload. The input voltage is increased
and the input-output signal voltage characteristic shows a bending of
one of the ends. The equivalent output waveform is shown in figure
184. Note the flattening of the lower half of the wave, indicating
that cut-off has been reached. (The type of tube used in the first stage,
cut off very rapidly.)
Increase of the signal input developed the characteristic shown in
figure 185, indicating that the positive swing was excessive. A check of
the waveform substantiated this conclusion, as shown in figure 186. In-
Figs. ISS, left, 186, right. A further increase of input to
the amplifier developed the characteristic of Fig. 185.
That the positive swing was excessive was proved by theoutput waveform of Fig. 186.
creasing the signal input developed the input-output signal voltage char-
acteristic shown in figure 187 and the resultant waveform is shown in
figure 188.
Figs. 187, left, 188, right. Increasing the input voltage still
further gave the characteristic of Fig. 187 with the corre-
sponding square-topped wave of Fig. 188.
Such tests are very valuable in the design as well as the servicing
of amplifiers, because correlation with actual voltage input and power

192 THE CATHODE-RAY TUBE AT WORK
output would furnish definite quantitative data concerning the over-
load point.
A similar test applied to an audio amplifier in a receiver established
the results shown in figures 189 to 194 inclusive. The set-up for the
test was the same as shown in figure 180, with respect to the connections
to the oscillograph. The input to the triode portion of the duo-diode-
triode was of a level equal to the amplitude of the rectified signal, re-
sulting from the transmission by a fairly powerful broadcasting station.
Figs. 189, left, 190, right. The input-output signal voltage characteristic of
the a-f. amplifier of a receiver with a medium setting of the volume control,
which was the diode's load, is shown in Fig. 189. The sine wave output is
shown in Fig. 190.
As is happens, this triode received its bias from the diode load re-
sistance. For a medium setting of the volume control, which was in the
grid circuit of the triode portion, the resultant input-output voltage char-
acteristic is shown in figure 189 and the sine-wave output is shown in
figure 190. The frequency is 400 cycles. Advancing the volume con-
Figs. 191, left, 192, right. When the volume control was farther advanced the
ends of the voltage characteristic became slightly flattened, see Fig. 191, anda change from a sine wave is evident in the output wave, see Fig. 192.
trol developed the input-output voltage characteristic shown in figure
191 and the resultant waveform is shown in figure 192. Flattening of
both ends of the voltage characteristic is evident and the distortion in-
troduced is shown in the departure of the output wave from sine shape.
With the volume control wide open, the resultant patterns are shown
in figures 193 and 194. Investigation showed that the diode load re-
sistance, which also functioned as the volume control, was not of the
correct value to supply the required bias at the different signal input

PRACTICAL APPLICATION OF CATHODE-RAY OSCILLOGRAPH 193
levels. It is to be understood that when the input-output signal voltage
characteristic is developed, the sweep circuit within the oscillograph is
not used. Neither is it necessary to make provision for any form of
synchronization.
The proper remedy for the correction of the overload condition is a
matter entirely within your hands; that is the operator. Naturally the
Figs. 193, left, 194, right. The distorted characteristic curve of Fig. 193 wascaused by turning the volume control on full and this, with the distorted out-
put wave of Fig. 194, showed that something was inherently wrong in the
circuit.
proper procedure will be followed. We do not think it necessary to dis-
cuss the corrective measures, in as much as that is routine service pro-
cedure and is not determined by the use of the cathode-ray oscillograph.
The mode of operation outlined as being suitable for the determina-
tion of overload in an audio amplifier is applicable to all types of am-
plifiers, which are supposed to operate in a linear manner, and to all
stages, which are supposed to operate in a linear manner. This refer-
ence is made in order to minimize confusion when such tests are applied
to a single tube of a class-B amplifier, or some type of audio amplifi-
cation other than class-A. What takes place in a class-B stage of am-
plification is described elsewhere in this chapter.
The successful application of the cathode-ray oscillograph to the
determination of distortion in amplifiers depends in a way upon the
knowledge possessed by the operator, for after all is said and done, the
operator must know the manner in which amplifier tubes function whenused under the conditions representative of the different classifications.
Checking I-F. Amplifier Overloading
Overloading of the intermediate-frequency amplifier is a common-
place occurrence, but it is seldom recognized. Time and again service
men have realized the existence of distortion in the output of a radio
receiver, yet no amount of adjustment of the audio amplifier seemed to
help. That is quite natural, since the distortion created as a result of
the overload originates ahead of the second detector. Consequently, no

194 THE CATHODE-RAY TUBE AT WORK
amount of adjustment in the second detector or audio amplifier circuit
is of any aid.
Overloading of the i-f. amplifier system may be caused by several
conditions. First is excessive signal strength for normal values of op-
erating voltage. Such is possible with some of our high powered sta-
tions. Second is normal signal strength, but imperfect operation of the
AVC voltage distribution system, wherein a leak across one of the con-
densers in the circuit forms a voltage divider across the AVC circuit,
thus materially reducing the control voltage applied to the controlled
tubes. Third, is incorrect operating potentials, which may not be
easily determinable because of high resistances in the various circuits.
Fourth is imperfect operation of the AVC tube. Whatever the rea-
son, overload in the i-f. amplifier can be checked by examination of the
modulated wave envelope of the i-f. signal. If desired, the rectified
a-f. signal across the demodulator load may be observed at the same
time. It should be understood that a conclusion drawn from the rec-
tified a-f. signal is not enough, because, as shall be shown later, it is
possible to develop distortion in the demodulator circuit, although the
input to the demodulator is satisfactory in every respect. The examina-
tion of the rectified a-f. signal made concurrently with the examination
of the i-f. wave envelope, is just a supplementary check.
\Mo0ijiATeoAmai /rteiz.
To »,0H o,oc o,jr roC.T» V/HP/Aei£ Aomo
7b t Orv i/oe <?>* T/ r I
%20n
Jl
otrAot i
5^ee» AO'Jt/sreo TOAudio
^ ///<?# s/oe orOertoouiAron io**o
Fig. 19S. Circuit for checking overloading in i-f. amplifiers.
The circuit connections for making the test are shown in figure 195.
A modulated oscillator with proper carrier frequency range and with
a sine-wave audio modulating signal is fed into the receiver. The
level of the modulated carrier fed into the receiver approximates the
normal signal, which would be encountered under different conditions
in the locality where the test is made. It is necessary to check with
a strong carrier in order to establish if the AVC circuits are working
properly.
An i-f. amplifier, of fairly high gain and with plug-in coils so as
to accommodate all intermediate frequencies, is required between the
i-f. system in the receiver and the vertical deflection plates of the cath-
ode-ray oscillograph. This amplifier is required because the vertical

PRACTICAL APPLICATION OF CATHODE-RAY OSCILLOGRAPH 195
defiection amplifier in the cathode-ray oscillograph is not suitable for
amplification of the i-f. signal. The frequency generally is beyond
the range of the oscillograph amplifier. Such a unit as used by the writer
was a two-stage affair, a-c. operated, using type 58 tubes with about 250
volts upon the plate. The i-f. transformers were of the conventional va-
riety and of the plug-in type, so that the proper transformers could be in-
serted for any i-f. peak called for. The coupling to the receiver i-f. am-
plifier was through a .0001-mfd. condenser, or a .0005-mfd. condenser,
in series with a 20,000-ohm resistor. The coupling was kept loose to
avoid regeneration. The lower value of capacity was used for the
higher intermediate frequencies. If the intermediate frequency is less
than 125,000 cycles, the oscillograph amplifier may be used and the
external amplifier is not required. This low intermediate frequency
is not found in many domestic American radio receivers. The amplifier
mentioned, if equipped with plug-in coils covering certain fixed
frequencies in the broadcast band, can be used for checking overloading
in r-f. stages.
As a general rule, it is possible to check for overloading of the
i-f. amplifiers by observing the modulated wave envelope out of the
last i-f. transformer secondary, as applied to the input circuit of the
demodulator tube. The i-f. amplifier is connected across the secondary
of the i-f. transformer and not across the high side and ground, because
in many circuits, the low side of the last i-f. transformer may have a
high resistance in the circuit, between that point and ground. Observa-
tion of the wave envelope as stated is possible, because distortion due
to overloading seldom originates in the mixer tube or ahead of that
circuit. However, to make certain that overloading is taking place
in the i-f. amplifier and not ahead of the i-f. system, provision is madefor checking the wave envelope of the signal out of the first i-f. trans-
former secondary. This is a precautionary measure.
After it has been established that the signal being fed into the i-f.
amplifier is satisfactory, the test amplifier is connected across the input
of the demodulator tube, which, as has been stated, is the equivalent
of connecting the unit across the secondary of the last i-f. transformer.
This statement applies irrespective of the type of i-f. transformer;
that is, if it has but two windings or if it has three windings, or is
tuned or untuned.
It should be noted that whenever the oscillograph or its associated
amplifier is connected across a tuned circuit in the receiver under test,
the circuit must be retuned to resonance by decreasing the trimmer

196 THE CATHODE-RAY TUBE AT WORK
capacity in the tuned circuit. It is also desirable that the leads car-
rying i-f. or r-f. currents be shielded and kept as short as possible.
If the i-f. amplifier is performing properly, there should be no flat-
tening of the peaks of the modulated wave envelope, as shown in figure
196-A. The equivalent a-f. signal, as determined by connecting the
vertical deflection plates of the cathode-ray oscillograph across the de-
Figs. 196-A, left, 196-B, right. When the i-f. amplifier is functioning properly,
the peaks of the modulated wave envelope should not be flattened, see Fig.
196-A. The equivalent a-f. signal, taken across the demodulator load, is
shown in Fig. 196-B.
modulator load, after having disconnected these plates from the test i-f.
amplifier output, is shown in figure 196-B.
Overloading of the i-f. amplifier will be indicated by flattening of
the peaks of the i-f. wave envelope, as shown in figures 197-A and
198-A. The extent that the peaks are cut off depends upon the degree
of overloading and is determined by the reason for the overload. The
degree of overload indicated in figure 198-A is greater than that indi-
cated in figure 197-A. The equivalent a-f. signals, secured from across
the demodulator load circuit, illustrate clearly the distortion introduced
as a result of the i-f. overload. Note the actual loss in a-f. signal am-
plimde as a result of the overloaded condition indicated in figure
198-A. The signal voltage fed into the input of the i-f. circuit is sub-
stantially the same in both cases, yet the a-f. signal output is much less
in figure in 198-B than in figure 197-B. The overload indicated in
these illustrations was due to a leak across one of the condensers in the
AVC. voltage distribution circuit, so that the proper automatic control
voltage was not applied to the i-f. tubes.
When making such wave envelope observations, the voltage to be ob-
served is applied across the vertical deflection plates and the sweep
oscillator in the oscillograph is adjusted just as it would be for ordinary
waveform observation. The frequency of the sweep circuit should be
some submultiple of the modulation frequency; that is, the audio com-
ponent of the modulated wave. To stop the image external synchron-

PRACTICAL APPLICATION OF CATHODE-RAY OSCILLOGRAPH 197
ization should be used and a good place to secure the synchronizing
pulse is from the demodulator load circuit, which arrangement will pro-
vide the audio pulse of a frequency equal to the modulating frequency,
since the rectified voltage developed across the demodulator load circuit
is the audio frequency signal. A 100,000-ohm resistor should be used
. A ""
V W \j
( ^ A ^V \j
Fig. 197-A, top. Fig. 197-B, lower.
The i-f. amplifier was overloaded andthe modulated wave envelope appearsin Fig. 197-A. Note the change in
shape of the a-f. wave in Fig. 197-Bfrom the corresponding a-f. wave in
the oscillogram of Fig. 196-B.
Figs. I98-A top, 198-B, lower. Theamount of overload in the i-f. ampli-
fier was increased above that shownin Fig. 197-A and the modulatedwave envelope resulting is shown in
Fig. 198-A. The corresponding a-f.
waveshape is shown in Fig. 198-B.
in series with the high side of the synchronizing circuit, so as not to
short the demodulator load and to cut down the amplitude of the syn-
chronizing pulse fed into the synchronizing circuit.
In the event that a triode type of demodulator or second detector is
used, a condenser must be connected in series with the high side of the
synchronizing circuit. A .1-mfd. condenser will be found satisfactory.
As far as the vertical deflection plate circuit is concerned for the ob-
servation of the a-f. waveform, the oscillograph circuit should be
checked to see that a condenser is in the "high” circuit, otherwise it
will be impossible to connect the deflection plates across the load circuit
of a triode demodulator, without biasing the spot away from its normal
position. Switch S is set to B for the i-f. wave envelope tests and to
A for the rectified a-f. waveform tests. See Fig. 195.
It is, of course, assumed that once information has been gained to
the effect that overloading is taking place, that suitable effort will be
made to correct the fault. It is possible that the operator, who reads
these lines, may feel that the time required to make such tests is entirely
out of proportion with the information gained. Such is not the case.

198 THE CATHODE-RAY TUBE AT WORK
In the second place, the test is a necessity, for if proper service is to be
rendered, overloading, resulting in distortion, cannot be tolerated, even
if the customer does not notice the poor quality, because he is tone deaf
or has no appreciation of music.
It is also conceivable that the operator does not possess a test signal
generator which will provide a sine-wave audio signal after proper rec-
tification. One should be secured. However, until such time, operation
can be carried out by examining the audio waveform of the audio com-
ponent supplied by the test oscillator and watching for any changes in
the shape of this wave during its passage through the receiver. Also
a test is made to determine the waveform of the modulated signal sup-
plied by the test oscillator. This test is made in accordance with in-
structions given elsewhere in this chapter. Once the correct shape of
the wave envelope is known, changes due to the introduction of distor-
tion or overloading will be detected with comparative ease.
Checking Demodulator Output Waveform
The majority of modern receivers employ diode detectors of one
kind or another. At any rate, the rectified signal is present across the
load upon the diode circuit. To check the a-f. waveform across the
diode load, use the circuit shown in figure 199. The vertical deflection
Fig. 199. Circuit for check-
ing waveform of diodedemodulator output. Thetrap circuit in series with
R and the vertical deflec-
tion plate is to take out
any r-f. that might still bepresent.
plates are connected across the diode load. Since operation is being
carried on at an audio frequency, the vertical deflection plate amplifier
can be used. The linear sweep circuit is placed in operation to spread
the wave. The frequency of the sweep is adjusted in accordance with
the number of cycles of the wave to be observed, which are desired upon
the cathode-ray tube screen. The synchronization control is set to in-
ternal. This circuit is suitable for use with all types of diodes;that is,
full wave diodes;with triodes used as diodes, with the grid and plate
joined; with duo-diode triodes and pentodes, wherein only one diode
plate is used in the rectifying circuit or wherein the two diodes are
tied together and used as a common element.
If a triode type of demodulator is used with a resistance-coupled

PRACTICAL APPLICATION OF CATHODE-RAY OSCILLOGRAPH 199
load, you can use the circuit shown in figure 200. The vertical deflec-
tion plates can be connected across the grid leak of the stage following,
Figs. 199-A, left, 199-B, right. The broadness of the waveshapes tn
199-A indicates that some r-f. is present in the output of the demodulator.
The oscillogram in Fig. 199-B was made after filtering out the r-f. Note the
difference in the peaks.
without influencing the waveform. If the input circuit to the vertical
plates of the cathode-ray oscillograph contains a condenser, the vertical
deflection plates can be connected between the plate of the detector or
Fig. 200. Circuit for de-
termining waveform of
Mode type of demodula-tor output.
= LINEAR.SINEEP
demodulator and ground. The same connections apply if the demodu-
lator tube is transformer coupled to the audio stage following. If no
condenser is in the high side of the vertical deflection plate, a .1-mfd.
unit of suitable voltage rating will suffice.
Checking Phase Distortion
Phase distortion, as has been stated earlier in this volume in con-
nection with audio amplifiers, is not of great interest in ordinary audio
amplifiers employed in receivers. Yet, interest is evidenced in the sub-
ject and the following may be of benefit in connection with a means em-
ployed to check phase shift. Minimization of phase shift is accom-
plished when series reactance and shunt susceptances are negligible,
which is seldom the case in commercial apparatus.
Phase shift or phase distortion can be checked by feeding a com-
plex or distorted wave into a device, noting the waveshape of the
input signal and noting the waveshape of the output signal. Assum-
ing that amplitude or harmonic distortion does not exist and hoping
that frequency distortion or discrimination is at a minimum, the differ-
ence between the two patterns is an indication of the extent of phase
distortion

200 THE CATHODE-RAY TUBE AT WORK
The circuit shown in figure 201 was used for this purpose and the
phase distortion was deliberately introduced by changing the value of
the capacity, with the value of resistance maintained constant. The
SoUK.C£ Of
DuTOUTfO
'1?
-
c 5
1 1
UOMa,!
1CFig. 201. Circuit for check,
ing phase distortion.
.sweep
fundamental frequency was 1000 cycles. The original wave fed into
the phase distorting circuit is shown in figure 202. The coupling ca-
pacity C was made .005-mfd. and the resultant waveform is that shown
in figure 203. With C changed to .01-mfd., the wave shape became
Figs. 202, left, 203, right. The original wave fed into the phase distorting
circuit is shown in Fig. 202. When the condenser C (Fig. 201) was made .00$
mf., the waveform of Fig. 203 resulted.
that shown in figure 204. With C changed to .05-mfd. the wave shape
became that illustrated in figure 205. The gradual approach to the
original waveform is evident. It was attained when C was increased to
.5-mfd.
No doubt a certain amount of frequency discrimination was also
present in the system, but the existence of phase distortion is shown
Figs. 204, left, 20$, right. Further changes were made in the value of C ofFig. 201. When it was increased to .01 mf. the wave shown in Fig. 204 wasobtained and when it was made .0$ mf., the waveform of Fig. 20$ was ob-
tained. Note the similarity of this wave to the original, which is shownin Fig. 202.
nevertheless very conclusively. A very excellent method of checking
phase distortion in amplifiers, known to be free from frequency dis-

PRACTICAL APPLICATION OF CATHODE-RAY OSCILLOGRAPH 201
crimination or frequency distortion, is to pass a fairly linear saw-tooth
wave through the system and note the departure from linearity as a
result of phase distortion.
When making such tests, the voltage to be observed is fed to the
vertical deflection plates. The linear sweep in the oscillograph is ad-
justed to a frequency which will place several cycles of the desired
wave upon the screen. Internal synchronization can be employed.
Having checked phase distortion, the presence of frequency dis-
tortion can be checked by making a frequency distortion test. In this
connection we are very hopeful that the use of the audio-frequency
modulator, described elsewhere in this volume, will be commercially
developed and applied.
Checking A Class "B” Audio Amplifier
We make special reference to this type of system because of the
difference in operation of certain sections, with respect to Class A am-
plifiers. An amplifier, such as we have in mind, as shown in schematic
form in 206. It can be used for ordinary power amplification or for
modulation of a transmitter. Forgetting its utility, what will be said
about the mode of checking through the unit with a cathode-ray
oscillograph is applicable to any such tmits. At the same time, the
mode of progress is applicable to any and all types of audio amplifiers.

202 THE CATHODE-RAY TUBE AT WORK
Referring to the schematic, the two sections of the input 6A6 tube
are used in parallel as a Class A amplifier. The Class B stage con-
sists of the two sections of a 6A6 used in push-pull. The remainder of
the circuit is self-explanatory. The variable load upon the Class B
stage has been arranged in order to adapt the unit to various loads and,
at the same time, to show the effect of various loads. This amplifier is
a part of the "ham” transmitter, which is dealt with in detail later in
this volume.
The test upon the amplifier is made by connecting the cathode-ray
tube across the various important points in the system, so as to deter-
mine operation, by noting the character of the signal which is passing
through the system. The illustrations given herewith show the images
developed by connecting the cathode-ray tube across the designated
points. Such a test can be made upon an amplifier which is considered
to be in good condition, as determined by voltage tests and by the
Figs. 207, left, 208, middle, 209, right. The output wave of the Class A stageis shown in Fig. 207. The input voltage wave to the Class B stage is shown in
Fig. 208. The correct phase relation of 180° between the two voltages to
the Class B input is indicated in Fig. 209.
way in which it operates. The identical test is applicable to an am-
plifier which is not operating as well as it should. The waveform test
should be a routine operation, irrespective of what other tests in-
dicate.
The cathode-ray tube is arranged so that the voltage to be ob-
served is applied across the vertical deflection plates. The vertical
deflection amplifier in the cathode-ray tube is used to adjust the am-
plitude of the image. The linear sweep circuit in the cathode-ray
tube is adjusted to a sub-multiple of the frequency of the test signal,
the exact frequency being determined by the number of cycles desired
upon the screen. Internal synchronization is used. The vertical de-
flection terminals are joined to test leads with prods and these leads
are connected across the various test points; or if desired, two clips
are connected to the test leads and these clips are connected to the
various test points.

PRACTICAL APPLICATION OF CATHODE-RAY OSCILLOGRAPH 203
The first test is the determination of the character of the test signal
input into the amplifier. This is a sine wave, determined by viewing
the waveform upon rhe screen. Assuming correct signal input, the fol-
lowing photographs illustrate the progress through the amplifier. Fig-
ure 207 is the waveform of the output of the Class A stage using the
6A6 tube. The test prods are joined across the plate circuit of the
Class A stage. The input voltage to the Class B stage is shown in
figure 208. Note that the amplitude of this voltage is lower than that
of the signal across the primary of the transformer. This is quite
natural, in thar the input transformer feeding a Class B stage has a
voltage step-down ratio. The sine character of the wave is preserved.
The phase relation between the two voltages applied to the two grids
of the Class B stage is determined by connecting the vertical deflection
Figs. 210, left, 211, middle, 212, right. The waves of Figs. 210 and211 were taken across each half of the input transformer of the Class B stage.
It can be seen that they are identical. The voltage across the primary ofthe output transformer is shown in Fig. 212.
plates between S-1 and ground and the horizontal deflection plates be-
tween S-2 and ground. The linear sweep circuit in the cathode-ray
tube is not used. The cathode-ray oscillograph input circuits are ad-
justed for independent voltages to the two sets of deflecting plates.
Correct phase relation of 180 degrees should exist if proper operation
of the system is to be secured. Such is found to be the case, as indi-
cated in figure 209. The vertical and horizontal axes are shown for
reference. The photograph is a triple exposure. The image which
would normally appear upon the screen is the diagonal line.
A check is made to make certain that the correct voltage exists across
each half of the input winding in the Class B stage, that is across S-1
and ground and across S-2 and ground. The pattern appearing upon
the screen is shown in figures 210 and 211 respectively. As is to be
expeaed in a normally operating system, they are identical.
The nature of the signal voltage across the primary of the output
transformer is determined by connecting the vertical plates across P-2
and P-3 and adjusting the sweep frequency to the proper figure. The

204 THE CATHODE-RAY TUBE AT WORK
resultant pattern is shown in figure 212. A very slight amount of
distortion is indicated in the waveform, but since it is so little, it is
tolerated. The waveform of the voltage appearing across the second-
ary circuit is shown in figure 213. It is to be understood that these
tests were made with the correct load impedance in the secondary
circuit of the output transformer.
Figs. 213, left, 214, right. The waveform of the voltage across the secondarycircuit is shown in Fig. 213. The waveshape of the voltage, showing cut-off,
in the plate circuit of one of the sections of the 6A6 tube in Ike Class B stage.
In a Class B stage of amplification, zero bias is often used and the
operating characteristic is such that no plate current flows, unless a sig-
nal is applied, during which time grid current also flows. However,
some of the tubes used as Class B amplifiers do allow the flow of plate
current with no signal input, so that for low values of signal input, each
stage in the system operates as a Class A amplifier. Cut-off in a Class
A stage is classified as being representative of distortion. In a Class
B stage, such cut-off is quite natural, as is indicated in figure 214. This
is the shape of the signal voltage in the plate circuit of one of the
sections of the 6A6 in the Class B stage, with the associated grid ex-
cited. No signal was applied to the other grid. Note the cut-off. The
final correct output is secured as a result of the presence of the two
tubes in the stage. One tube functions over one portion of the cycle
and the other tube functions over the other portion of the cycle.
Additional Class B amplifier tests are given in a subsequent section.
Distortion In Demodulator
There are occasions when distortion originates in the demodulator
tube, as a result of some kind of defect. One which has been found
of particular interest is given special mention at this time. Incidentally,
its discovery was made during the process of servicing. During the
checking of the receiver in question, it was noted that the audio signal
was distorted and no amount of adjustment was of any avail. Exam-
ination of the i-f. signal envelope established that the waveshape of

PRACTICAL APPLICATION OF CATHODE-RAY OSCILLOGRAPH 205
the signal fed into the demodulator, which was of the diode type, was
satisfactory in every respect. A test of the audio signal, resulting from
rectification in the diode circuit, established that it was distorted, so
that localization of the distottion in the diode circuit was accomplished.
The patterns upon the cathode-ray oscillograph screen, which dis-
closed the trouble, are shown in figure 215. There is no mistaking
Fig. 215. Above is shown the
modulated wave as it came fromthe i-f. amplifier and below is an
oscillogram of the a-f. wave taken
across the diode demodulator out-
put. Note the distortion in the
a-f. wave, indicating that the de-
modulator is not functioning
properly.
the fact that the i-f. wave envelope is satisfactory and that the rectified
signal should be the otiginal sine wave fed into the input of the re-
ceiver in the form of a modulated carrier. The distorted diode output
is shown as the lower photograph.
As to the reason for the distortion, investigation disclosed that the
diode load resistor, which also was the audio volume control unit, had
increased in resistance value from the correct 500,000 ohms to about
3,000,000 ohms. When this unit was changed, the distortion was
eliminated.
The cathode-ray oscillograph is applied in the conventional manner.
The voltage to be observed is applied across the vertical plates. For
observation of the i-f. waveform, it may be necessary to use the ex-
ternal i-f. amplifier described earlier in this chapter. However, if the
intermediate frequency is not higher than 175 kc., it may be possible
to use the vertical deflection amplifier in the cathode-ray unit, if
such an amplifier is available. If sufficient gain is available in the i-f.
amplifier in the receiver, it may be possible to feed the i-f. signal
directly to the vertical plates, without passing through any amplifier.
The sweep circuit is used, that is the linear sweep, and is adjusted
to a sub-multiple of the modulation component frequency, the exact
frequency being dependent upon the number of cycles desired upon
the viewing screen. (See the discussion concerning i-f. amplifier over-
load, presented earlier in this chapter.)

206 THE CATHODE-RAY TUBE AT WORK
For observation of the rectified a-f. signal, the vertical deflection
plates are connected across the demodulator load direct, or through the
vertical deflection plate amplifier. The linear sweep is used and ad-
justed to a frequency dependent upon the number of audio cycles de-
sired upon the screen. Either internal or external synchronization may
be used.
For proper application of such tests, it is essential that the waveform
of the audio signal generated by the test oscillator be known. This
means that the modulated carrier wave envelope of the test signal be
observed and also the audio signal be observed. Facts pertaining to
such tests are given on subsequent pages.
Condenser Power Factor Tests
The cathode-ray oscillograph enables a very rapid comparative test
between condensers, to determine relative power factor or losses. The
circuit used for such tests is shown in figure 216. An oscillator sup-
Fig. 216. Circuit for com-paring power factors or
losses between two con-
densers. Cx is the sampleand Cs is the standard.
plies the test voltage at a pre-determined frequency. We used 1000
cycles. The two condensers, Cs being the standard and Cx being the
unknown, are so arranged that the voltage across the sample being
tested develops the vertical deflection and the current through the sam-
ple develops the deflection in the horizontal deflection, so that the cur-
rent and voltage are 90 degrees apart. The linear sweep in the cathode-
ray oscillograph is not used. If the oscillograph unit is equipped with
amplifiers, both vertical and horizontal amplifiers should be used. If
the unit is equipped with a vertical deflection amplifier only then both
horizontal and vertical deflections should be secured without recourse to
amplifiers in the oscillograph. One amplifier alone should not be used.
If the sample being tested is comparable in electrical efficiency with
the standard, the pattern will be a straight line. The area of the pat-
tern is proportional to the power factor of the test condenser. The
greater the losses in the test condenser with respect to the standard,
the greater the eccentricity of the ellipse. Photographs showing vari-
ous patterns indicative of different degrees of loss in condensers com-
pared with standard samples, are given in figures 217, 218, 219 and
220. Each increase in the area of the ellipse indicates greater losses
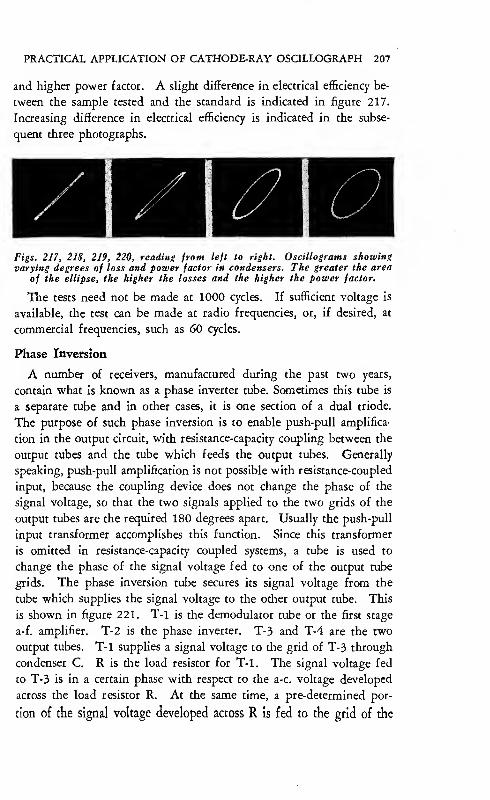
PRACTICAL APPLICATION OF CATHODE-RAY OSCILLOGRAPH 207
and higher power factor. A slight difference in electrical efficiency be-
tween the sample tested and the standard is indicated in figure 217.
Increasing difference in electrical efficiency is indicated in the subse-
quent three photographs.
Figs. 217, 218, 219, 220, reading from left to right. Oscillograms showingvarying degrees of loss and power factor in condensers. The greater the area
of the ellipse, the higher the losses and the higher the power factor.
The tests need not be made at 1000 cycles. If sufficient voltage is
available, the test can be made at radio frequencies, or, if desired, at
commercial frequencies, such as 60 cycles.
Phase Inversion
A number of receivers, manufactured during the past two years,
contain what is known as a phase inverter tube. Sometimes this tube is
a separate tube and in other cases, it is one section of a dual triode.
The purpose of such phase inversion is to enable push-pull amplifica
tion in the output circuit, with resistance-capacity coupling between the
output tubes and the tube which feeds the output tubes. Generally
speaking, push-pull amplification is not possible with resistance-coupled
input, because the coupling device does not change the phase of the
signal voltage, so that the two signals applied to the two grids of the
output tubes are the required 180 degrees apart. Usually the push-pull
input transformer accomplishes this function. Since this transformer
is omitted in resistance-capacity coupled systems, a tube is used to
change the phase of the signal voltage fed to one of the output tube
grids. The phase inversion tube secures its signal voltage from the
tube which supplies the signal voltage to the other output tube. This
is shown in figure 221. T-1 is the demodulator tube or the first stage
a-f. amplifier. T-2 is the phase inverter. T-3 and T-4 are the two
output tubes. T-1 supplies a signal voltage to the grid of T-3 through
condenser C. R is the load resistor for T-1. The signal voltage fed
to T-3 is in a certain phase with respect to the a-c. voltage developed
across the load resistor R. At the same time, a pre-determined por-
tion of the signal voltage developed across R is fed to the grid of the

208 THE CATHODE-RAY TUBE AT WORK
phase inverter tube T-2 through the condenser C-1 and resistor R-1.
The operation of a vacuum tube is such that when a resistive load is
used, the phase of the a-c. signal voltage in the plate circuit is 180 de-
grees out of phase with the a-c. signal voltage in the grid circuit.
Fig. 221. Schematic diagram of an a-f. amplifier employing a phase inverter
tube, which in this case is T~2. Various checks on the voltage as supplied to
the output stage can be made with the cathode-ray oscillograph, as is ex-
plained in the text.
The voltage supplied to the phase inverter tube develops an a-c.
voltage across the load resistor R-4. This voltage is then fed to the grid
of T-4, the other output tube, through the blocking condenser C-2.
Because of the action of the phase inverter tube, the phase of the
voltage fed to the grid of T-4 is 180 degrees out, with respect to the
signal voltage supplied to T-3. By proper selection of constants, it is
assumed that the amplitude of the two voltages fed into the two output
tube grid circuits is the same.
To check the operation of such a phase inversion circuir, several
facts must be established. One of these is that the amplitude of the
voltage output from the phase inverter tube is equal to the amplitude of
the signal supplied from the other tube. The second is that phase in-
version is actually taking place. As it happens, both tests can be
made simultaneously, because, when making the phase inversion rest,
it is possible to note the amplitude of the signal voltage and compare
the voltage supplied by T-1 and that supplied by the phase inverter
tube.
We checked phase inversion by actually observing the waveform.
A distorted wave was fed into T-1. The output wave is shown in figure
222. Note the distortion on the upper peaks. This voltage was meas-

PRACTICAL APPLICATION OF CATHUDE-RAY OSCILLOGRAPH 209
ured across R-2. Then the vertical deflection plates were connected
across R-5. The pattern resulting is shown in figure 223. Note that
the pattern has been shifted through 180 degrees and that the lower
peaks now show the distortion previously evident upon the upper peaks.
Figs. 222, left, 223, right. The wave shown in Pig. 222 was taken across R-2(Fig. 221) and shows distortion deliberately introduced. When the voltage
was taken across R-5, the wave of Fig. 223 was obtained. Note that the dis-
torted peaks are now on the bottom, showing that the wave has been shifted
through ISO", which is the function of the phase inverter tube.
The phase inverter tube has shifted the signal through 180 degrees,
but you will also note that the amplitude of the voltage out of the
phase inverter tube is not the same as that out of the supply tube T-1.
This may be due to any one of a number of defects. It may be due to
defects in the coupling resistor, which feeds a portion of the signal
out of T-1 to the phase inverter tube; or to insufficient amplification
within the phase inverter tube; or to incorrect values of the grid leaks
related to the phase inverter; or to the output tube which receives its
signal voltage from the phase inverter. At any rate, corrective rem-
edies must be applied.
Another way of establishing the operation of the phase inverter tube
is to develop a phase diagram, by conneaing the vertical plates across
the input to T-4. With a signal input into T-1 and the phase inverter
tube in operation, the pattern which appears upon the screen is a
single line indicating a phase difference of 180 degrees between the
two voltages fed into the two output tubes. When making such tests,
the oscillograph is adjusted for independent voltages to the two sets
of deflection plates and the linear sweep circuit is not used.
Checking Test Oscillators
We have made mention of the fact that it is often necessary to know
the character of the signal input into the receiver or amplifier being
tested, If tests are to be made uDon the i-f. system in the receiver, it

210 THE CATHODE-RAY TUBE AT WORK
is essential that the character of the modulated wave output from the
test oscillator being used be known. The same is true about the audio
signal which is generated by the test oscillator. The charaaer of this
signal must be established, so that when waveform observations are
being made in the audio system under test, the operator will knowthe correct shape of the wave. The ideal type of wave for most work
is the sine wave, but when a perfea sine wave is not available, a close
approach will do.
The rated percentage of modulation usually employed in test oscil-
lators is 30, but investigation discloses that the percentage varies over
a range in different units. However, actual percentage of modulation
is not very important. The important thing is to know the character of
the wave, so that operating conditions in the -receiver or amplifier under
test can be established. (Facts pertaining to the determination of the
percentage of modulation are given elsewhere in this volume.)
The exact character of the unmodulated r-f. carrier is not of great
importance, as far as servicing is concerned. The presence of har-
monics in the signal will not cause any complications, providing that
the test set-up is such that these harmonics will not cause beats with
other signals which may be involved in the test.
Tirsr OsciLL»n?ii,Uf/oeiz.
SPECiftL
ftMPaPiEfz
IA-fTOuTPur
JDirecf to Verticofdeffecfion plates.
'I Linearl-3i/eeep
Eycterha/'Synchron,
30r? to lOOtato
Fig. 224. Circuit used for checking the moduIAed and unmodulated carrier
outputs and the a-f. output of a test oscillator.
The method of checking the unmodulated carrier output, modulated
carrier output and audio output is shown in figure 224. For all of
these tests, the voltage or waveform to be observed is applied to the
vertical deflection plates. The linear sweep circuit is brought into play
and external synchronization is preferred. Whether or not the un-
modulated carrier can be spread so as to observe the waveform is a
matter of the upper frequency limit of the sweep in the cathode-ray
oscillograph. The adjustment of the sweep frequency depends upon
the number of cycles desired upon the screen. When checking modu-

PRACTICAL APPLICATION OF CATHODE-RAY OSCILLOGRAPH 211
lated waves, the number of cycles of the modulated wave, which
appears upon the screen, is determined by the ratio between the
sweep frequency and the frequency of the modulating signal. Whenchecking the audio signal waveform, that is, the modulating
signal generated by the test oscillator, the number of cycles which
appears upon the screen is determined by the ratio between the
sweep frequency and the frequency of the audio signal, with the former
being the lower of the two frequencies. The synchronizing signal is
Figs. 225, left, 226, right. A 100-kc. unmodulated carrier was fed to the
special amplifier of Fig. 224 and the streaked pattern of Fig. 225 was obtained.These light and dark horizontal lines in the pattern indicate that harmonicsare present in the output of the oscillator. In Fig. 226 several cycles of this
output wave are shown and the irregularities of the wave can be seen to
correspond with the streaks in the pattern of Fig. 225.
obtained by connecting the high side of the external synchronizing cir-
cuit to the high side of the special amplifier through a 30,000 to
100,000 ohm resistor. The higher the value of this resistor, the better,
for it provides greater freedom from loading of the output circuit of
the amplifier by the input circuit of the synchronizing system.
The character of an unmodulated carrier can be checked roughly by
examination of the pattern formed upon the screen. Figure 225 shows
the pattern resulting from the application of a 100 kc. unmodulated
Figs. 227, left, 228, right. The unmodulated 100-kc. carrier from an oscillatorthat is free of harmonics gives a pattern free of streaks, as is shown in Fig.227. Several cycles of the wave, which was used to obtain the oscillogram
of Fig. 227, are shown in Fig. 228.
r-f carrier to the circuit. Note the streaks in the pattern. Each of
these streaks indicates a kink in the waveform of the signal and denotes
that the wave is not pure, but contains harmonics. This is shown in

212 THE CATHODE-RAY TUBE AT WORK
figure 226, where several cycles of this 100 kc. carrier voltage are
spread by the sweep in the oscillograph. Note the departure of this
carrier voltage waveform from the ideal sine wave.
Figure 227 shows the pattern for an unmodulated r-f. carrier of
100 kc., but which is quite free of harmonics. Note the absence of streaks
in rhe pattern. A few cycles of this voltage are shown in figure 228.
This method of judging the character of an unmodulated carrier is fast
and reasonably accurate, although not necessarily quantitative with re-
spect to the exact amount of distortion present in the voltage wave.
The modulated output waveform is checked by feeding the test oscil-
lator output to the amplifier, as shown in figure 224. The audio sig-
nal is secured directly from the test oscillator, by connecting to the a-f.
output terminals usually provided for that purpose. The vertical de-
flection plates are disconnected from the special amplifier used for the
modulated wave envelope observations and connected to the test oscil-
lator audio output circuit. The amplifier in the cathode-ray oscillograph
can be employed for vertical amplitude control. The synchronization
control upon the oscillograph can be set to internal.
It might be well, if at this time, we mentioned that a superhetero-
dyne receiver, known to be good, can be used to check the character of
the modulated wave output from the test oscillator. If such a receiver
is available, you can dispense with the amplifier mentioned as being
required for amplification of carrier frequencies. During the normal
operation of a superheterodyne receiver, the beat frequency, that is, the
i-f. signal present in the intermediate frequency amplifier, retains all the
characteristics of the original modulated signal impressed across the
antenna-ground terminals. This is so, despite the fact that the carrier
frequency in the intermediate-frequency amplifier is not the same carrier
which was originally applied to the receiver input. Any departure
from regularity in the character of the modulated wave input to the re-
ceiver will be retained by the modulated i-f. signal, so that as far as
observation of such a wave is concerned, it can be examined and judged
by connecting the vertical deflection plates of the cathode-ray oscil-
lograph across the output circuit of the last i-f. transformer, or across
the input circuit of the demodulator.
What was said in the previous paragraph is true only when the
receiver mentioned is known to operate perfectly, with total freedom
from distortion, overloading and all other defects.
If we may be allowed to make a suggestion, we think that a high-
gain amplifier operative over the i-f. band will be found very handy,

PRACTICAL APPLICATION OF CATHODE-RAY OSCILLOGRAPH 213
whereas the receiver arrangement mentioned is suitable for use over
the broadcast and higher frequencies. When such a receiver is used, the
test oscillator output is fed into the antenna-ground system of the re-
ceiver and the output of the standard test receiver is connected to the
vertical deflection plates of the cathode-ray oscillograph.
Before discussing cathode-ray oscillograph patterns, such as you
would see when making tests upon commercial service test oscillators,
we feel that a few words are necessary concerning modulated wave pat-
terns and also the audio signal voltage waveshape.
Fig. 229-A, left. Fig. 229-B, middle. Fig. 229-C, right. A. The wave envelopeof the modulated output of a commercial test oscillator. B. The a-f. output
of the same oscillator. C. The a-f. signal resulting from demodulation of themodulated wave shown in A.
Concerning modulated wave patterns, the design of the majority
of commercial service test oscillators, with possibly one or two excep-
tions, is such that the modulated waveform varies with the frequency
setting of the test oscillator. Recognition of this fact is important,
when tests are to be made at different frequencies. This condition is
illustrated in several photographs. There are a number of reasons
which contribute to this condition, the major being that the amount
of r-f. voltage generated at the different carrier frequencies within the
range of the unit, is not constant; consequently, the relative amplitude
between the a-f. and r-f. voltages is not maintained uniform. As a
Fig. 230-A, left. Fig. 230-B, middle. Fig. 230-C, right. A. The wave envelopeof the modulated output of a commercial test oscillator. B. The a-f. outputof the same oscillator C. The a-f. signal resulting from demodulation of the
modulated wave shown in A.
result of carrier amplitude variations over the frequency range of the
unit, the percentage modulation is a variable. There are other rea-
sons, but our function is to show the application of the cathbde-ray
oacillograph and not discuss the design of test oscillators.

214 THE CATHODE-RAY TUBE AT WORK
A similar condition exists with respect to the audio-frequency signal
available from the a-f. output posts in the test unit and the a-f. signal
out of the demodulator tube in the receiver. Here, too, is a difference,
which must be appreciated, if proper application of the cathode-ray
tube is to be attained. With one or two exceptions, the a-f. output, as
secured from the service test oscillator, is not of the same shape as that
which is seen when the a-f. signal is checked across the demodulator
load in the receiver and which is due to demodulation of the modu-
lated carrier generated by the service test oscillator. This condition is
occasioned by the fact that the character of the audio signal is changed
Fig. 231-A, left, Fig. 231-B, middle. Fig. 231-C, right. A. The wave envelope
of the modulated output of a commercial oscillator. B. the a-f. output of
the same oscillator. C. The a-f. signal resulting from demodulation of the
modulated wave shown in A.
during the process of modulation of the carrier in the test oscillator
and demodulation in the receiver. This condition is the result of the
manner in which modulation of the carrier, generated by the test oscil-
lator, is accomplished. While it is true that the shape of the audio
voltage, generated by the a-f. portion of the test oscillator, remains
the same at all times, (that is, independent of the carrier frequency,
when that signal modulates the carrier,) the resultant wave envelope
may or may not be representative of the actual modulating voltage, de-
pending entirely upon modulating process. Then, when this modulated
wave is demodulated, the resultant a-f. signal is determined by the
characteristics of the modulated wave and not by the basic audio
signal, which was used for modulation in the test oscillator. This, too,
is shown in several photographs.
It is important to realize these facts because of the difference in
the character of the audio pattern which is obtained at the test oscillator
and the pattern developed across the demodulator tube in the receiver.
It would seem as if the normal run of test oscillators is not satisfac-
tory for application with the cathode-ray oscillograph. Such is really
not the case. All that is required is judicious operation of the equip-
ment at hand and full knowledge of what must be done and what is
being done. At the same time, however, we do hope that some time

PRACTICAL APPLICATION OF CATHODE-RAY OSCILLOGRAPH 215
in the future, when cathode-ray oscillographs will have become com-
monplace equipment, service test oscillators in general will operate in
a manner more in keeping with the work which has to be done.
The service test oscillators now in possession of service technicians
can be used for audio work, providing that the basic waveform is estab-
lished by demodulation of the modulated carrier. However, if the test
oscillator is equipped with audio output terminals, it is preferable to
Fig. 232-A, left. Fig. 232-B, middle, Fig. 232-C, right. A. The wave envelope
of the modulated output of a commercial test oscillator. B. The a-f. output
of the same oscillator, C. The a-f. signal resulting from demodulation of the
modulated wave shown in A.
use them as the source of audio signal voltage rather than to feed the
modulated r-f. output of the test oscillator into the receiver and then
use the audio signal resulting from the demodulation of the carrier.
This is so because the demodulated waveform is dependent upon
the frequency setting of the test oscillator. If finances permit, the
most logical plan would be to get a sine-wave audio oscillator, not as
elaborate as the Western Electric a-f. oscillator used for our a-f. tests,
but one cheaper and of a more limited frequency range.
While it is true that the majority of test oscillators in use in the
service field do not generate a sine audio wave, even after demodula-
tion wave form observations can be made, using the cathode-ray oscil-
lograph, if care is exercised when checking the various stages, and if
the operator is familiar with what effects are introduced by certain
types of defects existent in audio amplifiers. At this time, we wish
to make particular reference to the fact that the present day service
units, just as they are, are suitable for all forms of meter testing, such
as alignment with output meter and other types of adjustments, wherein
meters are used as the indicating devices. This means that men who in-
tend buying service test oscillators may feel free to purchase present
day equipment, with the knowledge that they will afford the required
amount of utility.
Referring again to modulated waves, it has been found that the most
important operative band, as far as application of the cathode-ray
oscillograph is concerned, is the i-f. band and the broadcast band up to
about 1500 kc. As it happens, the character of modulated wave en-

216 THE CATHODE-RAY TUBE AT WORK
velopes remains substantially the same over the i-f. band and over the
broadcast band, although in some instances, a change is noted at the
upper and lower limits of these bands. However, application of the
cathode-ray tube for tests, which involve the waveform of the modu-
lated signal, occur at but few frequencies, so that the change in the
character of the wave is not harmful, as long as it is recognized and
realized when work is being done.
Checking for overload ahead of the demodulator is complicated when
the normal envelope of the modulated wave has a flat top, as is the
case with some test oscillators. Few suggestions can be made, other
Fig. 233. The a-f. output of a com-mercial test oscillator. This oscillator
is also responsible for the modulatedpatterns shown in figures 234 to 236
inclusive.
than that another oscillator of superior design is required. It is, of
course, possible to recognize the presence of such distortion, because
either the positive or the negative peaks will be higher than the others,
assuming that the correct output from the oscillator shows even am-
plitude for the peaks.
As to the frequencies used in tests which involve the modulated
wave envelope, one frequency within the broadcast band is usually
sufficient, so that for that one frequency, it is possible to determine
Fig. 234-A, left. Fig. 234-B, right. A. The waveform of the modulated output
of a commercial test oscillator adjusted to 260 kc. B. The a-f. signal resulting
from the demodulation of A.
the character of the wave envelope and the information will hold true
for a band of frequencies both sides of that figure. This signal is
used to check the operation of the mixer tube-oscillator system and
can also be used to check the i-f. system. An average suitable fre-.
quency is about 800 kilocycles. The method of determining the opera-
tion of the mixer-oscillator, in the effort to establish distortion in that

PRACTICAL APPLICATION OF CATHODE-RAY OSCILLOGRAPH 217
system, is mentioned elsewhere in this volume. The character of the
800-kc. modulated signal, or for that matter any frequency within the
stated broadcast band, can be established by utilizing the test receiver,
as described earlier in this chapter.
Examples of the various conditions cited in connection with the
testing of test oscillators is shown in figures 229 to 236 inclusive. The
exact condition depiaed is described in the captions.
The cathode-ray oscillograph can be applied as shown when making
changes upon test oscillators in the effort to produce a unit which will
Fig. 23S-A, left. Fig. 23S-B, right. A. The modulated output waveform of the
same oscillator used for generating waves shown in Fig. 234. The frequencyhere is 600 he. B. The a-f. signal resulting from demodulation of A.
Fig. 236-A, left, Fig. 236-B, right. The same oscillator adjusted to 1000 kc.
has a modulated waveform as shown in Fig. 236-A. The a-f. output resulting
from the demodulation of A is shown in B.
Fig. 236-C, left. Fig. 236-0. The modulated output waveform of the sameoscillator when adjusted to 1700 kc., is shown in C. The a-f. output resulting
from the demodulation of C is shown in D.
be satisfactory in operation. Whether or not the average service tech-
nician or operator feels competent to make changes upon test oscillators
so as to remedy defects, depends entirely upon the individual, but it
stands to reason that if the knowledge possessed by the operator is
sufficient, the cathode-ray oscillograph is the medium which furnishes
the data relative to the efficacy of any change or adjustment, because
it shows what change in output waveform has been effected.

218 THE CATHODE-RAY TUBE AT WORK
As an example of what we have in mind, figures 237, 238 and 239
illustrate various waveforms secured from an audio oscillator, wherein
Fig. 237, left. Fig. 238, right. Two oscillograms obtained from an audio oscil-
lator in which regeneration was excessive and a very high L-C ratio.
regeneration was excessive and the L-C ratio was very high. Reduc-
tion of the L-C ratio and regeneration resulted in the development of
the sine wave shown in figure 240.
Fig. 239, left. Fig. 240, right. The oscillogram of Fig. 239 is the a-f. output
of an oscillator with high L-C ratio and regeneration. The waveform of Fig.
240 is for the same oscillator when the L-C ratio and the regenerationwere reduced.
An added example of the application of the cathode-ray oscillograph
as the tool whereby improvements may be effected, is shown in figures
241, 242, 243 and 244. Figure 241 is the pattern upon the screen
when a distorted 90-kc. unmodulated carrier is observed, with the linear
sweep set to a very low frequency so that a block pattern results. As
stated earlier in this volume, it is possible to distinguish distortion of
the carrier wave by the character of the pattern. If it is solid, without
any of the streaks of greater intensity, as appear in figure 241, the wave-
form usually is sine or a close approach to sine shape. The pres-
ence of the streaks indicates distortion. The wave shown in figure
241, when synchronized with the linear sweep so that a few cycles of
the carrier appears upon the screen, is shown in figure 242.
Corrective remedies applied to the oscillator in the form of a load
placed upon the tickler winding, so that the amount of feedback in the
circuit is reduced, is shown in figures 243 and 244. The block pattern,

PRACTICAL APPLICATION OF CATHODE-RAY OSCILLOGRAPH 219
corresponding to the oscillograph adjustment productive of figure 241,
is shown in figure 243. Note the absence of streaks in the pattern.
The synchronized pattern, showing several cycles of the carrier after
correction and corresponding to the adjustment of the oscillograph for
Fig. 241, left. Fig. 242, right. The light and dark streaks of the pattern in
Fig. 241 indicate that the unmodulated carrier, which was 90 kc., was dis-
torted. When the sweep frequency was increased, so that only a few cycles
of this 90-kc. carrier appeared on the screen, the waveform in Fig. 242showed the distortion that the solid pattern indicated.
figure 242, is shown in figure 244. Note the approach to what is a
sine wave. Actually, the wave is not of sine character. A certain
amount of distortion exists, but the oscillograph served its purpose in
enabling the application of corrective remedies by indicating what was
being accomplished.
Fig. 243, left. Fig. 244, right. After corrective measures were taken with theoscillator used to generate the patterns shown in Figs. 241 and 242, the pat-tern of Fig. 243 indicated that distortion had been removed from the carrier,
because the streaks had disappeared. The oscillogram of Fig. 244 shows thecorresponding carrier wave, which has little of the distortion of Fig. 242.
Many more photographs of such work are possible, but we do not
deem it necessary to consider all types of adjustments upon such units.
Irrespective of the nature of the adjustment, that which has some in-
fluence upon the operation of the device and upon the output voltage
or current waveform, can be checked by examination by means of the

220 THE CATHODE-RAY TUBE AT WORK
cathode-ray oscillograph. The patterns shown in figures 242 and 244
are carrier frequencies within the intermediate frequency band and be-
cause the frequency is within the limit of the vertical deflection ampli-
fier within the oscillograph, external amplification is not required.
The output of the test oscillator, adjusted for unmodulated output, is
connected across the vertical deflection plates through the amplifier.
Hum Measurements
This subject deserves discussion. Once more, we are confronted with
a situation where theory does not coincide with practice because of prac-
tical limitations. The cathode-ray oscillograph lends itself well to ob-
servation of hum voltages, but only if these voltages are of a certain
magnitude. This is so because of the voltage sensitivity limitation of
the cathode-ray oscillograph and because of noise which is inherent in
every radio receiver.
However, it is also fortunate that where hum levels are so low that
they are beyond normal observation by the cathode-ray oscillograph,
they are so low as not to be annoying. At least, such is generally the
case.
As a means of observing the filtering action of any system, the
cathode-ray oscillograph is an excellent medium. But it is necessary
to realize that the average commercial cathode-ray tube, when used
with the amplifiers contained within the cathode-ray oscillograph has
a sensitivity of about 2.0 volts per inch, with the possible exception of
one particular unit, wherein the vertical and horizontal deflection am-
plifiers can be connected in cascade in the vertical deflection circuit
and provide a theoretical sensitivity of about .02 volt per inch. How-
ever, even in this unit, it is difficult to operate both amplifiers wide
open without regeneration and noise troubles, so that the possible satis-
factory maximum sensitivity is about .06 volt per inch. These voltage
limitations, limit observation of hum levels to values which are within
the limits of the tube, so that while the presence of reasonably large
values of hum may be observed, when the hum is attenuated to a certain
value as a result of the filtering action, the cathode-ray tube will not in-
dicate its presence, because the deflection voltage is not sufficient to de-
flect the beam. The consequence is that we must recognize what are
suitable applications of the cathode-ray tube in connection with the
observation of hum voltages.
Another of the limitating factors, which must be recognized, is the
noise in the receiver. As a general rule, the points across which hum

PRACTICAL APPLICATION OF CATHODE-RAY OSCILLOGRAPH 221
is measured are those where noise is also strong and while it is true that
when the system is in normal operation, as for example in a receiver
or an amplifier, the signal completely overshadows the noise, this signal
is missing when the hum test is being made. Consequently, it is im-
portant to recognize that what may be classified as a hum pattern of a
certain level, may be noise also. In addition, cathode-ray tubes used
with amplifiers are quite sensitive to pickup, so that it is possible with
the gaiii wide open to obtain a hum pattern upon the screen, which
is really not the hum from the point being checked, but is stray line
voltage picked up through induction.
We are anxious to clarify our position in making these statements.
We are not repudiating statements made in manufacturers’ bulletins,
but are quoting from actual practical experience.
On the other hand, the cathode-ray oscillograph does perform an ex-
cellent funaion in locating the source of hum and the character of
the voltage, when its amplitude is appreciable, as would be the case in
a defective filter system. It can also be used in establishing if a
carrier, or for that matter the signal, being passed through the sys-
tem, is being modulated at 60 cycles, as a result of hum introduced into
either the grid or plate circuits. Once again, it is necessary that the
Fig. 24S. The oscillogram on the
right shows a SOOO-cycle note,
which, being passed through anamplifier, is modulated at 60 cycles,
because of unbalance in the outputstage.
hum be of appreciable' value, in order to portray its presence upon the
screen. A case of such action is shown in figure 245, where a 5000-
cycle note, being passed through an amplifier, is modulated at 60 cycles,
as a result of unbalance in the output stage. For such tests, it is neces-
sary that a substantial number of cycles of the signal voltage be visible
upon the screen. The linear sweep frequency should be a submultiple
of the hum frequency. The wavy outline of the pattern represents
the hum modulation.
Where the hum is due to faulty operation of the power supply sys-
tem, it can be checked, providing its amplitude is sufiiciently great, by
connecting the vertical deflection plates across the output of the power
supply circuit. In any well filtered system, the hum level at the out-

222 THE CATHODE-RAY TUBE AT WORK
put of the filter is so low as to cause no deflection of the beam. Humobservations are made in a manner identical to normal waveform
observations, with both the linear sweep and the synchronizing control
brought into operation. Ground connections must be perfect so as
to avoid, or at least minimize to the greatest degree, all stray pickup.
The circuit is shown in figure 246.
When checking for hum, the vertical deflection plates are connected
across the point being checked. In very few, if any, cases is the
cathode-ray tube suitable as a voltmeter for hum level measurements.
For such work, the average 1000 ohms-per-volt rectifier type of meter
is preferable.
The nature of the pattern indicative of the hum voltage may be any
one of a number of types. There are so many that it is useless to
show any. A controlling factor is the point at which the hum is being
checked and the harmonic content.
Fig. 246. The vertical plates
of the cathode-ray tube areconnected across the sourceof possible hum, for checkingthe presence of this inter-
ference.
Speaking about the filtering action of the units in a power supply
device, figure 247 illustrates a two-section filter, which is tested along
the following lines in order to establish the value of the various units:
The vertical deflection plate leads, shown in figure 246, would be con-
nected across the common connection and point 1, for the overall hum.Across points 1 and 2, would develop the a-c. voltage across the choke
L-1. Across the common connection and point 2, would develop the
a-c. hum voltage across the output of the first section of the filter.
Across points 2 and 3, with C-1 in the circuit, would develop the a-c.
voltage across the tuned choke. The effectiveness of this resonating
condenser could be established by noting the character and amplitude of
the voltage across L, with C-1 connected and with C-1 disconnected.
The a-c. voltage across the input filter condenser can be established by
connecting the vertical deflection plates across the common terminal
and point 3. The hum voltage is maximum across C and minimum
across C-3.
Frankly the effectiveness of the cathode-ray oscillograph in connection
with hum observation is to determine whether or not the hum origi-

PRACTICAL APPLICATION OF CATHODE-RAY OSCILLOGRAPH 223
nates in the power supply device by checking across the output of the
filter, or by checking to locate hum modulation in the grid and plate
circuits of the amplifier tubes, by feeding a signal of constant frequency
into the audio amplifier and observing the character of the signal vol-
tage across the various elements in the respective grid and plate circuits.
Fig. 247. By checking across the
points numbered 1, 2 and 3 in this
filter circuit by means of the circuit
of Fig. 246, hum can be traced to
its source.
? 5? I'
a y [^1_n
In all such work, it is advisable to determine first the shape of the
a-c. power supply voltage, so that undesired pickup of the power
supply voltage in place of the desired hum, will be recognized when
the image is examined. The character of the hum, due to defective
operation of the filter system or unbalance in an amplifying system,
shows a definite departure from the conventional sine wave of a sine
wave power supply or the distorted wave secured from a motor gen-
erator. This statement should not be taken as positive and applying
in all cases, for in many instances stray voltages may assume all shapes,
even when the stray is picked up from the line, because of the noise
voltage present in the line.
To establish whether or not the hum originates at the point being
checked, and is not due to stray voltage picked up by the connecting
leads to the vertical deflection plates, it is best to check the ground
connection and to turn off the amplifier or receiver being tested. If
the image remains upon the screen when the power supply, amplifier
or receiver under test has been turned off, it is obvious that the voltage,
which produces the image, is a stray.
The effectiveness of the tuned section, that is the resonating con-
denser, shown as C-1 in figure 247, can be tested by connecting the
vertical deflection plates across the output of the filter choke L, in the
position occupied by C-2. In a test power supply device, figure 248illustrates the hum voltage with C-1 disconnected. Figure 249 showsthe pattern secured when the proper value of capacity was connectedacross the filter choke L, for the purpose of resonating the unit andthus securing maximum attenuation. Figure 250 shows the imagewhen the capacity, used to shunt filter choke L, was too high and didnot resonate the circuit to the correct frequency.
When, working with such units, the pattern you may see may not

224 THE CATHODE-RAY TUBE AT WORK
be exactly like those shown here, but no matter what the shape of the
pattern, maximum attenuation will be indicated by a decrease in the
amplitude of the hum voltage.
The effect of core saturation in a filter choke can be determined in
similar manner. In every case where hum level is being measured,
the proper condition is minimum hum. When checking for core sat-
Fig. 24S, left. Fig. 249, middle. Fig. 2S0, right. When the condenser C-1 wasdisconnected, see Fig. 247, the waveshape in Fig. 248 illustrates the humvoltage present. When C-1 was the correct value, the oscillogram of Fig.
249 was obtained. When C-1 was too high, the pattern of Fig. 250 resulted,
as the circuit was not resonated to the right frequency.
uration, the vertical deflection plates can be connected across the out-
put of the filter, between the negative side of the filter and the output
of the filter choke being tested. A variable load resistor must be used
so as to enable variation of the load current, consequently the value
of the direct current flowing through the choke under test. If the
choke saturates, the hum level will increase and will be indicated by
a larger vertical amplitude of the image. In the event that hum is
indicated by a certain wave shape, this shape will change when satura-
tion occurs.
Testing Tone Controls
There are several ways of testing the action of a tone control in an
amplifier or receiver. One of these is to note the attenuation when a
number of different audio frequencies of constant amplitude or voltage
are fed into the stage. When such a test is made, the cathode-ray
oscillograph is being utilized solely as a voltmeter and equally satis-
factory results can be secured with an output meter.
A more satisfactory, although not yet generally practical, system is
to note the effect of the tone control over a continuously variable band
of audio frequencies, the signal being in the form of a frequency
modulated voltage. The system is described in elaborate detail in a
subsequent chapter, devoted to the application of a-f. frequency mod-ulators.

PRACTICAL APPLICATION OF CATHODE-RAY OSCILLOGRAPH 225
The third form of test is more of a design operation than a service
operation. The information gained is that relating to the introduction
of amplitude distortion, rather than frequency distortion, which is the
function of the unit. In certain types of audio amplifier circuits, load-
ing of the circuit and even tuning of the circuit occurs as the tone con-
trol is varied within its limits. Consequently, at certain frequencies,
a change in wave shape, due to amplitude distortion, takes place. For
tests of this type, the cathode-ray oscillograph circuit is adjusted in the
manner normally used to observe waveform. The voltage to be ob-
served is fed into the vertical plates. The horizontal plates are con-
nected to the linear sweep circuit and internal synchronization is
utilized.
Modulation Measurement
The subject is covered in detail in the chapter devoted to the ad-
justment of "ham” transmitters. Amplitude and trapezoid figures are
shown.

CHAPTER VI
ALIGNMENT OF TUNED CIRCUITS
The alignment of a tuned circuit, so as to establish the correct res-
onant state by visual observation, is commonly understood to be the
most valuable application of the cathode-ray oscillograph. Having
read through this volume up to this point, you no doubt appreciate
our statement when we say that observation of resonant circuits is but
one more application of the cathode-ray instrument we are discussing.
It is true, however, that, from the viewpoint of the servicing industry,
it is an extremely important application. In fact, many service tech-
nicians have displayed infinitely more interest in its uses for the pur-
pose of tuned circuit alignment than in its myriad other applications.
Just as a casual comment, let it be known, that visual curve tracing
devices, such as are formed by the cathode-ray oscillograph when used
for alignment operation, have been in use for some time. They are
new in the radio servicing field, but have been used for a long time
in manufacturing plants, in connection with production testing. While
it is true that all of these commercial visual curve tracing devices were
not of the cathode-ray tube variety, they were oscillographic. In-
cidentally, as far back as 1912, Marx and Banneitz used the cathode-
ray oscillograph, with a motor driven condenser and a synchronized
potentiometer-battery type of sweep, for the tracing of resonance curves.
Deflection coils were used in the sweep circuit instead of deflection
plates.
The produaion lines of many receiver manufacturers have been
using the string galvanometer type of oscillograph, modernized, of
course, for the alignment and testing of the various tuned circuits,
which were part of the receivers being produced. Further historical
background is not necessary, for after all is said and done, we are in-
terested in that which now is available for use in the servicing field.
If we analyze the basic underlying principles of the curve tracing
or visual alignment processes employed in connection with cathode-ray
226

ALIGNMENT OF TUNED CIRCUITS 227
tubes, we find them very much like those which apply to other applica-
tions of the cathode-ray oscillograph. It is true that there are various
ways of accomplishing some of the actions which enable operation of
the complete visual aligning system, but the basis of the system has
already been described, although it may not have appeared as such.
If we remember that the image which appears upon the cathode-ray
tube viewing screen, irrespective of its shape, is the result of a deflec-
tion of the beam by means of a varying voltage applied to the deflec-
tion plates, we have the basis for visual alignment system. This, as you
know, is also the basis for the normal operations of the cathode-ray
oscillograph.
There are, however, two additional considerations found in align-
ment systems, which are not involved in the waveform observation op-
erations with the cathode-ray oscillograph. One of these is that instead
of a fixed frequency voltage input to the device under test, as is the
case when observing voltage waveforms, the frequency of the voltage
input varies continuously over a predetermined band. The second con-
sideration is that relating to the frequency of the linear sweep circuit,
which is used in conjunction with alignment operations. Whereas
for normal waveform observation, the frequency of the linear sweep cir-
cuit is adjusted in a certain ratio with the frequency of the voltage
being observed, so as to place a certain number of cycles upon the
screen, for alignment work the frequency of the linear sweep in the
oscillograph is adjusted in accordance with the rate of frequency vari-
ation over the aforementioned band. The actual frequencies being
produced, by whatever device is used to vary the band covered, have
no beating upon the frequency setting of the oscillograph sweep cir-
cuit. Bear these facts in mind as this discussion progresses.
A resonance curve is a graph of the voltage output of a tuned stage
or tuned system with respect to frequency. The voltage output de-
velops the vertical deflection and the variation in frequency is plotted
along the horizontal axis. By synchronizing the sweep with the rate
of speed of the frequency variation, time, as shown along the horizon-
tal or "X” axis, is interpreted in frequency, because, theoretically, the
rate of change in frequency is linear over whatever operating band is
used. The result is that the base of the resonance curve represents
frequency in equally spaced divisions, and makes possible the use of
calibrated scales, graduated in kilocycles.
The above can be said to be the briefest of explantions of whatgoes on during visual alignment with the cathode-ray oscillograph.

228 THE CATHODE-RAY TUBE AT WORK
Naturally, there is much more to the subject and in order to present
most satisfactorily the facts of the matter, we are going to divide the
subject into two parts: the frequency modulator, which is the means
or device whereby the voltage fed into the tuned stage or system is
made to vary continuously over the band;and second, the synchroniza-
tion of the sweep circuit, so as to develop the resonance curve image.
The Motor Driven Frequency Modulated Oscillator
Since a resonance curve is an indication of the manner in which a
tuned stage or system responds to an impressed voltage over a band
of frequencies, one of which is the resonant frequency of the circuit,
it is necessary that voltage be available at frequencies above and below
the resonant frequency. The limits covered by this band, that is the
number of kilocycles below the resonant frequency and the number of
kilocycles above the resonant frequency, are spoken of as the "band-
width.” This test voltage, at a radio frequency or an intermediate
frequency, is secured in the following manner: A constant voltage is
secured from an oscillator at a fixed frequency, determined by the set-
ting of the variable tuning condenser. This fixed frequency is really
variable, since the tuning condenser is a variable, but, for the sake of
clarity, we will classify it as a fixed frequency, because at any one time
it is fixed as the setting of the tuning condenser remains untouched.
This signal voltage at a certain frequency may be secured from a single
oscillator, or may be the difference frequency or beat frequency between
two oscillators, one of which is fixed tuned. Expressed in another
manner, the test voltage may be the output voltage from a single oscil-
lating system, or may be the voltage at the beat frequency resulting
from the heterodyning of one oscillator with another.
Bear in mind that in both of these systems the output voltage is at a
single frequency determined by the tuning. The design of these oscil-
lators is such that the output voltage, while not substantially the same
at all frequencies, is practically constant for a small band of frequencies,
each side of any one setting. To secure such a test signal voltage over
a band of frequencies a device known as a frequency modulator is in-
corporated into the system. This frequency modulator may be a me-
chanically operating device or may be an electrical device. In the
mechanical device, a small variable condenser is connected or ar-
ranged in the tuned circuit. This condenser is continuously rotated by
a small, fractional horse-power motor. As it rotates, the capacity
naturally varies from minimum to maximum and back from maximum

ALIGNMENT OF TUNED CIRCUITS 229
to minimum. Since this condenser is electrically conneaed to the tun-
ing condenser in the oscillator circuit, each variation in capacity varies
the total tuning capacity, hence the frequency of the circuit. While
the frequency modulator condenser rotates, the frequency of the oscil-
lator is being continually varied. The width of the frequency band
thus covered is a function of the circuit capacity change due to the
rotation of the frequency modulator condenser and the change in
frequency of the oscillator output voltage, as a result of the change in
the L-C circuit.
Fig. 2S1. Schematic diagram of a motor driven frequency modulator con-
nected to an oscillator. The oscillator is tuned to the mean frequency of the
circuit under test and the motor driven condenser varies the output frequencyover a predetermined band, say 10 he. each side of the mean frequency.
With suitable calibration it is possible to adjust the oscillator con-
denser to generate a fixed frequency of say 260 kc. and to cause, as
a result of the capacity change in the frequency modulator condenser,
a continuous variation in frequency from 250 kc. to 270 kc., thus pro-
viding a band width of 20 kc., or a 10 kilocycle variation each side of
the mean or periodic frequency. (The mean frequency, which is the
setting of the oscillator and which also is the resonant frequency of the
circuit under test, often is referred to as the periodic frequency.) Asshown in figure 251, which is a simple version of what has been said,
the continuously rotating variable condenser is that contained in the
frequency modulator. The condenser in the oscillator, which is of the
continuously variable type, is not geared to a motor or any other formof drive. It is tuned by hand to whatever periodic frequency is de-
sired and is operated in exactly the same manner as if there were nofrequency modulator unit and a single frequency signal was desired.
Referring to figure 251, the motor and condenser shown withinthe dash line, comprise the frequency modulator unit. It is possible

230 THE CATHODE-RAY TUBE AT WORK
to arrange the frequency modulator condenser with several sections,
SO that two ranges of capacity are available, thereby providing two
band widths for any one periodic frequency. The connection between
the frequency modulator condenser and the tuning condenser within
the oscillator may be made in any manner which is convenient and
which will remain constant. The oscillator circuit shown is by no
means an example of any one commercial oscillator system. It is a
simple oscillator shown solely for illustrative purposes.
The exact band width desired depends upon the nature of the
tuned circuit or stage being investigated. A controlling influence is
the frequency band width rating of the circuit under investigation.
Fortunately, the majority of tuned circuits or stages associated with
such devices, are rated at from 5 kilocycles each side of the periodic
or resonant frequency to about 10 kilocycles each side of the resonant
frequency, so that by arranging a system whereby these two band widths
are available, complete coverage is secured, with possibly two adjust-
ments of the frequency modulator capacity range. Whatever the band
width of the frequency modulated system, it should always be at least
25 percent greater than the rated band width or band pass of the
tuned circuit or system being investigated. This is desired so that the
base of the resonance curve will be established as a reference point,
even when circuit conditions are such that tuning is broader than
normal.
We made reference to the fact that the band width achieved was
a function of the relation between the total circuit capacity at any one
periodic frequency setting of the tuning condenser and the change in
total circuit capacity as a result of the rotation of the frequency modu-
lator condenser. It, therefore, stands to reason that the higher the
periodic frequency, or the higher the frequency setting of the oscillator
circuit, the greater the band width when the frequency modulator
condenser is applied. This is so because a uniform percentage change
in frequency, as a result of a uniform change in circuit capacity, is
greater in actual number of kilocycles, the higher the mean frequency.
It further stands to reason that the lower the basic circuit capacity,
the greater the band width, when the frequency modulator condenser
is set into operation. The reverse is also true. This is so, because,
with a fixed maximum value for the frequency modulator condenser,
the change in total circuit capacity is greater, the smaller the basic
circuit capacity and naturally smaller, the greater the basic circuit
capacity. It is important to remember this variation in band width

ALIGNMENT OF TUNED CIRCUITS 231
experienced with single oscillator equipment of this type, because
other arrangements are also used, wherein constant band width exists
upon all frequencies.
An idea of what is meant by an increase in band width with fre-
quency is as follows: Suppose that operation of the frequency modu-
lator condenser results in a 6-percent change in frequency at 260 kc.
and at 1000 kc. In the former instance, the total band width will be
15.6 kc. or the frequency limits for a mean frequency of 260 kc., will
be 252.2 kc. to 267.8 kc. When set to 1000 kc., the total band width
is 60 kc. and the frequency limits would be 970 kc. and 1030 kc. Thus,
the single oscillator used with a motor driven frequency modulator
condenser, can be classified, for the want of a better name, as a variable
band width frequency modulator.
Fig. 2S2. Schematic diagram of a beat frequency oscillator which is frequencymodulated by the motor driven variable condenser in the lower left corner
of the diagram. This type of oscillator, when frequency modulated, providesa band width that is constant for any output frequency.
In contrast to the single oscillator type of frequency modulated
source of test signal, there is in use the dual oscillator system, operated
with a motor driven frequency modulator condenser, whereby a con-
stant band width is secured. This is the beat frequency unit men-
tioned earlier in the text. Operation of the system can best be com-
prehended by referring to the elementary circuit shown in figure 252and the following explanation.
THE CATHODE-RAY TUBE AT WORK^32
The circuit consists of two oscillators, a mixer tube and the motoi
driven frequenqr modulator. One of these oscillators, say Osc. 1, is
fixed tuned at some frequency, say 700 kc. Connected across the tun-
ing condenser of this unit is the motor driven frequency modulator
condenser. The capacity of the rotating condenser is so designed that
when in operation, the mean frequency of the oscillator is 700 kc.
and the frequency limits of the output ate 690 kc. and 710 kc., a
band width of 20 kc. or 10 kc. each side of the mean frequency. In
effect this oscillator is a frequency modulated r-f. oscillator, fixed
tuned to 700 kc. and frequency modulated over a 20 kc. band.
As is evident, provision is made to feed the frequency modulated
output voltage to one section of a 6A7 tube. It is to be remembered
that the circuit shown does not contain all of the frills and filters ac-
tually found in the commercial units. The circuit in figure 252 is the
basic operating system. The diagrams of the commercial frequency
modulated r-f. oscillators will be shown later in this chapter.
Oscillator 2 is the continuously variable frequency unit. This is the
one which employs the wave changing mechanism, so that it may be
tuned over the entire i-f., broadcast and high-fr.equency or short-wave
spectrum. The tuning condenser in this unit is operated by hand, just
as if it were a conventional oscillator without even the remotest asso-
ciation with any frequency modulating condenser. As is shown in the
diagram, the output of the oscillator is fed to the mixer tube through
a suitable attenuating system. The 6A7 in this case is used as a mixer
tube only. One of the oscillators feeds into one of the control grids,
grid number 1, and the other oscillator feeds into the other control
grid, grid number 4.
Let us say that oscillator 2, the continuously variable unit, is ad-
justed to 960 kc. When this is done, two signals are fed into the
mixer tube. One of them is of 960 kc. and the other is the 700 kc
signal frequency modulated over a 20 kc. band. These two voltages
are mixed and as a result of rectification, there is present in the plate
circuit of the 6A7, a voltage which varies in frequency from 250 kc.
to 270 kc., or a 260 kc. signal, the beat frequency, which is frequency
modulated over the 20 kc. band, or 10 kc. each side of the mean fre-
quency. This frequency modulated signal is produced because one of
the signals fed into the mixer is modulated plus and minus 10 kc.
We might mention that the selection of a 20 kc. band width for the
frequency modulation of the fixed oscillator, is purely illustrative. It
can just as readily be 10 kc. or 30 kc.

ALIGNMENT OF TUNED CIRCUITS 2ii
As a result of the fixed relation between the frequency modulating
condenser capacity and the circuit capacity of the fixed frequency oscil-
lator, the band width of the frequency modulated signal is constant,
at whatever the design provides. Since the beat signal retains the
modulation characteristics of the modulated signal, which is mixed
with the sine-wave signal, the output beat voltage, irrespeaive of
frequency, will retain the same modulation characteristics, which in
this case means modulation at plus and minus 10 kc. This is how the
band width of the frequency modulated output of this dual oscillator
arrangement is constant at whatever the design provides.
Electrically Operated Frequency Modulated Oscillators
In contrast to the motor driven condenser type of frequency modu-
lator, several units are in use, wherein frequency modulation is se-
cured without the use of a motor driven condenser. One such system
is used in the Egert unit. Two oscillators are used to produce the
constant band width frequency modulated signal, just as in the motor
driven affair, illustrated in figure 252, except that the motor driven
frequency modulating condenser is replaced by an electrical circuit.
Fig. 253. Schematic diagram of a frequency modulated oscillator, wherein the
spreading of the frequency over a band is accomplished by using the variation
in permeability of the iron core in the No. 2 oscillator oscillation transformer.
The process of beating a variable frequency oscillator against a fixed
frequency oscillator is the same. An idea of how this elearically
operated type of frequency modulator develops the modulated wave
can be gathered from figure 253 and the following text. The circuit
shown is basic and is offered solely for illustrative purposes. Thecomplete circuit of the Egert unit is given later in this chapter.
234 THE CATHODE-RAY TUBE AT WORK
Oscillator number 1 is the variable frequency unit, which covers
the various bands. Oscillator number 2 is the fixed frequency oscilla-
tor, which is frequency modulated over a constant band width, say
20 kilocycles. Oscillator number 1 uses the oscillator portion of a
6A7 tube. The mixer or pentode portion of this same tube receives
the frequency modulated output of oscillator number 2, so that the
two signals are mixed and, as a result of the rectifying action within
the tube, the plate circuit contains the difference frequency modulated
plus and minus 10 kc.
If you examine the wiring diagram, you will also note two sig-
nificant facts: First the presence of an iron core for the oscillator
number 2 coils. Second, the use of a rectifier and that a portion of the
a-c. voltage present across the input condenser is fed into the oscilla-
tion transformer used in oscillator number 2.
This iron core and the rectified a-c. voltage serve to frequency mod-
ulate the output of the fixed frequency oscillator, by employing the
variation in permeability of the iron core to change the frequency of
the oscillations generated by oscillator number 2. The winding con-
nected to the power supply furnishes a magnetizing current, which
varies at the frequency of the a-c. voltage across condenser C. Since
the rectifier is a half-wave system, this magnetizing current varies 60
times per second or at whatever the frequency of the power supply
may be. By suitable design of the iron cored oscillation transformer,
operation upon the straight portion of the permeability curve is se-
cured. The normal permeability of the iron core establishes a fixed
inductance for the oscillation windings and the oscillator circuit is
tuned in the regular manner, except that, since a fixed tuning con-
denser is used, the resonant frequency is fixed and is of a single value.
Now, when an a-c. voltage is established across condenser C, current
will flow through coil L and the magnetizing current will change the
permeability of the iron core and influence the inductance of the oscil-
lator number 2 winding, thereby changing the frequency of the output
voltage from oscillator number 2. Since the magnetizing current se-
cured from the power supply is a varying current, the frequency of
oscillator number 2 varies over a range and by designing the magnet-
izing current supply circuit and the iron core so that the current and
the permeability varies between pre-determined limits, the frequency
of oscillator number 2 will also vary between pre-determined limits.
In the actual unit, the band width provided is 22 kilocycles, or 11 kilo-
cycles each side of the mean frequency.

ALIGNMENT OF TUNED CIRCUITS 235
Since this signal is of constant band width and is fed into the mixer
tube, where it beats against the variable frequency oscillator, the re-
sultant beat frequency signal is a frequency modulated signal of the
stated band width, without the use of a motor driven condenser.
Another type of r-f. frequency modulation, which is electrically
operated and which does not use a motor driven frequency modulating
condenser, employs the dynamic input capacity of a tube to vary the
frequency of the oscillator output. According to information we can
gather, a voltage secured from the 60-cycle power supply varies the
operating potentials upon the auxiliary tube. The grid-to-plate capacity
of a tube, being reflected across the input circuit of the same tube and
being amplified to an extent determined by the operating potentials,
is caused to vary over a certain range, as a result of the change in oper-
ating potential. The net result is a variation in the dynamic input
capacity and since this capacity is a part of the tuning capacity, which
is fixed, the frequency of the voltage generated is varied over a range
determined by the change effected as a consequence of the varying
operating potential. In a sense this circuit is very much like the auto-
matic noise suppression and tone control system used in some radio
receivers. Full details of the exact system are not available and wewere not in possession of one of the units during the preparation of
this volume.
So much for the general outline of how the frequency modulation of
r-f. and i-f. test signal voltage is produced. Let us now consider the
frequency modulator, which, in the case of motor driven condensers,
is the unit comprised of the motor, the condenser and the synchronous
pulse generator. In the case of the electrically operated frequency mod-
ulated oscillator, such as that which employs variation of the perme-
ability of an iron core, the frequency modulator is the a-c. supply unit,
the magnetizing winding and the iron core.
Motor Driven Frequency Modulators
Speaking in generalities, the motor driven frequency modulator unit,
employed in connection with cathode-ray oscillographs used for align-
ment purposes, consists of the drive motor, the variable condenser and
the synchronous pulse generator. It might be well to state that all such
units do not employ synchronous pulse generators. Those which em-
ploy such a generator utilize the linear sweep circuit in the cathode-
ray oscillograph to sweep the spot across the screen. Those which
do not employ a synchronous pulse generator, do not use the linear

236 THE CATHODE-RAY TUBE AT WORK
sweep in the cathode-ray oscillograph to sweep the spot across the
viewing screen. Instead, a supplementary sweep circuit, associated
with the motor driven condenser system, generates the voltage which
sweeps the spot across the screen.
Perhaps we should mention that all reference to a frequency modu-
lator means the unit which is responsible for the change in circuit
constants so as to change the frequency. The motor driven condenser
is an example of the frequency modulator. The combination of die
frequency modulator and the oscillator forms what is designated as a
frequency modulated r-f., i-f. or a-f. oscillator.
The circuit of the RCA TMV 128-A motor driven frequency modu-
lator is shown in figure 254. The two condensers provide a range of
Fig. 2S4, Schematic diagram of the RCA Model TMV-12S-A motor driven
frequency modulator.
capacity. The "Hi-Lo” switch connects one or both condensers into
the circuit. When set to "Lo,” one of the condensers, C-1, is in the cir-
cuit; when set to "Hi”, C-2 is shunted across C-l and the band width,
for any one setting, is increased. Inclusive of the connecting cable, the
capacity range for the two positions is
"Lo” 55 to 77 mmfd.
"Hi” 65 to 110 mmfd.
An armature, which rotates between the two pole pieces of an in-
duction generator, is joined to the shaft of the condenser rotor and
naturally to the shaft of the motor. This induction generator furnishes
the impulse, which is fed to the linear sweep circuit within the cathode-
ray oscillograph, for synchronization between the frequency modulated
voltage, which is the vertical deflection, and the linear sweep voltage,
which is the horizontal defleaion. In this way the spot is swept across
the screen at a rate in conformity with the variation in frequency, as
the frequency modulating condenser rotor progresses through its arc
of travel. Figure 255 illustrates two cycles of the waveform of the
voltage developed by the impulse generator. This illustration may
serve as reference data in the event of some trouble with the unit.

ALIGNMENT OF TUNED CIRCUITS 237
This frequenq^ modulator is intended for use with the RCA model
TMV-97-C all-wave oscillator, which is already furnished with an
input jack to take the plug connection between the frequency modu-
lator and the oscillator. However, the unit also is suitable for use with
Fig. 2S5. Two cycles of the waveformproduced by the impulse generator,
which is that part of the RCA fre-
quency modulator that brings aboutsynchronization between the rate offrequency modulation and the linear
sweep voltage.
any other oscillator, providing proper connections ate made. As a
matter of fact, we used the unit with a number of different oscillators.
The circuit of the Clough-Brengle frequency modulator system, in-
clusive of the sweep used when checking alignment, is shown in figure
256. There is no provision for a change in the width of the band.
The maximum amount of capacity present in the circuit is definitely
fixed. Attached to the rotor is a short circuiting switch, consisting of
a rotating and a stationary contaa. The rotating contact makes electri-
Fig. 2S6. The circuit of
the Clough-Brengle fre-
quency modulator. Due to
the short-circuiting switch
on the shaft, the sweepcircuit is shorted daring
one half of the rotating
condenser’s travel.
cal connertion with the stationary contact during 180 degrees of the
360-degree arc made by the rotating condenser rotor. A high d-c.
voltage is fed to condenser C through resistor R, charging the condenser.
The rate at which the condenser C develops the sweep voltage is
not of importance providing that full charge is not reached before the
contacts close. The rotating short circuiting contacts are closed during
half of the arc of travel of the rotating condenser rotor, so that vertical
spot displacement takes place during one half of the complete fre-
quency modulating cycle. During the other half of the cycle there is
no displacement of the beam in the horizontal direction, because the
sweep voltage circuit is shorted.
This circuit arrangement is related to the proper development of
the resonance curve, that is synchronization between the rate of fre-
quency change in the oscillator circuit and the movement of the spot
in the horizontal direction. Figure 257 illustrates the character of the

238 THE CATHODE-RAY TUBE AT WORK
sweep voltage used in the Clough-Brengle model OM frequency modu-
lated r-f. oscillator. This photograph was made by taking the volt-
age out of the aforementioned sweep system and observing it on an-
other cathode-ray oscillograph.
Referring to figure 257, the jagged horizontal line represents the
180 degrees of time, during which the shorting contaas are closed.
Fig. 2S7, An oscillogram of the sweepvoltage employed in the Clough-Brenglefrequency modulator. The horizontal line
represents that period of the cycle whenthe shorting contact is closed and therising portion of the curve is the time
when the condenser is charging.
The rising portion of the pattern is the 180 degrees of time during
which the condenser charges. This image was made with the linear
sweep in another cathode-ray oscillograph, adjusted to twice the fre-
quency of the frequency modulator motor, in order to show the rela-
tive periods during a complete cycle, when the charging action and
the shorting action existed. Since the horizontal axis of figure 257
represents time, you can readily see that the duration of the charging
action is as long as the discharging or shorting action. Just how the
synchronizing pulse previously mentioned and the sweep, now being
discussed, actually function when developing resonance curves, will be
shown later.
Synchronization between the sweep of the spot across the cathode-
ray tube screen and the frequency change in the Egert VRO unit is
accomplished by securing the sweep voltage from the source which
supplies the voltage that causes the flow of the magnetizing current
through the magnetizing coil. The nature of this sweep voltage can be
gleaned by examination of figure 41. Synchronization is automatically
accomplished, because, as a result of the circuit connections, the fre-
quency of the modulated oscillator changes over its prescribed band
during the time that the spot is sweeping across the screen. This is so
during the charging as well as the discharging portion of the sweep
cycle, because during the charging portion of the cycle, current is flow-
ing through the magnetizing winding and causing the same change in
frequency of the fixed oscillator output, as during the charging portion
of the sweep cycle. So much for that. Let us now consider the devel-
opment of the resonance curve trace upon the cathode-ray tube screen
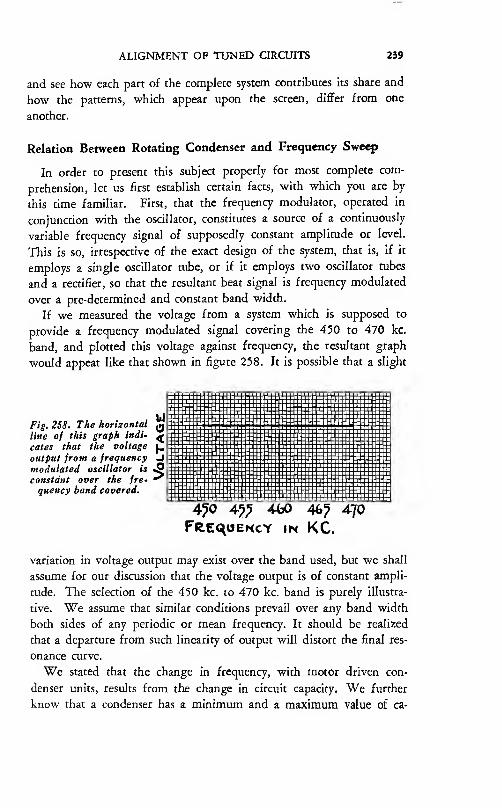
ALIGNMENT OF TUNED CIRCUITS 239
and see how each part of the complete system contributes its share and
how the patterns, which appear upon the screen, differ from one
another.
Relation Between Rotating Condenser and Frequency Sweep
In order to present this subject properly for most complete com-
prehension, let us first establish certain facts, with which you are by
this time familiar. First, that the frequency modulator, operated in
conjunction with the oscillator, constitutes a source of a continuously
variable frequency signal of supposedly constant amplimde or level.
This is so, irrespective of the exact design of the system, that is, if it
employs a single oscillator tube, or if it employs two oscillator tubes
and a rectifier, so that the resultant beat signal is frequency modulated
over a pre-determined and constant band width.
If we measured the voltage from a system which is supposed to
provide a frequency modulated signal covering the 450 to 470 kc.
band, and plotted this voltage against frequency, the resultant graph
would appear like that shown in figure 258. It is possible that a slight
Fig. 2SS. The horizontal
line of this graph indi-
cates that the voltage
output from a frequencymodulated oscillator is
constant over the fre-
quency band covered.
4?0 45? 4(30 46? 470Frequency in KC.
variation in voltage output may exist over the band used, but we shall
assume for our discussion that the voltage output is of constant ampli-
tude. The selection of the 450 kc. to 470 kc. band is purely illustra-
tive. We assume that similar conditions prevail over any band width
both sides of any periodic or mean frequency. It should be realized
that a deparmre from such linearity of output will distort the final res-
onance curve.
We stated that the change in frequency, with motor driven con-
denser units, results from the change in circuit capacity. We further
know that a condenser has a minimum and a maximum value of ca-

240 THE CATHODE-RAY TUBE AT WORK
pacity, so that if such a condenser is connected in shunt with a tuning
condenser in an oscillator, and since a band of frequencies are to be
covered by variation of the external condenser between its minimumand maximum limits, the mean oscillator frequency will obtain for
some intermediate position of the external rotating condenser. Just
what the exact position of the rotor may be depends upon the design
;
that is, capacity variation with respect to frequency variation. Be that
as it may, the fact is true that when the condenser is entirely out of
mesh, the capacity is lowest and the frequency is highest and when
the condenser is all in mesh, the capacity is highest and the frequency
is lowest.
Now, if a condenser rotor starts rotating from its minimum capacity
setting, it passes through two points of minimum capacity, a point of
maximum capacity and two points of intermediate capacity for each
complete revolution. This is illustrated in figures 259 A, B, C, D, and
E, which show five positions of the condenser rotor within a complete
A B c DFig. 2S9. Five positions of the rotating plates of a variable condenser used in
a frequency modulator. When the capacity is minimum (plates unmeshedcompletely) , the frequency is maximum and vice versa. It is essential that the
plates be in positions B or D when the oscillator delivers the mean frequency
of the circuit under test.
360 degree cycle. Since the mean oscillator frequency is located at the
mid-point of the frequency band covered, it is obvious that the adjust-
ment of the condenser rotor or the external capacity must be such that
the complete band will be covered when the rotating condenser varies
in capacity from minimum to maximum. If the fixed oscillator fre-
quency is set to the mean value, with the external condenser at mini-
mum or maximum, the required band width will not be obtained and
the actual mean frequency will not be the desired mean frequency.
Referring once more to the illustration of the condenser roror posi-
tions, it stands to reason that the five settings shown obtain only when
rotation is started from the minimum capacity setting. If the rotor
starts moving from its fully meshed position, it will complete a cycle
by returning to that position, during which time the capacity will have
passed through two stages of maximum, one minimum and two in-

ALIGNMENT OF TUNED CIRCUITS 241
termediate. If it starts rotating from the intermediate position, it will
pass through three intermediate settings, a minimum and a maximum.
Irrespective of the setting of the rotor, when the condenser roror starts
revolving, the proper band will be covered, if the adjustment of the
oscillator is correct. Just how this correct adjustment is attained in
actual practice will be stated later.
Referring to figure 259, if we set the frequency modulating con-
denser to either B or D and tune the oscillator to the mean or periodic
frequency without touching the external rotating condenser, the signal
frequency will be highest for the A and E settings of the rotating
condenser and lowest for the C setting of this condenser. It is as-
sumed, after correct adjustment of the oscillator condenser, that
further variation of capacity and frequency results from the move-
ment of the frequency modulating condenser rotor only. If we plot
the five positions of the condenser as shown in frequency of the oscil-
lator during one complete cycle, the graph shown in figure 260 is the
result. THIS IS NOT A RESONANCE CURVE.
Fig. 260. The variation in fre-
quency for different positions of
the variable condenser in the fre-
quency modulator is shown In the
graph on the right. Note that the
mean frequency—assumed to be460 kc.—is produced when the
plates of the condenser are half
meshed (positions B and D,Fig. 259). liiNimuM HALT Tvi-i. HAir niKinun
RoTOK. A05IT|OM or rlOOUUATPMa CoPlDCMAtlt.
Obviously, the correct setting of the frequency modulating condenser
for the correct mean frequency is about half capacity. The increase
from half to maximum capacity serves to produce the change in fre-
quency from the mean figure to the lowest frequency. The decrease
from half capacity to minimum capacity serves to produce the change
in output frequency from the mean frequency to the highest frequency.
Referring once more to figure 259, we note one very significant fact.
This is that starting from minimum capacity and increasing to maxi-
mum over an arc of 180 degrees covers the desired frequency band
—
and-—that the decrease in capacity from maximum to minimum over
the 180 degrees of travel of the rotor, again covers the required fre-
quency spread. Expressed differently, each 180 degree of travel of
the rotor, from minimum to maximum and then from maximum to
minimum, sweeps through the required frequency band, first, in one
direaion, then in the other direction.

242 THE CATHODE-RAY TUBE AT WORK
Starting from minimum capacity, we find that two positions of the
condenser rotor result in the same frequency. We now have an option
of using these two positions or short circuiting the condenser during
180 degrees of its travel, so that the frequency is swept through the
band only once in each complete arc of travel of the condenser rotor.
Both of these methods are used, as you will see. The RCA frequency
modulator sweeps through the band twice, whereas the Clough-Bren-
gle unit employs the short circuiting contact and shorts the sweep
during half of the complete revolution of the rotor. In other words
only one half of the V shown in figure 260 is used.
Synchronizing Rotating Condenser and Horizontal Sweep
Let us now establish the relation between the frequency sweep,
which is the action of the rotating condenser, and the horizontal sweep,
which means the motion of the spot across the screen in the horizontal
direction. Once mote we have to be specific and refer to the two
types of these units, that is, the nature of the patterns which result.
The rotating condenser, operative over its entire arc, develops what is
known as the double image type of curve. The rotating condenser, op-
erative over half its entire arc of travel, develops the single image type
of resonance curve. At the time of this writing, the former is found
in the RCA unit and the latter in the Clough-Brengle unit.
Suppose that we have a condenser operative over the entire arc of
travel of the rotor and, when frequency modulating an oscillator, will
produce a band width of 20 kc. with 460 kc. as the mean frequency.
Let us further suppose that the speed of the rotor travel is 1800 r.p.m.,
which is the equivalent of 30 cycles per second. During each 1/30th
of a second the condenser sweeps the frequency from say 450 kc. to
470 kc. and from 470 kc. back to 450 kc. (For this illustration we
assume that the rotor starts its excursion with the plates fully meshed.)
To illustrate the relation between frequency change and time, we
plot the frequency variation and one cycle of the linear sweep circuit,
normally adjusted to 30 cycles, which is the equivalent of saying that
the sweep is synchronized with the speed of the motor. This is shown
in figure 261. Note that the spot starts moving across the screen when
the frequency is 450 kc. It reaches half way across the screen when
the frequency is 470 kc. and continues moving towards the other limit
of the screen as the frequency decreases, until, when the spot has moved
across the screen, the frequency is again 450 kc. As is evident, the
sweep has been synchronized with a definite mode of frequency change.
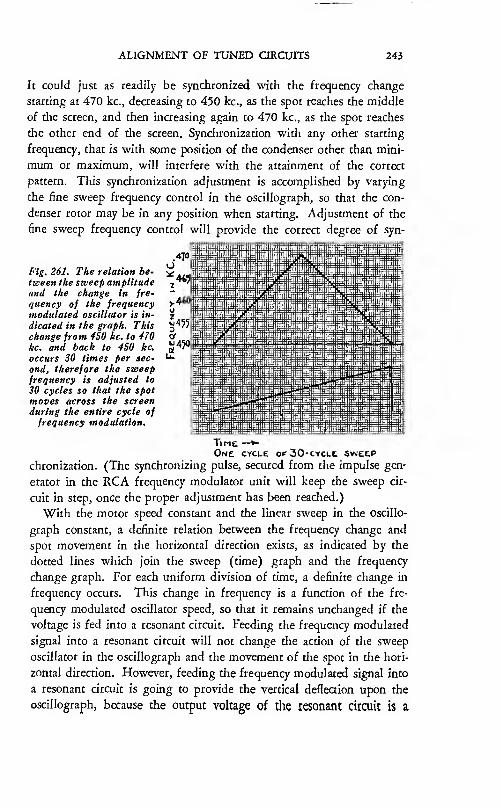
ALIGNMENT OF TUNED CIRCUITS 243
It could just as readily be synchronized with the frequency change
starting at 470 kc., decreasing to 450 kc., as the spot reaches the middle
of the screen, and then increasing again to 470 kc., as the spot reaches
the other end of the screen. Synchronization with any other starting
frequency, that is with some position of the condenser other than mini-
mum or maximum, will interfere with the attainment of the correct
pattern. This synchronization adjustment is accomplished by varying
the fine sweep frequency control in the oscillograph, so that the con-
denser rotor may be in any position when starting. Adjustment of the
fine sweep frequency control will provide the correct degree of syn-
Fig. 261. The relation be-
tween the sweep amplitudeand the change in fre-
quency of the frequencymodulated oscillator is in-
dicated in the graph. Thischange from 450 he. to 470kc. and back to 450 kc.
occurs 30 times per sec-
ond, therefore the sweepfrequency is adjusted to
30 cycles so that the spot
moves across the screenduring the entire cycle offrequency modulation.
Tine —>Onc cycle of30-cyclc sweep
chronization. (The synchronizing pulse, secured from the impulse gen-
erator in the RCA frequency modulator unit will keep the sweep cir-
cuit in step, once the proper adjustment has been reached.)
With the motor speed constant and the linear sweep in the oscillo-
graph constant, a definite relation between the frequency change and
spot movement in the horizontal direction exists, as indicated by the
dotted lines which join the sweep (time) graph and the frequency
change graph. For each uniform division of time, a definite change in
frequency occurs. This change in frequency is a function of the fre-
quency modulated oscillator speed, so that it remains unchanged if the
voltage is fed into a resonant circuit. Feeding the frequency modulated
signal into a resonant circuit will not change the action of the sweep
oscillator in the oscillograph and the movement of the spot in the hori-
zontal direction. However, feeding the frequency modulated signal into
a resonant circuit is going to provide the vertical defleaion upon the
oscillograph, because the output voltage of the resonant ciraiit is a

244 THE CATHODE-RAY TUBE AT WORK
function of the resonance characteristic of the circuit. (The rectifica-
tion process actually entailed in order to develop the resonant curve
is here omitted, but will be mentioned when the complete alignment
process is discussed.)
Let us now feed this frequency modulated signal into what may be
classified, for the sake of illustration, a perfect resonant circuit, one
which has a flat top over a lO-kilocycle band and has perfea suppres-
sion of all frequencies beyond this band. What is the nature of the
pattern which will result from this combination of frequency modu-
lated signal voltage, resonant circuit and sweep?
Examine figure 262. During the time that the condenser is rotating
and changing the frequency from 450 kc. to 455 kc., the spot is mov-
ing across the screen in the horizontal direction without any vertical
displacement, because the circuit into which this frequency modulated
voltage is being fed prevents the flow of current. The result is a straight
line, representative of the base of the resonance curve pattern between
the 450 kc. and 455 kc. At 455 kc. up to 465 kc. maximum vertical
deflection is obtained simultaneously with the horizontal displacement.
As the rotor motion progresses and the spot moves across the screen,
the vertical deflection again falls to zero and remains there while the
rotor has passed through 180 degrees of rotation and is sweeping the
frequency in the opposite direction, from 470 kc. downward. The cir-
cuit does not permit current to flow during the time that the frequency
is changing from 465 to 470 kc. and back to 465 kc.
The spot continues to move as a result of the sweep oscillator and
when the frequency again is 465 kc. maximum vertical displacement
is attained. This remains so as the condenser rotor continues turning
and the frequency is decreasing to 455 kc. The horizontal displace-
ment exists simultaneously with the vertical displacement because the
sweep is still causing the spot to move across the screen. As the fre-
quency moves below 455 kc., the vertical displacement again becomes
zero. When the spot reaches its limit before the return and frequency
has reached the low point of 450 kc., the process is repeated.
It is evident from the illustration that the pattern which appears
contains two resonance curves, one showing the response characteristic
when the frequency is sweeping in one direction and the other show-
ing the re.sponse characteristic when the frequency is sweeping in the
other direction. If you examine figure 262, you will note that the
sweep circuit is shown as being absolutely linear. Such an ideal case
is not achieved in practice, particularly at the low frequencies which

ALIGNMENT OF TUNED CIRCUITS 245
must be used in order to synchroni2e the sweep with the motor speed.
Actually, a slight departure from linearity exists, so that the resultant
pattern, as it would appear upon the screen, would not be as perfect
as is shown in figure 262. Curve B would be slightly narrower than
curve A, that is to say, would be crowded slightly.
The action described in connection with figure 262 is supposed to
take place within l/30th of a second. It remains unchanged for any
4^ 4^5 460 46^ 4^0Kc.
Fig. 262. How a reson-
ance curve is developed
on the cathode-ray os-
cillograph screen. Ideal
conditions are assumed,
as explained in the
text, in order that the
square top curve be de-
veloped. Note that the
mean frequency 460 kc.,
falls at the middle of
both curves, A and B.
duration of time, because it is recurrent, so that what is shown as
being the case for l/30th of a second holds true for whatever period of
time is desired, just as long as the constants of the circuits involved
do not change.
What is true for a square top resonance curve is true for the normal
symmetrical resonance curve or for a non-symmetrical curve. It might
be well, because of what may be experienced in practice, to show the
construction of a non-symmetrical curve with synchronization between
the sweep and the rotating rotor for frequency sweep in two directions.
This reference to direction means starting of the sweep at the highest
frequency or starting of the sweep at the lowest frequency. The reason
for showing these two illustrations is that, sometimes, during the prac-
tical application of the device to the alignment of asymmetrical curves,
the bump in the curve may be displaced from the inside to the outside,
this being dependent upon how the sweep and condenser rotor travel
are synchronized.

246 THE CATHODE-RAY TUBE AT WORK
Examine figure 263. This is the characteristic of a resonated trans-
former used in the i-f. circuit. The frequency modulated signal is fed
into this device and the sweep circuit is synchronized in such manner
that the start of the sweep occurs when the frequency modulating con-
denser is at full capacity and the frequency is the lowest. The numbers
upon curve A in figure 263 are reference figures to indicate the re-
sponse of the circuit at the various frequencies. During one half of
the sweep cycle, curve B is developed and during the remaining half
of the sweep cycle, curve C is developed, curves B and C appearing
simultaneously upon the screen. If you examine curves B and C, you
470 457 4W 467 470
Frequency ik kc.
Fig. 263. Deoelopmeutof an asymmetrical
resonance curve of an
i-f. transformer. Thesweep circuit is so syn-
chronized with the out-
put of the frequencymodulated oscillator
that the lowest fre-
quency, 450 kc., is at
the start of the sweepand the highest fre-
quency, 470 kc., occurs
at the middle of the
sweep.
will find that they are identical, with respect to frequency response
characteristic. They appear different, because the direction of the fre-
quency sweep is different for curve C than for curve B. This you can
see if you examine the frequency change during the existence of the
linear sweep cycle. First, the frequency sweeps from the lowest to the
highest and then from the highest to the lowest. While the response
of the circuit remains the same, the appearance of the response curve
has undergone a change. Curve C is curve B turned over. You will
further note, for comparison with the subsequent illustration, that the
maximiun peaks in the curve appear at the outside of the curve, where-
as the lov/er peaks are on the inside of each curve.

ALIGNMENT OF TUNED CIRCUITS 247
Suppose that we synchronize the linear sweep with the highest fre-
quency;that is to say, the sweep cycle starts when the frequency modu-
lating condenser is all out and as the sweep moves the spot across the
screen, the frequency of the oscillator is being lowered. What type of
curve would appear upon the screen for the same resonant circuit?
Examine figure 264. The basic circuit is the same as on figure 263.
Everything in the system is the same, except for the synchronization
between the movement of the frequency modulating condenser and the
linear sweep. Compare curves B and C in figures 263 and 264. The
curves are identical, although they appear different. The two maxi-
4^0 4?? 460 46? 410
Frequency in kc.
Fig. 264. The sweepand the highest fre-
quency, 470 kc., af the
frequency modulatedoutput of the oscillator
coincide in this dia-
gram, showing the de-
velopment of the reson-
ance curve of the samei-f. transformer in Fig.
263. Note that the re-
sultant curves B and Care reversed with re-
spect to those of Fig.
263.460 4^^ 4^0 4^^
ri^CQUENCY IN
1
V. _J> 1 1 1 1 1 1 i
[Time
1
1
1
/ E
0
V.4bO 470
mum peaks have been transposed from the outside to the inside of the
curves and the two smaller peaks have been transposed from the inside
to the outside of the curves. Curve B in figure 263 is like curve C in
figure 264, because the direction of the frequency sweep is the same.
A similar situation exists with respect to curve C in figure 263 and
curve B in figure 264.
Once again we want to make mention that the perfect linearity of
the sweep, evident in figures 263 and 264, is not achieved in practice,
with the result that curves C in figures 263 and 264 are more crowded
;
that is, the base, in each of the curves marked C, is not as wide as for
curves B, As stated, this is a function of the linearity of the timing

248 THE CATHODE-RAY TUBE AT WORK
sweep or horizontal displacement and has nothing to do with the fre-
quency band width, which is identical for both.
Examples of such images, as seen upon the cathode-ray oscillograph
viewing screen, are shown in figures 265, 266 and 267. Figure 265
illustrates the pattern which appears under the linear sweep-motor
fjg. 26S. An example of symmetrical reson-
ance curves. Note that the base of the right
hand curve is less wide than the one on the
left. As explained in the text, this is due to
the variation of the sweep from true
linearity. The sweep frequency here is thesame as the motor frequency.
Speed frequency relations cited; the response characteristic of the cir-
cuit is symmetrical. Figures 266 and 267 illustrate the images which
appear for a non-symmetrical resonance characteristic, illustrating the
displacement of the peaks in accordance with the explanation which
accompanied figures 263 and 264. If the curves in figure 265 are the
equivalents of the curves B and C in figures 262 to 264 inclusive, then
figure 268 is the response characteristic of the circuit into which was
fed the signal from the frequency modulated oscillator, in order to de-
velop the curves shown in figure 265.
If you examine figures 266 and 267, you find a great deal of simi-
larity between the curves, which, according to the graphic illustra-
Fig. 266, left, Fig. 267, right. These oscillograms are examples of asym-metrical resonance curves, like those which were developed in Figs. 263 and
264. The differences between these curves are explained in the text.
tions of figures 262, 263 and 264, is to be expected. In actual prac-
tice, however, you may experience quite a different condition. Thegraphic illustrations of figures 262 to 264 cannot take into considera-
tion such an item as regeneration, which is present to a lesser or greater
degree in each radio receiver. Now, the presence of regeneration cre-
ates peculiar conditions, which are related to the direction of the

ALIGNMENT OF TUNED CIRCUITS 249
frequency sweep. In other words, the circuit acts in one manner if the
signal, which is fed into the circuit, approaches the resonant frequency
from one direction and acts in another manner, if the signal fed into
the circuit approaches the resonant frequency from another direction.
It is very possible that the two curves created, as have been the curves
of figures 266 and 267, will show differences other than those caused
by non-linearity of the sweep. This is particularly true in the case of
circuits which possess non-symmetrical response characteristics. These
differences are that the two curves are not alike; they differ in the rela-
tive amplitude of the related peaks and overall amplitude. These
variations are to the best of our knowledge a function of the direction
in which the signal frequency sweep occurs. Examples of what we
mean are shown in figures 269 and 270.
At this time, we want to call to your attention that alignment, using
equipment of the type now being described, is seldom if ever carried
J U L JFigs. 26S, left, 269, middle, 270, right. The sweep frequency used in develop-ing the symmetrical pattern of Fig. 268 was twice the motor frequency.Compare with Fig. 265. Figs. 269 and 270 are examples of asymmetricalresonance curves. Explanation of the dissimilarity of the curves is given in
the accompanying text.
out by using such dual curve images. However, we feel that you
should be familiar with what is behind the appearance of such double
curve images, when operating frequency modulator units which employ
a rotating condenser operative over its entire arc of rotation. Further-
more, this discussion is the first step in the establishment of the re-
sultant pattern, wherein the two curves are superimposed to form a
single image, which is the usual form of image employed in alignment.
We intend developing the various forms of images, before embarking
upon the actual alignment operation and the discussion of what type
of resonance curves are indicative of satisfactory operation.
When operating frequency modulators of the type being discussed,
the correct timing sweep adjustment is twice the frequency of the ro-
tating rotor. What happens when this adjustment exists and what is
the difference between this frequency relation and that when the tim-
ing oscillator frequency is the same as the speed of the rotor? Since we

250 THE CATHODE-RAY TUBE AT WORK
have discussed the effect of sweeping the frequency in both directions,
the remainder of this discussion will relate to the change in frequency
in but one direction.
Figure 271 illustrates the relation between a change in frequency
^rom 450 kc. to 470 kc. and back to 450 kc., and the sweep frequency
twice that of the condenser rotor. Whereas in figure 261, a single-
cycle of the sweep existed during the complete 360 degrees of rota-
tion of the condenser rotor, the sweep now moves the spot across the
Sweep Cvcue N Sweep CkcCc O
Fig. 271. The sweep fre-
quency is here twice whatit was in Fig. 261. Cycle
N of the sweep spreads
the frequency modulatedoutput from 4S0 kc. to 470
kc. over the screen andcycle O spreads the de-
scending part of the out-
put. Points A to E and A
'
to E' coincide on the
screen. See Figs. 272 to
274.
screen during 180 degrees of the condenser rotor movement, returns
to its initial starting position and then again sweeps the spot across
the screen during the remaining 180 degrees of rotation of the con-
denser. What does this mean.? The answer is evident if you consider
the sweep curve as being spot positions upon the screen and also ex-
amine the position of the respective dash-line perpendiculars, with
respect to frequency" of the oscillator signal and spot position. A and
A' of the time sweep curve, represent the start of the sweep and the
spot at the same position upon the screen. The same is true of B and
B', C and C', D and D' and E and E'. Further analysis of figure 271
shows that spot position A represents 450 kc. and spot position A'
represents 470 kc. Since they occupy the same position upon the
screen, 450 and 470 kc. are in the same spot. Likewise spot B is
455 kc. and spot B' is 465 kc., and, since they occupy the same posi-
tion upon the screen, 455 kc. and 465 kc. are identically located upon
the screen. The 460 kc., or mean frequency position, is occupied by
one frequency only. On the other hand 465 kc. and 455 kc. are in
the same spot and 470 kc. and 455 kc. are likewise in the same spot.
With the exception of the mean frequency position upon the screen,
every spot position represents two different frequencies. One of these
frequencies is due to the frequency modulation in one direction and
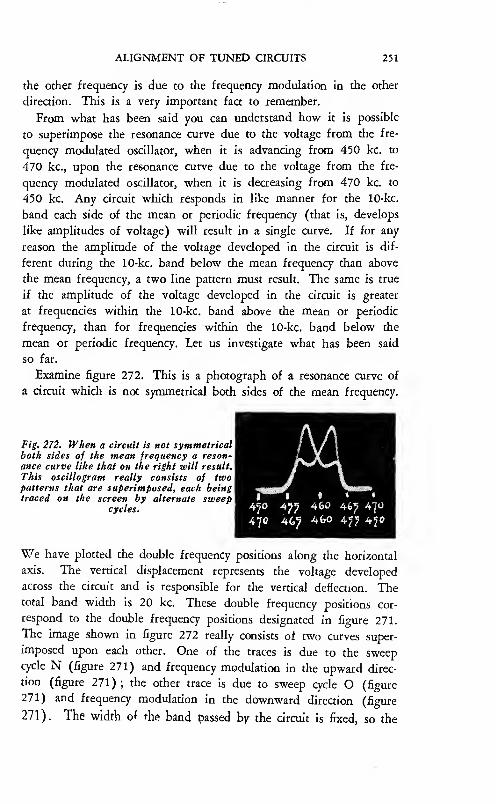
ALIGNMENT OF TUNED CIRCUITS 251
the other frequency is due to the frequency modulation in the other
direction. This is a very important fact to remember.
From what has been said you can understand how it is possible
to superimpose the resonance curve due to the voltage from the fre-
quency modulated oscillator, when it is advancing from 450 kc. to
470 kc., upon the resonance curve due to the voltage from the fre-
quency modulated oscillator, when it is decreasing from 470 kc. to
450 kc. Any circuit which responds in like manner for the 10-kc.
band each side of the mean or periodic frequency (that is, develops
like amplitudes of voltage) will result in a single curve. If for any
reason the amplitude of the voltage developed in the circuit is dif-
ferent during the 10-kc. band below the mean frequency than above
the mean frequency, a two line pattern must result. The same is true
if the amplitude of the voltage developed in the circuit is greater
at frequencies within the 10-kc. band above the mean or periodic
frequency, than for frequencies within the 10-kc. band below the
mean or periodic frequency. Let us investigate what has been said
so far.
Examine figure 272. This is a photograph of a resonance curve of
a circuit which is not symmetrical both sides of the mean frequency.
Fig. 272. When a circuit is not symmetricalboth sides of the mean frequency a reson-
ance curve like that on the right will result.
This oscillogram really consists of twopatterns that are superimposed, each beingtraced on the screen by alternate sweep
cycles. 4^0 460 46^ 4^0
470 4G7 460 4?? 4?0
V7e have plotted the double frequency positions along the horizontal
axis. The vertical displacement represents the voltage developed
across the circuit and is responsible for the vertical deflection. Thetotal band width is 20 kc. These double frequency positions cor-
respond to the double frequency positions designated in figure 271.
The image shown in figure 272 really consists of two curves super-
imposed upon each other. One of the traces is due to the sweepcycle N (figure 271) and frequency modulation in the upward direc-
tion (figure 271) ;the other trace is due to sweep cycle O (figure
271) and frequency modulation in the downward direction (figure
271). The width of the band passed by the circuit is fixed, so the

252 THE CATHODE-RAY TUBE AT WORK
base of one curve coincides with the base of the other and a single
trace is seen.
A peak occurs at about 457 kc. This is evident in both traces.
The lower peak to the left of the center interseaion is the 457 kc.
position during the upward frequency modulation. The lower peak
to the right of the center intersection is the 457-kc. position during
the downward frequency modulation. Following along the trace due
to sweep cycle N and the frequency modulation in the upward direc-
tion, we note a second and higher peak at about 463 kc. This is
evident in the trace due to sweep cycle O and frequency modulation
in the downward direaion, that is from 470 kc. to 450 kc. The rea-
son why these two traces cannot coincide throughout their entire
length is found in the illustration. The 463-kc. spot position in sweep
cycle N and during the frequency modulation in the upward direc-
tion, also is the 457-kc. spot position during the freqeuncy modula-
tion in the downward direction and during sweep cycle O. These
two frequency settings are on opposite sides of the mean frequency
of 460 kc. Since the nature of the circuit is such that the voltage de-
veloped at 457 kc. is not of the same amplitude as the voltage de-
veloped at 463 kc., the vertical displacements are not the same and
the traces cannot coincide.
Another significant item can be gleaned from the pattern in figure
272. This relates to the mean frequency. All traces properly estab-
lished and which intersect, do so at the mean frequency. This state-
ment is not made with the intention of conveying the impression that
all such traces intersect at 460 kc. However, they do intersect at
whatever the mean frequency may be of the band being developed
by the frequency modulating condenser. More about this later.
Readjustment of the circuit, so that response both sides of the
stated 460-kc. mean frequency is symmetrical, develops the pattern
_n_1 I »
4^0 AJf 460 470
470 46^ 460 4751 4ft>
Fig. 273. The circuit used for obtaining
the oscillogram of Fig. 272 was adjusted
so that it was symmetrical and the
resonance curve then taken. The result
is shown at the left. Note that now the
two curves coincide throughout.
shown in figure 273. The double frequency points are shown along
the horizontal axis. The vertical displacement is in accordance with

ALIGNMENT OF TUNED CIRCUITS 233
the voltage developed across the circuit. You now note that the two
traces coincide and appear as a single line trace. Examine the image
and you will note that the amplitude of the peak at 457 kc. is the
same as the amplitude of the peak at 463 kc., so that the vertical dis-
placement of the spot for this dual frequency setting, in accordance
with figure 271, is the same. We are referring to the 457-kc. setting
during sweep cycle N, when the frequency is being modulated upward
from 450 kc. to 470 kc. and the 463 kc. setting during sweep cycle Owhen the frequency is being modulated downward. This is the peak
to the left of the dip in the curve. The peak to the right of the dip
occurs during sweep cycle N, when the frequency is being modulated
upward and is at 463 kc. and during sweep cycle O, when the fre-
quency is being modulated downward and is 457 kc.
Another example of how an adjustment which develops a sym-
metrical pattern produces a single line trace or image, is shown in
figure 274. The double frequency points are shown along the base of
Fig. 274. Another symmetrical resonancecurve. The change in vertical amplitudecan be seen to be the same on each side
of the mean frequency, 460 kc. for cor-responding frequency points on the
pattern.
the curve. The variation in amplitude is the same both sides of the
single resonant frequency, hence the spot positioning for correspond-
ing frequencies of each pair is the same and a single line pattern
appears.
The extent of the departure of the pattern or image from a single
line trace depends upon the circuit being checked and the oscillator
adjustment. If we assume the correct oscillator adjustment, it is pos-
sible that the base of each trace will coincide with the other, as in
figure 272, and the peaks will not coincide. This may exist without
requiring that the resonance characteristic of the circuit being checked
contains two peaks. Then again it is possible that the peaks of the
curve will coincide, but the base of one curve will not coincide withthe base of the other curve. These conditions are controlled by the
circuit being tested. Any factor, which will influence the circuit sothat the amplitude response is not svtnmetrical both sides of the mean

254 THE CATHODE-RAY TUBE AT WORK
frequency, will prevent the formation of a single line trace, because
the lack of symmetry throughout the band will develop two different
vertical displacements for the same spot position along the horizontal
axis.
Lest some confusion exist about the spot occupying the same posi-
tion at the same time for two different frequencies, let it be known
that, like other optical illusions which exist when the cathode-ray
tube is applied, this, too, is one of the optical illusions. There really
is a time interval between the tracings of the curve for the frequency
modulation in the upward direction and of the curve for the fre-
quency modulation in the downward direction, but this time inter-
val is very short and since the phenomenon is recurrent, the spot ap-
pears to occupy the same position.
Single Image Motor Driven Frequency Modulator
There is a great deal of similarity between this arrangement and
the one just described. The greatest difference arises in the sweep
circuit, in that the sweep supplies the horizontal displacement during
one half of the complete cycle of rotation of the frequency modu-
lating condenser rotor. It is necessary that you understand that the
Fig. 27S. During one half
of each revoiution of the
variable condenser in the
frequency modulator of
Pig. 2S6, the sweep circuit
is shorted and only cycle
N spreads the resonance
curve, giving a single in-
stead of a double pattern.
portion of the cycle, is
the sweep and NOT THE FREQUENCY MODULATING CON-
DENSER. This is shown in figure 275. Note that the timing oscil-
lator is active only during one half of the complete cycle of the ro-
tating frequency modulating condenser rotor. Frequency modulation
of the oscillator is taking place during the complete cycle of the
rotating condenser rotor, but each spot position is related to one fre-
quency only and no matter how asymmetrical the pattern, only a
single line trace appears. However, this trace is also accompanied
by a vertical line, which represents the vertical displacement during
that portion of the frequency modulating cycle, when there is no hori-
zontal displacement.

ALIGNMENT OF TUNED CIRCUITS 255
Let us assume for the sake of illustration that the sweep circuit is
synchronized in such manner that it shows the response curve during
frequency modulation in the upward direction, from 450 kc. to 470
kc., as shown in figure 275. Horizontal displacement exists during
the time that the oscillator is being frequency modulated in this di-
Fig. 276, left. Fig. 277 right. The resonance curve in Fig. 276 is non-sym-
metrical and that in Fig. 277 is symmetrical. These oscillograms were madeusing the frequency modulator and sweep described in Fig. 275. The vertical
line on the right of each oscillogram indicates the vertical displacement due to
change in frequency, but as the sweep was shorted, it is not spread across
the screen.
rection. When the frequency modulating condenser rotor has reached
the position where a 470-kc. signal is being generated, the shorting
contacts close and there is no horizontal displacement during the time
that frequency modulation takes place in the downward direction.
However, voltage is established across the circuit being tested during
both halves of the frequency modulation cycle. The pattern or image
appearing upon the screen, when checking a non-symmetrical circuit
under these conditions, is shown in figure 276.
In accordance with the specifications stated, concerning the direc-
tion of frequency modulation, the resonance curve shown in figure
276 is for this half cycle, whereas the straight line is the vertical dis-
placement without horizontal displacement, during the O sweep cycle
of figure 275. The pattern for a symmetrical circuit is shown in figure
277. You now have a picture of the manner in which the resonance
curve is developed with the Clough-Brengle OM frequency modu-
lated r-f. oscillator.
Commercial Frequency Modulated R-F. Oscillators
We have shown the schematic wiring diagram of the RCA motor
driven frequency modulating condenser unit. As stated this unit can

Courtesy CloughrBrengle Co.
Pig. 278. The schematic diagram of the Clough-Brengle Model OM frequencymodulated r-f. oscillator. The 76 tube in the middle of the diagram is theconstant frequency oscillator that is frequency modulated by the motor driven
condenser at the left.

ALIGNMENT OF TUNED CIRCUITS 257
be used with any r-f. oscillator of suitable frequency range required
to cover all operating bands. The Clough-Brengle OM frequency
modulated r-f. oscillator is shown in figure 278. The type 76 tube
nearest the 6A7 mixer is the variable band oscillator. The type 76
tube directly beneath this tube is the fixed frequency oscillator, which
is frequency modulated with the motor driven condenser. The 76
tube near the bottom of the diagram is the a-f. oscillator, which is used
when modulated output is required without any frequency modula-
tion. The 80 rube is the reaifier. For panel view see figure 278-A.
The complete Egert VRO unit is shown in schematic form in figure
279. Tube T-3 is the fixed frequency oscillator, the output of which
Fig.279-A, right.
Panel view of
the Egert'ModelVRO unit.
is frequency modulated. T-5 is the variable band oscillator and also
the mixer tube, supplying the constant band frequency modulated
beat output signal. T-1 is the power supply for the cathode-ray tube.
T-2 is the power supply for the two oscillators. T-4 is a combination
detector and amplifier. Either function may be selected by means
of pin-jack connections. For panel view see figure 279-A.
Both of these units can be used as variable frequency r-f. oscil-
lators without frequency modulation. A 400-cycle tone is available in
the former unit and a 60-cycle tone is available with the latter unit.
Rectification of the Frequency Modulated Signal
We believe that alignment of a radio receiver with a cathode-ray
tube, in other words visual alignment, is so far superior to the normal
alignment with an output meter or some other similar type of indi-
cating instrument, that comparison is out of the question. We feel
that that faa will be proved by the photographs to follow.
In order to interpret alignment patterns properly, it is essential
that you understand what goes on during the process of alignment.
You are familiar with the generation of the frequency modulated sig-

THE
CATHODE-RAY
TUBE
AT
WORK

ALIGNMENT OF TUNED CIRCUITS 259
nal, so that we can start our discussion with the statement that the
frequency modulated signal is available from the signal generator. At
the moment, the width of the band, over which the signal is modu-
lated, is of little if any importance. If it will expedite comprehen-
sion, let us assume that the mean signal frequency lies within the in-
termediate band, is 460 kc., and is frequently modulated over a 10-
kc. band, so that the total band width is 20 kc.
If you recall the discussion concerning the various modes of fre-
quency modulation, you cannot help but understand that the frequency
modulation takes place at an audio rate, maybe 30 cycles per second,
60 cycles per second, etc. By audio rate is meant the speed of the
frequency modulating condenser rotor in such systems, or the rate at
which variation of permeability occurs in systems of that type. Ex-
pressed in another manner, we can say that the mean frequency is
modulated plus and minus 10 kilocycles, thirty times per second or
sixty times per second, or whatever the audio rate may be, depending
upon the design of the unit.
In order to develop the image upon the screen, we require deflec-
tion of the cathode-ray beam in two directions, namely vertical and
horizontal. The horizontal deflection voltage is secured from the tim-
ing axis oscillator or sweep oscillator. The vertical deflection voltage
is secured from the demodulator circuit in the receiver or from the
detector circuit associated with the resonant circuit being checked.
In order that the vertical deflection voltage be available for appli-
cation to the vertical plates of the cathode-ray tube, it is necessary to
convert the radio or intermediate-frequency signal voltage from the
frequency modulated oscillator into an audio voltage variation. This
is done by feeding the signal voltage, developed across whatever cir-
cuit is being checked, into a deteaor tube and rectifying the r-f.
or i-f. voltage. In other words, if a frequency modulated signal cov-
ers a band of frequencies extending from 450 kc. to 470 kc., this
band of signal voltages, at each instantaneous frequency within this
band, is rectified and a voltage is developed across the demodulator
load or output circuit. The envelope of this rectified voltage during a
complete cycle of frequency modulation is in accordance with the
resonance characteristics of the resonant circuit which feeds the de-
tector.
Examine figure 280. It is the fundamental circuit used for align-
ment. The frequency modulated signal is fed into the resonated sys-
tem being checked. The output voltage over the frequency modu-

260 THE CATHODE-RAY TUBE AT WORK
lated band is fed into the demodulator tube. Rectification occurs
and a rectified voltage is developed across the diode load resistor.
The magnitude of this voltage at any one instant during the cycle of
frequency modulation is dependent upon how the resonant circuit
passes the signal of that frequency. Perhaps "pass” is not the correct
pends on the signal voltage built up across the resonant circuit.
Fig. 280. Arrangement of
apparatus for obtaining
alignment curves. Rectifi-
cation occurs in the diode
and the voltage across the
diode load is impressed onthe vertical plates of the
tube. This voltage de-
term. It would be better to say that the rectified voltage at any one
frequency is dependent upon the signal voltage built up across the
resonant circuit or system.
Bear in mind that the voltage supplied from the frequency modu-
lated r-f. or i-f. oscillator is of constant level over the entire band
developed by the frequency modulating system. The greater the volt-
age built up across the resonant circuit or system and fed to the de-
tector, the greater the rectified voltage across the demodulator load
or output and the greater the deflection of the beam in the vertical
direction. If the operation of the circuit is such that it will not allow
the development of a voltage at frequencies between 450 kc. and 455
kc. and also between 465 kc. and 470 kc., there will be no rectified
voltage available across the diode load during those instants, when the
frequency of the frequency modulated oscillator is generating these
frequencies. This condition will be evident upon the cathode-ray
tube screen in the form of an absence of a vertical deflection for this
portion of the resonance curve. If the circuit operation is such that
maximum carrier voltage is built up at 460 kc., which may be the
resonant frequency of the circuit, the maximum rectified voltage will
be developed across the demodulator load.
The envelope of the voltage, built up across the demodulator load,
varies at an audio rate, namely at the rate that the frequency modu-
lation occurs. To keep the pattern upon the screen stationary,
the horizontal deflection voltage (sweep voltage) is adjusted to syn-
chronize with this audio rate.
You have seen frequent references in the last few paragraphs to
rectification. Rectification is essential to the development of the
resonance curve. This is so despite the fact that the graphic dc«

ALIGNMENT OF TUNED CIRCUITS 261
scripdons given earlier in this chapter, did not involve the process
of rectification. Without rectification, it is impossible to develop
the resonance curve upon the cathode-ray tube screen.
The facts given here are basic and apply to all types of patterns,
single and double line images and to all types of frequency modu-
lating systems.
Resonance Curves and Coupled Circuits
Without entering upon the discussion of the theory of coupled
circuits and resonance curves, we feel that certain pertinent facts
should be brought to your attention, for what good they may serve
during the process of practical alignment.
You have seen several examples of resonance curves upon previous
pages. These may be divided into two classes; for that matter all of
them may be divided into the same two classifications. These are
"symmetrical” and "asymmetrical” or "non-symmetrical.” By a sym-
metrical resonance curve is meant one which shows the same ampli-
tude response for frequencies which are higher or lower than the mean
frequency by like amounts. Another definition of a symmetrical reso-
nance curve is one which can be cut through the middle, along its
vertical axis, be folded over and have the lines coincide. Asymmet-
rical curves do not possess these characteristics.
Resonance curves may be of various shapes, yet be symmetrical. In
other words, symmetrical resonance curves may be obtained with
loosely coupled circuits, critically coupled circuits and over coupled
or closely coupled circuits. Examples of symmetrical resonance curves
with but one peak, two peaks and three peaks are shown in figures
281, 282, 283, and 273, the last having been shown in connection
Figs. 281, left, 282, middle, 283, right. Examples of symmetrical resonance
curves, having one and three peaks, are shown in Figs. 281 and 282. SeeFig. 273 for a two peaked curve. The resonance curve of Fig. 283 indicates
a wider band-pass than does the curve shown in Fig. 281.
with the graphic development of the resonance curve image. Asymmet-
rical curves, or non-symmetrical curves, may be obtained from the

262 THE CATHODE-RAY TUBE AT WORK
same type of circuits. Examples of non-symmetrical curves are shown
in figures 284 and 285. Regeneration, Sh extremely important factor,
is responsible for the lack of symmetry in the curve of figure 285.
Recognizing the function of tuned circuits, such as are found in r-f.
and i-f. amplifying systems, which are to be aligned, the first requisite
is symmetry of the resonance curve and elimination of those factors
which tend to prevent symmetry in response curves. These factors are
Figs. 284, left, 285, right.
Two oscillograms of asym-metrical resonance curves.
The lack of symmetry in
the curve of Fig. 285 wascaused by regeneration.
regeneration and incorrect adjustment of the coupling between the
related circuits. Where coupling is fixed, which usually is the case,
correct operation is secured by adjustment of the tuning of the related
circuits. This fact should be borne in mind during alignment opera-
tions when basic curves are not available for comparison.
As a rule, two winding transformers develop a sharp single peak,
depending upon the degree of coupling and resonance adjustment.
Three winding transformers usually are closely coupled transformers
and develop double or triple humped curves, depending upon the
tuning and coupling adjustments. However, it is possible with a
three winding transformer to develop a single peak, just as in the
case of the critically coupled two winding transformer.
A high sharp peak is not always the desired adjustment. It is
necessary to understand the requirement of band width. Since the
transformer is supposed to pass a band of frequencies with minimum
suppression, the ideal curve is the square flat-top, which cannot be
accomplished in practice. However, the nearest approach is desired,
consistent with maximum amplitude, thereby obtaining maximum sig-
nal transfer through the unit with minimization of sideband suppres-
sion. Symmetry of the resonance curve is a pre-requisite, as has been
stated.
Another important consideration, which must be remembered, is
that relating to the final resonance curve, resulting from the combina-
tion of resonated r-f. and i-f. circuits. You will note in the image
photographs to be given later in this chapter, that the combination
of the r-f. and i-f. circuits develops a resonance curve which is differ-
ent from either of these circuits, when handled individually. Fur-

ALIGNMENT OF TUNED CIRCUITS 265
thermore, since the operating frequencies relating to the i-f. amplifier
are fixed and those of the r-f. system are variable, it is necessary to
consider the overall response curve with respect to the mean fre-
quency of the signal being fed into the receiver input.
So much for the general details concerning the shape of the reso-
nance curves. A detailed discussion is not necessary in this volume,
because we must assume that the man, who intends applying the
cathode-ray tube to alignment, is familiar with the shape of the
curve he must develop, or at least with the general shape of the
curve, with respect to the requirements of the system. The cathode-
ray tube provides the picmre of the actual curve and the effect of the
adjustments made. That which was only a guess with meter type
indicators, now can be viewed by the operator.
The Dimensions of the Image
Before discussing the various types of images, which may appear
upon the screen, it might be well to make some comments concerning
the dimensions of the image and their effea upon its interpretation.
It stands to reason that a fair sized image is required in order to
enable proper interpretation of the information conveyed. However,
it is also necessary to realize that it is possible to distort the image
appearing upon the screen, by making the image too great, so that it
extends beyond the curved boundaries of the screen. In addition, it
is possible to distort the image by the application of an excessive volt-
age to the vertical deflection plates and cause overloading of the am-
plifier, with consequent flattening of the top of the curve. Last, but
not the least important point, is distortion of the image as a result of
overloading of the amplifier tubes, associated with the resonant cir-
cuits being checked. Examples of this will be given later.
Concerning the dimensions, a height not exceeding inches,
when using the 3 inch tube, is ample for examination and interpre-
tation. The maximum length of the base line of the image should
likewise not be greater than inches. This assumes that the image
is centered upon the screen.
The dimensions of the image, assuming them to be correct, do not
in any way change the characteristics of the pattern. That is to say,
the response charaaeristic of the circuit is not changed when the
dimensions of the image upon the screen are changed by varying the
cathode-ray mbe control equipment. It is possible that the pattern
may appear as if the characteristics had been changed, but no such
change has aaually taken place.

264 THE CATHODE-RAY TUBE AT WORK
Since the base line of the resonance curve is determined by the fre-
quency modulating circuit and the response charaaeristic of the reso-
nant circuit being tested, increasing or decreasing the length of the
base line, by varying the cathode-ray oscillograph horizontal ampli-
fier control, does not change the ratio between the total frequency
band sweep and the band passed by the resonant circuit. Expressed
in another manner; if the total frequency sweep is 20 kc. and the
band passed by the circuit is 5 kc. each side of the mean frequency,
this relation, as shown upon the resonance curve, does not change
when the horizontal sweep amplitude is changed. For any horizontal
sweep amplimde, the same ratio will be “found to exist in the pattern.
The same is true of the vertical displacement. Increasing the
height of the peak may make it look narrower, but in reality no
change has taken place. This condition can be checked by estab-
lishing the ratio between the total frequency sweep and the band
passed, by measuring the line representing the total sweep and the
space indicating the band passed.
This apparent change due to adjustment of the vertical and/or
horizontal amplifier gain controls was mentioned earlier in this vol-
ume in connection with sine waves.
For any given resonance curve pattern, the greater the frequency
band passed with respect to the total band established by the fre-
quency modulating condenser or unit, the greater the separation be-
tween the bottom of the sloping sides of the curve. The narrower
the band passed under the same conditions, the closer together will
be the bottoms of the sloping sides of the curve. It is because of this
relation that a “high" frequency sweep, with a much wider band
width, will develop a narrow response curve; whereas a “low” fre-
quency sweep, with a much narrower total band width, will develop
a wider resonance curve, when both signals are applied to the same
circuit.
Connecting the Oscillograph for Visual Alignment
There are several methods of connecting the cathode-ray oscillo-
graph to the receiver for visual alignment. However, only one of
these is really correct, in that it provides the correct pattern with
freedom from distortion. With both single and double image sys-
tems of the motor driven frequency modulating condenser variety or
with the electrically operated forms of frequency modulation, develop-
ment of the pattern requires that an audio signal be present. This

ALIGNMENT OF TUNED CIRCUITS 265
audio signal is at the rate of frequenq? modulation. Certain forms of
circuit connections, between the cathode-ray oscillograph and the
source of the rectified signal required for alignment, introduce phase
distortion of the audio signal, with the result that the resonance
curve pattern is badly distorted. The image, instead of having its
base upon the same horizontal plane, has one side of the base cor-
rectly placed and the other side displaced below what would nor-
mally be the correct base position.
Such distortion is introduced when the rectified signal from the
receiver is fed to the oscillograph through a capacity of insufficient
value, as is usually the case when the vertical deflection voltage is
secured across the audio volume control and the said volume con-
trol is connected to the source of the audio signal through a blocking
condenser. This system is to be found in a large number of radio
receivers using diode demodulators.
A similar case of distortion occurs when the demodulator is of the
triode type, with an inductive load, and the vertical deflection voltage
is taken ofif across this inductive load. Similar distortion also occurs
Figs. 286-A, 286-B, 2S7-A, 287-B, from left to right. The oscillograms of Figs.286-A and 287-A show phase distortion in single peaked and double peakedcurves, respectively. Correct corresponding curves with no phase distortion
are shown in Figs. 286-B and 287-B.
when a triode demodulator is used with resistance-capacity coupling
between the demodulator and the subsequent amplifying tube and the
vertical deflection voltage is taken off across the grid leak of the am-
plifier tube. These references to distortion assume that the coupling
or blocking condensers, present in the circuits mentioned, are of in-
sufficient capacity.
Examples of such phase distortion for a single peaked resonance
curve and for a double peaked resonance curve are shown in figures
286-A and 287-A. The correct corresponding curves, free fromphase distortion, are shown in figures 286-B and 287-B.
The most satisfactory circuit arrangement is to connect the input
to the oscillograph across the diode load resistor, assuming that the
demodulator is of the diode type. This connection is shown in figure

266 THE CATHODE-RAY TUBE AT WORK
280. Supplementary AVC and audio resistor connections have been
omitted from the diagram, because they have no bearing upon the
operation. It is possible that the circuit found in a receiver may be
slightly more complicated than that shown, having more resistors
in the load circuit. Be that as it may, the vertical deflection plates
should be connected across the diode load. The two curves shownin figures 286-B and 287-B were made with the signal voltage se-
cured from across the diode load.
The three major circuit arrangements, with several possible points
of connection of the vertical plates of the cathode-ray oscillograph
for alignment operation, are shown in figures 288, 289 and 290.
Figs. 2S8, left, 289, middle, 290, right. Schematic diagrams showing two types
of demodulator circuits with three types of load circuits. The correct points
for connecting to the deflection plates are indicated by V. The results ob-
tained when connections are made to other points are explained in the text.
These diagrams illustrate two types of demodulator systems with
three forms of load circuits. In the diode system of figure 288, con-
nection between point V and the ground is the most preferred and
provides an undistorted pattern, such as was shown in figures 286-B
and 287-B. Connecting the vertical deflection plates between Vl
and ground, introduces the blocking condenser and if its value is not
great enough, the distortion shown in figures 286-A and 287-A is
produced.
In a triode circuit with resistive load, the correct connecting point
is between V and ground or across Vl and ground, providing that
the blocking condenser used in the circuit is at least .5 mfd. If
connection is made at point V2 instead of at V, the pattern will be
fuzzy, because it will contain some of the carrier voltage.
In a triode circuit with a reactive load, the correct connecting
point is at V, but it is necessary to shunt a variable resistor across the
reactance in the plate circuit, or the reactive load can be temporarily
disconnected and a 50,000-ohm or 100,000-ohm resistor may be in-
serted in its stead. If a variable resistor is connected in shunt with
the reactive load to correct the phase distortion, its maximum value
should be about 25,000 ohms and the resistance should be varied un-
til the corrected pattern appears upon the screen.

ALIGNMENT OF TUNED CIRCUITS 267
What has been said about connections to various demodulator
systems, applies to all the types of oscillographs or visual aligning
devices, irrespective of the type of frequency modulation employed
in the device.
Images With Spurious Voltages
Images may appear, which, while of the shape desired, are dis-
torted or are not so required, because of the presence of spurious
voltage. Figure 291 illustrates a correct resonance curve, but it is
Figs, 291, left, 292, right. Both the resonance curves shown here have their
lines broad because of the presence of an appreciable amount of carrier
voltage.
made fuzzy by the presence of carrier voltage, such as would exist if
the vertical deflection plates were connected to that portion of the
demodulator circuit which carried appreciable carrier current or volt-
age, or, if in a diode circuit, the r-f. bypass condenser, connected
across the diode load resistor, were removed. Figure 292 illus-
trates a resonance curve of a non-symmetrical circuit, with a large
amount of carrier voltage present in the reaified a-f. signal, applied to
the vertical deflection plates.
The image shown in figure 293 indicates the presence of modu-
Figs. 293, left, 294, right. The output of the frequency modulated oscillator,used for making the resonance curve of Fig. 293, was also modulated at 400cycles. The curve of Fig. 294 shows the presence of another carrier voltagethat is beating against the frequency modulated signal, zero beat being at the
mean frequency,
lation. In other words, the frequency modulated oscillator was oper-
ated with the modulation "on” instead of "off.” Figure 294 illus-
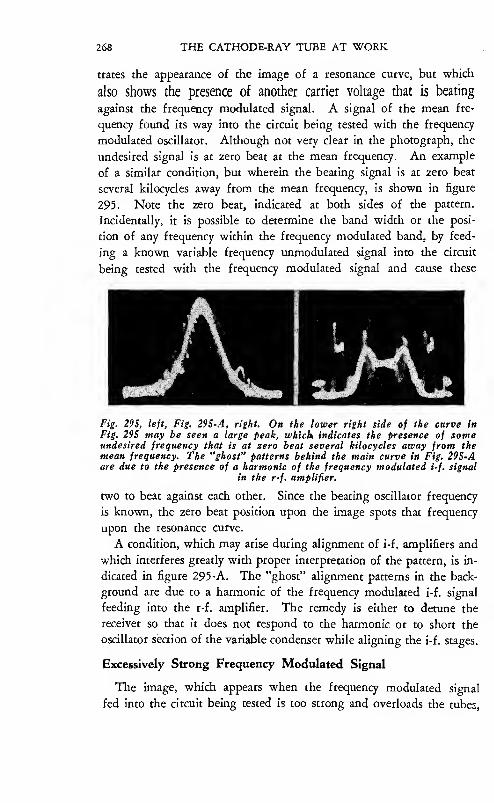
268 THE CATHODE-RAY TUBE AT WORK
traces the appearance of the image of a resonance curve, but which
also shows the presence of another carrier voltage that is beating
against the frequency modulated signal. A signal of the mean fre-
quency found its way into the circuit being tested with the frequency
modulated oscillator. Although not very clear in the photograph, the
undesired signal is at 2ero beat at the mean frequency. An example
of a similar condition, but wherein the beating signal is at zero beat
several kilocycles away from the mean frequency, is shown in figure
295. Note the zero beat, indicated at both sides of the pattern.
Incidentally, it is possible to determine the band width or the posi-
tion of any frequency within the frequency modulated band, by feed-
ing a known variable frequency unmodulated signal into the circuit
being tested with the frequency modulated signal and cause these
Fig. 29S, left, Fig. 29S-A, right. On the lower right side of the curve in
Fig. 295 may be seen a large peak, which indicates the presence of someundesired frequency that is at zero beat several kilocycles away from themean frequency. The "ghost" patterns behind the main curve in Fig. 295-
A
are due to the presence of a harmonic of the frequency modulated i-f. signal
in the r-f. amplifier.
two to beat against each other. Since the beating oscillator frequency
is known, the zero beat position upon the image spots that frequency
upon the resonance curve.
A condition, which may arise during alignment of i-f. amplifiers and
which interferes greatly with proper interpretation of the pattern, is in-
dicated in figure 295-A. The ''ghost” alignment patterns in the back-
ground are due to a harmonic of the frequency modulated i-f. signal
feeding into the r-f. amplifier. The remedy is either to detune the
receiver so that it does not respond to the harmonic or to short the
oscillator section of the variable condenser while aligning the i-f. stages.
Excessively Strong Frequency Modulated Signal
The image, which appears when the frequency modulated signal
fed into the circuit being tested is too strong and overloads the tubes.

ALIGNMENT OF TUNED CIRCUITS 269
is shown in figures 296, 297 and 298. Figure 296 is the correct
curve with the proper amount of signal input. Figure 297 shows the
effect of tube overload as stated. Note that the base of the curve
now shows a change in resonance, which is more aggravated when
Figs. 296, left, 297, middle, 292, right. The resonance curve in Fig. 296 wasmade when the frequency modulated signal input to the circuit under test
was the correct strength. The distortion in Fig. 297 was due to too strong
a signal with resultant overloading of the tubes. Compare the spreading of
the curve, indicating change in resonance when the signal is increased still
further, as shown in Fig. 298.
the degree of overload is increased still more, as shown in figure 298.
This is to be expected, because the presence of grid current creates
a condition which is the equivalent of a load placed upon the circuit
and causes a change in the resonance condition. It is interesting to
note the relative amplitudes of these three images, bearing in mind
that AVC was present in the circuit.
Conditions of Alignment
The condition of alignment is established by interpretation of the
pattern. In the double image system, the figures of 299, 300 and 301
Figs. 299, left, 300, middle, 301, right. These resonance curves show correctalignment of a symmetrical circuit as to frequency and band width (Fig,
299), alignment at the wrong frequency, (Fig. 300), and alignment at thecorrect peak but improper response over the band, (Fig. 301).
indicate correct alignment of a symmetrical response circuit as to
frequency and band width, alignment at the wrong frequency, and
alignment at the correct peak, but improper response over the band,
respectively. Additional adjustment of the circuit under test, with-
out any change of the frequency modulator setting, resulted in the
Correa curve of figure 299. The correct mean frequency is indicated

270 THE CATHODE-RAY TUBE AT WORK
in figure 300, by the point where the two curves, representative of
frequency modulation in the two directions, cross each other. It is
evident from figure 301 that it is possible for the peaks to coincide,
but not the bases. Under certain conditions, as for example the pres-
ence of regeneration, it may be impossible to get the two bases to
coincide, although the two peaks will fall atop each other. Mini-
mization or elimination of the regeneration in the circuit is the only
means of securing the required single pattern.
Under certain conditions of regeneration, the circuit may go into
oscillation only when the signal frequency is being swept through
in one direction, so that the pattern indicative of regeneration appears
upon one side of the curve. When this is the case, the peak and one
side of the two bases will coincide, whereas the other side will not
coincide. This is shown in figure 302. The corrected curve with
Fig. 302, left, 303,
right. The lack of sym-metry in the resonancecurve in Fig. 302 is
due to regeneration.
See Fig. 303 for the
corrected curve.
minimum regeneration is shown in figure 303. Note the difference in
frequency band pass of the two adjustments, bearing in mind that
both were made with the same frequency modulated sweep. The
two amplitudes are slightly out of proportion. Actually, that of figure
303 was smaller than that shown for 302. In order to present a sat-
isfactory picture, we increased the vertical amplitude. A slight dis-
crepancy in coincidence between the two bases on the right side of
the curve of figure 303 is still evident.
A different effect, caused by regeneration, is shown in figure 305.
The correct curve, showing the absence of regeneration, is shown in
figure 304. The same circuit with a definite amount of regeneration,
established the curve above in figure 305. Note that the bases coin-
cide, whereas the peaks do not, so that in this instance the condition
of alignment was changed in such manner that the resonant fre-
quency was changed.
Another example of incorrect alignment, using the double image
system and working upon closely coupled circuits productive of
double peaked curves, is shown in figure 306. The bases coincide
perfealy, but the peaks in the curve are not correctly established. It
is necessary to equalize the two peaks so that they are of the same

ALIGNMENT OF TUNED CIRCUITS 271
amplitude. This is done by adjusting the trimmers. Regeneration
in a circuit will make such equalization virtually impossible. When
the bases of asymmetrical response curves coincide, the mean fre-
Figs. 304, left,
305, right. Thecorrect reson-
ance curve is
shown in Fig.
304. In Fig. 305the bases coin-
cide, but the
peaks do not,
this being dueto regeneration.
quency is indicated or spotted upon the pattern or image by the point
where the two curves cross each other. A pattern of this type indi-
cates that the response of the circuit is better to frequencies one side
of the mean frequency than to frequencies on the other side of the
mean frequency.
If the frequency band, which may be passed through a system, is
greater than the frequency sweep, the pattern appearing upon the
screen will not be complete. The base of the curve will be absent.
Examine figures 307 and 308. In figure 307, the modulated fre-
quency band sweep is about 6 kc. each side of the mean frequency.
Figs. 306, left, 307, middle, 30S, right. The resonance curve of Fig. 306 in-
dicates incorrect alignment. Note that the bases of the two patterns coincide,but not the peaks. The incomplete curve in Fig. 307 was caused bp thefrequency band of the circuit being greater than the signal frequency sweep.
> The corrected condition is shown in Fig. 308.
whereas the circuit being checked, is capable of passing about 9 or 10
kc. each side of the mean frequency. The result is an uncompleted
resonance curve, because at no time within the modulated frequency
signal band does the circuit reject the frequency. The same system,
but fed by a frequency modulated voltage which covered about 15 kc.
each side of the mean frequency, developed a completed pattern. This
is shown in figure 308.
The absence of a completed pattern due to insufficient signal fre-
quency sweep is just as readily applicable to the single image system, as

272 THE CATHODE-RAY TUBE AT WORK
to the double image system. This also applies to those units which
furnish constant band width frequency modulated signals, because the
completion of the pattern depends upon the operating characteristics of
the resonant circuit or system, rather than upon the characteristics of
the oscillator which supplies the frequency modulated signal.
Synchronization of Double Image Pattern
The degree of synchronization has a great effect upon the appear-
ance of the finished pattern or image. This is so irrespective of the
state of alignment of the circuit under rest. By this we mean that the
shape of the pattern is influenced by the adjustment of the synchro-
nizing voltage control for both symmetrical and asymmetrical circuits.
Figure 309 indicates the pattern for an asymmetrical response circuit.
The resonance curve
of Fig. 309 shows cor-
rect synchronization,while the carves ofFigs. 310 to 313 showvarious degrees ofincorrect synchroniza-
tion.
As far as timing frequency (linear sweep) is concerned, the adjust-
ment is correct as indicated by the pattern. The adjustment of the
circuit trimmers for symmetrical response is another matter. The
same pattern, with the synchronizing voltage control advanced too far,
is shown in figure 310. The same pattern, with the linear sweep fre-
quency slightly higher than the frequency of the frequency modulating
condenser rotor, is shown in figure 313.
The effect of over-synchronization, that is adjustment of the syn-
chronizing voltage control upon the cathode-ray oscillograph, so that a
very strong synchronizing voltage is applied for a double pattern ob-
tained when the linear sweep frequency is the same as the motor speed,
is shown in figures 314 and 315. These two photographs should be
compared with figures 265 and 270 respectively. An excessively strong
synchronizing signal, obtained by advancing the synchronizing gain

ALIGNMENT OF TUNED CIRCUITS 273
control too far, changes the phase and frequency of the signal being
generated by the linear sweep ciraiit. The polarity of the synchro-
nizing pulse, obtained from the impulse generator in the frequency
Figs. 314, left, 31S, right.
The effect of over-syn-
chronization is shown in
these two resonancecurves. Compare themwith those of Figs. 265
and 270.
modulating unit, also is important. If the polarity is incorrect, the
pattern is greatly distorted. Examples are shown in figures 316 and
317. The image shown in figure 316 is for correct polarity of the
impulse generator signal and all other adjustments correct. The pat-
tern shown in figure 317 is for the same signal under exactly the same
conditions, except that the polarity of the signal obtained from the
impulse generator has been reversed.
Speaking about synchronization, it might be well to remember that
the synchronizing control adjustment and the fine linear sweep fre-
quency adjustment are closely allied to each other. Correction of an
incorrectly synchronized adjustment may be accomplished by varying
the synchronizing voltage gain control and the fine linear sweep fre-
quency control. The minimum setting of the synchronizing voltage
gain control, consistent with satisfactory performance, is the adjustment
right.
Carves ^
generatorappear and right. |P22^|P^S99pp|^jHpp|2^^2^2^^P
to be preferred. It should also be understood that the distortion
ensuing, when the synchronizing control is improperly set, applies
equally to symmetrical and asymmetrical patterns.
Band Width In Variable Band Width Double Image Systems
As is stated in the heading of this paragraph, the band width indi-
cated in the pattern depends upon the ratio of the total frequency sweep
(frequency modulator) and the frequency band passed through the
system under test. In frequency modulated systems, where constant
band width is not secured, the total frequency sweep increases with
the mean frequency. This was mentioned earlier in the text. Con-
sequently, for normal symmetrical response of a resonant circuit, the
274 THE CATHODE-RAY TUBE AT WORK
width of the frequency band passed with respea to the total frequency
sweep, as it appears upon the screen, is going to be a function of the
mean frequency.
Assuming knowledge of the total frequency sweep, the extent of the
band passed by the resonant circuit can be approximated in a very
simple manner. Suppose that the total frequency sweep (horizontal
base line) appearing upon the screen is 1.5 inches long, as measured
with a ruler. The total sweep is known to be 24 kc. With a ruler,
measure the length of the indication representative of the band passed.
Measure at the base of the curve or about a tenth of the way up. The
ratio between the total length of the base line and the line representa-
tive of the band passed is the band passed in kilocycles. Suppose that
the length of the space indicating the frequency band passed is .5 inch,
or roughly one third of the total length. The total frequency band
passed then is one third of the total sweep, or about 8 kc., which
means 4 kc. each side of the mean frequency.
When establishing band width in double peaked systems, calcuk’
tions should be made only after, proper alignment has been effected.
This means that both peaks are of equal amplitude and are equi-dis-
tant from the center or mean frequency, which may be indicated by a
depression in the curve or by a third peak. Examples of such reso-
nance curves have been shown.
When making band width deterrhinations, it is necessary to exer-
cise precautions to avoid making such measurements when aligning at
a harmonic of the correct mean frequency. In other words, if align-
ment is to be carried out at 1000 kc., the frequency modulator adjust-
ment should be 1000 kc., not 200 kc., i.e., operating at the fifth
harmonic. Such operation would tend to create the impression that
the band width was much narrower than is actually the case. . . . Al-
ways align with the fundamental frequency.
Constant Band Width Single Image Systems
We have made reference to several types of constant band width
single image systems. These differ from the double image arrange-
ment previously mentioned in that the pattern upon the screen is a
single image, irrespective of the nature of alignment, providing, of
course, that the frequency of the oscillator is within the frequency range
of the resonant circuit. As in the case of the double image system,
the prime requisite during adjustment is symmetrical response for all
types of resonant circuits used in radio receivers. As a general rule.

ALIGNMENT OF TUNED CIRCUITS 275
due to the constant band width of the frequency modulated signal,
these systems are employed in conjunction with transparent frequency
band pass calibrated scales, which are placed in front of the screen.
Since synchronization and horizontal sweep frequency adjustments
are automatic in such systems, nothing along such lines can be said
about the shape of the pattern, other than if a double pattern appears,
the synchronizing system, whatever its type, is out of order.
Whereas the double image arrangement requires that the two curves
be made to coincide, the single image system requires that the trimmer
adjustments be made in accordance with whatever type of response
characteristic is desired, and the calibrated scale showing kilocycle
separation is used. These scales have a vertical reference line which
is supposed to coincide with the mean frequency indication. The re-
sponse of the circuit then is indicated by noting the shape of the curve
with respect to the frequency divisions. Those items which relate to
the adjustment of the circuit at hand and which were quoted in con-
nection with double image operation apply to single image constant
band width systems. Proper interpretation of the image appearing
upon the screen, with respect to the calibrated scale, indicates the exact
band pass at any point along the curve.
Knowing the type of resonance curve required, trimmer adjustment
is carried on until the resonance curve, viewed through the transparent
scale, indicates such response. Lack of symmetry is established by
examination of the curve to see if, with the mean frequency coinci-
dent with the vertical reference line, the slope of the curve each side
of the mean frequency reference line is uniform on both sides.
We illustrate this discussion with photographs of images which
show a vertical amplitude line upon the pattern, as well as the regular
response curve. This is in accordance with the data previously given.
The usual run of single image systems will develop substantially
identical patterns under like conditions, with the exception that the
vertical amplitude line will be absent.
The connections between the receiver and the cathode-ray oscillo-
graph using the single image type of resonance curve, are identical to
those made for the double image system, and are shown in figures
280, 288, 289 and 290. The phase distortion introduced as a result
of improper connections and improper values of coupling capacity as
mentioned previously, applies here as well.
Incompleted patterns may be due to one of three conditions: First,
that the sweep of the frequency modulated oscillator is insufficiently

276 THE CATHODE-RAY TUBE AT WORK
wide, with respect to the band pass characteristics of the circuit. This
is not a commonplace occurrence, because the band width in these con-
stant band width systems is seldom if ever less than 15 kc. and is con-
stant over the entire frequency spectrum, covering the i-f. and high
frequency bands. In some of these systems, the band width is as high
as 30 kc., so that practically every type of resonant circuit found in
receivers will develop a completed pattern.
The second possible condition, illustrated in figure 318, is incor-
rect adjustment of the frequency modulator frequency setting, with
respect to the resonant frequency of the circuit being checked. Note that
Figs. 318, left, 319, right.
When the frequency mod-ulator setting was incor-
rect, the curve of Fig.
318 was obtained. Over-loading of the tubes in
the resonated amplifier
under test, caused the
distortion in Fig. 319.
response is contained over one complete side-band and over a portion
of the other, thus indicating that the mean frequency of the frequency
modulated signal is not correa.
The third possible condition is related to the second, in that the
resonant frequency of the circuit or system being checked is incorrect
with respect to the mean frequency of the frequency modulated signal.
The pattern shown in figure 318 would apply to this condition. In-
vestigation of the calibration of the oscillator establishes which of
these two stated conditions is the reason for the pattern. If the oscil-
lator calibration is correct and the oscillator is correctly mned, it
stands to reason that the resonant circuit is not correctly resonated.
Overloading of the tubes associated with the resonated amplifier
being tested is indicated exactly as in the case of the double image
system. The peak is flattened and the lack of symmetry, due to direct
current flow through the circuit, is shown by the fact that the two
sides of the curve are not the same, with respect to the side band fre-
quencies. The curve for this condition is illustrated in figure 319.
Compare this curve with figures 297 and 298.
Regeneration or motor boating in an i-f. amplifier, as viewed with
the single image system, is shown in figures 320, 321 and 322. The
correct resonance curve for a single peak system with minimum regen-
eration is shown in figure 320. The same system with increased re-
generation is shown in figure 321. Note the deparmre from lack of

ALIGNMENT OF TUNED CIRCUITS 277
symmetry; also the marked reduction in the width of the frequency
band passed, and the very steep slope as resonance is approached. In
the double image system, this curve would coincide at the peak, but the
Figs. 320, left, 321, middle, 322, right. A correct resonance curve for asingle-peaked system with minimum regeneration is shown in Fig. 320. Anincrease in regeneration caused the curve to become asymmetrical, see Fig.
321. Actual generation of oscillations is indicated in Fig. 322.
bases would not coincide. The actual generation of oscillations is in-
dicated in figure 322. Compare this pattern with a double image
pattern, showing the presence of oscillations.
The resonance curve of a triple peaked circuit, such as used in an
i-f. amplifier adjusted for high fidelity, is shown in figure 323. The
overall response curve of the receiver at 600 kc., with the frequency
Figs. 323, left, 324, middle, 325, right. The resonance curve of a triple-peakedcircuit is shown in Fig, 323. The overall response curve of the receiver is
shown in Fig. 324. The curve of Fig. 325 was the result when the alignmentwas made with an output meter instead of an oscillograph, as was the curve
of Fig. 324.
modulated signal fed into the antenna, is shown in figure 324. Note
how the response curve of the r-f. system, superimposed upon the i-f.
response curve, raises the gain at the mean frequency. Just as a mat-
ter of information, we show the same alignment operation, but made
with an output meter, instead of the oscillograph. The overall re-
sponse curve is shown in figure 325. Compare this curve with the one
shown in figure 324. Note the symmetry in the latter, and the ab-
sence of symmetry in the former.
The necessity for reasonable amplitude, in order to be able to judge
the charaaeristics of the response curve, is shown in figures 326 and
327. Note that at the low amplitude, it is difficult to establish the

278 THE CATHODE-RAY TUBE AT WORK
width of the band actually passed by the circuit. The band seems
smaller, because insufficient voltage is being built up across the circuit.
The correct operation of the circuit is seen when the vertical ampli-
tude is increased, as in figure 327.
The disfigurement of the image upon the screen, as a result of spu-
rious signals described in connection with the double image system, is
Figs. 326, left, 327, right
The low amplitude of the
curve of Pig. 326 makesinterpretation of its characteristics difficult. Notithe difference in Fig. 327in which the amplitude is
correct.
applicable in every respect to the signal image system. The spotting
of frequencies by beating an unmodulated signal against the frequency
modulated signal is accomplished in the manner originally stated. How-
ever, since a calibrated scale is used with such single image units, the
frequencies can be spotted by means of the scale, so that the addi-
tional heterodyning signal is not required.
Checking Effect of Damping Upon Tuned Circuit Response
The effea of damping upon the response of a simple tuned circuit
can be checked in the following manner: The circuit is shown in figure
328. The amplifier is a tuned amplifier capable of operation at the
Fig. 328. Schematic diagram of the circuit for checking the effect of dampingupon the response of a simple tuned circuit.
mean frequency used for checking. The values given were used at
500 kc. R-1 is a 200,000 ohm resistor, employed to minimize the
shunting effect of the output circuit in the amplifier. R-2 is a vari-
able resistance of from 0 to 14 ohms. R-3 is the diode load resistor
of 500,000 ohms. The tuned circuit is that shown within the four
dots. The rectifier is a conventional diode. Note that the cathode of
the diode is “high.” Provision was made for the addition of a shunt

ALIGNMENT OF TUNED CIRCUITS 279
resistance across the tuned circuit. When this shunt was used, R-2
was zero.
The six illustrations in figures 329, 330, 331, 332, 333 and 334
indicate the response under various conditions. The basic response
"igs. 329, left, 330, middle, 331, right. When R-2 of Fig. 32S was 0, the curve of
Fig. 329 was obtained. When R-2 was 2 ohms and 6 ohms, the carves ob-tained are shown in Figs. 330 and 331, respectively.
Figs. 332, left, 333, middle, 334, right. When R-2 of Fig. 32S was increased to
14 ohms, the curve of Fig. 332 was obtained. The effects of shunting 50,000
ohms and 20,000 ohms across the resonant circuit are shown in Figs. 333 and334 respectively.
curve of the circuit, with a 12-kc. frequency sweep, no additional series
or shunt resistor is shown in figure 329. The effea of adding 2 ohms
in series is shown in figure 330. The effect of adding 6 ohms in
series is shown in figure 331. The effect of adding 14 ohms in series
is shown in figure 332. The effect of shunting the resonant circuit
with 50,000 ohms is shown in figure 333. Note that with the coil
constants used, the effect of a 50,000-ohm shunt is very much like a
series resistance of 2 ohms. The effect of a 20,000-ohm shunt is shown
in figure 334. The effect is very much like the insertion of a 14-ohm
series resistor.

CHAPTER VII
THE A-F. FREQUENCY MODULATORThe use of the cathode-ray tube for the determination of overall
audio-frequency response curves is no innovation. As far back as
1927 Diamond and Webb pointed out the suitability of the device for
the rapid determination of audio-frequency response curves and pub-
lished excellent response curve oscillograms in the September 1927
issue of the 7. R. E. Proceedings. The authors used a beat frequency
oscillator, wherein the continuously variable frequency control con-
denser was mounted upon the shaft of the potentiometer, which, with
a, battery, supplied the sweep voltage. The potentiometer arm and the
condenser rotor were simultaneously driven by a slow speed motor.
The a-f. frequency modulator is a device which supplies a continu-
ously variable band of audio frequencies. In effect it is the same as
the various constant band width r-f. and i-f. frequency modulators
being sold for visual alignment operations, except that the mean fre-
quency or beat frequency is zero and the frequency modulation takes
place over a 10,000 or 15,000 cycle band each side of the zero beat.
This signal then is reaified, so that the output of the detector is a con-
tinuously variable band of audio frequencies.
The device, which we employed in connection with the photographs
shown in this volume, is illustrated graphically in figure 335. Since
Fig. 33S. Arrangement of apparatus used for the determination of overall a-f.
response curves.
there is nothing very special about the circuit, it is not necessary to
show schematic wiring diagrams of the respective oscillators. These
280

THE A-F. FREQUENCY MODULATOR 281
two oscillators are operated at about 200 kc. One of them is fre-
quency modulated with a motor driven condenser, so as to supply
frequency modulation over about a 10-kc. band. Because of the a. c.
present in the frequency modulated unit, the supplementary diagram,
shown iti figure 336, is offered. The frequency modulated oscillator
is grounded. In series with its output is the secondary of an i-f. trans-
Fig. m.\ Thetrap circMiV is
tuned to the fre-
quency qf the fC—two oscillators
and so keeps the Ti^eouency
i-f. out Of the OjcinATOR. i
G>unLIIMCr TIJANsroi^MElC SEPADLY TONED TO riEEO FRCquCNcY
a-f. circuit.FqEquENCY rioDOLATEO
OsctUUATOR.
former nined to about 200 kc. or whatever the frequency being used.
To this winding is coupled the primary winding, which is connected
to the other oscillator. The detector is a diode tube with a 100,000-
ohm loac' resistor, shunted with a .0005-mfd. condenser. In the out-
put voltage supply circuit is a trap tuned roughly to the frequency of
the two oscillators, namely about 200 kc. This is used to keep i-f.
out of the a-f. signal. The rest is the usual routine.
Two ndio-frequency oscillators, operating at about 200 kilocycles,
were heterodyned to obtain an a-f. signal with zero beat as the mean
frequency. To one of these oscillators was connected a motor driven
condensei:, such as is available for alignment work. The frequency
operating conditions were so chosen that the output audio frequency
varied 10,000 cycles each side of zero beat. With the equipment
available the timing sweep frequency was necessarily limited to 20
cycles. Synchronization between the sweep and the a-f. signal was
accomplished in the usual manner, as for i-f. alignment.
The operating parameters were so selected that the output beat signal
was linear over the 10,000-cycle frequency sweep. This is not difficult
of accomplishment, since the variation of 10,000 cycles at 200,000
cycles is sufficiently small so that very little departure from the actual
output at 200,000 cycles occurs. The oscillogram indicating the linear-
ity of the output voltage over the stated frequency range is shown in
figure 337. The type of frequency modulation used is that which fur-
nishes a double image, so that two types of image will be shown. Onetype is that which occurs when the timing frequency is the same as
the speed of the frequency modulating condenser rotor and the other
type is thit which occurs when the timing frequency is twice the speed

282 THE CATHODE-RAY TUBE AT WORK
of the frequency modulating condenser. A single image pattern can
be obtained by making the sweep frequency inoperative during one
half of the complete arc of travel of the frequency modulating con-
denser, as described in the chapter on r-f. and i-f. alignment. That
Pig. 337. An oscillogram of the
output of the a-f. frequency modu-lator. Note that it is linear over
the band from 0 to 10 kc.
device was not available when the photographs shown herein were
made and the experiments were conducted. (See appendix.)
When the synchronization adjustment is such that the timing
(sweep) frequency is equal to the frequency modulating condenser
rotor speed, only one half of the entire pattern is used, as indicated.
The other half of the trace is a repetition of the first in reverse order.
Incidentally, due to lack of linearity of the sweep at the low frequency
employed, that is between 20 and 25 cycles, the trace is not equally
divided. The second trace is somewhat more crowded than the first,
which condition was discussed at greater length in the preceding
chapter. By properly synchronizing the timing (sweep) voltage and
the rotation of the frequency modulating condenser, the zero beat or
lowest frequency setting can be set at the outside limits of the pattern,
so that frequency variation in the used half of the complete trace is in
the normal progression from the lowest to the highest, reading from
left to right. The limitation of image size, only one half of the com-
plete trace being of utility, is not a limitation of the system, but is due
essentially to the design of the device we were using. Further elabo-
ration of design can remove one half of the trace, leaving the entire
screen available for the remaining trace.
The accompanying unretouched photographs will show a few of the
practical applications of this system for the purpose of noting overall
audio-frequency response and the effect of any variables which influ-
ence the passage of signal voltages through the audio-frequency ampli-
fier. The day is not far distant when this rapid method of noting the
effea of tone frequency compensating circuit adjustments, tone control,
low-pass and high-pass filter adjustments, etc., will be put to use. This
system enables instantaneous determination of the frequency response
of an audio system. The fact that our photographs show calibration at

THE A-F. FREQUENCY MODULATOR 283
the two extreme limits, is not an indication of the fact that the device
possesses calibration limitations. With established linear frequency
variation, a calibrated scale can be placed in front of the screen and
all frequencies within the band, definitely spotted.
It should be noted that a linear frequency variation in general is not
to be desired, but rather one that is logarithmic. This type of scale
can be readily obtained by the use of properly shaped plates in the motor
driven frequency modulating condenser.
Figures 338, 339 and 340 show the application of the unit to the
adjustment of the 10-kc. low-pass filter found in the demodulator out-
put circuit of one of the high fidelity receivers. The three illustrations
show the filter adjusted below the correct limit, above the correct limit
Figs. 33S, top, 339, middle, 340,
bottom. These oscillograms showthe application of the a-f. frequencymodulator to the adjustment of a10-kc. low-pass filter in the de-
modulator output circuit of a high-
fidelity receiver. Fig. 338 shows the
filter adjusted below the correct
limit, Fig. 339, above the correct
limit and Fig. 340, correctly tuned.
Figs. 341, below left, 342, belowright. Fig. 341 indicates bass com-pensation and Fig. 342 indicates
treble compensation.
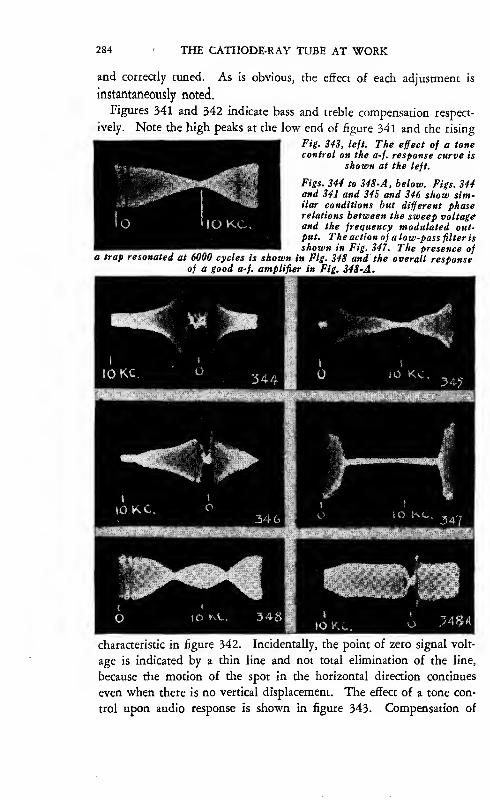
10 Ki.
characteristic in figure 342. Incidentally, the point of zero signal volt-
age is indicated by a thin line and not total elimination of the line,
because the motion of the spot in the horizontal direaion continues
even when there is no vertical displacement. The effect of a tone con-
trol upon audio response is shown in figure 343. Compensation of
284 ' THE CATHODE-RAY TUBE AT WORK
Figs. 344 to 34S-A, below. Figs. 344and 341 and 345 and 346 show sim-ilar conditions but different phaserelations between the sweep voltageand the frequency modulated out-put. The action of a low-pass filter is
shown in Fig. 347. The presence ofa trap resonated at 6000 cycles is shown in Fig. 348 and the overall response
of a good a-f. amplifier in Fig. 348-A.
and correctly tuned. As is obvious, the effect of each adjustment is
instantaneously noted.
Figures 341 and 342 indicate bass and treble compensation respect-
ively. Note the high peaks at the low end of figure 34 1 and the rising
Fig. 343, left. The effect of a tonecontrol on the a-f. response curve is
shown at the left.
iOKC. lO K.C
10 Ke..346

THE A-F. FREQUENCY MODULATOR 285
the bass frequencies, shown in figure 341, is again illustrated in figure
344, but this time with the sweep voltage phased with respect to the
frequency modulated output, to spot the 7ero beat position in the mid-
dle of the pattern. G^mpare figures 341 and 344. Figures 345 and
346 are for the same condition, except for different phase relation be-
tween the frequency modulating signal and the timing or sweep volt-
age. The pictures illustrate the response curve of an audio amplifier
used in a receiver, with a .04-mfd. condenser connected across the
output transformer. In figure 345 the zero beat position is at the left.
In figure 346, the zero beat spot is in the middle of the trace. The
action of a low-pass filter is shown in figure 347. It should be under-
stood that all of the tests indicated were made with the constant volt-
age input indicated in figure 337.
The presence of a trap or filter circuit resonated to about 6000
cycles is shown in figure 348. The overall response of a well built
audio frequency amplifier Is shown in figure 348-A. The zero beat spot
representative of the lower frequency limit is in the center of the
pattern.
One deficiency present in these patterns may have come to your
attention. This is the very small spread at the lower limit. In other
Figs. 349 to 352. These four oscillograms show the effects on the responsecurve of changing the blocking condenser in a resistance coupled amplifier.
See text for detailed explanation.
words it is difficult to distinguish the limits between the lower limit
and several hundred cycles. Elaboration of design, to spread the
lower end of the frequency spectrum, is one of the required refine-

286 THE CATHODE-RAY TUBE AT WORK
ments. As it happens it is fairly simple, being a modification of the
frequency modulator condenser plates.
The effect of varying the blocking condenser, in a well built resis-
tance coupled stage, is shown in figures 349, 350, 351 and 352. Fig-
ure 349 indicates the output with a high value of blocking condenser
and is the equivalent of the input used for comparison. The frequency
range is from 0 to 10,000 cycles and the zero beat spot is positioned
in the middle of the pattern, so that the frequency increase is from
right to left. Figure 350 shows the overall response with a .0001-mfd.
blocking condenser. Figure 351 shows the overall response with a
.0005-mfd. blocking condenser. Figure 352 shows the overall re-
sponse with a .01-mfd. blocking condenser. The value used to develop
the standard response curve of figure 349 was .25 mfd.
While we cannot speak officially, it has come to the attention of the
writer, that one large concern intends manufaauring a beat frequency
oscillator, which will have provision for frequency modulation, so that
the type of a-f. signal described herein will be available. Perhaps by
the time that cathode-ray oscillographs become general in service shops
and design laboratories, such a-f. frequency modulators will be avail-
able for audio-frequency amplifier analysis and design.

CHAPTER VIII
AUTO RADIO VIBRATOR TESTING
We want to preface this chapter with the statement that the ma-
terial offered herein is given simply to show the application of the
cathode-ray oscillograph to the testing of auto radio vibrators. The
photographs of voltage waveforms under various conditions ate purely
illustrative and are NOT furnished as the basis for comparison with
units which are being worked upon. A certain amount of data to be
found in this chapter is generally applicable and basic. There are too
many variables among the large number of different kinds of vibrators
to permit the presentation of specific voltage waveform oscillograms,
without reference to the specific model and the conditions under which
the vibrator is being employed. It is hoped, and we believe that the
trust is well founded, that manufacturers of such devices, now realizing
that cathode-ray oscillographic equipment is available, will furnish ref-
erence oscillograms to be used as the standards of comparison.
Proper adjustment of the contacts entails consideration of long life,
as well as operating efficiency. Both of these are related to specific
modes of application, with respect to the related apparatus, such as
the power transformer, the load, buffer condensers, etc. Speaking in
generalities, symmetry in the voltage waveform is an essential. Com-
parative freedom from arcing, which is productive of noise and ap-
pears in the oscillograph image as jagged streamers or off-shoots, is
required. Imperfect operation, due to one cause or another, is pro-
ductive of incorrect output voltage and incorrect primary current.
Correction of the condition raises the output voltage to its normal
value. Correlation between the nature of the image and the output
voltage, as measured with a d-c. meter across the 5000-ohm load, which
is the average load used when testing auto radio vibrator units, serves
as a guide to attain the proper adjustment.
Speaking about symmetry in the voltage waveform, a slight departure
is to be expected when checking the operation of that portion of the
transformer windings which is related to the starting winding. This
287

288 THE CATHODE-RAY TUBE AT WORK
winding shunts one half of the primary winding in all full wave, syn-
chronous and non-synchronous vibrator systems.
The oscillograms we shall show will serve to illustrate how the
cathode-ray oscillograph can be used to establish the effect of various
adjustments, showing that various changes in adjustment and circuit
constants influence the voltage waveform and proper interpretation
should lead to most efficient servicing.
The schematic wiring diagram of the full-wave non-synchronous
vibrator power supply units used during some of these tests is shown
in figure 353. The various designations related to the transformer
^WECP
Fig. 3S3. Schematic diagram of a fall-wave non-synchronous vibrator powersupply unit.
winding represent the points to which the vertical deflection plates
of the cathode-ray oscillograph were joined. The cathode-ray unit
was arranged for use as a means of observing voltage waveform. The
linear sweep oscillator within the unit was joined to the horizontal de-
flection plates in order to supply the horizontal time displacement.
Figs. 354, 355, 356, 357. Oscillograms of the voltage taken across PI and P2and the center tap are shown in Figs. 354 and 355. Simitar oscillograms takenacross SI and S2 and the center tap are shown in Figs. 356 and 357. See
Fig. 353 for points of test.
Internal synchronization was employed. Vibrator adjustments were
checked by noting the voltage waveform across the various terminals

AUTO RADIO VIBRATOR TESTING 289
specified in the text and shown upon the diagram. The "high”
terminal of the vertical deflection plates was connected to the point
designated. The "low” or grounded terminal of the vertical deflection
plates was connected to the associated center tap upon the identified
winding or across whatever points may be specifically stated.
The waveform for the vibrator as received, when checked between
P-1 and the center tap and between P-2 and the center tap, is shown in
Fig. 3SS. Oscillogram of vol-
tage taken across terminals
V and VI of Fig. 353.
figures 354 and 355 respectively. The corresponding voltage wave-
forms, as checked across the secondary winding between S-1 and the
center tap and between" S-2 and the center tap, are shown in figures
Figs. 359 to 364. Oscillograms in Figs. 359, 360 and 361 were made with thevibrator of Fig. 353 functioning as a half-wave rectifier by disconnecting con-tact A. Oscillogram made when contact A was restored to normal operationis shown in Fig. 362. When both contacts were opened to maximum separa-tion, oscillograms in Figs. 363 and 364 were obtained across PI and SI and
their respective center taps.
356 and 357 respectively. The voltage waveform between points Vand Vl is shown in figme 358.
Contact A (figure 353) was disconneaed making the unit a half-
wave rectifier. The resultant voltage waveform between P-1 and the

290 THE CATHODE-RAY TUBE AT WORK
center tap is shown in figure 359- The voltage across S-1 and the
center tap, with contact A open circuited, is shown in figure 360.
Compare figures 359 and 360.
The remaining active contact clearance or separation was increased
appreciably and the resultant voltage across P-1 and the center tap is
shown in figure 361. Contact A was again restored to operation, so
that the unit was functioning as a full-wave rectifier and the contact
separation made uniform so that symmetry was obtained. The re-
sultant voltage waveform between points P-1 and the center tap is
shown in figure 362.
Starting with the adjustment which resulted in figure 362, both con-
tacts were opened to maximum separation. The resultant voltage wave-
form developed between P-1 and the center tap is shown in figure 363.
The equivalent voltage across S-1 and the center tap is shown in figure
364.
The effect of resistance added into the "A” contact circuit is shown
Figs. 365, left, 366, right. Resistance was added into the A contact circuit of
Fig. 353. Fig. 365 was made with 1 ohm in the circuit and Fig. 366 with2 ohms.
in figures 365 and 366. The former indicates the voltage waveform
with 1.0 ohm added and the latter with 2.0 ohms added.
Tests were then made upon a full-wave synchronous vibrator unit.
The schematic wiring diagram is shown in figure 367. Preliminary
Fig. 367. Schematic diagram of full-wave synchronous vibrator.
voltage tests made upon the unit as received, resulted in the voltage
waveform images shown in figures 368 and 369, across P-1 and center
tap and P-2 and center tap, respectively. The equivalent voltages across

AUTO RADIO VIBRATOR TESTING 291
S-1 and center tap and S-2 and center tap are shown in figures 370 and
371 respeaively. The voltage existing across V and VI, or at the input
Figs. 368, left, 369, right. Oscillograms of voltage taken across PI and center
tap and P2 and center tap are shown in Pigs. 368 and 369 respectively.
Figs. 370, left, 371, right. Similar oscillograms taken across SI and the center
tap and S2 and the center tap are shown in Figs. 370 and 371 respectively.
Figs. 372, left, 373, right. Oscillogram of voltage taken across V and VI is
shown in Fig. 372. Fig. 373 shows the voltage across the same points, butwith a shorter exposure of the photographic film. Note the transients in
Fig. 372, indicated by the faint vertical lines below the wave, but not visible
in Fig. 373.
of the filter system, is shown in figure 372. Figure 373 is a duplicate
of figure 372, except for two items: First, figure 372 is a 3-second ex-
posure, whereas figure 373 is a ^-second exposure. A transient is
present in figure 373, but the "streamers” or "off-shoots”, productive
of r-f. interference, while visible upon the screen, did not record upon
the film. The long exposure is the reason for the very thick lines in
figure 372.
Maximum separation between the secondary contacts resulted in the
voltage waveform image across P-1 and the center tap, shown in figure
374. Arcing occurred at the contaas named. The effect of very little
spacing between the contacts is shown in figure 375. The voltage wave-
fonii was established across the same points.

292 THE CATHODE-RAY TUBE AT WORK
Readjustment for symmetrical waveform developed the image
shown in figure 376. The introduction of 0.5-ohm resistance in series
with the battery, resulted in a change in the waveform of figure 376 to
figs, 374, left, 375, right. The effect of maximum and minimum separation
between the secondary contacts is shown in Figs, 374 and 375 respectively,
that shown in figure 377. The output voltage also dropped from a
normal of about 245 volts to about 150 volts. This is the voltage
measured across the 5000-ohm load.
Figs. 376, left, 377, right. The oscillogram of Fig. 376 was made after the
contacts had been restored to normal. When a .5-ohm resistor was connectedin series with the battery, the oscillogram of Fig. 377 was obtained.
Starting with the normal adjustment of figure 376, removal of the
buffer condenser developed the-waveform in the primary circuit, shown
in figure 378. The output voltage was 160 volts. Under the same
conditions the voltage waveform of the secondary circuit was like that
Figs. 378, left, 379, right. The waveform taken in the primary circuit whenthe buffer condenser was removed is shown in Fig. 378. The waveform of the
secondary circuit under similar conditions is shown in Fig. 379.

AUTO RADIO VIBRATOR TESTING 293
shown in figure 379. The excessive amount of sparking is clearly
evident. With a .001-mfd. buffer condenser, the voltage rose to 170
volts, and the voltage across the secondary winding is shown in figure
380. With .005-mfd. as the buffer condenser, the voltage rose to 244
volts and the waveform is shown in figure 381.
Once more we wish to say that these oscillograms are offered purely
to show the application of the cathode-ray oscillograph to the servicing
and adjustment of auto-radio vibrators and not as images to be used
Figs. 380, left, 381, right. When a .OOI-tnf. condenser was used as a buffer, the
waveform of Fig. 380 was obtained. When the capacity was increased to
.005 tnf. the oscillogram of Fig. 381 resulted.
for comparison with what may appear upon the screen of the tube
which you may be using. Of course, a certain amount of general prac-
tical data can be gathered from these pictures, but the qualifications wehave mentioned still stand.

CHAPTER IX
TRANSMITTER ADJUSTMENT
The cathode-ray oscillograph is of excellent utility during the adjust-
ment of a transmitter. While it is true that our experimental work did
not cover all types of transmitters, we feel that the oscillograms pre-
sented in the following pages should serve as guides to those men, par-
ticularly the amateurs, who operate low powered "ham” transmitters
and who have been interested in the application of the cathode-ray oscil-
lograph as a means of adjusting correctly the various circuits which com-
prise the complete unit. For that matter, the data should also be of
interest to the men who operate modulated oscillators in laboratories
and who desire data concerning the various adjustments.
Modulation Measurement and Analysis
One of the most Important types of information, which operators of
transmitters and oscillators require, is the existing percentage of modu-
lation, when an audio tone is superimposed upon the r-f. carrier.
Furthermore, examination of the modulated wave envelope pattern
can furnish a great deal of data concerning the operation of the com-
plete unit, when interpretation is correct. There are several ways of
establishing patterns which will enable the determination of the per-
centage of modulation.
There are three types of patterns which can be developed with ease.
One of these is the modulated wave envelope showing amplitude modu-
lation, an example of which is illustrated in figure 382. The second
type of pattern is the trapezoid, showing the relation between the car-
rier amplitude and the modulating signal voltage amplitude, which is
illustrated in figure 383. The third type of pattern, which, for the
want of a better name is called a block pattern, is illustrated in
figure 384. This is a photograph. It is related to the pattern show-
ing the modulated wave envelope, except that the image is not spread
by the timing wave. Instead the pattern shows streaks of varied in-
294

TRANSMITTER ADJUSTMENT 295
tensity, the width of which can be used to establish the percentage of
modulation. The modulated wave envelope pattern of figure 382 is
developed by means of the arrangement shown in figure 385. The
modulated output signal voltage is secured from the source by some suit-
Figs. 3S2, left, 383, right. A modulated wave envelope showing amplitude
modulation is shown in Fig. 382. A trapezoidal pattern showing the relation
between the carrier amplitude and the audio signal amplitude is shown in
Fig. 383.
able means of coupling, so that a reasonably strong signal is available.
The modulated signal is applied to the vertical deflection plates. The
cathode-ray oscillograph is adjusted as for regular waveform examin-
ation. The linear sweep circuit is used and is adjusted to some sub-
Figs. 384, left, 384-A, right. Two block patterns are here shown. That of
Fig. 384 has fifty percent, modulation and that of Fig. 384-A is modulatedone hundred percent.
multiple frequency of the modulation frequency. The exact sweep fre-
quency depends upon the number of cycles of the modulated wave en-
velope, desired upon the screen. Internal synchronization can be used
except where the percentage of modulation is very low.
Adjustment of the transmitter should be accomplished with the Class
C stage working into a dummy antenna. The pick-up may be several
turns of wire loosely coupled to the output tank. If sufficient voltage
is not obtained, an additional Lo-C tank may be link coupled to the
final tank. In any case, the r-f. voltage should be taken from the final
tank with the amplifier working into a normal load.

296 THE CATHODE-RAY TUBE AT WORK
Another consideration must be recognized. This relates to the fre-
queng of the carrier and to the mode of connection to the vertical de-
flection plates. The amplifier associated with the vertical deflection
plates has a definite frequency limit, which usually is 100,000 cycles.
If the carrier frequency is higher than this figure, it is necessary to con-
nect directly to the vertical deflection plate, without going through the
amplifier. The low side of the signal supply circuit can be connected
to any ground upon the oscillograph. Adjustment of the modulated
signal pick-up may be required in order to keep the image upon the
screen.
The percentage of modulation can be determined by applying the fol-
lowing equation:
_ E Max — E MinPercent Modulations: v 100
E Max -f E Min
in accordance with the data shown in figure 382.
The units in which E Max and E Min are measured are unimportant
as long as they are the same for both. If E Max is 2 inches and E Min
is .5 inch, the percentage modulation is (2 — -r- (2 -4- V2 ) ^ 100 =60%. It is unnecessary to interpret the deflection on the screen in
terms of actual voltage.
The trapezoidal pattern of figure 383 is established by applying the
modulated r-f. signal voltage across the vertical plates and applying the
To riCOULATED.Voltaic Source
^ LiNCARSweep
Fig. 38S. The modulated wave envelope of
Pig. 3S2 is developed with the arrangementshown on the left. For frequencies above 100kc., it is necessary to connect directly to the
free vertical plate. See text.
modulating signal voltage (audio signal) across the horizontal plates.
To assure the correct trapezoidal pattern, the modulating signal should
be secured from the output of the modulator stage. The circuit arrange-
ment is shown in figure 386. As stated in connection with figure 385,
it may be necessary to feed the modulated signal voltage directly to the
Fig. 386. The connections shown at the left
are used for developing the trapezoidalpatterns.
To MoOUt-ATORlilBcOoTlw'klTPOT?^
free vertical deflection plate. The audio voltage from the modulator
can be applied to the horizontal deflection plates through the regular

TRANSMITTER ADJUSTMENT 297
terminals. The horizontal deflection amplifier in the cathode-ray oscil-
lograph, if such an amplifier is available, can be used as a gain con-
trol, governing the width of the pattern.
Determination of the percentage modulation is carried out by apply-
ing the equation previously stated in accordance with the designation
shown upon figure 383.
Developing the Trapezoidal Pattern
Speaking about trapezoidal patterns, ir might be well to show how
this type of pattern is developed. It will do much towards clarifying
the reasons why certain peculiar shapes appear and just why phase
Figs. 3S6-A, above, 3S6-B, below. How a trapezoidal pattern is developed onthe screen of a cathode-ray tube. The pattern enclosed in the small circle,
Fig. 3S6-B, is what actually appears on the screen. The sweep voltage is in
phase with the modulated wave.
difference between the original audio input signal and the modulation
component of the modulated wave distorts the trapezoid.
We stated that the trapezoid figure establishes the relation between
the modulated signal and the audio-frequency component. The vertical
displacement of the spot is accomplished by the modulated carrier vol-
tage and the horizontal displacement of the spot is accomplished by the

298 THE cathode-ray TUBE AT WORK
audio voltage, which is used to modulate the carrier. Since the rate
of amplitude modulation of the carrier is at the modulating frequency
and since this same frequency is used as the timing base or sweep fre-
quency to move the spot in the hori2ontal direction, the two voltages
are automatically synchronized and the pattern remains stationary.
Examine figure 386-A. This illustration shows two cycles of the
modulated wave envelope and one cycle of the audio voltage. The num-
bers upon the audio outline of the modulated wave correspond with the
numbers upon the audio wave, because they are identical. The negative
peak of the modulated wave corresponds to the negative peak of the
audio wave. Since both calves of the modulated wave are identical we
can number like positions of the envelope in like manner. The hori-
zontal displacement of the spot is accomplished, as has been stated, by
the audio voltage. For the sake of illustration, we show a sine audio
wave and sine modulation.
Displacement of the spot across the screen in one horizontal direc-
tion is accomplished by the change in voltage between points 1 and 6
of the audio wave. The return trace of the spot in the horizontal direc-
tion is accomplished by the change in voltage between points 6 and 12
of the audio wave, so that the completed pattern really consists of two
traces, but since the displacement of the spot is occurring at a fast rate,
the pattern appears as a single image. When the spot is in position
O along the "X” axis, it is being displaced along the vertical or "Y”
axis by the voltage difference between 0-0 of the modulated wave at
that instant, a single line is evident upon the screen. It is to be
remembered that the vertical motion of the spot takes place at the
carrier frequency and it is the peak amplitude of the carrier which is
determined by the audio modulation. As the horizontal displacement
of the spot moves towards the other end of the screen, that is towards
position 6, the peak amplitude of the modulated signal voltage is also
increasing at exactly the same rate, so that as the spot reaches posi-
tions 1, 2, 3, 4, etc. along the horizontal axis, the modulated carrier
voltage also reaches points, 1, 2, 3, 4, etc. and the displacement of the
spot in the vertical direction is determined by the peak voltages between
points 1-1, 2-2, 3-3, 4-4, etc. of the modulated wave.
It stands to reason that as the spot moves in the horizontal direc-
tion from 1 to 6, that vertical displacement will also take place for the
various peak values of the modulated carrier, so that at any instant, lines,
such as are shown for spot positions 1 and 2, would appear upon the
screen.

TRANSMITTER ADJUSTMENT 299
As the spot moves to 6, representing the limit of the sweep in one
direction, the vertical displacement corresponds to the modulated peak
voltage between points 6-6 upon the modulated curve. As the spot
starts moving back across the screen and reaches point 8 upon the
horizontal sweep voltage curve, the vertical displacement is that due
to the peak voltage between points 8-8 upon the modulated wave. This
point corresponds with points 4-4. As the spot reaches point 12 along
the horizontal sweep voltage curve, which is the audio voltage curve,
the vertical displacement is*that due to the peak voltage between 12-12.
This corresponds to points 0-0. The complete cycle is repeated dur-
ing the existence of the respective vertical and horizontal voltages. The
result is a stationary pattern of the type shown in figure 386-B. The
fact that the horizontal voltage or sweep voltage variation is not linear.
Fig. 3S6-C. The development of the
pattern is similar to that shown in Fig.
386-A with the exception that in this
case the sweep voltage is 45° out ofphase with the modulated signal. Thisis the type of pattern obtained whenthe sweep voltage is taken from somepart of the speech amplifier, other than
the modulator tube.
_i..n
but is sinusoidal, does not interfere with a linear pattern as long as the
amplitude variation of the modulated signal occurs at the same rate and
is of identical shape and correct phase. Provided the modulation is
linear, any complex modulating wave will produce a perfect trapezoid.
We stated that the phase relation between the audio voltage used
for the horizontal displacement of the spot and the modulated signal

300 THE CATHODE-RAY TUBE AT WORK
influenced the shape of the trapezoidal pattern. This is shown in
figure 386-C. The basic modulated signal is the same as in figure
386-A. However, the audio signal used for the horizontal sweep has
been displaced, so that the phase relation is changed slightly. The
phase loops which appear in the trapezoidal pattern are developed. This
is the type of pattern which results when the audio signal for the hori-
zontal sweep is secured from some part of the speech amplifier, other
than the modulator tube. The extent of the phase difference, as indi-
cated by the pattern, depends upon the phase displacement between the
signal at the point where the voltage is secured and the signal at the
output of the modulator stage. You will find several photographs
upon the pages following, which show photographically the difference
in the appearance of the trapezoidal image when the audio signal for
the horizontal displacement is secured from the input to the speech am-
plifier and from the modulator. Compare these photographs with the
pattern developed in figure 386-C.
Figure 386-D illustrates the development of a trapezoid pattern for
a state of overmodulation. The method outlined in figures 386-A and
rtg. 3S6-D. The effect of over modulation of the
modulated signal can be seen in the pattern de-
veloped. The sweep voltage is in phase with the
modulated signal in this instance.
386-C are applied to figure 386-D. While a distorted signal input
will not affect the linearity of the sides of the trapezoid, it will intro-
duce a series of bright vertical bands in the pattern corresponding to
the distortion present in the audio signal. Furthermore, you can ap-
preciate the formation of various kinds of patterns indicative of the
different troubles possible in a transmitter. Examples of such con-
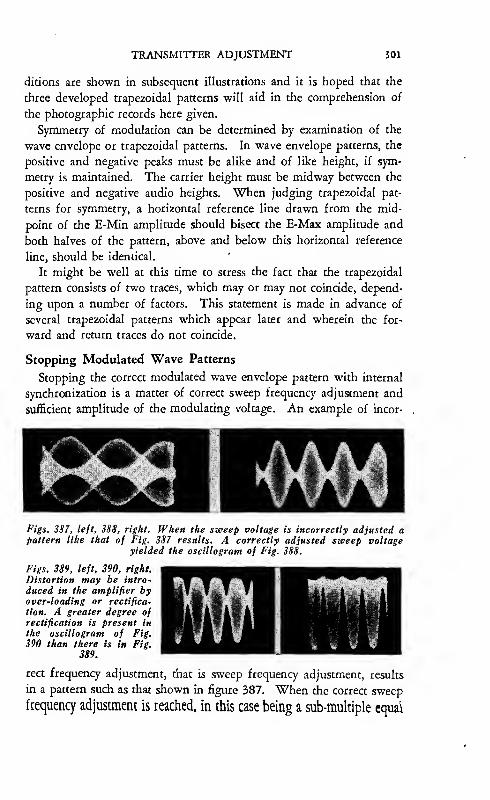
TRANSMITTER ADJUSTMENT 301
ditions are shown in subsequent illustrations and it is hoped that the
three developed trapezoidal patterns will aid in the comprehension of
the photographic records here given.
Symmetry of modulation can be determined by examination of the
wave envelope or trapezoidal patterns. In wave envelope patterns, the
positive and negative peaks must be alike and of like height, if sym-
metry is maintained. The carrier height must be midway between the
positive and negative audio heights. When judging trapezoidal pat-
terns for symmetry, a horizontal reference line drawn from the mid-
point of the E-Min amplitude should bisect the E-Max amplitude and
both halves of the pattern, above and below this horizontal reference
line, should be identical.
It might be well at this time to stress the fact that the trapezoidal
pattern consists of two traces, which may or may not coincide, depend-
ing upon a number of factors. This statement is made in advance of
several trapezoidal patterns which appear later and wherein the for-
ward and return traces do not coincide.
Stopping Modulated Wave Patterns
Stopping the correct modulated wave envelope pattern with internal
synchronization is a matter of correct sweep frequency adjustment and
sufficient amplitude of the modulating voltage. An example of incor-
Figs. 387, left, 388, right. When the sweep voltage is incorrectly adjusted apattern like that of Fig. 387 results. A correctly adjusted sweep voltage
yielded the oscillogram of Fig. 388.
Figs. 389, left, 390, right.
Distortion may be intro-
duced in the amplifier byover-loading or rectifica-
tion. A greater degree of
rectification is present in
the oscillogram of Fig.
390 than there is in Fig.
389.
rect frequency adjustment, that is sweep frequency adjustment, results
in a pattern such as that shown in figure 387. When the correct sweep
frequency adjustment is reached, in this case being a sub-multiple equal

302 THE CATHODE-RAY TUBE AT WORK
to % of the modulating frequenqr, the pattern of figure 387 becomes
that shown in figure 388.
A perfea modulated signal, fed into the vertical amplifier of the
cathode-ray oscillograph or into an external amplifier for amplification,
may be distorted as a result of overloading and rectification in the am-
plifier. Resulting patterns appear as shown in figures 389 and 390, the
latter indicating a greater degree of rectification than is shown in fig-
ure 389.
Transmitter Adjustment
The transmitter used in the tests to be described is of the "ham”type, operating at 80 meters. The circuit of the system is shown in
two parts, in figures 391 and 392. The variable controls shown in the
6 5 4 3 2 t
schematics and which generally are not found in such transmitter sys-
tems, were deliberately installed in order that means be available
whereby sub-normal and abnormal conditions could be introduced.

ZCOOOi
TRANSMITTER ADJUSTMENT 303
The transmitter is rated at 10 watts, 100 percent, modulation, of
course variable percentage modulation is available. It is crystal con-
trolled, with a buffer stage and power amplifier. The modulator system
employs a class A stage and a class B stage.
Tests made upon this transmitter were substantiated with experi-

504 THE CATHODE-RAY TUBE AT WORK
merits conducted on other transmitters, so that the results shown herein
can be said to be generally applicable to systems of similar design. It
is, of course, necessary that you realize the actual significance of these
patterns. Furthermore, that the appearance of identical patterns upon
the screen in the tube, which is being employed for the adjustment
of a transmitter, would require duplication of identical conditions.
Consequently the patterns we show herein should be classified as pat-
terns typical of the conditions stated. It is, therefore, possible and
likely that tests made upon transmitters under similar conditions would
result in patterns which would resemble those given herein, but which
would not be identical. It has been our experience that the greatest
resemblance would occur in the trapezoidal patterns rather than in the
modulated wave envelope patterns.
Figs. 393, left, 394, middle, 39S, right. The three oscillograms were madewith 100 percent, modulation. The pattern of Fig. 395 differs from that of
Fig. 394 because of phase shift.
We Start with all adjustments correct, showing the correct 100 per-
cent modulated wave envelope and the correct trapezoidal patterns.
As stated before the audio voltage for the trapezoidal pattern was
secured from the output circuit of the modulator stage. These two
correct patterns, to be used for comparison of shape and not amplitude,
are shown in figures 393 and 394. The effect upon the trapezoidal
pattern, due to phase shift, is shown in figure 395. The difference be-
tween the patterns shown in figures 394 and 395 is due to the fact
that the audio voltage used for the horizontal displacement of the
spot was secured from two different parts of the transmitter. The voltage
for figure 394 was secured from the output of the modulator stage. The
voltage for figure 395 was secured from the input to the speech am-
plifier. In all of the tests shown, the audio voltage was 400 cycles and
of sine waveform.
From this point on, we shall show a number of oscillograms indi-
cating different operating conditions of the transmitter. Since the
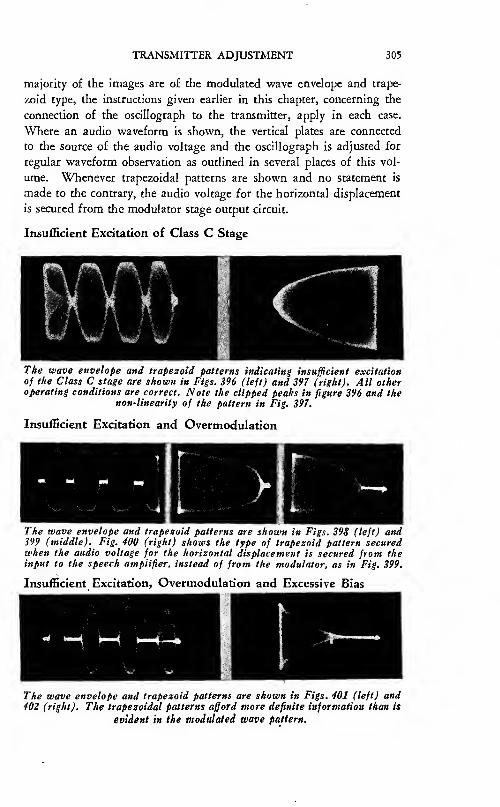
TRANSMITTER ADJUSTMENT 305
majority of the images are of the modulated wave envelope and trape-
zoid type, the instructions given earlier in this chapter, concerning the
connection of the oscillograph to the transmitter, apply in each case.
Where an audio waveform is shown, the vertical plates are connected
to the source of the audio voltage and the oscillograph is adjusted for
regular waveform observation as outlined in several places of this vol-
ume. Whenever trapezoidal patterns are shown and no statement is
made to the contrary, the audio voltage for the horizontal displacement
is secured from the modulator stage output circuit.
InsulEcient Excitation of Class C Stage
The wave envelope and trapezoid patterns indicating insufficient excitation
of the Class C stage are shown in Figs. 396 (left) and 397 (right). All otheroperating conditions are correct. Note the clipped peaks in figure 396 and the
non-linearity of the pattern in Pig. 397.
Insufficient Excitation and Overmodulation
The wave envelope and trapezoid patterns are shown in Figs. 398 (left) and399 (middle). Fig. 400 (right) shows the type of trapezoid pattern securedwhen the audio voltage for the horizontal displacement is secured from theinput to the speech amplifier, instead of from the modulator, as in Fig. 399.
Insufficient Excitation, Overmodulation and Excessive Bias
The wave envelope and trapezoid patterns are shown in Figs. 401 (left) and402 (right). The trapezoidal patterns afford more definite information than is
evident in the modulated wave pattern.

306 THE CATHODE-RAY TUBE AT WORK
Overmodulation
The wave envelope and trapezoidal patterns indicating overmodulation withall other conditions normal, is shown in Figs. 403 (left) and 404 (right)
Non-Linear Operating Conditions, Excessive Bias
The wave envelope and trapezoidal patterns for this condition are shown in
Figs. 405 (left) and 406 (right). Note that the condition is not as evident in
the modulated wave pattern as in the trapezoidal pattern.
Overmodulation With Distorted Audio
The wave envelope, trapezoidal and audio patterns are shown in
Figs. 407, 408 and 409. All other conditions are normal. Evidence of
distortion of the audio signal is seen in the trapezoidal figure, in that the
intensity of the pattern is greater in certain places than in others.
Correlation between the shape of the audio voltage and the formation
of the trapezoidal pattern will show that positions corresponding to the
positive and negative loops, in distorted voltages of the type shown,
slow down the movement of the spot and result in increased brightness
of the line. We assume a sine wave input to the speech amplifier.
High Excitation, Overloaded Speech Amplifier, Insufficient
Modulator Capability
Figures 410, 411 and 412 indicate a peculiar condition, one which
is not often experienced in actual practice. Figure 410 shows the modu-
lated wave. Figure 411 shows the corresponding trapezoid and figure
412 shows the audio output at the modulator. An examination of fig-
ure 410 shows that the desired 100-percent, modulation is not obtained.

TRANSMITTER ADJUSTMENT 307
Figs. 407, 40S and 409 show the wave envelope, trapezoidal and audio pat-
terns of an overmodulated wave with distorted audio.
Fig. 410 is the modulated wave. Fig. 411 is the corresponding trapezoid andFig 412 shows the modulator output. In this case observation of the modu-lated wave envelope indicates the existing condition more definitely than
does the trapezoid.
At the same time, the speech amplifier and modulator stages are over-
loaded, in the effort to modulate the r-f. carrier to the full value. The
trapezoidal pattern indicates that linear modulation of the carrier is
being achieved. Proper adjustment of the transmitter then requires
several considerations: One is reduction of the excitation, so that it is
possible to cut down the gain in the speech amplifier and modulator in
order to achieve distortionless output and still modulate the carrier 100
percent. The other is to keep the carrier at the high level and to make
changes in the speech amplifier and modulator system. The former is
true only if what we have classed here as being high excitation, actually
represents an adjustment which, based upon the design of the complete
transmitter, is excessive excitation. The existence of audio distortion is
indicated in the trapezoid by the light and dark portions.

308 THE CATHODE-RAY TUBE AT WORK
Fig. 413 (left) indicates the modulated wave during excessive regeneration
and Fig. 414 (middle) shows the equivalent trapezoidal pattern. Fig. 414-A(right) is another trapezodial pattern indicating improper neutralization
adjustment.
Fig. 415 (left) indicates the modulated wave. Fig. 416 (middle) shows the
equivalent trapezoidal pattern and 417 (right) shows the audio wave acrossthe modulator output. Note that the oscillation starts suddenly, persists forawhile and then dies oat daring each cycle. Note the resulting dip in the
audio wave
Fig. 418 shows the modulated wave. Fig. 419 shows the correspondingtrapezoidal pattern and Fig. 420 shows the audio wave across the modulatoroutput during the operative condition stated. The sudden start and cessation
of the uncontrolled oscillation is clearly shown in Fig. 418.
Incorrect Neutralization
The effect of incorrect neutralization is indicated in a number of os-
cillograms. In two cases, the modulated wave, equivalent trapezoid
and the audio wave at the modulator are shown. In a third case, the
modulated wave and trapezoid only are shown. These oscillograms
are purely illustrative and cannot be associated with any specific ad-
justment other than the incorrect setting of the neutralizing control.
Consequently, the value of these oscillograms is found in the informa-
tion they convey concerning the general appearance of modulated waves
and trapezoidal patterns during excessive regeneration in the Class Cstage. See figures 413 to 420 above.
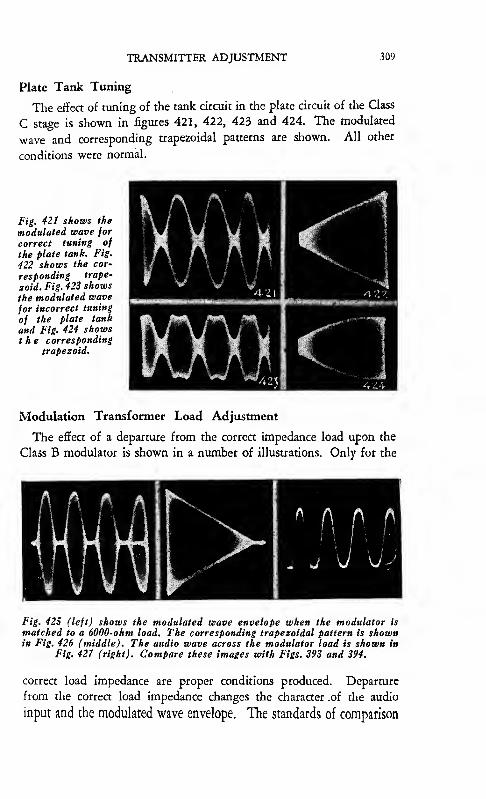
TRANSMITTER ADJUSTMENT 309
Plate Tank Tuning
The effect of tuning of the tank circuit in the plate circuit of the Qass
C stage is shown in figures 421, 422, 423 and 424. The modulated
wave and corresponding trapezoidal patterns are shown. All other
conditions were normal.
Fig. 421 shows the
modulated wave for
correct tuning of
the plate tank. Fig.
422 shows the cor-
responding trape-
zoid. Fig. 423 shows
the modulated wave
for incorrect tuning
of the plate tank
and Fig. 424 showsthe corresponding
trapezoid.
Modulation Transformer Load Adjustment
The effect of a departure from the correa impedance load upon the
Class B modulator is shown in a number of illustrations. Only for the
Fig. 42S (left) shows the modulated wave envelope when the modulator is
matched to a 6000-ohm load. The corresponding trapezoidal pattern is shownin Fig. 426 (middle). The audio wave across the modulator load is shown in
Fig. 427 (right). Compare these images with Figs. 393 and 394.
correct load impedance are proper conditions produced. Departure
from the correct load impedance changes the character .of the audio
input and the modulated wave envelope. The standards of comparison

310 THE CATHODE-RAY TUBE AT WORK
Fig, 428 (left) shows the modulated wave envelope when the modulator is
matched to a 2000-ohm load. The corresponding trapezoidal pattern is shownin Pig. 429 (middle^) and the audio voltage across the modulator load is
shown in Fig. 430 (right). Compare these images with Pigs, 393 and 394.
Fig, 431 (left) is an example of hum modulation of the carrier, which is
modulated at 1000 cycles. Fig, 432 (right) is an example of a pattern result-
ing from incorrect test connections.
Figs. 433 (left), 434 (middle), 435 (right). When the audio leads, whichwere the cause of the distorted pattern of Fig. 432, were removed, the pattern
of Fig. 433 was obtained, this being the correct one. Before the audio leadswere removed in a similar case, the pattern of Fig. 435 was on the screen,
the corrected pattern being shown in Fig. 434.
were shown in figures 393 and 394 . These two illustrations show the
standard and correct 100 percent, modulated wave and the correspond-
ing trapezoidal patterns. Incorrect adjustments are shown in figures
425 to 430 inclusive. The correct load impedance is 4000 ohms.
Tests were made with adjustments for a 2000-ohm load and a 6000-
ohm load. All other operating values are correct.

TRANSMITTER ADJUSTMENT 311
Improper Test Procedure
An example of the pattern resulting from incorrect test connections
is shown in figure 432. The oscillograph circuit was arranged to de-
velop the modulated wave pattern. However, the audio signal was
still connected to the horixontal plate binding posts, although these con-
nections were out of the circuit, because the horizontal sweep voltage
was the linear sweep voltage secured internally. Leakage between the
horizontal plate terminals and the horizontal plate circuit distorted the
pattern. The correct pattern developed, when the audio voltage leads,
which were used to develop the trapezoidal patterns, were removed, is
shown in figure 433.
Another example of a similar condition is shown in figures 434 and
435. The correct pattern is shown in figure 434. Due to the connec-
tion between the modulator plate circuit and the horizontal binding
posts, leakage occurred when developing the modulated wave pattern
and the distorted pattern, shown in figure 435, appeared upon the
screen. When the audio leads were removed, with everything else
left intact, the pattern of figure 435 changed to that shown in figure
434.
Distortion of the image is possible if, when making observations of
the modulated wave, the vertical deflection amplifier is in the circuit
and the gain control is not set to zero. This assumes that the modulated
carrier voltage is being fed directly to the vertical deflection plate and
not through the vertical amplifier. The form of distortion which occurs
is lack of symmetry of the pattern, that is the positive peaks may be
higher than the negative peaks, or vice-versa. The most feasible plan
is to keep the amplifier in the circuit, although the signal is not being
fed through the amplifier and to short circuit the amplifier input
terminals.

CHAPTER X
OTHER APPLICATIONS OF THE CATHODE-RAYOSCILLOGRAPH
In line with the statement that the cathode-ray oscillograph can be
used for the observation of various electrical phenomena, are observa-
tions of value in connection with the academic study of radio prin-
ciples. There are a number of subjects, which require extensive descrip-
tive discussion, particularly when variables are involved. A great deal
of time can be saved by the use of the cathode-ray oscillograph to illus-
trate the effect of these variables upon the final pattern. Take for ex-
ample the presence of two signals in an electrical circuit and the mixing
of these two voltages to form a beat pattern. It is to be understood
that the beat signal is not available until rectification takes place, but
the beat pattern, resulting from the mixing of the two signals, can be
viewed upon the cathode-ray screen.
Beat Patterns
Assume two unmodulated signals, say 1000 cycles and 1180 cycles.
The two oscillator output circuits are connected in series and fed into
Figs. 436 (left), 437 (middle), 438 (right). These three oscillograms wereobtained by connecting the output of two oscillators in series, each delivering
a different frequency. With the sweep frequency equal to the difference fre-quency, the oscillogram of Fig. 436 was obtained. The oscillograms of Figs.437 and 438 were obtained with the sweep frequency equal to one-half and
one-third the difference frequency respectively.
the vertical deflection plates. The horizontal displacement is secured
with the internal linear sweep oscillator, exactly as used for ordinary
waveform observation.
312

OTHER APPLICATIONS OF THE CATHODE-RAY OSCILLOGRAPH 313
With the sweep circuit adjusted to the difference frequency, a single
beat cycle pattern appears as in figure 436. With the sweep adjusted to
half the difference frequency, two cycles of the difference frequency ap-
pear as in figure 437. With the sweep frequency set to one third
of the difference frequency, three cycles of the di€erence frequency
appear upon the screen, as shown in figure 438.
CW Reception and Detection
The action taking place when a CW signal is heterodyned and rec-
tified is shown in figures 439 and 440. Two sine waves of compara-
tively low frequency were used. These two were fed into a diode rec-
Figs. 439 (left), 440 (right). When a CW signal is heterodyned and rectified,
the voltage across the detector input appears as shown in Fig. 439. Th^rectified voltage across the detector output is shown in Fig. 440.
tifier and the voltage across the diode load resistor was applied to the
vertical deflection plates. The internal sweep circuit was adjusted as for
ordinary wave form observation.
The voltage across the detector input is shown in figure 439. The
rectified voltage across the output circuit of the detector is shown
in figure 440. The relation between the signal amplitude and the
local heterodyning oscillator voltage amplitude can be shown upon the
screen by noting the amplitude of the output signal as the oscillator
voltage is varied over a prescribed range.
Industrial Applications
A number of very interesting industrial applications are described
in the May, 1935 issue of Electronics. The author isJ. M. Stinchfield.
In conneaion with such industrial applications, they employ means of
converting mechanical phenomena into electrical phenomena. For ex-

314 THE CATHODE-RAY TUBE AT WORK
ample, the cathode-ray tube can be used as a size tolerance indicator.
The capacity of a supplementary condenser, which influences the fre-
quency of an oscillator, is controlled mechanically by the device related
to the thickness of the item being checked. The voltage developed by
the oscillator is applied to vertical deflection plates. The length of the
line is used as the guide to tolerance or the tolerance is calibrated in
frequency and the frequency generated by the test oscillator is compared
with a standard frequency and the drift of the pattern upon the cathode-
ray screen is used as an indicator.
Pressure changes are determined by means of the cathode-ray oscil-
lograph, by having a quartz crystal, microphone diaphragm or any other
device, which can convert pressure changes into electrical impulses, feed
the vertical deflection plates through an amplifier.
Clock and watches may be compared with a standard, by having the
sound impulses picked up by microphones and fed inro the cathode-ray
tube in quadrature so as to form a Lissajous pattern.
The speed of moving contacts can be compared with standard fre-
quencies by having the contacts close a supplementary circuit.
A series of articles discussing the application of the cathode-ray oscil-
lograph to industrial problems is running at the time of this writing
in the monthly publication Instruments. The author is Ralph R.
Batcher.
Other Radio Applications
A very elaborate discussion of the application of the cathode-ray oscil-
lograph for direction finding in connection with radio signals, observa-
tion and study of atmospheric signals, prevention of collisions, etc., is
described in detail in "The Cathode-Ray Oscillograph In Radio Re-
search,” by R. A. Watson-Watt, published by His Majesty’s Stationery
Office, London, England.

APPENDIX
Testing Mixer Circuits
Reference is made on pages 216 and 217 to testing mixer systems for dis-
tortion. This can be done by using the tuned amplifier mentioned in this vol-
ume. The signal from the test oscillator is fed through the amplifier to the
cathode-ray tube and the character of the modulated wave is observed. Thiscan be done at frequencies as high as several megacycles, providing that the
modulated carrier signal is fed directly to the vertical deflection plates, withoutpassing through the vertical deflection amplifier.
Then the signal from the test oscillator is fed into the receiver and the tunedamplifier is connected across the output of the mixer tube and tuned to the
intermediate frequency of the receiver. The i-f. signal then is fed to thecathode-ray tube and the modulated wave examined. The character of the
signal should be the same as that which was originally secured from the test
oscillator.
Checking Test Oscillators
Reference is made on pages 209 to 220 to various test oscillators. Of the
various test oscillators checked, only one delivered a sine wave when the modu-lated wave was demodulated. Since the preparation of those pages, several
additional oscillators have been checked and have been found to deliver a sine
wave. One of these is shown below. Incidentally, the exploitation of the
cathode-ray oscillograph has created a very definite amount of interest in the
development of test oscillators intended for service operations and whichdeliver a sine wave when the modulated wave is demodulated.
Fig. 441. Fig. 442.
The sine wave at the left is the demodulated output of a recent commercialtest oscillator. At the right is shown the audio response curve of a trans-
former which covers a band from 0 to 10,000 cycles. Note that one half ofthe pattern is here present, the other half of the trace being eliminated byshorting the sweep circuit during half of the revolution of the rotating
condenser.
A-F. Frequency Modulator
In connection with the a-f. frequency modulators discussed on pages 280 to
286, the reference was made that one refinement was the removal of one of the
traces of the double trace pattern, so that a greater amount of space wasavailable upon the screen. An example of such a pattern, creared by using
a short circuiting contact, so that the sweep circuit was shorted during one
315

316 THE CATHODE-RAY TUBE AT WORK
half of the rotating cycle of the frequency modulating condenser, is shown above.
This is the response curve of an audio-frequency transformer over a 0 to 10,000cycle band.
Photographing the Image
The following is offered to those who are interested in the photographing ofthe image which appears upon the cathode-ray oscillograph screen. The state-
ments we mention are exactly in accordance with the photographing of thepatterns shown in this volume and represent our experience.
It was found that practically identical results were obtained when either the
RCA 906 cathode-ray tube, which fluoresces green, or the RCA 908 tube, whichfluoresces blue, were used. Super-Plenachrome film pack was found to be mostsatisfactory as the emulsion of this film is responsive to both blue andgreen light.
The camera was of a standard type, with an f 4.5 lens and with a bellows
long enough so that the camera could be placed from 10 to 18 inches from thecathode-ray viewing screen. Focussing of the image upon the ground glass is
vital to successful photography.
Practically all the oscillograms illustrating this book were photographed with
the camera stop at f 4.5, because maximum speed was highly desirable anddepth of focus was of no importance. If a lens slower than f 4.5 be used,
difficulty will be experienced in photographing moving patterns, because of the
increased time of exposure necessary.
The image upon the screen may be photographed in daylight or in a darkened
room. The choice depends upon the nature of the image, particularly, the in-
tensity of the image. No hood is requited over the cathode-ray tube. All of
the photographs in this book, which show the screen, were taken in broad day-
light. The determining influence is the image. If it is stationary and simple
in character, it can be photographed in daylight. The other photographs shownin this volume, which appear with a solid black background, were taken in
darkness. By darkness, we mean the shades were pulled down, so as to exclude
the sun light. Every oscillogram shown in this volume is an unretouchedphotograph.
Concerning the speed of the lens, the highest speed consistent with goodphotography is desired. An idea of the type of image resulting from various
exposure speeds can be had from the plate shown below. Six exposures weremade upon the same plate, at speeds ranging from 1/25 of a second to 3 seconds.
The image was stationary and the 908 tube was used. The stop was set to 4.5.
The frequency of the voltage being photographed was 1000 cycles.
As is evident the best detail is had at about l/5th of a second. This checks
with our experience. The majority of the photographs shown in this volumewere taken at speeds ranging from 1/5 to Yz second. Those exposures which
show the screen were taken at speeds of from y2 second to about 1 second.
Moving patterns, unless they ate moving fast, can be photographed at about
I/5th second with good results, providing that the intensity cf the image is
sufficiently great and it is properly focussed upon the camera. Such patterns
were photographed in the darkened room. Proper focussing of the image uponthe cathode-ray tube screen, likewise is important.
The size of the film is not very important—a convenient size is 2l4x3l/i
inches (6x9 cm.).
The camera must be mounted upon a substantial tripod if good pictures are
to be secured. Enough trouble develops due to movement of the image, so that
the situation should not be aggravated by having the camera move. As a mat-
ter of fact, we suspended a heavy weight from the head of the screw which
mounts the camera upon the tripod, to secure rigidity.

APPENDIX 317
FiS. 443. Fig. 444.
The oscillogram at the left is a quadruple exposure, each one being made at
l/S of a second, f 4.5. This illustrates the phase relations in a circuit con-
taining capacity, inductance and resistance. The sweep was synchronized
with the oscillator supplying the circuit. The illustration at the right showsthe effect of exposure time upon the image. The numbers at the right indicate
the time in seconds. The intensity and focus of the image were unchangedand the waves were positioned on the one film by elevating the lens.
Clough-Brengle Sweep
The oscillogram of figure 257 is slightly more linear than actually appears in
the illustration. The state of non-linearity was augmented slightly by the fact
that the other sweep which was used to spread the image was not a perfect sawtooth wave at 80 cycles.
High Frequency Sweep Circuits
A high frequency sweep circuit covering the range from about 4 to 12megacycles is described in the June, 1935, issue of the /. R. E. Proceedings.
The authors are T. T. Goldsmith, Jr. and L. A. Richards.
Simultaneous Traces
One of the units which has been found very helpful in connection withcathode-ray oscillographic equipment is a switching means whereby two or
more voltages can be fed to the cathode-ray oscillograph for simultaneous ap-
pearance upon the screen. Actually, these patterns are not upon the screen at
the same time; they appear alternately, but at such high speed that they appearto be upon the screen at the same time. Such equipment is suitable for the
comparison of waveforms, phase, etc. By means of suitable biasing units withinthe equipment, the various images can be positioned upon the screen to suit
whatever requirement exists.
One such commercial device is known as the Dumont electronic switch andconsists of a switching tube, which is a multi-vibrator, and two amplifier channels,
thus permitting the switching of two voltages from any source, and two patterns
upon the screen. A mechanical arrangement consisting of a motor driven camwith contacts, enabling the application of three voltages from three different

318 THE CATHODE-RAY TUBE AT WORK
soiurces is described in June, 1933, issue of Electronics. The author is
C. Bradner Brown.
Signal Synchronized Sweep
A sweep circuit which will automatically synchronize with a signal over a
very wide range of frequencies, is described in the May, 1935, issue of Elec-
tronics,
Sine Wave Relaxation Oscillator
Reference to relaxation oscillators in this volume stated that the output wave-form was extremely distorted and rich in harmonics. An article describing a
relaxation oscillator, which will deliver a sine wave output, is to be found in the
March, 1935, issue of Electronics.
Checking A-F. Amplifiers
An article describing the checking of audio-frequency amplifiers with a
saw tooth wave input voltage, is described in the March, 1931, issue of the
/. R. E. Proceedings. The author is Herbert J. Reich. Distortion and phase can
be determined.Another article concerning audio amplifier checking, already mentioned in
this volume, appeared in the September, 1927, issue of the 1. R. E. Proceedings.
The authors are Diamond and Webb.
Alignment
An article describing the application of the oscillograph to visual alignment
appears in the October, 1932, issue of the I. R. E. Proceedings. The author is
O. H. Schuck.
Frequency Analysis
An article describing the application of the oscillograph to the frequency
analysis of a complex wave, appears in the October, 1932, issue of the I R. EProceedings. The author is W. L. Barrow.
Resonance Curves
A method of obtaining frequency response curves with the cathode-ray oscil-
lograph is described in the January, 1934, issue of the I. R. E. Proceedings. Theauthor is Guenther Ulbrict.

APPENDIX 319
DuMont 148 Cathode-Ray Oscillograph
Two views of this instrument are shown herewith. At this writ-
ing the circuit diagram of the unit is not available; in fact the infor-
mation which follows was received just in time to be included in the
second printing of this book.
The oscillograph employs either a type 34-H or 54-H DuMontcathode-ray tube, the former being a 3-inch and the latter a 5 -inch
tube. Two amplifiers, linear from 10 to 100,000 cycles, are provided.
One can be used for horizontal and one for vertical deflection or the
two amplifier stages can be cascaded to amplify the signal to the ver-
tical deflection plates. When one amplifier is used the gain is approxi-
mately 25; when used in cascade, the gain is approximately 250. The
amplifier gain controls have scales for the purpose of resetting and
comparison.
Two views of the DuMonttype 14S oscillograph. All the
controls, with the exception
of the spot positioning adjust-
ments, can be seen on the
front panel.
A basically new sweep design is used in this unit which has a num-
ber of advantages over previous circuits. The frequency range of
the sweep is from 10 to 200,000 cycles per second, allowing both audio
and radio frequency waves to be observed. A type 57 pentode is used
as a current limiting tube, providing a substantially linear sweep over
the entire range. The discharge tube used is a DuMont type 128 mer-
cury vapor tube, which has a much faster de-ionization time than a
gas discharge tube and increases the speed of the return trace. Animportant feature of this sweep circuit is that it can be synchronized
with fractions of the wave as well as with multiples of the wave.
Two screw driver adjustments are provided at the side of the case
for borh vertical and horizontal beam-centering adjustment. A remov-

320 THE CATHODE-RAY TUBE AT WORK
able calibrated scale, to be used in conjunction with the 54-H tube, is
provided so that quantitative measurements can be made.
Reference to the illustration will show that all the controls are acces-
sible on the front panel. These are the intensity, focus, fine and rough
frequency, amplitude, vertical amplifier gain, horizontal amplifier gain,
and the switching controls. It will be noted that the latter control
permits six different amplifier arrangements by means of which the
signal and sweep can be applied to the oscillograph plates. This is
accomplished by means of a 6 position-five gang switch.
United Sound Engineering Co. CR-3 Oscillograph
This recently announced oscillograph incorporates a vertical and hori-
zontal amplifier, a linear sweep oscillator, and both horizontal and ver-
tical beam-centering adjustments. The frequency of the sweep oscillator
is divided into eight logarithmically-spaced ranges and a control is
provided for continuous variation of the sweep frequency. External,
internal, or 60-cycle synchronization is available by means of a switch
on the panel.
The horizontal and vertical amplifiers have identical characteristics
and are linear from 15 to 100,000 cycles, being down about 20 db. at
300 kc. The range of the sweep oscillator is from 15 to 20,000 cycles.
All the controls and terminals are conveniently located on the front
panel. The instrument is completely a-c. operated and employs the
following tubes; 906, 879, 885, 80, and two 57’s.
United Sound Engineering Co. CR-5 Frequency—Modulated
Oscillator
The extent of the frequency modulation in this unit is maintained
approximately constant at about 20 kc. This is accomplished by varying
the maximum capacity of the rotating condenser in accordance with
the dial setting. An internal impulse generator provides a peaked wave-
form suitable for synchronization. Audio modulation is efi^ected by
means of a sine-wave oscillator, which can be used externally for audio
work. Either a single or double image trace can be used.
Visual Alignment at 600 kc.
There has been some confusion as to the proper procedure to be
followed in effecting the alignment of the series oscillator trimmer at
the low frequency end of a band, say at 600 kc. To clear up this

APPENDIX 325
matter we shall go over the procedure in some detail. To take a con-
crete illustration, we shall assume that the intermediate frequency is
450 kc. The first step after aligning the i-f. amplifier is to align the
r-f., detector and oscillator shunt trimmers in the conventional way
at the high frequency end of the broadcast band, say 1400 kc. With
this completed, the signal generator (test oscillator) is set at 600
kc. and connected to the receiver antenna post. It should be under-
stood that the frequency-modulated signal generator is producing not
only 600 kc., but a band of frequencies ranging from say 585 to 615
kc. The receiver is tuned to 600 kc. and the resonance curve appears
on the screen. From this point on we shall consider first the proce-
dure when the single image system of frequency modulation is used.
In this case there will be just a single trace, the peak of which may
or may not be in the center of the trace. The adjustment of the
series oscillator trimmer should then be made so that the resonance
curve has the greatest height, regardless of whether this maximum
peak occurs in the middle of the trace. This is highly important
and even though it may be necessary to change the receiver tuning
slightly, the procedure is to adjust the trimmer for the greatest peak
height. The significance of the peak being off center is that the
calibration of the receiver is off at 600 kc. If the oscillator trimmer
Figs. 445, left, 446, middle, 447, right. Pig. 445 shows an incorrect adjust-
ment of the padding condenser, whereas Fig. 446 shows the correct adjust-
ment. In Fig. 447 the tuning has been changed to bring the peak to thecenter of the trace.
is adjusted so that the peak is in the center of the trace when the
receiver and signal generator are tuned to 600 kc., then the sensitivity
and selectivity of the receiver are sacrificed for the sake of an improve-
ment in the calibration of the receiver. This is certainly an undesir-
able condition. Fig. 445 shows the incorrect adjustment which re-
sults when the peak is centered, whereas Fig. 446 shows the improve-
ment in response which resulted when the series oscillator trimmer
was adjusted for maximum height, in spite of the fact that the peak

322 THE CATHODE-RAY TUBE AT WORK
happened to occur off the center of the trace. To bring the peak back
to the center of the trace, the receiver tuning can be changed and the
amount by which it must be changed to bring the peak to the center
indicates how far off the receiver calibration is. Referring back to
Fig. 447, the peak was brought to the center by changing the receiver
tuning from 600 kc. to 595 kc. This means that the receiver calibra-
tion at 600 kc. is off by 5 kc. It should be clearly understood that
the optimum adjustment is attained when the r-f. and detector stages
are tuned to the incoming signal and the oscillator frequency is higher
than the signal frequency by the amount of the intermediate frequency.
In this case, the r-f. and detector stages are tuned to 600 kc. and the
oscillator frequency is 1050 kc.
Figs. 448, left, 449, middle, 450, right. An incorrect adjustment of the series
oscillator trimmer is shown in Fig. 448. Figs. 449 and 450 indicate the correct
condition, the receiver tuning having been changed to obtain Fig. 450.
The procedure to be followed when the double image system is
used requires further explanation. In general, a double trace will
appear on the screen when the receiver and the signal generator are
tuned to 600 kc. Now the important point is this: in contrast to
the usual procedure, wherein the trimmer adjustments are made so as
to bring the two curves into coincidence, in this case the series oscil-
lator trimmer is adjusted for maximum output, regardless of whether
this may or may not bring the two curves together. Fig. 448 shows
the incorrect adjustment made so that the two curves are brought into
coincidence. The improvement in sensitivity, when the series oscil-
lator trimmer is adjusted so that the peak height,of the curves is a
maximum, is shown in Fig. 449. Note that while the curves no longer
coincide, at the same time, the gain and selectivity of the receiver have
been appreciably increased. The curves, of course, can be brought
together by retuning the receiver. Again the amount by which it is
necessary to change the receiver tuning is a measure of the extent to
which the calibration is off. The appearance of the trace when the
curves are brought together is shown in Fig. 450.
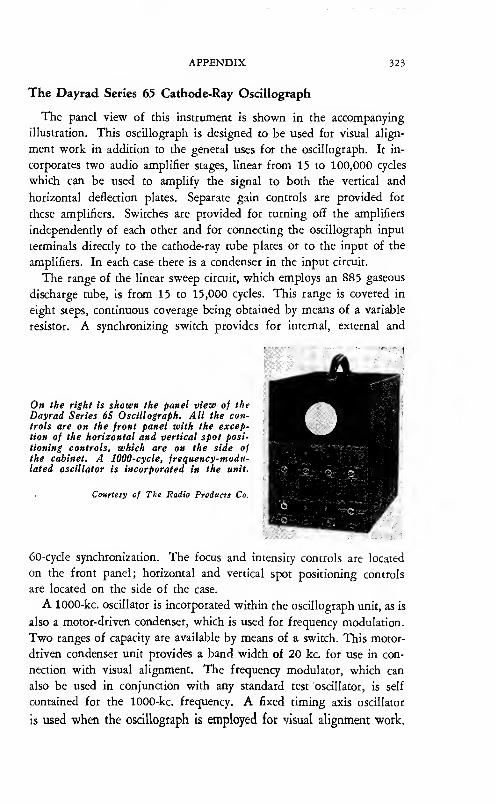
APPENDIX 323
The Dayrad Series 65 Cathode-Ray Oscillograph
The panel view of this instrument is shown in the accompanying
illustration. This oscillograph is designed to be used for visual align-
ment work in addition to the general uses for the oscillograph. It in-
corporates two audio amplifier stages, linear from 15 to 100,000 cycles
which can be used to amplify the signal to both the vertical and
horizontal deflection plates. Separate gain controls are provided for
these amplifiers. Switches are provided for turning off the amplifiers
independently of each other and for connecting the oscillograph input
terminals directly to the cathode-ray tube plates or to the input of the
amplifiers. In each case there is a condenser in the input circuit.
The range of the linear sweep circuit, which employs an 885 gaseous
discharge tube, is from 15 to 15,000 cycles. This range is covered in
eight steps, continuous coverage being obtained by means of a variable
resistor. A synchronizing switch provides for internal, external and
On the right is shown the panel view of the
Dayrad Series 6S Oscillograph. All the con-
trols are on the front panel with the excep-tion of the horizontal and vertical spot posi-
tioning controls, which are on the side of
the cabinet. A 1000-cycle, frequency-modu-lated oscillator is incorporated in the unit.
Courtesy of The Radio Products Co.
60-cycle synchronization. The focus and intensity controls are located
on the front panel; horizontal and vertical spot positioning controls
are located on the side of the case.
A 1000-kc. oscillator is incorporated within the oscillograph unit, as is
also a motor-driven condenser, which is used for frequency modulation.
Two ranges of capacity are available by means of a switch. This motor-
driven condenser unit provides a band width of 20 kc. for use in con-
nection with visual alignment. The frequency modulator, which can
also be used in conjunction with any standard test oscillator, is self
contained for the 1000-kc. frequency. A fixed timing axis oscillator
is used when the oscillograph is employed for visual alignment work.

324 THE CATHODE-RAY TUBE AT WORK

APPENDIX 325
This consists of a condenser charging circuit and shorting cam, which
works on the same motor shaft as the frequency modulator ;in this way
the resonance curve is kept on the screen, regardless of shift in line
voltage or change in motor speed.
Supreme Model 555 Cathode-Ray Oscillograph
This instrument is self-coneained for both visual alignment work
and for the usual oscillographic functions. It incorporates a signal
generator, which covers the frequency range from 125 kc. to 60 me.,
and which provides a frequency-modulated signal having a constant
band-width over this range. Frequency modulation is effected by
varying the permeability of an iron core, which is used in the tuned
The Siifireme Model 55S Oscillograph has
incorporated in it a signal generator with a
frequency range from 12S kc. to 60 me. There
is also an a.-f. generator whose output ranges
from 50 to 10,000 cycles.
Courtesy Supreme Instruments Corp.
circuit of the fixed-frequency oscillator. This is heterodyned with a
variable-frequency oscillator and produces the range of frequencies
mentioned above with a constant band-width of 24 kc. A transparent
celluloid screen, calibrated in kc. off resonance, is provided for quanti-
tative measurements.
The system of frequency modulation employed in this oscillograph
is of interest. A 60-cycle sweep voltage is applied to die horizontal
plates, and at the same time a 120-cycle current is passed through the
partially-saturated iron core of the fixed-frequency oscillator which
normally operates at 600 kc. This 120-cycle current is obtained from
the output of a full-wave rectifier. As a result of the variation of the
saturating current of the iron core, the oscillator frequency is varied
from 588 kc. to 612 kc. at such a rate that the output of the oscillator
sweeps through 600 kc. four times in each complete cycle of the hori-
zontal spot movement. It follows, then, that four complete resonance
curves are traced out each time the spor travels back and forth across
the screen of the cathode-ray tube.

326 THE CATHODE-RAY TUBE AT WORK
Typical resonance curves produced by this instrument are shown ir
the accompanying illustrations. Note that two of the resonance curve;
appear in the center of the screen and appear to be similar to the con-
ventional double image patterns which appear elsewhere in this book
The two vertical lines appearing at the extremities of the pattern are ir
reality two additional resonance curves which appear as straight line;
The left pat
tern shows thi
circuit in resonance and that a,
the right t the cir
cuit out of res-
onance. Theseoscillogr anti
made with the
Supreme 5S5.
because of the comparatively slow horizontal movement of the spot ai
the extremities of the screen. This slow movement is due to the fact
that a sine-wave voltage is used for the horizontal sweep, as we men-
tioned above. The phasing of this 60-cycle sweep voltage is perma-
nently adjusted at the correct value and no synchronizing adjustment is
necessary when the oscillograph is used for alignment work.
It is important to note that the resonance curves which appear in the
center of the screen are both due to frequency sweeping through reson-
ance in the sam.e direction. The fact that one image is reversed from
left to right with respea to the other, is due to the fact that the spot
is travelling in different directions for the two traces.
This type of double image pattern should be distinguished from the
conventional type of pattern in which the two traces are due to reson-
ance curves which are traced out by the frequency of the signal gen-
erator sweeping through resonance in different directions.
In addition to the r-f. signal generator, the oscillograph contains
an audio oscillator, continuously variable from 50 to 10,000 cycles.
The oscillograph is provided with both horizontal and vertical am-
plifiers. The gain of these amplifiers is 40 and the frequency response
is substantially flat from 20 to 90,000 cycles. The switching arrange-
ment permits the signal under study to be fed through the amplifiers
or connected directly to the plates. Each amplifier is provided with
a gain control and a scale graduated in 50 divisions to facilitate com-
parative tests.
The range of the linear sweep circuit, which employs an 885 tube,
from 15 to 20,000 cycles Synchronization is provided so as to

APPENDIX 327
permit internal, external or 60-cycle synchronization. Included among
the controls are the intensity, focus and spot positioning controls. The
convenient arrangement of the controls is evident in the accompany-
ing illustration.
Change in RCA TMV-122-B Oscillographs
The effectiveness of sweep synchronization at the higher frequencies
in models bearing serial numbers up to 1000, can be improved by re-
placing condenser C-18 with a %-watt, 10,000-ohm resistor. This con-
denser is easily accessible, being mounted at the end of the resi.Stor-
condenser board, which is in a vertical position near the front of the
chassis. As may be seen by reference to the schematic, which appears
on page 100, this condenser is shunted across the secondary of the
synchronizing transformer T-2 and so tends to bypass the synchronizing
voltage at the higher frequencies. There is no necessity for making this
change unless the oscillograph is used at frequencies above 25 kc.
Hickok Model RFO-1 Cathode-Ray Oscillograph
The panel view and schematic of this instrument are shown in the
accompanying illustrations. Designed to be used for both visual align-
0» the right is the front view of the HickokModel RFO-1 Oscillograph. The schematicdiagram of this instrument will be found onthe next page. In the revised model the spotpositioning controls, as well as all the others,
are on the front panel.
Courtesy Hickok Electrical Instrument Co.
ment and general work, this oscillograph incorporates an electronically
frequency-modulated r-f. oscillator in addition to the usual features.
Amplifiers which are linear to 100,000 cycles and which have a gain
of 40, are included in both the horizontal and vertical deflection cir-
cuits. An 885 tube is used in the linear sweep circuit to provide a
frequency range of 10 to 25,000 cycles. A synchronizing control permits


APPENDIX 329
of either internal, external or 60-cycle synchronization. Focus and
intensity controls, as well as horizontal and vertical positioning controls,
are located on the front panel.
The radio-frequency section of the oscillograph unit provides a fre-
quency-modulated output at 700 kc., the band-width being variable
from 5 kc. to 30 kc. The output of this oscillator is variable up to 3
volts, and contains sufficient harmonic output to permit alignment up
to 10 me. The choice of self-contained frequency is convenient in that
it permits visual alignment at both 700 kc. and at 1400 kc. This fre-
quency-modulated oscillator can be used in conjunction with a standard
test oscillator to provide a frequency-modulated signal of variable fre-
quency by the usual heterodyne method, the extent of frequency modu-
lation remaining constant.
The mbes used are 1-906 cathode-ray tube; 1-879 half-wave recti-
fier; 1-885 gaseous discharge tube; 1-6D6 as an electronic frequency
modulator; 2-6D6’s as horizontal and vertical deflection amplifiers;
1-41 as an r-f. oscillator.
Triumph Model 180 Frequency-Modulated Oscillator
This frequency-modulated oscillator, shown in the accompanying
figure, covers the range from 100 kc. to 30 me. and provides a band-
The range of the Triumph frequency-modu’lated oscillator. Model 180, is from 100 kc,
to 33 me. The frequency modulation is ac-
complished electronically.
Courtesy Triumph Mfg, Co.
width constant at 30 kc. over this entire range. Constant band-width
is secured by heterodyning a frequency-modulated “fixed-frequency”
oscillator, working at 840 kc., with a variable-frequency oscillator con-
tained within the unit. A dual attenuator is provided for controlling
both the input to and the output of the mixer tube. The frequency mod-
ulation is accomplished electronically. If a frequency-modulated signal
is not desired, a switch is provided so that the instrument can be used
for conventional alignment work.

330 THE CATHODE-RAY TUBE AT WORK
Triumph Model 800 Cathode-Ray Oscillograph.
This oscillograph employs two 6C6’s as vertical and horizontal ampli-
fiers. Individual gain controls ate provided, which give a maximum
Schematic diagram of the Triumph Model SOO cathode-ray oscillograph. Notethe two rectifiers, the type 879 supplying the high voltages for the cathode-ray tube, type 906, and the type SO supplying the bias and plate voltages for
the remainder of the tubes.
amplification of approximately 40. A type 80 tube is used to supply
power for both amplifiers and for the linear sweep circuit, which em-
ploys an 885 tube. A type 879 rectifier supplies the high voltage re-
quirements of the 906 cathode-ray tube.
The input impedance, when using either amplifier, is 500,000 ohms.
When using the direct connection to either set of plates, the input
impedance is one megohm with d-c. blocking condensers within the
unit. The deflection sensitivity is 75 volts per inch or 27 rms volts per
inch directly to the plates and with either the vertical or horizontal
amplifiers, the sensitivity is increased to about 2 peak volts per inch or
0.7 rms volts per inch.

appendix 331
Included among the controls, which are arranged as shown in the
On the right is shown the
Triumph Model SOO oscillo-
graph, the schematic diagram
of which appears on the op.
posite page. The various
controls are described in the
accompanying text.
Courtesy Triumph Mfg. Co.
accompanying illustration, are the following: focus, intensity, vertical
selector switch (providing a 60-cycle, direct, or through amplifier con-
nection to the vertical plates), internal-external synchronizing switch,
locking control, step and vernier sweep-frequency controls, horizontal
gain, vertical gain, and horizontal selector switch. The schematic is
shown in the accompanying figure.
R.C.A. Type 913 Cathode-Ray Tube
A new cathode-ray tube which is characterized by its small size and
low cost, has recently been announced by R.C.A. While this tube differs
in construction from the larger tubes which have been previously
described, the application of the tube is essentially the same. For this
reason it is unnecessary for us to explain here how the tube is employed
for the study of waveforms, modulation, frequency measurements, etc.
The 913 cathode-ray tube is of the high-vacuum type, utilizes the all-
metal type of construction, and employs a viewing screen which has a
diameter of approximately one inch as compared with the conventional
tube, which has a diameter of at least three inches. It contains two
sets of deflection plates which are at right angles to each other, and, as
in the case of the 906, one plate in each set is tied to a common point
inside the tube. The low voltage requirements of the tube are of special

332 THE CATHODE-RAY TUBE AT WORK
interest inasmuch as a brilliant green trace is obtained at voltages as
low as 250 volts.
The introduction of this tube has already greatly extended the field
of application of the cathode-ray tube and promises to continue to do
so. In many cases this does not mean that the larger type of cathode-
ray tube will be displaced, but rather that the low cost, small sixe, and
low voltage requirements of the 913 are making for its use in equip-
ment which would not ordinarily employ a cathode-ray tube. In service
equipment where a large image, although desirable, is not essential, the
new tube is rapidly becoming an integral part of the equipment being
oflfered to the serviceman by the instrument manufacturers. Aside from
the additional saving in space and the increased portability, made
possible through the use of the 913 in such equipment, the lower cost is
enabling more and more servicemen to afford and enjoy the advantages
and help of the cathode-ray oscillograph in diagnosing faults in radio
receivers and public address equipment.
The Alignment of Automatic Frequency Control Circuits
The cathode-ray oscillograph and the frequency modulated signal
generator can be used for aligning automatic frequency control cir-
cuits, and in this conneaion two typical oscillograms indicating cor-
rect and incorrect alignment are shown in the accompanying figure.
The left oscillo-
gram shows theA.P.C. circuit in
correct align-
ment and the
other, incorrect
alignment.
While it is not possible for us to go into any detail as to the various
connections and considerations involved in this type of alignment work,
the entire subject of automatic frequency control is fully covered in
another book by this author.

INDEXAlignment
(See Resonance Curves)
at wrong frequency, 269
Automatic Frequency Control, 332circuit connections, 260, 266
incorrect band width, 269, 271
insufficient band pass, 271
rectification for visual, 257
requirements for correct, 261
600 kc., 320Amplifier
alignment of r-f. and i-f.
(See Resonance Curves)
calibration of oscillograph gain con-
trols, 176, 177
checking audio overload of, 188,
189, 190, 191. 192, 193
checking Class B, 201, 202, 203, 204
checking frequency response of,
280-286, 315
checking Class C (See Transmitter
Adjustment)
checking i-f. overloading, 193, 194,
195, 196, 197, 198
checking phase inversion of, 207,
208, 209checking tone control action of,
224, 225, 283, 284, 315
distortion in, 185, 186, 187, 188,
189, 190, 191, 192, 193
effect of—on apparent waveform,
121, 128, 129, 130, 131
horizontal deflection, 4, 93, 94, 97,
100, 101, 102, 103, 106, 107
hum in, 220, 221, 222, 223, 224
phase shift in, 134, 135, 136, 137,
190, 192, 193, 199, 200, 201, 318
rectification in, 301
sweep circuit, 100, 102, 103, 106,
107
vertical deflection, 4, 93, 94, 97,
100, 101, 102, 103, 106, 107
Anodegeneral, 4
RCA, 8, 9, 14
voltage in series with, 155
Western Electric, 7, 17
Axis
•X"—30, 32, 33, 35, 45. 50, 110,
135, 136, 152
"Y”—30, 32, 33, 35. 45, 50, 110,
135, 136, 152
Beat patterns
312
C-W detection
313
Calibration
AC ammeter of, 177AC voltmeter of, 173
DC ammeter of, 172
DC voltmeter of, 168frequency, 118, 123, 124, 125,
139, 141-160
oscillator, 157of sweep as standard, 156voltage sensitivity, 24, 168-172, 173,
174, 175
Cathodecold, 1, 4, 6
hot, 1, 2, 3, 7, 8, 9, 17Cathode-ray tube
Dumont, 5
National Union, 5
RCA, 5, 8, 331types, 2, 5
Western Electric, 7Condenser power factor
206, 207
Current measurementsa-c., 177
d-C., 172
Deflection
coils, 20, 44direction of, 22-37, 44, 110, 113electrostatic, 3, 5, 7. 9. 20, 169,
170, 171, 173
magnetic, 3, 5, 20, 44, 163, 166plates, 3, 5, 7, 9, 20, 26, 77, 110,
171
sensitivity, 3, 4, 25, 171
voltage, 3, 20, 25, 41, 48, 49, 77.
81, 83, 169, 170, 171, 173Demodulator output
193, 194, 195, 196, 197. 198, 199,
213, 214, 215, 216, 217, 259,
281, 313Demodulated wave
213, 214. 215, 216, 217, 313
Electric field
direction of, 23, 25, 44
333

334 INDEX
Focusing
electrostatic, 10, 14, 114
gas, 3, 10, 17
magnetic, 10, 19
optical analogy of, 10, 11
Frequency
comparison of, 137, 142-160
distortion, 186, 280limit of amplifiers, 97limit of sweep circuits, 70, 71, 108,
317
standards, 73, 139, 156
Frequency modulators (A-F)280-286
Frequency modulator (R-F)
constant band width type, 231, 274Clough-Brengle motor driven, 237double image, 245, 246, 247, 248,
249
dynamic input capacity type, 235electrically operated, 233, 235
iron core type, 233
motor driven condenser, 228-233,
235
oscillator circuits, 228, 229, 231,
233, 256, 258RCX modulating condenser, 236single image type of, 250, 254, 255,
259, 274-278
sweep circuits used with, 237, 238synchronizing pulse from, 237, 242
synchronization of, with horizontal
sweep, 242-250, 272, 273
Triumph, 329United Sound Engineering, 320variable band width type, 228, 229
Glow tube oscillator
59
Hysteresis measurement
166-168
Linear time axis
(See Sweep Circuits)
Lissajous figures
79, 81, 83, 84, 87, 89, 125-126,
132, 135-160
amplitude of voltages, 139
circular, 154, 155
frequency comparison with, 137
frequency limits, 138
frequency standards, 139, 156
interpreting, 141-153, 156-160
Lissajous-Ryan patterns, 206, 207
phase patterns, 79, 81, 83, 87, 89,
135-137, 145, 146
phase splitting circuits, 154, 155
power factor patterns, 206, 207
Magnetic field
direction of, 44, 163, 166
Modulation(See Transmitter)
hum, 221, 310
percent of, 295
Modulated waves
checking, in i-f. amplifiers, 194-199
distortion of, 301
hum in, 221
stopping, 301, 302
test oscillator, 209-217
Oscillators
audio output of, 213, 214
block patterns, 211, 219, 295
distorted output from, 218, 219
modulated output from, 213, 214,
215, 216, 217, 304-310
multi-vibrator type, 71
output wave correction, 218, 219
relaxation, 59, 67, 69, 72
sine output from, 211, 218, 219
transmitter adjustment, 302-310
OscillographsClough-Brengle, 107
Day-Rad, 323Dumont, 99, 319Egert, 257
General Radio, 108
Hickok, 327Kaltman-Romander, 103
National, 105
National Union, 95
RCA, 99, 327Supreme, 325Triumph, 330United Sound Engineering, 320
Peak voltage measurement
173
Persistence of Vision
37Phase
amplitude of voltage for tests, 79-
81, 135-137
distortion, 199-201, 265
inversion, 207-209
measurements, 135-137
of Lissajous pattern, 79, 81, 83, 84,
87, 89, 135-137, 145, 146
patterns, 79, 81, 83, 84, 134-137,
142, 143, 145, 146, 190-193
relations in amplifiers, 189-193
relation between a-f. and modulated
INDEX 335
wave, 297-300, 304, 305
relation between sweep and other
voltage, 49, 79, 81, 83. 84, 124,
126, 245-250
relation between voltages, 79, 81,
83, 84, 87, 89, 135-137. 145-146,
180-185
shift, 166
shift due to synchronization, 126
splitting circuits, 154, 155
Photographyof images, 316
Quadrantsposition of, 31, 39
Regeneration
in amplifiers. 270, 271, 277, 308
Response curves
A-F., 282, 283, 284, 285
R-F. (See Resonance curves)
Resonance curves
asymmetrical, 246, 247, 248, 249.
251, 255. 262
circuit connections for, 260, 266
conditions of alignment, 269
damped circuit, 279
determining band width of, 273
development of, 245, 246, 247
dimensions of, image, 278
double image, 245, 246, 247, 248,
249, 251, 267, 269, 271, 272,
273
double peaked, 246, 247, 248, 252,
265
insufficient band pass of, 271
not synchronized, 272, 273
overall receiver, 277
overloaded tube circuit, 269, 2V6
phase distorted, 265
regeneration in circuit, 262, 270,
271, 277
single peak, 245, 248, 249, 253,
255, 261, 265, 267, 269, 270, 271
square top, 245
symmetrical, 245, 248, 249, 252,
253, 255. 261, 265, 269, 271, 277
triple peak, 249, 261, 262, 277
with carrier voltage, 267
with harmonics, 268
with modulation on, 267
Screenquadrants of, 31, 39
size of, 5
structure of, 3
vision, 37
Sensitivity
3, 4, 18, 24, 168-175
Spot intensity
operation of, control, 114
RCA, 15
Western Electric, 17, 18
Spot position
5, 8, 14, 22, 27-37, 39, 40, 44, 110-
114
Spot size
20. 110, 115
Structure
Dumont tubes, 5
National Union tubes, 5, 8, 9
RCA tubes, 5, 8, 9
Western Electric tubes, 7, 8
Sweep voltage
amplitude of, 68, 121, 122, 130
circuits, 59, 67, 69, 71, 72, 97,
100, 104, 105, 106, 256, 258
condenser charge, 65
control of, 117
development of, 48-52
distortion due to, 75, 121, 122,
126, 131
electronic systems for generating,
59, 67. 69, 71, 72, 97, 100, 104,
106
frequency modulator, 233, 236, 238-
250, 254, 271, 276, 280-286, 315
frequency of, 70, 71, 108, 118, 317
frequency standard, 73, 156
linear, 63, 65, 68, 131
multi-vibrator source of, 71
non-linear, 61, 65, 68, 105, 131
patterns, 61, 63, 65, 68, 73, 238
potentiometer source of, 27-37, 49,
57
relation between other voltage and,
49, 52, 55, 74, 75, 79, 81, 83. 91,
118, 121, 122, 126, 131, 312
synchronization of, 123, 124, 125,
126, 127
tubes, 59, 67, 69, 71, 72. 97, 100,
104, 106Synchronization
control adjustment, 119, 157, 211
during alignment, 236, 237, 272,
273
external, 127
in commercial units, 97, 100, 104,
106

336 INDEX
over, 126
relation to vertical amplitude, 129,
130
under, 123, 124, 125. 125
60 cycle pulse, 128
Transmitter
Adjustments of, 294-310
Trapezoidal patterns
development of, 297, 299, 300
normal, 295, 297, 304, 309overmodulation, 300, 305, 306, 307,
309patterns. 295. 297. 299, 300, 304-
310
percent modulation, 295, 296phase shift in, 299, 304, 305
Tube characteristics (dynamic)electromagnetic deflection, 166
electrostatic deflection, 160-163
Vibrators (auto-radio)
287-293
Voltage measurementsa-c., 173
d-c., 168
Waveformsby magnetic deflection, 163-165
block patterns showing, 211, 219
checking demodulated, 198, 199,
204, 205
class B operation, 204Clough-Brengle sweep, 238, 317
complex, 178-185
development of, 74-76
distorted, 127
distortion in amplifiers, 185-193
distorted, in Lissajous patterns, 14?
distortion of, by non-linear sweep,
75, 131
effect of exposure on, 317
horizontal amplitude, 121, 122, 130
hum modulation, 221
presence of carrier in, 199power supply, 224selection of sweep frequency, 118,
119, 122, 124, 125
showing phase distortion, 200
study of, 178-185
sweep, 61, 63, 68, 73sweep circuits for studying, 47-76
synchronizing control, 119, 120,
123-127
test oscillator, 209-220
vertical amplitude, 128, 129vibrator, 287-293