the export performance of the turkish …
TRANSCRIPT

THE EXPORT PERFORMANCE OF THE TURKISH MANUFACTURING INDUSTRIES WITH RESPECT TO SELECTED COUNTRIES
A THESIS SUBMITTED TO THE GRADUATE SCHOOL OF SOCIAL SCIENCES
OF MIDDLE EAST TECHNICAL UNIVERSITY
BY
ÖZGE TATARER
IN PARTIAL FULFILLMENT OF THE REQUIREMENTS FOR
THE DEGREE OF MASTER OF SCIENCE IN
DEPARMENT OF ECONOMICS
AUGUST 2004

Approval of the Graduate School of Social Sciences
Prof. Dr. Sencer AYATA Director
I certify that this thesis satisfies all the requirements as a thesis for the degree of
Master of Science.
Prof. Dr. Erol ÇAKMAK Head of Department
This is to certify that we have read this thesis and that in our opinion it is fully
adequate, in scope and quality, as a thesis for the degree of Master of Science in
Economics.
Prof. Dr. Güzin ERLAT Supervisor
Examining Committee:
Assoc. Prof. Dr. Kıvılcım Metin ÖZCAN (BİLKENT, ECON)
Prof. Dr. Güzin ERLAT ( METU, ECON)
Prof. Dr. Haluk ERLAT (METU, ECON)

iii
I hereby declare that all information in this document has been obtained and presented in accordance with academic rules and ethical conduct. I also declare that, as required by these rules and conduct, I have fully cited and referenced all material and results that are not original to this work.
Name, Last Name: Özge TATARER
Signature:
iv
ABSTRACT
THE EXPORT PERFORMANCE OF TURKISH MANUFACTURING
INDUSTRIES WITH RESPECT TO SELECTED COUNTRIES
Tatarer, Özge
M.Sc. Department of Economics
Supervisor: Prof. Dr. Güzin Erlat
August 2004, 116 pages
The objective of this paper is to analyze the export performance of Turkish
manufacturing industries in the East-Asian countries between the years 1992-2002.
SITC (Rev.3), three digit data were used in calculations and three methodologies
were applied in order to discover promising sectors of the Turkish exports. Constant
Market Share Analysis was used to explain the causes of the change in the market
shares of the exports of Turkey from one period to another. Revealed comparative
advantage indices were calculated to determine sectors in which Turkey had
comparative advantage. Grubel-Lloyd Index was used to determine the rate of intra-
industry trade. Results signal important changes in the export structure of Turkey.
Key words: Export Performance, Constant Market Share Analysis, Revealed
Comparative Advantage, Grubel-Lloyd Index
v
ÖZ
TÜRK İMALAT SANAYİİNİN İHRACAT PERFORMANSININ SEÇİLMİŞ
ÜLKELER AÇISINDAN DEĞERLENDİRİLMESİ
Tatarer, Özge
Yüksek Lisans, Ekonomi Bölümü
Tez Yöneticisi: Prof. Dr. Güzin Erlat
Ağustos 2004, 116 sayfa
Bu çalışmanın amacı, Türk İmalat Sanayiinin 1992-2002 yılları arasında,
Doğu Asya ülkelerindeki ihracat performansını değerlendirmektir. Hesaplamalarda
SITC (Rev.3), üç basamaklı veriler kullanılmış ve Türkiye’nin ihracatında gelecek
vadeden sektörlerin belirlenmesinde başlıca üç yöntem uygulanmıştır. Sabit Pazar
Payı Analizi, Türkiye’nin ihracatındaki pazar paylarındaki iki dönem arasındaki
değişimin nedenlerini açıklamak için; Açıklanmış Karşılaştırmalı Üstünlükler
Analizi, Türkiye’nin karşılaştırmalı üstünlüğe sahip sektörlerinin belirlenebilmesi
için; Grubel-Lloyd Endeksi, endüstri içi ticaretin seviyesini belirlemek için
kullanılmıştır. Sonuçlar, Türkiye’nin ihracat yapısında önemli değişikler olduğunu
göstermektedir.
Anahtar Kelimeler: İhracat Performansı, Sabit Pazar Payı Analizi, Açıklanmış
Karşılaştırılmalı Üstünlükler, Grubel-Lloyd Endeksi
vi
ACKNOWLEDGEMENTS
I would like to thank Prof. Dr. Güzin ERLAT for her valuable comments, guidance and help in the preparation of this thesis. I would like to thank Assoc. Prof. Dr. Kıvılcım Metin ÖZCAN and Prof. Dr. Haluk ERLAT for their participation in my examining committee and for their precious comments and suggestions. I am grateful to Yaşam BAŞTİMUR for his technical assistance, unforgettable encouragement and patience. I would also like to thank Asım Göker KESKİN for his technical help in the preparation of this thesis. Finally, I am grateful to my mother Gülnihal TATARER and my fiance Mustafa BÜYÜKYAĞCIOĞLU for their endless support and trust in me.
vii
TABLE OF CONTENTS
PLAGIARISM iii
ABSTRACT iv
ÖZ v
ACKNOWLEDGEMENTS vi
TABLE OF CONTENTS vii
LIST OF TABLES viii
LIST OF FIGURES xi
CHAPTER
1. INTRODUCTION 1
2. LITERATURE SURVEY 3
3. GENERAL STRUCTURE OF TRADE BETWEEN TURKEY
AND EAST-ASIAN COUNTRIES 12
4. CONSTANT MARKET SHARE ANALYSIS (CMSA) 22
4.1 CMSA With Respect to Each Country 25
4.2 CMSA With Respect to Group Countries As A Whole 27
5. REVEALED COMPARATIVE ADVANTAGE 36
6. MEASUREMENT OF INTRA INDUSTRY TRADE:
GRUBEL-LLOYD INDEX 49
7. EVALUATION OF THE RISING SECTORS IN THE EXPORT PERFORMANCE OF TURKEY WITH RESPECT TO EAST ASIAN COUNTRIES 52
8. CONCLUSION 57
REFERENCES 61 APPENDICIES
A. DATA 64
B. SITC (REV.3), THREE DIGIT CLASSIFICATION LEVEL 65
C. TECH. CHARACTERISTICS OF THE SECTORS IN SITC 74
D. APPENDIX TABLES 75
viii
LIST OF TABLES
Table 1 Overall Summary of the Major CMS Models, Their Founders and
Followers………………………………………………………………….3
Table 2 Main Indicators of the East-Asian Economies……………………………12
Table 3 Trade Balance of Turkey with East Asian Countries (million $)…………17
Table 4 Technological Characteristics of the goods which are exported to
East-Asian Countries (%) ………………………………………………..18
Table 5 Technological Characteristics of the Goods which are Imported From East-
Asian Countries (%) ………………………………………………….....18
Table 6 Hirschman-Herfindahl Index (Exports)……………………………….......20
Table 7 Hirschman-Herfindahl Index (Imports)…………………………………...20
Table 8 CMSA including three effects (% changes) ………………………...…. ..25
Table 9 CMSA including five effects (% changes) ……………………….………28
Table 10 Rising Sectors in the 1992-1997 Period ………………………………...30
Table 11 Rising Sectors in the 1998-2002 Period....................................................32
Table 12 Rising Sectors in the 1992-2002 Period ......................…….....................33
Table 13 Number of Sectors which have RCA …………………………………...37
Table 14 Percentage Distribution of Sectors which have RCA ..............................38
Table 15 Sectors in which Turkey has Revealed Comparative Advantage ………39
Table 16 Technological Characteristics of the Sectors with RCA (%) ...................48
Table 17 Aggregated Grubel-Lloyd Index (%) ………………………………….. 50
Table 18 Rising Sectors Which Were Selected by the CMSA and RCA
Methodologies ..........................................................................................53
Table D.1 Market Share of East-Asian Countries in Turkey's Total Exports (%)...75
Table D.2 Total Share of Turkish Exports in East-Asian Imports (%) ……….…..75
Table D.3 Market Share of East-Asian Countries in Turkey's Total Imports (%)...75
Table D.4 Total Share of Turkish Imports In East Asian Countries' Total Exports
(%)………...…………………...………………………………………76

ix
Table D.5 Technological Characteristics Of The Goods Which Are Exported To
China (%) ……………………………………………………………...76
Table D.6 Technological Characteristics Of The Goods Which Are Imported From
China (%)…………………………………………………………...….76
Table D.7 Technological Characteristics Of The Goods Which Are Exported To
Japan (%) ……………………….……………………………………..77
Table D.8 Technological Characteristics Of The Goods Which Are Imported From
Japan (%) ……………………………………………………………...77
Table D.9 Technological Characteristics Of The Goods Which Are Exported To
Korea (%)…………………….…………………………………….….77
Table D.10 Technological Characteristics Of The Goods Which Are Imported
From Korea (%)……………….……………………………………….78
Table D.11 Technological Characteristics Of The Goods Which Are Exported To
Malaysia (%)………………..…………………………………………78
Table D.12 Technological Characteristics Of The Goods Which Are Imported From
Malaysia (%)…………………………..……………………………….78
Table D.13 Technological Characteristics Of The Goods Which Are Exported To
Singapore (%) ………………………………….……………………..79
Table D.14 Technological Characteristics Of The Goods Which Are Imported From
Singapore (%) ……………………...………………………………….79
Table D.15 CMSA for China (% changes, 1992-1997)…………………………...80
Table D.16 CMSA for Japan (% changes, 1992-1997) ….………………………..81
Table D.17 CMSA for Korea (% changes, 1992-1997)…………………………...84
Table D.18 CMSA for Malaysia (% changes, 1992-1997)………………….…….85
Table D.19 CMSA for Singapore (% changes, 1992-1997) ……………….……...86
Table D.20 CMSA for China (% changes, 1998-2002)…………………………...88
Table D.21CMSA for Japan (% changes, 1998-2002) ……………………………91
Table D.22 CMSA for Korea (% changes, 1998-2002)…………………………...95
Table D.23 CMSA for Malaysia (% changes, 19982002)…………………………97
Table D.24 CMSA for Singapore (% changes, 1998-2002) ……………………..100

x
Table D.25 CMSA for China (% changes, 1992-2002)………………………….103
Table D.26 CMSA for Japan (% changes, 1992-2002) …………………………104
Table D.27 CMSA for Korea (% changes, 1992-2002)………………………….107
Table D.28 CMSA for Malaysia (% changes, 19922002)………………………..108
Table D.29 CMSA for Singapore (% changes, 1992-2002) ……………………..109
Table D.30 Turkey's RCA Indices for Individual Sectors………………………..110

xi
LIST OF FIGURES
Figure 1 Market Share of East-Asian Countries in Turkey's Total Exports (%)….13 Figure 2: Total Share of Turkish Exports in East-Asian Imports (%)…………..…15 Figure 3: Market Share of East-Asian Countries in Turkey's Total Imports (%).…15 Figure 4: Total Share of Turkish Imports In East Asian Countries' Total Exports
(%)……………………………………………………………………….16

1
CHAPTER 1
INTRODUCTION
The objective of this thesis is to analyze the export performance of Turkey
in a group of selected countries between the years 1992-2002. The basic motive
behind the analysis of export performance is to reflect the export structure of
Turkey in order to give some idea about the promising sectors in different markets.
We think that if Turkey is able to have an export structure which is in line with the
world trends in terms of commodity groups and country markets, it may be much
easier for her to attain a sustainable export growth.
China, Japan, Korea, Malaysia and Singapore were selected as the country
group1 for this investigation. There were two major reasons for this choice. First
and the most important reason was to analyze the export performance of Turkey
with respect to a country group that had not been studied before. Although
European Union (EU) countries, non-EU member OECD countries and the middle-
east countries constitute the major categories in Turkish trade, these countries were
analyzed fully in the studies of Erlat, Erlat and Özçelik (2003) and Erlat and Erlat
(2004). Accordingly, in order to establish an original study which provides different
information, East Asian countries were selected for this research.
Second reason for this choice was to evaluate the export performance of
Turkey in country markets which achieved high rates of export-led economic
growth and significant trade volumes. China has special importance in this study
since she is considered as one of the most challenging countries of the new century
with her incredible trade performance.
1 This country group will be called as “East-Asian countries” in the remainder of this study.

2
This study is based on three different methods in evaluating Turkish export
performance. The first method is the Constant Market Share Analysis (CMSA).
CMSA is a methodology which tries to project the possible causes of the change in
the market shares of the exports of a country from one period to another. The
second method is Revealed Comparative Advantage (RCA). RCA gives
information about the sectors in which a country has comparative advantage
relative to her trading partners. The last method is the Grubel-Lloyd Index (GL) and
it is used to measure the rate of intra-industry trade. With the use of Standard
International Trade Classification (SITC) Revision 3 (REV.3), three digit data2 and
through the use of these methodologies, Turkish export performance with respect to
East-Asian countries will be evaluated.
This study is organized as follows. Chapter 2 is a literature survey and it
reviews some previous studies about these three methodologies. The third chapter
summarizes the general structure of trade between Turkey and East-Asian
countries. Chapters 4, 5 and 6 give details of CMSA, RCA and GL methodologies
respectively and present the empirical results. Chapter 7 describes the rising sectors
which are selected simultaneously according to the methodologies used in this
thesis. Finally, Chapter 8 derives the main conclusions.
2 See Appendix A for the explanation about the data used and Appendix B for the details of the SITC (Rev.3), three digit classification.
3
CHAPTER 2
LITERATURE SURVEY
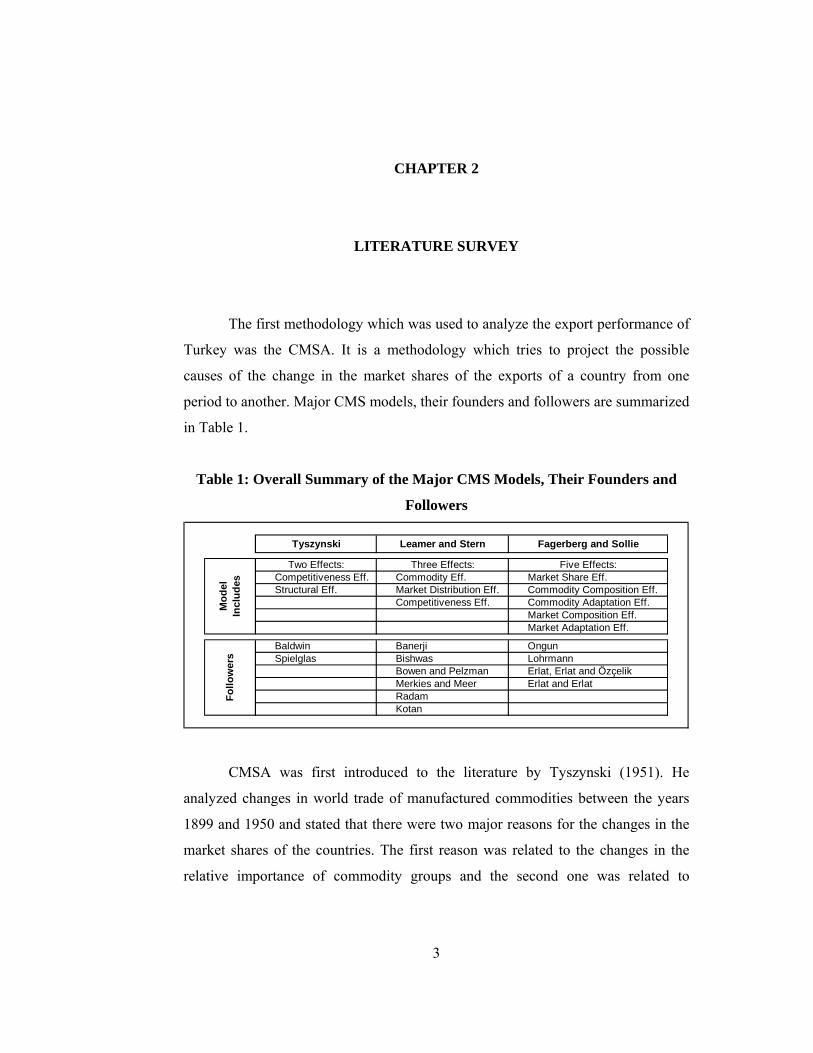
The first methodology which was used to analyze the export performance of
Turkey was the CMSA. It is a methodology which tries to project the possible
causes of the change in the market shares of the exports of a country from one
period to another. Major CMS models, their founders and followers are summarized
in Table 1.
Table 1: Overall Summary of the Major CMS Models, Their Founders and
Followers
Tyszynski Leamer and Stern Fagerberg and Sollie
Two Effects: Three Effects: Five Effects:Competitiveness Eff. Commodity Eff. Market Share Eff.Structural Eff. Market Distribution Eff. Commodity Composition Eff.
Competitiveness Eff. Commodity Adaptation Eff.Market Composition Eff.Market Adaptation Eff.
Baldwin Banerji OngunSpielglas Bishwas Lohrmann
Bowen and Pelzman Erlat, Erlat and ÖzçelikMerkies and Meer Erlat and ErlatRadamKotan
Follo
wer
sM
odel
In
clud
es
CMSA was first introduced to the literature by Tyszynski (1951). He
analyzed changes in world trade of manufactured commodities between the years
1899 and 1950 and stated that there were two major reasons for the changes in the
market shares of the countries. The first reason was related to the changes in the
relative importance of commodity groups and the second one was related to

4
the changes in the actual country shares of individual commodity groups. He
separated these causes by calculating two different market shares: the hypothetical
market share and the actual market share. The hypothetical market share was
defined as the market share of a country when its market shares in individual
commodity groups had remained constant. With the help of both the hypothetical
market share and the actual market share, Tyszynski tried to explain the changes in
the world demand for exports and changes in the competitive position of the
countries.
Studies until Leamer and Stern (1970) followed Tyszynski’s methodology
to a great extent instead of developing a new CMS technique. Among these studies,
Baldwin (1958) classified the imports of seven developed countries by using a
methodology which was similar to Tyszynski’s categorization and evaluated
commodity composition of world trade. In this sense, he divided the change in the
market shares of countries into two components: structural component and
competitiveness component. The structural component was related to the change in
the relative importance of the commodity groups while country’s share in the world
trade in each of these commodities remain the same. The competitiveness
component was related to the change in the shares of individual commodity groups.
With the help of these components, he determined leading commodity classes,
changes in the export performance of countries and new trends in world trade of the
period.
Spiegelglas (1959) also analyzed changes in the patterns of world export of
manufactured commodities. Similar to Baldwin (1958), he adopted Tyszynski’s
classification of commodities and was concerned with trade data of nine countries
between the years 1937 and 1956. He emphasized the significance of both structural
and competitive effects in the distribution of world exports during the period.
Leamer and Stern (1970) followed Tyszynski’s method to a great extent but
they developed his work by introducing three different reasons for poor export
performance. The first reason was related to the commodity composition of exports.
The second one was related to the market distribution of exports and the last one
was related to competitiveness. The major assumption of their study in analyzing
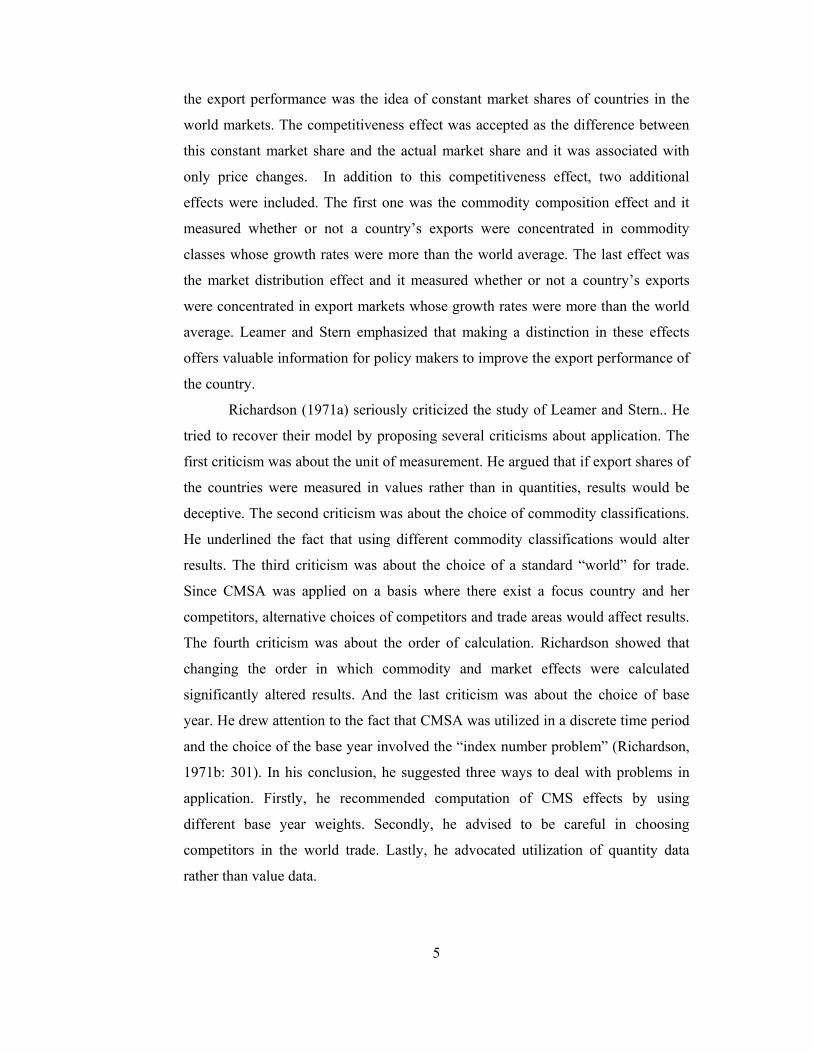
5
the export performance was the idea of constant market shares of countries in the
world markets. The competitiveness effect was accepted as the difference between
this constant market share and the actual market share and it was associated with
only price changes. In addition to this competitiveness effect, two additional
effects were included. The first one was the commodity composition effect and it
measured whether or not a country’s exports were concentrated in commodity
classes whose growth rates were more than the world average. The last effect was
the market distribution effect and it measured whether or not a country’s exports
were concentrated in export markets whose growth rates were more than the world
average. Leamer and Stern emphasized that making a distinction in these effects
offers valuable information for policy makers to improve the export performance of
the country.
Richardson (1971a) seriously criticized the study of Leamer and Stern.. He
tried to recover their model by proposing several criticisms about application. The
first criticism was about the unit of measurement. He argued that if export shares of
the countries were measured in values rather than in quantities, results would be
deceptive. The second criticism was about the choice of commodity classifications.
He underlined the fact that using different commodity classifications would alter
results. The third criticism was about the choice of a standard “world” for trade.
Since CMSA was applied on a basis where there exist a focus country and her
competitors, alternative choices of competitors and trade areas would affect results.
The fourth criticism was about the order of calculation. Richardson showed that
changing the order in which commodity and market effects were calculated
significantly altered results. And the last criticism was about the choice of base
year. He drew attention to the fact that CMSA was utilized in a discrete time period
and the choice of the base year involved the “index number problem” (Richardson,
1971b: 301). In his conclusion, he suggested three ways to deal with problems in
application. Firstly, he recommended computation of CMS effects by using
different base year weights. Secondly, he advised to be careful in choosing
competitors in the world trade. Lastly, he advocated utilization of quantity data
rather than value data.
6
Banerji (1974) criticized previous studies on the basis that they had only one
aspect in analyzing export performance of less developed countries: demand aspect
or supply aspect. In his analysis, he tried to include both aspects. In this sense,
commodity and market effects were considered on the demand side, whereas the
competitiveness effect was considered on the supply side. In his paper, he
summarized some shortcomings of the CMS model. One critique was about the
inability of the model to forecast unexpected changes in trade performance. CMSA
was used to evaluate trade performance in the past and it did not include any
econometric interpretation which was essential to predict probable future variations.
Another critique was about the interdependence of commodity and market effects.
He emphasized that although less developed countries became aware of the markets
which grew faster than the world average, those markets might not be considered as
alternative market places since countries might not have any comparative advantage
in those markets. Results of his study confirmed his hypothesis. After the
examination of sixteen markets for less developed countries, he found that
developing countries continued to focus basically on commodities3 and markets4
which grew slower than the world average.
Following Leamer and Stern (1970), Bishwas (1982) evaluated export
performance of India by using SITC data for seven commodity groups and eleven
markets between 1959 and 1968. Results of his study showed that commodity
composition, market distribution and competitiveness effects were all against
India’s export growth. Among them, the competitiveness effect was found to be the
most dominant one, mainly because of the currency overvaluation during that
period.
Similarly, Bowen and Pelzman (1984) analyzed the export performance of
US between the years 1962 and 1977 and tried to project the relationship between
the decline in US competitiveness and the poor export performance during the
period. Results of their study indicated that the market distribution effect played a
3 These commodities were basicly primary commodities such as food, beverages and tobacco, oils and fats etc. 4 The declining markets were defined as those in which the import of a given commodity increased by less than that of the world average of that commmodity. Some of these declining markets were Australia, New Zealand, Latin America and Africa

7
positive role in US export growth between 1962 and 1969 whereas the commodity
composition effect played a positive role between 1974 and 1977. In order to
prevent probable bias in estimation, Bowen and Pelzman applied some sensitivity
tests to the calculated figures of CSMA with the purpose of evaluating
Richardson’s (1971b) criticisms about the model. Sensitivity tests indicated that
although commodity classifications did not affect CMSA results, they were very
sensitive to changes in the choice of base year and the definition of the world
market.
After the methodology which was developed by Leamer and Stern (1970)
and the criticisms which were introduced by Richardson (1971 a and b ), Fagerberg
and Sollie (1987) developed the CMSA considerably and made the latest
contribution. They introduced two new perspectives in CMSA. The first one was
the use of Laspeyres Indices5 in order to avoid the index number problem which
was mentioned by Richardson (1971b) and the second one was the introduction of
two further effects into the analysis. In addition to the two common effects derived
in CMSA6, the well-known competitiveness effect was split up into the commodity
adaptation and market adaptation effects. Fagerberg and Sollie defined the role of
the commodity adaptation effect as “. . . to what degree a country has succeeded in
adapting the commodity composition of its exports to the changes in the commodity
composition of the market” (p.1575). Similarly, the role of the market adaptation
effect was defined as: “. . . the degree of success of the country in adapting the
market composition of its exports to the changes in the country composition of
world imports” (p.1576). Derivation of five effects instead of Leamer and Stern’s
three, increased the power of the CMSA and brought an additional perspective to
the analysis since these adaptation effects measure the performance of a country in
adapting her export composition in the direction of commodities with relatively
higher demand rates and in the direction of markets with relatively higher import
rates. Fagerberg and Sollie’s methodology was followed by many other researchers.
Among them, Lohrmann (2000) tried to evaluate the export performance of Turkey
in terms of both commodity groups and markets. She tried to find out whether 5 Laspeyres indexation uses initial year’s weights. 6 These were the commodity and the market composition effects.

8
Turkey sold the right goods to the right markets. Results of her study indicated that
Turkey could not adapt herself to the change in both the demand conditions and the
market conditions.
Following Leamer and Stern’s methodology, Merkies and Meer (1988) tried
to present a theoretical basis with the help of a two stage homothetic demand
function in order to offer a better framework for CMSA. By considering exports of
the same commodities from different countries as different products, they
developed a demand function in two stages. At the first stage, spending on a
commodity was allocated to exporters of that commodity and at the second stage
the import budget was allocated to different commodities. Using five different
SITC categories between 1972 and 1976 for USA, Economic and Social
Commission for Asia and the Pacific (ESCAP) countries and rest of the world, they
estimated a demand model. Results of their estimation showed that, contrary to the
generally accepted norms, commodity term was in fact a supply term since it
emerged from supply changes. World and market terms were both considered as
demand terms in line with the general view7.
Arshad and Radam (1997) also followed Leamer and Stern’s methodology
and applied CMSA for a special commodity group in order to evaluate the export
performance of selected electrical and electronic products in Malaysia. Results of
the CMSA showed that during the period of analysis, exports of electrical and
electronic products grew mainly due to the increase in world demand. The
competitiveness effect was the second important factor whereas the market
composition effect was quite negligible.
Among the Master Theses which applied CMSA, Ongun (1990) followed
both the methodologies of Richardson and Fagerberg and Sollie to analyze Turkish
fresh fruit and vegetable exports to the European Community (EC) between 1976
and 1987 years. She emphasized that the objective of her study was to examine
CMSA instead of examining Turkey’s fresh fruit and vegetable exports to EC. She
used both quantity data and value data in order to consider Richardson (1971a)’s
7 Merkies and Meer explained the export changes of a country by four different terms: the world term, the market term, the commodity term and the competitiveness term where the first three were defined as the “structural term”

9
advice. Results of the analysis indicated that different type of data might signal
different conclusions. Still her results showed that in fresh fruit and vegetable
exports, the commodity composition effect was positive whereas the market
distribution effect was negative. This meant that Turkey selected commodities with
high export rates but her choice of market might be wrong. Consequently, her study
is quite important in the sense that her conclusions supported the idea of
considering different market alternatives which was one of the basic motives behind
this thesis.
Kotan (2000) mainly adopted Leamer and Stern’s methodology and
compared export performance of Turkey and South East Asian Countries in the
European Union Market and tried to measure whether or not relative geographical
proximity of Turkey to the EU market played a positive role in decreasing prices
and increasing competitiveness. Relative proximity advantage was measured by the
difference between CIF import and FOB export prices and with the help of CMSA,
effect of competitiveness on the export performance of each country was analyzed.
Results of her study showed that price was the most significant factor in
competitiveness and relative export performance of Turkey was highly affected by
this factor especially in textiles, garment and technology intensive commodities.
Temiz (2002) evaluated Turkish export performance in agricultural goods
between 1989 and 1998 using CMSA methodology which was developed by
Leamer and Stern. Although different calculation methods were used, almost all
results demonstrated that both commodity composition and market distribution
effects were positive. Those positive effects indicated that both the commodity and
market composition of exports change in favor of Turkey. Conversely, the
competitiveness effect was found to be negative indicating that Turkey had
relatively less competitive power in agricultural exports.
The second methodology which was used to evaluate the export
performance of Turkey in this study was RCA. It is a methodology which simply
tries to compare a country’s export performance of a particular good with the
world’s export performance of that particular good. Balassa (1965) was the person
who introduced the concept of RCA. In his words:
10
. . . revealed comparative advantage can be indicated by the trade performance of individual countries in regard to manufacturing products, in the sense that the commodity pattern of trade reflects relative costs as well as differences in non-price factors . . . (p.103)
Balassa suggested that evaluation of RCA is possible through the use of
relative shares of a country in the world exports of individual commodities and
through the indication of changes in these relative shares. He also recommended the
use of export-import ratios in order to reflect comparative advantages under certain
assumptions like identical tastes and uniform duties. Since the assumptions of
identical tastes and uniform duties are not realistic in the real world, Balassa (1977)
totally gave up using the export-import ratios in the computation of RCA indices
and recommended the use of export ratios alone.Alternative to Balassa’s studies,
Volrath (1991) computed ten different RCA indices and compared them by
outlining both their shortcomings and good qualities. In this sense, he tried to
analyze and compare the theoretical foundation of alternative RCA indices with the
use of intensity measures.
The last methodology which was used in this thesis was the GL index. This
index was developed by Grubel and Lloyd (1971) in order to measure the rate of
intra-industry trade. Values of the index differ between 0 and 100. In one extreme,
when the value of the exports of commodity i is exactly equal to the value of the
imports of commodity i, the index takes on the value of 100 and at the other
extreme, when there are exports (imports) of commodity i but there are no imports
(exports) of it, the index takes the value of 0 indicating that there is no intra-
industry trade.
There are two studies which shed light on this thesis. These are Erlat, Erlat
and Özçelik (2003) and Erlat and Erlat (2004). Erlat, Erlat and Özçelik (2003)
evaluated the export performance of Turkey for the 15 European Union (EU) and
18 non-EU member OECD countries for the period of 1990-2000 whereas Erlat and
Erlat (2004) evaluated her performance in the Middle-East countries. They both
used the SITC (REV.3), three digit data and analyzed the rising and declining
sectors in the Turkish exports by applying CMS, RCA and GL methodologies at the
same time. In these studies, they also divided the 261, three-digit manufacturing

11
sectors into “traditional” and “non-traditional” sectors and calculated all the
measures taking into account these two groups separately. The expectation
underlying their approach was that sectors which become competitive towards the
end of the period would emerge from the “non-traditional” group and their studies
have shown that this expectation was justified. Accordingly, with the use of their
formulation and the guidance of their application, Turkish export performance in a
totally different market, East-Asia, was tried to be evaluated in this study. As it was
mentioned in Chapter 1, details of these three methodologies and their empirical
results are summarized in Chapters 4, 5 and 6.

12
CHAPTER 3
GENERAL STRUCTURE OF TRADE BETWEEN TURKEY AND EAST-
ASIAN COUNTRIES
Before summarizing the general structure of trade between Turkey and East-
Asian countries, it is useful to give some information about these economies. Basic
data about these countries and main economic indicators are summarized in Table2.
Table 2: Main Indicators of the East-Asian Economies8
China Japan Korea Malaysia Singapore
Land area (sq km) 9,561,000 377,864 99,585 330,113 682.3
Population 1.3billion 127.6 million 47.6 million 25.1million 3.4million
Capital City Beijing Tokyo Seoul Kuala Lumpur Singapore
GDP (billion US$) 1,307.3 3,981.7 454 94.9 87
GDP per capita (US$) 974 31,373.9 9,654 3,870 20,921
Real GDP growth (%) 8 0.3 6.3 4.1 2.2
CPI (%) -0.8 -0.9 4.1 1.8 -0.4
Exports, fob( US$ billion) 325.7 387.6 151.3 92 126.3
Imports, fob( US$ billion) 281.5 293.4 137.8 74 109.8
It can be easily seen from Table 2 that these countries are quite different in
terms of GDP, population and land area but they all have significant trade volumes.
High values of their imports place these countries at the centre of this research as
they are worth considering as market alternatives for Turkish exports. Before
evaluating Turkish export performance in these markets and deciding upon whether
or not these countries can be alternative trade partners of Turkey especially in some
8 All of them are 2002 figures and they are taken from Economic Intelligence Unit , 2003 Country Reports.

13
commodity groups, it will be helpful to give a general picture of trade between
Turkey and East-Asia.
Change in the market share of these five countries in Turkey’s total exports
is summarized in Figure 1.
0,00
1,00
2,00
3,00
4,00
5,00
6,00
1992 1993 1994 1995 1996 1997 1998 1999 2000 2001 2002
China Japan Korea Malaysia Singapore Total Share Figure 1: Market Share of East-Asian Countries in Turkey's Total Exports
(%)
Between 1992 and 2002, these countries’ share was on the average, 2.95
percent of total Turkish exports9. Among this 2.95 percent share; China, Japan,
Korea, Malaysia and Singapore capture 0.82, 0.68, 0.44, 0.31, 0.70 percent
respectively. 1993 is the most successful year of Turkey in this market since 6.16
percent of total Turkish goods are exported to this region. Since more than half of
this 6.16 percent was exported to China, export values of Turkey to China were
examined in detail and it was discovered that this enormous increase in the year
1993 was mainly due to the iron and steel exports. Especially in the sector groups
671- Pig iron, sponge iron, iron or steel granules and powders and ferroalloys, 673-
9 See Table D.1 in the Appendix D.

14
Iron or non-alloy steel flat-rolled products, not clad, plated or coated and 676- Iron
and steel bars, rods, angles, shapes and sections, including sheet piling, there was a
gigantic increase in the Turkey’s export values to China from 1992 to 1993. This
might be due to the increase in Chinese investment in the construction sector after
her adoption of liberal economic policies in 1993.
As opposed to the performance in 1993, only 1.35 percent of total goods are
exported to East-Asia in 1998. This fact is not surprising in the sense that a serious
economic crisis emerged in the Asia during the year 1997.
After a big jump in the market share of China from 1992 to 1993, there has
been a continuous decrease until 1998 and a slight recovery between 1999 and
2002. Japan has a continuous downward trend although there has been a slight
recovery just after the 1997 Asian Crisis, between 1998 and 2000. Exports to
Singapore fluctuate until 1998 and 1999-2002 period is a period of continuous
decrease in the share of Turkey’s exports to this country. Korea and Malaysia have
the lowest shares among these countries and their shares fluctuate around their
period averages of 0.44 percent and 0.31 percent, respectively.
In general, changes in the market shares of these East-Asian countries do
not have a unique trend in Turkey’s total exports. Japan and Korea are similar to
some extent in the sense that their shares have a downward trend between 1992 and
1997 whereas there has been a slight recovery period between 1998 and 2000.
China, Malaysia and Singapore have slightly different pictures. Their shares
fluctuate continuously.
Change in the total share of Turkish exports in these countries’ total imports
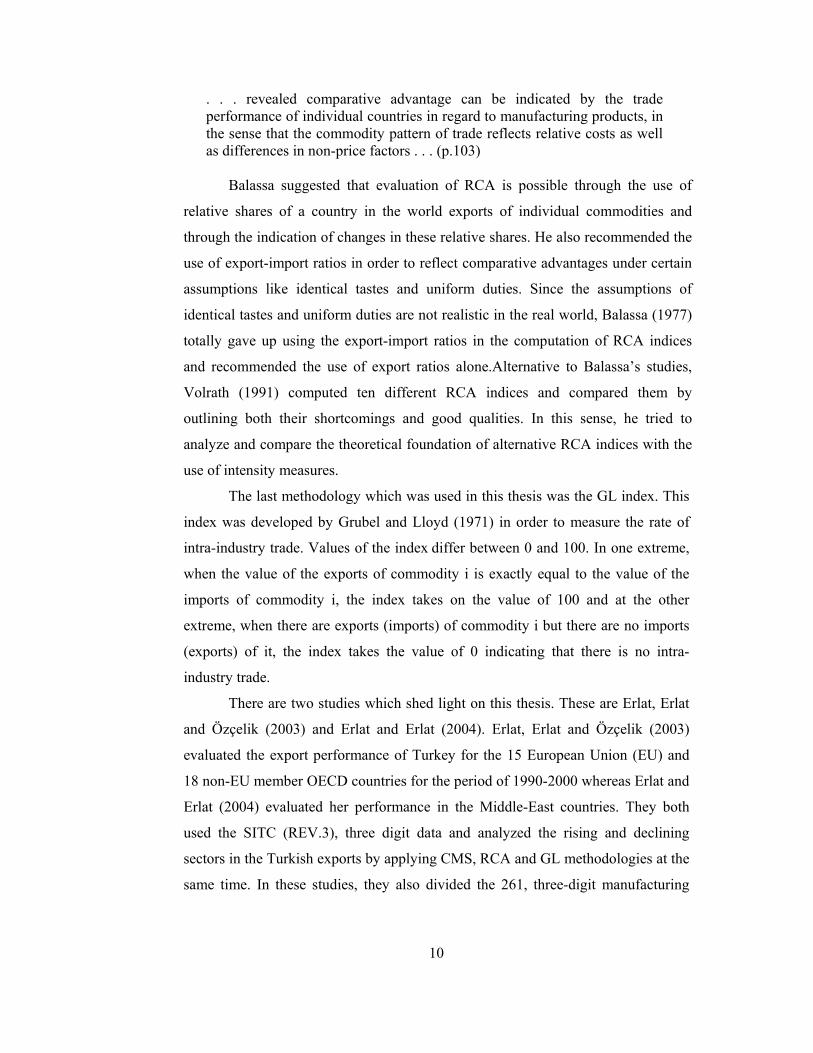
is summarized in Figure 2.
Between 1992 and 2002, there is a declining trend of Turkish exports in
East-Asian imports and Turkey on the average captures only 0.50 percent of their
total imports10. 1993 has the highest share with 0.95 percent whereas 2002 has the
lowest share with 0.29 percent. Although China, Malaysia and Singapore have very
similar period averages, their shares are quite different throughout the period. Japan
10 See Table D.2 in the Appendix D.
15
has the most stable values among these five. However, Japan has the lowest share
with 0.05 percent in this market and Korea follows Japan with 0.08 percent.
0,00
0,20
0,40
0,60
0,80
1,00
1,20
1992 1993 1994 1995 1996 1997 1998 1999 2000 2001 2002
China Japan Korea Malaysia Singapore Total Share
Figure 2: Total Share of Turkish Exports in East-Asian Imports (%)
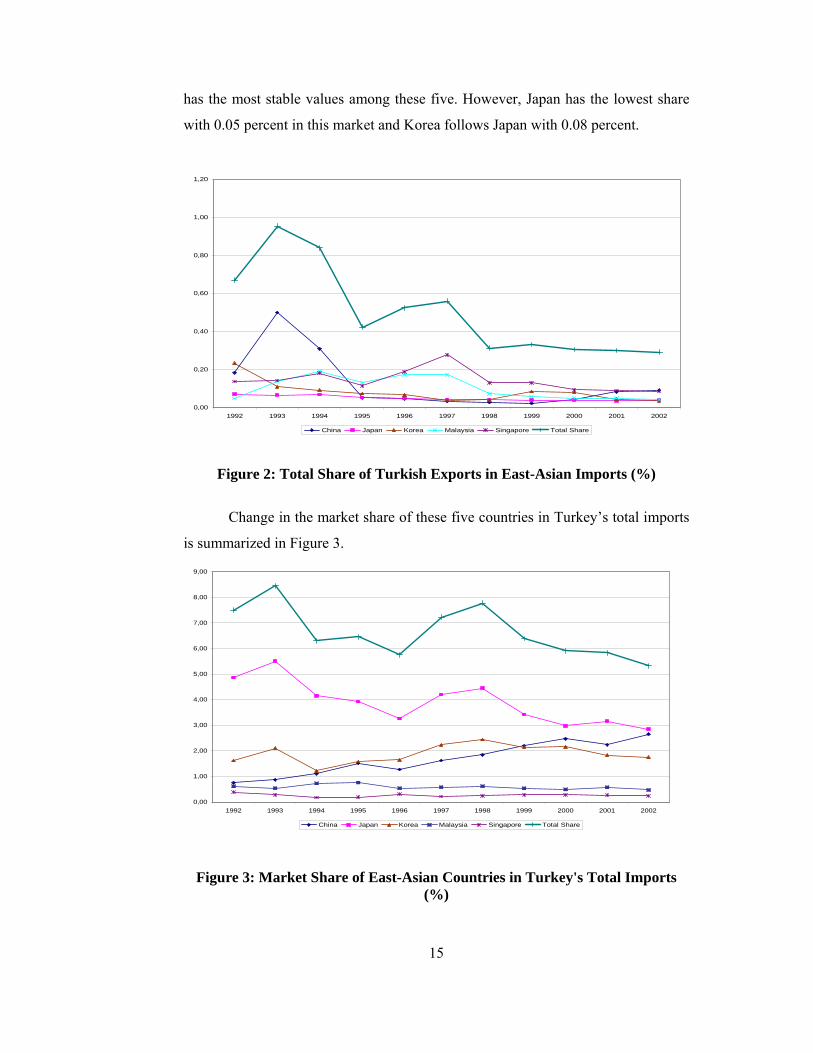
Change in the market share of these five countries in Turkey’s total imports
is summarized in Figure 3.
0,00
1,00
2,00
3,00
4,00
5,00
6,00
7,00
8,00
9,00
1992 1993 1994 1995 1996 1997 1998 1999 2000 2001 2002
China Japan Korea Malaysia Singapore Total Share
Figure 3: Market Share of East-Asian Countries in Turkey's Total Imports (%)

16
Between 1992 and 2002, these countries’ export share, on the average is,
6.63 percent of total Turkish imports11. Among this 6.63 percent share, Japan takes
the largest share with 3.89 percent and Korea follows Japan with 1.89 percent.
Although China is at third place as far as period averages are concerned, she has a
continuous upward trend and almost reaches Japan in 2002. Malaysia and
Singapore have the lowest shares and all their values are under one percent during
the period.
Change in the total share of Turkish imports in these countries’ total exports
is summarized in Figure 4.
0,00
0,50
1,00
1,50
2,00
2,50
3,00
1992 1993 1994 1995 1996 1997 1998 1999 2000 2001 2002
China Japan Korea Malaysia Singapore Total Share Figure 4: Total Share of Turkish Imports In East Asian Countries' Total
Exports (%)
On the average, 1.95 percent of total East-Asian exports have Turkey as the
destination. Japan has first place in Turkey’s imports among these five countries
with 0.94 percent. Korea follows Japan with 0.45 percent, China has a share of 0.37
11 See Table D.3 in the Appendix D.

17
percent, Malaysia and Singapore have 0.14 percent and 0.06 percent shares
respectively.
The trade balance between Turkey and East-Asian Countries is summarized
in Table 3.
Table 3: Trade Balance of Turkey with East Asian Countries (million $)
1992 1993 1994 1995 1996 1997 1998 1999 2000 2001 2002 Period Av.China -26 257 97 -472 -491 -743 -808 -858 -1.249 -726 -1.100 -556 Japan -950 -1.462 -781 -1.220 -1.254 -1.896 -1.933 -1.272 -1.471 -1.183 -1.336 -1.342 Korea -182 -530 -192 -466 -618 -1.031 -1.087 -770 -1.051 -697 -846 -679
Malaysia -122 -98 -57 -173 -103 -149 -243 -182 -229 -204 -195 -159 Singapore 10 35 143 77 117 263 16 30 -29 -6 -33 57
Total -1.270 -1.798 -790 -2.254 -2.349 -3.557 -4.054 -3.052 -4.029 -2.817 -3.509 -2.680
During the 1992-2002 period, trade balance is continuously against Turkey.
On the average, Turkey has a 2.68 billion dollar trade deficit throughout these
years. Singapore is the only country with whom Turkey has a trade surplus. Figure
1 and Figure 3 can explain this situation. Relatively high level of exports to
Singapore (on the average 0.70 percent) but low levels of imports in return (on the
average 0.26 percent) result in trade surplus with this country. Despite continuous
trade deficits after 1999, Turkey still has an average surplus of 57 million dollars
with Singapore.
Previous studies12 which analyze Turkish export performance in the EU
countries and non-EU member OECD countries demonstrated that trade balances
with these countries were also against Turkey. However, a different and positive
performance was observed with the Middle-East countries13. This might be related
to the similar geographical conditions of Turkey and the Middle-East which result
in the supply of commodity groups which are appropriate for the Middle-East
countries’ demand patterns. But trade deficits with the EU member, non EU
member OECD countries and East-Asian countries indicated that Turkey should
revise her export structure and improve her export performance. In this sense with
the purpose of giving some idea about the structure of trade between Turkey and
12 See Erlat, Erlat, Özçelik (2003) 13 See Erlat and Erlat (2004)
18
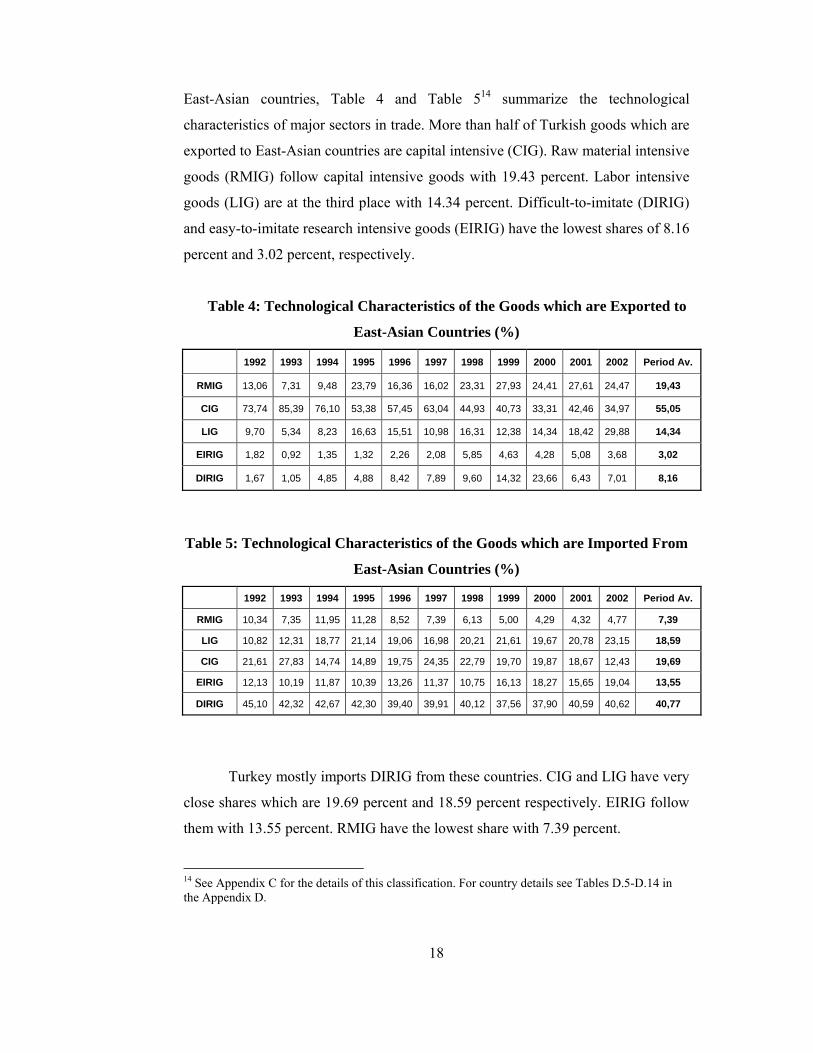
East-Asian countries, Table 4 and Table 514 summarize the technological
characteristics of major sectors in trade. More than half of Turkish goods which are
exported to East-Asian countries are capital intensive (CIG). Raw material intensive
goods (RMIG) follow capital intensive goods with 19.43 percent. Labor intensive
goods (LIG) are at the third place with 14.34 percent. Difficult-to-imitate (DIRIG)
and easy-to-imitate research intensive goods (EIRIG) have the lowest shares of 8.16
percent and 3.02 percent, respectively.
Table 4: Technological Characteristics of the Goods which are Exported to
East-Asian Countries (%)
1992 1993 1994 1995 1996 1997 1998 1999 2000 2001 2002 Period Av.
RMIG 13,06 7,31 9,48 23,79 16,36 16,02 23,31 27,93 24,41 27,61 24,47 19,43
CIG 73,74 85,39 76,10 53,38 57,45 63,04 44,93 40,73 33,31 42,46 34,97 55,05
LIG 9,70 5,34 8,23 16,63 15,51 10,98 16,31 12,38 14,34 18,42 29,88 14,34
EIRIG 1,82 0,92 1,35 1,32 2,26 2,08 5,85 4,63 4,28 5,08 3,68 3,02
DIRIG 1,67 1,05 4,85 4,88 8,42 7,89 9,60 14,32 23,66 6,43 7,01 8,16
Table 5: Technological Characteristics of the Goods which are Imported From
East-Asian Countries (%)
1992 1993 1994 1995 1996 1997 1998 1999 2000 2001 2002 Period Av.
RMIG 10,34 7,35 11,95 11,28 8,52 7,39 6,13 5,00 4,29 4,32 4,77 7,39
LIG 10,82 12,31 18,77 21,14 19,06 16,98 20,21 21,61 19,67 20,78 23,15 18,59
CIG 21,61 27,83 14,74 14,89 19,75 24,35 22,79 19,70 19,87 18,67 12,43 19,69
EIRIG 12,13 10,19 11,87 10,39 13,26 11,37 10,75 16,13 18,27 15,65 19,04 13,55
DIRIG 45,10 42,32 42,67 42,30 39,40 39,91 40,12 37,56 37,90 40,59 40,62 40,77
Turkey mostly imports DIRIG from these countries. CIG and LIG have very
close shares which are 19.69 percent and 18.59 percent respectively. EIRIG follow
them with 13.55 percent. RMIG have the lowest share with 7.39 percent.
14 See Appendix C for the details of this classification. For country details see Tables D.5-D.14 in the Appendix D.
19
After summarizing the technological characteristics of the exports and
imports, it might be useful to examine the level of the concentration in the
commodity groups. In this respect, the Hirschman-Herfindahl Index (HHI) was
used in the calculations.
In general, HHI is used as a measure of industry concentration. It is
calculated by squaring the market share of each firm competing in the market and
then summing the resulting numbers. Market shares are squared in order to give
more weight to larger shares. Higher values of the index indicate that less
competition exists in the market.
HHI can also be used to measure the level of commodity concentration in
trade. In this sense, HHI was adapted to our purpose by using Erlat and Erlat’s
(2004) definitions and the following formula is used:
HHIt = ∑N
iitp 2
where:
N= number of commodities
pit = share of commodity i in exports or imports that is: pit = Qit / Qt
Qit = exports or imports of commodity i in year t
Qt = total exports or imports in year t, i.e., Qt = ∑i Qit
HHI takes values between 1/N and 1. Values close to 1/N indicate low
levels of concentration whereas values close to 1 indicate high levels of
concentration.
Results are summarized in Table 6 and Table 7 on the next page. Values in
Table 6 and Table 7 indicate that there exists no significant level of concentration in
either exports or imports as far as the whole period is concerned. However some
figures in exports are worth considering. For instance, in exports to China, the 1993
and 1994 values are quite high. This fact is not surprising in the sense that capital
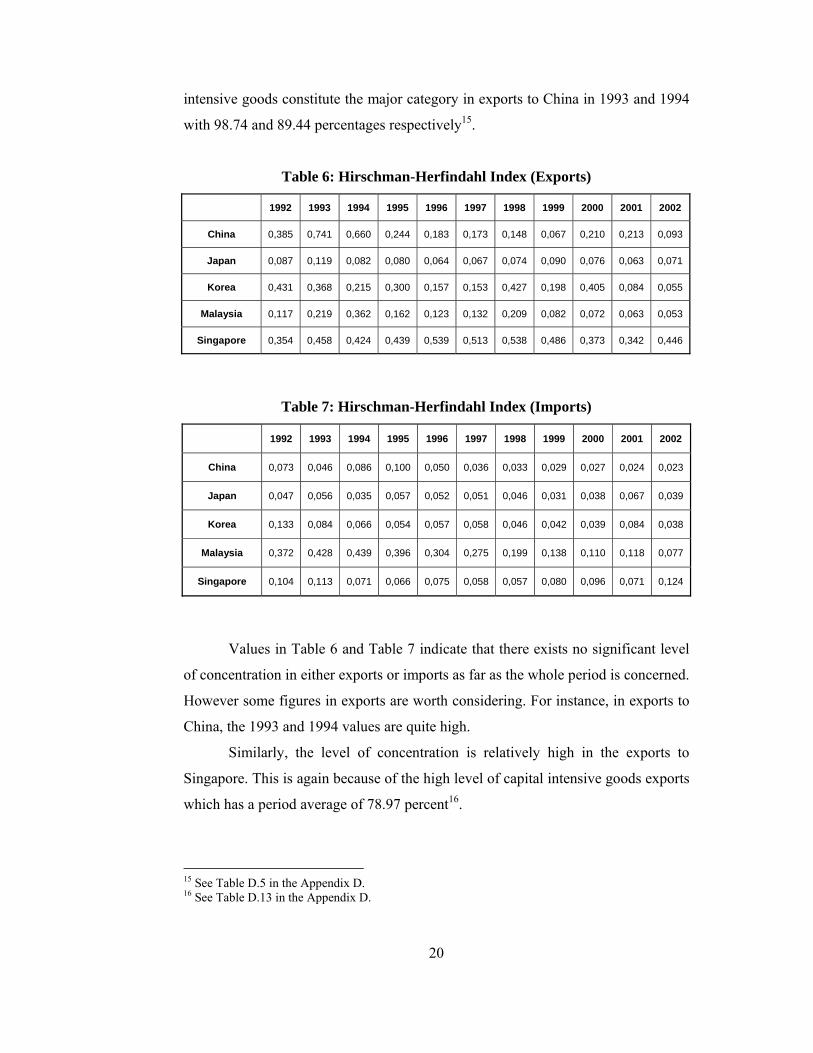
20
intensive goods constitute the major category in exports to China in 1993 and 1994
with 98.74 and 89.44 percentages respectively15.
Table 6: Hirschman-Herfindahl Index (Exports)
1992 1993 1994 1995 1996 1997 1998 1999 2000 2001 2002
China 0,385 0,741 0,660 0,244 0,183 0,173 0,148 0,067 0,210 0,213 0,093
Japan 0,087 0,119 0,082 0,080 0,064 0,067 0,074 0,090 0,076 0,063 0,071
Korea 0,431 0,368 0,215 0,300 0,157 0,153 0,427 0,198 0,405 0,084 0,055
Malaysia 0,117 0,219 0,362 0,162 0,123 0,132 0,209 0,082 0,072 0,063 0,053
Singapore 0,354 0,458 0,424 0,439 0,539 0,513 0,538 0,486 0,373 0,342 0,446
Table 7: Hirschman-Herfindahl Index (Imports)
1992 1993 1994 1995 1996 1997 1998 1999 2000 2001 2002
China 0,073 0,046 0,086 0,100 0,050 0,036 0,033 0,029 0,027 0,024 0,023
Japan 0,047 0,056 0,035 0,057 0,052 0,051 0,046 0,031 0,038 0,067 0,039
Korea 0,133 0,084 0,066 0,054 0,057 0,058 0,046 0,042 0,039 0,084 0,038
Malaysia 0,372 0,428 0,439 0,396 0,304 0,275 0,199 0,138 0,110 0,118 0,077
Singapore 0,104 0,113 0,071 0,066 0,075 0,058 0,057 0,080 0,096 0,071 0,124
Values in Table 6 and Table 7 indicate that there exists no significant level
of concentration in either exports or imports as far as the whole period is concerned.
However some figures in exports are worth considering. For instance, in exports to
China, the 1993 and 1994 values are quite high.
Similarly, the level of concentration is relatively high in the exports to
Singapore. This is again because of the high level of capital intensive goods exports
which has a period average of 78.97 percent16.
15 See Table D.5 in the Appendix D. 16 See Table D.13 in the Appendix D.

21
As opposed to these figures, the level of concentration is very low and
negligible in the imports from these countries.

22
CHAPTER 4
CONSTANT MARKET SHARE ANALYSIS
Constant Market Share Analysis (CMSA)17 is a methodology which tries to
project the possible causes of the change in the market shares of the exports of a
country from one period to another. If change in the market share of the home
country is analyzed in only one target country, the market share in question, sij, is
found by dividing the value of home country’s exports of commodity i by the value
of partner country j’s total imports. That is:
sij = Xij / ∑i Mij and i =1,…,N
where
sij = market share of home country exports of commodity i in country j’s total
imports.
Xij = home country’s exports of commodity i to partner country j
Mij = country j’s imports of commodity i
This market share, sij , can be expressed as the multiplication of two ratios.
The first ratio, aij, is the number which is found by the division of the value of home
country’s exports of commodity i to country j by the value of country j’s imports of
commodity i. Then aij = Xij / Mij . Second ratio, bij, is the share of partner country
j’s imports of commodity i in country j’s total imports. Then bij = Mij/∑iMij .
If we denote the beginning and the end periods by “0” and “1” respectively,
then, the change in the sij from one period to another can be expressed as:
17 This study is mainly based on and uses the definitions developed by Erlat, Erlat and Özçelik (2003)

23
∆ sij = sij1 - sij
0 = aij1
bij 1 - aij
0 bij0 (1)
The equality above can be written as an identity and it can be separated into
three different effects:
∆ sij ≡ (a1ij – a0
ij )b0ij + a0
ij (blij- b0
ij) + (a1ij- a0
ij ) (blij- b0
ij ) (2)
(a1ij – a0
ij )b0ij is called as the market share effect since change in sij from
one period to another is measured only by changes in the aij’s. In other words, this
effect indicates what the change in the market share of a country may be if the
change was only due to the change in the ratio of home country exports of
commodity i to partner country imports of that commodity.
a0ij (bl
ij- b0ij) is called as the commodity composition effect since change in
sij from one period to another is measured only by changes in bij’s. This effect
indicates what the difference between two periods may be if the change was only
due to the change in the ratio of partner country’s imports of a particular
commodity to partner country’s total imports.
(a1ij- a0
ij ) (blij- b0
ij ) is called as the commodity adaptation effect. This effect
shows whether the home country can adapt her exports to changes in the
commodity composition of her partner’s imports. Accordingly, when both (blij- b0
ij )
and (a1ij- a0
ij ) have equal signs, the commodity adaptation effect will be positive.
If change in the market share of the home country is analyzed in a group of
countries, then the market share in question is now “Si” and it can be computed by
dividing the value of home country exports of commodity i to the group countries
by the value of group of countries’ total imports. Then :
Si = ∑j Xij / ∑i ∑j Mij
Si can be expressed as the multiplication of three ratios. The first two ratios
aij and bij were explained previously. The third ratio, cj, is the ratio which is found
24
by the division of the value of the total imports of j th country by the value of total
imports of the country group. Then cj = ∑i Mij / ∑i ∑j Mij
The difference between the two period market shares can be expressed as
follows:
∆ Si = Si1 - Si
0 = a1ij bl
ij cj1 - a0
ij b0ij cj
0 (3)
This difference can be split into five effects with the help the of following
identity:
∆ Si ≡ ∑j (a1ij – a0
ij )b0ij c0
j + ∑j a0ij (bl
ij- b0ij) c0
j + ∑j (a1ij- a0
ij ) (blij- b0
ij ) c0j
+ ∑j s0ij (cl
j- c0j) + ∑j (s1
j- s0j ) (c1
j- c0j ) (4)
The first three effects are the same with the previous market share,
commodity composition and commodity adaptation effects. However there are two
additional effects in this case. The first one, ∑j s0ij (cl
j- c0j), is the market
composition effect. Here, change in the Si from one period to another is measured
only by changes in the cj’s. This means that the variation between two periods is the
result of the changes in the market shares of the countries within the group.
∑j (s1ij- s0
ij ) (c1j- c0
j ) is the market adaptation effect. This effect shows
whether or not Turkey can adapt its market shares of individual commodity groups
to the changes in the market shares of the countries in the group. Then if (s1ij-s0
ij )
changes in the same direction with (c1j- c0
j ), the market adaptation effect will be
positive.
Using the above methodology, first the change in the market share of
Turkey is analyzed with respect to each of these East Asian countries separately and
the change in Turkey’s market share is split into three effects. Then the change in
the market share of Turkey is analyzed with respect to these countries as a whole.
Consequently, change in the market share is split into five effects. In both cases, the
period we considered was divided into two sub-periods. The first sub-period is the
1992-1997 period and the second one is the 1998-2002 period. The reason why we
25
have these periods is due to the fact that 1997 was a turning point since these
countries were affected to a great extent by the Asian Crisis of 1997. Results of
each situation are summarized in the next two sections.
4.1. CMSA With Respect to Each Country
General structure of the analysis is summarized in Table 8.
Table 8: CMSA Including Three Effects (% changes)
Market Share Effect -93,791 -36,049 -85,766 246,638 63,430
Commodity Composition
Effect5,941 -24,586 -26,470 30,350 16,905
Commodity Adaptation Effect -5,955 11,841 24,890 25,821 17,342
Total -93,805 -48,793 -87,345 302,809 97,677Market Share
Effect 128,100 5,176 -30,225 -33,050 8,592
Commodity Composition
Effect-5,897 -15,150 -27,763 0,471 -36,673
Commodity Adaptation Effect -4,357 3,025 18,958 -0,980 -7,670
Total 117,846 -6,949 -39,029 -33,559 -35,751
Market Share Effect -84,128 -36,895 -86,309 32,442 9,376
Commodity Composition
Effect-48,122 -34,899 -26,574 -28,872 -49,192
Commodity Adaptation Effect 45,907 19,352 21,369 -13,113 -3,325
Total -86,343 -52,442 -91,514 -9,543 -43,140
1992
-199
7 pe
riod
1998
-200
2 pe
riod
1992
-200
2 pe
riod
China Japan Korea Malaysia Singapore
In the 1992-1997 period, Turkey’s market shares increased only in Malaysia
and Singapore. All three effects are positive in Malaysia and Singapore but the
market share effect is the dominant one. In China and Korea, although commodity
composition and commodity adaptation effects have different signs, they have close

26
shares and almost neutralize each other18. Although the commodity adaptation
effect is positive in Japan, negative market share and commodity composition
effects overcome its positive contribution.
As opposed to the 1992-1997 period, Turkey increased her market share in
China in the 1998-2002 period. This is only because of the positive market share
effect since the other two effects are negative. In other words, Turkey increased her
market share in China because, keeping other factors constant, only the ratio of
Turkish exports to Chinese imports increased between 1998 and 2002. This result
can be easily shown with the help of Table D.2 in the Appendix D. Total share of
Turkish exports in Chinese imports was 0.03 percent in 1998 whereas it increased
to 0.09 percent in 2002.
The 6.95 percent decrease in the market share in Japan during the 1998-
2002 period is lower than the 48.79 percent decrease of the 1992-1997 period. The
major difference between two periods is the positive market share effect of the
1998-2002 period which can not compensate the negative impact of the commodity
composition effect.
Similarly, due to the decline in the negative impact of the market share
effect, there is a smaller decrease in the market share in Korea in the 1998-2002
period compared to the previous period. However weights of the effects and their
contributions do not change much between the two periods.
Turkey’s performance in Malaysia is quite interesting in this period.
Positive contributions of three effects for the 1992-1997 period are almost totally
reversed in the 1998-2002 period. The market share effect is still dominant as it was
in the previous period, however it turns negative. The commodity composition and
commodity adaptation effects have really insignificant shares.
Between the 1992-1997 and 1998-2002 periods, another radical change
takes place in the case of Singapore. The commodity composition and adaptation
effects both turn negative and decrease the overall market share. This decrease can
18 This generalization is not valid for the 1998-2002 period.
27
be derived from the fact that both Singapore’s share in Turkish exports and
Turkey’s share in Singapore’s imports decline from 1998 to 200219.
When we consider the whole period, Turkish market shares decrease in all
of these countries. This fact is not surprising because, from Table D.2, it can be
seen that the total share of Turkish exports in East-Asian imports decreases from
0.18 percent to 0.09 percent in China, from 0.07 percent to 0.04 percent in Japan,
from 0.23 percent to 0.04 percent in Korea, from 0.05 percent to 0.04 percent in
Malaysia and from 0.14 percent to 0.08 percent in Singapore.
When we look at the number of positive entries in Table 8, we see that there
are seven positive and eight negative market share effects, four positive and eleven
negative commodity composition effects, nine positive and six negative commodity
adaptation effects. Although the commodity adaptation effect is at first place as far
as number of positive entries is considered, the reality is quite different when the
magnitude of these effects is considered.
Change in the market share between two periods is characterized to a great
extent by the market share effect when all three effects are taken as a whole in
terms of magnitude. This means that Turkey’s market share is mostly influenced by
the changes in the ratio of Turkish exports of a particular good to partner country
imports of that particular good. The commodity composition effect is the second
important factor. Although commodity adaptation is the least dominant factor, it is
interesting to note that this effect is positive in Japan and Korea in all three periods.
This indicates that Turkey can adapt its export structure according to the changes in
the commodity composition of Japanese and Korean imports. However negative
market share and commodity composition effects prevent the overall increase in the
market share of Turkey in these countries.
4.2. CMSA With Respect to Group Countries As A Whole
General structure of CMSA including five effects is summarized in Table 9
on the following page.
19 See Table D.1 and Table D.2 in the Appendix D.

28
Table 9: CMSA Including Five Effects (% changes)
Market Share Effect -93,690 -35,980 -85,710 159,780 63,560
Commodity Composition
Effect5,940 -24,590 -26,470 19,530 16,900
Commodity Adaptation Effect -5,880 11,840 24,860 16,430 17,320
Market Composition
Effect7,590 -11,910 7,170 19,450 11,180
Market Adaptation Effect -7,110 5,800 -6,260 38,070 10,930
Total -93,150 -54,840 -86,410 253,260 119,890
Market Share Effect
128,130 5,180 -29,660 -33,050 8,590
Commodity Composition
Effect-5,900 -15,150 -27,720 0,470 -36,670
Commodity Adaptation Effect -4,360 3,030 19,030 -0,980 -7,670
Market Composition
Effect44,590 -17,360 12,030 -5,710 -21,370
Market Adaptation Effect 52,560 1,210 -4,610 1,920 7,640
Total 215,020 -23,090 -30,930 -37,350 -49,480
Market Share Effect -84,100 -36,540 -86,110 34,780 9,580
Commodity Composition
Effect-48,120 -34,900 -26,570 -28,870 -49,190
Commodity Adaptation Effect 45,950 19,230 21,280 -13,740 -3,380
Market Composition
Effect90,340 -25,110 -3,810 3,020 -16,600
Market Adaptation Effect -77,940 13,110 3,490 -0,240 7,140
Total -73,870 -64,210 -91,720 -5,050 -52,450
1992
-199
7 pe
riod
1998
-200
2 pe
riod
1992
-200
2 pe
riod
China Japan Korea Malaysia Singapore

29
In addition to the previous information, CMSA including five effects offer
two supplementary pieces of information about the causes of the change in the
Turkey’s market share from one period to another. These are market composition
and market adaptation effects. Market composition effect is related to the changes
in the country shares of the East Asian countries within the group. Market
adaptation effect shows to what degree Turkey can adapt its market shares of a
particular commodity according to the changes in the country shares within the
group.
In the 1992-1997 period, the market composition effect is positive in all
countries except Japan. This means, country shares within the group change in
favor of Turkish exports. However, since this effect is relatively insignificant
among the others, it can not increase Turkey’s market share alone.
The market adaptation effect is positive in Japan, Malaysia and Singapore.
In other words, Turkey can arrange her market shares of individual commodity
groups according to the changes in the country shares of Japan, Malaysia and
Singapore within the group in the 1992-1997 period.
In the 1998-2002 period, the market composition effect turns negative in
Malaysia and Singapore but it is still positive in China and Korea. Although this
effect has different signs in different countries, its relative importance in the total
change increases considerably compared to the 1992-1997 period.
During this period, the market adaptation effect is positive except for Korea
but its contribution to the total change is trivial in Japan, Malaysia and Singapore.
In China, contribution of the market adaptation effect is significant and it increases
the market share of Turkey together with the positive market share and market
composition effects.
In the 1992-2002 period, the market composition effect is positive for China
and Malaysia whereas it is negative in the other three countries. Just the opposite is
true for the market adaptation effect. It is negative for China and Malaysia and
positive in the other three countries.
When three periods and five countries are considered altogether, it is
observed that except for Malaysia and Singapore, Turkey’s market shares decrease
30
in the pre-crisis period. After the Asian Crisis of 1997, Turkey loses her share even
in the Malaysia and Singapore markets. The market share increase in China during
the 1998-2002 period is only a slight recovery after the 1997 crisis since the 0.18
percent share of Turkish exports in Chinese imports during 1992 can not be reached
in the year 200220.
Detailed CMSA tables including five effects about the 3-digit sectors are
provided in Table D.15 to Table D.29 in Appendix D. Tables D.15-D.19 provide
information about the 1992-1997 period whereas Tables D.20-D.24 and Tables
D.25-D-29 summarize the 1998-2002 and the 1992-2002 periods respectively. The
last columns of all tables indicate the number of positive CMSA effects in each
sector. In order to find out which sectors enhance Turkey’s export performance
considering these five countries, firstly sectors in which Turkey’s market share
increases is chosen in each county. Among them, sectors whose market shares
increase in at least three of these five countries are taken and grouped under three
different titles, “sectors which are chosen in all five countries”, “sectors which are
chosen in four countries” and “sectors which are chosen in three countries”. Results
are summarized in Table 10, Table 11 and Table 12. Numbers in brackets denote
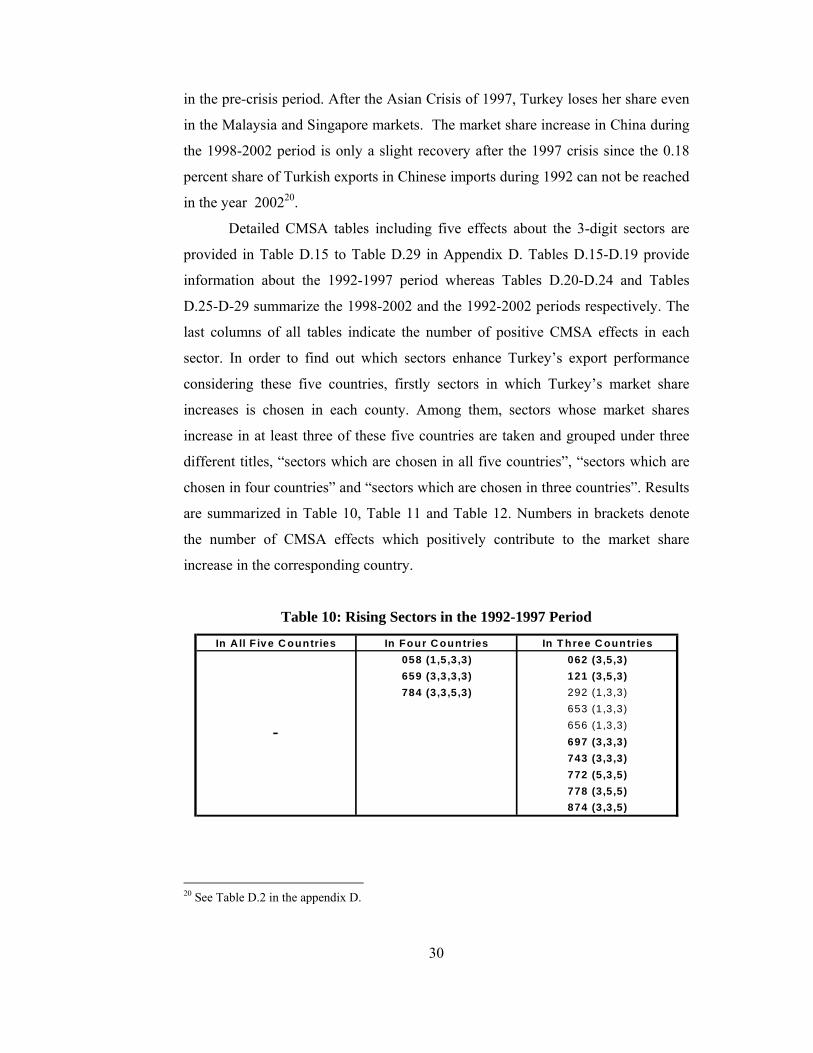
the number of CMSA effects which positively contribute to the market share
increase in the corresponding country.
Table 10: Rising Sectors in the 1992-1997 Period
772 (5,3,5)778 (3,5,5)874 (3,3,5)
653 (1,3,3)656 (1,3,3)
In A ll F iv e C ountries In Four C ountries
784 (3,3,5,3) 292 (1,3,3)
In T hree C ountries
659 (3,3,3,3) 121 (3,5,3)
-
058 (1,5,3,3) 062 (3,5,3)
697 (3,3,3)743 (3,3,3)
20 See Table D.2 in the appendix D.

31
In the 1992-1997 period, there exists no sectors whose market shares
increase in all of these five countries. Among the sectors whose market shares
increase in three or four countries, the following sectors are worth mentioning21:
058- Fruit, preserved and fruit preparations
062- Sugar confectionary
121- Tobacco, unmanufactured; tobacco refuse
659- Floor coverings, etc.
697- Household equipment of base metal, n.e.s.
743- Pumps, air or gas compressors and fans
772- Electrical apparatus
778- Electrical machinery and apparatus, n.e.s.
784- Parts and accessories for tractors, motor cars and other vehicles, trucks,
public transport vehicles and road motor vehicles, n.e.s.
874- Measuring, checking, analyzing and controlling instruments, n.e.s.
21 The market share effect is the dominant factor in the market share increase of Turkey in most of these sectors. For a better evaluation of the export performance, there should be at least two additional positive CMSA effects which increase the market share in that sector. Therefore sectors including at least three positive effects in each country are selected from Table 10, Table 11 and Table 12.
32
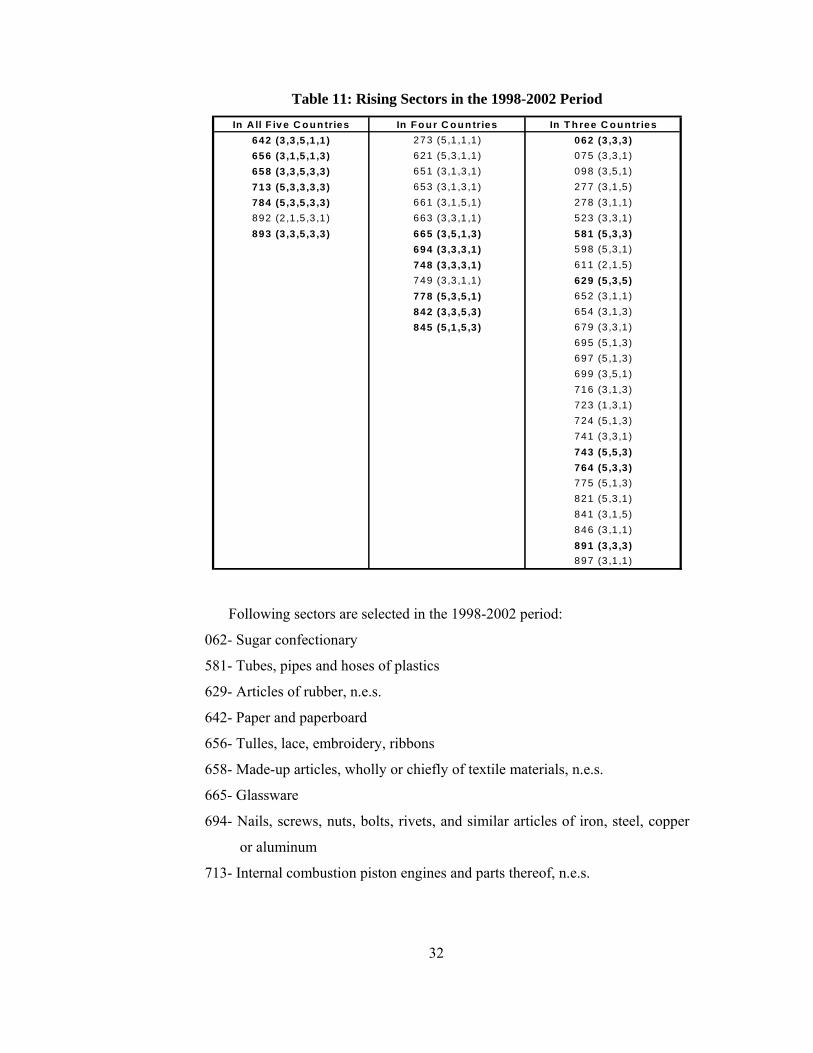
Table 11: Rising Sectors in the 1998-2002 Period
775 (5 ,1 ,3 )
846 (3 ,1 ,1 )
697 (5 ,1 ,3 )
723 (1 ,3 ,1 )
665 (3 ,5 ,1 ,3 ) 581 (5 ,3 ,3 )
749 (3 ,3 ,1 ,1 ) 629 (5 ,3 ,5 )
621 (5 ,3 ,1 ,1 ) 075 (3 ,3 ,1 )
In A ll F iv e C o u n tries In F o u r C o u n tries In T h ree C o u n tries
897 (3 ,1 ,1 )
841 (3 ,1 ,5 )
891 (3 ,3 ,3 )
821 (5 ,3 ,1 )
743 (5 ,5 ,3 )764 (5 ,3 ,3 )
741 (3 ,3 ,1 )
716 (3 ,1 ,3 )
724 (5 ,1 ,3 )
699 (3 ,5 ,1 )
845 (5 ,1 ,5 ,3 ) 679 (3 ,3 ,1 )695 (5 ,1 ,3 )
842 (3 ,3 ,5 ,3 ) 654 (3 ,1 ,3 )
748 (3 ,3 ,3 ,1 ) 611 (2 ,1 ,5 )
778 (5 ,3 ,5 ,1 ) 652 (3 ,1 ,1 )
694 (3 ,3 ,3 ,1 ) 598 (5 ,3 ,1 )
784 (5 ,3 ,5 ,3 ,3 ) 661 (3 ,1 ,5 ,1 ) 278 (3 ,1 ,1 )892 (2 ,1 ,5 ,3 ,1 ) 663 (3 ,3 ,1 ,1 ) 523 (3 ,3 ,1 )893 (3 ,3 ,5 ,3 ,3 )
713 (5 ,3 ,3 ,3 ,3 ) 653 (3 ,1 ,3 ,1 ) 277 (3 ,1 ,5 )
642 (3 ,3 ,5 ,1 ,1 ) 273 (5 ,1 ,1 ,1 ) 062 (3 ,3 ,3 )656 (3 ,1 ,5 ,1 ,3 )658 (3 ,3 ,5 ,3 ,3 ) 651 (3 ,1 ,3 ,1 ) 098 (3 ,5 ,1 )
Following sectors are selected in the 1998-2002 period:
062- Sugar confectionary
581- Tubes, pipes and hoses of plastics
629- Articles of rubber, n.e.s.
642- Paper and paperboard
656- Tulles, lace, embroidery, ribbons
658- Made-up articles, wholly or chiefly of textile materials, n.e.s.
665- Glassware
694- Nails, screws, nuts, bolts, rivets, and similar articles of iron, steel, copper
or aluminum
713- Internal combustion piston engines and parts thereof, n.e.s.
33
743- Pumps, air or gas compressors and fans
748- Transmission shafts and cranks
764- Telecommunications equipment and parts, n.e.s.
778- Electrical machinery and apparatus, n.e.s.
784- Parts and accessories for tractors, motor cars and other vehicles, trucks,
public transport vehicles and road motor vehicles, n.e.s.
842- Women’s and girls’ clothing accessories, not knitted or crocheted
845- Articles of apparel, whether knitted or not crocheted, n.e.s.
891- Arms and ammunition
893- Articles, n.e.s. of plastics
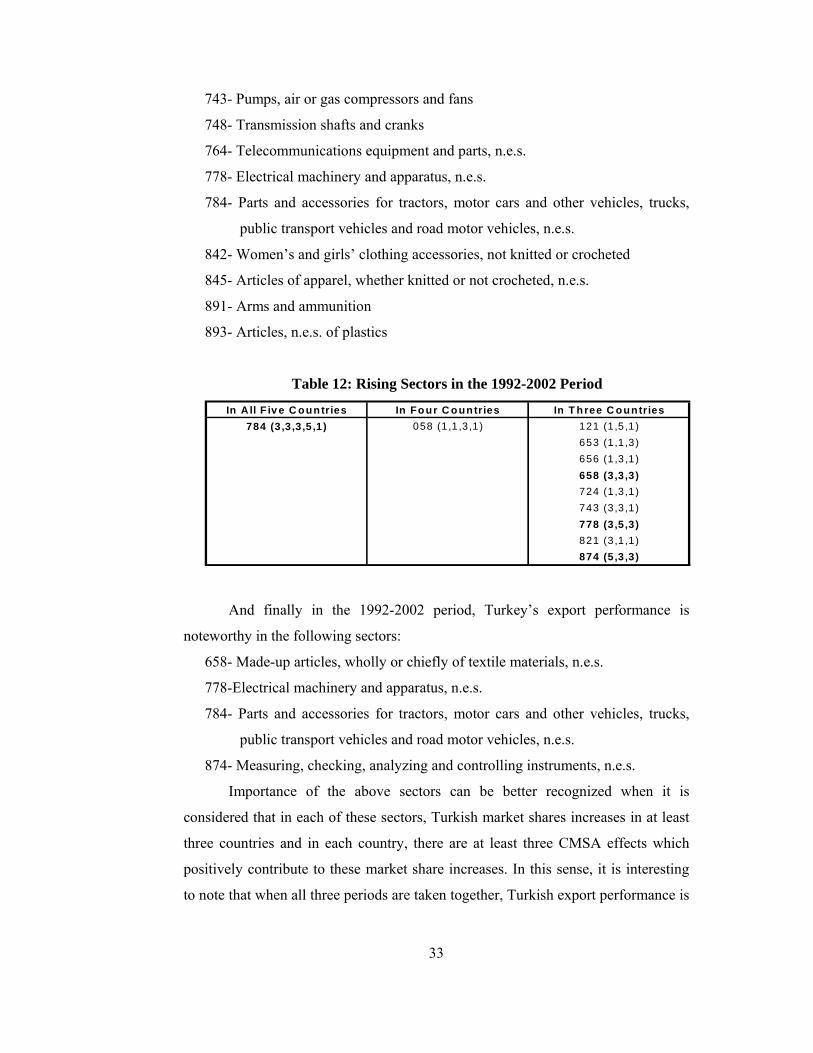
Table 12: Rising Sectors in the 1992-2002 Period
656 (1 ,3 ,1)
874 (5 ,3 ,3)
743 (3 ,3 ,1)778 (3 ,5 ,3)821 (3 ,1 ,1)
724 (1 ,3 ,1)658 (3 ,3 ,3)
784 (3 ,3 ,3 ,5 ,1) 058 (1 ,1 ,3 ,1) 121 (1 ,5 ,1)653 (1 ,1 ,3)
In A ll F iv e C ountries In Four C ountries In T hree C ountries
And finally in the 1992-2002 period, Turkey’s export performance is
noteworthy in the following sectors:
658- Made-up articles, wholly or chiefly of textile materials, n.e.s.
778-Electrical machinery and apparatus, n.e.s.
784- Parts and accessories for tractors, motor cars and other vehicles, trucks,
public transport vehicles and road motor vehicles, n.e.s.
874- Measuring, checking, analyzing and controlling instruments, n.e.s.
Importance of the above sectors can be better recognized when it is
considered that in each of these sectors, Turkish market shares increases in at least
three countries and in each country, there are at least three CMSA effects which
positively contribute to these market share increases. In this sense, it is interesting
to note that when all three periods are taken together, Turkish export performance is

34
generally better in the sectors with the codes of 700s and 800s. Especially 778, 784
and 874 have special importance since they are selected in all three periods.
Detailed information about the export performance in these three sectors is
provided below22.
Market shares in the sector 778- Electrical machinery and apparatus
increase in three countries- Japan, Malaysia and Singapore- during the 1992-1997
period. In Japan, market share, commodity composition and commodity adaptation
effects are positive whereas in Malaysia and Singapore all five effects are positive.
In the 1998-2002 period, 778 increases in four countries i.e. China, Japan, Korea
and Singapore. All five effects are positive in China and Korea, market share,
commodity composition and commodity adaptation effects are positive in Japan
and only the market share effect is positive in Singapore. In the 1992-2002 period,
778 increases in Japan, Malaysia, Singapore. Market share, commodity composition
and commodity adaptation effects are positive in Japan and Singapore and all five
effects are positive in Malaysia.
Market shares of Turkey in 784- parts and accessories for tractors, motor
cars and other vehicles increase in four countries- Japan, Korea, Malaysia,
Singapore- in the 1992-1997 period. In Japan, market share, commodity
composition and commodity adaptation effects are positive whereas in Korea and
Singapore, market share, market composition and market adaptation effects are
positive. In Malaysia, all five effects are positive. Positive market composition and
adaptation effects of this sector are quite interesting in the sense that these effects
are usually negative in other commodity groups. This indicates that in Turkey’s
exports of 784- parts and accessories for tractors, motor cars and other vehicles,
market shares of the countries within the group change in favor of Turkey and
Turkey can adapt to these changes. The CMS performance of this sector is even
better in the 1998-2002 and the 1992-2002 periods since market shares increase in
all countries during both periods. For the period of 1998-2002, all five effects are
positive in China and Korea whereas market share, commodity composition and
commodity adaptation effects are positive in Japan, Malaysia and Singapore. In the
22 See Tables D.15-D.29 in the Appendix D.

35
1992-2002 period, all five effects are positive in Malaysia, three effects are positive
in China, Japan and Korea whereas only the market share effect is positive in
Singapore.
Market shares in the sector 874- Measuring, checking, analyzing and
controlling instruments increase in three countries- China, Japan and Singapore-
during the 1992-1997 period. In China, market share, market composition and
market adaptation effects are positive. In Japan, market share, commodity
composition and commodity adaptation effects are positive and in Singapore, all
five effects are positive. In the 1992-2002 period, 874 increases in China, Japan
and Singapore. Market share, commodity composition and commodity adaptation
effects are positive in Japan and Singapore and all five effects are positive in
China23.
The above explanations once again show that the sectors 778, 784 and 874
have superior export performances in terms of both the number of countries in
which Turkey’s market shares increase and the number of positive CMS effects
which trigger these market share increases. Technological characteristics of these
sectors are quite interesting in the sense that two of these three sectors- 778, 874-
belong to the difficult-to imitate research intensive goods category. Coping with the
technology leaders of the world and being successful in their market might be
considered as a success for Turkey even if this success is valid for two commodity
groups.
23 874 increases in only two countries in the 1998-2002 period, and therefore this period was not included in the Table 11 and in the detailed explanation about this sector.
36
CHAPTER 5
REVEALED COMPARATIVE ADVANTAGE
RCA is another method which is used in this study in order to evaluate
the export performance of Turkey. This method simply tries to compare a
country’s export performance of a particular good with the world’s export
performance of that particular good. The concept was first used in the literature
by Balassa (1965). He suggested that evaluation of RCA is possible through the
use of relative shares of a country in the world exports of individual
commodities and through the indication of changes in these relative shares.
His study analyses only seventy-four commodity classes in the
manufacturing sector and includes merely the European Common Market and
five industrialized countries (United States, Canada, United Kingdom, Sweden,
Japan). But his study can be extended to all commodity classes and can be
computed for developing countries as well.
Accordingly, Erlat, Erlat and Özçelik (2003) computed RCA indices for
261 commodity groups in Turkey and the European Union (EU) countries
together with non-EU member OECD countries. We again will follow and use
the methodology and definitions given in their study for the computation of
RCA indices.
In this sense, RCA indices are calculated through the use of the
following formulation:
37
∑
∑
=
== N
iiwiw
N
iii
i
XX
XXRCA
1
1 i =1,…,N
where
Xi = Turkey’s total exports of commodity i
Xiw = World exports of commodity i
N = Number of commodities
Accordingly, if RCA index for commodity i is greater than 1, this
commodity is said to have comparative advantage.
The definition of “world” is really important in the computation of RCA. Its
definition may change according to the purpose of the research. It can be total
world exports, total exports of a country group or even a single country. Here, Xiw
is calculated by the summation of total exports of five East-Asian countries together
with Turkey, i.e. China, Japan, Korea, Malaysia, Singapore and Turkey.
Firstly, RCA indices for these six countries are computed and sectors whose
RCA averages are greater than one are selected and classified according to their
technological characteristics.
Results are summarized in Table 13 and Table 14.
Table 13: Number of Sectors Which Have RCA Greater Than Unity
RMIG LIG CIG EIRIG DIRIG Total China 47 48 14 11 5 125 Japan 8 9 17 14 44 92 Korea 17 26 12 9 13 77 Malaysia 36 11 5 7 8 67 Singapore 29 6 12 13 13 73
Turkey 45 35 19 6 6 111
38
Table 14: Percentage Distribution of Sectors Which Have
RCA Greater Than Unity
RMIG LIG CIG EIRIG DIRIG Total China 37,6 38,4 11,2 8,8 4,0 100 Japan 8,7 9,8 18,5 15,2 47,8 100 Korea 22,1 33,8 15,6 11,7 16,9 100 Malaysia 53,7 16,4 7,5 10,4 11,9 100 Singapore 39,7 8,2 16,4 17,8 17,8 100
Turkey 40,5 31,5 17,1 5,4 5,4 100
Among these six countries, China is at the first place when the number of
sectors with comparative advantage is concerned. China had comparative advantage
in 125 sectors out of 260 sectors. About 38.4 percent of these sectors are labor
intensive. Raw material intensive sectors are the second major category with 37.6
percent. Capital intensive goods, easy-to-imitate and difficult-to-imitate research
intensive goods are relatively less significant since they have 11.2 percent, 8.8
percent and 4.0 percent shares respectively.
Turkey is at the second place since she has comparative advantage in 111
sectors. Distribution of sectors is quite similar to China. Raw material intensive
goods take the lion’s share with 40.5 percent. Labor intensive goods are the second
major category with 31.5 percent while capital intensive goods account for 17.1
percent. Easy-to-imitate and difficult-to-imitate research intensive goods have only
5.4 percent share.
Japan has comparative advantage in 92 sectors but the distribution of sectors
is quite different. As opposed to China and Turkey, difficult-to-imitate research
intensive goods constitute the most important category in Japan’s export
performance with 47.8 percent share. This fact is not surprising in the sense that
Japan is the world leader in technology. Capital intensive goods and easy-to-imitate
research intensive goods have close shares which are 18.5 and 15.2 respectively.
Japan is relatively less competitive in raw material intensive and labor intensive
goods which have percentages of 8.7 and 9.8.
Korea has comparative advantage in 77 sectors. Korea is most competitive
in labor intensive sectors which make up of 33.8 percent of all competitive sectors.
39
Raw material intensive goods, difficult-to-imitate research intensive goods, capital
intensive goods and easy-to-imitate research intensive goods do not differ much and
have shares of 22.1 percent, 16.9 percent, 15.6 percent and 11.7 percent in a
descending order.
Singapore has comparative advantage in 73 sectors. Raw material intensive
goods comprise the major category with 29 sectors. Difficult-to-imitate and easy-to-
imitate research intensive goods have equal shares and both sector groups have 17.8
percent share. Capital intensive goods follow these sectors with 16.4 percent. Labor
intensive goods have only 8.2 percent share and there are only 6 competitive sectors
out of 73 sectors that are of labor intensive goods.
Malaysia is at the last place when the number of sectors which have
comparative advantage is concerned. She has comparative advantage only in 67
sectors. Raw material intensive goods are the leading category with 36 sectors and
capital intensive goods are at the final place with 5 sectors.
Turkey’s RCA performance is given in Appendix Table D.30 in detail. The
last two columns indicate the 1992-2002 period average and the last three year’s
period average respectively. Bold numbers specify the sectors whose revealed
comparative indices are greater than one. These competitive sectors are selected
and represented in Table 15.
Table 15: Sectors in which Turkey has Revealed Comparative Advantage
SITC3 1992 1993 1994 1995 1996 1997 1998 1999 2000 2001 2002 Period
Av. Last
3yr.Av.
001 6,52 12,91 10,32 6,42 4,00 3,82 2,37 0,80 0,20 2,85 1,98 4,74 1,68 012 2,29 2,26 2,42 0,81 0,65 0,68 0,67 0,52 0,58 0,68 0,71 1,12 0,66
022 0,26 0,53 0,71 1,20 0,79 0,73 1,03 0,71 1,06 1,63 1,15 0,89 1,28 023 3,60 3,87 1,20 2,43 3,60 2,19 1,19 1,35 1,26 1,16 1,40 2,11 1,27 024 25,45 28,31 28,34 29,41 25,55 27,27 22,34 24,77 25,27 22,26 23,82 25,71 23,78 025 0,28 0,90 4,25 4,74 7,15 9,50 10,79 6,35 1,78 6,70 1,41 4,90 3,29 041 41,78 38,85 38,28 38,60 26,44 29,39 33,24 36,76 41,72 24,92 3,92 32,17 23,52 043 42,11 43,63 43,41 42,74 38,88 35,81 33,27 35,09 41,77 33,62 32,08 38,40 35,82 044 0,20 0,35 0,60 5,65 5,27 0,20 0,36 0,42 0,16 0,44 0,30 1,27 0,30
045 0,10 0,89 0,18 0,10 0,46 0,45 0,29 6,13 2,33 0,25 0,05 1,02 0,88
046 18,19 15,50 18,00 18,55 14,93 18,80 11,62 8,11 12,16 5,25 7,07 13,47 8,16 047 1,29 1,25 0,90 3,25 3,09 2,08 1,19 0,89 0,65 0,40 0,59 1,42 0,55
40
Table 15 Continued
SITC3 1992 1993 1994 1995 1996 1997 1998 1999 2000 2001 2002 Period
Av. Last
3yr.Av.
048 6,59 7,16 7,91 11,40 12,34 11,38 10,16 6,52 6,98 6,39 6,92 8,52 6,76 054 10,20 10,50 8,01 8,13 9,34 9,28 7,36 5,75 6,31 6,04 4,65 7,78 5,66 056 9,90 9,30 9,49 7,62 8,64 8,62 8,03 7,69 7,27 5,99 5,12 7,97 6,13 057 23,81 24,66 24,59 24,93 22,17 22,52 22,20 23,56 24,95 21,72 19,03 23,10 21,90 058 10,98 14,83 16,45 14,20 13,12 14,64 13,51 12,69 12,61 10,04 8,71 12,89 10,45 059 24,18 19,79 20,66 21,69 20,65 12,98 12,39 11,88 7,95 5,93 4,24 14,76 6,04 061 5,63 6,73 9,55 0,90 1,02 6,04 6,29 10,10 12,15 12,94 5,23 6,96 10,11 062 5,91 8,92 15,32 15,64 14,79 13,40 12,21 9,65 9,66 8,40 7,25 11,01 8,44 072 0,01 0,02 0,04 0,29 0,23 0,44 0,25 1,34 2,58 2,80 2,10 0,92 2,49 073 8,77 11,51 12,87 17,10 15,38 15,48 13,23 11,32 12,39 10,07 9,95 12,55 10,80 074 0,66 4,54 0,70 0,47 0,61 1,43 1,13 0,47 0,60 0,35 0,41 1,03 0,45
075 5,38 6,14 4,51 3,29 3,50 3,09 3,70 3,03 3,60 3,68 4,01 4,00 3,76 091 17,04 18,54 18,60 19,42 19,72 13,82 13,70 12,68 11,00 8,82 8,53 14,72 9,45 098 1,79 2,08 2,04 2,02 2,33 2,63 2,39 2,06 2,25 1,76 1,91 2,11 1,97 111 0,84 0,87 1,73 3,92 4,16 2,57 1,83 1,24 1,26 0,80 0,82 1,82 0,96
112 1,03 1,23 1,78 2,18 2,18 1,50 1,38 1,18 1,17 1,00 0,96 1,42 1,04 121 27,24 31,37 33,40 28,04 30,03 25,85 23,93 24,53 28,73 21,45 18,13 26,61 22,77 122 0,82 1,10 0,64 2,35 1,42 1,82 1,12 2,15 3,64 1,82 2,11 1,73 2,52 211 0,54 0,80 0,43 0,83 1,10 0,50 5,22 3,49 9,05 7,77 7,82 3,41 8,21 212 1,05 1,04 1,73 1,34 1,83 1,89 0,69 1,03 0,16 0,25 0,02 1,00 0,14
223 3,41 6,96 7,17 8,25 11,35 14,71 14,68 15,66 11,28 8,57 8,06 10,01 9,30 263 7,60 16,35 8,39 12,68 28,11 20,29 15,62 10,13 7,34 14,19 8,90 13,60 10,14 264 0,00 0,01 0,09 0,75 5,09 8,99 6,18 0,65 0,32 1,42 1,89 2,31 1,21 266 1,69 1,10 2,14 2,12 1,81 1,43 1,72 1,94 2,26 2,41 2,42 1,91 2,36 269 2,17 2,02 2,80 2,95 2,59 2,68 3,99 2,82 2,81 2,32 2,59 2,70 2,57 273 2,15 2,30 2,28 2,79 3,12 3,97 4,89 7,11 7,52 9,42 9,65 5,02 8,86 277 8,59 3,71 3,57 3,99 4,17 2,88 3,39 2,64 2,79 2,11 2,73 3,69 2,55 278 9,95 9,25 8,84 7,52 7,35 6,46 6,46 7,58 7,74 5,50 5,62 7,48 6,29 281 0,64 0,39 0,00 0,10 1,87 3,71 0,61 1,01 4,03 7,13 0,62 1,83 3,93 282 1,26 1,50 4,02 1,83 1,38 1,10 0,80 0,92 1,34 0,66 0,65 1,40 0,88
283 5,33 5,91 5,68 16,45 14,69 22,15 22,88 29,98 39,79 31,79 30,18 20,44 33,92 285 3,71 4,99 2,83 4,81 3,13 3,11 2,10 2,65 2,83 3,81 1,37 3,21 2,67 287 11,63 9,26 11,10 22,39 20,09 15,22 14,55 13,03 15,38 7,25 6,36 13,29 9,66 288 0,37 0,45 2,18 1,90 2,56 2,23 2,38 2,20 2,46 2,09 2,02 1,89 2,19 289 0,00 0,07 0,77 1,60 3,48 1,92 0,00 0,06 1,39 0,10 1,92 1,03 1,13 291 3,18 3,54 2,56 2,31 2,24 2,17 2,07 2,25 1,89 1,31 1,62 2,29 1,61 292 1,26 1,36 1,26 1,74 1,06 1,09 1,29 1,37 1,05 0,97 1,21 1,24 1,08 322 0,06 1,52 16,07 1,20 12,01 1,39 3,44 1,98 2,39 0,45 1,37 3,81 1,40 344 7,17 3,38 2,26 2,38 1,76 1,46 1,58 2,61 1,69 1,78 1,53 2,51 1,67 351 0,00 0,00 0,22 0,13 2,41 0,87 1,10 0,93 1,40 1,03 0,80 0,81 1,08 411 2,98 2,35 3,47 9,49 8,16 1,21 1,08 0,81 1,61 0,39 2,66 3,11 1,55 421 22,32 12,53 7,20 12,67 8,84 7,09 8,44 15,25 8,80 14,10 7,91 11,38 10,27 431 0,53 4,22 3,08 3,19 3,04 3,28 2,47 1,42 1,25 0,64 0,56 2,15 0,82 523 5,29 4,73 4,74 3,91 0,56 3,81 4,29 5,10 4,92 3,20 3,25 3,98 3,79 532 8,54 5,32 7,00 10,77 9,84 9,65 9,89 9,95 10,52 7,03 6,37 8,63 7,98
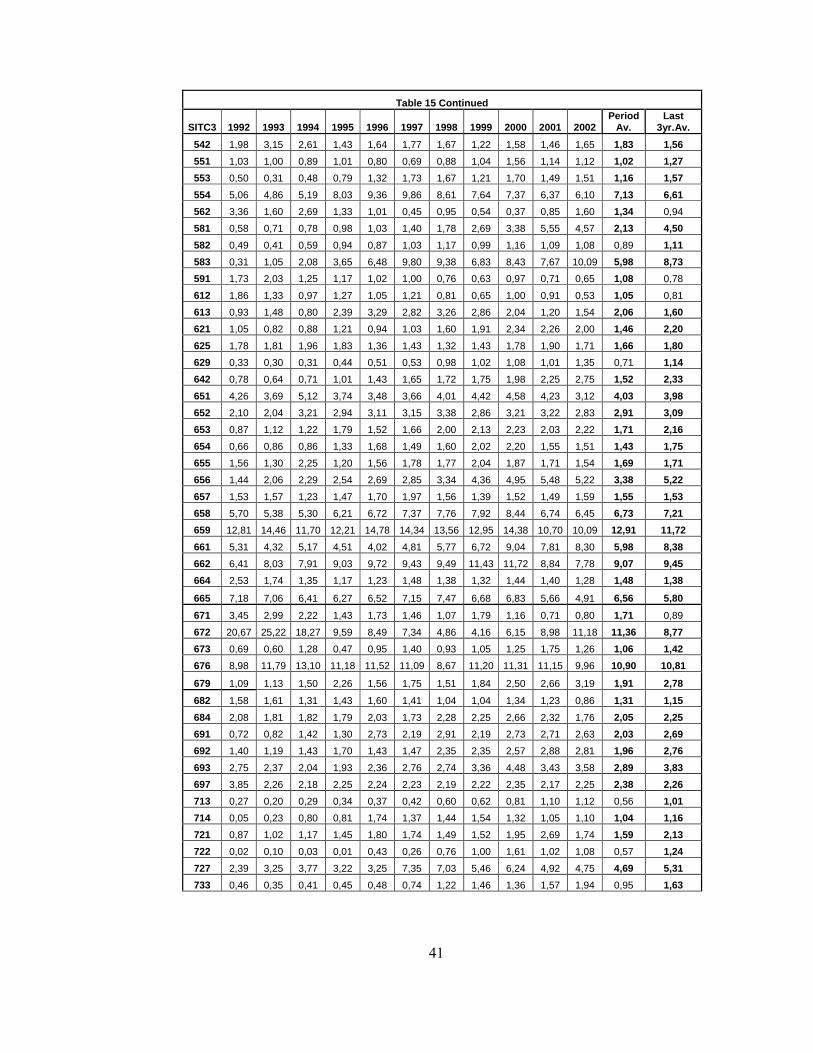
41
Table 15 Continued
SITC3 1992 1993 1994 1995 1996 1997 1998 1999 2000 2001 2002 Period
Av. Last
3yr.Av. 542 1,98 3,15 2,61 1,43 1,64 1,77 1,67 1,22 1,58 1,46 1,65 1,83 1,56 551 1,03 1,00 0,89 1,01 0,80 0,69 0,88 1,04 1,56 1,14 1,12 1,02 1,27 553 0,50 0,31 0,48 0,79 1,32 1,73 1,67 1,21 1,70 1,49 1,51 1,16 1,57 554 5,06 4,86 5,19 8,03 9,36 9,86 8,61 7,64 7,37 6,37 6,10 7,13 6,61 562 3,36 1,60 2,69 1,33 1,01 0,45 0,95 0,54 0,37 0,85 1,60 1,34 0,94
581 0,58 0,71 0,78 0,98 1,03 1,40 1,78 2,69 3,38 5,55 4,57 2,13 4,50 582 0,49 0,41 0,59 0,94 0,87 1,03 1,17 0,99 1,16 1,09 1,08 0,89 1,11 583 0,31 1,05 2,08 3,65 6,48 9,80 9,38 6,83 8,43 7,67 10,09 5,98 8,73 591 1,73 2,03 1,25 1,17 1,02 1,00 0,76 0,63 0,97 0,71 0,65 1,08 0,78
612 1,86 1,33 0,97 1,27 1,05 1,21 0,81 0,65 1,00 0,91 0,53 1,05 0,81
613 0,93 1,48 0,80 2,39 3,29 2,82 3,26 2,86 2,04 1,20 1,54 2,06 1,60 621 1,05 0,82 0,88 1,21 0,94 1,03 1,60 1,91 2,34 2,26 2,00 1,46 2,20 625 1,78 1,81 1,96 1,83 1,36 1,43 1,32 1,43 1,78 1,90 1,71 1,66 1,80 629 0,33 0,30 0,31 0,44 0,51 0,53 0,98 1,02 1,08 1,01 1,35 0,71 1,14 642 0,78 0,64 0,71 1,01 1,43 1,65 1,72 1,75 1,98 2,25 2,75 1,52 2,33 651 4,26 3,69 5,12 3,74 3,48 3,66 4,01 4,42 4,58 4,23 3,12 4,03 3,98 652 2,10 2,04 3,21 2,94 3,11 3,15 3,38 2,86 3,21 3,22 2,83 2,91 3,09 653 0,87 1,12 1,22 1,79 1,52 1,66 2,00 2,13 2,23 2,03 2,22 1,71 2,16 654 0,66 0,86 0,86 1,33 1,68 1,49 1,60 2,02 2,20 1,55 1,51 1,43 1,75 655 1,56 1,30 2,25 1,20 1,56 1,78 1,77 2,04 1,87 1,71 1,54 1,69 1,71 656 1,44 2,06 2,29 2,54 2,69 2,85 3,34 4,36 4,95 5,48 5,22 3,38 5,22 657 1,53 1,57 1,23 1,47 1,70 1,97 1,56 1,39 1,52 1,49 1,59 1,55 1,53 658 5,70 5,38 5,30 6,21 6,72 7,37 7,76 7,92 8,44 6,74 6,45 6,73 7,21 659 12,81 14,46 11,70 12,21 14,78 14,34 13,56 12,95 14,38 10,70 10,09 12,91 11,72 661 5,31 4,32 5,17 4,51 4,02 4,81 5,77 6,72 9,04 7,81 8,30 5,98 8,38 662 6,41 8,03 7,91 9,03 9,72 9,43 9,49 11,43 11,72 8,84 7,78 9,07 9,45 664 2,53 1,74 1,35 1,17 1,23 1,48 1,38 1,32 1,44 1,40 1,28 1,48 1,38
665 7,18 7,06 6,41 6,27 6,52 7,15 7,47 6,68 6,83 5,66 4,91 6,56 5,80 671 3,45 2,99 2,22 1,43 1,73 1,46 1,07 1,79 1,16 0,71 0,80 1,71 0,89
672 20,67 25,22 18,27 9,59 8,49 7,34 4,86 4,16 6,15 8,98 11,18 11,36 8,77 673 0,69 0,60 1,28 0,47 0,95 1,40 0,93 1,05 1,25 1,75 1,26 1,06 1,42 676 8,98 11,79 13,10 11,18 11,52 11,09 8,67 11,20 11,31 11,15 9,96 10,90 10,81
679 1,09 1,13 1,50 2,26 1,56 1,75 1,51 1,84 2,50 2,66 3,19 1,91 2,78 682 1,58 1,61 1,31 1,43 1,60 1,41 1,04 1,04 1,34 1,23 0,86 1,31 1,15 684 2,08 1,81 1,82 1,79 2,03 1,73 2,28 2,25 2,66 2,32 1,76 2,05 2,25 691 0,72 0,82 1,42 1,30 2,73 2,19 2,91 2,19 2,73 2,71 2,63 2,03 2,69 692 1,40 1,19 1,43 1,70 1,43 1,47 2,35 2,35 2,57 2,88 2,81 1,96 2,76 693 2,75 2,37 2,04 1,93 2,36 2,76 2,74 3,36 4,48 3,43 3,58 2,89 3,83 697 3,85 2,26 2,18 2,25 2,24 2,23 2,19 2,22 2,35 2,17 2,25 2,38 2,26 713 0,27 0,20 0,29 0,34 0,37 0,42 0,60 0,62 0,81 1,10 1,12 0,56 1,01 714 0,05 0,23 0,80 0,81 1,74 1,37 1,44 1,54 1,32 1,05 1,10 1,04 1,16 721 0,87 1,02 1,17 1,45 1,80 1,74 1,49 1,52 1,95 2,69 1,74 1,59 2,13 722 0,02 0,10 0,03 0,01 0,43 0,26 0,76 1,00 1,61 1,02 1,08 0,57 1,24 727 2,39 3,25 3,77 3,22 3,25 7,35 7,03 5,46 6,24 4,92 4,75 4,69 5,31 733 0,46 0,35 0,41 0,45 0,48 0,74 1,22 1,46 1,36 1,57 1,94 0,95 1,63

42
Table 15 Continued
SITC3 1992 1993 1994 1995 1996 1997 1998 1999 2000 2001 2002 Period
Av. Last
3yr.Av. 761 1,15 0,83 0,79 0,95 0,94 1,89 3,57 3,47 3,66 3,04 3,75 2,18 3,48 773 2,89 2,65 2,79 2,99 3,26 2,60 2,62 2,28 2,48 2,61 2,70 2,71 2,60 775 0,98 1,22 1,46 1,99 1,86 1,97 2,10 2,09 2,13 1,89 2,17 1,81 2,06 782 0,02 0,05 0,06 0,18 0,15 0,13 0,12 0,20 0,53 2,00 3,02 0,59 1,85 783 1,16 2,04 2,57 3,61 5,29 3,44 3,97 6,29 6,42 6,02 5,50 4,21 5,98 786 0,42 1,56 2,03 1,55 1,55 1,47 0,93 0,56 0,52 0,51 0,61 1,06 0,55
792 0,00 0,01 0,33 0,06 0,49 1,33 1,01 4,24 6,54 4,25 1,28 1,78 4,03 811 7,31 11,99 10,38 6,95 4,99 4,55 8,99 5,74 6,57 4,35 6,76 7,14 5,89 812 18,99 19,28 18,56 17,77 16,64 15,94 16,79 17,91 19,22 15,55 15,16 17,44 16,64 841 2,69 2,97 2,70 4,12 3,63 3,47 3,65 3,73 3,73 3,19 3,74 3,42 3,55 842 4,12 4,41 4,01 5,88 5,70 5,29 5,52 5,91 6,21 5,34 5,36 5,25 5,64 843 3,72 4,08 4,66 6,67 6,28 4,49 4,15 4,08 3,76 3,12 3,20 4,38 3,36 844 14,27 14,41 11,22 13,96 11,07 7,59 7,18 7,08 7,68 6,12 5,79 9,67 6,53 845 7,27 7,57 7,52 8,57 8,12 6,85 6,77 6,46 6,35 5,05 5,25 6,89 5,55 846 3,29 3,78 4,31 5,14 5,09 4,01 3,96 4,44 4,33 3,95 3,99 4,21 4,09 848 4,95 5,00 4,55 4,20 2,91 2,99 2,53 2,52 2,58 2,13 1,98 3,30 2,23 891 1,89 1,37 1,50 2,94 6,10 6,05 1,58 5,81 7,45 7,49 12,60 4,98 9,18 896 0,01 0,02 0,09 0,10 0,25 0,05 0,99 0,21 4,64 0,65 0,30 0,66 1,86 897 0,32 0,60 0,84 0,92 1,68 1,97 1,99 2,92 4,23 4,25 5,04 2,25 4,51
961 0,00 0,00 0,22 2,41 7,12 3,82 5,10 5,90 6,23 0,31 1,14 2,93 2,56
Table 15 offers four different information about the RCA performance of
Turkey. The first information we gather concerns the sectors whose RCA averages
are smaller than one for the whole period but greater than one in the last three years.
In other words, it represents rising sectors. There are ten sectors in this category
which can be listed as follows:
022- Milk and cream and milk products other than butter or cheese
072- Cocoa
351- Electric current
582- Plates, sheets, film, foil and strip of plastics
629- Articles of rubber, n.e.s.
713- Steam turbines and other vapor turbines, and parts thereof, n.e.s.
722- Tractors (other than mechanical handling equipment)
733- Machine tools for working metal, sintered metal carbides or cermets,
without removing material
782- Motor vehicles for the transport of goods and special purpose motor
vehicles
43
896- Works of art, collectors' pieces and antiques
The second type of information is just the opposite of the first situation. It
represents the sectors whose RCA averages are greater than one for the whole
period but smaller than one in the last three years. In other words, it represents
declining sectors. There are fourteen sectors in this category which can be recorded
as the following:
012- Meat, other than of bovine animals, and edible offal, fresh, chilled or
frozen
044- Maize (not including sweet corn) unmilled
045- Cereals, unmilled (other than wheat, rice, barley and maize)
047- Cereal meals and flours, n.e.s.
074- Tea and mate
111- Nonalcoholic beverages, n.e.s.
212- Furskins, raw (including furskin heads, tails and other pieces or cuttings,
suitable for furriers' use)
282- Ferrous waste and scrap; remelting ingots of iron or steel
431- Animal or vegetable fats and oils processed; waxes and inedible mixtures
or preparations of animal or vegetable fats or oils, n.e.s.
562- Fertilizers (other than those of group 272)
591- Insecticides, fungicides, herbicides, plant growth regulators, etc.,
disinfectants and similar products, put up or packed for retail sale, etc.
612- Manufactures of leather or composition leather, n.e.s.; saddlery and
harness
671- Pig iron and sponge iron, iron or steel granules and powders and
ferroalloys
786- Trailers and semi-trailers; other vehicles, not mechanically propelled;
specially designed and equipped transport containers
Third type of information we obtain from Table 15 is about the sectors
whose RCA averages are greater than one both in the 1992-2002 period and in the
44
last three years. However, these sectors have increasing RCA values in the last
three years compared to the 1992-2002 period. There are forty-one sectors in this
category which are:
061- Sugars, molasses, and honey
122- Tobacco, manufactured
211- Hides and skins (except furskins), raw
266- Synthetic fibers suitable for spinning
273- Stone, sand and gravel
281- Iron ore and concentrates
283- Copper ores and concentrates; copper mattes; cement copper
288- Nonferrous base metal waste and scrap, n.e.s.
289- Ores and concentrates of precious metals; waste, scrap and sweepings of
precious metals (other than gold)
551- Essential oils, perfume and flavor materials
553- Perfumery, cosmetics, or toilet preparations, excluding soaps
581- Tubes, pipes and hoses of plastics
583- Monofilament with a cross-sectional dimension exceeding 1 mm
621- Materials of rubber, including pastes, plates, sheets, rods, thread, tubes,
etc.
625- Rubber tires, interchangeable tire treads, tire flaps and inner tubes for
wheels of all kinds
642- Paper and paperboard, cut to size or shape, and articles of paper or
paperboard
652- Cotton fabrics, woven (not including narrow or special fabrics)
653- Woven fabrics of manmade textile materials (not including narrow or
special fabrics)
654- Woven fabrics of textile materials, other than cotton or manmade fibers
and narrow or special fabrics
655- Knitted or crocheted fabrics (including tubular knit fabrics, n.e.s., pile
fabrics and open-work fabrics), n.e.s.
656- Tulles, lace, embroidery, ribbons, trimmings and other small wares
45
658- Made-up articles, wholly or chiefly of textile materials, n.e.s.
661- Lime, cement, and fabricated construction materials, except glass and clay
materials
662- Clay construction materials and refractory construction materials
673- Iron or non-alloy steel flat-rolled products, not clad, plated or coated
679- Iron and steel tubes, pipes and hollow profiles, fittings for tubes and pipes
684- Aluminum
691- Metal structures and parts, n.e.s., of iron, steel or aluminum
692- Metal containers for storage or transport
693- Wire products (excluding insulated electrical wiring) and fencing grills
714- Engines and motors, non-electric
721- Agricultural machinery (excluding tractors) and parts thereof
727- Food-processing machines (excluding domestic)
761- TV receivers (including video monitors & projectors)
775- Household type electrical and non-electrical equipment, n.e.s.
783- Road motor vehicles, n.e.s.
792- Aircraft and associated equipment; spacecraft (including satellites) and
spacecraft launch vehicles; and parts thereof
841- Men's or boys' coats, jackets, suits, trousers, shirts, underwear etc. of
woven textile fabrics (except swimwear and coated or laminated apparel)
842- Women's or girls' coats, capes, jackets, suits, trousers, dresses, skirts,
underwear, etc. of woven textiles (except swimwear and coated etc.
apparel)
891- Arms and ammunition
897- Jewelry, goldsmiths' and silversmiths' wares, and other articles of precious
or semiprecious materials, n.e.s.
Finally, the last category includes sectors whose RCA averages are again
greater than one both in the 1992-2002 period and in the last three years but these
sectors have decreasing RCA values in the last three years compared to the 1992-
2002 period. There are fifty-seven sectors in this category which are:

46
001- Live animals
023- Butter and other fats and oils derived from milk
024-Cheese and curd
025- Birds' eggs and egg yolks, fresh, dried or otherwise
041- Wheat (including spelt) and meslin, unmilled
043- Barley, unmilled
046- Meal and flour of wheat and flour of meslin
048- Cereal preparations and preparations of flour or starch of fruits or
vegetables
054- Vegetables, fresh, chilled, frozen or simply preserved; roots, tubers and
other edible vegetable products, n.e.s., fresh or dried
056- Vegetables, roots and tubers, prepared or preserved, n.e.s.
057- Fruit and nuts (not including oil nuts), fresh or dried
058- Fruit preserved, and fruit preparations (excluding fruit juices)
059- Fruit juices (incl. grape must) and vegetable juices, unfermented and not
containing added spirit, whether or not containing added sweetening
matter
062- Sugar confectionery
073- Chocolate and other food preparations containing cocoa, n.e.s.
075- Spices
091- Margarine and shortening
098- Edible products and preparations, n.e.s
112- Alcoholic beverages
121-Tobacco, unmanufactured; tobacco refuse
223- Oil seeds and oleaginous fruits, whole or broken, of a kind used for
extracting other fixed vegetable oils
263- Cotton textile fibers
264- Jute and other textile bast fibers, n.e.s., raw or processed but not spun; tow
and waste of these fibres
269- Worn clothing and other worn textile articles; rags
277- Natural abrasives, n.e.s. (including industrial diamonds)

47
278- Crude minerals, n.e.s.
285- Aluminum ores and concentrates (including alumina)
287- Ores and concentrates of base metals, n.e.s.
291- Crude animal materials, n.e.s.
292- Crude vegetable materials, n.e.s.
322- Briquettes, lignite and peat
344- Petroleum gases and other gaseous hydrocarbons, n.e.s.
411- Animal oils and fats
421- Fixed vegetable fats and oils, soft, crude, refined or fractionated
523- Metallic salts and peroxysalts of inorganic acids
532- Dyeing and tanning extracts, and synthetic tanning materials
542- Medicaments (including veterinary medicaments)
554- Soap, cleansing and polishing preparations
613- Furskins, tanned or dressed (including pieces or cuttings), assembled or
unassembled without the addition of other materials, other than apparel,
etc.
651- Textile yarn
657- Special yarns, special textile fabrics and related products
659- Floor coverings, etc.
664- Glass
665- Glassware
672- Iron or steel ingots and other primary forms, and semifinished products of
iron or steel
676- Iron and steel bars, rods, angles, shapes and sections, including sheet
piling
682- Copper
697- Household equipment of base metal, n.e.s.
773- Equipment for distributing electricity, n.e.s.
811- Prefabricated buildings
812- Sanitary, plumbing and heating fixtures and fittings, n.e.s
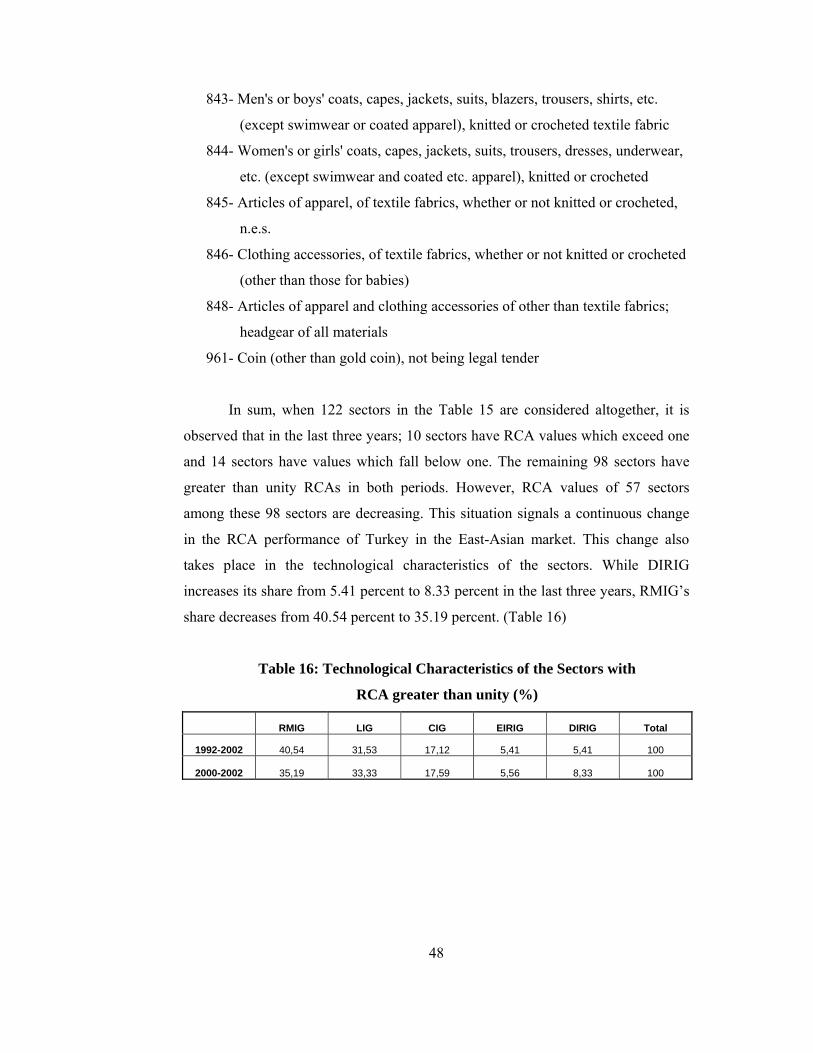
48
843- Men's or boys' coats, capes, jackets, suits, blazers, trousers, shirts, etc.
(except swimwear or coated apparel), knitted or crocheted textile fabric
844- Women's or girls' coats, capes, jackets, suits, trousers, dresses, underwear,
etc. (except swimwear and coated etc. apparel), knitted or crocheted
845- Articles of apparel, of textile fabrics, whether or not knitted or crocheted,
n.e.s.
846- Clothing accessories, of textile fabrics, whether or not knitted or crocheted
(other than those for babies)
848- Articles of apparel and clothing accessories of other than textile fabrics;
headgear of all materials
961- Coin (other than gold coin), not being legal tender
In sum, when 122 sectors in the Table 15 are considered altogether, it is
observed that in the last three years; 10 sectors have RCA values which exceed one
and 14 sectors have values which fall below one. The remaining 98 sectors have
greater than unity RCAs in both periods. However, RCA values of 57 sectors
among these 98 sectors are decreasing. This situation signals a continuous change
in the RCA performance of Turkey in the East-Asian market. This change also
takes place in the technological characteristics of the sectors. While DIRIG
increases its share from 5.41 percent to 8.33 percent in the last three years, RMIG’s
share decreases from 40.54 percent to 35.19 percent. (Table 16)
Table 16: Technological Characteristics of the Sectors with
RCA greater than unity (%)
RMIG LIG CIG EIRIG DIRIG Total
1992-2002 40,54 31,53 17,12 5,41 5,41 100
2000-2002 35,19 33,33 17,59 5,56 8,33 100
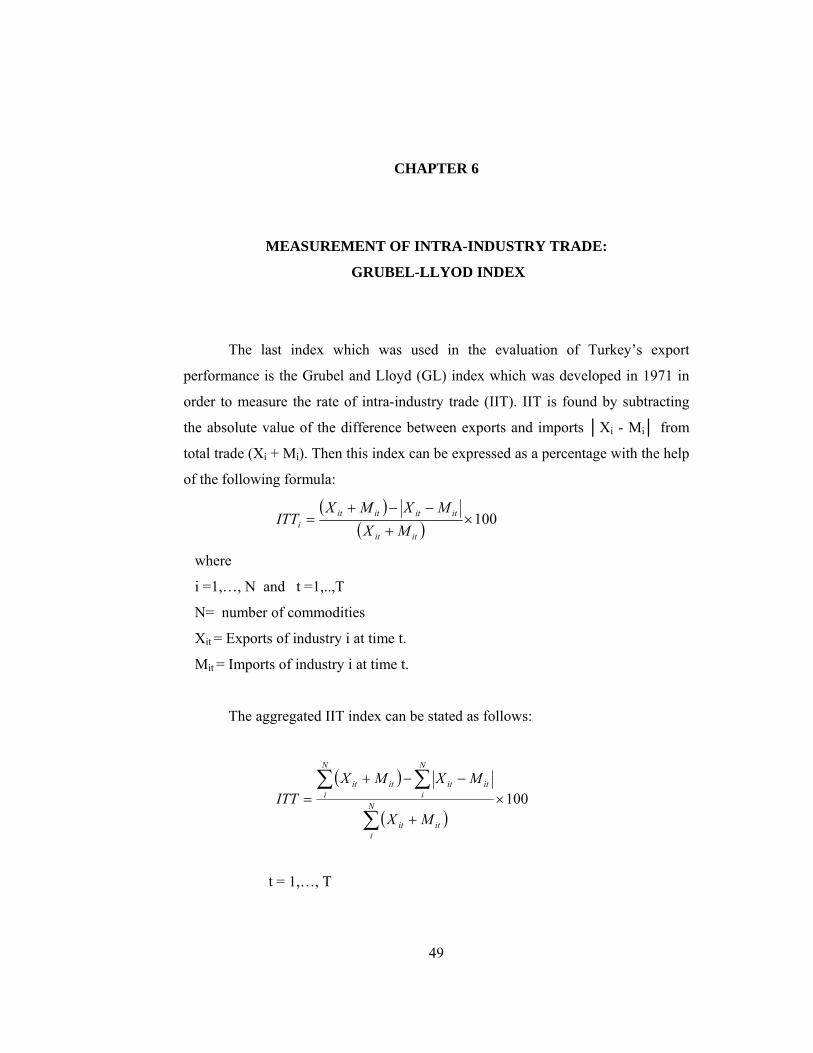
49
CHAPTER 6
MEASUREMENT OF INTRA-INDUSTRY TRADE:
GRUBEL-LLYOD INDEX
The last index which was used in the evaluation of Turkey’s export
performance is the Grubel and Lloyd (GL) index which was developed in 1971 in
order to measure the rate of intra-industry trade (IIT). IIT is found by subtracting
the absolute value of the difference between exports and imports │Xi - Mi│ from
total trade (Xi + Mi). Then this index can be expressed as a percentage with the help
of the following formula:
( )( ) 100×
+
−−+=
itit
ititititi MX
MXMXITT
where
i =1,…, N and t =1,..,T
N= number of commodities
Xit = Exports of industry i at time t.
Mit = Imports of industry i at time t.
The aggregated IIT index can be stated as follows:
( )
( )100×
+
−−+=
∑
∑ ∑N
iitit
N
i
N
iitititit
MX
MXMXITT
t = 1,…, T

50
Values of IIT differ between 0 and 100. In one extreme, when the value of
the exports of commodity i is exactly equal to the value of the imports of
commodity i, the index takes on the value of 100 and at the other extreme, when
there are exports (imports) of commodity i but there are no imports (exports) of it,
the index takes the value of 0 indicating that there is no intra-industry trade.
The aggregated GL index for trade between Turkey and East-Asian
countries is given in Table 17.
Table 17 : The Aggregated Grubel-Lloyd Index (%)
1992 1993 1994 1995 1996 1997 1998 1999 2000 2001 2002 Period Average
China 1,16 1,62 1,91 1,66 2,76 2,31 4,49 3,82 2,86 6,02 7,67 3,30
Japan 4,20 2,88 3,94 2,65 3,04 1,69 1,50 2,14 2,31 2,22 2,13 2,61
Korea 0,62 1,52 5,23 2,82 2,66 1,36 0,72 5,52 4,20 4,16 5,56 3,12
Malaysia 2,42 2,17 2,63 2,81 4,20 3,82 2,64 4,06 4,94 5,22 5,32 3,66
Singapore 1,36 2,15 2,91 3,78 3,70 3,68 5,18 5,44 5,95 6,59 6,60 4,30
For China, the GL index follows a relatively stable progress in the pre-crisis
period. Between 1996 and 1999, it fluctuates continuously and has an upward trend
in the last two years. This increase may be related to the increase in the share of
RMIG from 4.86 percent to 7.45 percent in the imports from China between 2000
and 2002 since RMIG has also an important share in the exports to China24.
The GL index of trade with Japan has a declining trend in the pre-crisis
period although it fluctuates between 4.20 percent and 1.69 percent. In the post-
crisis period it became stable around 2 percent.
Although the GL index of trade with Korea has a period average of 3.12
percent, it does not have any trend and fluctuates continuously.
24 See Tables D.5 and D.6 in the Appendix D.
51
The index for Malaysia has a relatively stable trend in the pre-crisis period
until 1996. Between 1996 and 1998 the index decreases continuously and after
1998 it gains an upward trend. Since RMIG has the highest share in the imports
from Malaysia, this upward trend may be related with significant rise in the share of
RMIG in the exports from Malaysia after 199825 .
Singapore has an interestingly upward trend in the whole period. Since
Turkey imported mostly EIRIG and DIRIG from Singapore, this trend in the GL
index may be related to the increase in the share of DIRIG in the exports to
Singapore after the Asian crisis of 199726.
In sum, Table 17 indicates that the level of intra-industry trade is very low
in trade with these countries and all figures are less than 10 percent. In fact, the
reason for this situation is inherent in the Tables D.5- D.14 of the Appendix D. The
technological characteristics of the goods which are exported to East-Asia and
imported from these countries are quite different. While raw material intensive
goods, labor intensive goods and capital intensive goods constitute the major
categories in the exports to East-Asia, easy-to-imitate and difficult-to imitate
research intensive goods are significant in the imports from them.
25 See Table D.11 and D.12 in the Appendix D. 26 See Tables D.13 and D.14 in the Appendix D.
52
CHAPTER 7
EVALUATION OF THE RISING SECTORS IN THE EXPORT
PERFORMANCE OF TURKEY WITH RESPECT TO EAST-ASIAN
COUNTRIES
In this study, mainly three methodologies were used in order to evaluate the
export performance of Turkey with respect to East-Asian countries. These are
CMSA, RCA and the GL index whose results were summarized in Chapters 4, 5
and 6 respectively. From Chapter 6, we saw that the level of intra-industry trade
was very low in trade with these countries and therefore this analysis was not
represented at the sectoral level. In this sense, the results of GL analysis were not
considered in this chapter and rising sectors were selected according to the results
of the CMSA and RCA. These results are also compared with the results of Erlat,
Erlat and Özçelik (2003) in order to judge the export performance of Turkey in the
East-Asian countries against EU and non-EU member OECD countries. The
comparison of the Turkish export performance in the East-Asian countries against
Middle-East countries is included only in general terms at the end of this chapter
since Erlat and Erlat (2004) does not present the CMSA and RCA results at the
sectoral level.
Accordingly, rising sectors in the East-Asian countries were selected from
the sectors in Tables 10, 11 and 12 whose RCA indices are greater than one in the
1992-2002 period, in the last three years or both. Results are presented in Table 18.
058- Fruit preserved and fruit preparations, 062- Sugar confectionery, 121-
Tobacco, 659- Floor coverings, 665- Glassware, 697- Household equipment of base
metal, n.e.s. and 845- Articles of apparel, of textile fabrics all have RCA averages
which are greater than one both in the 1992-2002 period and in the last three years
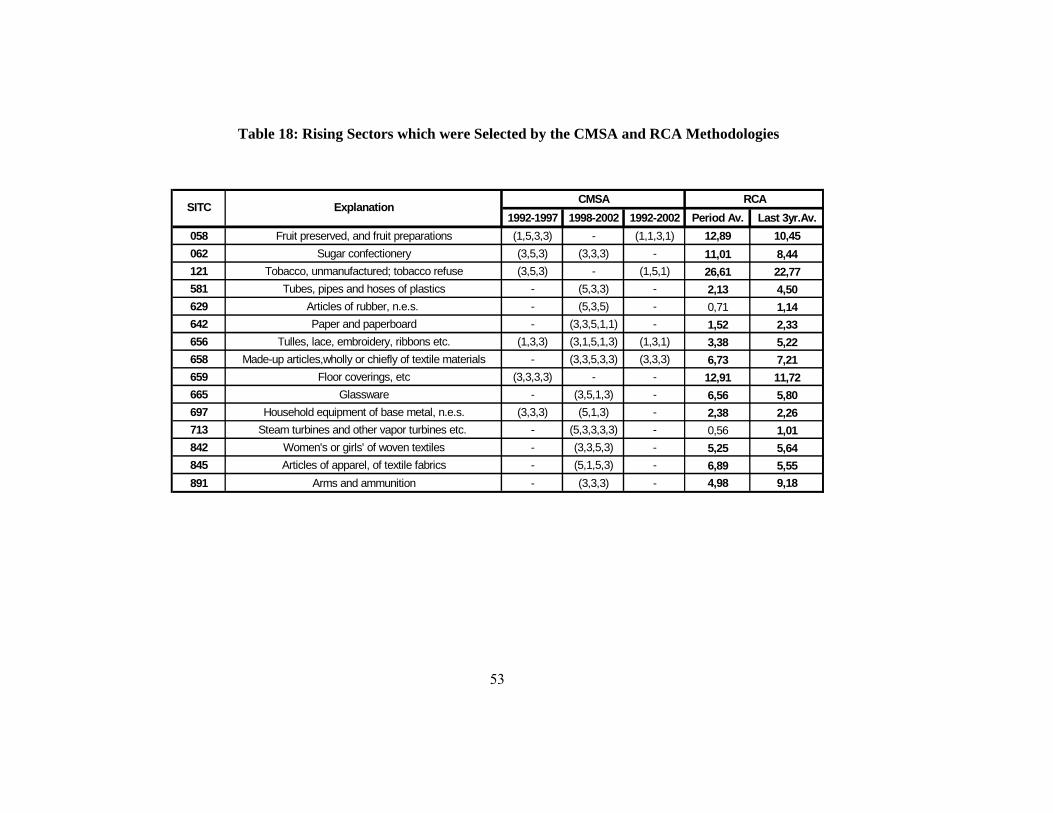
53
Table 18: Rising Sectors which were Selected by the CMSA and RCA Methodologies
1992-1997 1998-2002 1992-2002 Period Av. Last 3yr.Av.058 Fruit preserved, and fruit preparations (1,5,3,3) - (1,1,3,1) 12,89 10,45062 Sugar confectionery (3,5,3) (3,3,3) - 11,01 8,44121 Tobacco, unmanufactured; tobacco refuse (3,5,3) - (1,5,1) 26,61 22,77581 Tubes, pipes and hoses of plastics - (5,3,3) - 2,13 4,50629 Articles of rubber, n.e.s. - (5,3,5) - 0,71 1,14642 Paper and paperboard - (3,3,5,1,1) - 1,52 2,33656 Tulles, lace, embroidery, ribbons etc. (1,3,3) (3,1,5,1,3) (1,3,1) 3,38 5,22658 Made-up articles,wholly or chiefly of textile materials - (3,3,5,3,3) (3,3,3) 6,73 7,21659 Floor coverings, etc (3,3,3,3) - - 12,91 11,72665 Glassware - (3,5,1,3) - 6,56 5,80697 Household equipment of base metal, n.e.s. (3,3,3) (5,1,3) - 2,38 2,26713 Steam turbines and other vapor turbines etc. - (5,3,3,3,3) - 0,56 1,01842 Women's or girls' of woven textiles - (3,3,5,3) - 5,25 5,64845 Articles of apparel, of textile fabrics - (5,1,5,3) - 6,89 5,55891 Arms and ammunition - (3,3,3) - 4,98 9,18
SITC ExplanationCMSA RCA

54
but these sectors have decreasing RCA values in the last three years compared to
the 1992-2002 period. 062, 121, 659, 845 have also decreasing RCA indices in the
last three years in the non-EU member OECD countries27. In the EU countries,
the situation is quite different and except for 062 and 121 all sectors have
increasing RCA values28.
581- Tubes, pipes and hoses of plastics, 642- Paper and paperboard, cut to
size or shape, and articles of paper or paperboard, 656- Tulles, lace, embroidery,
ribbons, trimmings and other small wares and 658- Made-up articles, wholly or
chiefly of textile materials, n.e.s., 842- Women's or girls' woven textiles and 891-
Arms and ammunition have RCA averages which are greater than one both in the
1992-2002 period and in the last three years and these sectors have increasing RCA
values in the last three years compared to the 1992-2002 period. This situation is
also valid for the sectors 656, 658, 842 in the EU countries. RCA indices for 581
and 642 are smaller than one both in the whole period and in the last three years. In
the non-EU member OECD countries, 581 has RCA averages which are smaller
than one for the whole period but greater than one in the last three years. 656, 658
have increasing but 842 has decreasing RCA values in the last three years. RCA
indices for 642 and 891 are smaller than one both in the whole period and in the last
three years.
There are two sectors which need special emphasis in Table 18. These
sectors are 629- Articles of rubber and 713- Steam turbines and other vapor
turbines, and parts thereof. Their RCA averages are smaller than one for the whole
period but greater than one in the last three years. In other words, they represent
rising sectors of the last three years. Interestingly, these sectors have RCA indices
which are smaller than one both in the EU and non-EU member OECD countries.
When we look at the CMS performances of these sectors in the East-Asian
countries, from Table 18 we see that they are impressive in these sectors during the
1998-2002 period. In sector 629, market shares of Turkey increase in three
countries and, in each country, there are at least three positive CMS effects. The
27 See Erlat, Erlat and Özçelik (2003) , Tables 12 and 13 for the results of the RCA in the non-EU member OECD countries 28 See Erlat , Erlat and Özçelik (2003) ,Tables 10 and 11 for the RCA results in the EU countries
55
performance of sector 713 is even better. Turkey’s market shares increase in all five
countries in question. In Japan, Korea, Malaysia and Singapore three CMS effects
are positive and in China all five effects are positive29. These sectors have also
significant CMS performances in the EU and non-EU member OECD countries30
although their RCA performances are poorer in these countries. This result is
interesting in the sense that it may be a signal for Turkey’s success in the
alternative markets for certain commodity groups.
When CMS performances of the sectors in Table 18 are considered
altogether, it is observed that almost all of them have significant performances in
the 1998-2002 period. During this period, Turkey’s market shares increase in at
least three countries in each sector and in each country, at least three of these five
effects are positive31. When CMS performances of these sectors are considered in
the EU countries, it is observed that growing sectors are quite similar with the East-
Asian countries. However, different from the East-Asian countries, 058, 121, 656
and 842 have poor performances in the EU countries whereas 058, 062, 121, 581,
659 and 665 have poor performances in the non-EU member OECD countries.
Turkey’s poor export performance in these sectors in the EU and non-EU member
OECD countries but better export performance in the East-Asian countries raises
the following question: Should Turkey stop selling these goods in the EU and
OECD countries market and direct her exports to the East Asian markets? Even if
this statement is true, we can not decide whether an export structure depending on
these low-technological, traditional goods is desirable or not. It is another research
question and beyond the scope of this study.
Considering the export performance of Turkey in the Middle-East countries,
it is seen that Turkey has comparative advantages in 191 sectors in this market32. In
this sense, RCA performance of Turkey is better in the Middle-East countries when
it is compared to the East Asian countries since Turkey has comparative advantage
29 See Tables D.20-D.24 in the Appendix D. 30 See Erlat, Erlat and Özçelik (2003) , Tables 4 and 9 for the CMS results in the EU and non-EU member OECD countries 31 697-Household equipment of base metal is the only exception for the 1998-2002 period. 32 See Table 10 in Erlat and Erlat (2004)
56
only in 111 sectors in the East-Asian market33. Similar to the case of East-Asia,
LIG and RMIG constitute the major categories in Turkish exports to the Middle-
East countries. However, it is interesting to note that DIRIG has a significant share
of 19.4 percent in the exports to the Middle-East countries whereas this share is
only 5.4 percent in the exports to East-Asia. When the CMSA performance of
Turkey is concerned, it is observed that the market share of the exports of Turkey to
the Middle-East countries decreased in the l998-2000 period and the commodity
adaptation effect was the major reason behind this decrease. Only the market share
and market composition effects were positive and similar to the East-Asian market,
market share effect was the dominant one among the other effects which had
positively contributed the change in the market share between two periods34.
33 See Table 13 of this study. 34 See Table 9 in Erlat and Erlat (2004)

57
CHAPTER 8
CONCLUSION
Basic motive behind this research was to shed light on the export structure
of Turkey and find out promising sectors that encourage her export growth. In this
sense, the export performance of the Turkish manufacturing industries with respect
to East-Asian countries was analyzed between the years 1992-2002. Using SITC
(Rev.3), 3 digit data for 261 sectors and following CMS, RCA and GL
methodologies, we tried to discover the locomotive sectors of Turkish exports.
This analysis was different from the previous studies in the sense that
Turkish export performance was not studied in the East-Asian countries before. In
fact these countries have really significant shares in total world trade and in this
sense, they are worth considering as alternative trade markets for Turkey. In
addition, this study was very detailed in terms of both the type of data used and the
type of information it offers. It gives detailed information about the export
performance of Turkey in each of these 261 sectors of the SITC (REV.3), three
digit classification.
Three methodologies -CMSA, RCA and GL- were applied together in order
to find an answer to our research question. Results of the CMSA show that
Turkey’s market shares decreased in each of these countries during the 1992-2002
period. When two sub-periods are concerned, we see that market shares increase in
Malaysia and Singapore during the 1992-1997 period and in China during the 1998-
2002 period. When the CMS effects which contribute positively or negatively to
these market share increases are concerned, it is observed that the market share
effect is the dominant one in terms of magnitude. Accordingly, increases or
decreases in Turkey’s market shares are mostly characterized by the changes in the
58
ratio of Turkish exports to partner country imports. The remaining commodity
composition, commodity adaptation, market composition and market adaptation
effects are not as dominant as the market share effect. Although the commodity
adaptation effect is the least dominant factor, it is interesting to note that this effect
is positive in Japan and Korea in all three periods. This indicates that Turkey can
adapt its export structure according to the changes in the commodity composition of
Japanese and Korean imports. This fact is quite important in the sense that these
countries may be seriously considered as new trade partners for Turkey if the
magnitude of the commodity composition effect increases enough to provide the
overall market share increase of Turkey.
When detailed CMSA tables including five effects about the 3-digit sectors
in the Appendix D are examined, it is observed that Turkey has superior export
performances in three sectors: 778-Electrical machinery and apparatus, 784- Parts
and accessories for tractors, motor cars and other vehicles, 874- Measuring,
checking, analyzing and controlling instruments. These sectors were not included in
Chapter 7 since their RCA indices are smaller than one both in the 1992-2002
period and in the last three years. However, these sectors are worth considering in
this chapter although they were not selected by the RCA methodology. In each of
these sectors, Turkish market shares increased in at least three countries and in each
country, there are at least three CMSA effects, which positively contribute to these
market share increases. Erlat, Erlat and Özçelik (2003) showed that the export
performance in these sectors is also noteworthy in the EU and non-EU member
OECD countries. Both in the EU countries and non-EU member OECD countries,
the market share of Turkey in the commodity group 784 increases in each of the
1990-1996, 1997-2000 and 1990-2000 periods. Similarly, 874 increases in both
country groups in all three periods. 778 also shows significant trade performance in
the EU countries although the same success cannot be achieved in the non-EU
member OECD countries.
Significant export performance of these three sectors in the East-Asia, EU
and non-EU member OECD35 countries is quite interesting in the sense that Turkey
35 Except for the commodity group 778 in the non-EU member OECD countries
59
does not have comparative advantage in these sectors. As it was mentioned in
Chapter 4, two of these three sectors- 778, 874- belong to the DIRIG category. Erlat
and Erlat (2004) showed that DIRIG had also a significant share of 19.4 percent in
the exports to the Middle-East countries. This situation underlines the fact that
Turkey might be successful in different commodity groups even if she diverges
from her classical, traditional export structure.
Apart from what CMSA shows, results of the RCA methodology show that
out of 122 sectors in which Turkey has comparative advantage, 10 sectors have
RCA values which exceed one and 14 sectors have values which fall below one in
the last three years. The remaining 98 sectors have greater than unity RCAs in both
periods. However, RCA values of 57 sectors among these 98 sectors are decreasing.
This change in the RCA performance of Turkey in the East-Asian market also takes
place in the technological characteristics of the sectors. While DIRIG increases its
share, RMIG’s share decreases in the last three years. Accordingly, this signals a
change in the traditional export structure of Turkey together with the results of the
CMSA.
Results of Chapter 6 show that the level of intra-industry trade is very low
in trade with these countries. This low level of intra-industry trade indicates that the
structure of Turkish exports (imports) and East-Asian exports (imports) is quite
different in terms of commodity groups. Turkey may take advantage from this
situation because instead of trying to sell similar products and competing with these
countries in the same export markets, she may find different product groups which
can help Turkey’s penetration into these markets.
When both CMSA and RCA methodologies are considered together, it is
observed that Turkey’s export performance is noteworthy in fifteen sectors36. These
sectors are mostly traditional sectors which belong to the labor-intensive goods37
category. Another common feature of these sectors is their better CMS performance
during the 1998-2002 period. This recent increase in the export performance may
signal an improvement in trade with these countries.
36 See Table 18. 37 In Table 18, sectors 642, 656, 658, 659, 665, 697, 842, 845 and 891 are labor-intensive. See Appendix C to find out the technological characteristics of the other sectors in this table.

60
In sum, it is observed that Turkey’s export performance is better in the
traditional, less-technology intensive goods when RCA indices are considered.
However this situation is quite different when the CMSA is taken into account since
CMS performances are better in the sectors which Turkey does not have
comparative advantage. In this sense, this situation might be seen as a contradiction
but in fact it is not. Although Turkey’s RCA structure currently depends on
traditional goods, results of the Chapter 5 shows that difficult-to-imitate research
intensive goods have increased their shares in the last three years while shares of
raw material intensive goods have decreased. This signals a change in the RCA
structure of Turkey and supports the CMS results. In this sense, these changes once
again underline the importance of considering different commodity groups as well
as different country markets for better export performance.
61
REFERENCES
Arshad, F.M. and A. Radam (1997), “Export Performance of Selected Electrical and Electronic Products”, Second Asian Academy of Management Conference on Towards Management Excellent in 21st Century Asia, University Sains Malaysia Balassa, B. (1965): “ Trade Liberalization and “Revealed Comparative Advantage”, The Manchester School, 33, 99-123. Balassa, B. (1977): “ Revealed Comparative Advantage Revisited: An Analysis Of Relative Export Shares of The Industrial Countries, 19531971”, The Manchester School, 45, 327- 344. Baldwin, R.E. (1958): “The Commodity Composition of Trade: Selected Industrial Countries, 1900-1954”, Review of Economics and Statistics, 40, 50-71. Banerji, R. (1974): “The Export Performance of Less Developed Countries: A Constant Market Share Analysis”, Welwirtschaftliches Archiv, 100, 447-481. Bishwas, B. (1982): “ Constant Market Share Analysis of Export Performance: The Case of India”, Indian Economic Journal, 29(3), 41-51. Bowen, H.P. and J. Pelzman (1984): “US Export Competitiveness: 1962-77”, Applied Economics, 16, 461-473. Erlat, G., H. Erlat and E. Özçelik (2003): “Türkiye Dış Ticaretinde, Özellikle İhracatında, 1990 Sonrası Gelişmeler ve Öneriler”, TÜSİAD İçin Hazırlanan Rapor. Erlat G. and H. Erlat (2004): “Türkiye’nin Orta Doğu Ülkeleri İle Olan Ticareti, 1990-2002”, in GAP Bölgesinde Dış Ticaret ve Tarım (eds. E. Uygur and İ. Civcir), Ankara: Turkish Economic Association, 33-56.
62
Fagerberg, J. and G. Sollie (1987): “The Method of Constant Market Share Analysis Reconsidered”, Applied Economics, 19, 1571-1583. Grubel H.G. and P.J. Lloyd (1971): “The Empirical Measurement of Intra Industry Trade”, Economic Record, 47, 494-517. Kotan, Z. (2000): “Export Performance of Turkey In The European Union Market Compared To The South East Asian Countries”, Thesis Presented to the Department of Economics, Bilkent University, in partial fulfillment of the Master of Science Degree. Leamer, E.E. and R.M. Stern (1970): Quantitative International Economics. Chicago: Aldine. Lohrmann A.M. (2000): “On Turkey’s Export Performance: A Decomposed Constant Market Shares Analysis”, Russian and East European Finance and Trade, 36, 80-90. Merkies, A.Q.H.M. and T. van der Meer (1988): “A Theoretical Foundation for Constant Market Share Analysis, Empirical Economics, 13, 65-80. Ongun, E. (1990) “Turkey’s Fresh Fruit and Vegetable Exports To The European Community: A Constant Market Share Analysis”, Thesis Presented to the Department of Economics, METU, in partial fulfillment of the Master of Science Degree. Richardson, J.D. (1971 a): “Constant Market Share Analysis of Export Growth”, Journal of International Economics, 1, 227-239. Richardson, J.D. (1971 b): “Some Sensitivity Tests for a “Constant Market Shares Analysis” of Export Growth”, Review of Economics and Statistics, 53, 300-304. Spiegelglas, S. (1959). “World Exports of Manufactures, 1956 vs. 1937”, The Manchester School, 27, 111-139.
63
Temiz, D. (2002): “Turkey’s Agricultural Exports (1989-1998): Constant Market Share Analysis”, Thesis Presented to the Department of Economics, METU, in partial fulfillment of the Master of Science Degree. Tyszynski, H. (1951). “World Trade in Manufactured Commodities, 1899-1950”, The Manchester School, 19, 272-304. Volrath, T.L. (1991): “A Theoretical Evaluation of Alternative Trade Intensity Measures of Revealed Comparative Advantage”, Welwirtschaftliches Archiv, 127, 265-279.
64
APPENDICIES
APPENDIX A
DATA
In this study, SITC (Rev.3), 3 digit data was used for Turkey and five East
Asian countries (China, Japan, Korea, Malaysia and Singapore) for the years 1992-
2002.
Data about Turkey’s foreign trade was obtained from the State Institute of
Statistics. Statistics about foreign trade of East Asian countries were downloaded
from the United Nations Commodity Trade Statistics Database and the International
Trade Center’s (ITC) web site.
In the SITC (Rev.3) three-digit data classification, there are 261 sectors.
From these sectors, only those that contain data on trade between Turkey and East
Asian countries for the years 1992 and 2002 are selected and used in calculations.
Since calculations include ratios, sectors that contain the number zero in the
denominators of these ratios are excluded as ratios become mathematically
indefinite. Given that the number of indefinite sectors is not identical in each
calculation, the aggregate number of sectors may be different for each country in
each period.
65
APPENDIX B
STANDARD INTERNATIONAL TRADE CLASSIFICATION, REVISION 3
THREE-DIGIT CLASSIFICATION LEVEL38
001 Live animals other than animals of division 03 011 Meat of bovine animals, fresh, chilled or frozen 012 Meat, other than of bovine animals, and edible offal, fresh, chilled or frozen (except meat and meat offal not suitable for human consumption)
016 Meat and edible meat offal, salted, in brine, dried or smoked; edible flours and meals of meat or meat offal
017 Meat and edible meat offal, prepared or preserved n.e.s. 022 Milk and cream and milk products other than butter or cheese 023 Butter and other fats and oils derived from milk 024 Cheese and curd 025 Birds' eggs and egg yolks, fresh, dried or otherwise preserved, sweetened or not; egg albumin
034 Fish, fresh (live or dead), chilled or frozen 035 Fish, dried, salted in brine; smoked fish (whether or not cooked before or during the smoking process); flours, meals n pellets r fish, fit f human consumption
036 Crustaceans molluscs,aqutc invrtbrts fresh (live/dead) ch salted etc.;
037 Fish, crustaceans, molluscs and other aquatic invertebrates, prepared or preserved, n.e.s.
041 Wheat (including spelt) and meslin, unmilled 042 Rice 043 Barley, unmilled 044 Maize (not including sweet corn) unmilled 045 Cereals, unmilled (other than wheat, rice, barley and maize) 046 Meal and flour of wheat and flour of meslin 047 Cereal meals and flours, n.e.s. 048 Cereal preparations and preparations of flour or starch of fruits or vegetables
38 Abbreviations: nesoi means not elsewhere specified or indicated; nspf means not specifically provided for; and nec means not elsewhere classified.
66
054 Vegetables, fresh, chilled, frozen or simply preserved; roots, tubers and other edible vegetable products, n.e.s., fresh or dried
056 Vegetables, roots and tubers, prepared or preserved, n.e.s. 057 Fruit and nuts (not including oil nuts), fresh or dried 058 Fruit preserved, and fruit preparations (excluding fruit juices) 059 Fruit juices (incl. grape must) and vegetable juices, unfermented and not containing added spirit, whether or not containing added sweetening matter
061 Sugars, molasses, and honey 062 Sugar confectionery 071 Coffee and coffee substitutes 072 Cocoa 073 Chocolate and other food preparations containing cocoa, n.e.s. 074 Tea and mate 075 Spices 081 Feeding stuff for animals (not including unmilled cereals) 091 Margarine and shortening 098 Edible products and preparations, n.e.s. 111 Nonalcoholic beverages, n.e.s. 112 Alcoholic beverages 121 Tobacco, unmanufactured; tobacco refuse 122 Tobacco, manufactured (whether or not containing tobacco substitutes)
211 Hides and skins (except furskins), raw 212 Furskins, raw (including furskin heads, tails and other pieces or cuttings, suitable for furriers' use)
222 Oil seeds and oleaginous fruits used for the extraction of soft fixed vegetable oils (excluding flours and meals)
223 Oil seeds and oleaginous fruits, whole or broken, of a kind used for extracting other fixed vegetable oils (including their flours and meals, n.e.s.)
231 Natural rubber, balata, gutta-percha, guayule, chicle and similar natural gums, in primary forms (including latex) or in plates, sheets or strip
232 Synthetic rubber; reclaimed rubber; waste, pairings and scrap of unhardened rubber
244 Cork, natural, raw and waste (including natural cork in blocks or sheets)
245 Fuel wood (excluding wood waste) and wood charcoal 246 Wood in chips or particles and wood waste 247 Wood in the rough or roughly squared 248 Wood, simply worked and railway sleepers of wood 251 Pulp and waste paper 261 Silk textile fibers 263 Cotton textile fibers

67
264 Jute and other textile bast fibers, n.e.s., raw or processed but not spun; tow and waste of these fibres (including yarn waste and garnetted stock)
265 Vegetable textile fibers (other than cotton and jute), raw or processed but not spun; waste of these fibers
266 Synthetic fibers suitable for spinning 267 Manmade fibers, n.e.s. suitable for spinning and waste of manmade fibers
268 Wool and other animal hair (including wool tops) 269 Worn clothing and other worn textile articles; rags 272 Fertilizer, crude, except those of division 56, (imports only) 273 Stone, sand and gravel 274 Sulfur and unroasted iron pyrites 277 Natural abrasives, n.e.s. (including industrial diamonds) 278 Crude minerals, n.e.s. 281 Iron ore and concentrates 282 Ferrous waste and scrap; remelting ingots of iron or steel 283 Copper ores and concentrates; copper mattes; cement copper 284 Nickel ores and concentrates; nickel mattes, nickel oxide sinters and other intermediate products of nickel metallurgy
285 Aluminum ores and concentrates (including alumina) 286 Ores and concentrates of uranium or thorium 287 Ores and concentrates of base metals, n.e.s. 288 Nonferrous base metal waste and scrap, n.e.s. 289 Ores and concentrates of precious metals; waste, scrap and sweepings of precious metals (other than gold)
291 Crude animal materials, n.e.s. 292 Crude vegetable materials, n.e.s. 321 Coal, pulverized or not, but not agglomerated 322 Briquettes, lignite and peat 325 Coke and semicoke (including char) of coal, of lignite or of peat, agglomerated or not; retort carbon
333 Petroleum oils and oils from bituminous minerals, crude 334 Petroleum oils and oils from bituminous minerals (other than crude), and products therefrom containing 70% (by wt) or more of these oils, n.e.s.
335 Residual petroleum products, n.e.s. and related materials 342 Liquefied propane and butane 343 Natural gas, whether or not liquefied 344 Petroleum gases and other gaseous hydrocarbons, n.e.s. 345 Coal gas, water gas, producer gas and similar gases, other than petroleum gases and other gaseous hydrocarbons
351 Electric current 411 Animal oils and fats 421 Fixed vegetable fats and oils, soft, crude, refined or fractionated 422 Fixed vegetable fats and oils (other than soft), crude, refined or fractionated
68
431 Animal or vegetable fats and oils processed; waxes and inedible mixtures or preparations of animal or vegetable fats or oils, n.e.s.
511 Hydrocarbons, n.e.s. and their halogenated, sulfonated, nitrated or nitrosated derivatives
512 Alcohols, phenols, phenol-alcohols and their halogenated, sulfonated, nitrated or nitrosated derivatives
513 Carboxylic acids and anhydrides, halides, peroxides and peroxyacids; their halogenated, sulfonated, nitrated or nitrosated derivatives
514 Nitrogen-function compounds 515 Organo-inorganic compounds, heterocyclic compounds, nucleic acids and their salts
516 Organic chemicals, n.e.s. 522 Inorganic chemical elements, oxides and halogen salts 523 Metallic salts and peroxysalts of inorganic acids 524 Inorganic chemicals, n.e.s.; organic and inorganic compounds of precious metals
525 Radioactive and associated materials 531 Synthetic organic coloring matter and color lakes and preparations based thereon
532 Dyeing and tanning extracts, and synthetic tanning materials 533 Pigments, paints, varnishes and related materials 541 Medicinal and pharmaceutical products, other than medicaments (of group 542)
542 Medicaments (including veterinary medicaments) 551 Essential oils, perfume and flavor materials 553 Perfumery, cosmetics, or toilet preparations, excluding soaps 554 Soap, cleansing and polishing preparations 562 Fertilizers (exports include group 272; imports exclude group 272)
571 Polymers of ethylene, in primary forms 572 Polymers of styrene, in primary forms 573 Polymers of vinyl chloride or other halogenated olefins, in primary forms
574 Polyacetals, other polyethers and epoxide resins, in primary forms; polycarbonates, alkyd resins and other polyesters, in primary forms
575 Plastics, n.e.s., in primary forms 579 Waste, parings and scrap, of plastics 581 Tubes, pipes and hoses of plastics 582 Plates, sheets, film, foil and strip of plastics 583 Monofilament with a cross-sectional dimension exceeding 1 mm, rods, sticks and profile shapes of plastics, not more than surface-worked
591 Insecticides, fungicides, herbicides, plant growth regulators, etc., disinfectants and similar products, put up or packed for retail sale, etc.
592 Starches, inulin and wheat gluten; albuminoidal substances; glues

69
593 Explosives and pyrotechnic products 597 Prepared additives for mineral oils etc.; liquids for hydraulic transmissions; antifreezes and deicing fluids; lubricating preparations
598 Miscellaneous chemical products, n.e.s. 611 Leather 612 Manufactures of leather or composition leather, n.e.s.; saddlery and harness
613 Furskins, tanned or dressed (including pieces or cuttings), assembled or unassembled without the addition of other materials, other than apparel, etc.
621 Materials of rubber, including pastes, plates, sheets, rods, thread, tubes, etc.
625 Rubber tires, interchangeable tire treads, tire flaps and inner tubes for wheels of all kinds
629 Articles of rubber, n.e.s. 633 Cork manufactures 634 Veneers, plywood, particle board, and other wood, worked, n.e.s. 635 Wood manufactures, n.e.s. 641 Paper and paperboard 642 Paper and paperboard, cut to size or shape, and articles of paper or paperboard
651 Textile yarn 652 Cotton fabrics, woven (not including narrow or special fabrics) 653 Woven fabrics of manmade textile materials (not including narrow or special fabrics)
654 Woven fabrics of textile materials, other than cotton or manmade fibers and narrow or special fabrics
655 Knitted or crocheted fabrics (including tubular knit fabrics, n.e.s., pile fabrics and open-work fabrics), n.e.s.
656 Tulles, lace, embroidery, ribbons, trimmings and other small wares
657 Special yarns, special textile fabrics and related products 658 Made-up articles, wholly or chiefly of textile materials, n.e.s. 659 Floor coverings, etc. 661 Lime, cement, and fabricated construction materials, except glass and clay materials
662 Clay construction materials and refractory construction materials 663 Mineral manufactures, n.e.s. 664 Glass 665 Glassware 666 Pottery 667 Pearls, precious and semiprecious stones, unworked or worked 671 Pig iron and spiegeleisen, sponge iron, iron or steel granules and powders and ferroalloys
672 Iron or steel ingots and other primary forms, and semifinished products of iron or steel
70
673 Iron or nonalloy steel flat-rolled products, not clad, plated or coated
674 Iron and nonalloy steel flat-rolled products, clad, plated or coated 675 Alloy steel flat-rolled products 676 Iron and steel bars, rods, angles, shapes and sections, including sheet piling
677 Iron and steel rails and railway track construction material 678 Iron and steel wire 679 Iron and steel tubes, pipes and hollow profiles, fittings for tubes and pipes
681 Silver, platinum and other platinum group metals 682 Copper 683 Nickel 684 Aluminum 685 Lead 686 Zinc 687 Tin 689 Miscellaneous nonferrous base metals employed in metallurgy and cermets
691 Metal structures and parts, n.e.s., of iron, steel or aluminum 692 Metal containers for storage or transport 693 Wire products (excluding insulated electrical wiring) and fencing grills
694 Nails, screws, nuts, bolts, rivets and similar articles, of iron, steel, copper or aluminum
695 Tools for use in the hand or in machines 696 Cutlery 697 Household equipment of base metal, n.e.s. 699 Manufactures of base metal, n.e.s. 711 Steam or other vapor generating boilers, super-heated water boilers and auxiliary plant for use therewith; and parts thereof
712 Steam turbines and other vapor turbines, and parts thereof, n.e.s. 713 Internal combustion piston engines and parts thereof, n.e.s. 714 Engines and motors, nonelectric (other than steam turbines, internal combustion piston engines and power generating machinery); parts thereof, n.e.s.
716 Rotating electric plant and parts thereof, n.e.s. 718 Power generating machinery and parts thereof, n.e.s. 721 Agricultural machinery (excluding tractors) and parts thereof 722 Tractors (other than mechanical handling equipment) 723 Civil engineering and contractors' plant and equipment 724 Textile and leather machinery, and parts thereof, n.e.s. 725 Paper mill and pulp mill machinery, paper cutting machines and machinery for the manufacture of paper articles; parts thereof
726 Printing and bookbinding machinery, and parts thereof 727 Food-processing machines (excluding domestic)

71
728 Machinery and equipment specialized for particular industries, and parts thhereof, n.e.s.
731 Machine tools working by removing metal or other material 733 Machine tools for working metal, sintered metal carbides or cermets, without removing material
735 Parts and accessories suitable for use solely or principally with metal working machine tools, whether or not removing metal; hand held tool holders
737 Metalworking machinery (other than machine tools) and parts thereof, n.e.s.
741 Heating and cooling equipment and parts thereof, n.e.s. 742 Pumps for liquids, whether or not fitted with a measuring device; liquid elevators; parts for such pumps and liquid elevators
743 Pumps (not for liquids), air or gas compressors and fans; ventilating hoods incorporating a fan; centrifuges; filtering etc. apparatus; parts thereof
744 Mechanical handling equipment, and parts thereof, n.e.s. 745 Nonelectrical machinery, tools and mechanical apparatus, and parts thereof, n.e.s.
746 Ball or roller bearings 747 Taps, cocks, valves and similar appliances for pipes, boiler shells, tanks, etc. (including pressure and temperature controlled valves)
748 Transmission shafts and cranks; bearing housings and plain shaft bearings; gears and gearing; ball screws; gear boxes, clutches, etc.; parts thereof
749 Nonelectric parts and accessories of machinery, n.e.s. 751 Office machines 752 Automatic data processing machines and units thereof; magnetic or optical readers; machines transcribing coded media and processing such data, n.e.s.
759 Parts and accessories suitable for use solely or principally with office machines or automatic data processing machines
761 Tv receivers (including video monitors & projectors) wheth r nt incorp radiobroadcast receivers or sound or video recording or reproducing apparatus
762 Radio-broadcast receivers, whether or not incorporating sound recording or reproducing apparatus or a clock
763 Sound recorders or reproducers; television image and sound recorders or reproducers
764 Telecommunications equipment, n.e.s.; and parts, n.e.s., and accessories of apparatus falling within telecommunications, etc.
771 Electric power machinery (other than rotating electric plant of power generating machinery) and parts thereof
772 Electrical apparatus for switching or protecting electrical circuits or for making connections to or in electrical circuits (excluding telephone etc.)
773 Equipment for distributing electricity, n.e.s.
72
774 Electro-diagnostic apparatus for medical, surgical, dental or veterinary sciences and radiological apparatus
775 Household type electrical and nonelectrical equipment, n.e.s. 776 Thermionic, cold cathode or photocathode valves and tubes; diodes, transistors and similar semiconductor devices; integrated circuits, etc.; parts
778 Electrical machinery and apparatus, n.e.s. 781 Motor cars and other motor vehicles principally designed for the transport of persons (not public transport), including station wagons and racing cars
782 Motor vehicles for the transport of goods and special purpose motor vehicles
783 Road motor vehicles, n.e.s. 784 Parts and accessories for tractors, motor cars and other motor vehicles, trucks, public-transport vehicles and road motor vehicles n.e.s.
785 Motorcycles (including mopeds) and cycles, motorized and not motorized; invalid carriages
786 Trailers and semi-trailers; other vehicles, not mechanically propelled; specially designed and equipped transport containers
791 Railway vehicles (including hovertrains) and associated equipment
792 Aircraft and associated equipment; spacecraft (including satellites) and spacecraft launch vehicles; and parts thereof
793 Ships, boats (including hovercraft) and floating structures 811 Prefabricated buildings 812 Sanitary, plumbing and heating fixtures and fittings, n.e.s. 813 Lighting fixtures and fittings, n.e.s. 821 Furniture and parts thereof; bedding, mattresses, mattress supports, cushions and similar stuffed furnishings
831 Trunks, suitcases, vanity cases, binocular and camera cases, handbags, wallets, etc. of leather, etc.; travel sets for personal toilet, sewing, etc.
841 Men's or boys' coats, jackets, suits, trousers, shirts, underwear etc. of woven textile fabrics (except swimwear and coated or laminated apparel)
842 Women's or girls' coats, capes, jackets, suits, trousers, dresses, skirts, underwear, etc. of woven textiles (except swimwear and coated etc. apparel)
843 Men's or boys' coats, capes, jackets, suits, blazers, trousers, shirts, etc. (except swimwear or coated apparel), knitted or crocheted textile fabric
844 Women's or girls' coats, capes, jackets, suits, trousers, dresses, underwear, etc. (except swimwear and coated etc. apparel), knitted or crocheted
845 Articles of apparel, of textile fabrics, whether or not knitted or crocheted, n.e.s.
73
846 Clothing accessories, of textile fabrics, whether or not knitted or crocheted (other than those for babies)
848 Articles of apparel and clothing accessories of other than textile fabrics; headgear of all materials
851 Footwear 871 Optical instruments and apparatus, n.e.s. 872 Instruments and appliances, n.e.s., for medical, surgical, dental or veterinary purposes
873 Meters and counters, n.e.s. 874 Measuring, checking, analysing and controlling instruments and apparatus, n.e.s.
881 Photographic apparatus and equipment, n.e.s. 882 Photographic and cinematographic supplies 883 Cinematographic film, exposed and developed, whether or not incorporating sound track or consisting only of sound track
884 Optical goods, n.e.s. 885 Watches and clocks 891 Arms and ammunition 892 Printed matter 893 Articles, n.e.s. of plastics 894 Baby carriages, toys, games and sporting goods 895 Office and stationery supplies, n.e.s. 896 Works of art, collectors' pieces and antiques 897 Jewelry, goldsmiths' and silversmiths' wares, and other articles of precious or semiprecious materials, n.e.s.
898 Musical instruments, parts and accessories thereof; records, tapes and other sound or similar recordings (excluding photographic film, etc.)
899 Miscellaneous manufactured articles, n.e.s. 931 Special transactions and commodities not classified according to kind
950 Coin, including gold coin; proof and presentation sets and current coin
961 Coin (other than gold coin), not being legal tender 971 Gold, nonmonetary (excluding gold ores and concentrates) 984 Estimate of items valued under $251 and of other low valued items nonexempt from formal entry
992 Shipments valued not over $10,000, not identified by kind 994 Estimate of non-canadian low value shipments; compiled low value shipments to canada; and shipments to canada not identified by kind
998 Adjustment for undocumented exports
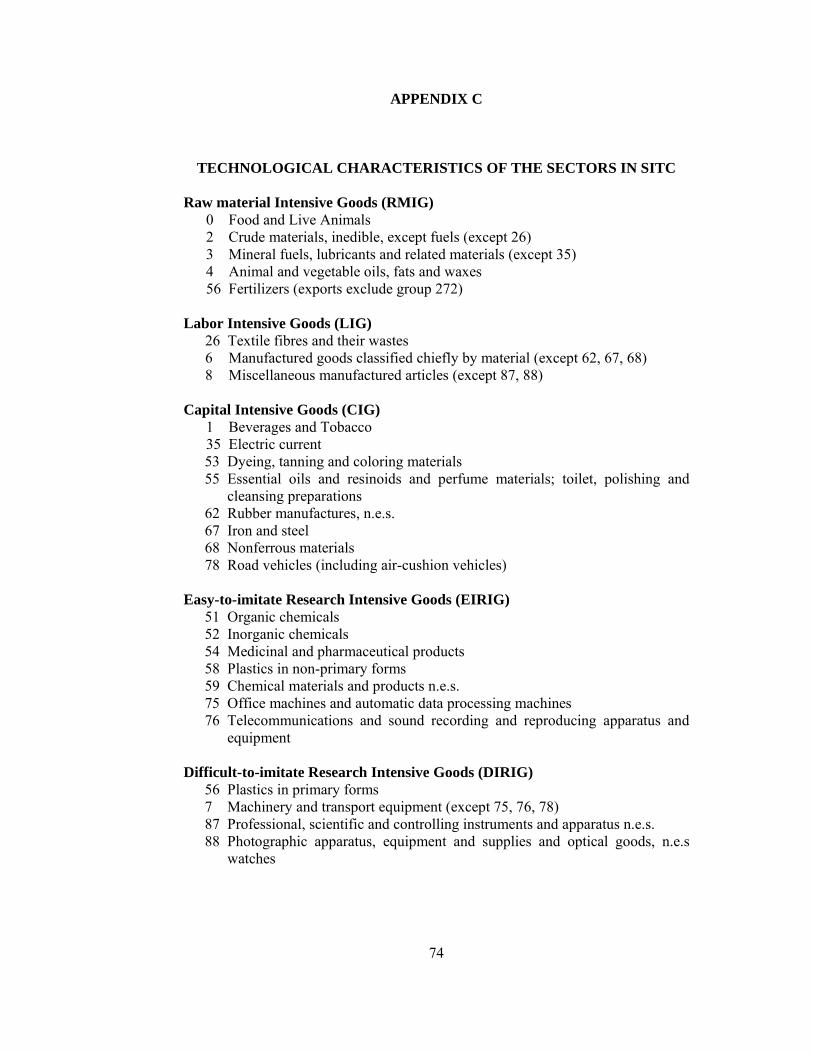
74
APPENDIX C
TECHNOLOGICAL CHARACTERISTICS OF THE SECTORS IN SITC
Raw material Intensive Goods (RMIG) 0 Food and Live Animals 2 Crude materials, inedible, except fuels (except 26) 3 Mineral fuels, lubricants and related materials (except 35) 4 Animal and vegetable oils, fats and waxes 56 Fertilizers (exports exclude group 272)
Labor Intensive Goods (LIG)
26 Textile fibres and their wastes 6 Manufactured goods classified chiefly by material (except 62, 67, 68) 8 Miscellaneous manufactured articles (except 87, 88)
Capital Intensive Goods (CIG)
1 Beverages and Tobacco 35 Electric current 53 Dyeing, tanning and coloring materials 55 Essential oils and resinoids and perfume materials; toilet, polishing and
cleansing preparations 62 Rubber manufactures, n.e.s. 67 Iron and steel 68 Nonferrous materials 78 Road vehicles (including air-cushion vehicles)
Easy-to-imitate Research Intensive Goods (EIRIG) 51 Organic chemicals 52 Inorganic chemicals 54 Medicinal and pharmaceutical products 58 Plastics in non-primary forms 59 Chemical materials and products n.e.s. 75 Office machines and automatic data processing machines 76 Telecommunications and sound recording and reproducing apparatus and
equipment Difficult-to-imitate Research Intensive Goods (DIRIG)
56 Plastics in primary forms 7 Machinery and transport equipment (except 75, 76, 78) 87 Professional, scientific and controlling instruments and apparatus n.e.s. 88 Photographic apparatus, equipment and supplies and optical goods, n.e.s
watches
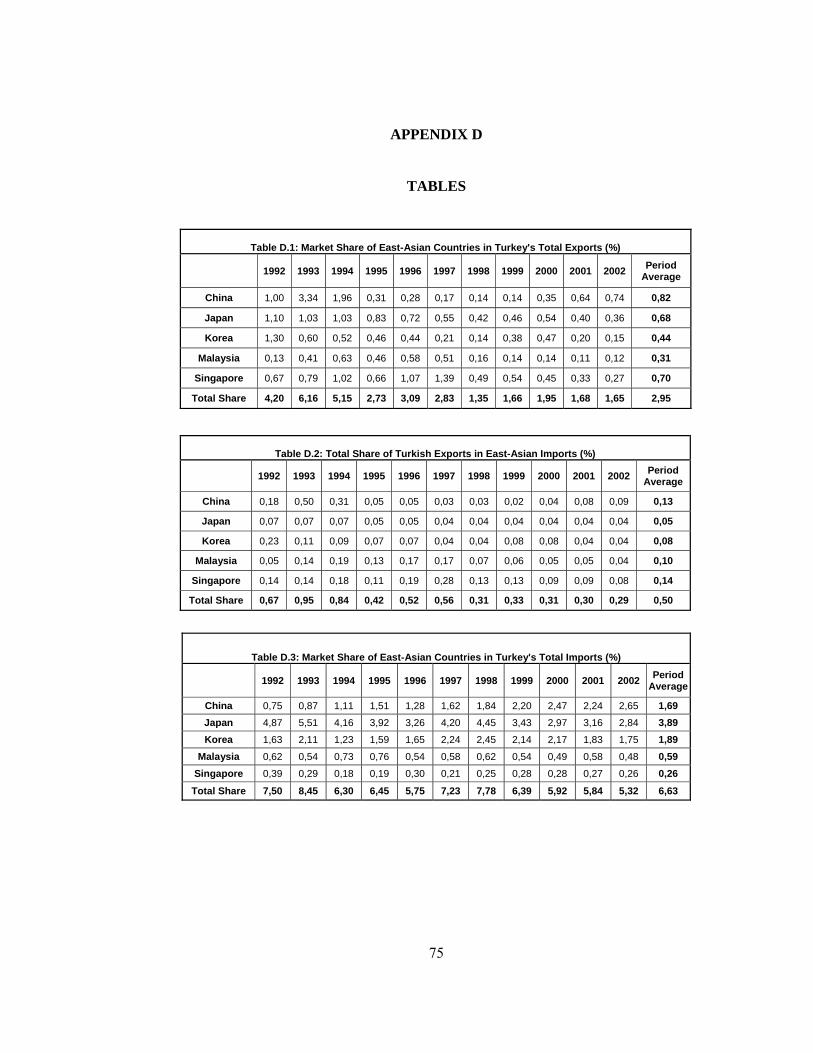
75
APPENDIX D
TABLES
Table D.1: Market Share of East-Asian Countries in Turkey's Total Exports (%)
1992 1993 1994 1995 1996 1997 1998 1999 2000 2001 2002 Period Average
China 1,00 3,34 1,96 0,31 0,28 0,17 0,14 0,14 0,35 0,64 0,74 0,82
Japan 1,10 1,03 1,03 0,83 0,72 0,55 0,42 0,46 0,54 0,40 0,36 0,68
Korea 1,30 0,60 0,52 0,46 0,44 0,21 0,14 0,38 0,47 0,20 0,15 0,44
Malaysia 0,13 0,41 0,63 0,46 0,58 0,51 0,16 0,14 0,14 0,11 0,12 0,31
Singapore 0,67 0,79 1,02 0,66 1,07 1,39 0,49 0,54 0,45 0,33 0,27 0,70
Total Share 4,20 6,16 5,15 2,73 3,09 2,83 1,35 1,66 1,95 1,68 1,65 2,95
Table D.2: Total Share of Turkish Exports in East-Asian Imports (%)
1992 1993 1994 1995 1996 1997 1998 1999 2000 2001 2002 Period Average
China 0,18 0,50 0,31 0,05 0,05 0,03 0,03 0,02 0,04 0,08 0,09 0,13
Japan 0,07 0,07 0,07 0,05 0,05 0,04 0,04 0,04 0,04 0,04 0,04 0,05
Korea 0,23 0,11 0,09 0,07 0,07 0,04 0,04 0,08 0,08 0,04 0,04 0,08
Malaysia 0,05 0,14 0,19 0,13 0,17 0,17 0,07 0,06 0,05 0,05 0,04 0,10
Singapore 0,14 0,14 0,18 0,11 0,19 0,28 0,13 0,13 0,09 0,09 0,08 0,14
Total Share 0,67 0,95 0,84 0,42 0,52 0,56 0,31 0,33 0,31 0,30 0,29 0,50
Table D.3: Market Share of East-Asian Countries in Turkey's Total Imports (%) 1992 1993 1994 1995 1996 1997 1998 1999 2000 2001 2002 Period
Average
China 0,75 0,87 1,11 1,51 1,28 1,62 1,84 2,20 2,47 2,24 2,65 1,69 Japan 4,87 5,51 4,16 3,92 3,26 4,20 4,45 3,43 2,97 3,16 2,84 3,89 Korea 1,63 2,11 1,23 1,59 1,65 2,24 2,45 2,14 2,17 1,83 1,75 1,89
Malaysia 0,62 0,54 0,73 0,76 0,54 0,58 0,62 0,54 0,49 0,58 0,48 0,59 Singapore 0,39 0,29 0,18 0,19 0,30 0,21 0,25 0,28 0,28 0,27 0,26 0,26
Total Share 7,50 8,45 6,30 6,45 5,75 7,23 7,78 6,39 5,92 5,84 5,32 6,63

76
Table D.4: Total Share of Turkish Imports In East Asian Countries' Total Exports (%)
1992 1993 1994 1995 1996 1997 1998 1999 2000 2001 2002 Per.
Av.
China 0,20 0,28 0,21 0,36 0,37 0,43 0,46 0,46 0,54 0,35 0,42 0,37
Japan 1,31 1,77 0,80 0,94 0,94 1,12 1,11 0,71 0,65 0,49 0,45 0,94
Korea 0,44 0,68 0,24 0,38 0,48 0,59 0,61 0,45 0,47 0,29 0,28 0,45
Malaysia 0,17 0,17 0,14 0,18 0,16 0,15 0,15 0,11 0,11 0,09 0,08 0,14
Singapore 0,10 0,09 0,03 0,04 0,09 0,06 0,06 0,06 0,06 0,04 0,04 0,06 Total Share 2,22 2,99 1,42 1,91 2,03 2,35 2,40 1,79 1,83 1,26 1,26 1,95
Table D.5: Technological Characteristics Of The Goods Which Are Exported To China (%) 1992 1993 1994 1995 1996 1997 1998 1999 2000 2001 2002 Period Av.
RMIG 2,35 0,51 3,09 39,58 29,01 49,28 15,27 41,53 20,90 19,55 25,31 22,40
LIG 1,58 0,29 4,87 34,54 27,21 26,19 37,05 21,65 15,32 12,27 11,62 17,51
CIG 90,79 98,74 89,44 22,22 34,91 9,62 6,50 12,80 48,11 56,84 49,98 47,27
EIRIG 0,53 0,17 0,53 0,90 1,39 6,74 32,00 15,16 7,48 5,48 4,78 6,83
DIRIG 4,75 0,28 2,07 2,76 7,48 8,17 9,18 8,86 8,19 5,85 8,31 5,99
Total 100 100 100 100 100 100 100 100 100 100 100 100
Table D.6: Technological Characteristics Of The Goods Which Are Imported From China (%) 1992 1993 1994 1995 1996 1997 1998 1999 2000 2001 2002 Period Av.
RMIG 32,24 12,95 12,93 9,12 5,35 10,65 7,83 4,81 4,86 6,58 7,45 10,43
LIG 37,55 54,36 57,48 61,14 45,45 40,18 43,81 41,94 36,78 40,57 36,15 45,04
CIG 5,71 5,66 5,60 3,75 4,41 4,37 6,67 7,19 8,29 6,07 6,26 5,82
EIRIG 9,07 14,35 13,91 15,18 24,04 24,02 20,15 22,85 23,39 18,47 24,41 19,08
DIRIG 15,42 12,68 10,09 10,81 20,76 20,78 21,55 23,20 26,68 28,32 25,73 19,64
Total 100 100 100 100 100 100 100 100 100 100 100 100
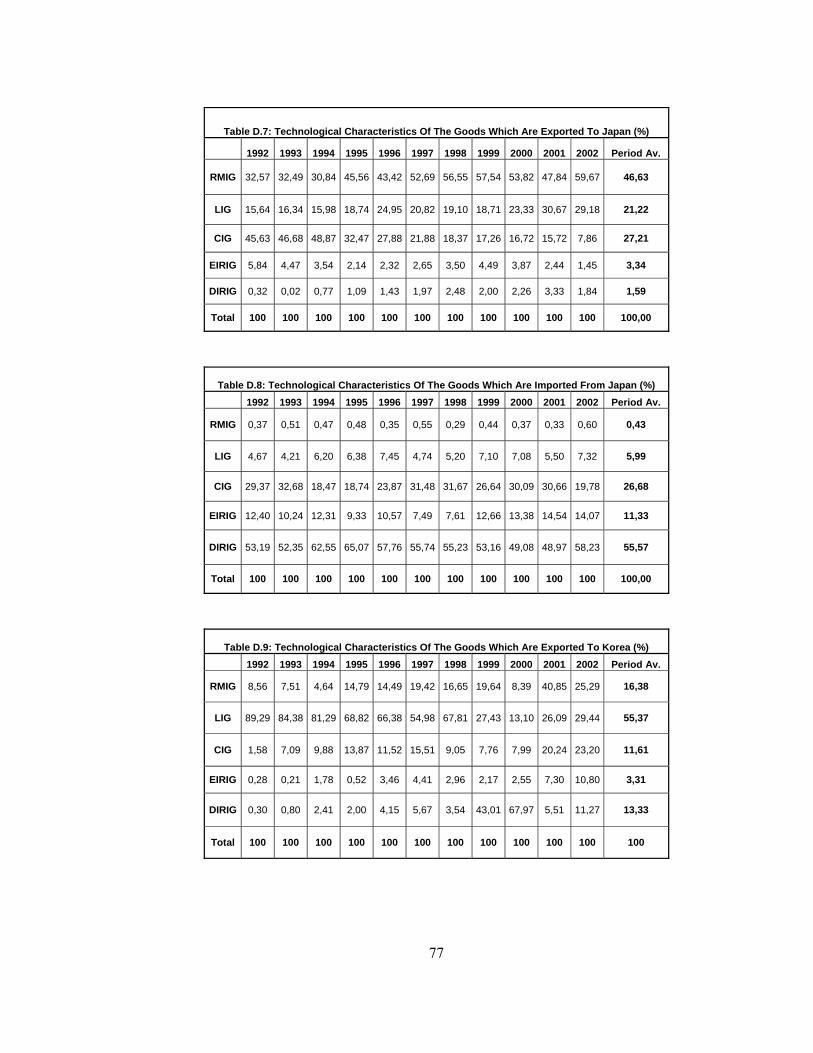
77
Table D.7: Technological Characteristics Of The Goods Which Are Exported To Japan (%)
1992 1993 1994 1995 1996 1997 1998 1999 2000 2001 2002 Period Av.
RMIG 32,57 32,49 30,84 45,56 43,42 52,69 56,55 57,54 53,82 47,84 59,67 46,63
LIG 15,64 16,34 15,98 18,74 24,95 20,82 19,10 18,71 23,33 30,67 29,18 21,22
CIG 45,63 46,68 48,87 32,47 27,88 21,88 18,37 17,26 16,72 15,72 7,86 27,21
EIRIG 5,84 4,47 3,54 2,14 2,32 2,65 3,50 4,49 3,87 2,44 1,45 3,34
DIRIG 0,32 0,02 0,77 1,09 1,43 1,97 2,48 2,00 2,26 3,33 1,84 1,59
Total 100 100 100 100 100 100 100 100 100 100 100 100,00
Table D.8: Technological Characteristics Of The Goods Which Are Imported From Japan (%) 1992 1993 1994 1995 1996 1997 1998 1999 2000 2001 2002 Period Av.
RMIG 0,37 0,51 0,47 0,48 0,35 0,55 0,29 0,44 0,37 0,33 0,60 0,43
LIG 4,67 4,21 6,20 6,38 7,45 4,74 5,20 7,10 7,08 5,50 7,32 5,99
CIG 29,37 32,68 18,47 18,74 23,87 31,48 31,67 26,64 30,09 30,66 19,78 26,68
EIRIG 12,40 10,24 12,31 9,33 10,57 7,49 7,61 12,66 13,38 14,54 14,07 11,33
DIRIG 53,19 52,35 62,55 65,07 57,76 55,74 55,23 53,16 49,08 48,97 58,23 55,57
Total 100 100 100 100 100 100 100 100 100 100 100 100,00
Table D.9: Technological Characteristics Of The Goods Which Are Exported To Korea (%) 1992 1993 1994 1995 1996 1997 1998 1999 2000 2001 2002 Period Av.
RMIG 8,56 7,51 4,64 14,79 14,49 19,42 16,65 19,64 8,39 40,85 25,29 16,38
LIG 89,29 84,38 81,29 68,82 66,38 54,98 67,81 27,43 13,10 26,09 29,44 55,37
CIG 1,58 7,09 9,88 13,87 11,52 15,51 9,05 7,76 7,99 20,24 23,20 11,61
EIRIG 0,28 0,21 1,78 0,52 3,46 4,41 2,96 2,17 2,55 7,30 10,80 3,31
DIRIG 0,30 0,80 2,41 2,00 4,15 5,67 3,54 43,01 67,97 5,51 11,27 13,33
Total 100 100 100 100 100 100 100 100 100 100 100 100

78
Table D.10 : Technological Characteristics Of The Goods Which Are Imported From Korea (%) 1992 1993 1994 1995 1996 1997 1998 1999 2000 2001 2002 Period Av.
RMIG 0,29 1,19 0,48 0,87 0,75 0,64 0,95 0,77 0,67 0,89 1,33 0,80
LIG 20,47 19,76 37,41 29,91 27,31 26,00 32,48 27,80 20,72 25,43 28,05 26,85
CIG 16,63 34,10 19,71 23,90 31,90 33,01 24,09 26,14 25,22 13,00 13,84 23,78
EIRIG 11,79 6,97 12,15 8,39 8,73 7,12 6,80 9,76 10,97 8,41 12,68 9,43
DIRIG 50,82 37,97 30,24 36,93 31,31 33,23 35,67 35,53 42,41 52,27 44,09 39,13
Total 100 100 100 100 100 100 100 100 100 100 100 100,00
Table D.11: Technological Characteristics Of The Goods Which Are Exported To Malaysia (%)
1992 1993 1994 1995 1996 1997 1998 1999 2000 2001 2002 Period Av.
RMIG 34,25 9,76 9,20 12,92 5,59 6,08 16,06 31,75 24,76 28,10 18,58 17,91
LIG 27,30 8,12 5,46 12,19 13,62 10,54 12,35 14,61 17,51 25,42 25,43 15,68
CIG 29,76 71,61 64,26 54,81 46,79 52,33 12,80 23,77 20,42 17,72 29,92 38,56
EIRIG 1,09 0,71 1,41 1,90 3,57 2,67 5,31 10,74 8,81 13,84 9,09 5,38
DIRIG 7,61 9,79 19,67 18,19 30,43 28,38 53,47 19,13 28,51 14,93 16,97 22,46
Total 100 100 100 100 100 100 100 100 100 100 100 100
Table D.12: Technological Characteristics Of The Goods Which Are Imported From Malaysia (%) 1992 1993 1994 1995 1996 1997 1998 1999 2000 2001 2002 Period Av.
RMIG 89,78 91,32 92,52 89,95 77,08 69,62 56,65 46,96 38,94 28,43 27,57 64,44
LIG 3,43 2,10 2,46 3,03 8,18 9,08 14,38 14,17 14,13 15,82 33,86 10,97
CIG 1,72 0,70 0,77 0,64 1,57 1,86 9,67 9,08 2,58 27,37 2,56 5,32
EIRIG 3,47 3,49 1,86 3,31 9,08 9,79 10,30 16,29 30,86 15,07 21,28 11,34
DIRIG 1,59 2,39 2,39 3,08 4,09 9,64 9,01 13,50 13,49 13,31 14,72 7,93
Total 100 100 100 100 100 100 100 100 100 100 100 100
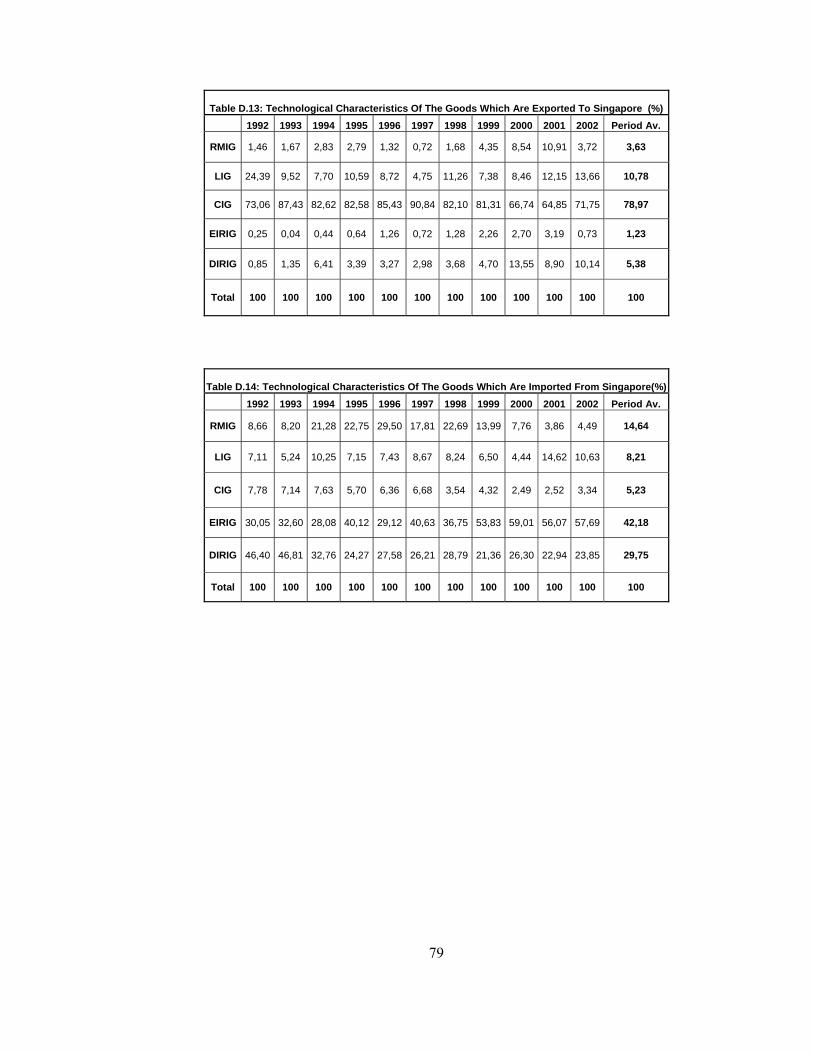
79
Table D.13: Technological Characteristics Of The Goods Which Are Exported To Singapore (%)
1992 1993 1994 1995 1996 1997 1998 1999 2000 2001 2002 Period Av.
RMIG 1,46 1,67 2,83 2,79 1,32 0,72 1,68 4,35 8,54 10,91 3,72 3,63
LIG 24,39 9,52 7,70 10,59 8,72 4,75 11,26 7,38 8,46 12,15 13,66 10,78
CIG 73,06 87,43 82,62 82,58 85,43 90,84 82,10 81,31 66,74 64,85 71,75 78,97
EIRIG 0,25 0,04 0,44 0,64 1,26 0,72 1,28 2,26 2,70 3,19 0,73 1,23
DIRIG 0,85 1,35 6,41 3,39 3,27 2,98 3,68 4,70 13,55 8,90 10,14 5,38
Total 100 100 100 100 100 100 100 100 100 100 100 100
Table D.14: Technological Characteristics Of The Goods Which Are Imported From Singapore(%) 1992 1993 1994 1995 1996 1997 1998 1999 2000 2001 2002 Period Av.
RMIG 8,66 8,20 21,28 22,75 29,50 17,81 22,69 13,99 7,76 3,86 4,49 14,64
LIG 7,11 5,24 10,25 7,15 7,43 8,67 8,24 6,50 4,44 14,62 10,63 8,21
CIG 7,78 7,14 7,63 5,70 6,36 6,68 3,54 4,32 2,49 2,52 3,34 5,23
EIRIG 30,05 32,60 28,08 40,12 29,12 40,63 36,75 53,83 59,01 56,07 57,69 42,18
DIRIG 46,40 46,81 32,76 24,27 27,58 26,21 28,79 21,36 26,30 22,94 23,85 29,75
Total 100 100 100 100 100 100 100 100 100 100 100 100
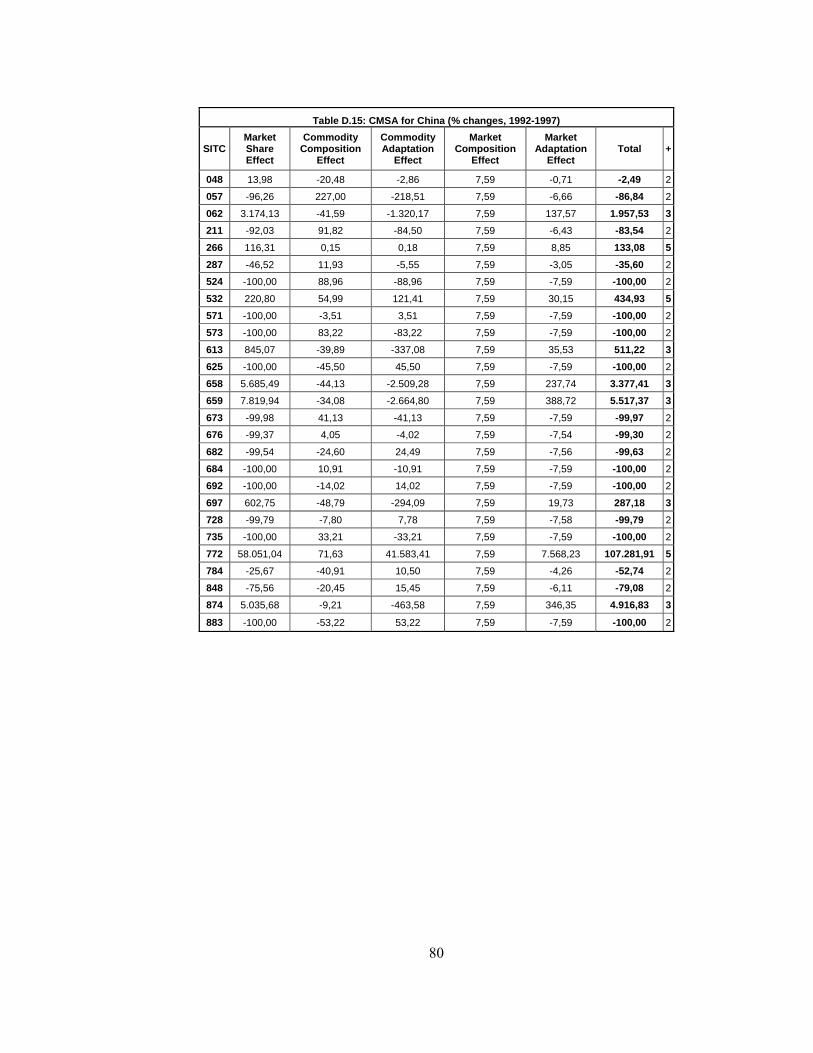
80
Table D.15: CMSA for China (% changes, 1992-1997)
SITC Market Share Effect
Commodity Composition
Effect
Commodity Adaptation
Effect
Market Composition
Effect
Market Adaptation
Effect Total +
048 13,98 -20,48 -2,86 7,59 -0,71 -2,49 2
057 -96,26 227,00 -218,51 7,59 -6,66 -86,84 2
062 3.174,13 -41,59 -1.320,17 7,59 137,57 1.957,53 3211 -92,03 91,82 -84,50 7,59 -6,43 -83,54 2
266 116,31 0,15 0,18 7,59 8,85 133,08 5287 -46,52 11,93 -5,55 7,59 -3,05 -35,60 2
524 -100,00 88,96 -88,96 7,59 -7,59 -100,00 2
532 220,80 54,99 121,41 7,59 30,15 434,93 5571 -100,00 -3,51 3,51 7,59 -7,59 -100,00 2
573 -100,00 83,22 -83,22 7,59 -7,59 -100,00 2
613 845,07 -39,89 -337,08 7,59 35,53 511,22 3625 -100,00 -45,50 45,50 7,59 -7,59 -100,00 2
658 5.685,49 -44,13 -2.509,28 7,59 237,74 3.377,41 3659 7.819,94 -34,08 -2.664,80 7,59 388,72 5.517,37 3673 -99,98 41,13 -41,13 7,59 -7,59 -99,97 2
676 -99,37 4,05 -4,02 7,59 -7,54 -99,30 2
682 -99,54 -24,60 24,49 7,59 -7,56 -99,63 2
684 -100,00 10,91 -10,91 7,59 -7,59 -100,00 2
692 -100,00 -14,02 14,02 7,59 -7,59 -100,00 2
697 602,75 -48,79 -294,09 7,59 19,73 287,18 3728 -99,79 -7,80 7,78 7,59 -7,58 -99,79 2
735 -100,00 33,21 -33,21 7,59 -7,59 -100,00 2
772 58.051,04 71,63 41.583,41 7,59 7.568,23 107.281,91 5784 -25,67 -40,91 10,50 7,59 -4,26 -52,74 2
848 -75,56 -20,45 15,45 7,59 -6,11 -79,08 2
874 5.035,68 -9,21 -463,58 7,59 346,35 4.916,83 3
883 -100,00 -53,22 53,22 7,59 -7,59 -100,00 2
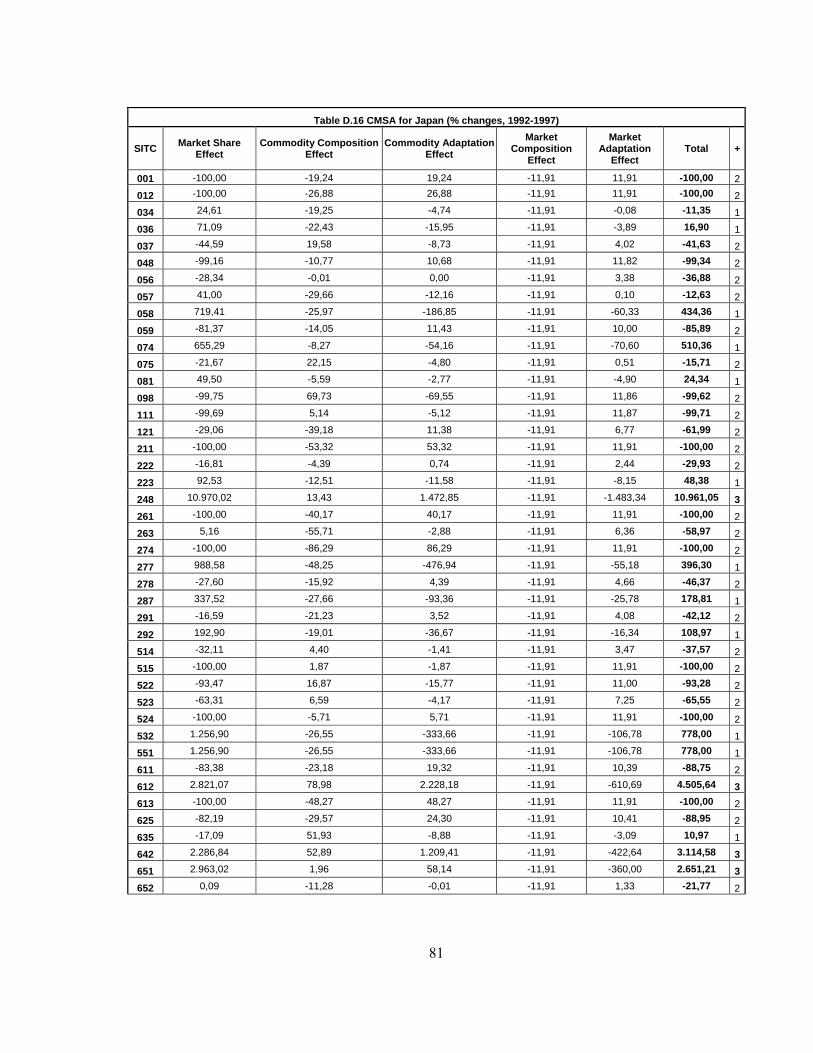
81
Table D.16 CMSA for Japan (% changes, 1992-1997)
SITC Market Share Effect
Commodity Composition Effect
Commodity Adaptation Effect
Market Composition
Effect
Market Adaptation
Effect Total +
001 -100,00 -19,24 19,24 -11,91 11,91 -100,00 2
012 -100,00 -26,88 26,88 -11,91 11,91 -100,00 2
034 24,61 -19,25 -4,74 -11,91 -0,08 -11,35 1
036 71,09 -22,43 -15,95 -11,91 -3,89 16,90 1
037 -44,59 19,58 -8,73 -11,91 4,02 -41,63 2
048 -99,16 -10,77 10,68 -11,91 11,82 -99,34 2
056 -28,34 -0,01 0,00 -11,91 3,38 -36,88 2
057 41,00 -29,66 -12,16 -11,91 0,10 -12,63 2
058 719,41 -25,97 -186,85 -11,91 -60,33 434,36 1
059 -81,37 -14,05 11,43 -11,91 10,00 -85,89 2
074 655,29 -8,27 -54,16 -11,91 -70,60 510,36 1
075 -21,67 22,15 -4,80 -11,91 0,51 -15,71 2
081 49,50 -5,59 -2,77 -11,91 -4,90 24,34 1
098 -99,75 69,73 -69,55 -11,91 11,86 -99,62 2
111 -99,69 5,14 -5,12 -11,91 11,87 -99,71 2
121 -29,06 -39,18 11,38 -11,91 6,77 -61,99 2
211 -100,00 -53,32 53,32 -11,91 11,91 -100,00 2
222 -16,81 -4,39 0,74 -11,91 2,44 -29,93 2
223 92,53 -12,51 -11,58 -11,91 -8,15 48,38 1
248 10.970,02 13,43 1.472,85 -11,91 -1.483,34 10.961,05 3261 -100,00 -40,17 40,17 -11,91 11,91 -100,00 2
263 5,16 -55,71 -2,88 -11,91 6,36 -58,97 2
274 -100,00 -86,29 86,29 -11,91 11,91 -100,00 2
277 988,58 -48,25 -476,94 -11,91 -55,18 396,30 1
278 -27,60 -15,92 4,39 -11,91 4,66 -46,37 2
287 337,52 -27,66 -93,36 -11,91 -25,78 178,81 1
291 -16,59 -21,23 3,52 -11,91 4,08 -42,12 2
292 192,90 -19,01 -36,67 -11,91 -16,34 108,97 1
514 -32,11 4,40 -1,41 -11,91 3,47 -37,57 2
515 -100,00 1,87 -1,87 -11,91 11,91 -100,00 2
522 -93,47 16,87 -15,77 -11,91 11,00 -93,28 2
523 -63,31 6,59 -4,17 -11,91 7,25 -65,55 2
524 -100,00 -5,71 5,71 -11,91 11,91 -100,00 2
532 1.256,90 -26,55 -333,66 -11,91 -106,78 778,00 1
551 1.256,90 -26,55 -333,66 -11,91 -106,78 778,00 1
611 -83,38 -23,18 19,32 -11,91 10,39 -88,75 2
612 2.821,07 78,98 2.228,18 -11,91 -610,69 4.505,64 3613 -100,00 -48,27 48,27 -11,91 11,91 -100,00 2
625 -82,19 -29,57 24,30 -11,91 10,41 -88,95 2
635 -17,09 51,93 -8,88 -11,91 -3,09 10,97 1
642 2.286,84 52,89 1.209,41 -11,91 -422,64 3.114,58 3651 2.963,02 1,96 58,14 -11,91 -360,00 2.651,21 3652 0,09 -11,28 -0,01 -11,91 1,33 -21,77 2

82
Table D.16 Continued
SITC Market Share Effect
Commodity Composition Effect
Commodity Adaptation Effect
Market Composition
Effect
Market Adaptation
Effect Total +
653 8.131,71 -32,32 -2.628,30 -11,91 -651,52 4.807,67 1
654 38.753,26 -45,69 -17.705,87 -11,91 -2.500,95 18.488,84 1
655 427,74 100,13 428,32 -11,91 -113,87 830,42 3656 1.648,47 -33,43 -551,08 -11,91 -126,70 925,35 1
658 -53,45 53,82 -28,77 -11,91 3,38 -36,93 2
659 36,11 -24,10 -8,70 -11,91 -0,39 -8,99 1
661 400,29 -17,73 -70,99 -11,91 -37,10 262,56 1
662 213,89 71,24 152,38 -11,91 -52,10 373,51 3
663 -88,76 17,19 -15,26 -11,91 10,34 -88,40 2
664 -73,95 44,19 -32,68 -11,91 7,44 -66,91 2
665 -77,62 11,65 -9,04 -11,91 8,93 -77,99 2
666 58,77 24,00 14,10 -11,91 -11,54 73,43 3671 -100,00 1,28 -1,28 -11,91 11,91 -100,00 2
672 -92,04 -66,29 61,01 -11,91 11,59 -97,64 2
673 -67,63 -26,57 17,97 -11,91 9,08 -79,07 2
676 -99,89 -64,54 64,47 -11,91 11,90 -99,97 2
679 -100,00 2,70 -2,70 -11,91 11,91 -100,00 2
684 477,29 0,98 4,68 -11,91 -57,51 413,53 3694 -98,59 33,73 -33,25 -11,91 11,68 -98,34 2
697 185,41 17,86 33,11 -11,91 -28,15 196,32 3699 7,22 21,00 1,52 -11,91 -3,54 14,29 3721 -100,00 -25,61 25,61 -11,91 11,91 -100,00 2
724 -77,32 -27,78 21,48 -11,91 9,96 -85,57 2
727 -100,00 -25,99 25,99 -11,91 11,91 -100,00 2
741 -73,24 -1,41 1,03 -11,91 8,77 -76,76 2
742 -100,00 25,32 -25,32 -11,91 11,91 -100,00 2
743 378,88 26,31 99,70 -11,91 -60,12 432,87 3745 -87,47 4,20 -3,68 -11,91 10,35 -88,50 2
747 -100,00 13,91 -13,91 -11,91 11,91 -100,00 2
751 -99,98 123,11 -123,08 -11,91 11,90 -99,96 2
752 164,23 155,57 255,49 -11,91 -68,51 494,87 3761 -99,99 128,23 -128,22 -11,91 11,90 -99,97 2
762 -4,33 31,34 -1,36 -11,91 -3,05 10,68 1
764 -27,93 98,89 -27,62 -11,91 -5,16 26,27 1
772 -30,88 48,61 -15,01 -11,91 -0,32 -9,51 1
775 20.378,88 61,14 12.460,45 -11,91 -3.917,90 28.970,67 3776 -51,12 121,96 -62,35 -11,91 -1,01 -4,43 1
778 488,97 61,93 302,81 -11,91 -101,66 740,14 3784 515,19 16,52 85,09 -11,91 -73,45 531,43 3786 -100,00 81,84 -81,84 -11,91 11,91 -100,00 2
812 -100,00 30,40 -30,40 -11,91 11,91 -100,00 2
813 -59,14 40,68 -24,06 -11,91 5,06 -49,37 2
821 6,35 32,77 2,08 -11,91 -4,91 24,39 3831 -66,98 12,96 -8,68 -11,91 7,47 -67,15 2
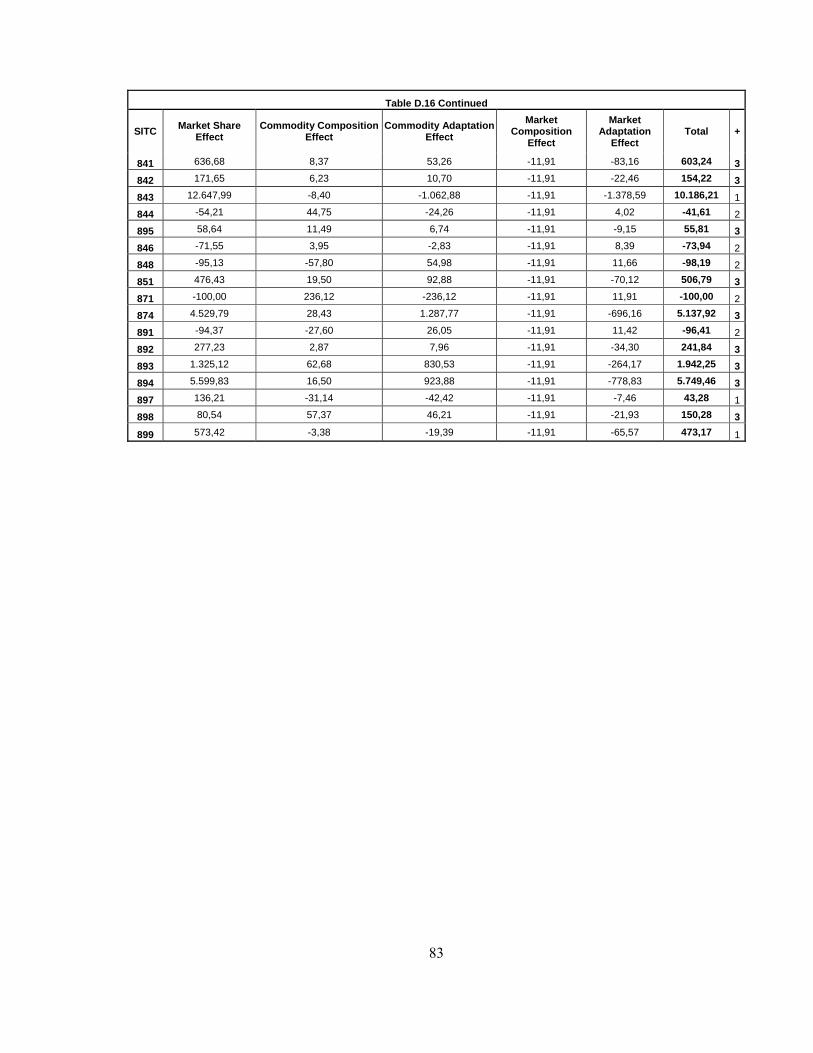
83
Table D.16 Continued
SITC Market Share Effect
Commodity Composition Effect
Commodity Adaptation Effect
Market Composition
Effect
Market Adaptation
Effect Total +
841 636,68 8,37 53,26 -11,91 -83,16 603,24 3842 171,65 6,23 10,70 -11,91 -22,46 154,22 3843 12.647,99 -8,40 -1.062,88 -11,91 -1.378,59 10.186,21 1
844 -54,21 44,75 -24,26 -11,91 4,02 -41,61 2
895 58,64 11,49 6,74 -11,91 -9,15 55,81 3846 -71,55 3,95 -2,83 -11,91 8,39 -73,94 2
848 -95,13 -57,80 54,98 -11,91 11,66 -98,19 2
851 476,43 19,50 92,88 -11,91 -70,12 506,79 3871 -100,00 236,12 -236,12 -11,91 11,91 -100,00 2
874 4.529,79 28,43 1.287,77 -11,91 -696,16 5.137,92 3891 -94,37 -27,60 26,05 -11,91 11,42 -96,41 2
892 277,23 2,87 7,96 -11,91 -34,30 241,84 3893 1.325,12 62,68 830,53 -11,91 -264,17 1.942,25 3894 5.599,83 16,50 923,88 -11,91 -778,83 5.749,46 3897 136,21 -31,14 -42,42 -11,91 -7,46 43,28 1
898 80,54 57,37 46,21 -11,91 -21,93 150,28 3
899 573,42 -3,38 -19,39 -11,91 -65,57 473,17 1
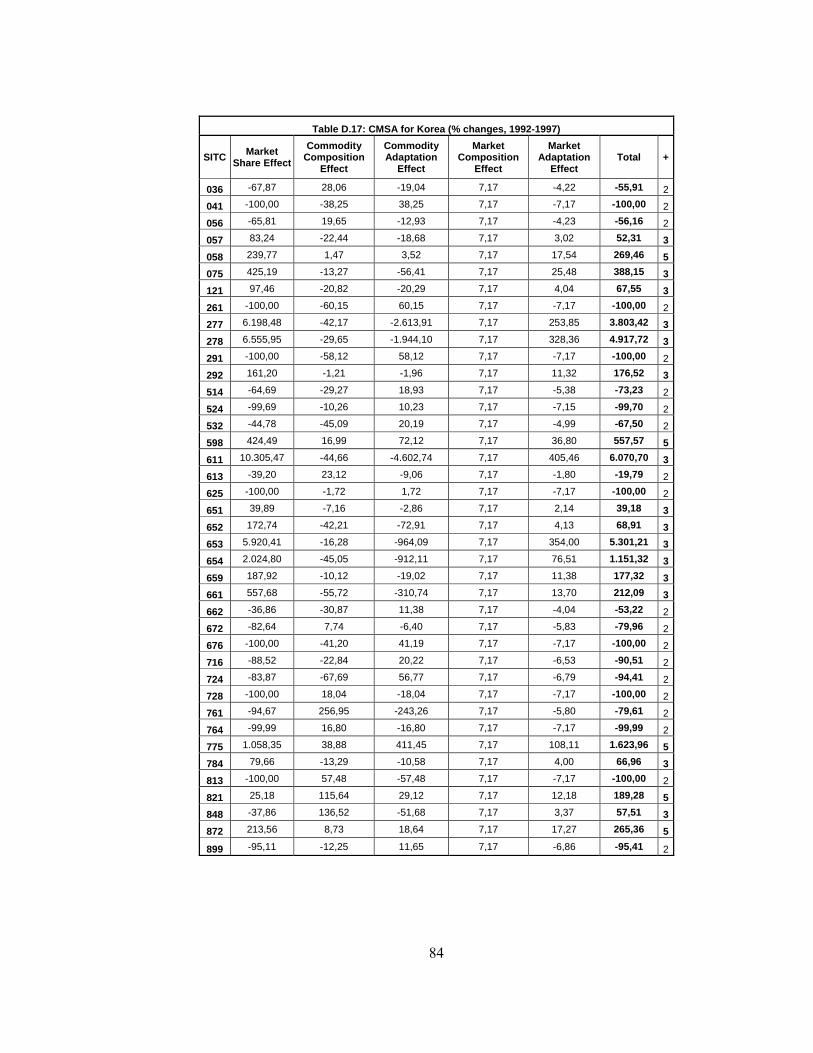
84
Table D.17: CMSA for Korea (% changes, 1992-1997)
SITC Market Share Effect
Commodity Composition
Effect
Commodity Adaptation
Effect
Market Composition
Effect
Market Adaptation
Effect Total +
036 -67,87 28,06 -19,04 7,17 -4,22 -55,91 2
041 -100,00 -38,25 38,25 7,17 -7,17 -100,00 2
056 -65,81 19,65 -12,93 7,17 -4,23 -56,16 2
057 83,24 -22,44 -18,68 7,17 3,02 52,31 3058 239,77 1,47 3,52 7,17 17,54 269,46 5075 425,19 -13,27 -56,41 7,17 25,48 388,15 3121 97,46 -20,82 -20,29 7,17 4,04 67,55 3261 -100,00 -60,15 60,15 7,17 -7,17 -100,00 2
277 6.198,48 -42,17 -2.613,91 7,17 253,85 3.803,42 3278 6.555,95 -29,65 -1.944,10 7,17 328,36 4.917,72 3291 -100,00 -58,12 58,12 7,17 -7,17 -100,00 2
292 161,20 -1,21 -1,96 7,17 11,32 176,52 3514 -64,69 -29,27 18,93 7,17 -5,38 -73,23 2
524 -99,69 -10,26 10,23 7,17 -7,15 -99,70 2
532 -44,78 -45,09 20,19 7,17 -4,99 -67,50 2
598 424,49 16,99 72,12 7,17 36,80 557,57 5611 10.305,47 -44,66 -4.602,74 7,17 405,46 6.070,70 3613 -39,20 23,12 -9,06 7,17 -1,80 -19,79 2
625 -100,00 -1,72 1,72 7,17 -7,17 -100,00 2
651 39,89 -7,16 -2,86 7,17 2,14 39,18 3652 172,74 -42,21 -72,91 7,17 4,13 68,91 3653 5.920,41 -16,28 -964,09 7,17 354,00 5.301,21 3654 2.024,80 -45,05 -912,11 7,17 76,51 1.151,32 3659 187,92 -10,12 -19,02 7,17 11,38 177,32 3661 557,68 -55,72 -310,74 7,17 13,70 212,09 3662 -36,86 -30,87 11,38 7,17 -4,04 -53,22 2
672 -82,64 7,74 -6,40 7,17 -5,83 -79,96 2
676 -100,00 -41,20 41,19 7,17 -7,17 -100,00 2
716 -88,52 -22,84 20,22 7,17 -6,53 -90,51 2
724 -83,87 -67,69 56,77 7,17 -6,79 -94,41 2
728 -100,00 18,04 -18,04 7,17 -7,17 -100,00 2
761 -94,67 256,95 -243,26 7,17 -5,80 -79,61 2
764 -99,99 16,80 -16,80 7,17 -7,17 -99,99 2
775 1.058,35 38,88 411,45 7,17 108,11 1.623,96 5784 79,66 -13,29 -10,58 7,17 4,00 66,96 3813 -100,00 57,48 -57,48 7,17 -7,17 -100,00 2
821 25,18 115,64 29,12 7,17 12,18 189,28 5848 -37,86 136,52 -51,68 7,17 3,37 57,51 3872 213,56 8,73 18,64 7,17 17,27 265,36 5
899 -95,11 -12,25 11,65 7,17 -6,86 -95,41 2
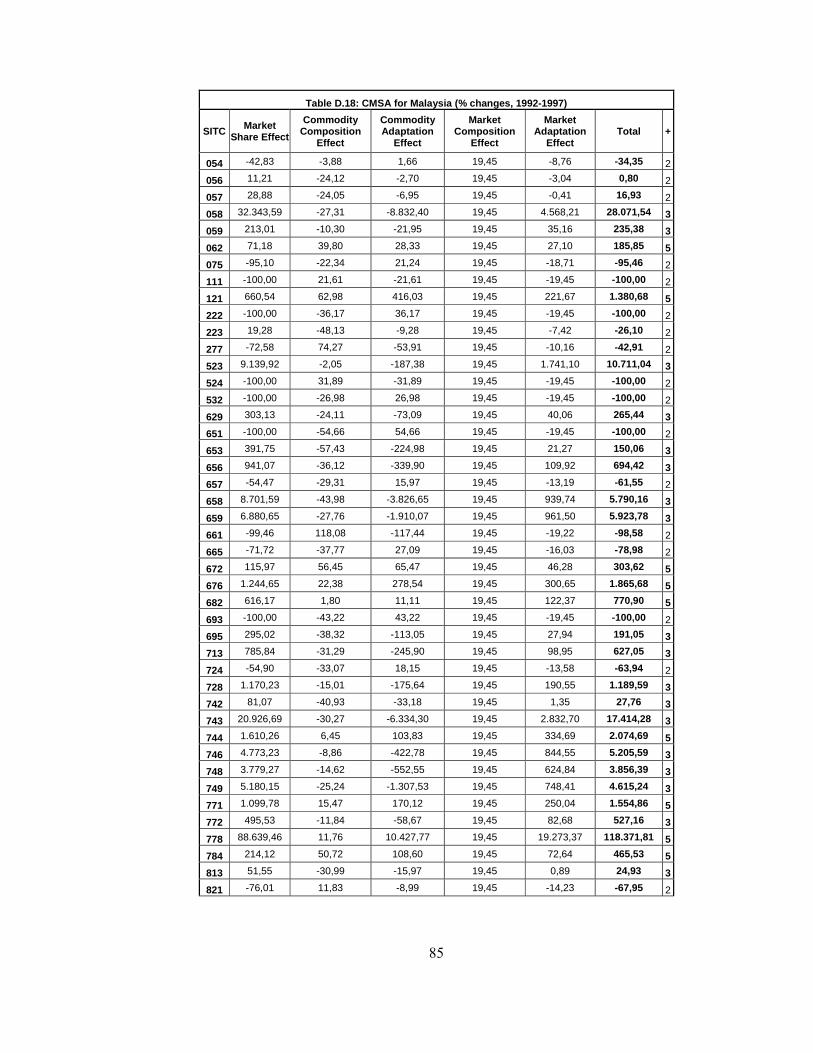
85
Table D.18: CMSA for Malaysia (% changes, 1992-1997)
SITC Market Share Effect
Commodity Composition
Effect
Commodity Adaptation
Effect
Market Composition
Effect
Market Adaptation
Effect Total +
054 -42,83 -3,88 1,66 19,45 -8,76 -34,35 2
056 11,21 -24,12 -2,70 19,45 -3,04 0,80 2
057 28,88 -24,05 -6,95 19,45 -0,41 16,93 2
058 32.343,59 -27,31 -8.832,40 19,45 4.568,21 28.071,54 3059 213,01 -10,30 -21,95 19,45 35,16 235,38 3062 71,18 39,80 28,33 19,45 27,10 185,85 5075 -95,10 -22,34 21,24 19,45 -18,71 -95,46 2
111 -100,00 21,61 -21,61 19,45 -19,45 -100,00 2
121 660,54 62,98 416,03 19,45 221,67 1.380,68 5222 -100,00 -36,17 36,17 19,45 -19,45 -100,00 2
223 19,28 -48,13 -9,28 19,45 -7,42 -26,10 2
277 -72,58 74,27 -53,91 19,45 -10,16 -42,91 2
523 9.139,92 -2,05 -187,38 19,45 1.741,10 10.711,04 3524 -100,00 31,89 -31,89 19,45 -19,45 -100,00 2
532 -100,00 -26,98 26,98 19,45 -19,45 -100,00 2
629 303,13 -24,11 -73,09 19,45 40,06 265,44 3651 -100,00 -54,66 54,66 19,45 -19,45 -100,00 2
653 391,75 -57,43 -224,98 19,45 21,27 150,06 3656 941,07 -36,12 -339,90 19,45 109,92 694,42 3657 -54,47 -29,31 15,97 19,45 -13,19 -61,55 2
658 8.701,59 -43,98 -3.826,65 19,45 939,74 5.790,16 3659 6.880,65 -27,76 -1.910,07 19,45 961,50 5.923,78 3661 -99,46 118,08 -117,44 19,45 -19,22 -98,58 2
665 -71,72 -37,77 27,09 19,45 -16,03 -78,98 2
672 115,97 56,45 65,47 19,45 46,28 303,62 5676 1.244,65 22,38 278,54 19,45 300,65 1.865,68 5682 616,17 1,80 11,11 19,45 122,37 770,90 5693 -100,00 -43,22 43,22 19,45 -19,45 -100,00 2
695 295,02 -38,32 -113,05 19,45 27,94 191,05 3713 785,84 -31,29 -245,90 19,45 98,95 627,05 3724 -54,90 -33,07 18,15 19,45 -13,58 -63,94 2
728 1.170,23 -15,01 -175,64 19,45 190,55 1.189,59 3742 81,07 -40,93 -33,18 19,45 1,35 27,76 3743 20.926,69 -30,27 -6.334,30 19,45 2.832,70 17.414,28 3744 1.610,26 6,45 103,83 19,45 334,69 2.074,69 5746 4.773,23 -8,86 -422,78 19,45 844,55 5.205,59 3748 3.779,27 -14,62 -552,55 19,45 624,84 3.856,39 3749 5.180,15 -25,24 -1.307,53 19,45 748,41 4.615,24 3771 1.099,78 15,47 170,12 19,45 250,04 1.554,86 5772 495,53 -11,84 -58,67 19,45 82,68 527,16 3778 88.639,46 11,76 10.427,77 19,45 19.273,37 118.371,81 5784 214,12 50,72 108,60 19,45 72,64 465,53 5813 51,55 -30,99 -15,97 19,45 0,89 24,93 3821 -76,01 11,83 -8,99 19,45 -14,23 -67,95 2

86
Table D.18 Continued
SITC Market Share Effect
Commodity Composition
Effect
Commodity Adaptation
Effect
Market Composition
Effect
Market Adaptation
Effect Total +
841 344,56 -22,19 -76,47 19,45 47,83 313,18 3844 -95,28 54,15 -51,60 19,45 -18,04 -91,31 2
845 -80,23 -51,75 41,52 19,45 -17,60 -88,60 2
873 1.672,74 -23,61 -395,00 19,45 243,96 1.517,54 3
Table D.19: CMSA for Singapore (% changes, 1992-1997)
SITC Market Share Effect
Commodity Composition Effect
Commodity Adaptation
Effect
Market Composition
Effect
Market Adaptation
Effect Total +
048 -67,31 -7,88 5,30 11,18 -7,81 -66,52 2
054 38,90 -36,57 -14,22 11,18 -1,33 -2,05 2
056 -54,53 -52,95 28,87 11,18 -8,79 -76,21 2
057 93,85 -43,82 -41,12 11,18 1,00 21,08 3058 8.912,76 -54,78 -4.882,56 11,18 444,37 4.430,97 3062 77,31 -14,25 -11,01 11,18 5,82 69,04 3073 99,89 -17,60 -17,58 11,18 7,23 83,13 3075 38,48 -5,38 -2,07 11,18 3,47 45,68 3081 -100,00 -75,85 75,85 11,18 -11,18 -100,00 2
111 51,85 -0,73 -0,38 11,18 5,67 67,59 3121 449,22 -23,02 -103,42 11,18 36,08 370,03 3273 -2,79 65,54 -1,83 11,18 6,81 78,91 3277 -100,00 -72,75 72,75 11,18 -11,18 -100,00 2
292 5.625,55 -36,90 -2.075,78 11,18 392,67 3.916,71 3334 -100,00 -12,95 12,95 11,18 -11,18 -100,00 2
523 43,63 -5,91 -2,58 11,18 3,93 50,25 3524 -100,00 40,46 -40,46 11,18 -11,18 -100,00 2
531 -100,00 -40,73 40,73 11,18 -11,18 -100,00 2
532 -100,00 -77,12 77,12 11,18 -11,18 -100,00 2
575 -71,47 -7,79 5,57 11,18 -8,24 -70,76 2
581 5.988,96 -8,71 -521,39 11,18 610,19 6.080,23 3598 -87,08 -62,35 54,30 11,18 -10,63 -94,59 2
625 249,64 -15,23 -38,02 11,18 21,95 229,52 3635 -7,81 25,89 -2,02 11,18 1,80 29,03 3651 -96,93 -40,54 39,29 11,18 -10,97 -97,97 2
652 102,00 -69,40 -70,79 11,18 -4,27 -31,28 2
653 138,08 -63,38 -87,52 11,18 -1,43 -3,07 2
656 529,72 -24,95 -132,15 11,18 41,65 425,45 3658 -36,60 -29,00 10,62 11,18 -6,15 -49,96 2
659 175,22 -47,91 -83,95 11,18 4,85 59,39 3661 -71,37 4,22 -3,01 11,18 -7,84 -66,83 2
662 18,82 -17,47 -3,29 11,18 -0,22 9,03 2
663 11.815,31 -21,41 -2.529,61 11,18 1.035,57 10.311,04 3

87
Table D.19 Continued
SITC Market Share Effect
Commodity Composition Effect
Commodity Adaptation
Effect
Market Composition
Effect
Market Adaptation
Effect Total +
665 96,24 -41,22 -39,67 11,18 1,72 28,24 3666 712,82 -43,81 -312,29 11,18 39,87 407,77 3672 34,07 82,13 27,98 11,18 16,12 171,47 5676 116,92 16,66 19,48 11,18 17,11 181,36 5679 -96,51 -27,03 26,09 11,18 -10,89 -97,17 2
682 221,65 -13,82 -30,64 11,18 19,81 208,18 3684 801,35 -9,63 -77,14 11,18 79,88 805,64 3694 14,22 -15,68 -2,23 11,18 -0,41 7,08 2
697 1.334,09 -3,49 -46,50 11,18 143,54 1.438,82 3699 916,10 -6,23 -57,03 11,18 95,33 959,35 3713 1.403,15 -33,82 -474,59 11,18 100,01 1.005,92 3723 662,70 55,58 368,32 11,18 121,46 1.219,24 5724 -95,74 -30,54 29,24 11,18 -10,85 -96,71 2
728 -88,74 41,80 -37,10 11,18 -9,39 -82,25 2
741 -60,48 -17,71 10,71 11,18 -7,54 -63,84 2
742 52,17 -10,90 -5,69 11,18 3,98 50,73 3743 2.417,30 -20,95 -506,51 11,18 211,25 2.112,26 3747 263,36 -36,03 -94,88 11,18 14,81 158,44 3
748 428,14 -30,26 -129,56 11,18 29,99 309,49 3749 28.621,37 -14,87 -4.255,35 11,18 2.721,98 27.084,31 3752 83,72 79,10 66,23 11,18 25,60 265,83 5759 323,63 54,43 176,16 11,18 61,95 627,35 5771 1.530,72 19,31 295,60 11,18 206,30 2.063,11 5772 21.829,96 8,17 1.783,02 11,18 2.640,38 26.272,70 5773 24.130,60 -24,69 -5.958,51 11,18 2.028,52 20.187,10 3776 2.387,75 83,29 1.988,86 11,18 498,53 4.969,60 5778 355,08 24,77 87,94 11,18 52,29 531,26 5784 170,37 -18,40 -31,34 11,18 13,48 145,30 3812 1.446,53 1,89 27,32 11,18 164,96 1.651,88 5813 -95,84 6,28 -6,02 11,18 -10,68 -95,08 2
821 -55,44 17,16 -9,51 11,18 -5,34 -41,96 2
843 4,62 27,55 1,27 11,18 3,74 48,36 5844 -99,25 -42,62 42,30 11,18 -11,13 -99,52 2
845 170,80 -4,93 -8,42 11,18 17,60 186,23 3846 2.256,72 -34,27 -773,35 11,18 161,98 1.622,26 3874 219,61 23,38 51,34 11,18 32,90 338,41 5885 3.951,62 -7,91 -312,72 11,18 405,87 4.048,04 3893 1.654,76 -8,99 -148,79 11,18 167,33 1.675,50 3896 186,61 36,77 68,61 11,18 32,64 335,80 5
897 -67,34 372,68 -250,98 11,18 6,08 71,61 3

88
Table D.20: CMSA for China (% changes, 1998-2002)
SITC Market Share Effect
Commodity Composition
Effect
Commodity Adaptation
Effect
Market Composition
Effect
Market Adaptation
Effect Total +
012 -58,54 111,92 -65,51 44,59 -5,41 27,05 2036 186,43 46,19 86,10 44,59 142,12 505,42 5054 268,48 27,26 73,20 44,59 164,51 578,04 5058 189,43 10,31 19,52 44,59 97,77 361,61 5073 81,65 39,24 32,04 44,59 68,19 265,72 5121 -67,22 191,78 -128,91 44,59 -1,94 38,30 2211 92,54 -3,48 -3,22 44,59 38,28 168,72 3247 -48,30 69,57 -33,61 44,59 -5,50 26,75 2248 5,92 53,77 3,18 44,59 28,04 135,50 5261 580,97 -71,78 -417,00 44,59 41,11 177,89 3263 1.005,32 -75,14 -755,43 44,59 77,92 297,25 3266 -47,80 -50,50 24,14 44,59 -33,07 -62,63 2268 461,42 -18,17 -83,86 44,59 160,25 564,23 3273 5.587,58 106,56 5.953,86 44,59 5.193,86 16.886,44 5277 2.744,40 -18,40 -504,85 44,59 990,41 3.256,15 3278 8.888,19 -7,11 -632,09 44,59 3.678,24 11.971,81 3283 709,06 -15,91 -112,82 44,59 258,77 883,69 3287 54,48 -3,82 -2,08 44,59 21,66 114,82 3288 2.858,97 41,15 1.176,54 44,59 1.817,79 5.939,03 5292 933,35 -31,66 -295,53 44,59 270,29 921,04 3334 653,11 -25,04 -163,55 44,59 207,13 716,24 3512 -49,78 68,76 -34,23 44,59 -6,80 22,54 2513 180,45 98,88 178,42 44,59 204,11 706,45 5523 20.947,63 -16,44 -3.444,44 44,59 7.797,36 25.328,70 3524 -100,00 -2,27 2,27 44,59 -44,59 -100,00 2531 -88,95 -19,67 17,49 44,59 -40,63 -87,17 2532 945,71 25,50 241,19 44,59 540,61 1.797,61 5533 -39,02 -8,23 3,21 44,59 -19,63 -19,08 2553 -89,84 -5,04 4,52 44,59 -40,29 -86,04 2554 -65,21 -20,06 13,08 44,59 -32,19 -59,78 2572 4.563,69 -33,74 -1.539,86 44,59 1.333,28 4.367,96 3581 550,52 12,81 70,52 44,59 282,63 961,07 5582 474,55 -31,74 -150,61 44,59 130,29 467,08 3583 -100,00 21,03 -21,03 44,59 -44,59 -100,00 2592 -97,07 -18,84 18,29 44,59 -43,53 -96,56 2597 2.217,32 30,04 666,16 44,59 1.299,14 4.257,26 5598 2.031,40 19,77 401,64 44,59 1.093,71 3.591,11 5611 49,22 -36,37 -17,90 44,59 -2,25 37,29 2613 33.881,69 -45,23 -15.325,84 44,59 8.253,91 26.809,12 3621 42.522,99 36,78 15.639,02 44,59 25.950,91 84.194,29 5625 2.908.680,63 -15,08 -438.604,95 44,59 1.101.403,26 3.571.508,46 3629 6.272,24 12,65 793,23 44,59 3.156,14 10.278,86 5
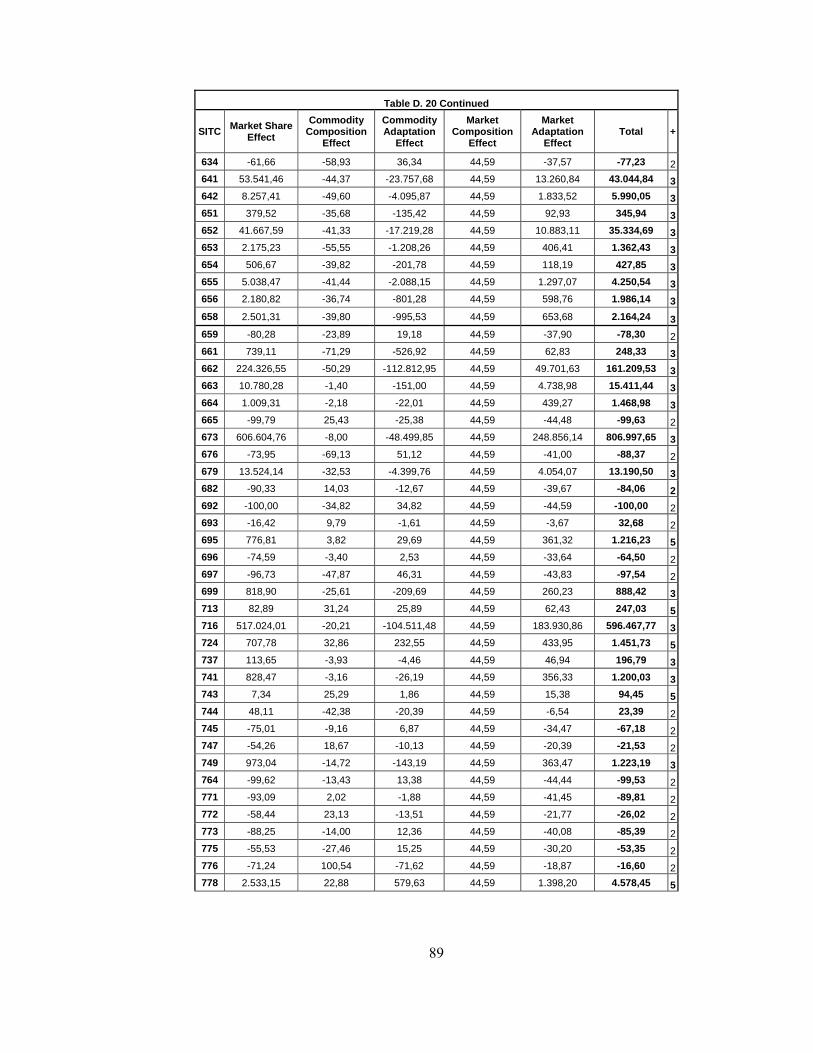
89
Table D. 20 Continued
SITC Market Share Effect
Commodity Composition
Effect
Commodity Adaptation
Effect
Market Composition
Effect
Market Adaptation
Effect Total +
634 -61,66 -58,93 36,34 44,59 -37,57 -77,23 2641 53.541,46 -44,37 -23.757,68 44,59 13.260,84 43.044,84 3642 8.257,41 -49,60 -4.095,87 44,59 1.833,52 5.990,05 3651 379,52 -35,68 -135,42 44,59 92,93 345,94 3652 41.667,59 -41,33 -17.219,28 44,59 10.883,11 35.334,69 3653 2.175,23 -55,55 -1.208,26 44,59 406,41 1.362,43 3654 506,67 -39,82 -201,78 44,59 118,19 427,85 3655 5.038,47 -41,44 -2.088,15 44,59 1.297,07 4.250,54 3656 2.180,82 -36,74 -801,28 44,59 598,76 1.986,14 3658 2.501,31 -39,80 -995,53 44,59 653,68 2.164,24 3659 -80,28 -23,89 19,18 44,59 -37,90 -78,30 2661 739,11 -71,29 -526,92 44,59 62,83 248,33 3662 224.326,55 -50,29 -112.812,95 44,59 49.701,63 161.209,53 3663 10.780,28 -1,40 -151,00 44,59 4.738,98 15.411,44 3664 1.009,31 -2,18 -22,01 44,59 439,27 1.468,98 3665 -99,79 25,43 -25,38 44,59 -44,48 -99,63 2673 606.604,76 -8,00 -48.499,85 44,59 248.856,14 806.997,65 3676 -73,95 -69,13 51,12 44,59 -41,00 -88,37 2679 13.524,14 -32,53 -4.399,76 44,59 4.054,07 13.190,50 3682 -90,33 14,03 -12,67 44,59 -39,67 -84,06 2692 -100,00 -34,82 34,82 44,59 -44,59 -100,00 2693 -16,42 9,79 -1,61 44,59 -3,67 32,68 2695 776,81 3,82 29,69 44,59 361,32 1.216,23 5696 -74,59 -3,40 2,53 44,59 -33,64 -64,50 2697 -96,73 -47,87 46,31 44,59 -43,83 -97,54 2699 818,90 -25,61 -209,69 44,59 260,23 888,42 3713 82,89 31,24 25,89 44,59 62,43 247,03 5716 517.024,01 -20,21 -104.511,48 44,59 183.930,86 596.467,77 3724 707,78 32,86 232,55 44,59 433,95 1.451,73 5737 113,65 -3,93 -4,46 44,59 46,94 196,79 3741 828,47 -3,16 -26,19 44,59 356,33 1.200,03 3743 7,34 25,29 1,86 44,59 15,38 94,45 5744 48,11 -42,38 -20,39 44,59 -6,54 23,39 2745 -75,01 -9,16 6,87 44,59 -34,47 -67,18 2747 -54,26 18,67 -10,13 44,59 -20,39 -21,53 2749 973,04 -14,72 -143,19 44,59 363,47 1.223,19 3764 -99,62 -13,43 13,38 44,59 -44,44 -99,53 2771 -93,09 2,02 -1,88 44,59 -41,45 -89,81 2772 -58,44 23,13 -13,51 44,59 -21,77 -26,02 2773 -88,25 -14,00 12,36 44,59 -40,08 -85,39 2775 -55,53 -27,46 15,25 44,59 -30,20 -53,35 2776 -71,24 100,54 -71,62 44,59 -18,87 -16,60 2778 2.533,15 22,88 579,63 44,59 1.398,20 4.578,45 5

90
Table D.20 Continued
SITC Market Share Effect
Commodity Composition
Effect
Commodity Adaptation
Effect
Market Composition
Effect
Market Adaptation
Effect Total +
784 27.511,96 50,72 13.953,72 44,59 18.512,22 60.073,22 5791 -100,00 -17,09 17,09 44,59 -44,59 -100,00 2793 425,74 53,18 226,42 44,59 314,51 1.064,44 5812 2.915,94 -14,64 -426,97 44,59 1.103,31 3.622,22 3841 3.192,38 -35,64 -1.137,71 44,59 900,29 2.963,90 3842 542,09 -9,61 -52,10 44,59 214,20 739,17 3845 123,05 26,93 33,14 44,59 81,65 309,36 5846 42,58 -70,63 -30,08 44,59 -25,92 -39,46 2848 -53,61 -22,45 12,04 44,59 -28,55 -47,99 2851 122,44 -50,26 -61,54 44,59 4,75 59,99 3872 -82,40 49,84 -41,07 44,59 -32,83 -61,86 2873 -99,54 6,54 -6,51 44,59 -44,37 -99,29 2874 731,07 16,10 117,70 44,59 385,64 1.295,10 5892 71,53 -50,80 -36,34 44,59 -6,96 22,02 2893 100,65 -20,96 -21,09 44,59 26,13 129,32 3894 -97,32 -38,58 37,55 44,59 -43,86 -97,62 2

91
Table D.21: CMSA for Japan (% changes, 1998-2002)
SITC Market Share Effect
Commodity Composition
Effect
Commodity Adaptation
Effect
Market Composition
Effect
Market Adaptation
Effect Total +
034 567,29 -5,24 -29,70 -17,36 -92,40 422,59 1036 -54,33 -25,05 13,61 -17,36 11,42 -71,71 2037 -88,90 -0,30 0,27 -17,36 15,44 -90,85 2041 -100,00 -14,73 14,73 -17,36 17,36 -100,00 2046 -100,00 -43,06 43,06 -17,36 17,36 -100,00 2048 219.882,24 -11,88 -26.117,14 -17,36 -33.631,22 160.104,65 1054 6,21 -29,59 -1,84 -17,36 4,38 -38,20 2056 -9,56 -13,39 1,28 -17,36 3,76 -35,27 2057 -7,67 -8,95 0,69 -17,36 2,77 -30,53 2058 20,18 -9,73 -1,96 -17,36 -1,47 -10,34 1059 -48,09 -8,93 4,29 -17,36 9,15 -60,93 2062 2,81 29,62 0,83 -17,36 -5,77 10,13 3071 -42,32 -52,79 22,34 -17,36 12,63 -77,50 2073 -65,63 -13,35 8,76 -17,36 12,19 -75,39 2074 -33,15 -17,13 5,68 -17,36 7,74 -54,22 2075 0,87 -26,68 -0,23 -17,36 4,52 -38,88 2098 1.794,07 1,21 21,68 -17,36 -315,38 1.484,21 3111 -77,91 38,78 -30,21 -17,36 12,04 -74,67 2112 11,40 -39,98 -4,56 -17,36 5,75 -44,74 2121 -32,21 -23,95 7,72 -17,36 8,41 -57,40 2122 -87,20 -9,09 7,92 -17,36 15,34 -90,38 2222 67,36 -30,05 -20,24 -17,36 -2,96 -3,24 1223 40,83 -67,66 -27,63 -17,36 9,45 -62,36 2248 72,17 -13,26 -9,57 -17,36 -8,57 23,42 1263 -94,15 -60,05 56,54 -17,36 16,95 -98,07 2273 1.950,13 -39,54 -771,12 -17,36 -197,79 924,33 1277 701,48 -23,48 -164,68 -17,36 -89,10 406,86 1278 -52,65 -27,79 14,63 -17,36 11,42 -71,74 2283 80,28 -8,58 -6,89 -17,36 -11,25 36,21 1287 -34,04 -27,97 9,52 -17,36 9,11 -60,74 2288 1.465,91 7,01 102,69 -17,36 -273,49 1.284,76 3291 44,87 -38,31 -17,19 -17,36 1,84 -26,14 2292 -0,67 -15,46 0,10 -17,36 2,78 -30,60 2421 1.515,79 -33,20 -503,29 -17,36 -169,98 791,96 1514 -100,00 -11,90 11,90 -17,36 17,36 -100,00 2522 -89,60 -23,56 21,11 -17,36 15,98 -93,43 2523 -70,08 3,77 -2,64 -17,36 11,97 -74,34 2531 -100,00 -26,94 26,94 -17,36 17,36 -100,00 2532 -80,29 -6,32 5,07 -17,36 14,15 -84,74 2533 -100,00 -12,63 12,63 -17,36 17,36 -100,00 2551 -46,28 2,42 -1,12 -17,36 7,81 -54,53 2553 175,68 12,94 22,73 -17,36 -36,68 157,30 3

92
Table D.21 Continued
SITC Market Share Effect
Commodity Composition
Effect
Commodity Adaptation
Effect
Market Composition
Effect
Market Adaptation
Effect Total +
554 -65,72 -2,55 1,67 -17,36 11,56 -72,39 2581 25,16 0,87 0,22 -17,36 -4,56 4,34 3591 -100,00 -18,65 18,65 -17,36 17,36 -100,00 2598 4.992,16 10,31 514,53 -17,36 -957,63 4.542,01 3611 5.323,30 -22,89 -1.218,58 -17,36 -708,51 3.355,96 1612 -100,00 12,30 -12,30 -17,36 17,36 -100,00 2621 29.004,80 1,64 475,04 -17,36 -5.117,32 24.346,79 3625 -21,91 -27,18 5,96 -17,36 7,49 -53,01 2629 2.192.587,30 4,33 94.996,10 -17,36 -397.073,99 1.890.496,39 3634 26,88 9,37 2,52 -17,36 -6,73 14,68 3635 -59,10 11,33 -6,69 -17,36 9,45 -62,37 2642 344,49 10,76 37,06 -17,36 -68,10 306,85 3651 202,45 -23,77 -48,12 -17,36 -22,66 90,54 1652 922,46 -35,25 -325,20 -17,36 -97,55 447,09 1653 597,02 -38,73 -231,24 -17,36 -56,77 252,92 1654 405,61 -28,03 -113,71 -17,36 -45,80 200,71 1655 -52,93 -64,91 34,36 -17,36 14,49 -86,35 2656 44,24 -2,97 -1,31 -17,36 -6,93 15,66 1657 214,88 -1,59 -3,41 -17,36 -36,43 156,09 1658 280,48 16,19 45,41 -17,36 -59,38 265,35 3659 -24,47 -8,61 2,11 -17,36 5,38 -42,96 2661 129,88 -0,13 -0,16 -17,36 -22,49 89,74 1662 -15,56 20,76 -3,23 -17,36 -0,34 -15,74 1663 204,35 4,32 8,83 -17,36 -37,75 162,39 3664 -99,26 -7,66 7,61 -17,36 17,24 -99,43 2665 77,97 9,87 7,70 -17,36 -16,58 61,60 3666 -22,62 -10,39 2,35 -17,36 5,32 -42,69 2667 -100,00 -22,47 22,47 -17,36 17,36 -100,00 2671 -96,05 -24,26 23,31 -17,36 16,84 -97,52 2672 -100,00 -46,99 46,99 -17,36 17,36 -100,00 2676 -100,00 -39,98 39,98 -17,36 17,36 -100,00 2678 11.011,51 -13,45 -1.480,62 -17,36 -1.652,01 7.848,07 1679 -67,91 -12,95 8,80 -17,36 12,51 -76,92 2682 -94,03 -48,29 45,41 -17,36 16,82 -97,45 2684 -74,76 -22,49 16,82 -17,36 13,96 -83,83 2691 138,31 32,17 44,49 -17,36 -37,31 160,30 3692 -100,00 6,01 -6,01 -17,36 17,36 -100,00 2693 -100,00 5,41 -5,41 -17,36 17,36 -100,00 2694 223,15 4,89 10,92 -17,36 -41,48 180,13 3695 1.068,59 -7,00 -74,79 -17,36 -171,29 798,16 1696 -40,34 17,70 -7,14 -17,36 5,17 -41,97 2697 -68,08 6,39 -4,35 -17,36 11,46 -71,94 2699 -95,26 5,00 -4,76 -17,36 16,49 -95,88 2
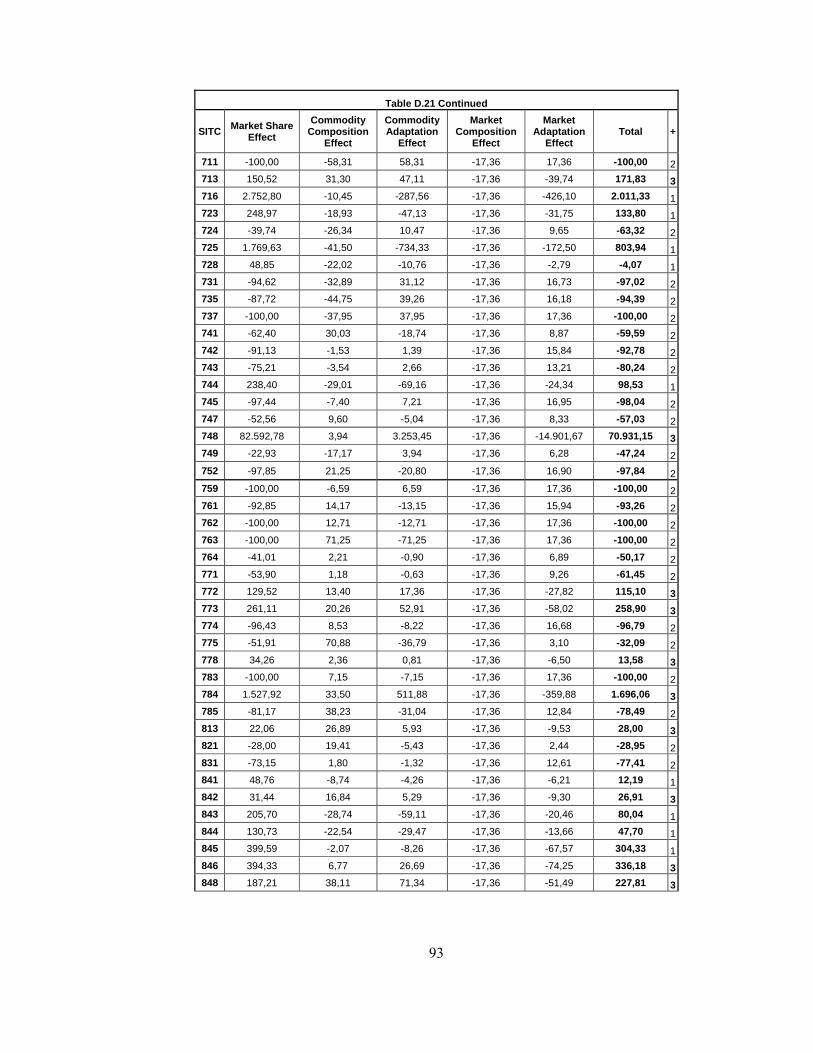
93
Table D.21 Continued
SITC Market Share Effect
Commodity Composition
Effect
Commodity Adaptation
Effect
Market Composition
Effect
Market Adaptation
Effect Total +
711 -100,00 -58,31 58,31 -17,36 17,36 -100,00 2713 150,52 31,30 47,11 -17,36 -39,74 171,83 3716 2.752,80 -10,45 -287,56 -17,36 -426,10 2.011,33 1723 248,97 -18,93 -47,13 -17,36 -31,75 133,80 1724 -39,74 -26,34 10,47 -17,36 9,65 -63,32 2725 1.769,63 -41,50 -734,33 -17,36 -172,50 803,94 1728 48,85 -22,02 -10,76 -17,36 -2,79 -4,07 1731 -94,62 -32,89 31,12 -17,36 16,73 -97,02 2735 -87,72 -44,75 39,26 -17,36 16,18 -94,39 2737 -100,00 -37,95 37,95 -17,36 17,36 -100,00 2741 -62,40 30,03 -18,74 -17,36 8,87 -59,59 2742 -91,13 -1,53 1,39 -17,36 15,84 -92,78 2743 -75,21 -3,54 2,66 -17,36 13,21 -80,24 2744 238,40 -29,01 -69,16 -17,36 -24,34 98,53 1745 -97,44 -7,40 7,21 -17,36 16,95 -98,04 2747 -52,56 9,60 -5,04 -17,36 8,33 -57,03 2748 82.592,78 3,94 3.253,45 -17,36 -14.901,67 70.931,15 3749 -22,93 -17,17 3,94 -17,36 6,28 -47,24 2752 -97,85 21,25 -20,80 -17,36 16,90 -97,84 2759 -100,00 -6,59 6,59 -17,36 17,36 -100,00 2761 -92,85 14,17 -13,15 -17,36 15,94 -93,26 2762 -100,00 12,71 -12,71 -17,36 17,36 -100,00 2763 -100,00 71,25 -71,25 -17,36 17,36 -100,00 2764 -41,01 2,21 -0,90 -17,36 6,89 -50,17 2771 -53,90 1,18 -0,63 -17,36 9,26 -61,45 2772 129,52 13,40 17,36 -17,36 -27,82 115,10 3773 261,11 20,26 52,91 -17,36 -58,02 258,90 3774 -96,43 8,53 -8,22 -17,36 16,68 -96,79 2775 -51,91 70,88 -36,79 -17,36 3,10 -32,09 2778 34,26 2,36 0,81 -17,36 -6,50 13,58 3783 -100,00 7,15 -7,15 -17,36 17,36 -100,00 2784 1.527,92 33,50 511,88 -17,36 -359,88 1.696,06 3785 -81,17 38,23 -31,04 -17,36 12,84 -78,49 2813 22,06 26,89 5,93 -17,36 -9,53 28,00 3821 -28,00 19,41 -5,43 -17,36 2,44 -28,95 2831 -73,15 1,80 -1,32 -17,36 12,61 -77,41 2841 48,76 -8,74 -4,26 -17,36 -6,21 12,19 1842 31,44 16,84 5,29 -17,36 -9,30 26,91 3843 205,70 -28,74 -59,11 -17,36 -20,46 80,04 1844 130,73 -22,54 -29,47 -17,36 -13,66 47,70 1845 399,59 -2,07 -8,26 -17,36 -67,57 304,33 1846 394,33 6,77 26,69 -17,36 -74,25 336,18 3848 187,21 38,11 71,34 -17,36 -51,49 227,81 3
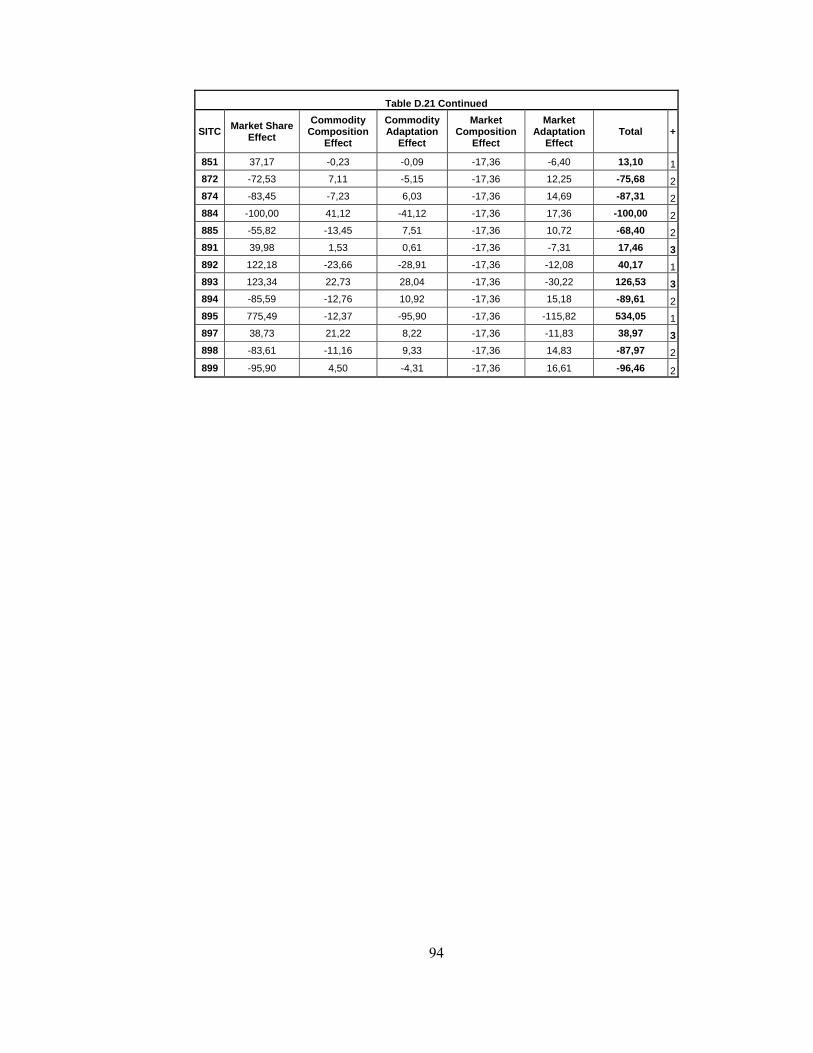
94
Table D.21 Continued
SITC Market Share Effect
Commodity Composition
Effect
Commodity Adaptation
Effect
Market Composition
Effect
Market Adaptation
Effect Total +
851 37,17 -0,23 -0,09 -17,36 -6,40 13,10 1872 -72,53 7,11 -5,15 -17,36 12,25 -75,68 2874 -83,45 -7,23 6,03 -17,36 14,69 -87,31 2884 -100,00 41,12 -41,12 -17,36 17,36 -100,00 2885 -55,82 -13,45 7,51 -17,36 10,72 -68,40 2891 39,98 1,53 0,61 -17,36 -7,31 17,46 3892 122,18 -23,66 -28,91 -17,36 -12,08 40,17 1893 123,34 22,73 28,04 -17,36 -30,22 126,53 3894 -85,59 -12,76 10,92 -17,36 15,18 -89,61 2895 775,49 -12,37 -95,90 -17,36 -115,82 534,05 1897 38,73 21,22 8,22 -17,36 -11,83 38,97 3898 -83,61 -11,16 9,33 -17,36 14,83 -87,97 2899 -95,90 4,50 -4,31 -17,36 16,61 -96,46 2
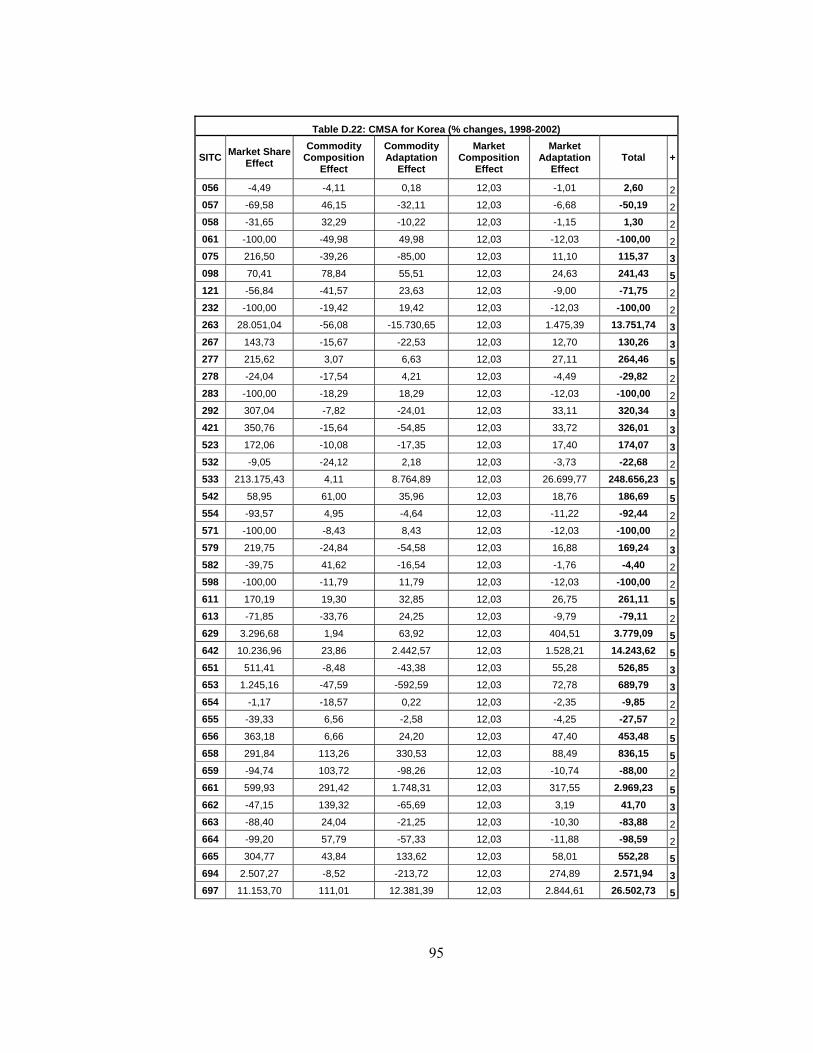
95
Table D.22: CMSA for Korea (% changes, 1998-2002)
SITC Market Share Effect
Commodity Composition
Effect
Commodity Adaptation
Effect
Market Composition
Effect
Market Adaptation
Effect Total +
056 -4,49 -4,11 0,18 12,03 -1,01 2,60 2057 -69,58 46,15 -32,11 12,03 -6,68 -50,19 2058 -31,65 32,29 -10,22 12,03 -1,15 1,30 2061 -100,00 -49,98 49,98 12,03 -12,03 -100,00 2075 216,50 -39,26 -85,00 12,03 11,10 115,37 3098 70,41 78,84 55,51 12,03 24,63 241,43 5121 -56,84 -41,57 23,63 12,03 -9,00 -71,75 2232 -100,00 -19,42 19,42 12,03 -12,03 -100,00 2263 28.051,04 -56,08 -15.730,65 12,03 1.475,39 13.751,74 3267 143,73 -15,67 -22,53 12,03 12,70 130,26 3277 215,62 3,07 6,63 12,03 27,11 264,46 5278 -24,04 -17,54 4,21 12,03 -4,49 -29,82 2283 -100,00 -18,29 18,29 12,03 -12,03 -100,00 2292 307,04 -7,82 -24,01 12,03 33,11 320,34 3421 350,76 -15,64 -54,85 12,03 33,72 326,01 3523 172,06 -10,08 -17,35 12,03 17,40 174,07 3532 -9,05 -24,12 2,18 12,03 -3,73 -22,68 2533 213.175,43 4,11 8.764,89 12,03 26.699,77 248.656,23 5542 58,95 61,00 35,96 12,03 18,76 186,69 5554 -93,57 4,95 -4,64 12,03 -11,22 -92,44 2571 -100,00 -8,43 8,43 12,03 -12,03 -100,00 2579 219,75 -24,84 -54,58 12,03 16,88 169,24 3582 -39,75 41,62 -16,54 12,03 -1,76 -4,40 2598 -100,00 -11,79 11,79 12,03 -12,03 -100,00 2611 170,19 19,30 32,85 12,03 26,75 261,11 5613 -71,85 -33,76 24,25 12,03 -9,79 -79,11 2629 3.296,68 1,94 63,92 12,03 404,51 3.779,09 5642 10.236,96 23,86 2.442,57 12,03 1.528,21 14.243,62 5651 511,41 -8,48 -43,38 12,03 55,28 526,85 3653 1.245,16 -47,59 -592,59 12,03 72,78 689,79 3654 -1,17 -18,57 0,22 12,03 -2,35 -9,85 2655 -39,33 6,56 -2,58 12,03 -4,25 -27,57 2656 363,18 6,66 24,20 12,03 47,40 453,48 5658 291,84 113,26 330,53 12,03 88,49 836,15 5659 -94,74 103,72 -98,26 12,03 -10,74 -88,00 2661 599,93 291,42 1.748,31 12,03 317,55 2.969,23 5662 -47,15 139,32 -65,69 12,03 3,19 41,70 3663 -88,40 24,04 -21,25 12,03 -10,30 -83,88 2664 -99,20 57,79 -57,33 12,03 -11,88 -98,59 2665 304,77 43,84 133,62 12,03 58,01 552,28 5694 2.507,27 -8,52 -213,72 12,03 274,89 2.571,94 3697 11.153,70 111,01 12.381,39 12,03 2.844,61 26.502,73 5
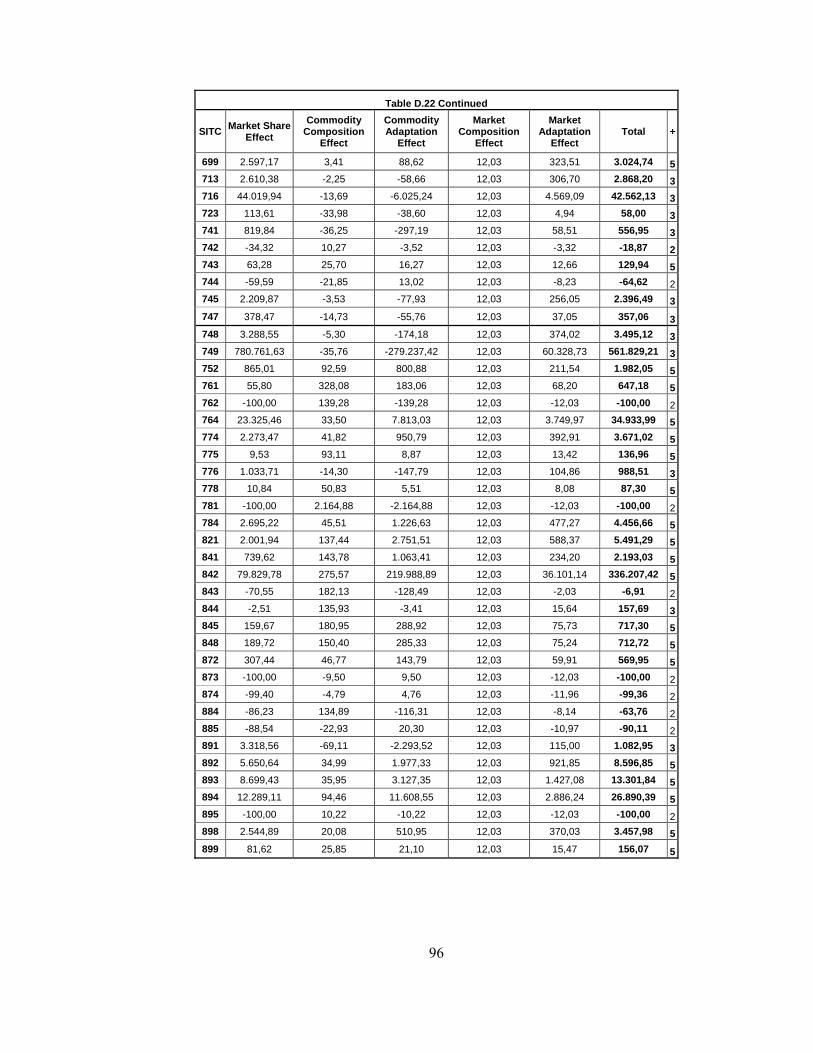
96
Table D.22 Continued
SITC Market Share Effect
Commodity Composition
Effect
Commodity Adaptation
Effect
Market Composition
Effect
Market Adaptation
Effect Total +
699 2.597,17 3,41 88,62 12,03 323,51 3.024,74 5713 2.610,38 -2,25 -58,66 12,03 306,70 2.868,20 3716 44.019,94 -13,69 -6.025,24 12,03 4.569,09 42.562,13 3723 113,61 -33,98 -38,60 12,03 4,94 58,00 3741 819,84 -36,25 -297,19 12,03 58,51 556,95 3742 -34,32 10,27 -3,52 12,03 -3,32 -18,87 2743 63,28 25,70 16,27 12,03 12,66 129,94 5744 -59,59 -21,85 13,02 12,03 -8,23 -64,62 2745 2.209,87 -3,53 -77,93 12,03 256,05 2.396,49 3747 378,47 -14,73 -55,76 12,03 37,05 357,06 3748 3.288,55 -5,30 -174,18 12,03 374,02 3.495,12 3749 780.761,63 -35,76 -279.237,42 12,03 60.328,73 561.829,21 3752 865,01 92,59 800,88 12,03 211,54 1.982,05 5761 55,80 328,08 183,06 12,03 68,20 647,18 5762 -100,00 139,28 -139,28 12,03 -12,03 -100,00 2764 23.325,46 33,50 7.813,03 12,03 3.749,97 34.933,99 5774 2.273,47 41,82 950,79 12,03 392,91 3.671,02 5775 9,53 93,11 8,87 12,03 13,42 136,96 5776 1.033,71 -14,30 -147,79 12,03 104,86 988,51 3778 10,84 50,83 5,51 12,03 8,08 87,30 5781 -100,00 2.164,88 -2.164,88 12,03 -12,03 -100,00 2784 2.695,22 45,51 1.226,63 12,03 477,27 4.456,66 5821 2.001,94 137,44 2.751,51 12,03 588,37 5.491,29 5841 739,62 143,78 1.063,41 12,03 234,20 2.193,03 5842 79.829,78 275,57 219.988,89 12,03 36.101,14 336.207,42 5843 -70,55 182,13 -128,49 12,03 -2,03 -6,91 2844 -2,51 135,93 -3,41 12,03 15,64 157,69 3845 159,67 180,95 288,92 12,03 75,73 717,30 5848 189,72 150,40 285,33 12,03 75,24 712,72 5872 307,44 46,77 143,79 12,03 59,91 569,95 5873 -100,00 -9,50 9,50 12,03 -12,03 -100,00 2874 -99,40 -4,79 4,76 12,03 -11,96 -99,36 2884 -86,23 134,89 -116,31 12,03 -8,14 -63,76 2885 -88,54 -22,93 20,30 12,03 -10,97 -90,11 2891 3.318,56 -69,11 -2.293,52 12,03 115,00 1.082,95 3892 5.650,64 34,99 1.977,33 12,03 921,85 8.596,85 5893 8.699,43 35,95 3.127,35 12,03 1.427,08 13.301,84 5894 12.289,11 94,46 11.608,55 12,03 2.886,24 26.890,39 5895 -100,00 10,22 -10,22 12,03 -12,03 -100,00 2898 2.544,89 20,08 510,95 12,03 370,03 3.457,98 5899 81,62 25,85 21,10 12,03 15,47 156,07 5

97
Table D.23: CMSA for Malaysia (% changes, 1998-2002)
SITC Market Share Effect
Commodity Composition
Effect
Commodity Adaptation
Effect
Market Composition
Effect
Market Adaptation
Effect Total +
046 -52,55 225,14 -118,31 -5,71 -3,10 45,47 1048 18,36 -4,45 -0,82 -5,71 -0,75 6,63 1054 -46,46 -9,10 4,23 -5,71 2,93 -54,11 2056 -39,03 -7,51 2,93 -5,71 2,49 -46,82 2057 -6,18 -1,05 0,06 -5,71 0,41 -12,46 2058 34,92 41,68 14,55 -5,71 -5,20 80,24 3061 -100,00 -28,30 28,30 -5,71 5,71 -100,00 2062 126,95 51,41 65,27 -5,71 -13,91 224,01 3073 19,37 82,94 16,07 -5,71 -6,76 105,91 3075 1.095,14 19,80 216,84 -5,71 -76,01 1.250,06 3098 68,02 -7,81 -5,31 -5,71 -3,13 46,05 1121 -70,33 97,08 -68,27 -5,71 2,37 -44,86 2223 438,57 -59,91 -262,75 -5,71 -6,62 103,59 1232 -100,00 0,82 -0,82 -5,71 5,71 -100,00 2247 -100,00 86,46 -86,46 -5,71 5,71 -100,00 2263 -100,00 -70,52 70,52 -5,71 5,71 -100,00 2273 6.289,76 -34,16 -2.148,81 -5,71 -234,40 3.866,68 1277 -100,00 206,72 -206,72 -5,71 5,71 -100,00 2278 183,05 -8,57 -15,70 -5,71 -9,06 144,01 1288 -100,00 -8,65 8,65 -5,71 5,71 -100,00 2292 -69,14 -28,62 19,79 -5,71 4,45 -79,23 2334 348,32 11,37 39,60 -5,71 -22,79 370,80 3515 -100,00 -34,22 34,22 -5,71 5,71 -100,00 2522 -79,97 -20,56 16,44 -5,71 4,80 -84,99 2523 90,06 -18,48 -16,64 -5,71 -3,14 46,10 1533 327,19 -2,25 -7,36 -5,71 -18,13 293,75 1541 -100,00 15,45 -15,45 -5,71 5,71 -100,00 2551 -100,00 3,28 -3,28 -5,71 5,71 -100,00 2553 -93,94 3,34 -3,14 -5,71 5,35 -94,09 2573 -100,00 -27,24 27,24 -5,71 5,71 -100,00 2575 9.142,23 26,51 2.423,99 -5,71 -661,66 10.925,36 3581 56.871,92 87,01 49.484,38 -5,71 -6.075,34 100.362,26 3582 1.761,78 2,50 44,05 -5,71 -103,21 1.699,41 3592 -100,00 -20,65 20,65 -5,71 5,71 -100,00 2621 662,74 -13,96 -92,52 -5,71 -31,75 518,81 1625 171,33 198,34 339,83 -5,71 -40,50 663,30 3629 -51,08 5,03 -2,57 -5,71 2,78 -51,55 2635 -100,00 34,06 -34,06 -5,71 5,71 -100,00 2642 155.590,60 -14,89 -23.159,72 -5,71 -7.557,75 124.852,54 1651 3.189,04 -14,11 -450,11 -5,71 -155,52 2.563,59 1652 270,17 -48,38 -130,71 -5,71 -5,20 80,18 1653 186,31 -29,09 -54,19 -5,71 -5,88 91,44 1654 -92,07 -29,17 26,85 -5,71 5,39 -94,70 2656 231,91 -33,54 -77,77 -5,71 -6,88 108,01 1

98
Table D.23 Continued
SITC Market Share Effect
Commodity Composition
Effect
Commodity Adaptation
Effect
Market Composition
Effect
Market Adaptation
Effect Total +
657 18,51 -2,04 -0,38 -5,71 -0,92 9,47 1658 357,71 39,65 141,82 -5,71 -30,77 502,70 3659 70,23 11,59 8,14 -5,71 -5,13 79,11 3661 -100,00 -24,38 24,38 -5,71 5,71 -100,00 2662 17,21 -18,79 -3,23 -5,71 0,27 -10,25 2663 93,86 -12,32 -11,56 -5,71 -3,99 60,28 1664 -52,45 71,72 -37,62 -5,71 1,05 -23,01 2665 1.068,03 -29,22 -312,11 -5,71 -41,48 679,51 1666 11,87 185,36 22,01 -5,71 -12,51 201,02 3674 -100,00 -9,95 9,95 -5,71 5,71 -100,00 2679 700,02 38,13 266,93 -5,71 -57,37 942,00 3682 -96,54 -14,64 14,14 -5,71 5,54 -97,22 2691 91,18 -24,42 -22,27 -5,71 -2,54 36,24 1694 224,64 14,92 33,52 -5,71 -15,59 251,79 3695 -79,72 3,59 -2,86 -5,71 4,51 -80,19 2697 159,16 -5,07 -8,06 -5,71 -8,33 131,99 1699 8,54 -18,73 -1,60 -5,71 0,67 -16,82 2713 41,56 20,21 8,40 -5,71 -4,01 60,46 3716 -96,65 -22,15 21,41 -5,71 5,56 -97,54 2721 3.038,43 20,02 608,35 -5,71 -209,29 3.451,81 3723 -96,38 167,47 -161,41 -5,71 5,15 -90,86 2724 1.383,60 -32,00 -442,69 -5,71 -51,88 851,34 1727 2.143,91 -51,99 -1.114,63 -5,71 -55,78 915,80 1728 -96,48 -33,14 31,97 -5,71 5,57 -97,78 2733 506,10 -13,41 -67,86 -5,71 -24,25 394,88 1737 -72,90 -70,92 51,70 -5,71 5,26 -92,57 2741 -52,30 -53,59 28,03 -5,71 4,44 -79,12 2742 50,77 13,76 6,99 -5,71 -4,08 61,72 3743 1.134,74 20,40 231,50 -5,71 -79,14 1.301,79 3744 -87,49 -15,98 13,98 -5,71 5,11 -90,09 2745 205,51 -10,95 -22,49 -5,71 -9,82 156,54 1746 208,77 -6,70 -14,00 -5,71 -10,73 171,63 1747 357,42 29,10 104,00 -5,71 -28,00 456,81 3748 244,23 57,04 139,31 -5,71 -25,15 409,73 3749 75,13 -13,80 -10,37 -5,71 -2,91 42,35 1764 52,37 25,50 13,36 -5,71 -5,21 80,31 3771 -77,98 -9,98 7,79 -5,71 4,58 -81,31 2772 66,03 -9,64 -6,37 -5,71 -2,86 41,46 1773 -19,04 -20,87 3,97 -5,71 2,05 -39,59 2775 -2,87 135,46 -3,88 -5,71 -7,35 115,65 1778 -75,93 14,06 -10,67 -5,71 4,14 -74,12 2784 71,81 118,00 84,74 -5,71 -15,67 253,17 3786 469,70 48,69 228,69 -5,71 -42,64 698,73 3812 557,25 24,42 136,07 -5,71 -40,97 671,06 3813 -94,10 -15,75 14,82 -5,71 5,42 -95,31 2821 648,97 102,56 665,55 -5,71 -80,88 1.330,49 3

99
Table D.23 Continued
SITC Market Share Effect
Commodity Composition
Effect
Commodity Adaptation
Effect
Market Composition
Effect
Market Adaptation
Effect Total +
831 5.885,08 40,58 2.388,28 -5,71 -474,53 7.833,71 3842 -100,00 52,55 -52,55 -5,71 5,71 -100,00 2844 -19,87 -13,24 2,63 -5,71 1,74 -34,45 2845 35,13 49,37 17,35 -5,71 -5,81 90,33 3846 138,96 -14,55 -20,23 -5,71 -5,95 92,53 1872 -48,68 32,52 -15,83 -5,71 1,83 -35,87 2873 145,50 -18,75 -27,29 -5,71 -5,68 88,08 1874 24,50 -7,18 -1,76 -5,71 -0,89 8,97 1884 -100,00 21,98 -21,98 -5,71 5,71 -100,00 2891 115.760,12 191,56 221.752,33 -5,71 -19.274,73 318.423,57 3892 386,97 20,26 78,42 -5,71 -27,72 452,22 3893 1.212,18 40,68 493,14 -5,71 -99,65 1.640,63 3895 57,32 -24,75 -14,19 -5,71 -1,05 11,63 1897 867,87 -34,44 -298,86 -5,71 -30,51 498,35 1898 629,40 -13,33 -83,91 -5,71 -30,37 496,08 1899 1.143,90 -9,66 -110,52 -5,71 -58,43 959,58 1
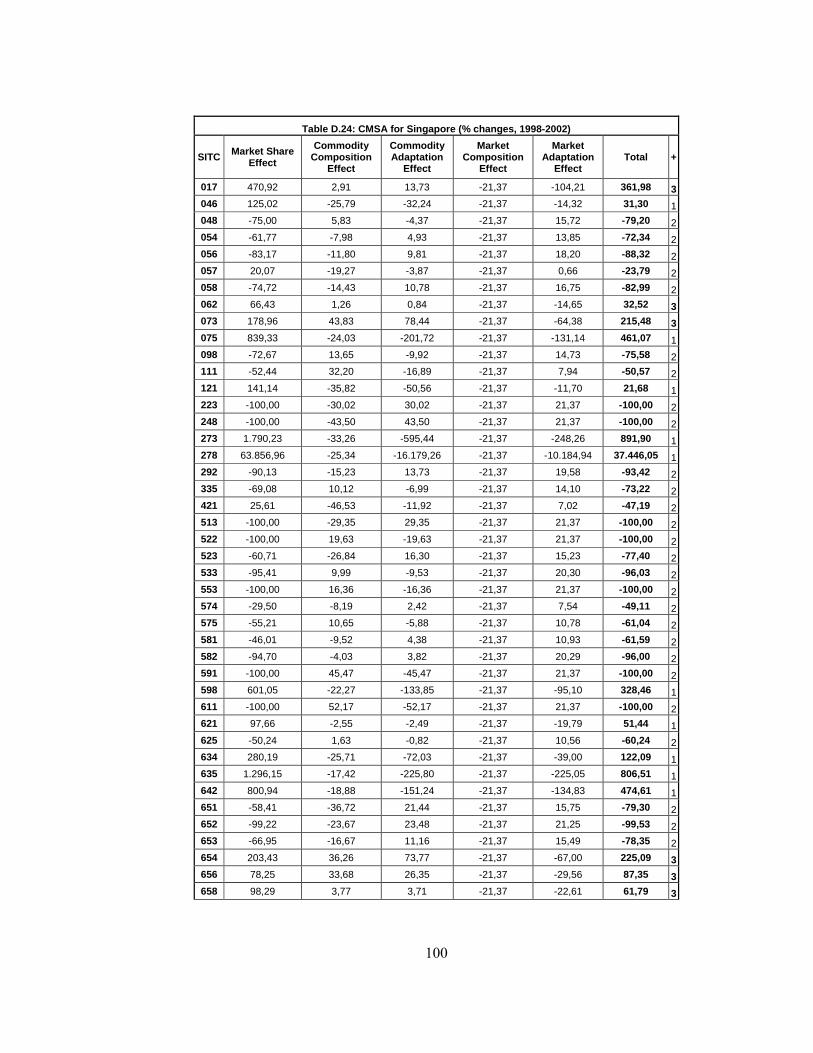
100
Table D.24: CMSA for Singapore (% changes, 1998-2002)
SITC Market Share Effect
Commodity Composition
Effect
Commodity Adaptation
Effect
Market Composition
Effect
Market Adaptation
Effect Total +
017 470,92 2,91 13,73 -21,37 -104,21 361,98 3046 125,02 -25,79 -32,24 -21,37 -14,32 31,30 1048 -75,00 5,83 -4,37 -21,37 15,72 -79,20 2054 -61,77 -7,98 4,93 -21,37 13,85 -72,34 2056 -83,17 -11,80 9,81 -21,37 18,20 -88,32 2057 20,07 -19,27 -3,87 -21,37 0,66 -23,79 2058 -74,72 -14,43 10,78 -21,37 16,75 -82,99 2062 66,43 1,26 0,84 -21,37 -14,65 32,52 3073 178,96 43,83 78,44 -21,37 -64,38 215,48 3075 839,33 -24,03 -201,72 -21,37 -131,14 461,07 1098 -72,67 13,65 -9,92 -21,37 14,73 -75,58 2111 -52,44 32,20 -16,89 -21,37 7,94 -50,57 2121 141,14 -35,82 -50,56 -21,37 -11,70 21,68 1223 -100,00 -30,02 30,02 -21,37 21,37 -100,00 2248 -100,00 -43,50 43,50 -21,37 21,37 -100,00 2273 1.790,23 -33,26 -595,44 -21,37 -248,26 891,90 1278 63.856,96 -25,34 -16.179,26 -21,37 -10.184,94 37.446,05 1292 -90,13 -15,23 13,73 -21,37 19,58 -93,42 2335 -69,08 10,12 -6,99 -21,37 14,10 -73,22 2421 25,61 -46,53 -11,92 -21,37 7,02 -47,19 2513 -100,00 -29,35 29,35 -21,37 21,37 -100,00 2522 -100,00 19,63 -19,63 -21,37 21,37 -100,00 2523 -60,71 -26,84 16,30 -21,37 15,23 -77,40 2533 -95,41 9,99 -9,53 -21,37 20,30 -96,03 2553 -100,00 16,36 -16,36 -21,37 21,37 -100,00 2574 -29,50 -8,19 2,42 -21,37 7,54 -49,11 2575 -55,21 10,65 -5,88 -21,37 10,78 -61,04 2581 -46,01 -9,52 4,38 -21,37 10,93 -61,59 2582 -94,70 -4,03 3,82 -21,37 20,29 -96,00 2591 -100,00 45,47 -45,47 -21,37 21,37 -100,00 2598 601,05 -22,27 -133,85 -21,37 -95,10 328,46 1611 -100,00 52,17 -52,17 -21,37 21,37 -100,00 2621 97,66 -2,55 -2,49 -21,37 -19,79 51,44 1625 -50,24 1,63 -0,82 -21,37 10,56 -60,24 2634 280,19 -25,71 -72,03 -21,37 -39,00 122,09 1635 1.296,15 -17,42 -225,80 -21,37 -225,05 806,51 1642 800,94 -18,88 -151,24 -21,37 -134,83 474,61 1651 -58,41 -36,72 21,44 -21,37 15,75 -79,30 2652 -99,22 -23,67 23,48 -21,37 21,25 -99,53 2653 -66,95 -16,67 11,16 -21,37 15,49 -78,35 2654 203,43 36,26 73,77 -21,37 -67,00 225,09 3656 78,25 33,68 26,35 -21,37 -29,56 87,35 3658 98,29 3,77 3,71 -21,37 -22,61 61,79 3
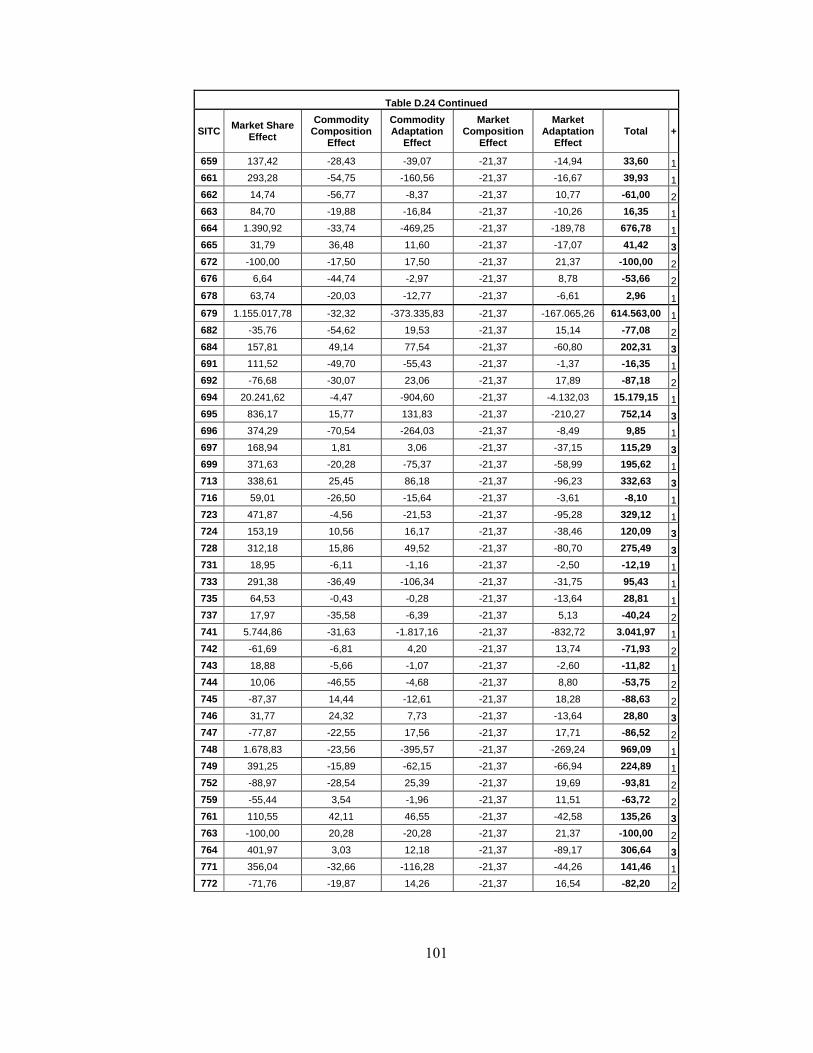
101
Table D.24 Continued
SITC Market Share Effect
Commodity Composition
Effect
Commodity Adaptation
Effect
Market Composition
Effect
Market Adaptation
Effect Total +
659 137,42 -28,43 -39,07 -21,37 -14,94 33,60 1661 293,28 -54,75 -160,56 -21,37 -16,67 39,93 1662 14,74 -56,77 -8,37 -21,37 10,77 -61,00 2663 84,70 -19,88 -16,84 -21,37 -10,26 16,35 1664 1.390,92 -33,74 -469,25 -21,37 -189,78 676,78 1665 31,79 36,48 11,60 -21,37 -17,07 41,42 3672 -100,00 -17,50 17,50 -21,37 21,37 -100,00 2676 6,64 -44,74 -2,97 -21,37 8,78 -53,66 2678 63,74 -20,03 -12,77 -21,37 -6,61 2,96 1679 1.155.017,78 -32,32 -373.335,83 -21,37 -167.065,26 614.563,00 1682 -35,76 -54,62 19,53 -21,37 15,14 -77,08 2684 157,81 49,14 77,54 -21,37 -60,80 202,31 3691 111,52 -49,70 -55,43 -21,37 -1,37 -16,35 1692 -76,68 -30,07 23,06 -21,37 17,89 -87,18 2694 20.241,62 -4,47 -904,60 -21,37 -4.132,03 15.179,15 1695 836,17 15,77 131,83 -21,37 -210,27 752,14 3696 374,29 -70,54 -264,03 -21,37 -8,49 9,85 1697 168,94 1,81 3,06 -21,37 -37,15 115,29 3699 371,63 -20,28 -75,37 -21,37 -58,99 195,62 1713 338,61 25,45 86,18 -21,37 -96,23 332,63 3716 59,01 -26,50 -15,64 -21,37 -3,61 -8,10 1723 471,87 -4,56 -21,53 -21,37 -95,28 329,12 1724 153,19 10,56 16,17 -21,37 -38,46 120,09 3728 312,18 15,86 49,52 -21,37 -80,70 275,49 3731 18,95 -6,11 -1,16 -21,37 -2,50 -12,19 1733 291,38 -36,49 -106,34 -21,37 -31,75 95,43 1735 64,53 -0,43 -0,28 -21,37 -13,64 28,81 1737 17,97 -35,58 -6,39 -21,37 5,13 -40,24 2741 5.744,86 -31,63 -1.817,16 -21,37 -832,72 3.041,97 1742 -61,69 -6,81 4,20 -21,37 13,74 -71,93 2743 18,88 -5,66 -1,07 -21,37 -2,60 -11,82 1744 10,06 -46,55 -4,68 -21,37 8,80 -53,75 2745 -87,37 14,44 -12,61 -21,37 18,28 -88,63 2746 31,77 24,32 7,73 -21,37 -13,64 28,80 3747 -77,87 -22,55 17,56 -21,37 17,71 -86,52 2748 1.678,83 -23,56 -395,57 -21,37 -269,24 969,09 1749 391,25 -15,89 -62,15 -21,37 -66,94 224,89 1752 -88,97 -28,54 25,39 -21,37 19,69 -93,81 2759 -55,44 3,54 -1,96 -21,37 11,51 -63,72 2761 110,55 42,11 46,55 -21,37 -42,58 135,26 3763 -100,00 20,28 -20,28 -21,37 21,37 -100,00 2764 401,97 3,03 12,18 -21,37 -89,17 306,64 3771 356,04 -32,66 -116,28 -21,37 -44,26 141,46 1772 -71,76 -19,87 14,26 -21,37 16,54 -82,20 2

102
Table D.24 Continued
SITC Market Share Effect
Commodity Composition
Effect
Commodity Adaptation
Effect
Market Composition
Effect
Market Adaptation
Effect Total +
773 55,28 -43,60 -24,10 -21,37 2,66 -31,14 2775 261,14 1,41 3,67 -21,37 -56,90 187,95 3776 301,53 14,48 43,66 -21,37 -76,87 261,42 3778 374,83 -14,35 -53,78 -21,37 -65,55 219,78 1781 -100,00 65,25 -65,25 -21,37 21,37 -100,00 2784 220,97 48,62 107,44 -21,37 -80,58 275,07 3793 39.582,68 -87,70 -34.713,18 -21,37 -1.022,03 3.738,39 1812 25,01 -36,83 -9,21 -21,37 4,50 -37,91 2813 355,98 -14,19 -50,50 -21,37 -62,26 207,66 1821 277,60 -16,85 -46,78 -21,37 -45,73 146,86 1841 -53,79 -16,88 9,08 -21,37 13,16 -69,80 2842 130,84 6,97 9,12 -21,37 -31,40 94,15 3843 -77,28 -22,48 17,37 -21,37 17,61 -86,15 2844 -54,82 15,21 -8,34 -21,37 10,25 -59,07 2845 -54,92 48,66 -26,72 -21,37 7,05 -47,30 2846 393,57 -4,15 -16,34 -21,37 -79,74 271,96 1848 -94,53 -25,98 24,56 -21,37 20,51 -96,82 2851 -100,00 6,76 -6,76 -21,37 21,37 -100,00 2872 158,57 -0,32 -0,50 -21,37 -33,72 102,66 1885 9.686,88 -25,16 -2.437,34 -21,37 -1.544,10 5.658,91 1892 302,57 -2,95 -8,92 -21,37 -62,13 207,20 1893 45,58 8,09 3,69 -21,37 -12,26 23,72 3894 -86,18 31,56 -27,20 -21,37 17,49 -85,70 2896 -100,00 -15,89 15,89 -21,37 21,37 -100,00 2897 95,88 -13,51 -12,96 -21,37 -14,83 33,20 1898 -92,38 -54,40 50,25 -21,37 20,63 -97,27 2899 -100,00 20,79 -20,79 -21,37 21,37 -100,00 2

103
Table D.25: CMSA for China (% changes, 1992-2002)
SITC Market Share Effect
Commodity Composition
Effect
Commodity Adaptation
Effect
Market Composition
Effect
Market Adaptation
Effect Total +
048 9,82 -18,51 -1,82 90,33 -9,49 70,33 2057 108,85 149,77 163,02 90,33 380,87 892,84 5062 762,04 -58,68 -447,19 90,33 231,39 577,88 3211 -64,55 82,82 -53,46 90,33 -31,79 23,35 2266 75,18 -63,63 -47,84 90,33 -32,78 21,27 2287 -40,63 -10,10 4,10 90,33 -42,12 1,59 2524 -100,00 131,33 -131,33 90,33 -90,33 -100,00 2532 1.443,41 110,14 1.589,79 90,33 2.839,46 6.073,14 5571 -100,00 -27,65 27,65 90,33 -90,33 -100,00 2573 -100,00 42,39 -42,39 90,33 -90,33 -99,99 2613 1.588,62 -69,36 -1.101,84 90,33 377,07 884,83 3625 857,00 -61,51 -527,13 90,33 242,41 601,11 3658 8.697,32 -66,64 -5.795,74 90,33 2.560,87 5.486,14 3659 2.999,94 -64,33 -1.929,79 90,33 908,59 2.004,75 3673 -59,19 15,77 -9,33 90,33 -47,65 -10,07 2676 -99,95 -69,97 69,93 90,33 -90,32 -99,97 2682 -99,53 -5,52 5,50 90,33 -89,93 -99,16 2684 -98,93 -4,82 4,77 90,33 -89,41 -98,06 2692 -100,00 -68,37 68,37 90,33 -90,33 -100,00 2697 109,49 -73,01 -79,94 90,33 -39,25 7,63 2728 195,91 -32,27 -63,22 90,33 90,72 281,47 3735 29,39 -25,40 -7,46 90,33 -3,14 83,73 2772 15.432,84 142,22 21.948,53 90,33 33.896,04 71.509,97 5784 13.768,91 -10,20 -1.404,19 90,33 11.160,16 23.605,02 3848 -27,73 -50,34 13,96 90,33 -57,91 -31,69 2874 3.456,05 16,32 564,11 90,33 3.646,26 7.773,08 5883 -100,00 -78,38 78,38 90,33 -90,33 -100,00 2
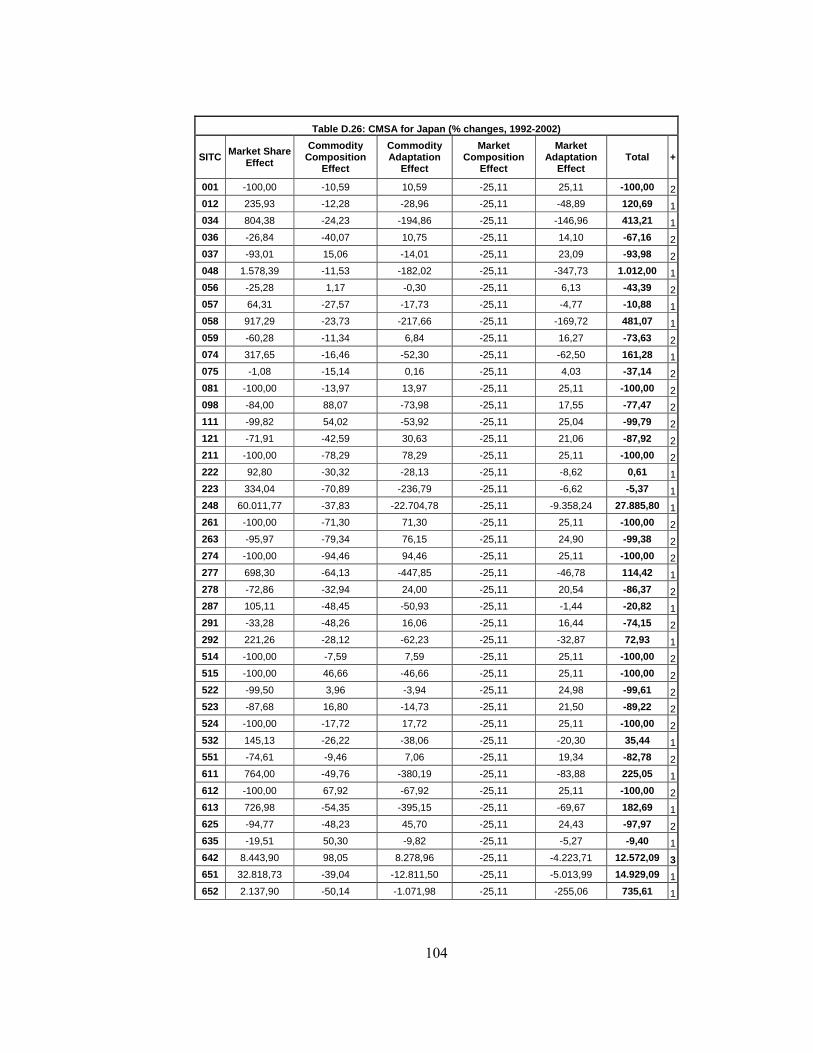
104
Table D.26: CMSA for Japan (% changes, 1992-2002)
SITC Market Share Effect
Commodity Composition
Effect
Commodity Adaptation
Effect
Market Composition
Effect
Market Adaptation
Effect Total +
001 -100,00 -10,59 10,59 -25,11 25,11 -100,00 2012 235,93 -12,28 -28,96 -25,11 -48,89 120,69 1034 804,38 -24,23 -194,86 -25,11 -146,96 413,21 1036 -26,84 -40,07 10,75 -25,11 14,10 -67,16 2037 -93,01 15,06 -14,01 -25,11 23,09 -93,98 2048 1.578,39 -11,53 -182,02 -25,11 -347,73 1.012,00 1056 -25,28 1,17 -0,30 -25,11 6,13 -43,39 2057 64,31 -27,57 -17,73 -25,11 -4,77 -10,88 1058 917,29 -23,73 -217,66 -25,11 -169,72 481,07 1059 -60,28 -11,34 6,84 -25,11 16,27 -73,63 2074 317,65 -16,46 -52,30 -25,11 -62,50 161,28 1075 -1,08 -15,14 0,16 -25,11 4,03 -37,14 2081 -100,00 -13,97 13,97 -25,11 25,11 -100,00 2098 -84,00 88,07 -73,98 -25,11 17,55 -77,47 2111 -99,82 54,02 -53,92 -25,11 25,04 -99,79 2121 -71,91 -42,59 30,63 -25,11 21,06 -87,92 2211 -100,00 -78,29 78,29 -25,11 25,11 -100,00 2222 92,80 -30,32 -28,13 -25,11 -8,62 0,61 1223 334,04 -70,89 -236,79 -25,11 -6,62 -5,37 1248 60.011,77 -37,83 -22.704,78 -25,11 -9.358,24 27.885,80 1261 -100,00 -71,30 71,30 -25,11 25,11 -100,00 2263 -95,97 -79,34 76,15 -25,11 24,90 -99,38 2274 -100,00 -94,46 94,46 -25,11 25,11 -100,00 2277 698,30 -64,13 -447,85 -25,11 -46,78 114,42 1278 -72,86 -32,94 24,00 -25,11 20,54 -86,37 2287 105,11 -48,45 -50,93 -25,11 -1,44 -20,82 1291 -33,28 -48,26 16,06 -25,11 16,44 -74,15 2292 221,26 -28,12 -62,23 -25,11 -32,87 72,93 1514 -100,00 -7,59 7,59 -25,11 25,11 -100,00 2515 -100,00 46,66 -46,66 -25,11 25,11 -100,00 2522 -99,50 3,96 -3,94 -25,11 24,98 -99,61 2523 -87,68 16,80 -14,73 -25,11 21,50 -89,22 2524 -100,00 -17,72 17,72 -25,11 25,11 -100,00 2532 145,13 -26,22 -38,06 -25,11 -20,30 35,44 1551 -74,61 -9,46 7,06 -25,11 19,34 -82,78 2611 764,00 -49,76 -380,19 -25,11 -83,88 225,05 1612 -100,00 67,92 -67,92 -25,11 25,11 -100,00 2613 726,98 -54,35 -395,15 -25,11 -69,67 182,69 1625 -94,77 -48,23 45,70 -25,11 24,43 -97,97 2635 -19,51 50,30 -9,82 -25,11 -5,27 -9,40 1642 8.443,90 98,05 8.278,96 -25,11 -4.223,71 12.572,09 3651 32.818,73 -39,04 -12.811,50 -25,11 -5.013,99 14.929,09 1652 2.137,90 -50,14 -1.071,98 -25,11 -255,06 735,61 1
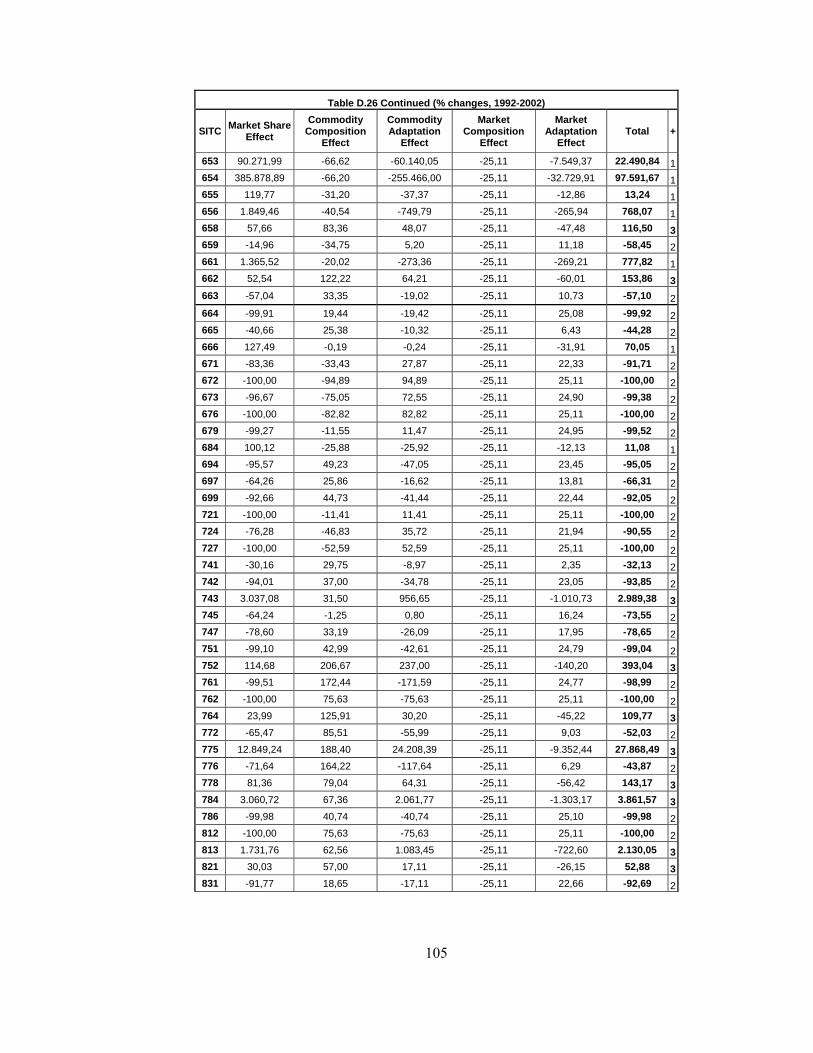
105
Table D.26 Continued (% changes, 1992-2002)
SITC Market Share Effect
Commodity Composition
Effect
Commodity Adaptation
Effect
Market Composition
Effect
Market Adaptation
Effect Total +
653 90.271,99 -66,62 -60.140,05 -25,11 -7.549,37 22.490,84 1654 385.878,89 -66,20 -255.466,00 -25,11 -32.729,91 97.591,67 1655 119,77 -31,20 -37,37 -25,11 -12,86 13,24 1656 1.849,46 -40,54 -749,79 -25,11 -265,94 768,07 1658 57,66 83,36 48,07 -25,11 -47,48 116,50 3659 -14,96 -34,75 5,20 -25,11 11,18 -58,45 2661 1.365,52 -20,02 -273,36 -25,11 -269,21 777,82 1662 52,54 122,22 64,21 -25,11 -60,01 153,86 3663 -57,04 33,35 -19,02 -25,11 10,73 -57,10 2664 -99,91 19,44 -19,42 -25,11 25,08 -99,92 2665 -40,66 25,38 -10,32 -25,11 6,43 -44,28 2666 127,49 -0,19 -0,24 -25,11 -31,91 70,05 1671 -83,36 -33,43 27,87 -25,11 22,33 -91,71 2672 -100,00 -94,89 94,89 -25,11 25,11 -100,00 2673 -96,67 -75,05 72,55 -25,11 24,90 -99,38 2676 -100,00 -82,82 82,82 -25,11 25,11 -100,00 2679 -99,27 -11,55 11,47 -25,11 24,95 -99,52 2684 100,12 -25,88 -25,92 -25,11 -12,13 11,08 1694 -95,57 49,23 -47,05 -25,11 23,45 -95,05 2697 -64,26 25,86 -16,62 -25,11 13,81 -66,31 2699 -92,66 44,73 -41,44 -25,11 22,44 -92,05 2721 -100,00 -11,41 11,41 -25,11 25,11 -100,00 2724 -76,28 -46,83 35,72 -25,11 21,94 -90,55 2727 -100,00 -52,59 52,59 -25,11 25,11 -100,00 2741 -30,16 29,75 -8,97 -25,11 2,35 -32,13 2742 -94,01 37,00 -34,78 -25,11 23,05 -93,85 2743 3.037,08 31,50 956,65 -25,11 -1.010,73 2.989,38 3745 -64,24 -1,25 0,80 -25,11 16,24 -73,55 2747 -78,60 33,19 -26,09 -25,11 17,95 -78,65 2751 -99,10 42,99 -42,61 -25,11 24,79 -99,04 2752 114,68 206,67 237,00 -25,11 -140,20 393,04 3761 -99,51 172,44 -171,59 -25,11 24,77 -98,99 2762 -100,00 75,63 -75,63 -25,11 25,11 -100,00 2764 23,99 125,91 30,20 -25,11 -45,22 109,77 3772 -65,47 85,51 -55,99 -25,11 9,03 -52,03 2775 12.849,24 188,40 24.208,39 -25,11 -9.352,44 27.868,49 3776 -71,64 164,22 -117,64 -25,11 6,29 -43,87 2778 81,36 79,04 64,31 -25,11 -56,42 143,17 3784 3.060,72 67,36 2.061,77 -25,11 -1.303,17 3.861,57 3786 -99,98 40,74 -40,74 -25,11 25,10 -99,98 2812 -100,00 75,63 -75,63 -25,11 25,11 -100,00 2813 1.731,76 62,56 1.083,45 -25,11 -722,60 2.130,05 3821 30,03 57,00 17,11 -25,11 -26,15 52,88 3831 -91,77 18,65 -17,11 -25,11 22,66 -92,69 2

106
Table D.26 Continued (% changes, 1992-2002)
SITC Market Share Effect
Commodity Composition
Effect
Commodity Adaptation
Effect
Market Composition
Effect
Market Adaptation
Effect Total +
841 1.448,17 0,42 6,07 -25,11 -365,26 1.064,29 3842 354,15 25,00 88,54 -25,11 -117,44 325,14 3843 62.915,87 -30,04 -18.899,76 -25,11 -11.044,85 32.916,10 1844 -21,92 28,44 -6,23 -25,11 -0,07 -24,90 1845 494,01 21,63 106,87 -25,11 -156,31 441,09 3846 -39,80 19,28 -7,67 -25,11 7,08 -46,22 2848 -77,81 -40,79 31,74 -25,11 21,81 -90,16 2851 1.039,21 10,94 113,73 -25,11 -292,25 846,52 3871 -100,00 386,83 -386,83 -25,11 25,11 -100,00 2874 1.005,09 34,50 346,76 -25,11 -348,11 1.013,12 3891 59,32 -21,72 -12,88 -25,11 -6,21 -6,60 1892 912,10 -18,89 -172,28 -25,11 -181,02 514,79 1893 1.010,86 114,67 1.159,17 -25,11 -573,69 1.685,91 3894 -5,20 5,50 -0,29 -25,11 0,00 -25,10 1897 75,62 -8,45 -6,39 -25,11 -15,26 20,41 1898 -0,19 37,84 -0,07 -25,11 -9,43 3,03 1899 -82,34 16,25 -13,38 -25,11 19,96 -84,63 2

107
Table D.27: CMSA for Korea (% changes, 1992-2002)
SITC Market Share Effect
Commodity Composition
Effect
Commodity Adaptation
Effect
Market Composition
Effect
Market Adaptation
Effect Total +
036 -6,38 119,77 -7,64 -3,81 -4,03 97,91 1 041 -100,00 -46,37 46,37 -3,81 3,81 -100,00 2 056 -66,80 4,40 -2,94 -3,81 2,49 -66,66 2 057 -11,24 3,52 -0,40 -3,81 0,31 -11,62 2 058 148,20 -1,31 -1,94 -3,81 -5,53 135,61 1 075 953,88 -22,56 -215,21 -3,81 -27,31 684,98 1 121 94,75 -35,71 -33,84 -3,81 -0,96 20,43 1 261 -100,00 -82,18 82,18 -3,81 3,81 -100,00 2 277 8.409,63 -62,86 -5.286,23 -3,81 -116,72 2.940,01 1 278 4.093,09 -31,18 -1.276,08 -3,81 -106,24 2.675,78 1 291 -100,00 -64,67 64,67 -3,81 3,81 -100,00 2 292 800,62 -18,47 -147,89 -3,81 -24,19 606,26 1 514 230,81 -32,94 -76,02 -3,81 -4,65 113,40 1 524 -100,00 3,02 -3,02 -3,81 3,81 -100,00 2 532 -34,79 -52,00 18,09 -3,81 2,62 -69,89 2 598 -100,00 22,77 -22,77 -3,81 3,81 -100,00 2 611 50.296,44 -38,28 -19.251,26 -3,81 -1.182,50 29.820,59 1 613 -49,20 -76,93 37,85 -3,81 3,37 -88,72 2 625 17.308,06 92,83 16.066,29 -3,81 -1.276,33 32.187,04 3 651 836,48 -11,44 -95,67 -3,81 -27,82 697,74 1 652 450,33 -33,96 -152,93 -3,81 -10,05 249,58 1 653 31.346,77 -59,24 -18.570,35 -3,81 -484,99 12.228,37 1 654 6.180,50 -58,97 -3.644,59 -3,81 -94,46 2.378,67 1 659 -94,14 -13,76 12,95 -3,81 3,62 -95,14 2 661 3.694,94 -48,75 -1.801,42 -3,81 -70,35 1.770,61 1 662 -94,96 37,76 -35,85 -3,81 3,55 -93,32 2 672 -100,00 -17,88 17,88 -3,81 3,81 -100,00 2 676 -100,00 -27,85 27,85 -3,81 3,81 -100,00 2 716 364,63 -26,88 -98,01 -3,81 -9,14 226,78 1 724 607,14 -78,55 -476,88 -3,81 -1,97 45,92 1 728 -43,99 -19,11 8,40 -3,81 2,09 -56,42 2 761 347,32 810,87 2.816,29 -3,81 -151,57 3.819,09 3 764 -91,68 51,99 -47,67 -3,81 3,33 -87,83 2 775 1.369,02 68,79 941,74 -3,81 -90,75 2.284,99 3 784 648,61 22,42 145,45 -3,81 -31,14 781,54 3 813 178,08 106,42 189,51 -3,81 -18,08 452,12 3 821 -13,06 185,29 -24,20 -3,81 -5,65 138,58 1 848 -46,40 164,72 -76,43 -3,81 -1,60 36,47 1 872 1.927,49 31,18 600,94 -3,81 -97,62 2.458,18 3 899 274,11 1,21 3,33 -3,81 -10,63 264,21 3
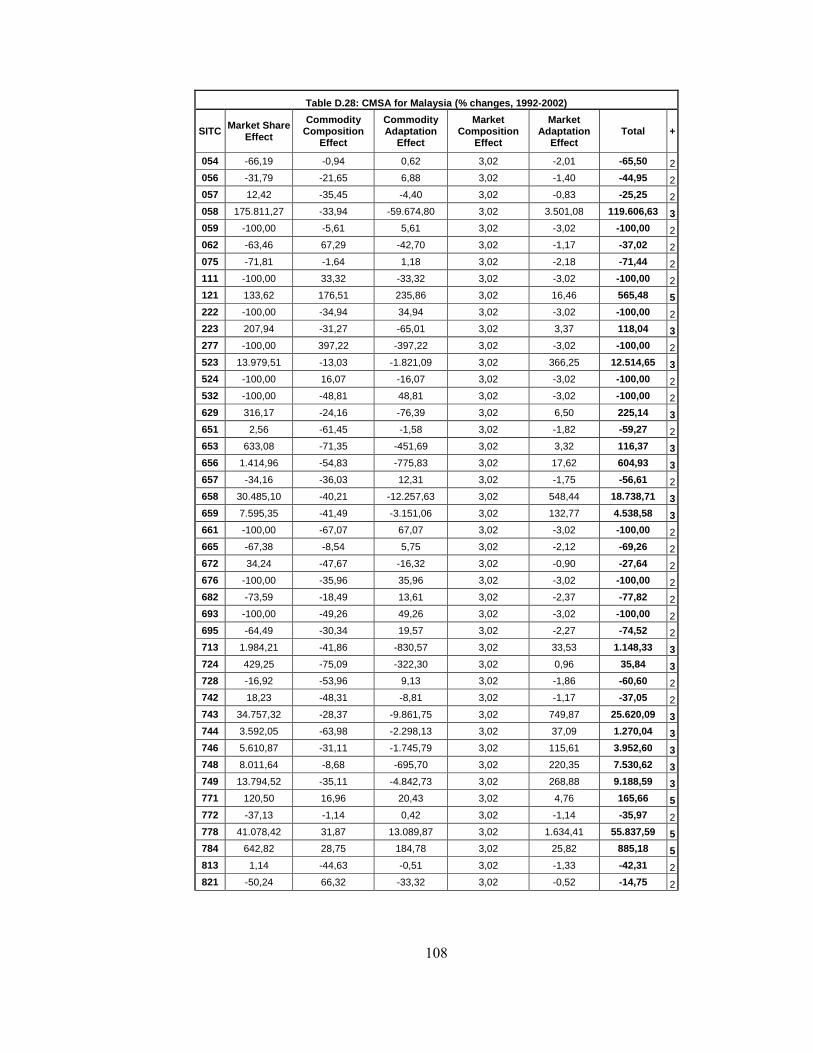
108
Table D.28: CMSA for Malaysia (% changes, 1992-2002)
SITC Market Share Effect
Commodity Composition
Effect
Commodity Adaptation
Effect
Market Composition
Effect
Market Adaptation
Effect Total +
054 -66,19 -0,94 0,62 3,02 -2,01 -65,50 2056 -31,79 -21,65 6,88 3,02 -1,40 -44,95 2057 12,42 -35,45 -4,40 3,02 -0,83 -25,25 2058 175.811,27 -33,94 -59.674,80 3,02 3.501,08 119.606,63 3059 -100,00 -5,61 5,61 3,02 -3,02 -100,00 2062 -63,46 67,29 -42,70 3,02 -1,17 -37,02 2075 -71,81 -1,64 1,18 3,02 -2,18 -71,44 2111 -100,00 33,32 -33,32 3,02 -3,02 -100,00 2121 133,62 176,51 235,86 3,02 16,46 565,48 5222 -100,00 -34,94 34,94 3,02 -3,02 -100,00 2223 207,94 -31,27 -65,01 3,02 3,37 118,04 3277 -100,00 397,22 -397,22 3,02 -3,02 -100,00 2523 13.979,51 -13,03 -1.821,09 3,02 366,25 12.514,65 3524 -100,00 16,07 -16,07 3,02 -3,02 -100,00 2532 -100,00 -48,81 48,81 3,02 -3,02 -100,00 2629 316,17 -24,16 -76,39 3,02 6,50 225,14 3651 2,56 -61,45 -1,58 3,02 -1,82 -59,27 2653 633,08 -71,35 -451,69 3,02 3,32 116,37 3656 1.414,96 -54,83 -775,83 3,02 17,62 604,93 3657 -34,16 -36,03 12,31 3,02 -1,75 -56,61 2658 30.485,10 -40,21 -12.257,63 3,02 548,44 18.738,71 3659 7.595,35 -41,49 -3.151,06 3,02 132,77 4.538,58 3661 -100,00 -67,07 67,07 3,02 -3,02 -100,00 2665 -67,38 -8,54 5,75 3,02 -2,12 -69,26 2672 34,24 -47,67 -16,32 3,02 -0,90 -27,64 2676 -100,00 -35,96 35,96 3,02 -3,02 -100,00 2682 -73,59 -18,49 13,61 3,02 -2,37 -77,82 2693 -100,00 -49,26 49,26 3,02 -3,02 -100,00 2695 -64,49 -30,34 19,57 3,02 -2,27 -74,52 2713 1.984,21 -41,86 -830,57 3,02 33,53 1.148,33 3724 429,25 -75,09 -322,30 3,02 0,96 35,84 3728 -16,92 -53,96 9,13 3,02 -1,86 -60,60 2742 18,23 -48,31 -8,81 3,02 -1,17 -37,05 2743 34.757,32 -28,37 -9.861,75 3,02 749,87 25.620,09 3744 3.592,05 -63,98 -2.298,13 3,02 37,09 1.270,04 3746 5.610,87 -31,11 -1.745,79 3,02 115,61 3.952,60 3748 8.011,64 -8,68 -695,70 3,02 220,35 7.530,62 3749 13.794,52 -35,11 -4.842,73 3,02 268,88 9.188,59 3771 120,50 16,96 20,43 3,02 4,76 165,66 5772 -37,13 -1,14 0,42 3,02 -1,14 -35,97 2778 41.078,42 31,87 13.089,87 3,02 1.634,41 55.837,59 5784 642,82 28,75 184,78 3,02 25,82 885,18 5813 1,14 -44,63 -0,51 3,02 -1,33 -42,31 2821 -50,24 66,32 -33,32 3,02 -0,52 -14,75 2
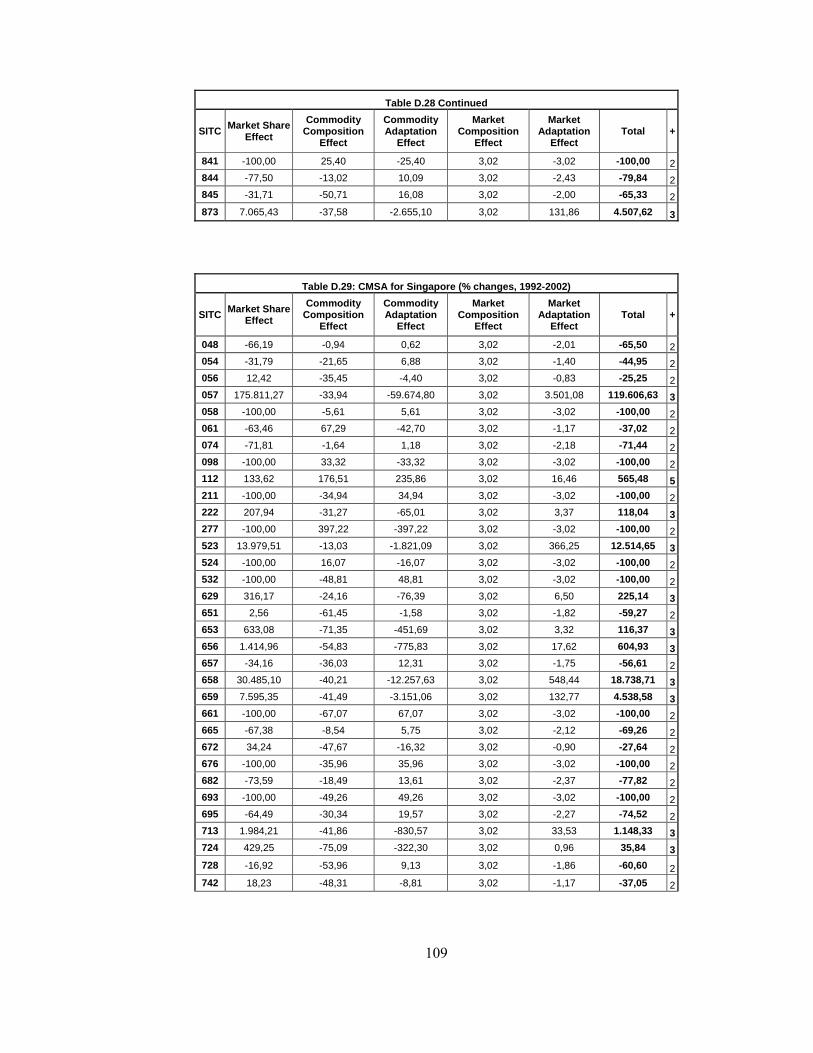
109
Table D.28 Continued
SITC Market Share Effect
Commodity Composition
Effect
Commodity Adaptation
Effect
Market Composition
Effect
Market Adaptation
Effect Total +
841 -100,00 25,40 -25,40 3,02 -3,02 -100,00 2844 -77,50 -13,02 10,09 3,02 -2,43 -79,84 2845 -31,71 -50,71 16,08 3,02 -2,00 -65,33 2873 7.065,43 -37,58 -2.655,10 3,02 131,86 4.507,62 3
Table D.29: CMSA for Singapore (% changes, 1992-2002)
SITC Market Share Effect
Commodity Composition
Effect
Commodity Adaptation
Effect
Market Composition
Effect
Market Adaptation
Effect Total +
048 -66,19 -0,94 0,62 3,02 -2,01 -65,50 2054 -31,79 -21,65 6,88 3,02 -1,40 -44,95 2056 12,42 -35,45 -4,40 3,02 -0,83 -25,25 2057 175.811,27 -33,94 -59.674,80 3,02 3.501,08 119.606,63 3058 -100,00 -5,61 5,61 3,02 -3,02 -100,00 2061 -63,46 67,29 -42,70 3,02 -1,17 -37,02 2074 -71,81 -1,64 1,18 3,02 -2,18 -71,44 2098 -100,00 33,32 -33,32 3,02 -3,02 -100,00 2112 133,62 176,51 235,86 3,02 16,46 565,48 5211 -100,00 -34,94 34,94 3,02 -3,02 -100,00 2222 207,94 -31,27 -65,01 3,02 3,37 118,04 3277 -100,00 397,22 -397,22 3,02 -3,02 -100,00 2523 13.979,51 -13,03 -1.821,09 3,02 366,25 12.514,65 3524 -100,00 16,07 -16,07 3,02 -3,02 -100,00 2532 -100,00 -48,81 48,81 3,02 -3,02 -100,00 2629 316,17 -24,16 -76,39 3,02 6,50 225,14 3651 2,56 -61,45 -1,58 3,02 -1,82 -59,27 2653 633,08 -71,35 -451,69 3,02 3,32 116,37 3656 1.414,96 -54,83 -775,83 3,02 17,62 604,93 3657 -34,16 -36,03 12,31 3,02 -1,75 -56,61 2658 30.485,10 -40,21 -12.257,63 3,02 548,44 18.738,71 3659 7.595,35 -41,49 -3.151,06 3,02 132,77 4.538,58 3661 -100,00 -67,07 67,07 3,02 -3,02 -100,00 2665 -67,38 -8,54 5,75 3,02 -2,12 -69,26 2672 34,24 -47,67 -16,32 3,02 -0,90 -27,64 2676 -100,00 -35,96 35,96 3,02 -3,02 -100,00 2682 -73,59 -18,49 13,61 3,02 -2,37 -77,82 2693 -100,00 -49,26 49,26 3,02 -3,02 -100,00 2695 -64,49 -30,34 19,57 3,02 -2,27 -74,52 2713 1.984,21 -41,86 -830,57 3,02 33,53 1.148,33 3724 429,25 -75,09 -322,30 3,02 0,96 35,84 3728 -16,92 -53,96 9,13 3,02 -1,86 -60,60 2742 18,23 -48,31 -8,81 3,02 -1,17 -37,05 2
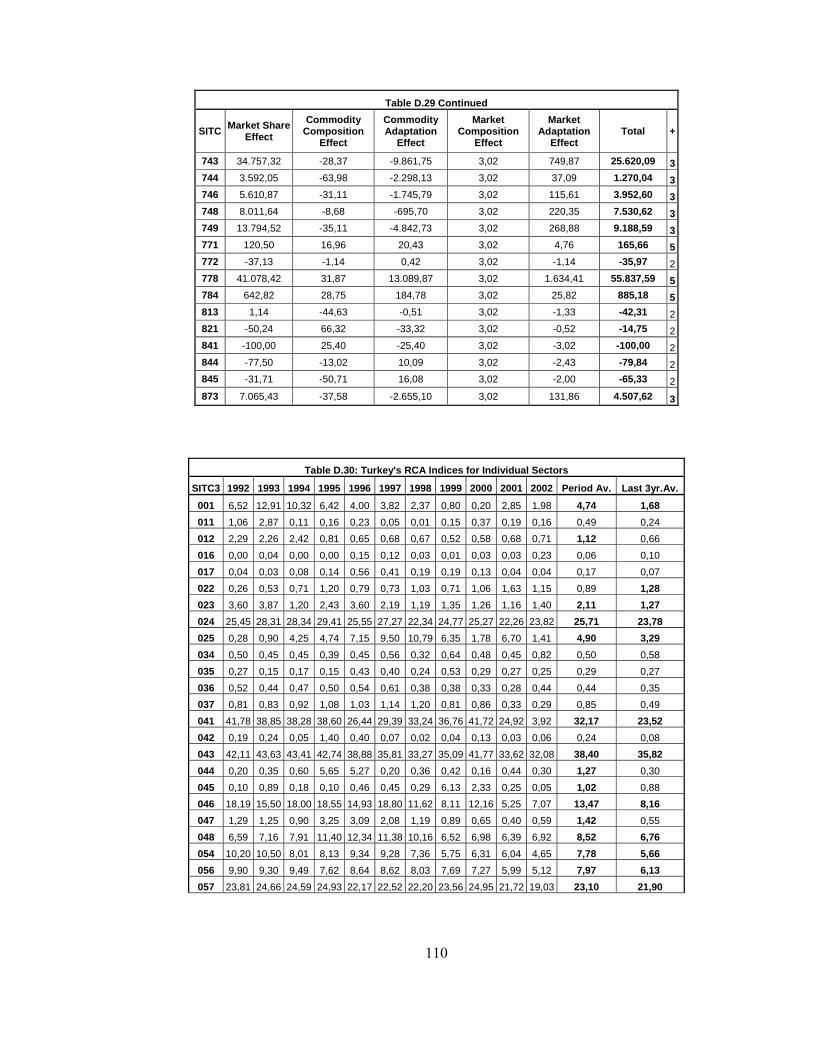
110
Table D.29 Continued
SITC Market Share Effect
Commodity Composition
Effect
Commodity Adaptation
Effect
Market Composition
Effect
Market Adaptation
Effect Total +
743 34.757,32 -28,37 -9.861,75 3,02 749,87 25.620,09 3744 3.592,05 -63,98 -2.298,13 3,02 37,09 1.270,04 3746 5.610,87 -31,11 -1.745,79 3,02 115,61 3.952,60 3748 8.011,64 -8,68 -695,70 3,02 220,35 7.530,62 3749 13.794,52 -35,11 -4.842,73 3,02 268,88 9.188,59 3771 120,50 16,96 20,43 3,02 4,76 165,66 5772 -37,13 -1,14 0,42 3,02 -1,14 -35,97 2778 41.078,42 31,87 13.089,87 3,02 1.634,41 55.837,59 5784 642,82 28,75 184,78 3,02 25,82 885,18 5813 1,14 -44,63 -0,51 3,02 -1,33 -42,31 2821 -50,24 66,32 -33,32 3,02 -0,52 -14,75 2841 -100,00 25,40 -25,40 3,02 -3,02 -100,00 2844 -77,50 -13,02 10,09 3,02 -2,43 -79,84 2845 -31,71 -50,71 16,08 3,02 -2,00 -65,33 2873 7.065,43 -37,58 -2.655,10 3,02 131,86 4.507,62 3
Table D.30: Turkey's RCA Indices for Individual Sectors
SITC3 1992 1993 1994 1995 1996 1997 1998 1999 2000 2001 2002 Period Av. Last 3yr.Av.
001 6,52 12,91 10,32 6,42 4,00 3,82 2,37 0,80 0,20 2,85 1,98 4,74 1,68 011 1,06 2,87 0,11 0,16 0,23 0,05 0,01 0,15 0,37 0,19 0,16 0,49 0,24 012 2,29 2,26 2,42 0,81 0,65 0,68 0,67 0,52 0,58 0,68 0,71 1,12 0,66 016 0,00 0,04 0,00 0,00 0,15 0,12 0,03 0,01 0,03 0,03 0,23 0,06 0,10 017 0,04 0,03 0,08 0,14 0,56 0,41 0,19 0,19 0,13 0,04 0,04 0,17 0,07 022 0,26 0,53 0,71 1,20 0,79 0,73 1,03 0,71 1,06 1,63 1,15 0,89 1,28 023 3,60 3,87 1,20 2,43 3,60 2,19 1,19 1,35 1,26 1,16 1,40 2,11 1,27 024 25,45 28,31 28,34 29,41 25,55 27,27 22,34 24,77 25,27 22,26 23,82 25,71 23,78 025 0,28 0,90 4,25 4,74 7,15 9,50 10,79 6,35 1,78 6,70 1,41 4,90 3,29 034 0,50 0,45 0,45 0,39 0,45 0,56 0,32 0,64 0,48 0,45 0,82 0,50 0,58 035 0,27 0,15 0,17 0,15 0,43 0,40 0,24 0,53 0,29 0,27 0,25 0,29 0,27 036 0,52 0,44 0,47 0,50 0,54 0,61 0,38 0,38 0,33 0,28 0,44 0,44 0,35 037 0,81 0,83 0,92 1,08 1,03 1,14 1,20 0,81 0,86 0,33 0,29 0,85 0,49 041 41,78 38,85 38,28 38,60 26,44 29,39 33,24 36,76 41,72 24,92 3,92 32,17 23,52 042 0,19 0,24 0,05 1,40 0,40 0,07 0,02 0,04 0,13 0,03 0,06 0,24 0,08 043 42,11 43,63 43,41 42,74 38,88 35,81 33,27 35,09 41,77 33,62 32,08 38,40 35,82 044 0,20 0,35 0,60 5,65 5,27 0,20 0,36 0,42 0,16 0,44 0,30 1,27 0,30 045 0,10 0,89 0,18 0,10 0,46 0,45 0,29 6,13 2,33 0,25 0,05 1,02 0,88 046 18,19 15,50 18,00 18,55 14,93 18,80 11,62 8,11 12,16 5,25 7,07 13,47 8,16 047 1,29 1,25 0,90 3,25 3,09 2,08 1,19 0,89 0,65 0,40 0,59 1,42 0,55 048 6,59 7,16 7,91 11,40 12,34 11,38 10,16 6,52 6,98 6,39 6,92 8,52 6,76 054 10,20 10,50 8,01 8,13 9,34 9,28 7,36 5,75 6,31 6,04 4,65 7,78 5,66 056 9,90 9,30 9,49 7,62 8,64 8,62 8,03 7,69 7,27 5,99 5,12 7,97 6,13 057 23,81 24,66 24,59 24,93 22,17 22,52 22,20 23,56 24,95 21,72 19,03 23,10 21,90

111
Table D.30 Continued
SITC3 1992 1993 1994 1995 1996 1997 1998 1999 2000 2001 2002 Period Av. Last 3yr.Av.058 10,98 14,83 16,45 14,20 13,12 14,64 13,51 12,69 12,61 10,04 8,71 12,89 10,45 059 24,18 19,79 20,66 21,69 20,65 12,98 12,39 11,88 7,95 5,93 4,24 14,76 6,04 061 5,63 6,73 9,55 0,90 1,02 6,04 6,29 10,10 12,15 12,94 5,23 6,96 10,11 062 5,91 8,92 15,32 15,64 14,79 13,40 12,21 9,65 9,66 8,40 7,25 11,01 8,44 071 0,07 0,04 0,05 0,06 0,68 0,28 0,26 0,19 0,21 0,16 0,14 0,20 0,17 072 0,01 0,02 0,04 0,29 0,23 0,44 0,25 1,34 2,58 2,80 2,10 0,92 2,49 073 8,77 11,51 12,87 17,10 15,38 15,48 13,23 11,32 12,39 10,07 9,95 12,55 10,80 074 0,66 4,54 0,70 0,47 0,61 1,43 1,13 0,47 0,60 0,35 0,41 1,03 0,45 075 5,38 6,14 4,51 3,29 3,50 3,09 3,70 3,03 3,60 3,68 4,01 4,00 3,76 081 0,14 0,18 0,47 0,62 0,78 0,47 0,33 0,43 0,77 1,36 0,54 0,55 0,89 091 17,04 18,54 18,60 19,42 19,72 13,82 13,70 12,68 11,00 8,82 8,53 14,72 9,45 098 1,79 2,08 2,04 2,02 2,33 2,63 2,39 2,06 2,25 1,76 1,91 2,11 1,97 111 0,84 0,87 1,73 3,92 4,16 2,57 1,83 1,24 1,26 0,80 0,82 1,82 0,96 112 1,03 1,23 1,78 2,18 2,18 1,50 1,38 1,18 1,17 1,00 0,96 1,42 1,04 121 27,24 31,37 33,40 28,04 30,03 25,85 23,93 24,53 28,73 21,45 18,13 26,61 22,77 122 0,82 1,10 0,64 2,35 1,42 1,82 1,12 2,15 3,64 1,82 2,11 1,73 2,52 211 0,54 0,80 0,43 0,83 1,10 0,50 5,22 3,49 9,05 7,77 7,82 3,41 8,21 212 1,05 1,04 1,73 1,34 1,83 1,89 0,69 1,03 0,16 0,25 0,02 1,00 0,14 222 0,74 0,73 0,62 0,63 0,79 1,46 1,38 1,22 1,05 0,81 0,76 0,93 0,87 223 3,41 6,96 7,17 8,25 11,35 14,71 14,68 15,66 11,28 8,57 8,06 10,01 9,30 231 0,00 0,01 0,01 0,01 0,01 0,00 0,00 0,02 0,01 0,00 0,01 0,01 0,01 232 0,15 0,25 0,69 0,58 0,49 0,28 0,25 0,25 0,30 0,14 0,28 0,33 0,24 244 0,00 1,04 0,15 0,02 0,33 0,16 0,47 0,60 0,22 0,19 0,35 0,32 0,25 245 0,01 0,01 0,01 0,01 0,04 0,00 0,07 0,00 0,00 0,00 0,00 0,01 0,00
246 0,00 0,01 0,05 0,00 0,03 0,08 0,01 0,00 0,00 0,00 0,00 0,02 0,00
247 0,15 0,19 0,28 0,15 0,21 0,28 0,51 0,26 0,27 0,28 0,27 0,26 0,28 248 0,23 0,15 0,47 0,44 0,24 0,51 0,66 0,53 0,34 1,01 0,82 0,49 0,72 251 0,11 0,15 0,89 0,33 0,17 0,17 0,09 0,03 0,12 0,01 0,09 0,20 0,08 261 0,14 0,00 0,04 0,01 0,04 0,01 0,00 0,02 0,03 0,00 0,00 0,03 0,01 263 7,60 16,35 8,39 12,68 28,11 20,29 15,62 10,13 7,34 14,19 8,90 13,60 10,14 264 0,00 0,01 0,09 0,75 5,09 8,99 6,18 0,65 0,32 1,42 1,89 2,31 1,21 265 0,02 0,02 0,09 0,04 0,88 0,74 0,44 0,57 0,30 0,27 0,75 0,38 0,44 266 1,69 1,10 2,14 2,12 1,81 1,43 1,72 1,94 2,26 2,41 2,42 1,91 2,36 267 0,13 0,12 0,12 0,26 0,16 0,15 0,24 0,16 0,62 0,51 0,44 0,27 0,52 268 0,31 0,22 0,65 0,65 0,88 1,49 1,57 0,98 0,90 1,15 1,49 0,94 1,18 269 2,17 2,02 2,80 2,95 2,59 2,68 3,99 2,82 2,81 2,32 2,59 2,70 2,57 272 0,00 0,01 0,02 0,04 0,11 0,57 0,01 0,04 0,01 0,11 0,01 0,08 0,04 273 2,15 2,30 2,28 2,79 3,12 3,97 4,89 7,11 7,52 9,42 9,65 5,02 8,86 274 0,24 0,01 1,45 0,02 0,00 0,02 0,01 0,02 0,15 0,24 0,18 0,21 0,19 277 8,59 3,71 3,57 3,99 4,17 2,88 3,39 2,64 2,79 2,11 2,73 3,69 2,55 278 9,95 9,25 8,84 7,52 7,35 6,46 6,46 7,58 7,74 5,50 5,62 7,48 6,29 281 0,64 0,39 0,00 0,10 1,87 3,71 0,61 1,01 4,03 7,13 0,62 1,83 3,93 282 1,26 1,50 4,02 1,83 1,38 1,10 0,80 0,92 1,34 0,66 0,65 1,40 0,88 283 5,33 5,91 5,68 16,45 14,69 22,15 22,88 29,98 39,79 31,79 30,18 20,44 33,92 284 0,00 0,00 0,00 0,00 0,00 0,02 0,00 0,00 0,00 0,00 0,00 0,00 0,00 285 3,71 4,99 2,83 4,81 3,13 3,11 2,10 2,65 2,83 3,81 1,37 3,21 2,67

112
Table D.30 Continued
SITC3 1992 1993 1994 1995 1996 1997 1998 1999 2000 2001 2002 Period Av. Last 3yr.Av.286 0,00 0,00 0,00 0,01 0,00 0,00 0,38 0,00 0,00 0,00 0,00 0,00 0,00 287 11,63 9,26 11,10 22,39 20,09 15,22 14,55 13,03 15,38 7,25 6,36 13,29 9,66 288 0,37 0,45 2,18 1,90 2,56 2,23 2,38 2,20 2,46 2,09 2,02 1,89 2,19 289 0,00 0,07 0,77 1,60 3,48 1,92 0,00 0,06 1,39 0,10 1,92 1,03 1,13 291 3,18 3,54 2,56 2,31 2,24 2,17 2,07 2,25 1,89 1,31 1,62 2,29 1,61 292 1,26 1,36 1,26 1,74 1,06 1,09 1,29 1,37 1,05 0,97 1,21 1,24 1,08 321 0,00 0,00 0,00 0,00 0,00 0,01 0,01 0,03 0,04 0,05 0,02 0,01 0,04 322 0,06 1,52 16,07 1,20 12,01 1,39 3,44 1,98 2,39 0,45 1,37 3,81 1,40 325 0,02 0,01 0,12 0,01 0,01 0,04 0,05 0,02 0,02 0,00 0,00 0,03 0,01 333 0,01 0,01 0,00 0,01 0,00 0,00 0,02 0,06 0,03 0,02 0,02 0,02 0,03 334 0,74 0,52 0,71 0,81 0,58 0,35 0,52 0,63 0,42 0,59 0,97 0,62 0,66 335 0,19 0,44 0,52 0,79 0,26 0,20 0,19 0,32 0,46 0,38 0,24 0,36 0,36 342 0,00 0,00 0,00 0,00 0,00 0,12 0,01 0,01 0,00 0,01 0,14 0,03 0,05 343 0,00 0,00 0,00 0,00 0,00 0,00 0,00 0,00 0,00 0,00 0,00 0,00 0,00 344 7,17 3,38 2,26 2,38 1,76 1,46 1,58 2,61 1,69 1,78 1,53 2,51 1,67 345 0,00 0,00 0,00 0,00 39,45 36,85 0,00 0,00 0,49 0,00 0,04 0,00 0,18 351 0,00 0,00 0,22 0,13 2,41 0,87 1,10 0,93 1,40 1,03 0,80 0,81 1,08 411 2,98 2,35 3,47 9,49 8,16 1,21 1,08 0,81 1,61 0,39 2,66 3,11 1,55 421 22,32 12,53 7,20 12,67 8,84 7,09 8,44 15,25 8,80 14,10 7,91 11,38 10,27 422 0,31 0,16 0,20 0,08 0,02 0,04 0,07 0,07 0,14 0,07 0,05 0,11 0,09 431 0,53 4,22 3,08 3,19 3,04 3,28 2,47 1,42 1,25 0,64 0,56 2,15 0,82 511 0,90 0,74 0,75 0,34 0,40 0,33 0,32 0,31 0,33 0,27 0,32 0,46 0,31 512 0,36 0,07 0,19 0,63 0,51 0,24 0,31 0,26 0,31 0,29 0,28 0,31 0,29 513 0,46 0,42 0,19 0,18 0,09 0,08 0,03 0,06 0,17 0,25 0,20 0,19 0,21 514 0,47 0,28 0,55 0,38 0,24 0,20 0,17 0,26 0,36 0,29 0,22 0,31 0,29 515 0,07 0,07 0,17 0,13 0,12 0,10 0,04 0,07 0,07 0,03 0,02 0,08 0,04 516 0,06 0,04 0,10 0,11 0,08 0,05 0,06 0,08 0,11 0,13 0,14 0,09 0,13
522 0,43 0,61 0,90 0,60 1,84 0,52 0,36 0,22 0,21 0,51 0,29 0,59 0,33
523 5,29 4,73 4,74 3,91 0,56 3,81 4,29 5,10 4,92 3,20 3,25 3,98 3,79 524 2,35 1,68 1,07 0,78 0,07 0,14 0,12 0,16 0,14 0,15 0,24 0,63 0,18 525 0,00 0,00 0,00 0,00 0,01 0,00 0,01 0,01 0,01 0,00 0,01 0,00 0,01 531 0,11 0,04 0,06 0,09 0,10 0,13 0,22 0,20 0,22 0,15 0,23 0,14 0,20 532 8,54 5,32 7,00 10,77 9,84 9,65 9,89 9,95 10,52 7,03 6,37 8,63 7,98 533 0,48 0,67 0,61 0,73 1,02 1,05 1,04 0,78 0,78 0,75 0,79 0,79 0,77 541 0,17 0,13 0,20 0,25 0,48 0,46 0,47 0,59 0,64 0,31 0,22 0,36 0,39 542 1,98 3,15 2,61 1,43 1,64 1,77 1,67 1,22 1,58 1,46 1,65 1,83 1,56 551 1,03 1,00 0,89 1,01 0,80 0,69 0,88 1,04 1,56 1,14 1,12 1,02 1,27 553 0,50 0,31 0,48 0,79 1,32 1,73 1,67 1,21 1,70 1,49 1,51 1,16 1,57 554 5,06 4,86 5,19 8,03 9,36 9,86 8,61 7,64 7,37 6,37 6,10 7,13 6,61 562 3,36 1,60 2,69 1,33 1,01 0,45 0,95 0,54 0,37 0,85 1,60 1,34 0,94 571 1,17 1,78 1,14 0,32 0,18 0,07 0,04 0,06 0,15 0,30 0,10 0,48 0,18 572 0,00 0,01 0,01 0,00 0,01 0,01 0,01 0,02 0,02 0,02 0,01 0,01 0,02 573 1,56 1,70 1,37 0,70 0,23 0,05 0,15 0,08 0,17 0,33 0,09 0,58 0,20 574 1,11 0,67 0,41 0,44 0,53 0,61 0,48 0,54 0,44 0,48 0,39 0,55 0,44 575 0,78 0,68 0,61 0,53 0,46 0,33 0,34 0,33 0,34 0,37 0,35 0,46 0,35 579 0,22 0,23 0,15 0,18 0,17 0,11 0,11 0,37 0,62 0,44 0,36 0,27 0,47
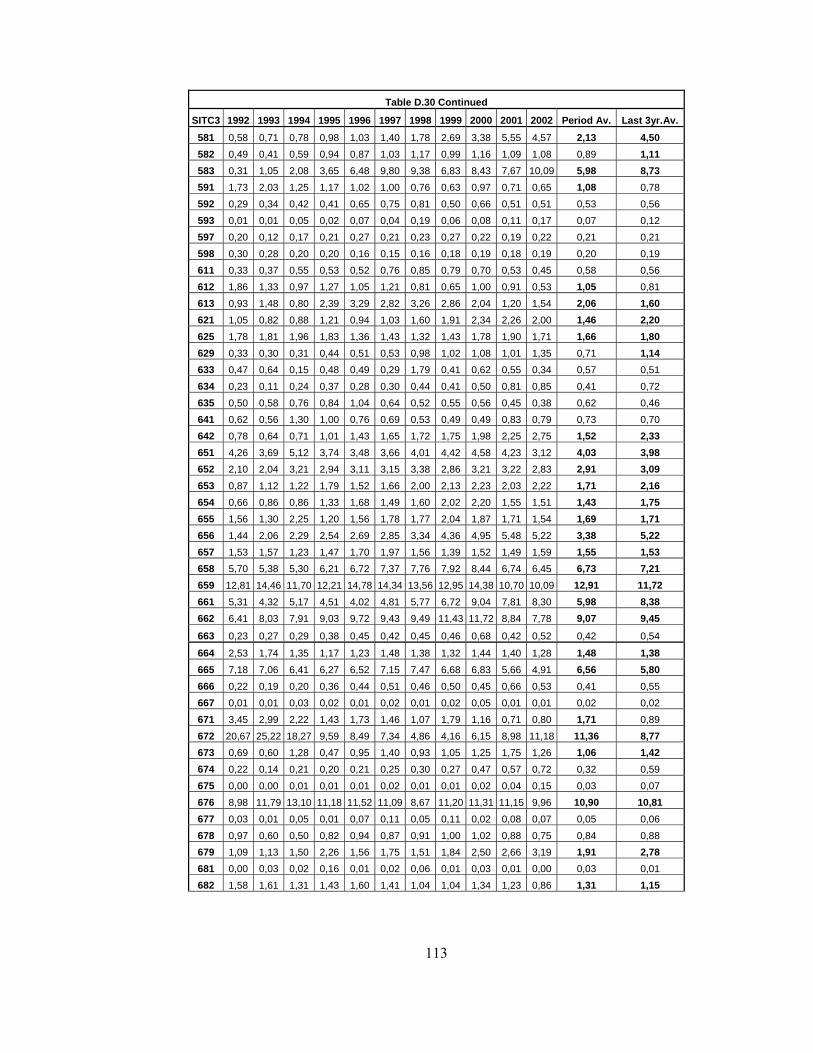
113
Table D.30 Continued
SITC3 1992 1993 1994 1995 1996 1997 1998 1999 2000 2001 2002 Period Av. Last 3yr.Av.581 0,58 0,71 0,78 0,98 1,03 1,40 1,78 2,69 3,38 5,55 4,57 2,13 4,50 582 0,49 0,41 0,59 0,94 0,87 1,03 1,17 0,99 1,16 1,09 1,08 0,89 1,11 583 0,31 1,05 2,08 3,65 6,48 9,80 9,38 6,83 8,43 7,67 10,09 5,98 8,73 591 1,73 2,03 1,25 1,17 1,02 1,00 0,76 0,63 0,97 0,71 0,65 1,08 0,78 592 0,29 0,34 0,42 0,41 0,65 0,75 0,81 0,50 0,66 0,51 0,51 0,53 0,56 593 0,01 0,01 0,05 0,02 0,07 0,04 0,19 0,06 0,08 0,11 0,17 0,07 0,12 597 0,20 0,12 0,17 0,21 0,27 0,21 0,23 0,27 0,22 0,19 0,22 0,21 0,21 598 0,30 0,28 0,20 0,20 0,16 0,15 0,16 0,18 0,19 0,18 0,19 0,20 0,19 611 0,33 0,37 0,55 0,53 0,52 0,76 0,85 0,79 0,70 0,53 0,45 0,58 0,56 612 1,86 1,33 0,97 1,27 1,05 1,21 0,81 0,65 1,00 0,91 0,53 1,05 0,81 613 0,93 1,48 0,80 2,39 3,29 2,82 3,26 2,86 2,04 1,20 1,54 2,06 1,60 621 1,05 0,82 0,88 1,21 0,94 1,03 1,60 1,91 2,34 2,26 2,00 1,46 2,20 625 1,78 1,81 1,96 1,83 1,36 1,43 1,32 1,43 1,78 1,90 1,71 1,66 1,80 629 0,33 0,30 0,31 0,44 0,51 0,53 0,98 1,02 1,08 1,01 1,35 0,71 1,14 633 0,47 0,64 0,15 0,48 0,49 0,29 1,79 0,41 0,62 0,55 0,34 0,57 0,51 634 0,23 0,11 0,24 0,37 0,28 0,30 0,44 0,41 0,50 0,81 0,85 0,41 0,72 635 0,50 0,58 0,76 0,84 1,04 0,64 0,52 0,55 0,56 0,45 0,38 0,62 0,46 641 0,62 0,56 1,30 1,00 0,76 0,69 0,53 0,49 0,49 0,83 0,79 0,73 0,70 642 0,78 0,64 0,71 1,01 1,43 1,65 1,72 1,75 1,98 2,25 2,75 1,52 2,33 651 4,26 3,69 5,12 3,74 3,48 3,66 4,01 4,42 4,58 4,23 3,12 4,03 3,98 652 2,10 2,04 3,21 2,94 3,11 3,15 3,38 2,86 3,21 3,22 2,83 2,91 3,09 653 0,87 1,12 1,22 1,79 1,52 1,66 2,00 2,13 2,23 2,03 2,22 1,71 2,16 654 0,66 0,86 0,86 1,33 1,68 1,49 1,60 2,02 2,20 1,55 1,51 1,43 1,75 655 1,56 1,30 2,25 1,20 1,56 1,78 1,77 2,04 1,87 1,71 1,54 1,69 1,71 656 1,44 2,06 2,29 2,54 2,69 2,85 3,34 4,36 4,95 5,48 5,22 3,38 5,22 657 1,53 1,57 1,23 1,47 1,70 1,97 1,56 1,39 1,52 1,49 1,59 1,55 1,53 658 5,70 5,38 5,30 6,21 6,72 7,37 7,76 7,92 8,44 6,74 6,45 6,73 7,21 659 12,81 14,46 11,70 12,21 14,78 14,34 13,56 12,95 14,38 10,70 10,09 12,91 11,72 661 5,31 4,32 5,17 4,51 4,02 4,81 5,77 6,72 9,04 7,81 8,30 5,98 8,38 662 6,41 8,03 7,91 9,03 9,72 9,43 9,49 11,43 11,72 8,84 7,78 9,07 9,45
663 0,23 0,27 0,29 0,38 0,45 0,42 0,45 0,46 0,68 0,42 0,52 0,42 0,54
664 2,53 1,74 1,35 1,17 1,23 1,48 1,38 1,32 1,44 1,40 1,28 1,48 1,38 665 7,18 7,06 6,41 6,27 6,52 7,15 7,47 6,68 6,83 5,66 4,91 6,56 5,80 666 0,22 0,19 0,20 0,36 0,44 0,51 0,46 0,50 0,45 0,66 0,53 0,41 0,55 667 0,01 0,01 0,03 0,02 0,01 0,02 0,01 0,02 0,05 0,01 0,01 0,02 0,02 671 3,45 2,99 2,22 1,43 1,73 1,46 1,07 1,79 1,16 0,71 0,80 1,71 0,89 672 20,67 25,22 18,27 9,59 8,49 7,34 4,86 4,16 6,15 8,98 11,18 11,36 8,77 673 0,69 0,60 1,28 0,47 0,95 1,40 0,93 1,05 1,25 1,75 1,26 1,06 1,42 674 0,22 0,14 0,21 0,20 0,21 0,25 0,30 0,27 0,47 0,57 0,72 0,32 0,59 675 0,00 0,00 0,01 0,01 0,01 0,02 0,01 0,01 0,02 0,04 0,15 0,03 0,07 676 8,98 11,79 13,10 11,18 11,52 11,09 8,67 11,20 11,31 11,15 9,96 10,90 10,81 677 0,03 0,01 0,05 0,01 0,07 0,11 0,05 0,11 0,02 0,08 0,07 0,05 0,06 678 0,97 0,60 0,50 0,82 0,94 0,87 0,91 1,00 1,02 0,88 0,75 0,84 0,88 679 1,09 1,13 1,50 2,26 1,56 1,75 1,51 1,84 2,50 2,66 3,19 1,91 2,78 681 0,00 0,03 0,02 0,16 0,01 0,02 0,06 0,01 0,03 0,01 0,00 0,03 0,01 682 1,58 1,61 1,31 1,43 1,60 1,41 1,04 1,04 1,34 1,23 0,86 1,31 1,15
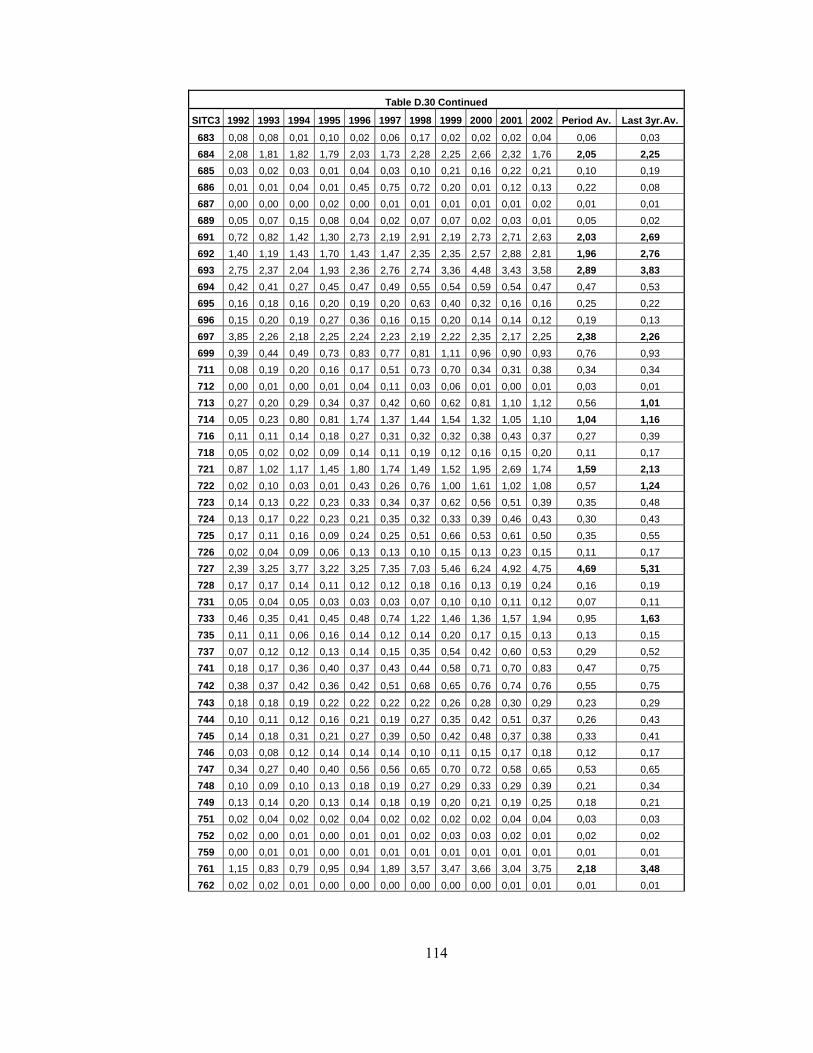
114
Table D.30 Continued
SITC3 1992 1993 1994 1995 1996 1997 1998 1999 2000 2001 2002 Period Av. Last 3yr.Av.683 0,08 0,08 0,01 0,10 0,02 0,06 0,17 0,02 0,02 0,02 0,04 0,06 0,03 684 2,08 1,81 1,82 1,79 2,03 1,73 2,28 2,25 2,66 2,32 1,76 2,05 2,25 685 0,03 0,02 0,03 0,01 0,04 0,03 0,10 0,21 0,16 0,22 0,21 0,10 0,19 686 0,01 0,01 0,04 0,01 0,45 0,75 0,72 0,20 0,01 0,12 0,13 0,22 0,08 687 0,00 0,00 0,00 0,02 0,00 0,01 0,01 0,01 0,01 0,01 0,02 0,01 0,01 689 0,05 0,07 0,15 0,08 0,04 0,02 0,07 0,07 0,02 0,03 0,01 0,05 0,02 691 0,72 0,82 1,42 1,30 2,73 2,19 2,91 2,19 2,73 2,71 2,63 2,03 2,69 692 1,40 1,19 1,43 1,70 1,43 1,47 2,35 2,35 2,57 2,88 2,81 1,96 2,76 693 2,75 2,37 2,04 1,93 2,36 2,76 2,74 3,36 4,48 3,43 3,58 2,89 3,83 694 0,42 0,41 0,27 0,45 0,47 0,49 0,55 0,54 0,59 0,54 0,47 0,47 0,53 695 0,16 0,18 0,16 0,20 0,19 0,20 0,63 0,40 0,32 0,16 0,16 0,25 0,22 696 0,15 0,20 0,19 0,27 0,36 0,16 0,15 0,20 0,14 0,14 0,12 0,19 0,13 697 3,85 2,26 2,18 2,25 2,24 2,23 2,19 2,22 2,35 2,17 2,25 2,38 2,26 699 0,39 0,44 0,49 0,73 0,83 0,77 0,81 1,11 0,96 0,90 0,93 0,76 0,93 711 0,08 0,19 0,20 0,16 0,17 0,51 0,73 0,70 0,34 0,31 0,38 0,34 0,34 712 0,00 0,01 0,00 0,01 0,04 0,11 0,03 0,06 0,01 0,00 0,01 0,03 0,01 713 0,27 0,20 0,29 0,34 0,37 0,42 0,60 0,62 0,81 1,10 1,12 0,56 1,01 714 0,05 0,23 0,80 0,81 1,74 1,37 1,44 1,54 1,32 1,05 1,10 1,04 1,16 716 0,11 0,11 0,14 0,18 0,27 0,31 0,32 0,32 0,38 0,43 0,37 0,27 0,39 718 0,05 0,02 0,02 0,09 0,14 0,11 0,19 0,12 0,16 0,15 0,20 0,11 0,17 721 0,87 1,02 1,17 1,45 1,80 1,74 1,49 1,52 1,95 2,69 1,74 1,59 2,13 722 0,02 0,10 0,03 0,01 0,43 0,26 0,76 1,00 1,61 1,02 1,08 0,57 1,24 723 0,14 0,13 0,22 0,23 0,33 0,34 0,37 0,62 0,56 0,51 0,39 0,35 0,48 724 0,13 0,17 0,22 0,23 0,21 0,35 0,32 0,33 0,39 0,46 0,43 0,30 0,43 725 0,17 0,11 0,16 0,09 0,24 0,25 0,51 0,66 0,53 0,61 0,50 0,35 0,55 726 0,02 0,04 0,09 0,06 0,13 0,13 0,10 0,15 0,13 0,23 0,15 0,11 0,17 727 2,39 3,25 3,77 3,22 3,25 7,35 7,03 5,46 6,24 4,92 4,75 4,69 5,31 728 0,17 0,17 0,14 0,11 0,12 0,12 0,18 0,16 0,13 0,19 0,24 0,16 0,19 731 0,05 0,04 0,05 0,03 0,03 0,03 0,07 0,10 0,10 0,11 0,12 0,07 0,11 733 0,46 0,35 0,41 0,45 0,48 0,74 1,22 1,46 1,36 1,57 1,94 0,95 1,63 735 0,11 0,11 0,06 0,16 0,14 0,12 0,14 0,20 0,17 0,15 0,13 0,13 0,15 737 0,07 0,12 0,12 0,13 0,14 0,15 0,35 0,54 0,42 0,60 0,53 0,29 0,52 741 0,18 0,17 0,36 0,40 0,37 0,43 0,44 0,58 0,71 0,70 0,83 0,47 0,75
742 0,38 0,37 0,42 0,36 0,42 0,51 0,68 0,65 0,76 0,74 0,76 0,55 0,75
743 0,18 0,18 0,19 0,22 0,22 0,22 0,22 0,26 0,28 0,30 0,29 0,23 0,29 744 0,10 0,11 0,12 0,16 0,21 0,19 0,27 0,35 0,42 0,51 0,37 0,26 0,43 745 0,14 0,18 0,31 0,21 0,27 0,39 0,50 0,42 0,48 0,37 0,38 0,33 0,41 746 0,03 0,08 0,12 0,14 0,14 0,14 0,10 0,11 0,15 0,17 0,18 0,12 0,17 747 0,34 0,27 0,40 0,40 0,56 0,56 0,65 0,70 0,72 0,58 0,65 0,53 0,65 748 0,10 0,09 0,10 0,13 0,18 0,19 0,27 0,29 0,33 0,29 0,39 0,21 0,34 749 0,13 0,14 0,20 0,13 0,14 0,18 0,19 0,20 0,21 0,19 0,25 0,18 0,21 751 0,02 0,04 0,02 0,02 0,04 0,02 0,02 0,02 0,02 0,04 0,04 0,03 0,03 752 0,02 0,00 0,01 0,00 0,01 0,01 0,02 0,03 0,03 0,02 0,01 0,02 0,02 759 0,00 0,01 0,01 0,00 0,01 0,01 0,01 0,01 0,01 0,01 0,01 0,01 0,01 761 1,15 0,83 0,79 0,95 0,94 1,89 3,57 3,47 3,66 3,04 3,75 2,18 3,48 762 0,02 0,02 0,01 0,00 0,00 0,00 0,00 0,00 0,00 0,01 0,01 0,01 0,01

115
Table D.30 Continued
SITC3 1992 1993 1994 1995 1996 1997 1998 1999 2000 2001 2002 Period Av. Last 3yr.Av.763 0,00 0,00 0,00 0,00 0,00 0,00 0,00 0,00 0,00 0,00 0,00 0,00 0,00 764 0,04 0,07 0,05 0,05 0,10 0,07 0,12 0,07 0,08 0,08 0,05 0,07 0,07 771 0,57 0,55 0,60 0,56 0,79 0,73 0,56 0,45 0,58 0,63 0,66 0,61 0,62 772 0,15 0,11 0,13 0,14 0,20 0,16 0,21 0,20 0,19 0,23 0,24 0,18 0,22 773 2,89 2,65 2,79 2,99 3,26 2,60 2,62 2,28 2,48 2,61 2,70 2,71 2,60 774 0,02 0,02 0,05 0,02 0,05 0,06 0,04 0,06 0,05 0,03 0,08 0,04 0,06 775 0,98 1,22 1,46 1,99 1,86 1,97 2,10 2,09 2,13 1,89 2,17 1,81 2,06 776 0,00 0,00 0,00 0,00 0,00 0,00 0,00 0,00 0,00 0,00 0,00 0,00 0,00 778 0,06 0,09 0,08 0,10 0,14 0,16 0,15 0,13 0,13 0,15 0,14 0,12 0,14 781 0,06 0,04 0,06 0,22 0,21 0,08 0,08 0,39 0,38 0,50 0,54 0,23 0,47 782 0,02 0,05 0,06 0,18 0,15 0,13 0,12 0,20 0,53 2,00 3,02 0,59 1,85 783 1,16 2,04 2,57 3,61 5,29 3,44 3,97 6,29 6,42 6,02 5,50 4,21 5,98 784 0,27 0,24 0,26 0,37 0,43 0,56 0,79 0,81 0,90 0,91 1,01 0,60 0,94 785 0,02 0,04 0,05 0,10 0,09 0,16 0,10 0,09 0,08 0,09 0,08 0,08 0,08 786 0,42 1,56 2,03 1,55 1,55 1,47 0,93 0,56 0,52 0,51 0,61 1,06 0,55 791 0,00 0,14 0,48 0,33 0,05 0,09 0,11 0,26 0,20 0,24 0,56 0,22 0,33 792 0,00 0,01 0,33 0,06 0,49 1,33 1,01 4,24 6,54 4,25 1,28 1,78 4,03 793 0,42 0,21 0,13 0,16 0,13 0,25 0,24 0,31 0,24 0,50 0,41 0,27 0,38 811 7,31 11,99 10,38 6,95 4,99 4,55 8,99 5,74 6,57 4,35 6,76 7,14 5,89 812 18,99 19,28 18,56 17,77 16,64 15,94 16,79 17,91 19,22 15,55 15,16 17,44 16,64 813 1,10 0,93 0,81 0,90 1,01 0,82 0,72 0,67 0,67 0,50 0,52 0,79 0,56 821 0,64 0,79 0,73 0,89 0,89 0,75 0,81 0,92 1,04 0,91 1,01 0,85 0,98 831 0,55 0,50 0,39 0,40 0,44 0,37 0,33 0,29 0,33 0,31 0,29 0,38 0,31 841 2,69 2,97 2,70 4,12 3,63 3,47 3,65 3,73 3,73 3,19 3,74 3,42 3,55 842 4,12 4,41 4,01 5,88 5,70 5,29 5,52 5,91 6,21 5,34 5,36 5,25 5,64 843 3,72 4,08 4,66 6,67 6,28 4,49 4,15 4,08 3,76 3,12 3,20 4,38 3,36 844 14,27 14,41 11,22 13,96 11,07 7,59 7,18 7,08 7,68 6,12 5,79 9,67 6,53 845 7,27 7,57 7,52 8,57 8,12 6,85 6,77 6,46 6,35 5,05 5,25 6,89 5,55 846 3,29 3,78 4,31 5,14 5,09 4,01 3,96 4,44 4,33 3,95 3,99 4,21 4,09 848 4,95 5,00 4,55 4,20 2,91 2,99 2,53 2,52 2,58 2,13 1,98 3,30 2,23 851 0,45 0,52 0,83 0,57 0,67 0,77 0,66 0,41 0,43 0,38 0,35 0,55 0,39 871 0,00 0,00 0,00 0,01 0,07 0,02 0,03 0,01 0,00 0,02 0,03 0,02 0,02 872 0,16 0,19 0,10 0,12 0,19 0,19 0,24 0,17 0,20 0,19 0,22 0,18 0,21 873 0,05 0,09 0,15 0,11 0,19 0,47 0,43 0,38 0,31 0,32 0,27 0,25 0,30 874 0,10 0,06 0,07 0,06 0,09 0,08 0,12 0,12 0,11 0,11 0,09 0,09 0,10 881 0,00 0,00 0,01 0,00 0,01 0,01 0,01 0,01 0,00 0,01 0,01 0,00 0,01
882 0,01 0,01 0,00 0,01 0,02 0,03 0,03 0,04 0,04 0,04 0,15 0,03 0,08
883 0,11 0,02 0,02 0,02 0,03 0,01 0,07 0,02 0,05 1,26 0,05 0,15 0,46 884 0,02 0,02 0,02 0,03 0,04 0,03 0,04 0,03 0,04 0,02 0,02 0,03 0,03 885 0,01 0,01 0,02 0,01 0,02 0,03 0,02 0,03 0,04 0,05 0,06 0,03 0,05 891 1,89 1,37 1,50 2,94 6,10 6,05 1,58 5,81 7,45 7,49 12,60 4,98 9,18 892 0,36 0,67 0,40 0,41 0,56 0,67 0,50 0,46 0,55 0,49 0,49 0,50 0,51 893 0,44 0,46 0,67 0,91 1,06 1,11 1,00 0,87 0,96 0,90 0,91 0,84 0,92 894 0,02 0,02 0,03 0,03 0,05 0,03 0,04 0,04 0,04 0,04 0,03 0,03 0,04 895 0,18 0,15 0,13 0,14 0,17 0,12 0,16 0,13 0,14 0,17 0,17 0,15 0,16 896 0,01 0,02 0,09 0,10 0,25 0,05 0,99 0,21 4,64 0,65 0,30 0,66 1,86
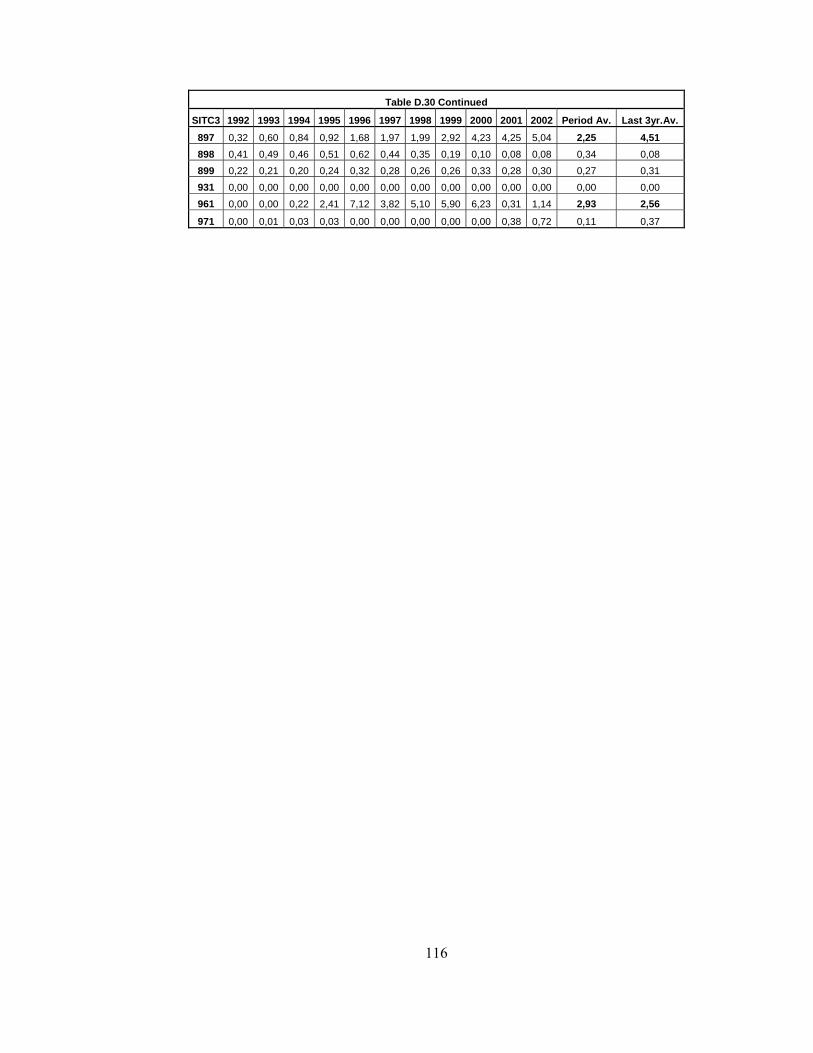
116
Table D.30 Continued
SITC3 1992 1993 1994 1995 1996 1997 1998 1999 2000 2001 2002 Period Av. Last 3yr.Av.897 0,32 0,60 0,84 0,92 1,68 1,97 1,99 2,92 4,23 4,25 5,04 2,25 4,51 898 0,41 0,49 0,46 0,51 0,62 0,44 0,35 0,19 0,10 0,08 0,08 0,34 0,08 899 0,22 0,21 0,20 0,24 0,32 0,28 0,26 0,26 0,33 0,28 0,30 0,27 0,31 931 0,00 0,00 0,00 0,00 0,00 0,00 0,00 0,00 0,00 0,00 0,00 0,00 0,00 961 0,00 0,00 0,22 2,41 7,12 3,82 5,10 5,90 6,23 0,31 1,14 2,93 2,56
971 0,00 0,01 0,03 0,03 0,00 0,00 0,00 0,00 0,00 0,38 0,72 0,11 0,37