the experimental and theoretical study of fines migration in porous media … · 2015-01-22 · the...
TRANSCRIPT

The Experimental and Theoretical Study of
Fines Migration in Porous Media under
Particle-rock Repulsion and Attraction
Kaiser Aji
A thesis submitted for the degree of Doctor of
Philosophy (PhD)
Australian School of Petroleum
Faculty of Engineering, Computer & Mathematical Sciences
The University of Adelaide
October 2014

i
Table of Contents
Abstract …………………………………………………………………………………...…iii
Statement of Originality …………………………………………………………………....vi
Acknowledgment …………………………………………………………………………...vii
Thesis by Publications ………………………………………………………………….....viii
Statement of Authors’ Contributions ………………………………………………………x
1 Contextual Statement ………………………………………………………………..1
1.1 Thesis Structure ……………………………………………………………….6
1.2 Relation between Publications and This Thesis ………………………………9
1.3 References …………………………………………………………………...14
2 Literature Review …………………………………………………………………..16
2.1 Introduction ………………………………………………………………….16
2.2 Particle Migration in Porous Media ……….………………………………...18
2.2.1 Chemical Mechanism ………………………………………………………..19
2.2.2 Physical Mechanism …………………………………………………………20
2.3 Permeability Reduction due to Size Exclusion ……………………………...21
2.4 Deep Bed Filtration Theory ………………………………………………….24
2.5 Methodology of Experimental Study………………………………..……….27
2.5.1 Experimental Study under the Particle-Rock Repulsion during Suspension
Flow .................................................................................................................28
2.5.2 Determining the Pore Throat Size Distribution …………………………………30
2.6 References …………………………………………………………………...31
3 Particle Transport in Porous Media under Particle-Rock Repulsion:
Experimental and Theoretical Study ……………………………………………...34
3.1 Transport and Straining of Suspension in Porous Media: Experimental and
Theoretical Study ………………………………………………………..…..35

ii
3.2 Colloidal Flow in Aquifers during Produced Water Disposal: Experimental
and Mathematical Modelling ………………………………………….……..41
3.3 Effect of Nanoparticle Transport and Retention in Oilfield Rocks on the
Efficiency of Different Nanotechnologies in Oil Industry …………………..67
3.4 Study of Particle Straining Effect on Produced Water Management and
Injectivity Enhancement ……………………………………………………..83
3.5 Colloidal-suspension Flow in Rocks: A New Mathematical Model, Laboratory
Study, IOR …………………………………………………………………...96
4 Particle Transport in Porous Media under Particle-Rock Attraction:
Experimental and Theoretical Study ……………………………………….....…115
4.1 Particle Deposition and Mobilization during Deep Bed Filtration in Oilfield
……………………………………………………………………………………....116
4.2 Experimental Study of Colloidal Flow in Porous Media at High Velocities
……………………………………………………………………………………....130
4.3 High Velocity Colloidal Flow in Porous Media: Experimental Study and
Modelling ……………………………………………………...…………..139
5 Critical Analysis of Uncertainties during the Deep Bed Filtration …………....179
5.1 Size Exclusion Deep Bed Filtration: Experimental and Modelling
Uncertainties ………………………………………………………………..180
5.2 Critical Analysis of Uncertainties during Particle Filtration ……………….194
6 Summary and Conclusion ……………………………………..…………………204

iii
Abstract
This is a PhD thesis by publication. The essence of the research performed has been
published in one book chapter, five journal papers and four SPE papers.
The thesis contains laboratory study of deep bed filtration in porous media
accounting for particle migration, mobilization and straining for two particular cases:
straining-dominant particle capture and filtering under high flow velocities.
Advanced challenge core flood test methodology to determine pore throat size
distribution under unfavorable particle retention conditions is designed and developed in
the thesis. It includes significant advance in design of the laboratory set-up if compared with
previous version, development of the test procedures to provide the particle-rock repulsion
and measure the post-mortem retention profile, analysis of accuracy and uncertainties of the
experiments.
In more details, the improvements of the laboratory set-up and procedures include
sieving of glass beads in the ultrasonic bath with consequent reduction of the sieving time
and more reproducible grain size distribution, application of the dual syringe pump system
with continuous injection of suspension and pulseless delivery of particles in the porous
medium, measurements of the retention profile after the test by cutting up the porous
column in 4-6 pieces and dispersing the material in water. The above methods are applicable
to continuous as well as to a pulse type particle injection. Latex particle have been injected
into packed glass beads or borosilicate filters at different concentrations, velocities, pH, and
salinities. However, main varying parameters are size distributions of injected latex particles
and compacted glass beads. The tests show that the pore throat size distributions can be
recovered from the challenge tests.

iv
Another development of the thesis includes deep bed filtration investigation under
high flow velocities under favorable particle retention conditions. It includes the design of
laboratory set-up, development of the experimental methodology to reveal the hysteretic
phenomena of the particle attachment and detachment under high velocities, treatment of the
data using the Forchheimer law of high velocity flow in rocks and formulating the modified
Forchheimer law under the conditions of formation damage, development of the
methodology for estimates of the accuracy and uncertainties of the performed laboratory
high-velocity tests.
In more details, high velocity suspension flow in engineered porous medium was
studied at various volumetric flow rates and conditions favorable for particle attachment
under the occurrence of the phenomena of particle deposition, mobilization, migration and
entrainment. The maximum retention function (the critical particle retention concentration)
derived is a quadratic function of flow velocity. A strong particle surface attraction as
indicated by calculation of DLVO energy potential, translates to almost a quarter of filter
surface coverage by the attached particles. The particles can’t be removed by an increase of
solution velocity only due to strong particle-matrix attraction. The removal of approximately
17.5 % of the attached particles was achieved only after the reduction of salinity and
increase in pH of solution at maximum velocity.
The work includes the development of the Forchheimer model for the case of
particle retention, i.e. the advanced formula for inertial coefficient versus retained
concentration is proposed. Application of the Forchheimer law to the laboratory data results
in the formation damage coefficient dependency of the critical retained concentration and
the inverse dimensionless function of velocity. The inertial coefficient showed similar
behavior at low velocities, although it remained almost constant at low surface coverage.
Partial formation of the external cake on the inlet surface of the filter was observed by a

v
post-experimental examination using an optical microscope and via an abrupt increase in the
formation damage and inertial coefficients during particle deposition at lower velocities.
The partial cake coverage is the indication of the continuation of deep bed filtration even at
high surface coverage which is supported by high filtration coefficient values at lower
velocities. Results from the theoretical micro scale model based on the torque balance
exerted on attached fine particles agree well with the experimental critical retention
concentration data within combined standard uncertainties in the entire range of velocities.
It allows proposing the model with modified Forchheimer flow equation and micro scale
based maximum retention function for high velocity colloidal flows in porous media.

vi
Statement of Originality
This work contains no material which has been accepted for the award of any other degree
or diploma in any university or other tertiary institution and, to the best of my knowledge
and belief, contains no material previously published by or written by another person,
except where due reference has been made in the text.
I give consent to this copy of my thesis, when deposited in the University Library, being
made available for loan and photocopying, subject to the provisions of the Copyright Act
1968.
The author acknowledges that copyright of published works contained within this thesis (as
listed below) resides with the copyright holder/s of those works.
I also give permission for the digital version of my thesis to be made available on the web,
via the University’s digital research repository, the library catalogue, the Australian Digital
Theses program (ADTP) and also through web search engines, unless permission has been
granted by the university to restrict access for a period of time.
Signed……………………………………..
Date………………………………………..

vii
Acknowledgment
First and foremost I offer my sincerest gratitude to my supervisor, Professor Pavel
Bedrikovetsky, who has supported me throughout my thesis with his patience and
knowledge whilst allowing me to work in my own way. I am very appreciative of his
generosity with his time, advice, and contribution. His guidance helped me in the entire time
of researching and writing of this thesis.
Besides my advisor, I would like to thank Dr. Alexander Badalyan and my Co-
Supervisor Dr. Themis Carageorgos for her support, reviews, comments, criticisms and
advices during my research. They also aided my various laboratorial and experimental
works during the development of my research.
My sincere thank also goes to Dr. Zhenjiang You, for helping me with the theoretical
part of my research.
In my daily work I have been blessed with a friendly and cheerful group of fellow
students at Australian School of Petroleum. Thanks to all for welcoming and helping. I
deeply appreciate ASP for providing all the equipments I needed to accomplish my thesis.
Finally, I thank my parents and family members for supporting me throughout all my
studies at University. They have always provided unwavering love and encouragement.

viii
Thesis by Publications
Book Chapter
1. Aji K., Badalyan A., Carageorgos T., Zeinijahromi A., Bedrikovetsky P. High Velocity
Colloidal Flow in Porous Media: Experimental study and modeling, in: Focus on
Porous Media Research, Ed. by Zhao C, 2013, Nova Science Publishers, NY.
Peer Reviewed Publications
2. Aji K. Particle deposition and mobilization during deep bed filtration in oil field.
International Journal of Oil, Gas and Coal Technology. Accepted on 31.06. 2013.
(http://www.inderscience.com/info/ingeneral/forthcoming.php?jcode=ijgct)
3. Badalyan A., You Z, Aji K., Bedrikovetsky P., Carageorgos T., Zeinijahromi A. Size
exclusion deep bed filtration: experimental and modelling uncertainties. Review of
Scientific Instruments. V. 85, 015111.2014.
4. Aji K. Experimental study of colloidal flow in porous media at high velocities. Asia-
Pacific Journal of Chemical Engineering. DOI: 10.1002/apj.1782.2013.
5. Aji K., You Z., Badalyan A. Transport and straining of suspensions in porous media:
experimental and theoretical study. Thermal Science. 2012, 16(5), 1444-1448.
6. Badalyan A., Carageorgos T., Bedrikovetsky P., You Z., Zeinijahromi A., Aji K.
Critical analysis of uncertainties during particle filtration. Review of Scientific
Instruments, 83, 095106/1-9. 2012.
SPE (Society of Petroleum Engineering) Papers
7. McLindin C., Saha A., Le K., Aji K., You Z., Badalyan A., Bedrikovetsky P. Colloidal
flow in aquifers during produced water disposal: experimental and mathematical

ix
modelling. SPE-153502-MS. SPE Middle East Health, Safety, Security, and
Environmental Conference, 2-4 April 2012, Abu Dhabi, UAE. DOI: 10.2118/153502-
MS.
8. You Z., Aji K., Badalyan A., Bedrikovetsky P. Effect of nanoparticle transport and
retention in oilfield rocks on the efficiency of different nanotechnologies in oil industry.
SPE-157097-MS. SPE International Oilfield Nanotechnology Conference, 12-14 June
2012, Noordwijk, The Netherlands. DOI: 10.2118/157097-MS. ISBN: 978-1-61399-
206-7.
9. Aji K., You Z., Badalyan A., Bedrikovetsky P. Study of particle straining effect on
produced water management and injectivity enhancement. SPE-157399-MS. SPE
International Production and Operations Conference & Exhibition, 14-16 May 2012,
Doha, Qatar. DOI: 10.2118/157399-MS. ISBN: 978-1-61399-201-2.
10. Aji K., McLindin C., Saha A., Le K., You Z., Badalyan A., Bedrikovetsky P.
Colloidal-suspension flow in rocks: a new mathematical model, laboratory study, IOR.
SPE-152025-MS, The 2012 SPE EOR Conference at Oil and Gas West Asia, 16-18
April 2012, Muscat, Oman. DOI: 10.2118/152025-MS. ISBN: 978-1-61399-199-2.

x
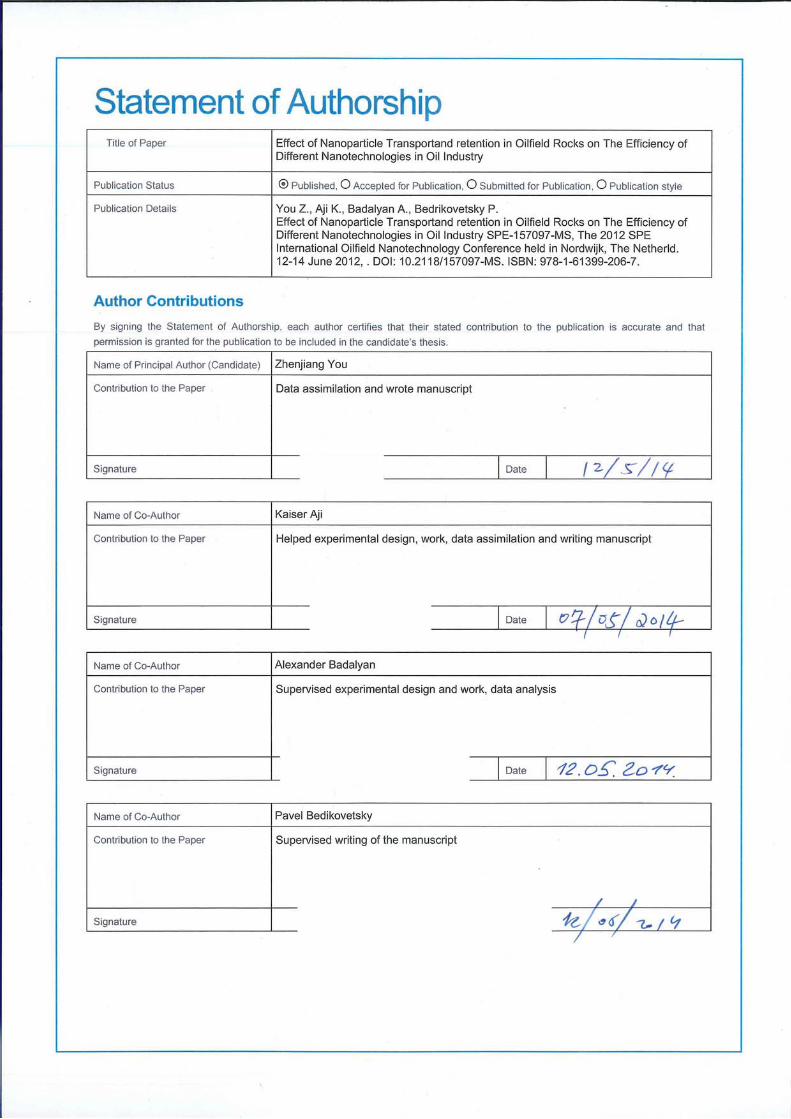
Statement of Authors’ Contributions
This thesis comprises a portfolio of ten publications that have been published, accepted
for publication and/or submitted for publications in accordance with ‘Academic Program
Rules and Specifications 2012’. All journals to which the papers have been submitted are
indexed in the ‘ERA 2012 Journal List’ database. The research summarized in the papers
that constitute this thesis was undertaken within ‘Formation Damage and EOR Research
Group’ at Australian School of Petroleum and with other universities and industry
collaborators. Hence all the papers presented herein are co-authored and detail statements
of relative contributions are endorsed by the co-authors.


1
1. Contextual Statement
In this Section, the main achievements of laboratory studies of deep bed filtration
are summarized; the absence of the topics aimed in the thesis in the contemporary
literature is stated.
Fines or fine particles (colloids) are small particles that exist in natural porous
media. The migration of particles in porous media is a challenging problem for both
scientific research and industrial applications, especially in the area of petroleum
engineering. During the flow of fluids through a porous medium, fine particles attached
to pore surfaces are released under certain sets of condition (Khilar and Fogler, 1998).
Fines mobilization in porous media is an important issue as it can lead to drastic
changes in the permeability of oil reservoirs (Cerda, 1987). Fines transport and
deposition have been considered as significant mechanisms causing formation damage
(Mueeke, 1979).
Permeability is an important property of porous media and has been the subject of
many studies by engineers and geologists (Mungan, 1965). Many of these studies are
concerned with formation damage, i.e., reduction in permeability, resulting from rock
contact with fresh water, which is attributed to migration of particles. This reduction in
permeability has often been attributed to mobilization, migration, and plugging of fine
particles in the rock pore spaces (Gabriel and Inamdar, 1983).
The flow of colloidal suspensions in natural rocks is an important process in many
industrial applications ranging from particle filtration to fines migration in oil and gas
reservoirs (Ochi and Vernoux, 1998; Moghadasi et al., 2004; Civan, 2007; Ding, 2010).
Reservoir formation damage occurs during the invasion of drilling or completion fluid,

2
raw and produced water injection (Nabzar et al., 1996; Pang and Sharma, 1997). Fines
migration and retention near to the injection and production wells (Khilar and Fogler,
1998; Civan, 2010; Takahashi and Kovscek, 2010) are also reported to occur. Through
reliable modeling of colloidal suspension flow and consequent particle retention in
porous media and its permeability reduction, it is possible to reduce the formation
damage for the oil and gas industry, or design and plan different improved oil recovery
(IOR) technologies where these colloidal particles are used to increase sweep efficiency
during waterflooding.
Suspended particles can be captured in porous media by electrostatic attraction,
sorption, bridging, diffusion, gravitational segregation etc (Nabzar et al., 1996; Khilar
and Fogler, 1998; Torkzaban et al., 2012). Intensity of these particle capture mechanism
depends on surface chemistry of particles and porous media, ionic strength of aqueous
media, colloid and pore size distributions, chemical heterogeneity of pore space, and
concentration of colloids and hydrodynamics of a flowing suspension (Bradford et al.,
2011).
There are two distinct mechanisms that lead to the particle capture during filtration:
physicochemical and geometrical. The former is controlled by physicochemical
characteristics due to hydrodynamic, electrostatic and chemical forces which result in
particle attachment and detachment in porous media. The most commonly used
approach for physicochemical filtration is the classical colloidal-suspension deep bed
filtration theory (Herzig et al., 1970; Payatakes et al., 1974), which contains two
governing differential equations: one for particle population balance, and the other for
particle capture kinetics. However, the classical theory does not provide accurate
predictions of particle propagation and retention when the effect of capture by straining
is significant.

3
Particle straining is a geometrical mechanism. When a particle arrives at a pore
throat with a smaller size, the particle is not able to enter this small pore and, thus, it is
physically excluded from downstream suspension. Despite seemingly simple straining
concept – the particle is captured if its size is smaller than the pore size – this
phenomenon is still not well understood and robust models accounting for particle
straining mechanism are not available in the literature.
Another aim of this thesis is to observe the process of high velocity particle
deposition onto an engineered porous medium with subsequent particle detachment via
alteration of fluid velocity, pH and ionic strength of suspension.
Numerous works investigated colloidal transport on micro scale (Payatakes et al.,
1974). These includes population balance models (Sharma and Yortsos, 1987;
Bedrikovetsky, 2008; Chalk et al., 2012; You et al., 2013), random walk equations
(Cortis et al., 2006; Yuan et al., 2010; Yuan et al., 2012; Yuan et al., 2013) and direct
pore scale simulation (Bradford et al., 2009). The population balance and random walk
models, as well as, the large scale phenomenological models use the detachment rate
equation with an empirical kinetics coefficient and do not account for forces, exerting
on a single particle.
Asymptotical stabilisation of the retained concentration and permeability with time
approaching to infinity is the common feature of mathematical models considering
proportionality between particle detachment rate and the following factors affecting
particle mobilisation such as drag force, difference between equilibrium and current
velocities, difference between the equilibrium and current suspension concentrations
(Civan, 2010; Massoudieh and Gynn, 2010). On the contrary, particles show immediate
mobilisation as the result of a sharp decrease in ionic strength (Khilar and Fogler, 1998)

4
and abrupt increase in flowrate (Ochi and Vernoux, 1998) which translates to immediate
permeability decline.
Mobilisation of a particle retained on the internal filter cake occurs when it is not in
the mechanical equilibrium (Bergendahl and Grasso, 2000; Civan, 2007; Bradford et al.,
2011). Some models consider mechanical equilibrium of a retained particle through a
balance between the drag force and the friction force by introduction of an empirical
Coulomb coefficient (Civan, 2007). Other models consider the balance of all moments
exerted by forces (Freitas and Sharma 2001; Bradford et al., 2011).
A recently developed deep bed filtration model with a migrating layer of the fine
particles attached in the secondary energy minimum (Yuan et al., 2010) also does not
consider the forces acting on the retained particles.
The above analysis of contemporary literature shows the lack of experimental
studies of size exclusion particle capture under unfavourable attachment. It also shows
that experimental studies of high velocity colloidal suspension flows in porous media,
which are so important for prediction of well behaviour in petroleum and environmental
engineering haven’t been performed. The above defines two main aims of the thesis:
laboratory studies of size exclusion deep bed filtration under the particle-rock repulsion
and of filtration under high flow velocities.
In the current thesis, new experimental methodology for size exclusion deep bed
filtration has been developed, including the significant improvement of the set-up if
compared with previous studies, development of laboratory procedures including post-
flow retention profile measurements and detailed analysis of uncertainties and accuracy
of laboratory measurements. The important co-lateral result is the validation of the
stochastic micro-model for deep bed filtration of suspension in porous media and
straining under size exclusion capture mechanism. It is validated by laboratory tests on

5
suspension flow in engineered media. Pore size distribution and particle capture
mechanisms in porous media are investigated (Papers 2, 3, 5-10).
In the thesis the formation damage laboratory study of suspension flow under high
velocity is performed, the laboratory test on sequential particle injections at piece-wise
increasing velocities is designed, followed by injection of particle-free water at
increasing velocity, allows for full characterization of the colloidal flow system with
particles attachment and detachment at high velocities. The experimental results with
model validation are presented in a later part of the thesis. Forchheimer equation
(quadratic law of flow in porous media at high velocities) is fulfilled for porous media
with attached particles with high accuracy. The values of the maximum retention
function for high velocity flows, as calculated from the torque balance conditions on the
pore scale and as obtained from laboratory measurements are in a good agreement. The
decrease of absolute permeability during high velocity particle injection fulfils the linear
retention concentration dependency of normalised reciprocal to permeability resulting in
a common value for formation damage coefficient. The dependency cannot be
prolonged for high values of the retained concentration due to formation of external
filter cake affecting deep bed filtration. The problem of fines migration towards
production well contains strained concentration dependencies for permeability, inertia
coefficient, and maximum attached concentration and filtration coefficient. The fines
attachment does not occur under the assumption of incompressible flow in the zone of
fines lifting, so the filtration coefficient does not enter the system of governing
equations. The fines attachment does occur under the assumption of incompressible
flow in remote zone of under saturated initial attached fines concentration (Papers 1 and
4).

6
1.1 Thesis Structure
This is a PhD thesis by publications. Ten papers are included in the thesis, of which one
is a book chapter, five papers have been published in peer reviewed journals and four
papers have been published by SPE. The PhD student is not the first author in three
above mentioned papers. However, due to his significant contribution to the work, these
papers are included in this thesis.
Paper Chapter Title of the paper Status
5 Chapter 3 Transport and straining of suspensions in porous media:
experimental and theoretical study Published
7 Chapter 3 Colloid flow in aquifers during produced water disposal:
experimental and mathematical modelling Published
8 Chapter 3
Effect of nanoparticle transport and retention in oilfield
rocks on the efficiency of different nanotechnologies in oil
industry
Published
9 Chapter 3 Study of particle straining effect on produced water
management and injectivity enhancement Published
10 Chapter 3 Colloidal-suspension flow in rocks: a new mathematical
model, laboratory study, IOR Published
1 Chapter 4 High velocity colloidal flow in porous media: experimental
study and modelling Published
2 Chapter 4 Particle deposition and mobilization during deep bed
filtration in oilfield Accepted
4 Chapter 4 Experimental study of colloidal flow in porous media at
high velocities Published
3 Chapter 5 Size exclusion deep bed filtration: experimental and
modelling uncertainties Published
6 Chapter 5 Critical analysis of uncertainties during particle filtration Published
The thesis body is formed by five chapters. The first Chapter contains the
contextual statement that the research aimed by the submitted thesis is not available in
the contemporary literature. Chapter two presents the detailed literature review on

7
laboratory investigation of deep bed filtration, particularly with straining domination
and at high flow velocities, exhibiting the lack of studies on the two above mentioned
subjects and formulating the aims of the research presented. Chapters 3, 4 and 5 are
novel original chapters of the thesis. The third Chapter presents laboratory study of size
exclusion dominant deep bed filtration under unfavorable attaching conditions. Chapter
four contains investigation of deep bed filtration under high flow velocities. The fifth
Chapter exhibits the analysis of uncertainties and accuracy of the above laboratory
study. The main statements of scientific novelty presented in Chapter six conclude the
thesis.
In Chapter one, the brief summary of the analysis of the contemporary literature
show the importance of size exclusion and high velocity deep bed filtration in porous
media, from one hand side, and the lack of experimental studies in these areas. It allows
formulating two main aims of the thesis, i.e. deep investigation of these areas by
laboratory experiments. The main contextual statement in Chapter one is the achieving
of the formulated goal of the PhD study.
The second Chapter presents the literature review of experimental and theoretical
works performed to investigate suspension transport under net repulsion condition to
provide the straining dominant deep bed filtration. The particle-rock repulsion is the
main condition for the size exclusion dominant suspension colloidal transport in porous
media. The review contains physics and chemical mechanisms of particle capture, the
resulting permeability reduction. The analytical models for deep bed filtration of
suspension in porous media and straining under size exclusion capture mechanism are
analyzed. It is highlighted that there is no any laboratory experimental study of
suspended colloidal flow at high velocities.

8
The third Chapter contains original research on straining dominant particle capture
in porous media. The results have been published in papers 2, 5, 7-10. A new laboratory
set-up that highly develops previous set-ups on suspended colloidal flows under rock-
particle repulsion is designed. DLVO calculations assure electrostatic repulsion between
particles and glass beads. The particle-rock repulsion achieved under the laboratory test
conditions provides with the domination of particle straining capture. An important
novel element of the laboratory methodology is a post-flow analysis of retention profiles
by extraction of the core sections into solvent, separation of captured particles and their
counting. A new formulation for experimental study methodology in engineered porous
media which allows excluding other mechanisms of particle retention except straining
was validated by comparison between the laboratory data and mathematical modelling.
The presented laboratory study is applied for solution of the important industrial
problem of determining pore throat size distribution from challenge testing. The routine
challenge method for determining pore throat size distribution has been modified and
improved. Several successfully verified tests on calculating the pore throat size
distribution for engineered porous columns have been presented in the published papers,
indicating the method applicability in the industry.
The fourth Chapter contains high velocity colloidal flow in porous media.
Deposition of colloidal particle onto an engineered porous medium (borosilicate filter)
has been studied at high suspension velocities at conditions favorable for particle
attachment. In this part, experimental work is carried out in condition of particle rock
attraction. The size exclusion, as mechanism for particle straining, was absent due to
low value of jamming ratio (ratio between particle diameter and mean pore size). The
designed experimental test on sequential particle injections at step-wise increasing
velocities, followed by injection of particle free water at increasing velocity, used for

9
full characterization of the colloidal flow system with particle attachment and
detachment at high velocities. Application of Forchheimer equation to investigate the
critical retention concentration and permeability damage in high velocity is presented in
this Chapter too. Good match between high velocity colloidal flow and the modified
Forchheimer equation is observed, validating the proposed expression. The results must
be applied for evaluation of formation damage and skin factor in high rate oil and gas
wells.
In chapter five, critical analysis of uncertainties during deep bed filtration has been
performed. A detailed uncertainty analysis, associated with carboxyl modified latex
particle capture in glass bead formed porous media, enabled verification of the two
theoretical models for prediction of particle retention due to size exclusion. In addition,
a systematic analysis of experimental and modeling uncertainties associated with
permeability measurement during colloidal particle attachment to engineered porous
medium is investigated. The results are applicable in wide range of laboratory studies of
flow in porous media.
1.2 Relation between Publications and This Thesis
The first aim of the thesis – laboratory study of size exclusion dominated deep bed
filtration is presented in Chapter 3 and in publications 5, 7-10.
In the paper “Transport and Straining of Suspensions in Porous Media:
Experimental and Theoretical Study”, experimental set-up and injection sequence are
described. The DLVO calculations of particle-rock electrostatic interactions show that
the repulsion takes place under low salinities and high pH applied in the tests. The
results from the newly designed experimental work were compared with the data of

10
analytical modelling; finally, the analytical model for size exclusion dominant deep bed
filtration was validated.
In more details, the experimental procedures are described in “Colloid Flow in
Aquifers during Produced Water Disposal: Experimental and Mathematical Modelling”
along with the final conclusions about feasibility of determining the pore size
distribution curves from the challenge testing data. Not only good matching of
laboratory data was achieved by population balance model, but also good quality
prediction of the model with tuned parameters was demonstrated.
The difference between deep bed filtration with particle straining and attachment is
discussed in “Effect of Nanoparticle Transport and Retention in Oilfield Rocks on the
Efficiency of Different Nanotechnologies in Oil Industry”. Here the term “nanoflow”
corresponds to porous materials with reference pore size of nano meters. Size exclusion
can affect suspension flows only in extremely low permeability formations, like
unconventional reservoirs. The paper emphasizes importance of size exclusion even for
low values of jamming ratio due to complex forms of pores and particles, where small
particle can wedge in front of asperity or thin bund between two grains.
Size exclusion capture of injected fluid can highly affect well injectivity, as
investigated in “Study of Particle Straining Effect on Produced Water Management and
Injectivity Enhancement”. The paper is related to the experimental set-up and
laboratorial study for repulsion condition of the background solution (the solution that
being mixed with colloids forms the injecting suspension). It contains a simplified
geometric model of parallel tubes intercalated by the mixing chambers to form the
porous media under consideration. The paper explains a new model for particle
straining dominated by particle capture, accounting for the porous space accessibility
and fractional flow in the inlet and effluent boundary conditions, as well as in the

11
expression of the particle rate. The laboratory methodology and set-up are applied for
verification of the model by matching and predictive modelling.
The application of the designed straining-dominant suspension transport in porous
media to validation of the population balance mathematical model is presented in the
work “Colloidal-Suspension Flow in Rocks: a New Mathematical Model, Laboratory
Study, IOR”.
The above papers encompass the newly developed topic of experimental study of
straining dominant suspension colloidal flows in porous media, including a set-up with
two parallel syringe pumps providing the continuity of suspension injection, laboratory
methodology with procedures of sieving using ultra-sonic bath and column cutting with
retained particles separation and suspension with the following particle counting. So far,
two main applications published are determination of the rock pore throat size
distribution from the challenge tests, and validation of the population balance model
from the breakthrough and retained concentrations.
The second aim of the thesis – laboratory study of high velocity deep bed filtration
is presented in Chapter 4 and Publications 1, 2 and 4.
The paper “Particle Deposition and Mobilization during Deep Bed Filtration in
Oilfield” explains the experimental process of high velocity particle deposition onto an
engineered porous medium, with subsequent particle detachment via alteration of fluid
velocity, pH and ionic strength of suspension. In this paper, the maximum retention
concentration function in the engineering porous medium is determined along with
formation damage and inertia coefficients, and the modified particle detachment model
is validated by the comparison between the experimental data and the model prediction.
Experimental investigation of high velocity colloidal suspension flow for particle
retention and formation damage is contained in the next paper “Experimental Study of

12
Colloidal Flow in Porous Media at High Velocities”. In this paper, experimental set up
is described in all details highlighting the new elements, particle attachment and
detachment was explained by DLVO theory for electrostatic interactions. The particle
deposition at various flow velocities has been introduced into the Forchheimer equation
for flow in a porous medium. The data also show a good agreement between the model
and the experimental data.
The book Chapter “High Velocity Colloidal Flow in Porous Media: Experimental
Study and Modeling” is a combination of the previous two papers which focus on
experimental studies of high velocity deep bed filtration. The Chapter has a form of the
close theory, with description of physics phenomena, explanation of laboratory
procedures, introduction of a new mathematical model and its verification by laboratory
study. The paper is concluded by formulating the mathematical model for reliable
prediction of wells behavior in oil, gas and aquifer reservoirs during high velocity flow
of suspensions. It contains also the critics to the classical filtration theory and
formulates the need for modifications. In this paper, the new torque balance model for
particle capture in porous media is introduced for high velocities, followed by a
laboratory tests for the model validation. The reported experiments in the paper
investigate the effect of velocity alternation on particle retention concentration and the
consequent formation damage.
The above papers present a hydrodynamic theory for high velocity suspension-
colloidal flows in porous media accounting for inertia effects and their interference with
the induced formation damage. The theory includes description of physics phenomena
of the increase of not only hydraulic resistance but also the inertial resistivity during
particle attachment at high velocities, a new methodology of laboratory studies to reveal
hysteretic behavior during loading and unloading of the system and validation of the

13
generalized Forchheimer law by laboratory experiments. The method developed can be
applied for prediction of formation damage in high rate gas and oil wells in order to
choose the optimal rates and wellbore pressures and mitigate the damage.
The above described laboratory tests have been analyzed for uncertainties and
accuracy, yielding the increase of the quality of performed measurements. However, the
developed methods for the analysis of uncertainties and accuracy can be applied in wide
variety of laboratory studies of flow in porous media. Therefore, the results are joined in
a separate Chapter 5.
The paper “Size Exclusion Deep Bed Filtration: Experimental and Modeling
Uncertainties” analyses in details the uncertainties associated with particle capture due
to size exclusion. From our knowledge, this is the first time that the analysis of
uncertainties for experimental suspension colloidal flow in rocks has been performed.
In this paper, the uncertainties of experimental results have been analyzed
accounting for particle transport, capture and measurements of inlet and effluent
concentrations. The general expression for uncertainties in measurements of inlet and
effluent concentrations is proposed. Finally, a comparison between normalized
suspended particle concentrations, obtained by the related models and respective
experimental data, is presented with the explanation of the observed deviations.
The paper “Critical Analysis of Uncertainties during Particle Filtration” aims the
systematic analysis of experimental and modeling uncertainties associated with
permeability measurements during colloidal particle attachment to an engineered porous
medium. Particle attachment during colloidal suspension injection at different velocities
was monitored in the experiments. In the paper, the law of propagation of uncertainties
was applied for calculation of uncertainties in parameters of Darcy equation, and
parameters having the greatest effect on uncertainties in permeability and modeling
14
results were identified. Recommendations for reducing modeling uncertainties were
given in the paper.
The results of the fifth Chapter can be used in laboratory studies of any flows in
porous media, including petroleum, environmental and chemical engineering
applications.
Finally, the above mentioned 10 journal papers and selected SPE papers present a
new technology for understanding the mechanism of formation damage during
suspension flow in porous media under the condition of particle rock repulsion and
attraction.
1.3 References
Bedrikovetsky P., 2008. Upscaling of stochastic micro model for suspension transport in porous
media, Transp Porous Med Vol 75, 335–369
Bergendahl, J. and Grasso, D., 2000. Prediction of Colloid Detachment in a Model Porous
Media: Hydrodynamics. J. Chemical Engineering Science 55 (9): 1523-1532
Bradford, S., H. Kim., B. Haznedaroglu., S. Torkzaban., S. Walker., 2009. "Coupled factors
influencing concentration-dependent colloid transport and retention in saturated porous
media." Environmental Science and Technology 43(18): 6996-7002
Bradford, S.A., Torkzaban, S. and Simunek, J., 2011. Modeling Colloid Transport and
Retention in Saturated Porous Media under Unfavorable Attachment Conditions. Water
Resour. Res. 47 (10): W10503
Cerda C.M., 1987. Mobilization of Kaolinite Fines in Porous Media, Colloids and Surfaces Vol
27, 219-241
Chalk, P., N. Gooding., S. Hutten., Z. You., P. Bedrikovetsky., 2012. "Pore size distribution
from challenge coreflood testing by colloidal flow." Chemical Engineering Research
and Design 90(1): 63-77
Civan, F., 2007. Reservoir Formation Damage: Fundamentals, Modeling, Assessment, and
Mitigation. Burlington: Gulf Professional Publishing, Elsevier.
Civan, F., 2010. Non-Isothermal Permeability Impairment by Fines Migration and Deposition in
Porous Media Including Dispersive Transport. Transport in Porous Media 85 (1): 233-
258
Cortis, A., T. Harter., L. Hou., E. Atwill., A. Packman and P. Green., 2006. "Transport of
cryptosporidium parvum in porous media: long-term elution experiments and
continuous time random walk filtration modeling." Water Resources Research 42(12):
W12S13
Ding, D.Y. 2010. Modelling formation damage for flow simulations at reservoir scale. SPE J 15
(3): 737-750
Freitas, A. and M. Sharma 2001. "Detachment of particles from surfaces: an AFM study."
Journal of Colloid and Interface Science 233(1): 73-82.
Gabriel, G.A and Inamdar, G.R., An Experimental Investigation of Fines Migration in Porous
Media. Journal of Society of Petroleum (SPE 12168)., 1983, 1– 12

15
Herzig, J.P., Leclerc, D.M. and Goff, P.L., 1970. Flow of Suspensions through Porous Media—
Application to Deep Filtration. Industrial and Engineering Chemistry 62: 8-35
Khilar, K. and Fogler, H., 1998. Migrations of Fines in Porous Media.
Dordrecht/London/Boston: Kluwer Academic Publishers.
Massoudieh, A. and T. R. Gynn 2010. Colloid-facilitated contaminant transport in unsaturated
porous media. Modelling of Pollutants in Complex Environmental Systems. G.
Hanrahan. Glendale, USA, ILM Publications. Vol II: 263-292
Moghadasi, J., Müller-Steinhagen, H., Jamialahmadi, M. and Sharif, A. 2004. Theoretical and
experimental study of particle movement and deposition in porous media during water
injection. J Petrol Sci Eng 43: 163-181
Mueeke,T.W., Formation Fines and Factors Controlling Their Movement in Porous Media. J.
Pet. Tec., 1979, Vol 31, 144-150
Mungan, N., 1965. Permeability Reduction through Changes in Ph and Salinity. Journal of
Petroleum Technology 17 (12): 1449-1453
Nabzar, L., Chauveteau, G. and Roque, C., 1996. A New Model for Formation Damage by
Particle Retention. Paper SPE 1283 presented at the SPE Formation Damage Control
Symposium, Lafayette, Louisiana, USA, 14-15 February.
Ochi, J. and Vernoux, J.-F., 1998. Permeability Decrease in Sandstone Reservoirs by Fluid
Injection: Hydrodynamic and Chemical Effects. J. of Hydrology 208 (3): 237-248
Pang, S. and Sharma, M.M. 1997. A model for predicting injectivity decline in water-injection
wells. SPE FE 12 (3): 194-201
Payatakes, A.C., R. Rajagopalan and C. Tian., 1974. “Application of Porous Medium Models to
the Study of Deep Bed Filtration,” Can. J. Chem. Eng Vol 52, 722-731
Sharma, M. M. and Yortsos, Y. C., c., 1987. Fines migration in porous media, AIChE J Vol
33(13), 1654-1662
Takahashi, S. and Kovscek, A.R., 2010. Wettability Estimation of Low-Permeability, Siliceous
Shale Using Surface Forces. Journal of Petroleum Science and Engineering 75 (1-2):
33-43
Torkzaban, S., Wan, J., Tokunaga, T.K., Bradford, S.A., 2012. Impacts of bridging
complexation on the transport of surface-modified nanoparticles in saturated sand,
Journal of Contaminant Hydrology, 136-137: 86-95
You, Z., A. Badalyan., and P. Bedrikovetsky., 2013. "Size-exclusion colloidal transport in
porous media - stochastic modelling and experimental study." Society of Petroleum
Engineers Journal 18: 1-14
Yuan, H. and Shapiro, A., 2010. A Mathematical Model for Non-Monotonic Deposition Profiles
in Deep Bed Filtration Systems. Chemical Engineering J. 166 (1): 105-115
Yuan, H., A. Shapiro., Z. You and and A. Badalyan., 2012. "Estimating filtration coefficients
for straining from percolation and random walk theories." Chemical Engineering
Journal 210(1 November 2012): 63-73
Yuan, H., Z. You., A. Shapiro., P. Bedrikovetsky., 2013. "Improved population balance model
for straining-dominant deep bed filtration using network calculations." Chemical
Engineering Journal 226(15 June 2013): 227-237

16
2 Literature Review
2.1 Introduction
Fines or fine particles (colloids) are small particles that exist in rocks or are injected
together with water into injection wells. The smallest size corresponds to the particles
that are just larger than dissolved macromolecules, and the largest size to colloids that
resist settling once suspended (Denovio et al., 2004). Colloids in nature include mineral
fragments such as clays, microorganisms, mineral precipitates, and debris. These fine
particles can be released into flowing fluid due to a variety of hydrologic, geochemical,
and microbiological processes (Ryan and Elimelech, 1996).
The migration of particles in porous media is a challenging problem of both
scientific and industrial importance especially in the area of petroleum engineering.
During the flow of suspension through a porous medium, fine particles attached to pore
surfaces are released or detached under certain sets of condition (Khilar and Fogler,
1998). Particle mobilization in porous media is an important issue as it can lead to
drastic changes in the permeability of oil reservoirs (Cerda, 1987). The transport of
colloidal suspensions in porous media is accompanied by particle capture and
consequently permeability impairment. The permeability reduction caused by fine
particles capture in reservoirs is known as formation damage in petroleum engineering
(Mueeke, 1979; Mays and Hunt, 2005).
In chemical engineering, particle transport is important in several contexts. It
occurs in operation of deep bed filters for water treatment and industrial liquids,
membrane technologies, and size exclusion chromatography (Mays and Hunt, 2005).

17
High velocity colloidal suspension, size exclusion dominant colloidal suspension
and emulsion transport in porous media with particle capture and consequent
permeability decline is essential for numerous environmental, petroleum and chemical
technologies. Transport of colloids, suspensions and emulsions also takes place in
industrial filtering, size exclusion chromatography, water production by artesian wells,
grouting injection to improve soil strength, liquid composite moulding, industrial waste
disposal, aquifer remediation, contamination of aquifers by viruses and bacteria, fines
migration in low consolidate and high clay content reservoirs and low quality water
injection (Mays and Hunt, 2005; Lefevre et al., 2007; Chupin et al., 2007; Kocaefe et
al., 2009; Zhou et al., 2009; Gitis et al., 2010; Massoudieh and Gynn, 2010; Noubactep
and Care, 2010; Richard and Neretnieks, 2010; Wong and Mettananda, 2010). Near to
production and injection wells in petroleum reservoirs and aquifers, flow velocities are
2-3 orders of magnitude higher than in the other parts of the reservoir. Therefore, the
bulk of particle mobilization, filtering and attachment occur. In petroleum industry, well
injectivity with injection of solid and liquid particles, with fines lifting and straining due
to high velocity or water salinity alteration during seawater flooding, re-injection of
produced water or disposal of produced water in aquifers is one of the main challenges
of oil production by waterflooding of oilfields (Bedrikovetsky et al., 2011;
Bedrikovetsky et al., 2012). The problem of oil and gas well productivity with lifting,
migration and straining of the reservoir fines is important problem in petroleum
industry. Design and behavior prediction of the above mentioned technological
processes are based on mathematical modeling. Therefore, creating appropriate model
prediction that coincides with experimental results still needs a lot of scientific work.

18
2.2 Particle Migration in Porous Media
Particle migration is a process involving the release, transport and capture of small
particles in a fluid saturated porous media. The definition of fines migration is a very
broad phenomenon seen in many different areas, including environmental engineering,
chemical engineering and petroleum engineering. For petroleum engineering, the porous
medium is usually a petroleum reservoir and small particles are typically considered to
be any colloidal particles. Colloidal particles are particles with effective diameters less
than 10μm (MacCartthy and Zachara, 1989). These particles maybe made of many
different materials such as inorganic, organic, and microbiological compounds but some
of the more common materials are clays (Bradford et al., 2002)
In the petroleum industry, particle migration usually has undesirable consequences,
such as formation damage and production of fines. Transport of particle suspensions
and colloids in porous media is accompanied by particle capture and consequent
permeability decline (Shapiro et al, 2007). Particle migration can occur in several
different situations. It may occur during primary production from a field, particularly
from heavy oil, consolidated in a clay rich reservoir. It may also occur during water
flooding because injected water causes the mobilization of fines in the reservoir (Khilar
and Fogler, 1998, Civan, 2007). Therefore, to have experimental results with reliable
model prediction is essential to do the required water treatment for water injection, to
choose the particle size for drilling mud and also to design proper sand screens.
Experimental data is also important to be able to predict particle’s behavior, such as
attachment and release, and its effects on formation damage while flow of suspension in
porous media.

19
In recent years, fines migration has been recognized as a source of permeability
damage and productivity decline in petroleum engineering. Formation damage by
particle migration involves mainly two different mechanisms, chemical and physical
mechanism.
2.2.1 Chemical Mechanism
Laboratory work in the area of fines migration induced by chemical interactions has
showed the rapid and drastic permeability decline resulting from fresh water contact
with clay containing formations. Several investigators have described the mechanism of
clay particle expansion, dispersion, migration and plugging. Veley (1969) reported that
the factors contributing to the binding of clay particles are London-van der Waals
forces, recrystallization and chemical alteration, sorption of organic matter from oil,
mutual sorption of ions between adjacent unit layers, electrostatic attractions and
hydrodynamic drive forces. He demonstrated that opposing these considerations are the
factors contributing to clay particle expansion and dispersion such as hydration of
exchangeable cations, hydration of particle surface, repulsion of exchangeable cations
(double layer theory), desorption or chemical removal of sorbet binding matter,
neutralization of positive charges on particle edges, mechanical shear, and thermal
(Brownian) motions. He suggested that the diffusion forces are strongly dependent on
the concentration of ions in the bulk solution.
Recent research has focused on fines migration in a porous media with respect to
different chemical parameters. These parameters include the pH, ionic strength and
salinity of the pore fluid. An increase in ionic strength or valence of counter ions has
been found to decrease the rate of release of the particles and hence the rate of

20
permeability decline (Khilar and Fogler, 1998). At a higher ionic strength condition, the
significant multilayer particle deposition was observed by Kuhnen et al, (2000).
Reduction of permeability is generally caused by decreasing salinity. Valdya and
Fogler (1992) clearly showed that the particle release process is started by a
combination of low salinity and high pH. The ionic condition of low salinity and high
pH appears to be harmful to formation permeability, causing fines migration and drastic
damage. An increase in pH has been found to increase the rate of release of particles
(Khilar and Fogler, 1998). Permeability reduction due to salinity changes occurs
regardless of the type of clay minerals (Mungan, 1965). Chemical perturbations like
decreasing ionic strength and increasing pH can increase the mobilization of particles
and formation plugging.
2.2.2 Physical Mechanism
Formation damage resulting from physical flow forces, has not been as extensively
studied as that caused by chemical interactions. The majority of the work in this area is
detailed in the investigations of Gruesbeck and Collins (1982) and Kuhnen et al (2000).
In their works, experimental research has been carried out to investigate the release of
fine particles or particle entrainment and deposition as a mechanism of permeability
reduction. A critical velocity for particle entrainment has been identified. This velocity
was determined to be highly dependent upon the properties of the porous medium and
the interstitial fluids.
If a particle is initially adsorbed onto the surface of a pore, there are two broad
types of forces such as, hydrodynamic and electrostatic force that can act on the particle.
Forces that attach a particle to the pore surface are electrostatic forces and, forces that

21
act to remove particle from the pore are hydrodynamic forces. If the forces acting on the
particle change and the hydrodynamic forces dominate, this equilibrium may be
disrupted and the particle removed from the pore surface into the fluid stream. As the
hydrodynamic forces increase with velocity, there should be a critical velocity at which
these forces are sufficient to dislodge the particle. A decrease in the forces attaching the
particle to the pore surface would decrease the critical velocity required to remove the
particle. Therefore, experimental work and modeling of the forces acting on a particle
initially attached to a pore surface should be able to predict the critical velocity for a
given set of condition. Cerda (1987), Khilar and Fogler (1998) conducted several
experimental studies related to hydrodynamically induced release of particles. However,
less attention has been paid to particle deposition under the alteration of the velocities.
In this thesis, the profile of high velocity particle deposition onto an engineered
porous medium, with particle detachment by the alteration fluid velocity, pH and ionic
strength of suspension were observed. The modified particle detachment model for
maximum retention concentration was validated (Paper 4). Laboratorial test with
colloidal injections at high flow rates were carried out until the stabilized conditions
have been reached, and effect of the colloidal retention and permeability damage in
porous media have been investigated as paper 5. The mathematical model for reliable
prediction of wells behavior in oil, gas and aquifer reservoirs during the high velocity of
colloidal suspension with experimental work concluded as paper 1.
2.3 Permeability Reduction due to Size Exclusion
Much of the current knowledge of straining comes from field experiment with traceable
colloids, bacteria, viruses, and latex microspheres. A variety of inorganic, organic, and
microbiological colloids exist in natural subsurface systems including silicate clays, iron

22
and aluminum oxides, mineral precipitates, humic materials, micro emulsions of
nonaqueous phase liquids, viruses and bacteria (Ryan and Elimelech, 1996; Bradford et
al., 2002).
Straining is trapping of colloids in pore throats that are too small to allow passage.
The critical pore size for straining will depend on the size of the particle and the pore
size distribution of the porous media (Bradford et al., 2002). During the well drilling,
the main factors that determine formation damage due to particle straining are particle
size distribution in the mud (particles in suspension), formation permeability (pore size
distribution), concentration of solids in the mud, and mud circulation rate (Suri and
Sharma, 2001). Natural porous media typically exhibit a wide range in pore sizes due to
variations in grain size, orientation and configuration, and surface roughness. It is
possible that straining occurs at both the pore and grain scale (Sakthivadivel, 1969).
Herzig et al. (1970) reported that straining is significant when the colloids diameter is
greater than 5% of the median grain diameter in porous media. For this reason, most
previous studies on colloid transport have neglected straining as a major mechanism for
retention (Bradford et al., 2005).
The critical pore size for straining depends on the size of colloid and the pore size
distribution of the medium. Many chemical factors (i.e., pH, ionic strength, surface
charge, etc.) affect the aggregating behavior of a colloidal particle and the effective pore
size distribution (Bradford et al., 2002). These chemical factors (pH, ionic strength,
surface charge, and chemical composition) are also known to influence soil structure
(disaggregation) and pore size distribution (shrinking and swelling) when soil contains
clay and other colloidal materials (Ayers and Westcot, 1989). Several colloidal
suspension properties such as surface charge of the colloids, ionic strength of the

23
suspension and type of salt molecules can cause flocculation or dispersion of particles in
the suspension and consequently affect the plugging of pore throats. If flocculation does
occur, the effective particle size is increased dramatically, therefore increasing the drag
force and hence its chance of being dislodged and re-captured on a pore throat.
Straining may also be influenced by physical (fluid velocity, colloid concentration,
colloid and soil grain size distribution characteristics, and heterogeneity (Bradford at al.,
2002).
Experimental observations of colloid transport are not always in agreement with
colloid attachment theory (Tufenkji et al., 2004). Colloid attachment theory does not
account for straining. Previous colloid transport studies reported in the literature have
focused on the quantification of clean bed first order attachment coefficients to describe
particle removal in filter beds (Fitzpatrick and Spielman, 1973; Tobiason and O’Melia,
1988). Smaller particles are predicted to be removed more efficiently by diffusive
transport and larger particles are predicted to be removed more efficiently by
sedimentation and interception.
Recent studies have shown that the importance of straining on colloid transport has
been underestimated in the past. Bradford et al. (2002) suggested that straining is an
important mechanism of colloid retention for the larger 2.0μm to3.2μm colloids in the
various porous media. Straining is also an important mechanism of colloid retention,
especially for decreasing median grain size and increasing colloid size. Attachment
theory for these larger colloids needs to take into account the role of straining, which
involves the interaction between collectors and the particles. An accurate knowledge of
the pore size distribution is, therefore, needed for a proper prediction of the retention of

24
colloids. Investigation on the influence of straining on colloid transport in porous media
still needs much attention.
In this thesis, experimental results from the laboratory study for validation of the
population balance model is improved. The new modification of the size exclusion
suspension transport accounting for the pore accessibility and flow fraction in capture
kinetics term, in the inlet and outlet conditions of particle mass balance, is discussed
(Papers 5-9). New improved model for size exclusion dominated particle capture, which
additional takes account of the expression for the particle capture rate with new
experimental results are studied (Paper 10).
2.4 Deep Bed Filtration Theory
The classical suspension-colloid filtration theory is the most widespread approach for
prediction of particle behaviors in porous formations (Herzig et al., 1970;
Bedrikovetsky, 2008). This advection-dispersion model consists of two equations for
material balance with a sink term for particle capture and an equation for particle
deposition rate (Herzig et al., 1970, Yao et al., 1971). Filtration theories tend to assume
that deposition of colloids to the filter media is essentially irreversible. The effect of
filter depth on filter performance is described by Iwasaki (1937). The mass balance
equation for 1-D flow of an incompressible fluid or suspension is written as (Herzig et
al., 1970; Tufenkji, 2007):
2
2
bc c cU D
t x x t
(1)
Where c is concentration of suspended particles, σ is amount of particle retained in
the porous medium, ρb is dry bulk density, and U is the fluid velocity. The mobilization
and retention of colloidal particles in the classical model is described by first-order

25
kinetics (Bradford et al., 2003; Civan, 2007). The local deposition and capture rate is
calculated by:
detcU kt
(2)
Where kdet is usually referred to as the detachment rate constant and λ is filtration
coefficient in deep-bed filtration process. The term is called the filtration rate and
explains the particles release and deposition rate. The detachment rate is a function of
suspended concentration, flow velocity and also amount of deposited particles (Nabzar
et al., 1996; Rousseau et al., 2008).
The process of fine particles detachment has been discussed widely in the literature.
However numerous equations have been proposed yet a universal model explaining the
particle release does not exist. Kolakowski and Matijevic (1979) have experimentally
studied removal of deposited particle. They have used a well-defined system of mono-
dispersed spherical particles deposited on glass beads in a packed column to investigate
the effect of solution pH on particle removal. The expression for particle detachment
rate is given as:
det
,,
x tk x t
t
(3)
Where σ(t) is the number of adhered particles and kdet is the probability of escape
that is determined by the electrical energy barrier. In Kolakowski and Matijevic (1979)
model the rate of particle desorption, only depends on interaction potential between
particle and porous media and is not affected by the mechanical equilibrium of forces on
the deposited particles.
Khilar et al. (1983) showed a first order equation with respect to retained
concentration for the particle release rate. However, they mentioned that the initiation

26
and rate of particle removal depend on several variables such as physical and chemical
nature of particle attachment, the local brine salt concentration, temperature, and fluid
velocity; the model consists of a coefficient for release that is independent of force
balance on single particles. The detachment rate expression is given as:
det
det
det det
: 0
:
salt
salt
kt
C CSC k
C CSC k k
(4)
Where σ concentration of attached particles on pore wall and kdet is so called release
coefficient and is equal to zero for salt concentration higher than the critical salt
concentration.
An empirical law for the rate of particle detachment is also presented by Schechter
(1992):
det
1
0
crt crt
crt
crt
crt
k U U H U U ct
U UH U U
U U
(5)
The model includes Heaviside function that causes the particle removal to stop, if the
fluid velocity U is less than the critical velocity Ucrt. He mentioned that the equation for
release rate (Eq. 3) is purely empirical and there is no experimental evidence confirming
that using this particular equation is more beneficial than any other plausible forms
(Schechter, 1992).
New deep bed filtration model by Yuan and Shapiro (2011a) introduces a surface
associated phase migration. They have defined a migrating layer of the particles
associated with the pore walls via secondary energy minimum, to model particle capture
and release which is not function of force balance on attached particles.

27
Apart from the equations mentioned above, several other detachment rate equations
have also been presented in Khilar and Fogler (1998). Despite the known physical
dependency of particle detachment to forces acting on particles, there is no theory for
calculating the detachment coefficients. The major shared aspect of all release rate
equations is their threshold characteristic. That means, the particle release happens
beyond a critical value of specific parameters (Khilar and Fogler, 1998) and is assumed
to be proportional to the difference between current condition such as velocity, salinity,
pH, and temperature, and their critical value (Gruesbeck and Collins, 1982;
Bedrikovetsky et al., 2011). The detachment coefficients are also empirical constants
and could be determined by models tuning using experimental results (Schechter, 1992;
Tufenkji, 2007).
Another shortcoming of the Classical Filtration Theory is the prediction of an
asymptotic response to the flow condition change. Lever and Dawe (1984) investigated
the effect of brine salinity on a sandstone core. They have observed an abrupt change in
permeability due to brine salinity change. Likewise, Mungan (1965) has reported an
instant permeability response to a change to injected water pH. Numerous experimental
studies also show that fines release occurs instantly under brine chemistry or injection
velocity alternation (Gruesbeck and Collins, 1982; Khilar et al., 1983; Sharma et al.,
1992; Miranda and Underdown, 1993; Ochi and Vernoux, 1998; Ju et al., 2007).
Various experimental studies have reported an abrupt core response to a flow condition
change too (salinity, pH, flow rate.), while the classical filtration theory, with the
kinetics of particle detachment; predicts an asymptotical stabilization of the retention
concentration and permeability (Bedrikovetsky et al., 2011; Yuan and Shapiro, 2011b).
2.5 Methodology of Experimental Study

28
In this Section, we present some laboratory works targeting suspension flow in porous
media under the particle-rock repulsion and discuss how pore throat size distribution
can be determined from those tests.
2.5.1 Experimental Study under the Particle-Rock Repulsion during Suspension
Flow
In order to examine the attachment and straining of colloids moving through a single
layer of glass beads, the micro model housings are designed to support the observation
under an optical microscope (Chalk et al., 2012). The housings are milled out of
polyvinyl chloride (PVC) plastic and are designed in such a way that two glass slides
are held in place to contain the porous media in a single layer. The deionised ultrapure
MilliQ water (resistivity of 18.2 MOhmcm at 25 C) after degassing in vacuum at
pressure 10-2
Pa is used for the preparation of a colloidal suspension. The salinity,
acidity and alkalinity of the prepared suspensions are adjusted with the addition of
NaCl(aq), HCl(aq) and NaOH(aq), respectively.
The effect of colloidal suspension salinity on the particle retention is investigated
under three different NaCl(aq) concentrations (0 mM, 10 mM and 100 mM) at constant
acidity/alkalinity. A proportional increase in particle attachment with salinity is
observed throughout these experiments, as shown in Fig. 1(a), where the images of
colloid particles are small bright “points” while the images of glass beads are semi-
transparent large circles. So, the images in Figure 1a allow concluding that the higher is
the brine ionic strength the stronger is the particle attachment. Simultaneously, the
particle-rock interaction force was calculated for three salinity values using DLVO
theory (Khilar and Fogler, 1998). Three plots of the force vs the particle-surface
separation distance show that the increase in retention is due to an increased depth of

29
the secondary minimum and a reduced energy barrier to the primary minimum (Tufenkji
and Elimelech 2004, 2005). The same results were obtained by Kuznar and Elimelech
(2007).
Figure 1. Images of particles strained in porous media: (a) different salinities (blue bright points
are attached colloids) and (b) different pH levels (green bright points are attached colloids).
Colloidal particle retention by glass beads is investigated using suspensions with
five different pH levels (2.79, 4.26, 7, 8.48 and 10.38) at constant salinity. The
monotonic decrease in attachment is found to occur with increased alkalinity. The
colloid retention in the unit is comparatively low in all alkaline resident solutions, as
shown in Fig. 1(b). The high particle retention in acidic conditions is probably due to
the reduction in the strength of the electrical charge on the surface of the glass beads
and the colloidal particles. Figure 1b shows that the higher is the pH the weaker is the

30
electrostatic particle-grain attachment. Those conclusions indicate that net repulsion
exists between the porous media and the colloidal particles, and that size exclusion is
the dominant capture mechanism.
2.5.2 Determining the Pore Throat Size Distribution
Presently there are two commonly used methods in the industry for the determination of
pore size distribution. There are mercury porosimetry and challenge testing. Mercury
porosimetry is used extensively for the characterization of porous materials. It is one of
the most simple and rapid methods available to give a basic representation of a porous
media (Brakel et al., 1981). The method provides information about pore size
distribution, the total volume or porosity, the skeletal and apparent density and specific
area of a sample. The disadvantages of the method include: it underestimates
concentration of thin pores because high pressures must be applied in order to force the
non-wetting fluid into thin pores; it can be destructive under high pressure hence not
applicable for deformable and fragile porous materials; it is environmental unfriendly
because of mercury. The challenge testing method, which was recently significantly
improved, utilizes the injection of particle suspension into porous media (Purchas and
Sutherland 2002; Rideal 2006, 2009). The method is based on calculation of the particle
capture probability in a single sieve and cannot be applied for deep bed filtration. Yet,
usually the reservoir rock sample sizes vary as 0.5-10 cm; a thin slice can be submitted
to flow only for highly consolidated cores. To the best of our knowledge, there is no
available in the literature method to determine the overall pore size distribution of core
plugs from particle size distribution in the injected and produced suspensions.
Therefore, the pore size distribution determined from the experimental data using
solution of the inverse problem, and also the Monte Carlo simulation will be used to
predict the pore throat size distribution based on the Descartes’ theorem. A method is

31
proposed by which the pore throat size distribution will be determined using particle
suspension core flood tests through engineered porous media when only straining
effects are present. The method involves a suspension flow of particles with a known
size distribution through porous media and measuring the inlet, breakthrough and
stabilized outlet particle concentrations throughout the test. For these requirements, the
new designed challenge core flood test is developed and continuously improved based
on previous work (Chalk et al., 2012).
The above critical analysis of the past and current laboratory investigation of
suspended colloidal transport in porous media allows concluding the importance of
experimental study under high flow velocities and under straining capture and
unavailability of this research in the contemporary literature.
2.6 References
Ayers, R.S., and Westcot, D.W., 1989. Water Quality for Agriculture. FAO Irrig, And Drain,
Pap., 29, Rev 1, U.N. Food and Agric. Organ., Rome
Bedrikovetsky, P., 2008. Upscaling of Stochastic Micro Model for Suspension Transport in
Porous Media. Transport in Porous Media 75 (3): 335-369
Bedrikovetsky, P., Siqueira, F., Furtado, C. and Souza, A., 2011. Modified Particle Detachment
Model for Colloidal Transport in Porous Media. Transport in Porous Media 86 (2):
353-383
Bedrikovetsky, P., A. Zeinijahromi., F. Siqueira., C. Furtado and A. Souza., 2012. "Particle
detachment under velocity alternation during suspension transport in porous media."
Transport in Porous Media 91(173-197)
Bradford, S.A., Yates, S.R., Bettahar, M., Simunek, J. 2002. Physical factors affecting the
transport and fate of colloids in saturated porous media. Water Resour. Res. Vol 38
(12), 1327
Bradford, S., Simunek, J., Bettahar, M., van Genuchten, M. and Yates, S., 2003. Modeling
Colloid Attachment, Straining, and Exclusion in Saturated Porous Media. J. Environ.
Sci. Technol 37 (10): 2242-2250
Bradford, S.A., Simunek, J., Bettahar, M., Tadassa, Y.F., 2005. Straining of Colloids at Textural
Interfaces, Water Resour. Res. Vol 41, 1-17
Brakel, J.V., Modry, S. & Svata, M. 1981. Mercury Porosimetry: State of the Art. Powder
Technology, Vol 29 , 1-12
Cerda C.M., 1987. Mobilization of Kaolinite Fines in Porous Media, Colloids and Surfaces Vol
27, 219-241
Chalk, P., N. Gooding, S. Hutten., Z. You., P. Bedrikovetsky., 2012. "Pore size distribution
from challenge coreflood testing by colloidal flow." Chemical Engineering Research
and Design 90(1): 63-77
Chupin, O., N. Saiyouri and P. Hicher., 2007. "The effects of filtration on the injection of
cement-based grouts in sand columns." Transport in Porous Media 72(2): 227-240

32
Civan, F., 2007. Reservoir Formation Damage: Fundamentals, Modeling, Assessment, and
Mitigation. Burlington: Gulf Professional Publishing, Elsevier.
DeNovio, N.M., Saiers, J.E. and Ryan, J.N., 2004. Colloid Movement in Unsaturated Porous
Media Recent Advances and Future Directions. Vadose Zone Journal 3 (2): 338-351
Fitzpatrick, J.A., and Spielman, L.A.,1973. Filtration of Equeous Latex Suspensions Through
Beds of Glass Spheres, J. Colloid Interface Sci. Vol 43, 350-369
Gitis, V., Rubinstein, I., Livshits, M. and Ziskind, G., 2010. Deep-Bed Filtration Model with
Multistage Deposition Kinetics. Chemical Engineering Journal 163 (1-2): 78-85
Gruesbeck, C. and Collins, R.E., 1982. Entrainment and Deposition of Fine Particles in Porous
Media. SPE Journal 22 (6): 847-856
Herzig, J.P., Leclerc, D.M. and Goff, P.L., 1970. Flow of Suspensions through Porous Media—
Application to Deep Filtration. Industrial and Engineering Chemistry 62: 8-35
Iwasaki, T., J.,1937. Amer. Water Works Ass. 29 (1591-1597)
Ju, B., Fan, T., Wang, X. and Qiu, X., 2007. A New Simulation Framework for Predicting the
Onset and Effects of Fines Mobilization. Transport in Porous Media 68 (2): 265-283.
Khilar, K.C., Fogler, H.S. and Ahluwalia, J.S., 1983. Sandstone Water Sensitivity: Existence of
a Critical Rate of Salinity Decrease for Particle Capture. Chemical Engineering Science
38 (5): 789-800
Khilar, K. and Fogler, H., 1998. Migrations of Fines in Porous Media.
Dordrecht/London/Boston: Kluwer Academic Publishers.
Kuhnen, F., Barmettler, K., Bhattacharjee, S., Elimelech, M. and Kretzschmar, R., 2000.
Transport of Iron Oxide Colloids in Packed Quartz Sand Media: Monolayer and
Multilayer Deposition, Journal of Colloid and Interface Science. Vol 231, 32–41
Kolakowski, J.E. and Matijevic, E., 1979. Particle Adhesion and Removal in Model Systems.
Part 1.-Monodispersed Chromium Hydroxide on Glass. Journal of the Chemical
Society, Faraday Transactions 1: Physical Chemistry in Condensed Phases 75: 65-78
Kocaefe, D., T. R. Bui and P. Waite., 2009. "2D transient filtration model for aluminum."
Journal of Applied Mathematical Modelling 33(11): 4013-4030
Kuznar, Z.A. and Elimelech, M. 2007. Direct microscopic observation of particle deposition in
porous media: role of the secondary energy minimum, Colloid Surf. Physicochem. Eng.
Aspect, Vol. 294, Nos. 1-3, 156-162.
Lefevre, D., S. Comas-Cardona., C. Binetruy., 2007. "Modelling the flow of particle-filled resin
through a fibrous preform in liquid composite moulding technologies." Composites Part
A Applied Science and Manufacturing 38(10): 2154-2163
Lever, A. and Dawe, R., 1984. Water-Sensitivity and Migration of Fines in the Hopeman
Sandstone. Journal of Petroleum Geology 7 (1): 97-107
MacCarthy, J.F., and J.M. Zachara. 1989. Subsurface transport of contaminants, Environ. Sci.
Technol, Vol 23, 496-502
Massoudieh, A. and Ginn, T.R., 2010. Colloid-Facilitated Contaminant Transport in
Unsaturated Porous Media. In Modelling of Pollutants in Complex Environmental
Systems, ed. G. Hanrahan, Chap. 8, 263. Hertfordshire, Glensdale: ILM Publications.
Mays, D.C. and Hunt, J.R., 2005. Hydrodynamic Aspects of Particle Clogging in Porous Media.
Environmental science & technology 39 (2): 577-584
Miranda, R.M. and Underdown, D.R., 1993. Laboratory Measurement of Critical Rate: A Novel
Approach for Quantifying Fines Migration Problems. Paper SPE 25432 presented at the
SPE Production Operations Symposium, Oklahoma City, Oklahoma,USA, 21-23
March.
Muecke, T.W., 1979. Formation Fines and Factors Controlling Their Movement in Porous
Media. Journal of Petroleum Technology 31 (2): 144-150
Mungan, N., 1965. Permeability Reduction through Changes in Ph and Salinity. Journal of
Petroleum Technology 17 (12): 1449-1453
Nabzar, L., Chauveteau, G. and Roque, C., 1996. A New Model for Formation Damage by
Particle Retention. Paper SPE 1283 presented at the SPE Formation Damage Control
Symposium, Lafayette, Louisiana, USA, 14-15 February.

33
Noubactep, C. and S. Care 2010. "Dimensioning metallic iron beds for efficient contaminant
removal" Chemical Engineering Journal 163: 454-460
Ochi, J. and Vernoux, J.-F., 1998. Permeability Decrease in Sandstone Reservoirs by Fluid
Injection: Hydrodynamic and Chemical Effects. J. of Hydrology 208 (3): 237-248
Purchas D.B., Sutherland K., 2002. Handbook of Filter Media (2nd ed.). Elsevier Advanced
Technology, Oxford
Richards, T. and I. Neretnieks 2010. "Filtering of clay colloids in bentonite detritus material."
Chemical Engineering and Technology 33: 1303-1310
Rideal, G., 2006. Analysis and monitoring: how to improve precision pore size measurement,
Filtr. Separat. Vol 43: 28-29
Rideal, G., 2009. The filtration society: the importance of testing and standards, Filtr. Separat.
Vol 46: 28-30
Rousseau, D., Latifa, H. and Nabzar, L., 2008. Injectivity Decline from Produced-Water
Reinjection: New Insights on in-Depth Particle-Deposition Mechanisms. SPE Prod &
Oper 23 (4): 525-531
Ryan, J.N. and Elimelech, M., 1996. Colloid Mobilization and Transport in Groundwater.
Colloids and Surfaces A: Physicochemical and Engineering Aspects 107: 1-56
Sakthivadivel, R., 1969. Clogging of a granular porous medium by Sediment, Rep. HEL 15-7
Schechter, R.S., 1992. Oil Well Stimulation. TX: Richardson, Society of Petroleum Engineers.
Shapiro A.A., Bedrikovetsky P.G., Santos A., Medvedev O.O. 2007. A Stochastic Model for
Filtration of Particulate Suspensions with Incomplete Pore Plugging, Journal of
Transport in Porous Media.Vol 67, (1), p.135-164
Sharma, M.M., Chamoun, H., Sarma, D.S.H.S.R. and Schechter, R.S., 1992. Factors Controlling
the Hydrodynamic Detachment of Particles from Surfaces. Journal of Colloid and
Interface Science 149 (1): 121-134
Suri, A. and Sharma, M.M., 2001. Stratigies for Sizing Particles in Drilling and Completion
Fluids, SPE 68964, 1-14
Tobiason, J.E., and O’Melia, C.R., 1988. Physicochemical Aspects of Particle Removal in
Depth Filtration. J.Am, Water Works Assoc. Vol 80: 54-61
Tufenkji, N., and M. Elimelech., 2004. Deviation from Classical Colloid Filtration Theory in
the Presence of Repulsive DLVO Interactions, Langmuir, Vol 20:10818–10828
Tufenkji, N. and Elimelech, M., 2005. Breakdown of Colloid Filtration Theory: Role of the
Secondary Energy Minimum and Surface Charge Heterogeneities. Langmuir 21 (3):
841-852
Tufenkji, N., 2007. Colloid and Microbe Migration in Granular Environments: A Discussion of
Modelling Methods. In Colloidal Transport in Porous Media, ed. F.H. Frimmel, F. von
der Kammer and F.-C. Flemming, Chap. 5, 119-142. Berlin: Springer-Verlag.
Valdya, R.N. and Fogler, H.S., 1992. Fines Migration and Formation Damage: Influence of pH
and ion exchange, SPE, 325-330
Veley, C.D, 1969. Howhydrolyzable Metal Ion React with Clays to Control Formation Water
Sensitivity. Journal of Petroleum Tech, 1111-1118
Wong, R. and Mettananda, D., 2010. Permeability Reduction in Qishn Sandstone Specimens
Due to Particle Suspension Injection. Transport in Porous Media 81 (1): 105-122
Yao, K.-M., Habibian, M.T. and O'Melia, C.R., 1971. Water and Waste Water Filtration.
Concepts and Applications. Environmental science & technology 5 (11): 1105-1112
Yuan, H. and Shapiro, A.A., 2011a. A Mathematical Model for Non-Monotonic Deposition
Profiles in Deep Bed Filtration Systems. Chemical Engineering Journal 166 (1): 105-
115
Yuan, H. and Shapiro, A.A., 2011b. Induced Migration of Fines During Waterflooding in
Communicating Layer-Cake Reservoirs. Journal of Petroleum Science and Engineering
78 (3–4): 618-626
Zhou, J., X. Zheng., M. Flury and G. Lin., 2009. "Permeability changes during remediation of
an aquifer affected by sea-water intrusion: a laboratory column study." Journal of
Hydrology 376(3-4): 557-566.

3 Particle Transport in Porous Media under
Particle–Rock Repulsion: Experimental and
Theoretical Study
34

3.1 Transport and Straining of Suspension in Porous Media:
Experimental and Theoretical Study
Aji K., You Z., Badalyan A.
Thermal Science, 2012, 16(5), 1444-1448.
35

Aji, K., et al.: Transport and Straining of Suspensions in Porous Media: … 1344 THERMAL SCIENCE, Year 2012, Vol. 16, No. 5, pp. 1344-1348
TRANSPORT AND STRAINING OF SUSPENSIONS IN POROUS MEDIA: EXPERIMENTAL AND THEORETICAL STUDY
by
Kaiser AJI, Zhenjiang YOU*, and Alexander BADALYAN Australian School of Petroleum, The University of Adelaide, Adelaide, Australia
Short paper
DOI: 10.2298/TSCI1205344A
An analytical model for deep bed filtration of suspension in porous media and straining under size exclusion capture mechanism is developed and validated by laboratory tests on suspension flow in engineered media. The fraction of swept particles is introduced in the inlet boundary condition. The model is successfully matched with the results from column experiments, predicting the suspended par-ticle concentrations at the outlet. Key words: colloidal suspension, porous media, straining
Introduction
Colloidal transport is a complex and industrially important process, attracting a great deal of interest for years [1-7]. Flow of colloidal suspensions in natural rocks occurs in many industrial applications ranging from particle filtration to fines migration in oil and gas reser-voirs [1]. Through reliable modeling of suspension flow and consequent particle retention in rocks, it is possible to reduce the formation damage in oil and gas wells, to design and plan different oil recovery technologies where the colloidal particles are used to increase sweep ef-ficiency during waterflooding.
Suspended particles can be captured in porous media by electrostatic attraction, sorp-tion, bridging, diffusion, gravitational segregation, etc. [3]. In the current work, only the size ex-clusion (straining) capture, where a particle is retained by a smaller pore only, is considered.
The large scale deep bed filtration is described by governing equations of mass bal-ance and capture kinetics for two unknowns – suspended and retained concentrations. These equations can be obtained by exact averaging of mono-size suspension transport in stochastic porous media [8].
Despite the importance of size exclusion population balance in many industrial ap-plications, the validation of population balance models with particle straining, to the best of our knowledge, is not available in the literature. In the present work, we provide new experi-mental results from the laboratory study on colloidal transport in engineered porous media, aiming at the validation of the population balance model. The new modification of the size exclusion suspension transport accounting for the pore accessibility and flow fraction in the capture kinetics term, in the inlet and outlet conditions of particle mass balance, is discussed.
–––––––––––––– * Corresponding author; e-mail: [email protected]
36

Aji, K., et al.: Transport and Straining of Suspensions in Porous Media: … THERMAL SCIENCE, Year 2012, Vol. 16, No. 5, pp. 1344-1348 1345
Good agreement between the experimental results and model prediction validates the mathe-matical model.
Stochastic micro model for particle size exclusion
Net repulsion condition between particles and rock matrix indicates that the size ex-clusion is the only particle capture mechanism. The pore space geometry is represented by the bundle of parallel capillary intercalated by the mixing chambers. Derivations of the equations for suspension transport in porous media can be found in [8, 9]. The particle population bal-ance equation is written as:
[ ] [ ]( , ) ( , , ) ( , , ) ( , , ) ( , ) 0a s s s s a sH r C r x t Σ r x t U C r x t f H rt xφ∂ ∂
+ + =∂ ∂
(1)
where the accessible porosity φa and accessible flow fraction fa are functional of pore concen-tration distribution H and particle size rs, C and Σ – concentration distributions for suspended and retained particles, respectively. The total flux U is independent of the coordinate x due to the incompressibility of particulate suspension. The particle capture rate is proportional to the advective particle flux:
( , , ) 1 ( , , ) ( , ) ( , )s
s a s ns sΣ r x t
UC r x t f H r f H rt l
∂=
∂ (2)
where fns is the flux fraction via smaller pores. The plugging rate of the pores is derived under the assumption that one particle plugs one pore:
1( , , ) ( )( , , ) ( , , ) ( , ) d
p
p pp s a s s
r
H r x t k rUH r x t C r x t f H r r
t k
∞∂= −
∂ ∫ (3)
Introduction of inaccessible porosity and accessible fractional flow is analogous to two-phase flow in porous media [10, 11], inaccessible large pores corresponding to ganglia of non-wetting phase [12]. Equations (1)-(3) are similar to the system of two-phase multicompo-nent flow in porous media [1, 10].
The initial conditions t = 0: C (rs, x, t) = 0, H (rp, x, t) = H0 (rp), are applied to the clean bed without suspension where H0(rp) is the initial pore size distribution of the medium. The suspension flux with the injected concentration entering larger pores is equal to that being transported through accessible pore space, which results in the following boundary condition at the inlet:
[ ]00 : ( , ) ( , ) ( , ) ( ,0, ) ( , )s a s nl s s a sx C r t f H r f H r U C r t f H r U= + = (4)
Let us formulate boundary conditions at the core inlet. The particles approaching smaller pores can be either swept by the tangent flux component parallel to the core edge and finally enter the larger pores, or stay captured in deep larger throats of the thin pores. The par-ticles approaching smaller pores are more likely to be redirected into larger pores for the clean cut inlet core surface. In the case of rough inlet surface, the particles approaching smaller pores are more likely to remain in the deep entrances into small pores. If α is the fraction of swept particles, C0(rs, t)[1 – fns (H, rs) + α fns (H, rs)]U is the carrier water flux carrying par-
37

Aji, K., et al.: Transport and Straining of Suspensions in Porous Media: … 1346 THERMAL SCIENCE, Year 2012, Vol. 16, No. 5, pp. 1344-1348
ticles into larger pores. The entering particles are transported via porous medium by the ac-cessible flux faU. The continuity of the particle flux at the outlet yields the following boun-dary condition: x = 0: C0(rs, t)[1 – fns (H, rs) + α fns(H, rs) ]U = C(rs,0, t) fa (H, rs)U. Further in the text, the case α = 0 is assumed, i. e. the suspension flux with the injected concentration en-tering larger pores is equal to that being transported through accessible pore space, which re-sults in the boundary condition at the inlet (4). On the other side, the particle suspension at the outlet is diluted in the overall water flux after passing the core outlet, corresponding to the pre-outlet condition:
: ( , , ) ( ) ( , )Ls a s sx L C r L t f r U C r t U= = (5)
Particularly, for the case of low retention filtration, time variation of the pore size distribution during the straining can be ignored. The steady state suspension concentration profile is obtained:
[ ]0 ( ) ( ) ( )
( , ) exp ( )( )
s a s nl ss ns s
a s
C r f r f r xC r x f rf r l
+ ⎡ ⎤= −⎢ ⎥⎣ ⎦ (6)
Laboratory study on suspension transport through engineered porous media
The glass beads are sieved using stainless steel sieves, before being packed in column at wet conditions with a theoretical porosity of 39.6%. Colloidal suspension is then delivered through packed column at constant rate by dual-pump/syringe system. Concentrations of in-jected and collected suspensions C0(rsi) and CL(rsi) are measured by the particle counter (fig. 1).
(a) bead sieving (b) column packing (c) suspension injection (d) particle counting Figure 1. Schematic for laboratory set-up on size exclusion suspension transport in porous media
During the experiment, C0(rsi) and CL(rsi), are measured for each test (here, i = 1, 2, ..., n). The “n” tests result in the system of “n” transcendental equations for three unknowns – mean pore radius <rp>, standard deviation σ0 and dimensionless inter-chamber distance l. The least squares method is applied to minimize the total quadratic deviation between the experi-mental data and those predicted by the analytical model (6):
0
2
0, , 1
( )min [ ( ) ( )]exp ( )
( )p
Lnsi
a si nl si ns sir l L i si
C rLR f r f r f rl C rσ< > =
⎧ ⎫⎪ ⎪⎡ ⎤= + − −⎨ ⎬⎢ ⎥⎣ ⎦⎪ ⎪⎩ ⎭∑ (7)
For a porous medium PM1 with glass beads size range of 20~31.5 μm, the opti-mized mean pore size <rp> = 3.58 μm, the standard deviation σ0 = 1.82 μm, and the inter-
38

Aji, K., et al.: Transport and Straining of Suspensions in Porous Media: … THERMAL SCIENCE, Year 2012, Vol. 16, No. 5, pp. 1344-1348 1347
chamber distance l = 0.55 mm. For a porous medium PM2 with glass beads size ranging from 31.5 to 45 μm, <rp> = 5.11 μm, σ0 = 2.42 μm, and l = 0.15 mm. The results of data treatment are shown in fig. 2. The six star points from laboratory test data for PM1, fig. 2(a) and five test data points for PM2, fig. 2(b) match well with the curve predicted by the model (6). The dashed curves in figs. 2(a) and 2(b) are from the classical model [6], which does not account for the concentration increase at the inlet (4), dilution effect at the outlet (5) and accessible flux in the capture rate expression (2). The deviation between the two models can be expected for intermediate sized particles.
0 0.2 0.4 0.6 0.8 1 1.2 1.4
1
0.8
0.6
0.4
0.2
0
j
(a) PM1 (b) PM2
1 2 3
4
56
Present modelPrevious modelExperiment
0 0.2 0.4 0.6 0.8 1 1.2 1.4j
1 2
3
4
5
Present modelPrevious modelExperiment
CL/C0
1
0.8
0.6
0.4
0.2
0
CL/C0
Figure 2. Normalized breakthrough concentrations vs. jamming ratio
Conclusions
A stochastic micro model is presented to describe suspension transport under size exclusion particle capture mechanism. The model accounts for the increase of particle concen-tration at the inlet due to the injected flux entrance only into accessible fraction of large pores, for the decrease of particle concentration at the outlet due to dissolution of the particle sus-pension carried by the accessible water flux in the overall water flux outside the porous me-dia, and for the retention rate proportional to the accessible suspension flux. The fraction of swept particles introduced in the inlet boundary condition accounts for the redirection of par-ticles into larger pores. The data from two laboratory tests have been successfully matched by the proposed model.
Acknowledgment
Financial supports from the Australian Research Council (ARC) Discovery Project 1094299, ARC Linkage Project 100100613 and Santos Pty Ltd are gratefully acknowledged.
References
[1] Bedrikovetsky, P. G., Mathematical Theory of Oil & Gas Recovery (With applications to ex-USSR oil & gas condensate fields), Kluwer, London, 1993
39

Aji, K., et al.: Transport and Straining of Suspensions in Porous Media: … 1348 THERMAL SCIENCE, Year 2012, Vol. 16, No. 5, pp. 1344-1348
[2] Bradford, S. A., Torkzaban, S., Wiegmann, A., Pore-Scale Simulations to Determine the Applied Hy-drodynamic Torque and Colloid Immobilization, Vadose Zone Journal, 10 (2011), 1, pp. 252-261
[3] Torkzaban, S., et al., Impacts of Bridging Complexation on the Transport of Surface-modified Nanopar-ticles in Saturated Sand, Journal of Contaminant Hydrology, 136-137 (2012), Aug., pp. 86-95
[4] Yu, M., Lin, J. Z., Chan, T. L., Effect of Precursor Loading on Non-Spherical TiO2 Nanoparticle Syn-thesis in a Diffusion Flame Reactor, Chem. Eng. Sci, 63 (2008), 9, pp. 2317-2329
[5] Yu, M., Lin, J. Z., Taylor-Expansion Moment Method for Agglomerate Coagulation due to Brownian Motion in the Entire Size Regime, Journal of Aerosol Science, 40 (2009), 6, pp. 549-562
[6] Yu, M., Lin, J. Z., Chan, T. L., Numerical Simulation of Nanoparticle Synthesis in Diffusion Flame Reactor, Powder Technology, 181 (2008), 1, pp. 9-20
[7] Yu, M., Lin, J. Z., Chan, T. L., A New Moment Method for Solving the Coagulation Equation for Par-ticles in Brownian Motion, Aerosol Science and Technology, 42 (2008), 9, pp. 705-713
[8] Bedrikovetsky, P., Upscaling of Stochastic Micro Model for Suspension Transport in Porous Media, Transport in Porous Media, 75 (2008), 3, pp. 335-369
[9] Chalk, P., et al., Pore Size Distribution from Challenge Coreflood Testing by Colloidal Flow, Chemical Engineering Research and Design, 90 (2012), 1, pp. 63-77
[10] Barenblatt, G. I., Entov, V. M., Rizhik, V. M., Theory of Fluid Flows through Natural Rocks, Kluwer, London, 1987
[11] Ilina, T., et al., A Pseudo Two-Phase Model for Colloid Facilitated Transport in Porous Media, Trans-port in Porous Media, 71 (2008), 3, pp. 311-329
[12] Bedrikovetsky, P. G., WAG Displacements of Oil-Condensates Accounting for Hydrocarbon Ganglia, Transport in Porous Media, 52 (2003), 2, pp. 229-266
Paper submitted: August 1, 2012 Paper revised: September 7, 2012 Paper accepted: September 12, 2012
40

3.2 Colloidal Flow in Aquifers during Produced Water Disposal:
Experimental and Mathematical Modelling
McLindin C., Saha A., Le K., Aji K., You Z., Badalyan A., Bedrikovetsky P
SPE-153502-MS. DOI: 10.2118/153502-MS.
41

42
A McLindin, C., Saha, A., Le, K., Aji, K., You, Z., Badalyan, A. & Bedrikovetsky, P. (2012) Colloidal flow in aquifers during produced water disposal: experimental and mathematical modelling. Presented at the SPE Middle East Health, Safety, Security and Environment Conference, Abu Dhabi, UAE, 2-4 April 2012
NOTE:
This publication is included on pages 42-66 in the print copy of the thesis held in the University of Adelaide Library.

3.3 Effect of Nanoparticle Transport and Retention in Oilfield Rocks on
the Efficiency of Different Nanotechnologies in Oil Industry
You Z., Aji K., Badalyan A., Bedrikovetsky P
SPE-157097-MS. DOI: 10.2118/157097-MS. ISBN: 978-1-61399-206-7.
67

68
NOTE:
This publication is included on pages 68-82 in the print copy of the thesis held in the University of Adelaide Library.
It is also available online to authorised users at:
http://doi.org/10.2118/157097-MS
A You, Z., Aji, K., Badalyan, A. & Bedrikovetsky, P. (2012) Effect of nanoparticle transport and retention in oilfield rocks on the efficiency of different nanotechnologies in oil industry. Presented at the SPE International Oilfield Nanotechnology Conference, The Netherlands, 12-14 June, 2012

3.4 Study of Particle Straining Effect on Produced Water Management
and Injectivity Enhancement
Aji K., You Z., Badalyan A., Bedrikovetsky P.
SPE-157399-MS. DOI: 10.2118/157399-MS. ISBN: 978-1-61399-201-2.
83

84
NOTE:
This publication is included on pages 84-95 in the print copy of the thesis held in the University of Adelaide Library.
It is also available online to authorised users at:
http://doi.org/10.2118/157399-MS
A Aji, K., You, Z., Badalyan, A. & Bedrikovetsky, P. (2012) Study of particle straining effect on produced water management and injectivity enhancement. Presented at the SPE International Production and Operations Conference and Exhibition, Doha Qatar, 14-16 May, 2012

3.5 Colloidal-Suspension Flow in Rocks: A New Mathematical Model,
Laboratory Study, IOR
Aji K., McLindin C., Saha A., Le K., You Z., Badalyan A., Bedrikovetsky P.
SPE-152025-MS, DOI: 10.2118/152025-MS. ISBN: 978-1-61399-199-2.
96

97
NOTE:
This publication is included on pages 97-114 in the print copy of the thesis held in the University of Adelaide Library.
It is also available online to authorised users at:
http://doi.org/10.2118/152025-MS
A Aji, K., McLindin, C., Saha, A., Le, K., You, Z., Badalyan, A. & Bedrikovetsky, P. (2012) Colloidal-suspension flow in rocks: a new mathematical model, laboratory study, IOR. Presented at the SPE EOR Conference at Oil and Gas West Asia, Muscat, Oman, 16-18 April, 2012

4 Particle Transport in Porous Media under
Particle-Rock Attraction: Experimental and
Theoretical Study
115

4.1 Particle Deposition and Mobilization during Deep Bed Filtration in
Oilfields …….
Aji Kaiser
International Journal of Oil, Gas and Coal Technology, Accepted on 21/06/2013
Available online:
(http://www.inderscience.com/info/ingeneral/forthcoming.php?jcode=ijgct)
116

117
NOTE:
This publication is included on pages 117-129 in the print copy of the thesis held in the University of Adelaide Library.
It is also available online to authorised users at:
http://doi.org/10.1504/IJOGCT.2014.065812
A Aji, K. (2013) Particle deposition and mobilisation during deep bed filtration in oilfields. International Journal of Oil, Gas and Coal Technology, v. 8(3), pp. 262-274

4.2 Experimental Study of Colloidal Flow in Porous Media at High
Velocities
Aji Kaiser
Asia-Pacific Journal of Chemical Engineering, Accepted on 20/11/2013. DOI: 10.1002,
apj.1782
130
131
A Aji, K. (2013) Experimental study of colloidal flow in porous media at high velocities. Asia-Pacific Journal of Chemical Engineering, v. 9(4), pp. 535-542
NOTE:
This publication is included on pages 131-138 in the print copy of the thesis held in the University of Adelaide Library.
It is also available online to authorised users at:
http://doi.org/10.1002/apj.1782

4.3 High Velocity Colloidal Flow in Porous Media: Experimental Study
and Modeling
Aji K., Badalyan A., Carageorgos T., Zeinijahromi A., Bedrikovetsky
Accepted by Book Chapter
Focus on Porous media Research, Ed. by Zhao C, 2013, Nova Science Publishers,NY.
139

140
NOTE:
This publication is included on pages 140-178 in the print copy of the thesis held in the University of Adelaide Library.
A Aji, K., Badalyan, A., Carageorgos, T., Zeinijahromi, A. & Bedrikovetsky, P. (2013) High velocity colloidal flow in porous media: experimental study and modelling. In: Focus on Porous Media Research, Nova Science Publishers, New York

5 Critical Analysis of Uncertainties during the
Deep Bed Filtration
179

5.1 Size Exclusion Deep Bed Filtration: Experimental and Modeling
Uncertainties
Badalyan A., You Z, Aji K., Bedrikovetsky P., Carageorgos T., Zeinijahromi A.
Review of Scientific Instruments, 2014, V. 85, 015111/1-13
180

REVIEW OF SCIENTIFIC INSTRUMENTS 85, 015111 (2014)
Size exclusion deep bed filtration: Experimental and modellinguncertainties
Alexander Badalyan,a) Zhenjiang You, Kaiser Aji, Pavel Bedrikovetsky,Themis Carageorgos, and Abbas ZeinijahromiAustralian School of Petroleum, University of Adelaide, Adelaide, South Australia 5005, Australia
(Received 23 July 2013; accepted 17 December 2013; published online 16 January 2014)
A detailed uncertainty analysis associated with carboxyl-modified latex particle capture in glass bead-formed porous media enabled verification of the two theoretical stochastic models for prediction ofparticle retention due to size exclusion. At the beginning of this analysis it is established that size ex-clusion is a dominant particle capture mechanism in the present study: calculated significant repulsiveDerjaguin-Landau-Verwey-Overbeek potential between latex particles and glass beads is an indica-tion of their mutual repulsion, thus, fulfilling the necessary condition for size exclusion. Applyinglinear uncertainty propagation method in the form of truncated Taylor’s series expansion, combinedstandard uncertainties (CSUs) in normalised suspended particle concentrations are calculated usingCSUs in experimentally determined parameters such as: an inlet volumetric flowrate of suspension,particle number in suspensions, particle concentrations in inlet and outlet streams, particle and porethroat size distributions. Weathering of glass beads in high alkaline solutions does not appreciablychange particle size distribution, and, therefore, is not considered as an additional contributor to theweighted mean particle radius and corresponded weighted mean standard deviation. Weighted meanparticle radius and LogNormal mean pore throat radius are characterised by the highest CSUs amongall experimental parameters translating to high CSU in the jamming ratio factor (dimensionless par-ticle size). Normalised suspended particle concentrations calculated via two theoretical models arecharacterised by higher CSUs than those for experimental data. The model accounting the fractionof inaccessible flow as a function of latex particle radius excellently predicts normalised suspendedparticle concentrations for the whole range of jamming ratios. The presented uncertainty analysis canbe also used for comparison of intra- and inter-laboratory particle size exclusion data. © 2014 AIPPublishing LLC. [http://dx.doi.org/10.1063/1.4861096]
I. INTRODUCTION
Retention of suspended particles flowing through porousmedia results in decrease in its permeability and translatesto the reduced oil and gas well productivity and injectivity,1
quick depletion of aquifers in geothermal fields due to claymigration,2, 3 etc. Such particle capture, according to Herziget al.,4 occurs via two mechanisms: particle separation at theentrance of a porous media through an external cake for-mation called mechanical filtration5, 6 and particle depositioninside a porous matrix. Formation of an external cake onthe injection well surface is responsible for well injectivitydecline.7 The second mechanism of particle retention is calleddeep bed filtration, and it has implications during transport ofsuspended particles in oilfields, injection of produced waterin aquifers, transport of contaminants in ground water reser-voirs, filtration in wastewater treatment, etc.
Deep bed filtration during suspended transport in porousmedia is characterised by various micro-sized particle cap-ture mechanisms occurred separately or in combination:straining,6 size exclusion of large particles in smallerpores,6 particle bridging at pore entrance,5, 8 internal cake
a)Author to whom correspondence should be addressed. Electronic mail:[email protected]
formation,5, 8 sedimentation/segregation of particles due togravity, diffusion of particles into pores with dead ends, andparticle attachment to a porous matrix via London-van derWaals attractive forces.5, 6 Field or experimental conditionssuch as particle and pore size distributions, salinity and pHof suspension, surface chemistry and irregularities of parti-cles and porous matrix, particle concentration, particle den-sity, suspension velocity, etc. determine the dominance of oneor several particle retention mechanisms over others.
Among the above particle capture mechanisms, particlesize exclusion is responsible for formation damage when thefollowing conditions are satisfied: particle dimensions exceedpore throat size, there is a weak or no attraction between par-ticles and porous media, low particle concentration excludescompetition between particles to pass through a pore throatand thus excludes the formation of bridges.
Appropriate selection of surface chemistry of suspendedparticles and a porous medium, particle concentration, alka-linity and ionic strength of suspension makes particle sizeexclusion mechanism dominant compared to other particleretention processes which at such conditions are consid-ered negligible.9–13 Although being an important particle re-tention mechanism, size exclusion deep bed filtration as adominant particle capture mechanism has not been given adue attention in the literature;6 previous studies mostly dealtwith particle diffusion, attachment and sedimentation. Poor
0034-6748/2014/85(1)/015111/13/$30.00 © 2014 AIP Publishing LLC85, 015111-1
181

015111-2 Badalyan et al. Rev. Sci. Instrum. 85, 015111 (2014)
agreement between experimental data and theoretical resultsduring “polystyrene latex-glass beads” repulsion observed invarious studies14–16 was attributed, according to Ryan andElimelech,9 to surface charge heterogeneity and surface ir-regularities of particles and collectors. Quantification of thesediscrepancies would have been possible if the experimentaland modelling uncertainties were available.
According to Yuan and Sin,17 uncertainty analysis of fil-tration models can be done by the two commonly used meth-ods, namely, Monte-Carlo simulations (MCS) or linear un-certainty propagation (LUP). The major drawbacks of theMCS method for uncertainty analysis are as follows: signif-icant computational time18 due to the fact that the accuracyof this method is a square root function of runs; and its in-ability to clearly identify the contribution of each parameter’suncertainty to the combined standard uncertainty (CSU) ofthe final result in analytical form.19 On the contrary, whenexperimental uncertainties of model parameters are known,computational efficiency,20 simplicity,18 and representation ofthe CSU in analytical form are the advantages of LUP analy-sis. Additionally, unlike MCS method,21 a more conservativeLUP method does not underestimate model’s uncertainty.22
Another uncertainty propagation method such as sensitivityanalysis also tends to deliver underestimated model’s uncer-tainties when the number of input parameters changing “at atime” is limited to one or two thus not covering all their pos-sible combinations.23
Tien24 reported that the accuracy of 10% in particle con-centration translates to a maximum uncertainty of ≈27% ininitial collection efficiency of a filter. In an attempt to quantifyuncertainty in their breakthrough concentration data, Desh-pande and Shonnard25 performed experiments in triplicateand used standard deviation as a measure of experimental un-certainty. Although sometimes repeatability can to some ex-tent reflect the accuracy of measurements, in most cases ex-perimental uncertainty is the most appropriate indicator of theexperimental data accuracy. Authors estimated uncertainty inexperimental breakthrough data calculated from the model as<±6%. Al-Abduwani et al.26 used computer tomography forthe determination of suspended particle concentration duringfiltration though granular media. They evaluated sensitivity oftheir experimental method to various particles concentrations;also, they calculated uncertainties in initial particle concentra-tion and filtration coefficient. Using these uncertainty param-eters, the authors concluded the poorness of their first modelfor prediction of filtration coefficient. Thus, the efficiencyof the particle retention model was verified via instrument-related sensitivity data. Mays and Hunt27 using Monte-Carlosimulations estimated uncertainty in the clogging parameterfor several data sets. However, in these simulations they ig-nored experimental uncertainty in particle concentration data,which leads to underestimation of CSU in the simulated re-sults. As a result, they were not able to conclude how well theclogging model agrees with the experimental data.
Various theoretical models28–32 have been developed forprediction of particle capture due to size exclusion. Thesemodels were verified through comparison with the respectiveexperimental data. However, such approach is incomplete andshould be enhanced by the analysis of uncertainties in exper-
imental data and modelling results achievable by the propa-gation of experimental uncertainties through modelling for-mulae. During model development, model parameters havingdirect physical meaning are usually preferred over empiricalcoefficients with indirect physical meaning. Sometimes, theseparameters are the products of other experimental parameterswith their own uncertainties. In this case, these model param-eters may be characterised by a significantly higher uncer-tainty, than that for an empirical coefficient, translating to anunexpected high CSU in a modelling result. To circumventsuch outcome, a detailed uncertainty analysis for each modelparameter should accompany model development.
In the previous publications,33–35 a methodology for theevaluation of the CSU in experimental data considered notonly the contribution of the uncertainties in the measured ex-perimental parameters, but also those arisen from the appli-cation of various models. Similar approach for the evaluationof CSU inherent to particle size exclusion experiment is nec-essary. Such detailed analysis of uncertainties for this typeof experiments is done for the first time to the best of ourknowledge.
In this paper, the uncertainties associated with particlecapture due to size exclusion during deep bed filtration areanalysed in details. Initially, appropriate measurements ofelectrophoretic mobilities of suspended particles and calcu-lations of their outer surface potentials, zeta potentials ofa porous medium and total potential of interaction betweenthem were performed ensuring the existence of total repul-sion between particles and a porous medium, leading to par-ticle capture due to only size exclusion. This is followed bythe discussion of the first category of uncertainties regardedas experimental which arise from the application of appro-priate instruments. We demonstrate how these uncertaintiespropagate to normalised suspended particle concentrations inthe two theoretical stochastic models developed in the previ-ous papers36, 37 and used for correlation between breakthroughconcentrations and fractions of accessible and inaccessibleflows in size exclusion experiments. We identified the exper-imental and derived parameters having the highest uncertain-ties and showed how they affect the modelled uncertainties.Finally, a comparison between normalised suspended parti-cle concentrations obtained by the two models and the re-spective experimental data is presented with the explanationof the observed deviations. Recommendations from NIST38
and EURACHEM39 uncertainty guidelines were used in thispaper.
II. MATERIALS
A. Glass beads
Spherical soda-lime glass beads of AH-type (BallotiniBead, Potters Industries Pty. Ltd., Australia) packed in a plas-tic flow-through column were used as an engineered porousmedium in size exclusion experiments. Their chemical com-position as reported by the manufacturer is presented inTable I.
Procedure outlined in Chalk et al.13 and aimed ensur-ing experimental conditions favourable for repulsion between
182

015111-3 Badalyan et al. Rev. Sci. Instrum. 85, 015111 (2014)
TABLE I. Chemical composition of glass beads.
Compound SiO2 Na2O CaO MgO Fe2O3 Al2O3
% (w/w) 73.1 15.0 7.0 4.2 0.4 0.3
latex particles and porous matrix was used for glass beadspreparation. Negative net surface charge of glass beads wasachieved by adjusting alkalinity of flushing deionised high-purity MilliQ water (EMD Millipore, former Millipore Cor-poration, electrical resistivity of 18.2 M� cm at 25 ◦C) andsuspensions at pH > 10. At such conditions, metal ox-ides presented on the surface of glass beads have nega-tive charge,40 resulting in the net total repulsion with car-boxyl latex suspended particles (see Sec. IV C). Therefore,size exclusion is adopted as the only mechanism of sus-pended particle capture inside a glass beads-formed porousmedium. Quantitatively, suspended particle-glass bead inter-action is discussed in Sec. IV C using Derjaguin-Landau-Verwey-Overbeek (DLVO) theory.41, 42
B. Latex particles
Spherical latex particles modified by surface carboxylgroups (Polysciences, Inc., Warrington, PA, USA) were usedfor the preparation of suspensions. In alkaline solutions withpH > 10, carboxyl surface groups undergo deprotonation,thus, creating a net negative charge on the surface of sus-pended particles.43 At high pH-values and low salinity sus-pended carboxyl modified latex particles are prevented fromaggregation44 and from attachment to the surface of alsonegatively charged engineered porous medium (packed glassbeads), leading to a suspended particle capture due to size ex-clusion. Previous studies with carboxyl latex particles flowingthrough a single layer of glass beads have shown no parti-cle straining due to electrostatic attraction from surface metaloxides.12, 13, 40
Deionised high-purity MilliQ water was used for prepa-ration of suspensions with pH > 10 (by adding 0.1 M NaOH).In the present study, suspended particle concentrations variedbetween 0.5 and 2.0 ppm – such low values result in the re-duction of particle competition to pass through a pore throatand in the absence of bridging.
III. EXPERIMENTAL
A. Experimental setup for size exclusion studies
Polyvinylchloride (PVC) flowthrough column 1 was usedfor size exclusion experiments (see Fig. 1). Column packingwith clean glass beads 2 was carried out inside an ultrasonicbath filled with MilliQ water for several reasons: to avoidair ingress inside the packed column, which affects particlecapture, and to get a more homogeneous packing, which im-proves experimental data reproducibility. Reduction of inletand outlet dead-volumes differs the present column from thatused in the previous study.13
The following improvements of the experimental setupand procedure aimed to improve the quality and reliability
4 7
5
6
3
54
8
1
2
9
10
11
12
13
14
15
FIG. 1. Schematic of particle size exclusion setup: 1 – column; 2 – glassbeads; 3 – latex particle-based suspension vessel; 4 – syringe pump; 5 – sy-ringes; 6–9 – one-way valves; 10, 11 – valves; 12 – collection beaker foreffluent suspension; 13 – analytical balance; 14 – PAMAS particle counter;15 – personal computer.
of experimental data compared to the previous experimentalsetup.13 Alkaline (pH ≈ 10) suspension 3 at 25 ± 0.5 ◦C waspumped through the PVC column using a pulseless NE-100dual-pump/syringe system 4 (New Era Pump Systems, Inc.,Farmingdale, NY, USA) equipped with two 60 ml plastic sy-ringes 5. Combination of one-way valves 6–9 allowed unin-terrupted pumping of suspension with a volumetric flowrateof 2 ml/min (5 × 10⁻⁵ m/s linear velocity) through a glassbeads-packed column separated by manual valves 10 and 11.Mass of effluent samples in collecting beakers 12 were mea-sured by the precision balance 13 (KERN EW 420-3NM, In-scale Ltd., Bucks, UK) and were used for calculation of porevolumes injected (PVI) using values for suspension density(which without an appreciable error was adopted as equal towater density).36 Inlet (C0) and outlet (CL) particle concentra-tions were measured by a portable particle counter PAMASS4031 GO (PAMAS GmbH, Salzuflen, Germany; later in thetext referred as PAMAS) 14 and data transmitted to a personalcomputer 15. Thus, the time-dependent relationship of thenormalised outlet suspension concentration was established.
B. Particle size distribution measurements
1. Glass beads
According to the manufacturer, radii of beads, rb, varyfrom 15 to 62.5 μm (see Table II). The beads were sieved tothe desired radius range of 20–31.5 μm using stainless steeltest sieves (Pro-lab Scientific, Australia) certified to AS 1152-93/BS 410-86/ISO 3310. Mastersizer 2000 particle size anal-yser (Malvern Instruments Limited, Worcestershire, UnitedKingdom) was used to determine size distributions of sup-plied and sieved beads, which were later used for the evalua-tion of mean pore size.
2. Latex particles
Latex particles of 5 different sizes were used in presentstudies (see Table III). Concentrations of these particles in in-let and outlet suspensions, and particle size distribution weremeasured by PAMAS.
183
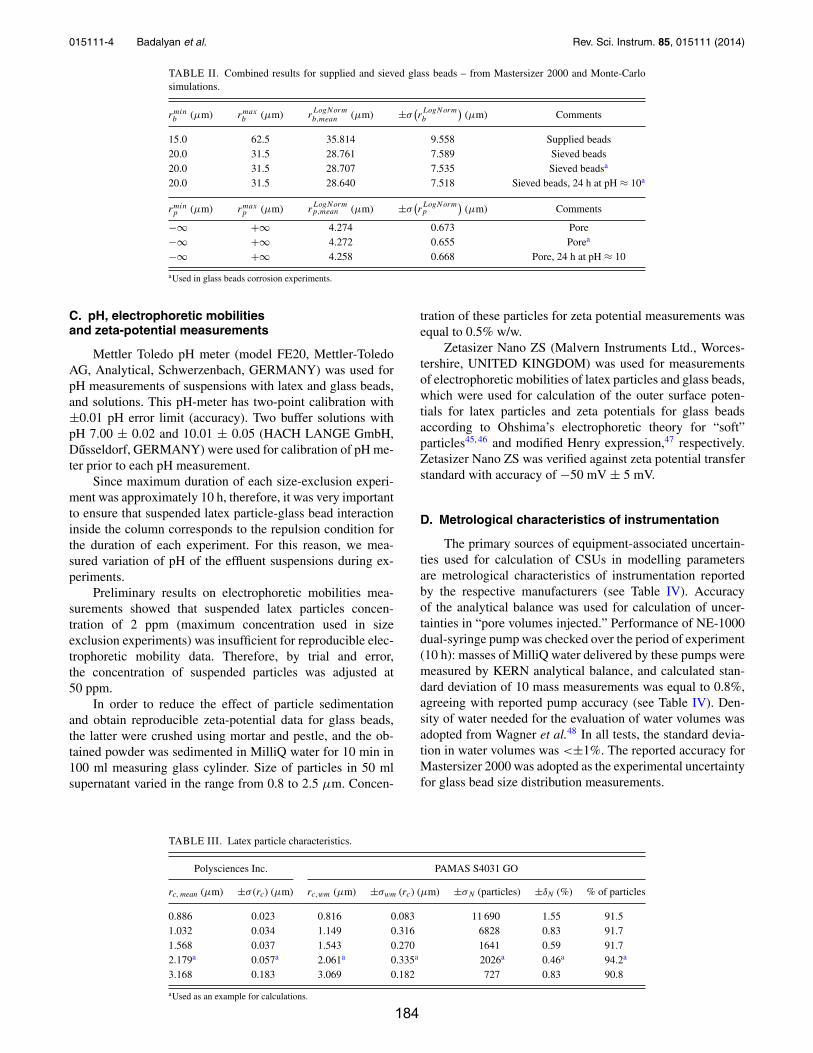
015111-4 Badalyan et al. Rev. Sci. Instrum. 85, 015111 (2014)
TABLE II. Combined results for supplied and sieved glass beads – from Mastersizer 2000 and Monte-Carlosimulations.
rminb (μm) rmax
b (μm) rLogNorm
b,mean (μm) ±σ(rLogNorm
b
)(μm) Comments
15.0 62.5 35.814 9.558 Supplied beads20.0 31.5 28.761 7.589 Sieved beads20.0 31.5 28.707 7.535 Sieved beadsa
20.0 31.5 28.640 7.518 Sieved beads, 24 h at pH ≈ 10a
rminp (μm) rmax
p (μm) rLogNormp,mean (μm) ±σ
(rLogNormp
)(μm) Comments
−∞ +∞ 4.274 0.673 Pore−∞ +∞ 4.272 0.655 Porea
−∞ +∞ 4.258 0.668 Pore, 24 h at pH ≈ 10
aUsed in glass beads corrosion experiments.
C. pH, electrophoretic mobilitiesand zeta-potential measurements
Mettler Toledo pH meter (model FE20, Mettler-ToledoAG, Analytical, Schwerzenbach, GERMANY) was used forpH measurements of suspensions with latex and glass beads,and solutions. This pH-meter has two-point calibration with±0.01 pH error limit (accuracy). Two buffer solutions withpH 7.00 ± 0.02 and 10.01 ± 0.05 (HACH LANGE GmbH,Dusseldorf, GERMANY) were used for calibration of pH me-ter prior to each pH measurement.
Since maximum duration of each size-exclusion experi-ment was approximately 10 h, therefore, it was very importantto ensure that suspended latex particle-glass bead interactioninside the column corresponds to the repulsion condition forthe duration of each experiment. For this reason, we mea-sured variation of pH of the effluent suspensions during ex-periments.
Preliminary results on electrophoretic mobilities mea-surements showed that suspended latex particles concen-tration of 2 ppm (maximum concentration used in sizeexclusion experiments) was insufficient for reproducible elec-trophoretic mobility data. Therefore, by trial and error,the concentration of suspended particles was adjusted at50 ppm.
In order to reduce the effect of particle sedimentationand obtain reproducible zeta-potential data for glass beads,the latter were crushed using mortar and pestle, and the ob-tained powder was sedimented in MilliQ water for 10 min in100 ml measuring glass cylinder. Size of particles in 50 mlsupernatant varied in the range from 0.8 to 2.5 μm. Concen-
tration of these particles for zeta potential measurements wasequal to 0.5% w/w.
Zetasizer Nano ZS (Malvern Instruments Ltd., Worces-tershire, UNITED KINGDOM) was used for measurementsof electrophoretic mobilities of latex particles and glass beads,which were used for calculation of the outer surface poten-tials for latex particles and zeta potentials for glass beadsaccording to Ohshima’s electrophoretic theory for “soft”particles45, 46 and modified Henry expression,47 respectively.Zetasizer Nano ZS was verified against zeta potential transferstandard with accuracy of −50 mV ± 5 mV.
D. Metrological characteristics of instrumentation
The primary sources of equipment-associated uncertain-ties used for calculation of CSUs in modelling parametersare metrological characteristics of instrumentation reportedby the respective manufacturers (see Table IV). Accuracyof the analytical balance was used for calculation of uncer-tainties in “pore volumes injected.” Performance of NE-1000dual-syringe pump was checked over the period of experiment(10 h): masses of MilliQ water delivered by these pumps weremeasured by KERN analytical balance, and calculated stan-dard deviation of 10 mass measurements was equal to 0.8%,agreeing with reported pump accuracy (see Table IV). Den-sity of water needed for the evaluation of water volumes wasadopted from Wagner et al.48 In all tests, the standard devia-tion in water volumes was <±1%. The reported accuracy forMastersizer 2000 was adopted as the experimental uncertaintyfor glass bead size distribution measurements.
TABLE III. Latex particle characteristics.
Polysciences Inc. PAMAS S4031 GO
rc, mean (μm) ±σ (rc) (μm) rc,wm (μm) ±σwm (rc) (μm) ±σ N (particles) ±δN (%) % of particles
0.886 0.023 0.816 0.083 11 690 1.55 91.51.032 0.034 1.149 0.316 6828 0.83 91.71.568 0.037 1.543 0.270 1641 0.59 91.72.179a 0.057a 2.061a 0.335a 2026a 0.46a 94.2a
3.168 0.183 3.069 0.182 727 0.83 90.8
aUsed as an example for calculations.
184

015111-5 Badalyan et al. Rev. Sci. Instrum. 85, 015111 (2014)
TABLE IV. Metrological characteristics of instrumentation.
Instrument Measuring range Accuracy
KERN EW 420-3NM 0–420 g 0.005 gNE-100 dual-syringe pump 29.13 μl/h–2120 ml/h 1.0%Mastersizer 2000 0.02–2000 μm 1.0%
Experimental uncertainties for particles number in inletand outlet suspensions from the packed column were deter-mined using accuracy of PAMAS. This accuracy was deter-mined via repeatability measurements of particles number for5 different-sized latex particles. For each particle size we car-ried out 10 consecutive measurements. The weighted meanvalues for particle radii, rci ,wm, and corresponded weightedmean standard deviations, σwm(rci
), are more representativethan the respective mean values, since the PAMAS deliv-ers data for particle number over a narrow particle size dis-tribution range. These values were calculated by processingrci
= f (Ni)-data, where Ni is the number of particles for ′′i′′
range of particle radii measured by the PAMAS. Numbers ofparticles used in these calculations were between 90.8% and94.2% of the total number of particles delivered by PAMAS,±δN. Thus obtained data are reported in Table III and, ac-cording to NIST Guidelines,38 are adopted as precisions forparticle number, ±σNi
, and radii, σwm(rci).
IV. RESULTS
A. pH, electrophoretic mobilities and zeta-potential
Variation of pH of effluent latex-based suspensions dur-ing size exclusion studies never dropped below 10.16. This isa sure sign of consistent experimental conditions.
Although MilliQ deionised water was used for the prepa-ration of suspension, it is not appropriate to consider thismedium as the so-called “salt-free” due to the presence of H+
and OH− in MilliQ water.49 According to Merck Millipore,50
concentration of sodium and chlorine ions in MilliQ wateris 0.22 and 1 ppt (ng/l), respectively. This, together with theamount of NaOH added to MilliQ water to adjust pH > 10translates to a maximum molar concentration of sodium ionsas CNa+ = 1.248 × 10⁻⁴ M and ionic strength of I = 6.24× 10⁻⁵ M. Taking into account the radius of latex micro-spheres as rc = 2.061 μm, we arrive at κrc = 53.43, whereκ = 2.592 × 10⁷ m−1 is the Debye-Hückel (D-H) recipro-cal length for a symmetrical monovalent electrolyte (NaCl),according to Elimelech et al.51
For the evaluation of zeta-potential from experimentalelectrophoretic mobility data the Smoluchowski (κrc � 1 andelectrolyte concentration should be >10−3 M) and Hückel(κrc � 1 and non-aqueous solutions) equations are widelyused in literature. However, for the present experimental con-ditions for latex microspheres (κrc = 53.43 and ionic strengthI = 6.24 × 10⁻⁵ M), according to Elimelech et al.,51 both ofthese equations are not suitable, since calculated ζ -potentialvalues do not accurately represent actual surface potentialsof carboxyl coated latex microspheres. Another reason fornon-applicability of the above zeta-potential models is that
when latex microspheres are coated by a polyelectrolyte layer(carboxyl-modified in the present study), they are treated asthe so-called “soft” particles since ions from an electrolytesolution can penetrate into the surface layer of carboxylcoating.45, 46
To overcome limitations of Smoluchowski and Hückelmodels, several formulas were proposed by Ohshima45, 46 forelectrophoretic mobilities of “soft” particles:
μ = εrε0
η
ψ0
κm
+ ψDON
λ
1
κm
+ 1
λ
+ ρf ix
ηλ2, (1)
ψ0 = kT
ze
⎛⎝ln
⎡⎣ ρf ix
2zen∞ +{(
ρf ix
2zen∞
)2
+ 1
}1/2⎤⎦
+ 2zen∞
ρf ix
⎡⎣1 −
{(ρf ix
2zen∞
)2
+ 1
}1/2⎤⎦⎞⎠ , (2)
ψDON = kT
zeln
⎡⎣ ρf ix
2zen∞ +{(
ρf ix
2zen∞
)2
+ 1
}1/2⎤⎦ , and
(3)
κm = κ
[1 +
(ρf ix
2zen∞
)2]1/4
, (4)
where μ is electrophoretic mobility, m2
V ×s; εr is relative per-
mittivity of aqueous solutions of NaCl at 25 ◦C and variousionic strengths, adopted from Buchner et al.;52 ε0 = 8.854× 10⁻¹² is dielectric permittivity of vacuum; η = 8.9002× 10⁻⁴ Pa s is dynamic viscosity of water;53 ψ0 andψDON are the outer surface and the Donnan potentials, re-spectively, V ; κm is the Debye-Hückel parameter for thepolyelectrolyte layer with fixed charges contribution,46 m−1;1λ
is electrophoretic “softness” of latex particle, m; ρfix
= ZeN is fixed charge density of for the polyelectrolytelayer, C
m3 ; Z = 1 is the valence of the symmetrical func-tional groups; e = 1.602 × 10⁻¹⁹ C is the elementaryelectric charge; and N is the number concentration of thedissociated carboxyl functional groups, m−3; k is Stefan-Boltzmann constant, J
K; T = 298.15 ± 0.1 K is absolute
temperature of suspension; z is valence of a symmetricalelectrolyte solution; and n∞ is bulk concentration of theelectrolyte, m−3.
Equation (1) can be re-written in the following form:
μ = εrε0
η
ψ0
κm
1
κm
+ 1
λ
+ εrε0
η
ψDON
λ1
κm
+ 1
λ
+ ρf ix
ηλ2
= εrε0
η
ψ0λ
κm + λ+ εrε0
η
ψDONκm
κm + λ+ ρf ix
ηλ2
= μ0 + μDON + μ∞. (5)185

015111-6 Badalyan et al. Rev. Sci. Instrum. 85, 015111 (2014)
-1.0E-07
-8.0E-08
-6.0E-08
-4.0E-08
-2.0E-08
0.0E+00
0.0 0.2 0.4 0.6 0.8 1.0
Ele
ctro
phor
etic
mob
ility
, m2 /
(V×s
)
Ionic strength, M
FIG. 2. Variation of electrophoretic mobility for latex particles as a functionof ionic strength of NaCl solution: red •, experimental data; dark blue ——,according to (1).
Increase of electrolyte concentration, n∞ → ∞, results inshrinkage of the diffuse layer with κ → ∞ (and, conse-quently, κm → ∞). At this limit, ψ0 → 0 and ψDON → 0as follows from Eqs. (2) and (3), leaving μ0 → 0 and μDON
→ 0, respectively. As the result, μ∞ = ρf ix
ηλ2 , meaning vanish-ing of all potentials.46
Limiting non-zero value of μ∞ with two unknown pa-rameters, ρfix and λ, corresponds to the experimental condi-tion with maximum electrolyte concentration. At high ionicstrengths of solutions, electrophoretic mobility of rigid par-ticles tends to zero. When residual electrophoretic mobilityvalues are observed at high ionic strength of an electrolyteone is dealing with “soft” particles.40 Electrophoretic mobili-ties of latex microspheres were measured at ionic strengths ofNaCl solutions varying from 0.000125 to 1 M (see Fig. 2) andwere reproducible within their experimental uncertainties (thehighest deviation was 12.3%, which can be regarded as satis-factory). Electrophoretic mobilities measurements at higherionic strengths 2, 3, 4, and 5 M NaCl were very difficult toperform due to strong polarisation of electrodes of the mea-suring cell54 and agglomeration of suspended particles.11 Thisled to a significant spread of experimental electrophoretic mo-bility data at high ionic strengths of electrolyte solution, al-though every effort was made to improve data repeatabilitysuch as: ultrasonification of sample prior to measurementsand reduction of time interval after sample ultrasonificationand measurement down to 5 s (stabilisation of sample time).Electrophoretic mobility of μ∞ = (−1.268 ± 0.156) × 10−8
m2/(V s) corresponding to 1.0 M NaCl salinity was adopted asa residual electrophoretic mobility of carboxyl-modified latexmicrospheres.
According to Ohshima et al.,55 the first approximationof the pair ρfix and λ can be obtained by fitting ρf ix
ηλ2 tothe electrophoretic mobility value corresponded to maximumelectrolyte concentration, μ∞. However, the authors did notspecify which iteration algorithm was employed to fit elec-trophoretic mobility data at lower ionic strength resulting inthe final values of ρfix and λ. de Kerchove and Elimelech56
applied the Levenberg-Marquardt method to μ = f(I)-data for
the determination of ρfix and λ in the range of ionic strengthsfrom 1 to 300 mM KCl.
In the present study, a weighted nonlinear least squaresmethod57 with the two adjusting parameters ρfix and λ wasused. Since each experimental value of electrophoretic mo-bility for latex particles, μi, has its own standard deviation,σ i (which is adopted as experimental uncertainty), respec-tive weight functions, wi = 1
σ 2i
, were calculated for elec-
trophoretic mobility data. Values of μcalci were calculated
according to Eq. (5) using ρfix and λ data for similar car-boxyl microspheres adopted from Kuznar and Elimelech40
as the initial input data. Then, the following values of (μcalc
− μexper)2 and wi(μcalc − μexper )2 were calculated. Minimis-ing
∑i=16i=1 [wi(μcalc − μexper )2] via iteration procedure using
Solver in the Microsoft ExcelTM resulted in the final valuesof the particle charge density ρfix = −1064 mM and elec-trophoretic “softness” 1
λ= 0.242 nm.
Using Eqs. (2) and (3), the following potentials were cal-culated: ψ0 = −206.8 mV and ψDON = −232.5 mV. Ap-plication of Smoluchowski model to electrophoretic mobilitydata significantly overestimates surface potential of carboxyl-modified latex particles, resulting in ψSmol.
0 = (−96.32± 5.25) mV.
Application of corrections for the electrophoretic re-tardation and relaxation effects for glass beads accord-ing to Abramson58 gives the following value for theHenry correction factor f1(κrc) = 1.440. Using experimen-tal electrophoretic mobility data for glass beads and Henryexpression:47
ζb = 3UEμ
2εf1(κrc), (6)
where UE is electrophoretic mobility of particle of interest,mV; μ – fluid dynamic viscosity, Pa s; and ε – permittivity ofMilliQ water; we obtained the following zeta-potential value:ζ beads = (−51.99 ± 3.15) mV.
B. Particle size distribution
1. Glass beads particle and pore size distribution
Results of size distributions for supplied and sieved beadsare presented in Table II. Sieved glass beads were used forthe preparation of packed bed, through which suspended latexparticles were pumped. To use experimental data for calcula-tions, pore size distribution of a porous medium in a packedcolumn is needed. Previous experiments for bed packing withglass beads have shown that the most probable bead packingtype is rhombohedral with 39.6% porosity.13 In such a pack-ing, two dimensional cross-section gives a pore throat formedby three circles with the forth one (circular pore throat) in-scribed between them. The radius of the forth circle can bedetermined by the Descartes theorem.59 Using this theoremand @RISK analysis software with Monte-Carlo simulationsfor Excel (Palisade Corporation, Ithaka, NY, USA) pore throatsize distribution was determined, rp, with LogNormal distri-bution giving the best fit to the experimental data. Resultsof Monte-Carlo simulations (100 000 iterations) are given in
186

015111-7 Badalyan et al. Rev. Sci. Instrum. 85, 015111 (2014)
Table II. Standard deviation was adopted as an uncertainty inthe evaluation of pore radius.60
2. Latex particle size distribution
Although the manufacturer supplied latex microsphereswith values of their mean diameter and standard deviation, inorder to keep internal consistency in calculations of latex mi-crosphere concentrations and jamming ratios we used our ex-perimental data obtained using PAMAS particle counter/sizeras described in Secs. III B 2 and III D. Suspended particlesize distribution used as the example for uncertainty calcula-tions (see footnote for Table III) together with weighted meanradii and standard deviations for the studied latex particles arepresented in Table III.
C. Total interaction potential between latex particlesand glass beads
In the present study, the major mechanism of particle cap-ture is size exclusion, meaning that particle attachment andbridging are negligible. Particle-bead interaction41, 42 is deter-mined by attractive long-range London-van der Waals, andshort-range repulsive electrical double layer and Born forcescontributing to the total particle-surface potential energy, Vtot ,as follows:
Vtot = VLW + VEDL + VB, (7)
where VLW , VEDL, and VB are London-van der Waals, electro-static double layer, and Born potential energies, respectively,kBT. Introduction of a short-range Born repulsion force fromthe Lennard-Jones “m-n” potential into Eq. (7), according toElimelech et al.,51 accounts for overlapping of electron cloudswhen atoms find themselves in the close vicinity from eachother.
Since the ratio between mean glass bead radius and
weighted mean latex particle radius is equal torLogNorm
b,mean
rc,wm= 14.4
(see Table II), the formula proposed by Gregory61 was usedfor calculation of sphere-plate retarded London-van der Waalspotential:
VLW = −A123rc,wm
6h
[1 − 5.32h
λln
(1 + λ
5.32h
)], (8)
where A123 = 1.028 × 10⁻²⁰ J is Hamaker constant for a sys-tem latex-water-glass calculated in the present study accord-ing to Ref. 43; λ = 100 nm is the characteristic wavelength ofthe interaction according to Ref. 61; and h is particle-surface(sphere-plate) separation distance, h � rc, m.
Value of κrc = 53.43�1 indicates that the double-layerthickness is significantly smaller than the particle size, there-fore, electrostatic double-layer potential can be calculated ac-cording to Gregory:62
VEDL = 128πrc,wmrLogNorm
b,mean n∞kBT(rc,wm + r
LogNorm
b,mean
)κ2
γ1γ2e−κh, (9)
where n∞ = 6.022 × 1025 number/m3 is bulk number den-sity of ions; kB = 1.381 × 10⁻²³ J/K is Boltzmann constant;T is absolute temperature of the system, K; γ1 = tanh( zeψc
4kT)
-1.0E+04
0.0E+00
1.0E+04
2.0E+04
3.0E+04
4.0E+04
5.0E+04
1.E-11 1.E-10 1.E-09 1.E-08 1.E-07 1.E-06 1.E-05
Vto
t/kBT
Separation distance, h, m
-0.050
-0.025
0.000
0.025
0.050
1.E-07 1.E-06 1.E-05
Vto
t/kBT
Separation distance, h, m
FIG. 3. Total interaction potential between latex microspheres and glassbeads.
and γ1 = tanh( zeζb
4kT) are reduced surface potentials for latex
particles and glass beads;51 ψc = ψ0 and ζ b are surface andzeta potentials for latex microspheres and glass beads, respec-tively, V; in this equation mean LogNorm bead radius ap-proaches infinity for a sphere-plate system.
Short-range Born repulsion potential between latex mi-crospheres and glass beads was evaluated according to Ruck-enstein and Prieve:63
VB = A123σ6
7560
[8rc,wm + h
(2rc,wm + h)7+ 6rc,wm − h
h7
], (10)
where σ c = 0.5 nm is collision diameter and n = 12 isLennard-Jones parameter.
Calculation of the total potential of interaction betweenlatex microspheres and glass beads revealed a high repulsionenergy barrier of 40 244 kBT observed on the “total inter-action potential/particle-wall distance”-curve at 0.733 nm asshown in Fig. 3. A presence of a negligible secondary en-ergy minimum with depth of −0.035 kBT was observed at≈436 nm. It means that at all separation distances, electric-double-layer and Born repulsive forces dominate over attrac-tive LW forces, and, therefore, experimental conditions arefavourable for particle-wall repulsion. It can be concluded thatparticle retention mechanism in the present study is size ex-clusion particle capture.
V. SOURCES OF UNCERTAINTIESAND THEIR CONTRIBUTIONS
Linear uncertainty propagation method is used for calcu-lation of CSUs for latex particle concentrations in the form ofthe first-order Taylor series approximation:38
u2c (y) =
∑N
i=1
(∂f
∂xi
)2
u2 (xi)
+ 2∑N−1
i=1
∑N
j=i+1
∂f
∂xi
∂f
∂xj
u(xi, xj ), (11)
187

015111-8 Badalyan et al. Rev. Sci. Instrum. 85, 015111 (2014)
where uc(y) is CSU for a function; u(xi) is CSU for the pa-rameter i; and N is the number of parameters. In the presentuncertainty analysis, input parameters are independent anduncorrelated; therefore, the truncated form of Eq. (11) is usedfor the evaluation of combined uncertainties64, 65
uc (y) =√∑N
i=1
[(∂f
∂xi
)u (xi)
]2
. (12)
A. Weathering of glass beads in alkaline suspensions
Alkaline nature of flowing suspension may affect the sizeof glass beads. As was reported earlier by Jeong et al.,66 soda-lime glass undergoes weathering (corrosion) in solutions withpH-values as high as 10 at 20 to 90 ◦C due to dissolution ofsilica from silica-oxygen (Si–O) bonds. As the result, radiiof glass beads are reduced with the duration of exposure tohigh-pH solutions. Such dissolution causes the change in ini-tial particle size distribution and, consequently, in pore sizedistribution of a porous medium. We determined the effect ofweathering on glass bead radii used in the present studies atthe following conditions: pH ≈ 10 and 20 ◦C. According toJeong et al.,66 silica dissolution rate at pH = 9.81 and 20 ◦Cis equal to ≈6 × 10⁻² g/(m2 day). Taking into account thatthe maximum duration of an experiment is ≈24 h, the reduc-tion of glass bead radii varied from 0.04% to 0.19% for beadradii from 31.5 to 20 μm, respectively (see Table II).
Using Mastersizer 2000, we measured particle size dis-tribution for glass beads (sieving range for rb varied from20 to 31.5 μm) soaked and stirred for 24 h in MilliQ wa-ter with pH ≈ 10 at 20 ◦C and compared with those pre-pared according to the procedure outlined in Sec. II A ofthe present paper. According to Table II, the agreement be-tween the obtained r
LogNorm
b,mean -values is 0.23%, which can beregarded as satisfactory, taking into account that the repro-ducibility of beads sieving procedure is 0.19%. Such reduc-tion in r
LogNorm
b,mean -values due to weathering translates to the
differences in respective rLogNormp,mean -values of 0.33%. Overall,
rLogNormp,mean results for washed glass beads and for those soaked
in alkaline MilliQ water solution agree within respective stan-dard deviations, σ (rLogNorm
p ).
B. Latex particle concentrations and jamming ratios
Concentrations of latex particles in inlet and effluentstreams were determined by PAMAS and expressed in “par-ticles/ml,” rather than in “ppm” or “vol/vol.” Parameters C0
and CL correspond to those from Eq. (12) in the followingform: y = C, x1 = C0, and x2 = CL, thus contributing to CSUin normalised outlet suspended concentration according to thefollowing expression:
uc(C) = uc
(CL
C0
)=
√[∂C
∂CLu(CL)
]2
+[
∂C
∂C0u(C0)
]2
=√[
1
C0u(CL)
]2
+[− CL
(C0)2u(C0)
]2
. (13)
As an example, CSU in normalised concentration wascalculated for suspended particles with rc,wm = 2.061± 0.335 μm (see Table III) flowing through glass beads withrb = 20.0 ÷ 31.5 μm (see Table I). Respective CSUs are givenin Table V, and after using (13) they translate to a normalisedconcentration C = 0.701 ± 0.001. Similar approach was ap-plied to latex particles with different radii (see Table III).
The “jamming ratio” (with a physical meaning of a “di-mensionless particle size”) as one of the parameters in thestochastic model for size exclusion experiments is determinedas the ratio between weighted mean latex particle radius andmean LogNormal pore radius obtained by Monte-Carlo sim-ulations (see Sec. IV B and Tables II and III):
j = rc,wm
rLogNormp,mean
. (14)
Using Eq. (12), CSU in jamming ratio is determined asfollows:
uc(j ) = uc
(rc,wm
rLogNormp,mean
)=
√√√√[∂j
∂rc,wm
u(rc,wm)
]2
+[
∂j
∂rLogNormp,mean
u(r
LogNormp,mean
)]2
=
√√√√√√[
1
rrLogNormp,mean
σwm(rc,wm)
]2
+
⎡⎢⎣− rc,wm(
rLogNormp,mean
)2 σ(r
LogNormp,mean
)⎤⎥⎦2
. (15)
In Eq. (15), we substituted CSU of weighted mean latexparticle radius and CSU of mean LogNormal pore radius bytheir weighted mean standard deviation and standard devia-
tion, respectively. For the above example, the value for thejamming ratio of j = 0.482 ± 0.114 was obtained. Therefore,the jamming ratio can be determined with a relatively high
188

015111-9 Badalyan et al. Rev. Sci. Instrum. 85, 015111 (2014)
TABLE V. Summary of experimental uncertainty analysis results.
Parameter Units CSU RCSU
L m 5.00 × 10⁻⁶ 8.44 × 10⁻⁵
NMAST ERSIZER 2000particle particles N/A 1.00 × 10⁻²
dMAST ERSIZER 2000particle m 2.06 × 10⁻⁸ 1.00 × 10⁻²
NPAMASparticle particles 4624 2.38 × 10⁻²
dPAMASparticle m 8.52 × 10⁻⁸ 4.13 × 10⁻²
Qsyringe m3/s 3.33 × 10⁻¹⁰ 1.0 × 10⁻²
C0 particles/ml 4.258 × 10⁴ 0.0046CL particles/ml 2.983 × 10⁴ 0.0046C N/A 4.558 × 10⁻³ 0.0065rc,wm m 3.77 × 10⁻⁷ 0.19
rLogNormp,mean m 6.73 × 10⁻⁷ 0.16
j N/A 0.116 0.246Corrosion of glass m 1 × 10⁻⁹ 7 × 10⁻⁴
Int-25-1 m/s 0.0325 1.66 × 10⁻⁴
Int-25/26-2 m/s 0.0610 1.58 × 10⁻⁴
Int-26-1 m/s 3.3000 0.251fa(rc) N/A 1.16 × 10⁻⁴ 2.29 × 10⁻⁴
fns(rc) N/A 8.54 × 10⁻³ 2.51 × 10⁻¹
l m 6.73 × 10⁻⁷ 1.03 × 10⁻³
uc(Cmodel), Eq. (27) N/A 3.40 × 10⁻³ 7.92 × 10⁻³
uc(Cmodel), Eq. (28) N/A 3.43 × 10⁻² 4.97 × 10⁻²
uncertainty of 24.3% which can be reduced to 15.5%, ifvalues of particle radius and their standard deviations wereadopted after the manufacturer (see Table III). However,since we are dealing with a population of particles of dif-ferent radii (rather than with a population of particles ofthe same radius), for a more rigorous approach, one shoulduse a weighted mean value for the particle radius and itsweighted mean standard deviation, which would providehigher uncertainty value for the jamming ratio. Such ap-proach is also correct, since suspended particle concentra-tions were determined by PAMAS giving results in parti-cle number distribution over the range of latex particle radiiresulting in a more representative weighted mean value forthe particle radius, appropriate for the present experimentalconditions.
VI. UNCERTAINTIES FOR TWO STOCHASTICPARTICLE SIZE EXCLUSION MODELS
Information about uncertainties in experimental data anduncertainties in modelling results provide full information formodel evaluation. Some model variables are experimental pa-rameters with their experimental uncertainties; other modelvariables are derived from experimental parameters via em-pirical or theoretical formulas. Therefore, the law of propaga-tion of uncertainties (12) should be applied to the respectivemodelling equations to calculate uncertainties in modellingresults.
Correlation between breakthrough concentration andfraction of accessible and inaccessible flows in size exclu-sion experiments can be predicted by the two stochastic mi-
cromodels developed in Refs. 36 and 37:
CL (rc)
C0 (rc)= exp
(−fns (rc) L
fa (rc) l
), and (16)
CL (rc)
C0 (rc)= {1 − fns (rc)} exp
(−fns (rc)
L
l
), (17)
where fa(rc) is the fraction of accessible flow as a function ofsuspended particle radius; fns(rc) is the fraction of inaccessi-ble flow as a function of suspended particle radius; L is thelength of the column of the porous medium, m; l is the inter-val between chambers where suspended particles are mixedand redistributed; a porous medium is represented by a bun-dle of a parallel capillaries alternated by chambers, m; and l
L
is dimensionless correlation length.Propagation of experimental uncertainties in the two mi-
cromodels described by Eqs. (16) and (17) was evaluated asfollows. Initially, we evaluate uncertainties in the parametersof these equations, namely, u(fa(rc)), u(L), u(fns(rc)) and u(l).As follows from Table V, u(L) = 5.00 × 10⁻⁶ m. Due to thesmall value of the interval between mixing chambers, the pa-rameter l, without a significant error, can be approximated bythe value of the mean LogNormal bead diameter, d
LogNorm
b,mean ,and, then, u(l) is equal to the weighted mean standard devia-tion, u(l) = u(rLogNorm
b,mean ) = σ (rLogNorm
b,mean ).The following approach was used to evaluate u(fa(rc))
and u(fns(rc)). As reported in the paper,36 fractions of accessi-ble and inaccessible flows can be determined as follows:
fa (rc) = Ua
U=
∫ ∞rc
k1(rp)γ (j ) H (rp, x, t)drp∫ ∞0 k1(rp)H (rp, x, t)drp
, and
(18)
fns (rc) = Uns
U=
∫ rc
0 k1(rp)H (rp, x, t)drp∫ ∞0 k1(rp)H (rp, x, t)drp
, (19)
where U, Ua, and Uns are linear velocities of the total, ac-cessible, and inaccessible fluxes, respectively, m/s; k1(rp) isthe conductance through a single pore of a triangular cross-section; and γ (j) is the flux reduction factor; H(rp, x, t)is the concentration of pores with sizes between rp and rp
+ drp at a certain distance x from the inlet of the col-umn and time t, m−3. These parameters are determined asfollows:
k1(rp) = 9√
3
20r4p, and (20)
γi (j ) =⎧⎨⎩ (1 − j )2
(1 + 2j − 1
3j 2 − 4
9j 3
), j < 1
0, j > 1.
(21)In uncertainty calculations, we consider only the case,
when j < 1. Substituting Eqs. (20) and (21) into (16) and (17),189

015111-10 Badalyan et al. Rev. Sci. Instrum. 85, 015111 (2014)
yields:
fa(rc) =
∫ ∞rc
(rp)4
(1 − rc
rp
)2 (1 + 2
rc
rp
− 1(rc)2
3(rp)2− 4(rc)3
9(rp)3
)H (rp, x, t)drp∫ ∞
0 (rp)4H (rp, x, t)drp
, and (22)
fns (rc) =∫ rc
0 (rp)4H (rp, x, t)drp∫ ∞0 (rp)4H (rp, x, t)drp
. (23)
Parameter H(rp, x, t) can be approximated by the Log-Normal curve of pore size distribution for the certain porousmedium (in this case we use beads with radii 20–31.5 μm)obtained from Monte-Carlo simulations in the form:
H (rp, μ, σ ) = 1
rpσ√
2πe− (lnrp−μ)2
2σ2 , (24)
where rp > 0, μ = rp, mean = 4.274 μm, and σ = 0.673 μmare mean and standard deviation, respectively, of the naturallogarithm of the pore radius obtained using Monte-Carlo sim-ulations of the glass bead radii distribution and the Descartesformula (see Table II).
According to Eqs. (22) and (23), integral limits in nomi-nators vary from rs to ∞. Latex particles with rc,wm = 2.061
± 0.335 μm (see Table III) have their radii distributed from1.726 to 2.396 μm which correspond to ≈ 94.2% of the to-tal number of latex particles detected by PAMAS. This rangealmost coincide with ±2σwm(rc) or 95% confidence inter-val. Thus, the integral limits for nominators of Eqs. (22)and (23) are chosen as follows: 1.391 and 2.731 μm (95%confidence interval), for the lower and upper limits, respec-tively. Similarly, as the lower and upper limits for the in-tegral in the denominator of Eqs. (22) and (23) we chooser
LogNormp,mean ± 2σ (rLogNorm
p ) corresponding to 95% confidenceinterval, i.e., 2.928 and 5.620 μm, respectively. With theseassumptions, Eqs. (22) and (23) look as follows:
fa(rc) =
∫ ∞rc
(rp)4
(1 − rc
rp
)2 (1 + 2
rc
rp
− 1(rc)2
3(rp)2− 4(rc)3
9(rp)3
)1
rpσ√
2πe− (lnrp−μ)2
2σ2 drp
∫ ∞0 (rp)4
1
rpσ√
2πe− (lnrp−μ)2
2σ2 drp
, and (25)
fns (rc) =
∫ rc
0 (rp)4 1
rpσ√
2πe− (lnrp−μ)2
2σ2 drp
∫ ∞0 (rp)4
1
rpσ√
2πe− (lnrp−μ)2
2σ2 drp
. (26)
In order to get an accurate approximation for all inte-grals from Eqs. (25) and (26), fractions of accessible and inac-cessible flows can be evaluated by numerical integration us-ing composite Simpson’s rule in the form of the quadraturealgorithm.67
Parameters x1 and x2 (lower and upper limits of integrals)are not fixed numbers, since latex particles are distributed overtheir radii. The correct choice of these integration limits hassignificant effect on the values of these integrals, and conse-quently, on the values of fa(rc) and fns(rc) and their CSUs.
We used the following approach in numerical integrationof the above integrals. The lower limit for the integral in thenominator of formula (25), referred as Int-25-1, was chosen asrc,min = rc,wm = 2.061 μm, consistent with all previous cal-culations. The upper limit for Int-25-1 was chosen using con-secutive iterations by changing values for rc from 2.061 μm
to the value which delivers two consecutive numbers for thisintegral differing by no more than 0.01% resulting in rc, max
= 8.861 μm; applying these lower and upper limits we calcu-lated the value of Int-25-1 to be equal to 195.698 m/s.
Similar approach was used for the evaluation of inte-grals in denominators of formulas (25) and (26), called Int-25/26-2. Using the lower and upper limits for Int-25/26-2as rp, min = 0.010 μm and rp, max = 8.699 μm, respectively,the value of the integral was equal to 386.396 m/s with theprecision of 0.01%. The lower integration limit for the inte-gral in the denominator of formula (26), called Int-26-1, waschosen as rp, min = 0.020 μm, and the upper limit was cho-sen as rp,max = rc,wm + 4σwm (rc) = 3.401 μm to count formore than 99.9% of latex particle sizes used in the experi-ment; thus, the value of Int-26-1 was equal to 13.1577 m/s.The above approach delivered the following values for pa-rameters in stochastic models: fa(rc) = 0.3982 and fns(rc)= 0.0334.
For the evaluation of uncertainties in these integrals thefollowing approach was applied. Precision of 0.01% can-not be used as a value for the combined uncertainty for
190

015111-11 Badalyan et al. Rev. Sci. Instrum. 85, 015111 (2014)
0.0
0.4
0.8
1.2
0.0 0.4 0.8 1.2
CL/C
0
j
FIG. 4. Suspended normalised concentration vs jamming ratio for the twostochastic models (16) and (17): red •, experimental data; dark green ——model (16); dark green – – –, lower and upper limit for model (16); dark blue——, model (17); dark blue – – –, lower and upper limits for model (17).
Int-25-1, since latex particles are distributed over various sizeranges; otherwise this uncertainty will be significantly un-derestimated. In order to overcome this problem, values ofInt-25-1 were calculated for the two lower integration limits,such as rc,min1 = rc,wm − 2σwm (rc) = 1.391 μm and rc,min2
= rc,wm + 2σwm(rc) = 2.731 μm, and the difference betweenthem was adopted as the combined uncertainty of Int-25-1(see Table V).
Similarly, precision of 0.01% does not reflect the actualvalue of uncertainty in Int-25/26-2. Initially, we attempted toevaluate uncertainty in Int-25/26-2 as for Int-25-1 with theone difference that this integral is calculated for the two val-ues of the mean of the natural logarithm of the pore radius:μ − 2σ (rLogNorm
p ) = 1.1275 and μ + 2σ (rLogNormp ) = 1.7531.
The difference between thus calculated integrals was thoughtto be adopted as an uncertainty for Int-25/26-2. However, thisdifference is enormously sensitive to variations of μ: value ofInt-25/26-2 is equal to the area under pore size distributioncurve which varies significantly for the above two values ofthe mean of the natural logarithm of the pore radius, 1.1275and 1.7531. The difference between thus calculated integralsdoes not reflect the actual value of its uncertainty. Therefore,this approach cannot be considered as appropriate. A betterway to evaluate this integral for the two values of the upperlimits is as follows: rp,max1 = rp,max − 2σwm(rc) = 8.029 μm,rp,max2 = rp,max + 2σwm(rc) = 9.369 μm, and the differencebetween two integral values, equal to 0.032%, adopt as theuncertainty for Int-25/26-2. For the evaluation of Int-25-1 weused rc,min = rc,wm = 2.061±0.335 μm similarly to Int-26-1;
the obtained value for uncertainty for Int-26-1 is 3.3000 m/s,which is significantly higher than that for Int-25-1.
Thus determined uncertainties in the integrals fromEqs. (25) and (26) were used for the evaluation of u(fa(rc))and u(fns(rc)) – see Table V. Having determined values of theparameters in the Eqs. (16) and (17) and their CSUs, we cannow evaluate how these uncertainties propagate to uc(Cmodel)= uc(CL(rs )
C0(rs ) ), using Eq. (12) and properties of derivatives of anexponential function and that of a product of two functions.Equation (12) when applied to Eqs. (16) and (17) translatesthem into the following equations, respectively:
uc (Cmodel) = e− fns (rc )L
fa (rc )l
√√√√√√√√√
[(− L
fa(rc)l
)u {fns(rc)}
]2
+[(
−fns(rc)
fa(rc)l
)u(L)
]2
+[(
− fns(rc)L
{fa(rc)}2 l
)u {fa(rc)}
]2
+[(
−fns(rc)L
fa(rc)l2
)u(L)
]2, and (27)
uc (Cmodel) = e− fns (rc )Ll
√√√√√√√√√
[((fns(rc) − 1)
L
l− 1
)u{fns(rc)}
]2
+[
(fns(rc) − 1)fns(rc)
lu(L)
]2
+[
(1 − fns(rc))
(−fns(rc)L
l2
)u(l)
]2
.
(28)
Using uncertainty uc(Cmodel) from Table V, graphs for ex-perimental data and stochastic models results obtained fromEqs. (16) and (17) were plotted in Fig. 4. As follows fromthis figure, model (16) having lower CSU (with its bound-ary indicated by the “green” dotted line) delivers the follow-ing results for CL(rc)
C0(rc) = f (j ): agreement between modelling
results and experimental data is within combined respectiveCSUs at lower values of jamming ratios, however, at higherjamming ratios agreement is not good. Although charac-terised by a higher CSU (with its boundary indicated bythe “blue” dotted line), Eq. (17) delivers more accurate re-sults in the entire jamming ratio range: agreement between
191
015111-12 Badalyan et al. Rev. Sci. Instrum. 85, 015111 (2014)
experimental data and modelling results is within the CSUof experimental data. This uncertainty analysis clearly showssuperiority of the model (17) over (16).
The presented uncertainty analysis can be used not onlyfor the evaluation of the validity of theoretical models usedfor deep bed filtration, but also for comparison of intra- andinter-laboratory data.
VII. CONCLUSIONS
Two theoretical stochastic models for prediction ofcarboxyl-modified latex particles capture due to size exclu-sion were compared and verified using a detailed analysisof experimental and modelling uncertainties. Calculation ofmodelling uncertainties was carried out using the law of prop-agation of experimental uncertainties through the modellingformulas.
Surface potentials for carboxyl-modified latex particleswere calculated using Ohshima theory for “soft” particlesdue to the presence of the residual electrophoretic mobil-ity at high values of ionic strength of electrolyte. Applica-tion of the Smoluchowski model to electrophoretic mobilitydata significantly overestimates surface potentials for latexparticles.
Size exclusion particle capture is characterised by repul-sive electric-double-layer and Born forces which dominate atall separation distances between latex particles and a porousmedia, and consequently, by a very high repulsive DLVO en-ergy barrier and a shallow secondary energy minimum.
Weighted mean radius and weighted mean standard devi-ation better than respective mean values represent size of latexparticles due to their distribution over various sizes. High al-kalinity of suspensions does not have appreciable weatheringeffect on the diameter of glass beads resulting in stability ofthe jamming ratio factor used as a modelling parameter. How-ever, as the result of particle and pore-throat size distributions,jamming ratio factor is characterised by the highest combinedstandard uncertainty among all experimental and modellingparameters.
Normalised suspended particle concentrations calculatedvia two theoretical models are characterised by higher CSUsthan those for experimental data. The model accounting thefraction of inaccessible flow as a function of latex particleradius excellently agrees with experimental normalised sus-pended particle concentrations in the entire range of jammingratios.
Overall, the proposed methodology makes a valuablecontribution towards better understanding of the correlationbetween experimental parameters and modelled results, de-termining the ways of reduction of respective uncertainties,validating the proposed models during size exclusion exper-iments and provides criteria for estimation of reproducibilityof intra- and inter-laboratory experimental data.
ACKNOWLEDGMENTS
Authors thank Institute of Minerals and Energy Re-sources (IMER) of the University of Adelaide for finan-cial support. Financial support from the Australian Research
Council (ARC) Discovery Project 1094299 and Santos Pty.Ltd. is gratefully acknowledged.
1K. C. Khilar and H. S. Fogler, Migration of Fines in Porous Media (KluwerAcademic Publishers, Dordrecht, 1998).
2J. L. Bergosh, R. B. Wiggins, and D. O. Ennis, Mechanisms of for-mation damage in matrix-permeability geothermal wells. ContactorReport for Sandia National Laboratories. Sandia National Laboratories,Albuquerque, New Mexico, 87185, USA. 74 pp, (1981). Available at:http://0-www.osti.gov.iii-server.ualr.edu/geothermal/servlets/purl/5350144-YeZvsW/native/5350144.pdf.
3A. A. Tchistiakov, in Proceedings of World Geothermal Congress 2000,Kyushu, Tohoku, Japan (International Geothermal Association, Bohum,Germany, 2000), pp. 3087–3095.
4J. P. Herzig, D. M. Leclerc, and P. Le Goff, Ind. Eng. Chem. 62(5), 8–35(1970).
5L. Nabzar, G. Chauveteau, and C. Roque, “A new model for forma-tion damage by particle retention,” in SPE Formation Damage ControlConference, Lafayette, Louisiana, USA (Society of Petroleum Engineers,Inc., Richardson, Texas, USA, 1996), SPE-31119-MS, 16 pp. Available at:http://www.onepetro.org/mslib/servlet/onepetropreview?id=00031119.
6S. A. Bradford, J. Simunek, M. Bettahar, M. T. van Genuchten,and S. R. Yates, Water Resour. Res. 42, W12S15/11–W12S15/16,doi:10.1029/2005WR004791 (2006).
7R. G. Guedes, F. Al-Abduwani, P. Bedrikovetsky, and P. K. Currie, Soc.Pet. Eng. J. 14(September), 477–487, doi:10.2118/98623-PA (2009).
8D. Rosseau, L. Hadi, and L. Nabzar, SPE Prod. Oper. 23(4), 525–531,doi:10.2118/107666-PA (2008).
9J. N. Ryan and M. Elimelech, Colloids Surf., A 107, 1–56 (1996).10S. B. Roy and D. A. Dzombak, Colloids Surf., A 107, 245–262 (1996).11J. Bergendahl and D. Grasso, Am. Inst. Chem. Eng. J. 45(3), 475–484
(1999).12S. A. Bradford, S. R. Yates, M. Bettahar, and J. Simunek, Water Resour.
Res. 38(12), 63-1–63-12, doi:10.1029/2002WR001340 (2002).13P. Chalk, N. Gooding, S. Hutten, Z. You, and P. Bedrikovetsky, Chem. Eng.
Res. Des. 90(1), 63–77 (2012).14J. E. Tobiason and C. R. O’Melia, J. Am. Water Works Assoc. 80(12), 54–
64 (1988).15M. Elimelech and C. R. O’Melia, Langmuir 6(6), 1153–1163 (1990).16M. Elimelech and C. R. O’Melia, Environ. Sci. Technol. 24(10), 1528–
1536 (1990).17H. Yuan and G. Sin, Chem. Eng. J. 168(2), 635–648 (2011).18C. S. Melching and S. Anmangandla, J. Environ. Eng. 118(5), 791–805
(1992).19J. Xue and J. Ma, in 2012 20th International Conference on Geoinformat-
ics (GEOINFORMATICS), Hong Kong, China (Institute of Electrical andElectronics Engineers, New York, NY, USA, 2012), pp. 487–491.
20P. Reichert and P. Vanrollenghem, Water Sci. Technol. 43(7), 329–338(2001).
21M. Neumann and W. Gujer, Environ. Sci. Technol. 42(11), 4037–4043(2008).
22A. L. James and C. M. Oldenburg, Water Resour. Res. 33(11), 2495–2508,doi:10.1029/97WR01925 (1997).
23C. L. Smith, J. Idaho Acad. Sci. 30(2), 93–105 (1994).24C. Tien, ChEnC 17(1–6), 361–382 (1982).25P. A. Deshpande and D. R. Shonnard, Appl. Environ. Microbiol. 66(2),
763–768 (2000).26F. A. H. Al-Abduwani, R. Farajzadeh, W. M. G. T. van den Broek, P. K.
Currie, and P. L. J. Zitha, Rev. Sci. Instrum. 76, 103704 (2005).27D. C. Mays and J. R. Hunt, Environ. Sci. Technol. 39(2), 577–584
(2005).28A. O. Imdakm and M. Sahimi, Phys. Rev. A 36(11), 5304–5309,
doi:10.1103/PhysRevA.36.5304 (1987).29S. D. Rege and H. S. Fogler, Chem. Eng. Sci. 42(7), 1553–1564 (1987).30A. Santos and P. Bedrikovetsky, Comput. Appl. Math. 23(2–3), 259–284
(2004).31A. A. Shapiro, P. G. Bedrikovetsky, A. Santos, and O. O. Medvedev, TPM
67(1), 135–164, doi:10.1007/s11242-006-0029-5 (2007).32A. Shapiro and P. G. Bedrikovetsky, Physica A 389(13), 2473–2494 (2010).33A. Badalyan and P. Pendleton, Langmuir 19(19), 7919–7928 (2003).34A. Badalyan and P. Pendleton, J. Colloid Interface Sci. 326(1), 1–7 (2008).35A. Badalyan, T. Carageorgos, P. Bedrikovetsky, Z. You, A. Zeinijahromi,
and K. Aji, Rev. Sci. Instrum. 83, 095106 (2012).
192

015111-13 Badalyan et al. Rev. Sci. Instrum. 85, 015111 (2014)
36Z. You, A. Badalyan, and P. Bedrikovetsky, Soc. Pet. Eng. J. 18(4), 620–633, doi:10.2118/162941-PA (2013).
37H. Yuan, Z. You, A. Shapiro, and P. Bedrikovetsky, Chem. Eng. J. 226,227–237 (2013).
38B. N. Taylor and C. E. Kuyatt, Guidelines for Evaluating and Expressingthe Uncertainty of NIST Measurement Results, National Institute of Stan-dards and Technology Technical Note 1297, 1994 ed. (U.S. GovernmentPrinting Office, Washington, DC, 1994).
39Quantifying Uncertainties in Analytical Measurements, EURACEM/CITACGuide CG4, 2nd ed., edited by S. L. R. Ellison, M. Rosslein, and M.Williams (EURACHEM, UK, 2000).
40Z. A. Kuznar and M. Elimelech, Colloids Surf. Physicochem. Eng. Aspects294(1–3), 156–162 (2007).
41L. D. Landau and E. M. Lifshitz, Statistical Physics, Part 1 (Course inTheoretical Physics) (Pergamon Press, Oxford, 1980), Vol. 5.
42E. J. W. Verwey and J. T. G. Overbeek, Theory of the Stability of LyophobicColloids (General Publishing Company, Toronto, Canada, 1999).
43J. N. Israelachvili, Intermolecular and Surface Forces, 3rd ed. (AcademicPress, Sydney, 2011).
44S. H. Behrens, D. I. Christl, and R. Emmerzael, Langmuir 16(6), 2566–2575 (2000).
45H. Ohshima, J. Colloid Interface Sci. 163(2), 474–483 (1994).46H. Ohshima, Sci. Technol. Adv. Mater. 10, 063001 (2009).47R. J. Hunter, Zeta Potential in Colloid Science: Principles and Applications
(Academic Press, Sydney, 1981).48W. Wagner, J. R. Cooper, A. Dittmann, J. Kijima, H.-J. Kretzschmar, A.
Kruse, R. Mares, K. Oguchi, H. Sato, I. Stocker, O. Sifner, Y. Takaishi, I.Tanishita, J. Trubenbach, and T. Willkommen, J. Eng. Gas Turbines Power122, 150–182 (2000).
49H. Ohshima, J. Colloid Interface Sci. 262, 294–297 (2003).50See http://www.millipore.com/techpublications/tech1/ab1946en00 for in-
formation about Merck Millipore, application brief (assessed 25 December2012).
51M. Elimelech, J. Gregory, J. Xiadong, and W. Richard, Particle Depositionand Aggregartion: Measurement, Modelling, and Simulation (Butterworth-Heinemann, New York, 1995).
52R. Buchner, G. T. Hefter, and P. M. May, J. Phys. Chem. A 103(1), 1–9(1999).
53J. R. Cooper and R. B. Dooley, Release of the IAPWS formulation 2008 forthe viscosity of ordinary water substance (The International Association ofthe Properties of Water and Steam, Berlin, Germany, 2008).
54X. Wang and V. Alvarado, Energies 4, 1763–1778 (2011).55H. Ohshima, K. Makino, T. Kato, K. Fujimoto, T. Kondo, and H.
Kawaguchi, J. Colloid Interface Sci. 159, 512–514 (1993).56A. J. de Kerchove and M. Elimelech, Langmuir 21(14), 6462–6472
(2005).57R. de Levie, Advanced Excel for Scientific Data Analysis, 2nd ed. (Oxford
University Press, New York, 2008).58H. A. Abramson, L. S. Moyler, and M. H. Gorin, Electrophoresis of Pro-
teins (Reinhold, New York, 1942).59D. Pedoe, Am. Math. Monthly 74(6), 627–640 (1967).60H. Castrup, in 8th Annual ITEA Instrumentation Workshop (Park Plaza Ho-
tel and Conference Center, Lankaster, CA, 2004), p. 7.61J. Gregory, J. Colloid Interface Sci. 83(1), 138–145 (1981).62J. Gregory, J. Colloid Interface Sci. 51(1), 44–51 (1975).63E. Ruckenstein and D. C. Prieve, Am. Inst. Chem. Eng. J. 22(2), 276–283
(1976).64Evaluation of measurement data - Guide to the expression of uncertainty in
measurement, JCGM 100:2008 (Joint Committee for Guides in Metrology,France, 2008).
65S. Mekid and D. Vaja, Measurement 41, 600–609 (2008).66S.-Y. Jeong, L. R. Morss, and W. L. Ebert, Scientific Basis for Nuclear
Waste Management XXVI, Materials Research Society 2001 Fall Meeting,November 26–30, 2001.
67R. L. Burden and J. D. Faires, Numerical Analysis, 8th ed. (Brooks Cole,New York, 2004).
193

5.2 Critical Analysis of Uncertainties during Particle Filtration
Badalyan A., Carageorgos T., Bedrikovetsky P., You Z., Zeinijahromi A., Aji K.
Review of Scientific Instruments, 2012, 83, 095106/1-9
194

Critical analysis of uncertainties during particle filtrationAlexander Badalyan, Themis Carageorgos, Pavel Bedrikovetsky, Zhenjiang You, Abbas Zeinijahromi, and
Keyiseer Aji Citation: Review of Scientific Instruments 83, 095106 (2012); doi: 10.1063/1.4749844 View online: http://dx.doi.org/10.1063/1.4749844 View Table of Contents: http://scitation.aip.org/content/aip/journal/rsi/83/9?ver=pdfcov Published by the AIP Publishing
This article is copyrighted as indicated in the article. Reuse of AIP content is subject to the terms at: http://scitationnew.aip.org/termsconditions. Downloaded to IP:
192.43.227.18 On: Thu, 12 Dec 2013 03:08:01
195

REVIEW OF SCIENTIFIC INSTRUMENTS 83, 095106 (2012)
Critical analysis of uncertainties during particle filtrationAlexander Badalyan,a) Themis Carageorgos, Pavel Bedrikovetsky, Zhenjiang You,Abbas Zeinijahromi, and Keyiseer AjiAustralian School of Petroleum, University of Adelaide, Adelaide, South Australia 5005, Australia
(Received 30 April 2012; accepted 19 August 2012; published online 11 September 2012)
Using the law of propagation of uncertainties we show how equipment- and measurement-relateduncertainties contribute to the overall combined standard uncertainties (CSU) in filter permeabil-ity and in modelling the results for polystyrene latex microspheres filtration through a borosilicateglass filter at various injection velocities. Standard uncertainties in dynamic viscosity and volumetricflowrate of microspheres suspension have the greatest influence on the overall CSU in filter perme-ability which excellently agrees with results obtained from Monte Carlo simulations. Two modelparameters “maximum critical retention concentration” and “minimum injection velocity” and theiruncertainties were calculated by fitting two quadratic mathematical models to the experimental datausing a weighted least squares approximation. Uncertainty in the internal cake porosity has the high-est impact on modelling uncertainties in critical retention concentration. The model with the internalcake porosity reproduces experimental “critical retention concentration vs velocity”-data better thanthe second model which contains the total electrostatic force whose value and uncertainty have notbeen reliably calculated due to the lack of experimental dielectric data. © 2012 American Institute ofPhysics. [http://dx.doi.org/10.1063/1.4749844]
I. INTRODUCTION
Experimental1, 2 and theoretical3 approaches for descrip-tion of deep bed filtration successfully coexist and comple-ment each other leading to improvement in process design inpetroleum and geothermal water processes, in environmen-tal processes and other areas dealing with particles migration.Microparticles attachment due to electrostatic attraction to thesurface of a porous medium can be studied using colloidalsuspension flow through an engineered porous medium. Thechemistry and hydrodynamics of the colloidal suspension,surface chemistry of colloids and porous media, and particleand pore sizes are important parameters in the particle attach-ment process. Attachment of particles onto a porous mediumis accompanied by reduction in its permeability due to the de-posit of colloidal particles that decrease the cross-sectionalarea available for suspension flow. The colloids depositionprocess can be monitored by measuring the permeability de-cline. This deposition can be reliably determined if experi-mental uncertainty in the permeability of a porous mediumis known. Despite its importance, the uncertainties in exper-imental permeability data during coreflood tests are not rou-tinely implemented in laboratory investigations and not muchattention has been given in the literature.
Nevertheless, Kwon et al.4–6 graphically determined per-meability of shale specimens to NaCl solutions with standarddeviation of 1%–3% excluding any errors in the evaluationof pressure drop across the shale specimen, dynamic viscos-ity, and compressibility of NaCl solutions. Applying the lawof propagation of uncertainties and Monte Carlo simulationto Darcy equation, Dong7 identified uncertainties in viscos-ity and pressure as the major sources of uncertainty in per-meability. Mazumder and Wolf8 applied an error analysis to
a)Author to whom correspondence should be addressed. Electronic mail:[email protected].
Darcy equation and experimental data of sub- and supercrit-ical CO2 flow through coal samples. Uncertainty in pressuregradient along the coal specimen was the major contributor tothe overall uncertainty in permeability of around 20%.
Good reproducibility of permeability measurements isimportant for comparison of experimental data from intra- andinter-laboratory tests.9 Brighenti and Macini indicated that“a standardization of permeability measurement procedure isnecessary, in order to ensure reliable comparisons amongstdifferent sets of data.”10 Such standardization is difficult toachieve due to: unavailability of “certified permeability stan-dards from recognised standard institutions,”11 and the lim-ited information about experimental uncertainties for perme-ability and particle concentration data.
Theoretical models for different particle capture mech-anisms have been developed and represent the respective ex-perimental data with various degrees of agreement.12–15 How-ever, according to Al-Abduwani et al.,16 validation of suchmodels via different experimental methods is limited. Addi-tionally, unavailability of uncertainty analyses for models de-scribing suspension transport in porous media and limited in-formation about uncertainties for the respective experimentaldata makes validation of such models difficult.
In the present work, a detailed and systematic analysisof experimental and modelling uncertainties associatedwith permeability measurements during colloidal particleattachment to an engineered porous medium is done. Particleattachment during colloidal suspension injection at differentvelocities was monitored via real-time measurements of theporous medium permeability and post-experimental colloidsmass balance. The law of propagation of uncertainties wasapplied for calculation of uncertainties in parameters of Darcyequation. Parameters having the greatest effect on uncertain-ties in permeability and modelling results were identified,and recommendations for reducing modelling uncertainties
0034-6748/2012/83(9)/095106/9/$30.00 © 2012 American Institute of Physics83, 095106-1
This article is copyrighted as indicated in the article. Reuse of AIP content is subject to the terms at: http://scitationnew.aip.org/termsconditions. Downloaded to IP:
192.43.227.18 On: Thu, 12 Dec 2013 03:08:01
195

095106-2 Badalyan et al. Rev. Sci. Instrum. 83, 095106 (2012)
TABLE I. Chemical composition of a borosilicate glass filter.
Compound SiO2 B2O3 Na2O3 Al2O3 CaO Cl MgO Fe2O3
%, w/w 80.60 12.60 4.20 2.20 0.10 0.10 0.05 0.04
were presented. Recommendations from NIST17 andEURACHEM18 uncertainty guidelines were used in thispaper.
II. MATERIALS
A. Borosilicate glass filter
A borosilicate sintered glass filter (ROBU R©, Glasfilter-Geraete GmbH, Hattert, Germany), with pore sizes varyingwithin 10–16 μm (from now on called filter) was used asporous medium. Chemical composition of this filter accord-ing to the manufacturer is given in Table I. The filter porositywas determined as 43% by the Archimedes method.
B. Colloidal latex particles
Polystyrene latex microspheres crafted by surface car-boxyl groups (Polysciences, Inc., Warrington, PA) were usedfor the preparation of colloidal suspension. According to themanufacturer, these microspheres have a mean diameter ofdc, mean = 1.019 ± 0.032 μm which translates to the meanjamming ratio of j = dc,mean
dpore,mean= 0.08.
The colloidal suspension was prepared by adding the mi-crospheres to a 0.1 M NaCl aqueous solution at pH 3. In theseconditions there is almost no self-agglomeration, bridging orsize exclusion capture.19, 20
III. EXPERIMENTAL SECTION
A. Experimental setup
A schematic diagram of the setup for filter permeabilitymeasurements is shown in Fig. 1. The filter 1 is held inside arubber sleeve 2 located in a high-pressure core holder 3. Anoverburden pressure is established by pumping MilliQ waterthrough a manual valve 4 (Swagelok R©), and measured by aBourdon tube pressure gauge 5 (Swagelok). The colloidal sus-pension was pumped through the filter by a high-performanceliquid chromatography (HPLC) pump 6 (Scientific Systems,Inc., Lab Alliance, PA) via a manual valve 7 (Swagelok). Aback-pressure regulator 8 (Swagelok) maintains the pore pres-sure at the desired level.
The pore pressure is measured by a PA 33X gauge pres-sure transmitter 9 (KELLER AG fur Druckmesstechnik, Win-terthur, Switzerland). Differential pressure across the filteris measured by four differential pressure transducers 10-13(DPTs) (Validyne Engineering, CA) with different measur-ing ranges. Manual valves 14-17 connect a respective DPTto a flow-through system. Each DPT is connected to a re-spective readout/signal conditioner. Output signals from read-outs/signal conditioners (0 to 10 Vdc) and PA 33X (0–5 Vdc)enter the analog input channels of the ADAM-4019+ analog-to-digital data acquisition module 18 (Advantech R©, Taipei,Taiwan), which via the ADAM-5060 RS-232/RS-485/RS-422
FIG. 1. Schematic of a real-time data acquisition and monitoring systemfor liquid permeability of porous media. (“Green” colour denotes openvalves, “red” colour denotes closed valves.) (1) Filter; (2) rubber sleeve;(3) high-pressure core holder; (4, 7, 14-17) manual valves; (5) Bourdon tubepressure gauge; (6) HPLC pump; (8) back-pressure regulator; (9) PA 33Xgauge pressure transmitter; (10-13) Validyne differential pressure transduc-ers; (18) ADAM-4019+ data acquisition module; (19) ADAM-5060 RS-232/RS-485/RS-422 signal converter; (20) personal computer; (21) beakers;(22) PAMAS S4031 GO portable particle counter.
signal converter 19 (Advantech, Taipei, Taiwan) is incorpo-rated into a real-time data acquisition and monitoring systembased on stand-alone personal computer 20. Custom builddata acquisition software based on Advantech ADAMView4.25 application builder calculates and records differentialpressures in real time. Dynamic data exchange server deliv-ers all experimental data (temperature, pressure, differentialpressure, and time) into Microsoft Excel incorporating all cor-responding calculations and graphs.
Particle deposition in the filter was studied at follow-ing velocities: 1.32 × 10⁻³, and (7.92, 3.96, 2.64, and 1.32)× 10−4 m/s. Continuous monitoring of the filter permeabil-ity in real-time provided information about attachment of col-loidal particles: stabilisation of monotonically reduced per-meability within experimental uncertainty in filter permeabil-ity (3.09%) assumed the end of particle attachment processfor the chosen flowrate. As an example, the decrease of fil-ter permeability with particle deposition at velocity of 1.32× 10⁻⁴ m/s is shown in Fig. 2 (vertical bars indicate the CSUin permeability).
The effluent stream was collected in plastic beakers 21(Figure 1), and particle concentrations in the inlet and outletstreams were determined by PAMAS S4031 GO portable par-ticle counter 22 (PAMAS GmbH, Salzuflen, Germany). Thedifference between these concentrations determines the volu-metric concentration of the attached particles. Later, this con-centration was converted to dimensionless (reduced by thevolume of the filter) volumetric concentration or critical re-tention concentration. The following relationship was experi-mentally established (Fig. 3):
σcr = σcr (U ), (1)
where σ cr(U) is critical retention concentration of attachedparticles; and U is velocity, m/s. Particle deposition at 1.32× 10⁻³ and 7.92 × 10⁻⁴ m/s resulted in negligibly low valuesof critical retained concentrations and their CSUs which are
This article is copyrighted as indicated in the article. Reuse of AIP content is subject to the terms at: http://scitationnew.aip.org/termsconditions. Downloaded to IP:
192.43.227.18 On: Thu, 12 Dec 2013 03:08:01
196

095106-3 Badalyan et al. Rev. Sci. Instrum. 83, 095106 (2012)
85
100
115
0 40 80 120
Per
mea
bilit
y, m
D
Time, min
FIG. 2. Variation of glass filter permeability during colloid deposition at 1.32× 10⁻⁴ m/s.
not included in all consecutive calculations and, therefore, notshown in Fig. 3.
B. Metrological characteristics of instrumentation
Manufacturer-supplied metrological characteristics ofinstruments used in the setup are the primary sourceof equipment-related uncertainties used for calculation ofmeasurement-related uncertainties in parameters of Darcyequation, particle concentrations, and modelling results (seeTable II).
Output signal from type-T thermocouple (not shown inFig. 1) together with those from readouts/signal conditionersand PA 33 X are fed into ADAM-4019+. Taking into ac-count the accuracy and 16-bit resolution of ADAM-4019+and NIST17, 21 recommendations, CSUs in temperature, dif-
0.00
0.15
0.30
0.E+00 4.E-04 8.E-04
Cri
tica
l ret
enti
on c
once
ntra
tion
, σcr
Fluid velocity, U, m/s
FIG. 3. Comparison of experimental data and modelled results for criticalretention particle concentration. ● experimental data; � quadratic function
model fitting using OLSM; quadratic function model fitting using WLSM;– - – lower uncertainty limit for Eq. (14); – – upper uncertainty limit forEq. (14).
TABLE II. Metrological characteristics of instrumentation.
Instrument Measuring range Accuracy
HPLC pump 0–100 ml/min 2.0% FSType-T thermocouple N/A 1.0 KADAM 4019+ 0-5; 10 Vdc 0.1%Valydine DPT 0-(8.62 × 10³; 8.62 × 10⁴; 0.25% FS
8.62 × 10⁵; 8.62 × 10⁶) PaPA 33X 0.1-30 MPa 0.1 FS
Note: FS means full scale.
ferential pressure, and absolute pressure of suspension werecalculated (see Table III).
The manufacturer calibrated PAMAS using NIST trace-able particles without stating its accuracy which is necessaryfor the evaluation of uncertainties in inlet and outlet parti-cle concentrations. We evaluated the PAMAS repeatabilityby measuring number of particles across various particle sizedistributions for the investigated particle size. Ten consec-utive measurements of particle numbers resulted in a stan-dard deviation of u(NPAMAS
particle ) = 4402 or 1.75% for a nar-row particle diameter range from 0.904 to 1.126 μm. SincePAMAS delivers number of particles within the particle sizedistribution range, the weighted mean value for particle di-
ameter was used in calculations as dc,wm =∑i=m
i=1 dinavi∑i=m
i=1 dnavi
= 1.014
± 0.068 μm. Here, m = 6 is the number of measured diam-eters of particles; di is “i”-th measured diameter of particles,μm; dav
i is the average of 10 values of “i”-th measured di-ameter of particles, μm; nav
i is the average number of parti-cles with measured diameters di; and 0.068 μm is weightedmean standard deviation. The obtained weighted mean valuefor particle diameter is in a good agreement with that reportedby the manufacturer. According to NIST guidelines,17 values4402 and 0.068 μm are adopted as the precision of the PA-MAS particle counter for number of particles and diameter,respectively.
IV. SOURCES OF UNCERTAINTIES AND THEIRCONTRIBUTIONS
According to Taylor and Kuyatt,17 the CSU of the mea-surement is calculated according to the law of propagation ofuncertainty as follows:
u2c (y) =
N∑i=1
(∂f
∂xi
)2
u2 (xi) + 2N−1∑i=1
N∑j=i+1
∂f
∂xi
∂f
∂xj
u(xi, xj ).
(2)
When the second term in Eq. (2) is negligible it translatesto
uc (y) =√√√√ N∑
i=1
[(∂f
∂xi
)u (xi)
]2
. (3)
Since the reduction of filter permeability is caused by theincreased amount of attached particles, the uncertainty anal-ysis begins from calculation of uncertainties in parametersfrom Darcy equation and particle concentrations.
This article is copyrighted as indicated in the article. Reuse of AIP content is subject to the terms at: http://scitationnew.aip.org/termsconditions. Downloaded to IP:
192.43.227.18 On: Thu, 12 Dec 2013 03:08:01
197

095106-4 Badalyan et al. Rev. Sci. Instrum. 83, 095106 (2012)
TABLE III. Summary of experimental uncertainty analysis results.
Parameter Units CSU RCSU
A m2 6.30 × 10⁻⁷ 4.99 × 10⁻⁴
L m 5.00 × 10⁻⁶ 1.24 × 10⁻³
R m 2.50 × 10⁻⁶ 1.25 × 10⁻⁴
π N/A 5.0 × 10⁻⁵ 1.59 × 10⁻⁵
Vf m3 5.05 × 10⁻⁹ 1.74 × 10⁻³
NPAMASparticle Particles 4402 1.75 × 10⁻²
dPAMASc,wm m 6.84 × 10⁻⁸ 6.75 × 10⁻²
σ at m3 3.56 × 10⁻⁹ to 5.98 × 10⁻⁸ 7.70 × 10⁻²
σ cr N/A (1.40 to 2.11) × 10−2 (7.75 to 7.94) × 10−2
�p Pa 7.80 × 100 2.6 × 10⁻³
p Pa 3.0 × 10⁴ 8.8 × 10⁻³
pw Pa 3.0 × 10⁴ 8.8 × 10⁻³
Q m3/s 1.67 × 10⁻⁹ 2.0 × 10⁻²
TA K 1.0 N/ATB K 2.2 × 10⁻² N/AT K 1.0 3.4 × 10⁻³
μP μPa×s 5.77 × 10⁻³ 6.19 × 10⁻⁶
μT μPa×s 21.8 2.34 × 10⁻²
μ μPa×s 21.8 2.34 × 10⁻²
k m2 2.55 × 10⁻¹⁵ 3.09 × 10⁻²
U m/s 2.64 × 10⁻⁶ to 2.64 × 10⁻⁵ 2.00 × 10⁻²
φ N/A 8.30 × 10⁻⁴ 1.92 × 10⁻³
φc N/A 2.65 × 10⁻² 7.39σ 0, OLSM
cr or aOLSM N/A 1.57 × 10⁻² 5.68 × 10⁻²
bOLSM (m/s)−2 1.58 × 10⁵ 2.46 × 10⁻¹
UOLSMmin m/s 9.92 × 10⁻⁵ 1.51 × 10⁻¹
σ 0, WLSMcr or aWLSM N/A 1.13 × 10⁻² 4.11 × 10⁻²
bWLSM (m/s)−2 1.50 × 10⁵ 2.38 × 10⁻¹
UWLSMmin m/s 7.96 × 10⁻⁵ 1.39 × 10⁻¹
σmodelcr Eqs. (13) and (15) N/A 4.32 × 10⁻³ to 1.16 × 10⁻² 4.23 × 10⁻² to 1.03 × 10⁻¹
σmodelcr Eqs. (14) and (16) N/A 1.14 × 10⁻² 4.16 × 10⁻² to 1.55 × 10⁻¹
A. Filter length, cross-sectional area, and volume
Glass filter dimensions were measured by a calliper withan uncertainty of u(L) = 2u(R) = 5 × 10⁻⁶ m. UsingEq. (3), CSUs for the cross-sectional area and volume of thefilter were equal to uc(A) = 6.28 × 10⁻⁷ m and uc(Vf ) = 5.31× 10⁻⁹ m3, respectively.
B. Total volume of attached particles and criticalretention concentration
Critical retention concentration, σ cr, is calculated accord-ing to the following formula: σcr = σat
Vf, where σ at - is the
volumetric concentration of attached particles, m3. Cumula-tive volume of particles attached to the filter is calculated asthe sum of incremental volumes of particles attached at var-ious flowrates. Since each consecutive deposited volume ofcolloids is added to the previous one, uc(σ at) is calculatedaccording to the rules of propagation of uncertainties result-ing in the CSU of the next cumulative volume of particlesbeing greater than that for the previous one. As calculated,CSUs for σ cr varies from 1.40 × 10⁻² (corresponding to100 ml/min) to 2.11 × 10⁻² (corresponding to 10 ml/min),with relative combined standard uncertainty (RCSU), δc(σ cr),varying from 7.75% to 7.94% (see Table III).
C. Pressure and differential pressure measurements
Pressure of suspension passing through the glass filterwithout a significant error is determined as
pw = p − �p
2, (4)
where p is the pressure measured by PA 33X, and �p is thedifferential pressure across the glass filter measured by therespective DPT. Parameters in Eq. (4) correspond to those inEq. (3) as follows: y = pw, x1 = p and x2 = �p. Each variablein Eq. (4) contributes to CSU for pressure according to Eq. (3)as follows:
uc (pw) =√[
∂pw
∂pu (p)
]2
+[
∂pw
∂ (�p)u (�p)
]2
=√
[1 × u (p)]2 +[−1
2u (�p)
]2
. (5)
Using data from Table III, the value of CSU in pres-sure is calculated as uc(pw) ∼= uc(p) ∼= 3.0 × 10⁴, P a, sinceuc(p) � uc(�p). Thus, determined uc(pw) will be used for the
This article is copyrighted as indicated in the article. Reuse of AIP content is subject to the terms at: http://scitationnew.aip.org/termsconditions. Downloaded to IP:
192.43.227.18 On: Thu, 12 Dec 2013 03:08:01
198
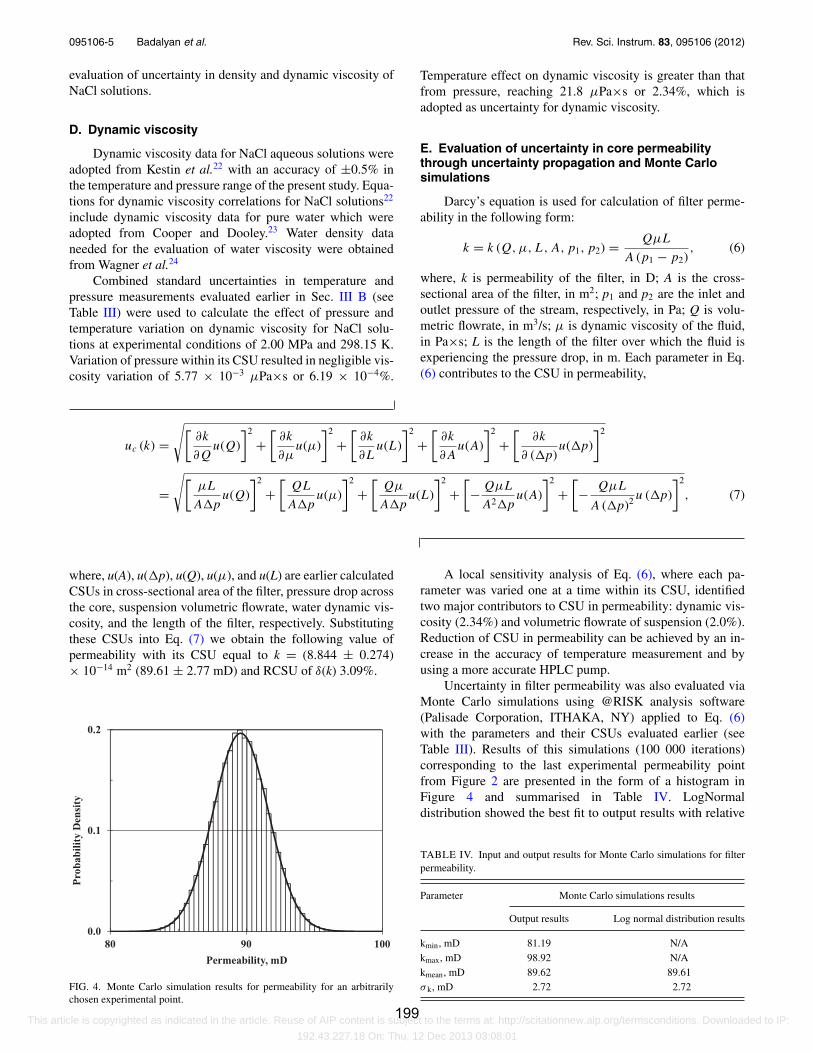
095106-5 Badalyan et al. Rev. Sci. Instrum. 83, 095106 (2012)
evaluation of uncertainty in density and dynamic viscosity ofNaCl solutions.
D. Dynamic viscosity
Dynamic viscosity data for NaCl aqueous solutions wereadopted from Kestin et al.22 with an accuracy of ±0.5% inthe temperature and pressure range of the present study. Equa-tions for dynamic viscosity correlations for NaCl solutions22
include dynamic viscosity data for pure water which wereadopted from Cooper and Dooley.23 Water density dataneeded for the evaluation of water viscosity were obtainedfrom Wagner et al.24
Combined standard uncertainties in temperature andpressure measurements evaluated earlier in Sec. III B (seeTable III) were used to calculate the effect of pressure andtemperature variation on dynamic viscosity for NaCl solu-tions at experimental conditions of 2.00 MPa and 298.15 K.Variation of pressure within its CSU resulted in negligible vis-cosity variation of 5.77 × 10⁻³ μPa×s or 6.19 × 10⁻⁴%.
Temperature effect on dynamic viscosity is greater than thatfrom pressure, reaching 21.8 μPa×s or 2.34%, which isadopted as uncertainty for dynamic viscosity.
E. Evaluation of uncertainty in core permeabilitythrough uncertainty propagation and Monte Carlosimulations
Darcy’s equation is used for calculation of filter perme-ability in the following form:
k = k (Q,μ,L,A, p1, p2) = QμL
A (p1 − p2), (6)
where, k is permeability of the filter, in D; A is the cross-sectional area of the filter, in m2; p1 and p2 are the inlet andoutlet pressure of the stream, respectively, in Pa; Q is volu-metric flowrate, in m3/s; μ is dynamic viscosity of the fluid,in Pa×s; L is the length of the filter over which the fluid isexperiencing the pressure drop, in m. Each parameter in Eq.(6) contributes to the CSU in permeability,
uc (k) =√[
∂k
∂Qu(Q)
]2
+[
∂k
∂μu(μ)
]2
+[
∂k
∂Lu(L)
]2
+[
∂k
∂Au(A)
]2
+[
∂k
∂ (�p)u(�p)
]2
=√[
μL
A�pu(Q)
]2
+[
QL
A�pu(μ)
]2
+[
Qμ
A�pu(L)
]2
+[− QμL
A2�pu(A)
]2
+[− QμL
A (�p)2 u (�p)
]2
, (7)
where, u(A), u(�p), u(Q), u(μ), and u(L) are earlier calculatedCSUs in cross-sectional area of the filter, pressure drop acrossthe core, suspension volumetric flowrate, water dynamic vis-cosity, and the length of the filter, respectively. Substitutingthese CSUs into Eq. (7) we obtain the following value ofpermeability with its CSU equal to k = (8.844 ± 0.274)× 10−14 m2 (89.61 ± 2.77 mD) and RCSU of δ(k) 3.09%.
0.0
0.1
0.2
80 90 100
Pro
babi
lity
Den
sity
Permeability, mD
FIG. 4. Monte Carlo simulation results for permeability for an arbitrarilychosen experimental point.
A local sensitivity analysis of Eq. (6), where each pa-rameter was varied one at a time within its CSU, identifiedtwo major contributors to CSU in permeability: dynamic vis-cosity (2.34%) and volumetric flowrate of suspension (2.0%).Reduction of CSU in permeability can be achieved by an in-crease in the accuracy of temperature measurement and byusing a more accurate HPLC pump.
Uncertainty in filter permeability was also evaluated viaMonte Carlo simulations using @RISK analysis software(Palisade Corporation, ITHAKA, NY) applied to Eq. (6)with the parameters and their CSUs evaluated earlier (seeTable III). Results of this simulations (100 000 iterations)corresponding to the last experimental permeability pointfrom Figure 2 are presented in the form of a histogram inFigure 4 and summarised in Table IV. LogNormaldistribution showed the best fit to output results with relative
TABLE IV. Input and output results for Monte Carlo simulations for filterpermeability.
Parameter Monte Carlo simulations results
Output results Log normal distribution results
kmin, mD 81.19 N/Akmax, mD 98.92 N/Akmean, mD 89.62 89.61σ k, mD 2.72 2.72
This article is copyrighted as indicated in the article. Reuse of AIP content is subject to the terms at: http://scitationnew.aip.org/termsconditions. Downloaded to IP:
192.43.227.18 On: Thu, 12 Dec 2013 03:08:01
199

095106-6 Badalyan et al. Rev. Sci. Instrum. 83, 095106 (2012)
standard deviation of δ(k) = σLogNorm(k)k
LogNormmean
× 100% = 2.72 mD89.61 mD
× 100% ≈ 3.04%, which excellently agrees with earlier cal-culated CSU in permeability (3.09%). Time consuming na-ture of Monte Carlo simulations makes impossible to use thismethod for real-time permeability variation monitoring.
V. UNCERTAINTIES FOR THEORETICAL MODELSFOR PARTICLE DEPOSITION
A. Evaluation of uncertainty for extrapolated results
A detailed analysis of physical processes governingparticle attachment/detachment in porous media at variousflowrates was carried out by Bedrikovetsky et al.25, 26 result-ing in the mathematical model for the critical retention con-centration as a function of velocity,
σcr (U ) = σ0
[1 −
(U
Umin
)2]
, (8)
where σ cr(U) is the critical retention concentration of col-loidal particles; σ 0 is the maximum retention concentration ofcolloidal particles at zero velocity; U is the velocity, m/s; andUmin is the minimum velocity for which no particles can beheld on the grain surface by electrostatic and gravity forces,m/s. Equation (8) is used for the determination of σ 0 and Umin
from the experimental data via extrapolation of the critical re-tention concentration curve to U = 0 and σ cr = 0.
The model (8) was fitted to the experimental “σ cr vsU”-data corresponding to velocities of (3.96, 2.64, and 1.32)× 10−4 m/s. Uncertainty in U was calculated according toEq. (3) using uncertainties in flowrate and cross-sectional areaof the filter. Uncertainty in the critical retention concentrationof the attached particles, uc(σ cr), was calculated in Sec. IV B.A different approach should be applied for the evaluation ofσ 0
cr , u(σ 0cr ), Umin and u(Umin), since parameters σ 0 and Umin
cannot be measured directly. Instead, they should be deter-mined by the intersection of the σ cr(U)-curve with σ cr-axisvia its extrapolation to U = 0, and with U-axis via its extrap-olation to σ 0
cr = 0, respectively.Equation (8) can be re-written as follows:
σcr (U ) = σ 0cr
[1−
(U
Umin
)2]
= σ 0cr − σ 0
cr
U 2min
U 2 = a − bx2,
(9)
and experimental data can be fitted by a quadratic equationusing mean-least squares approximation.
Three experimental points are sufficient to fully deter-mine σ cr(U)-curve according to Eq. (9). Location of an ex-perimental point along the σ cr(U)-curve affects the locationof the two intercept points, σ 0
cr and Umin, during data extrapo-lation. Applying an ordinary least squares method (OLSM) tothe experimental data and assuming 68.27% confidence inter-val (which corresponds to ± one standard deviation) results inthe following σ 0,OLSM
cr and UOLSMmin values, respectively, 2.765
× 10−1 and 6.565 × 10⁻⁴ m/s with their CSUs and RCSUsgiven in Table III.
During particle attachment experiment one moves to theleft along the σ cr(U)-curve, then each consecutive uc(σ cr)-value incorporates uncertainties from all previous experi-mental points and movement towards the lower velocities isaccompanied by an increase in uc(σ cr)-values. Therefore, ex-perimental σ cr-values are of various “quality” which can bequantified by a weighting function wi = 1
[uc(σcr )]2 , meaningthat the last experimental point on the σ cr(U)-curve has thehighest uncertainty and the lowest weight. As a result, theabove-mentioned three-point curve method gives the lowestpossible uncertainty for the last experimental point.
The closer the first experimental point is to U-axis and thelast experimental point is to the σ cr-axis, the more accurateUmin and σ 0-values can be determined by extrapolation of theparabolic curve. It is possible to determine the position ofthe last experimental point before the experiment. However,the location of the first experimental point is problematicsince before the experiment it is not possible to predict theminimum velocity at which no particles can be attached to thefilter (all particles are swept away by the flowing suspension).
According to Taylor,27 it is appropriate to use theweighted least squares method (WLSM), which gives themost precise estimate of coefficients a and b from Eq. (9).Although some caution has been expressed towards the use ofWLSM for non-precisely estimated weights,28 in the presentstudy, uncertainties in the volumes of the attached parti-cles and, consequently, in the critical retention concentra-tions were accurately calculated within the experimental un-certainty of PAMAS. Applying the WLSM to the quadraticfunction (9), the following expressions and values for coeffi-cients a, b, and model parameter UWLSM
min are obtained withtheir CSUs and RCSUs listed in Table III:
a =(∑n
i=1 wi
) (∑ni=1 wix
2i yi
) − (∑ni=1 wix
2i
) (∑ni=1 wiyi
)(∑n
i=1 wi
) (∑ni=1 wix
4i
) − (∑ni=1 wix
2i
)2
= σ 0,WLSMcr = 2.757 × 10⁻¹ (10)
and
b =(∑n
i=1wiyi
) (∑ni=1wix
4i
) − (∑ni=1wix
2i yi
) (∑ni=1wix
2i
)(∑n
i=1wi
) (∑ni=1wix
4i
) − (∑ni=1wix
2i
)2
= 6.329 × 10⁵ (m/s)−2, (11)
with Umin = 6.600 × 10⁻⁴ m/s. The uncertainty in σ cr-valuescan be calculated via the following expression:
uWLSMc [(σcr )i] =
√√√√ 1
n − 2
n∑i=1
[(σcr )i − a − bU 2
i
]2
= 3.12 × 10⁻³, (12)
where (σ cr)i is experimental critical retention concentrationof colloidal particles.
Although OLSM produced results for σ cr which are in agood agreement with the experimental data, those obtainedvia WLSM are characterised by relatively smaller errors.Since OLSM treats data without consideration of their uncer-tainties (or as equally weighed), it underestimates uncertain-ties in the obtained results. It is, therefore, advisable to use
This article is copyrighted as indicated in the article. Reuse of AIP content is subject to the terms at: http://scitationnew.aip.org/termsconditions. Downloaded to IP:
192.43.227.18 On: Thu, 12 Dec 2013 03:08:01
200

095106-7 Badalyan et al. Rev. Sci. Instrum. 83, 095106 (2012)
WLSM for the evaluation of σ 0cr and Umin-values and their
uncertainties.
B. Evaluation of uncertainty for particle attachmentmodel
Equation (8) is a simple representation of the two morecomplex expressions for the critical retention concentration:25
σmodelcr (U ) =
[1 −
(hc
H
)2]
(1 − φc) φ, (13)
σmodelcr (U ) =
[1 −
(μr2
c U
φHFex
)2]
(1 − φc) φ, (14)
where hc is a cake thickness, which is a function of velocity,m; H is thickness of a rectangular pore channel adopted as2rp = 1.3 × 10⁻⁵ m; Fe - is the total electrostatic force calcu-lated as the sum of attractive London-van der Waals (LvdW)and electric double layer repulsive (DLR), and Born repul-sive (BR) forces according to Derjaguin, Landau, Verwey,and Overbeek (DLVO) theory,19 N; x is the ratio between thedrag and electrostatic forces;25 and φc is porosity of the cakeformed on the internal surface of the borosilicate filter due tocolloidal particle deposition.
Analysis of model (14) shows that when U = 0 m/s, then,σmodel
cr = (1 − φc)φ, meaning that the critical retention con-centration depends only on cake and filter porosities. Filterporosity is measured experimentally with the appropriatelycalculated uncertainty. The maximum value of σmodel
cr , there-fore, greatly depends on adopted the φc-value. This dependson the assumption of the uniform particle packing (rhombo-hedral, orthorhombic or cubic, etc.). If the cake porosity isadopted as one of the uniform type of packing, then the ap-propriate calculations show that, it is not possible to adjustthe maximum value of σmodel
cr to that obtained from extrapola-tion of the experimental σ cr = σ cr(U)-curve to the value of U= 0 m/s. To overcome such inflexibility of the model (14), thelatter was adjusted to the value of σmax
cr = σ 0, WLSMcr = 0.276
± 0.006 (obtained earlier in this paper using WLSM) withφc as a tuning parameter, resulting in φc = 0.359 ± 0.013.The outcome of this approach is very important: the cakeporosity is not adopted via assumptions, but is directly de-rived from the experimental σ cr = σ cr(U)-data. Therefore, theuncertainty for the cake porosity is also substantiated by theuncertainty in σmax
cr -value derived from experimental criticalretention concentrations.
Using Eqs. (3) and (13), CSU in critical retention concen-tration can be evaluated as follows:
σmodelcr (U ) =
√√√√√√√√√√√√√√√
[(2hc
H− 2hcφc
H− h2
c
H 2+ h2
cφc
H 2
)u(φ)
]2
+[(
−2hcφ
H+ h2
cφ
H 2
)u(φc)
]2
+[(
2φ
H− 2φφc
H− 2hcφ
H 2+ 2hcφφc
H 2
)u(hc)
]2
+[(
−2hcφ
H 2+ 2hcφφc
H 2+ 2h2
cφ
H 3+ 2h2
cφφc
H 3
)u(H )
]2
.(15)
Having evaluated σ 0,WLSMcr - and UWLSM
min -values and theiruncertainties, and thus, determined the entire σ cr = σ cr(U)-curve, it is now possible to determine σmodel
cr = σmodelcr (U )-
curve according to Eqs. (13) and (14). In order to evaluate un-certainties in the values of critical retention concentrations de-rived from the models (13) and (14), u(σmodel
cr ), it is necessaryto know uncertainties in the parameters of these models.
The only parameter in Eq. (13) which varies with veloc-ity is the cake thickness, hc. This parameter can be evaluatedby fitting Eq. (13) to experimental data, with obtained resultsin Figure 5 showing a gradual increase in the internal cakethickness accompanied with an increase in critical retentionparticle concentration. For the colloidal particle with dc,wm
= 1.014 ± 0.068 μm one-layer cake thickness can be eval-uated with the uncertainty of uc(h1 layer
c ) = ±0.068 μm. Thenumber of layers of deposited particles in the cake, nl, is de-termined by the ratio between hc and the mean particle diam-eter resulting in values varying from 0 to 13, when velocity
0.0E+00
8.0E-06
1.6E-05
0.00 0.15 0.30
h c, m
σcr
FIG. 5. Variation of cake thickness during particle deposition.
This article is copyrighted as indicated in the article. Reuse of AIP content is subject to the terms at: http://scitationnew.aip.org/termsconditions. Downloaded to IP:
192.43.227.18 On: Thu, 12 Dec 2013 03:08:01
201

095106-8 Badalyan et al. Rev. Sci. Instrum. 83, 095106 (2012)
changes from 0 to 6.6 × 10⁻⁴ m/s. Uncertainties for the vary-ing cake thickness are calculated according to the followingformula uc(hnl
c ) = ±0.068nl μm (see Table III). Uncertaintyin particle radius, uc(rc), is taken from Table III. Since theglass filter is characterised by a pore width from 10 to 16 μmwith Hmean = 13 μm, then a standard deviation of 1.0 μm isadopted as uc(H). Using uncertainties for masses of dry andwater-saturated filter, CSU in its porosity is equal to uc(φ)= 8.30 × 10⁻⁴.
After introducing the values of all parameters and theiruncertainties into Eq. (15), we obtained u(σmodel
cr ) varyingfrom 4.23 to 10.3% when velocity changes from 0 to 6.6× 10⁻⁴ m/s (see Table III). A local sensitivity analysis wasperformed to determine how variation of uncertainties in pa-rameters from Eqs. (13) and (14) affects u(σmodel
cr ). When wedoubled uncertainties for parameters one at a time, (σmodel
cr )remained unchanged for all parameters, but for uc(φc) itwas doubled. Varying parameters in Eqs. (13) and (14) oneat a time within their CSUs, we arrive to the conclusion
that φc has the highest impact on σmodelcr according to data
presented in Table V. The procedure proposed in the presentpaper for the evaluation of uc(φc) via experimental uncertain-ties in σ cr resulted in the lowest possible uc(φc)-value forthe present experimental conditions, and is, therefore, recom-mended for calculations.
Using Eqs. (3) and (14) it is possible to evaluate u(σmodelcr )
according to Eq. (16). Additional assumptions should bemade before calculating u(σmodel
cr ). The resultant electrostaticforce is calculated as the derivative of the potential energy.For many parameters of the LvdW, DLR, and BR forces, itis not always possible to calculate their uncertainties. Val-ues of Hamaker constants calculated via DLVO theory oftendisagree with those obtained experimentally,29 reaching, forexample, 50% for non-retarded region of ≤10 nm.30 Directmeasurements of vdW forces produced results with standarddeviation ranging from 14.9% to 23.1%31 and uncertainty of15%.32 In the present study, uncertainty in electrostatic force,uc(Fe) was adopted as 15%:
σmodelcr (U ) =
√√√√√√√√√√√√√√√√√√√√√√√√√√√√√√
[(1 − φc + 1 − φφc
φ2
(μr2
c U
HFex
)2)
u(φ)
]2
+[(
−φ + 1
φ
(μr2
c U
HFex
)2)
u(φc)
]2
+[(
2μ(φc − 1)
φ
(r2c U
HFex
)2)
u(μ)
]2
+[(
4r3s (φc − 1)
φ
(μU
HFex
)2)
u(rc)
]2
+[(
2U (φc − 1)
φ
(μr2
c
HFex
)2)
u(U )
]2
+[(
2(1 − φc)
φH 3
(μr2
c U
Fex
)2)
u(H )
]2
+[(
2(1 − φc)
φF 3e
(μr2
c U
Hx
)2)
u(Fe)
]2
+[(
2(1 − φc)
φx3
(μr2
c U
HFe
)2)
u(x)
]2
+[(
2(1 − φc)
φx3
(μr2
c U
HFe
)2)
u(x)
]2
.(16)
According to our calculations, hc varies from 1.3 × 10⁻⁵
to 0 m when fluid velocity changes from 0 to its maximumvalue of 6.60 × 10⁻⁴ m/s, corresponding to the condition
TABLE V. Results of sensitivity analysis for Eqs. (13) and (14).
Variation of σmodelcr , %
Parameter Equation (13) Equation (14)
μ N/A 0.006rs N/A 0.016U N/A 0.013H 0.325 0.019hc 0.153 N/AFe N/A 0.038x N/A 0.038φ 0.193 0.193φc 4.13 4.13
when σ cr = 0 and all particles are swept away by high-velocity fluid. In this range of “particle-to-surface distances”and for the present experimental conditions, Fe calculated ac-cording to DLVO theory25 varies from 2.72 × 10⁻²¹ to −9.38× 10⁻¹⁹ N.
According to Bedrikovetsky et al.,25 parameter x is theratio between the drag and electrostatic forces, with the dragforce determined according to the following formula:
Fd = ωπr2c U
H, (17)
where ω is the dimensionless empirical drag coefficient. Thedrag coefficient was adopted as 21 via fitting equation (14)to the experimental critical retention concentration data. Ap-plying formula (3) to (17), we obtain that uc(Fd) varies inthe range from 1.26 × 10⁻¹⁵ to 1.66 × 10⁻¹⁴ N and uc(x)
This article is copyrighted as indicated in the article. Reuse of AIP content is subject to the terms at: http://scitationnew.aip.org/termsconditions. Downloaded to IP:
192.43.227.18 On: Thu, 12 Dec 2013 03:08:01
202

095106-9 Badalyan et al. Rev. Sci. Instrum. 83, 095106 (2012)
from 2.73 × 10⁶ to 1.12 × 10⁵ for the above range of fluidvelocities.
After substitution of all relevant parameters into Eq. (16)we obtained that RCSU (σmodel
cr ) varies from 4.16% to 15.5%for the same range of fluid velocities (see Table III). Model(14) represents experimental σ cr = σ cr(U)-data less accu-rately than model (13) due to the presence in Eq. (14) of the at-tractive electrostatic force, whose value and uncertainty can-not be reliably established due to unavailability of dielectricdata.
VI. CONCLUSIONS
Calculation of experimental uncertainties for permeabil-ity of a borosilicate filter was carried out through propagationof uncertainties for parameters in Darcy’s equation and also,using Monte-Carlo simulations. Both methods provided iden-tical values for combined standard uncertainty for permeabil-ity. The local sensitivity analysis of Darcy equation showedthat the uncertainties in dynamic viscosity and volumetricflowrate of colloidal suspension have the highest impact onthe overall uncertainty for filter permeability.
The uncertainty in each consecutive value of critical re-tention concentration incorporates uncertainties from all pre-vious values. Therefore, the total number of experimentalpoints for critical retention concentrations, as a function ofvelocity, should be limited to three points in order to reducethe uncertainty in the determination of maximum critical re-tention concentration. Weighing functions for the critical re-tention concentrations were accurately calculated through thepropagation of uncertainties in the respective experimentalparameters. Application of the weighted least squares methodresulted in more accurate values for maximum critical reten-tion concentration and minimum velocity.
The local sensitivity analysis of the models showed thatinternal cake porosity has a significant impact on the mod-elling results and their uncertainties. The first model, contain-ing the internal cake thickness as one of its parameters, repre-sented experimental critical retention concentration data bet-ter than the second model which used dynamic viscosity, par-ticle radius, pore thickness, drag, and total electrostatic forcesas model parameters. Higher deviations of the results from thesecond model are, probably, due to the presence of the totalelectrostatic force in the model’s formula. The values and un-certainty for this force cannot be reliably measured and calcu-lated, due to lack of experimental dielectric data at the currentexperimental conditions.
The proposed uncertainty analysis was implemented intoMicrosoft ExcelTM spreadsheet coupled with the real-timedata acquisition software, such that each experimental datapoint is accompanied by its uncertainty, leading to timely de-cisions during particle attachment experiments.
Overall, the presented method for the evaluation of ex-perimental and modelling uncertainties establishes the valid-ity ranges for experimental permeability and particle attach-ment data and for the corresponding theoretical models. Thismakes possible intra- and inter-laboratory data comparisonwhich is the first step towards standardizing these types ofexperiments.
ACKNOWLEDGMENTS
Authors thank Institute of Minerals and Energy Re-sources (IMER) of the University of Adelaide for finan-cial support. Financial support from the Australian ResearchCouncil (ARC) Discovery Project 1094299, ARC LinkageProject 100100613, and Santos Pty. Ltd. is gratefully ac-knowledged.
1C. Gruesbeck and R. E. Collins, Soc. Pet. Eng. J. 22, 847–856 (1982).2N. Tufenkji and M. Elimelech, Langmuir 20(25), 10818–10828(2004).
3A. Santos and P. Bedrikovetsky, Comput. Appl. Math. 23(2–3), 259–284(2004).
4O. Kwon, A. K. Kronenberg, A. F. Gangi, and B. Johnson, J. Geophys. Res.106(B9), 19339–19353, doi:10.1029/2001JB000273 (2001).
5O. Kwon, B. E. Herbert, and A. K. Kronenberg, J. Geophys. Res. 109,B10205, doi:10.1029/2004JB003052 (2004).
6O. Kwon, B. E. Herbert, and A. K. Kronenberg, J. Geophys. Res. 109,B10206, doi:10.1029/2004JB003055 (2004).
7C. Dong, J. Manuf. Sci. Eng. 127(4), 907–911 (2005).8S. Mazumder and K. H. Wolf, Int. J. Coal Geol. 74(2), 123–138(2008).
9A. S. El-Dieb and R. D. Hooton, Cem. Concr. Res. 24(5), 854–862(1994).
10G. Brighenti and P. Macini, Future Groundwater Resources at Risk (IAHS,Helsinki, Finland, 1994), Vol. 222, pp. 409–416.
11American Petroleum Institute, Recommended Practices for Core Analysis:Recommended Practice, 2nd ed. (American Petroleum Institute PublishingService, 1998), Vol. 40.
12A. C. Payatakes, R. Rajagopalan, and C. Tien, Can. J. Chem. Eng. 52(6),722–731 (1974).
13A. Santos and P. Bedrikovetsky, TPM 62(1), 23–53 (2006).14A. A. Shapiro, P. G. Bedrikovetsky, A. Santos, and O. O. Medvedev, TPM
67(1), 135–164 (2007).15P. Bedrikovetsky, TPM 75, 335–369 (2008).16F. A. H. Al-Abduwani, R. Farajzadeh, W. M. G. T. van den Broek, P. K.
Currie, and P. L. J. Zitha, Rev. Sci. Instrum. 76, 103704 (2005).17B. N. Taylor and C. E. Kuyatt, “Guidelines for evaluating and expressing
the uncertainty of NIST measurement results,” National Institute of Stan-dards and Technology Technical Note 1297 (U.S. Government Printing Of-fice, Washington, DC, 1994).
18“Quantifying uncertainties in analytical measurements,” EURACHEM/CITAC Guide CG4, edited by S. L. R. Ellison, M. Rosslein, and M.Williams (EURACHEM, 2000).
19B. Derjaguin and L. Landau, PrSS 43(1–4), 30–59 (1993).20J. Bergendahl and D. Grasso, AIChE J. 45(3), 475–484 (1999).21D. Ripple, G. W. Burns, and M. G. Scroger, “Assessment of uncertainties
of thermocouple calibrations at NIST,” NISTIR 5340 (National Institute ofStandards and Technology, Gaithersburg, MD, 1994), p. 35.
22J. Kestin, H. E. Khalifa and R. J. Correia, JPCRD 10(1), 71–87(1981).
23J. R. Cooper and R. B. Dooley, The International Association for the Prop-erties of Water and Steam (Berlin, Germany, 2008), p. 9.
24W. Wagner, J. R. Cooper, A. Dittmann, J. Kijima, H.-J. Kretzschmar, A.Kruse, R. Mares, K. Oguchi, H. Sato, I. Stocker, O. Sifner, Y. Takaishi, I.Tanishita, J. Trubenbach, and T. Willkommen, J. Eng. Gas Turbines Power122, 150–182 (2000).
25P. Bedrikovetsky, F. D. Siqueira, C. Furtado, and A. L. S. de Souza, TPM86(2), 353–383 (2011).
26P. Bedrikovetsky, A. Zeinijahromi, F. D. Siqueira, C. A. Furtado, and A. L.S. de Souza, TPM 91, 173–197 (2012).
27J. R. Taylor, An Introduction to Error Analysis: The Study of Uncertaintiesin Physical Measurements (University Science Books, New York, 1982).
28R. J. Carroll and D. Ruppert, Transformation and Weighing in Regression(Chapman and Hall, New York, 1988).
29Q. Qi and G. J. Brereton, ITUFF 42(4), 619–629 (1995).30D. Chan and P. Richmond, Proc. R. Soc. London, Ser. A 353(1673), 163–
176 (1977).31J. A. Kitchener and A. P. Prosser, Proc. R. Soc. London, Ser. A 242(1230),
403–409 (1957).32A. K. Mohapatra and C. S. Unnikrishnan, EL 73(6), 839–845 (2006).
This article is copyrighted as indicated in the article. Reuse of AIP content is subject to the terms at: http://scitationnew.aip.org/termsconditions. Downloaded to IP:
192.43.227.18 On: Thu, 12 Dec 2013 03:08:01
203

6 Summary and Conclusions
In this thesis, new experimental technology was designed to investigate particle
behavior in porous media under the condition of size exclusion. The colloidal
retention and permeability damage under high flow velocity have been investigated;
the effects have been introduced into a modified Forchheimer equation for
suspension flow under the inertial flow conditions. Experimental and modeling
uncertainties at both conditions have been defined, determined and analyzed.
The experimental tests on repulsion condition between colloidal suspension and
porous media carried out in the thesis yields in the straining-dominant particle
capture. The particle-rock repulsion can be predicted by DLVO calculations of
electrostatic forces and achieved by the correct choice of water composition, salinity,
pH, the material and coating of grains (glass beads) and the particles. Creation of the
significant particle-rock repulsion environment allows avoiding the particle capture
by attachment; and also the expensive and cumbersome characterization of particle-
rock interaction in order to model the DLVO interactions and consequent attachment.
The induced particle-rock repulsion conditions leave the particle straining as a single
particle retention mechanism. The tests are analogous to challenge testing of porous
multi sieve membranes.
Several improvements to the laboratory set-up have been implemented in the
thesis submitted: post-flow measurement of the retention profile, sieving of glass
beads in the ultrasonic bath resulting in the reduced bead sieving time and more
reproducible particle size distribution, and the application of a dual syringe pump
system leading to the continuous pulseless colloidal suspension pumping.
204

The tests with different size particles allow determining pore throat size
distribution for a log-normal type of distributions used in the present study. For more
complex distribution functions, more studies must be performed, the method needs
significantly more substantial validation. Challenge testing in real reservoir cores
will be an important future stage of experimental investigation. However, the
conclusion that size exclusion deep bed filtration is determined by a pore space only
makes the determining of pore throat size distribution from challenge testing data a
prospective method for porous media characterization.
The designed high velocity laboratory test on sequential particle injections at
piece-wise increasing velocities, followed by injection of particle free water at
increasing velocity, allows observing the following physics phenomena of particle
attachment and detachment. Particle attachment to the surface and inter-pore filling
were found to be the major mechanisms during high velocity injection in favorable
attachment condition. High ionic strength and low pH of suspension together with
low value of jamming ratio factor ensured particle deposition due to attachment
without size exclusion (Paper 2). The particle attachment is so strong that full
detaching deposited particles by increasing flow rate was impossible (paper 2). The
beginning of the external cake formation was observed in paper 4. Formation of the
external cake starts after the critical value of particle retained concentration was
reached (Paper 4).
The designed high velocity laboratory test allows for full characterization of the
colloidal flow system with particles attachment and detachment at high velocities.
The maximum retention function model for high velocity flows which was calculated
from the torque balance condition was validated by experimental work in paper 1. In
paper 1, the problem of fines migration from the injection well was identified. It
205

contains strained concentration dependencies for permeability, inertia coefficient,
maximum concentration of retained particle and filtration coefficient.
It was found out that the modified Forchheimer equation accounting for deposit-
dependent inertia coefficient can be accurately validated by experimental results
(Paper 4). The test data also show that the values of the maximum retention function
for high velocity flows, as calculated from the torque balance conditions on the pore
scale and as obtained from laboratory measurements are in a good agreement.
The variation of the inertial coefficient is relatively low at the initial stage of
particle deposition, which can be explained by the lining-type layer by layer retention
without changing the geometry of porous space. The inertial coefficient increase at
high retention concentration is explained by formation of the external filter cake.
The critical analysis of uncertainties during the deep bed filtration was carried out at
both favorable and unfavorable conditions of attachment, corresponding to two kinds
of processes studied in the thesis (paper 3 and paper 6).
The presented method for the evaluation of experimental and modelling
uncertainties establishes the validity ranges for experimental permeability and
particle attachment data, obtained in the thesis and for the corresponding theoretical
models.
The new experimental technology of laboratory studies on size exclusion during
colloidal transport, which includes the set-up and the tests methodology, is applicable
at experimental porous media investigation in petroleum, chemical and
environmental industries. One of important applications is determining pore size
distributions from challenge testing.
Another application of the developed set-up and methodology of the particle-
rock repulsion colloidal flow tests is validation of different available in the literature
206

mathematical models of size exclusion deep bed filtration, their comparison and
definition of areas of validity.
The results of the experimental study of high velocity deep bed filtration can be
applied for laboratory based prediction of well index and skin factor for high rate oil
and gas wells, especially under the conditions of inflow performance with fines
migration.
The developed method for measurement uncertainties calculating can be applied
not only for colloid suspension studies, but to a significantly wider range of
experimental studies of flow in porous media.
207