the evolution of urban heat island and water demand
TRANSCRIPT

American Meteorological Society Eighth Symposium on the Urban Environment
Proceedings of the 89th Annual Meeting 11-15 January 2009
1
The Evolution of Urban Heat Island and Water Demand
Christopher A. Scott
Dept. of Geography & Regional Development, and
Udall Center for Studies in Public Policy, University of Arizona
Eve B. Halper
Dept. of Geography & Regional Development, University of Arizona, and
U.S. Bureau of Reclamation
Stephen Yool
Dept. of Geography & Regional Development, University of Arizona
Andrew Comrie
Dept. of Geography & Regional Development, University of Arizona
Abstract
Urban water demand in the arid Southwestern U.S. is influenced by the type, age, and structure
of residential and public landscaping. Urban heat island (UHI) coupled with regional climate
change have important impacts on urban water demand. Results show that Tucson, Arizona is
warming at 0.067 degrees C per year (equivalent to a 1 degree C increase in 15 years). Due to
UHI Tucson is warming at 0.040 degrees C per year faster than surrounding nonurban areas
(equivalent to a 1 degree C difference in 25 years). The pre-monsoon period (particularly Feb-
May) exhibit the most pronounced UHI effects with a high degree of statistical significance. Compared to 1969-1999 results, the rate of urban warming still remains greater than the regional
warming trend, but that the rate of UHI urban-nonurban Tmin divergence has decreased, which is
partially attributed to evapotranspiration (ET) from irrigated urban vegetation. This paper
attempts to relate 2000 – 2006 residential water use in Tucson to Penman-Monteith potential
evapotranspiration (ETref) derived from weather station data. ETref exhibits increasing trends for
the months of December – May, but declining trends for June – November. The effects of
temperature increases on ETref are offset by decreases in wind speed, possibly related to
vegetation-induced changes in surface roughness. Geospatial analysis of normalized difference
vegetation index (NDVI) and surface temperature derived from 1984 – 2005 Landsat Thematic
Mapper imagery demonstrate the evolution of urban spatial patterns with stable NDVI of mature
vegetation in the older urban core contrasted by increasing NDVI in the expanding urban fringes.
Spatially disaggregated urban water use is shown to have similar patterns and follow similar
temporal trends. The UHI implications of urban landscaping are discussed.

American Meteorological Society Eighth Symposium on the Urban Environment
Proceedings of the 89th Annual Meeting 11-15 January 2009
2
Introduction
Urban heat island (UHI) and climate change-driven warming across the Southwest have
implications for water use. Researchers and planners have paid inadequate attention to spatial
and temporal patterns in urban warming or the implications of these patterns for urban water
demands, particularly for outdoor residential irrigation. This study investigates urban warming
and water use in the Tucson, Arizona basin. The research objectives are to a) characterize UHI
temporal trends, b) assess impacts on outdoor residential water demand of temperature and
reference evapotranspiration (ET) trends, c) measure NDVI temporal trends and spatial patterns,
and d) review UHI mitigation potential of irrigated vegetation.
Methodology
Archival Landsat Thematic Mapper (TM) imagery was accessed from the Arizona Regional
Image Archive (aria.arizona.edu). Only those images with antecedent precipitation less than 300
mm in the 90-day period preceding the image date as recorded at the Campbell Ave. station
(Coop ID 028796) were used for analysis in order to minimize the effects of vegetation greening
resulting from natural precipitation (Figure 1).
Figure 1. Landsat TM Image Acquisition Dates and 90-day Antecedent Precipitation
90d antecedent precip (mm) for Landsat Images
5/25/1984
5/15/1986
5/20/1988
6/8/1989
5/26/19905/13/1997
6/17/20014/20/2003
5/2/1987
6/11/1990
5/13/1991
5/15/1992
4/3/1994
5/8/1995
4/30/1998
4/12/20006/22/1994
5/10/1996
6/20/2002
6/15/2000
6/4/20055/3/1999
5/2/1993
6/1/2004
6/24/19895/3/2002
4/17/2002
7/1/2003
5/6/2003
0
100
200
300
400
500
600
700
1/1/
1984
12/3
1/19
84
12/3
1/19
85
12/3
1/19
86
12/3
1/19
87
12/3
0/19
88
12/3
0/19
89
12/3
0/19
90
12/3
0/19
91
12/2
9/19
92
12/2
9/19
93
12/2
9/19
94
12/2
9/19
95
12/2
8/19
96
12/2
8/19
97
12/2
8/19
98
12/2
8/19
99
12/2
7/20
00
12/2
7/20
01
12/2
7/20
02
12/2
7/20
03
12/2
6/20
04
12/2
6/20
05
Date
90d
an
teced
en
t p
recip
missing thermal band
= Landsat ETM

American Meteorological Society Eighth Symposium on the Urban Environment
Proceedings of the 89th Annual Meeting 11-15 January 2009
3
TM images were registered and rectified to an orthophoto-derived street map shapefile from
Pima Co. Dept. of Transportation resulting in root mean square error RMSE < 15 m (equivalent
to half the minimum pixel resolution). The normalized difference vegetation index (NDVI) was
calculated from TM imagery using COST-model (Chavez, 1996) atmospherically corrected band
3 (red) and band 4 (near infrared) radiances as follows:
NDVI = (B4-B3) / (B4+B3)
Surface temperatures were retrieved from TM band 6 (thermal infrared) by converting thermal
brightness temperatures into thermodynamic (kinetic) temperatures. We accessed an ASTER
image from 5/26/2001, with a processed emissivity layer at 90m. The Landsat NDVI for
6/18/2001 (closest date to the ASTER image) was resampled from 30 m to 90 m, and a per-pixel
regression of Landsat NDVI vs. ASTER NDVI yielded R2 > 0.98 indicating reliable NDVI
results. Subsequently, we regressed ASTER emissivity vs. Landsat NDVI with R2 > 0.36 and
selected the quadratic equation with the best fit in the NDVI range of interest (0.2 ~ 0.7).
Finally, kinetic temperature maps were calculated from emissivity and radiant temperatures as:
Tkinetic = E0.25 * Tradiant
Climatological data were accessed from the National Climatic Data Center (ncdc.noaa.gov) and
the Arizona Meteorological Network (AZMET, ag.arizona.edu/azmet). Table 1 lists the
meteorological stations used for the urban warming analysis. The analysis period was selected to
start from 1/1/1969 in order to allow comparison with, and extend analysis of previous UHI
characterization for Tucson by Comrie (2000). Data for 2008 were reviewed but not included,
principally due to the fact that Tucson WFO #028815 ceased recording from February 2008. For
1969-2007 and 1984-2005 (the latter corresponding to the period of Landsat record), monthly
trend analysis of urban Tmin and Tmax were compared to nonurban Tmin and Tmax. The urban –
nonurban difference in Tmin provides the rate of warming resulting from UHI processes.
Additional trend analyses were performed on reference evapotranspiration (ETref) for urban and
nonurban stations for the full 1987-2008 time series available from AZMET.
Table 1. Meteorological Stations and Data Analyzed
Station Urban/ Nonurban Data Analyzed
Tucson Campbell Ave.
#028796 Urban Tmin, Tmax, Precip, ETref
Tucson WFO #028815 Urban Tmin, Tmax, Precip
Tucson Intl Airport
#028820 Urban
Excluded (due to cold air
drainage effects)
Anvil Ranch #020287 Nonurban Tmin, Tmax, Precip
Cascabel #021330 Nonurban Tmin, Tmax, Precip
Oracle 2SE #026119 Nonurban Tmin, Tmax, Precip
Santa Rita Exp Range
#027593 Nonurban Tmin, Tmax, Precip
Safford #027390 Nonurban Tmin, Tmax, Precip, ETref
American Meteorological Society Eighth Symposium on the Urban Environment
Proceedings of the 89th Annual Meeting 11-15 January 2009
4
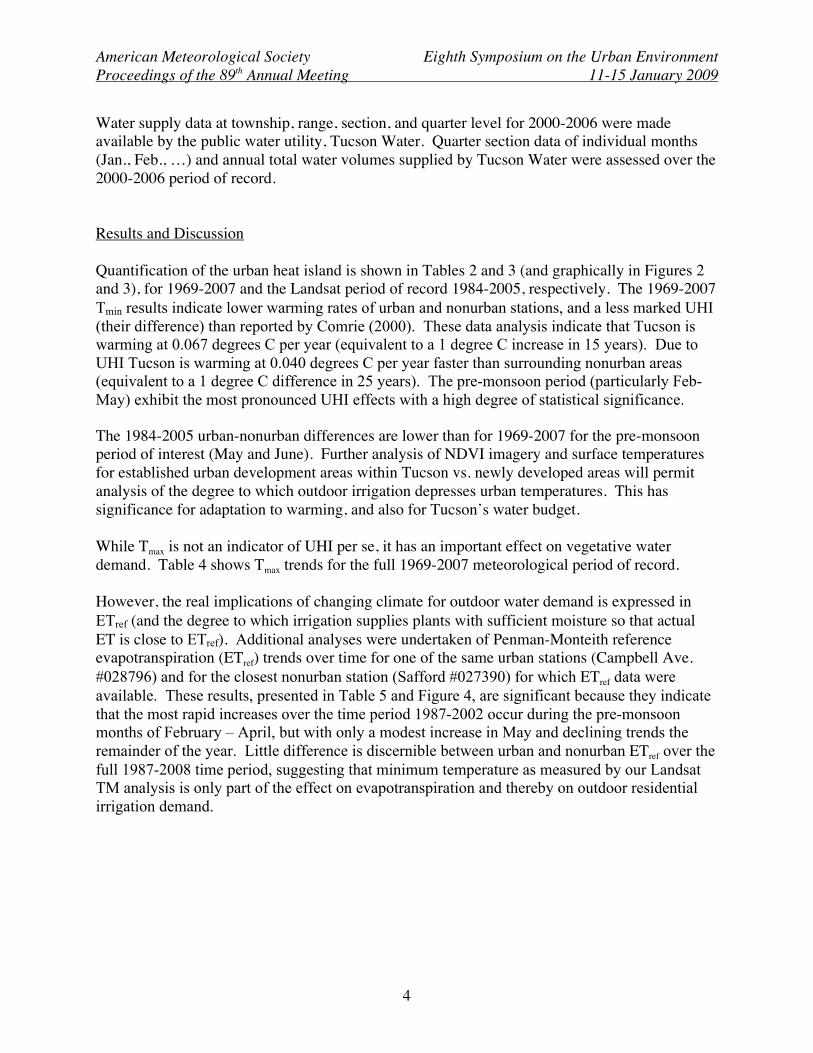
Water supply data at township, range, section, and quarter level for 2000-2006 were made
available by the public water utility, Tucson Water. Quarter section data of individual months
(Jan., Feb., …) and annual total water volumes supplied by Tucson Water were assessed over the
2000-2006 period of record.
Results and Discussion
Quantification of the urban heat island is shown in Tables 2 and 3 (and graphically in Figures 2
and 3), for 1969-2007 and the Landsat period of record 1984-2005, respectively. The 1969-2007
Tmin results indicate lower warming rates of urban and nonurban stations, and a less marked UHI
(their difference) than reported by Comrie (2000). These data analysis indicate that Tucson is
warming at 0.067 degrees C per year (equivalent to a 1 degree C increase in 15 years). Due to
UHI Tucson is warming at 0.040 degrees C per year faster than surrounding nonurban areas
(equivalent to a 1 degree C difference in 25 years). The pre-monsoon period (particularly Feb-
May) exhibit the most pronounced UHI effects with a high degree of statistical significance.
The 1984-2005 urban-nonurban differences are lower than for 1969-2007 for the pre-monsoon
period of interest (May and June). Further analysis of NDVI imagery and surface temperatures
for established urban development areas within Tucson vs. newly developed areas will permit
analysis of the degree to which outdoor irrigation depresses urban temperatures. This has
significance for adaptation to warming, and also for Tucson’s water budget.
While Tmax is not an indicator of UHI per se, it has an important effect on vegetative water
demand. Table 4 shows Tmax trends for the full 1969-2007 meteorological period of record.
However, the real implications of changing climate for outdoor water demand is expressed in
ETref (and the degree to which irrigation supplies plants with sufficient moisture so that actual
ET is close to ETref). Additional analyses were undertaken of Penman-Monteith reference
evapotranspiration (ETref) trends over time for one of the same urban stations (Campbell Ave.
#028796) and for the closest nonurban station (Safford #027390) for which ETref data were
available. These results, presented in Table 5 and Figure 4, are significant because they indicate
that the most rapid increases over the time period 1987-2002 occur during the pre-monsoon
months of February – April, but with only a modest increase in May and declining trends the
remainder of the year. Little difference is discernible between urban and nonurban ETref over the
full 1987-2008 time period, suggesting that minimum temperature as measured by our Landsat
TM analysis is only part of the effect on evapotranspiration and thereby on outdoor residential
irrigation demand.

American Meteorological Society Eighth Symposium on the Urban Environment
Proceedings of the 89th Annual Meeting 11-15 January 2009
5
Table 2. Annualized 1969-2007 Minimum Temperature Trends (Linear Slope Coefficients of Monthly
Mean Minima at Urban and Nonurban Sites, deg C yr-1
) and their Differences with Significance
Month Urban Nonurban Difference Significance
p <
Jan 0.051 0.010 0.041 0.001
Feb 0.062 -0.001 0.063 0.001
Mar 0.090 0.019 0.071 0.001
Apr 0.099 0.028 0.070 0.001
May 0.109 0.051 0.058 0.001
Jun 0.087 0.045 0.042 0.001
Jul 0.044 0.019 0.025 0.01
Aug 0.053 0.026 0.027 0.001
Sep 0.063 0.024 0.039 0.001
Oct 0.067 0.035 0.032 0.01
Nov 0.070 0.046 0.024 0.05
Dec 0.015 -0.014 0.029 0.01
Annual 0.067 0.027 0.040 0.001
2 urban stations (Campbell Ave #28796, Tucson WFO #28815) & 4 nonurban
stations (Anvil Rnch #20287, Cascabel #21330, Oracle 2SE #26119, Santa Rita Exp
Rng #27593)
Figure 2. Urban and Nonurban Minimum Temperature (deg C), 1969-2007

American Meteorological Society Eighth Symposium on the Urban Environment
Proceedings of the 89th Annual Meeting 11-15 January 2009
6
Table 3. Annualized 1984-2005 Minimum Temperature Trends (Linear Slope Coefficients of Monthly
Mean Minima at Urban and Nonurban Sites, deg C yr-1
) and their Differences with Significance
Month Urban Nonurban Difference Significance
p <
Jan 0.060 0.058 0.002
Feb 0.031 -0.003 0.034
Mar 0.053 0.000 0.053 0.01
Apr -0.003 -0.081 0.077 0.001
May 0.030 0.024 0.006
Jun 0.022 0.011 0.011
Jul 0.074 0.038 0.036 0.05
Aug 0.034 0.015 0.019
Sep 0.097 0.071 0.026
Oct 0.009 -0.024 0.034
Nov 0.034 0.025 0.008
Dec -0.001 -0.010 0.009
Annual 0.036 0.008 0.028
2 urban stations (Campbell Ave #28796, Tucson WFO #28815) & 4 nonurban
stations (Anvil Rnch #20287, Cascabel #21330, Oracle 2SE #26119, Santa Rita Exp
Rng #27593)
Figure 3. Urban and Nonurban Minimum Temperature (deg C), 1984-2005

American Meteorological Society Eighth Symposium on the Urban Environment
Proceedings of the 89th Annual Meeting 11-15 January 2009
7
Table 4. Annualized 1969-2007 Maximum Temperature Trends (Linear Slope Coefficients of Monthly
Mean Maxima at Urban and Nonurban Sites, deg C yr-1
) and their Differences with Significance Month Urban Nonurban Difference Significance
p <
Jan 0.014 -0.007 0.022 0.001
Feb -0.020 -0.037 0.017 0.01
Mar 0.043 0.017 0.026 0.001
Apr 0.018 -0.001 0.019 0.001
May 0.053 0.051 0.002
Jun 0.013 -0.001 0.015 0.05
Jul -0.004 -0.005 0.000
Aug -0.021 -0.031 0.010
Sep 0.015 0.004 0.011
Oct 0.039 0.022 0.017 0.01
Nov 0.020 -0.009 0.028 0.01
Dec -0.023 -0.048 0.025 0.001
Annual 0.011 -0.020 0.031 0.05
2 urban stations (Campbell Ave #28796, Tucson WFO #28815) & 4 nonurban
stations (Anvil Rnch #20287, Cascabel #21330, Oracle 2SE #26119, Santa Rita Exp
Rng #27593)
Table 5. Annualized 1987-2008 Reference Evapotranspiration Trends (Linear Slope Coefficients of
Monthly Mean ET at Urban and Nonurban Sites, mm d-1
yr-1
) and their Differences with Significance
Month Urban Significance
p <
Nonurban Significance
p <
Difference
Urban -
Nonurban
Significance
p <
Jan 0.023 0.032 -0.008
Feb 0.017 0.036 -0.020 0.05
Mar 0.036 0.036 0.000
Apr 0.028 0.029 -0.001
May 0.021 0.020 0.001
Jun -0.033 -0.029 -0.004
Jul -0.042 0.05 -0.048 0.006
Aug -0.031 0.05 -0.018 -0.012
Sep -0.048 -0.035 -0.013
Oct -0.016 -0.011 -0.005
Nov -0.004 -0.008 0.004
Dec 0.023 0.022 0.001
Annual -0.002 0.002 -0.004
1 urban station (Campbell Ave #28796) & 1 non-urban station (Safford #27390)
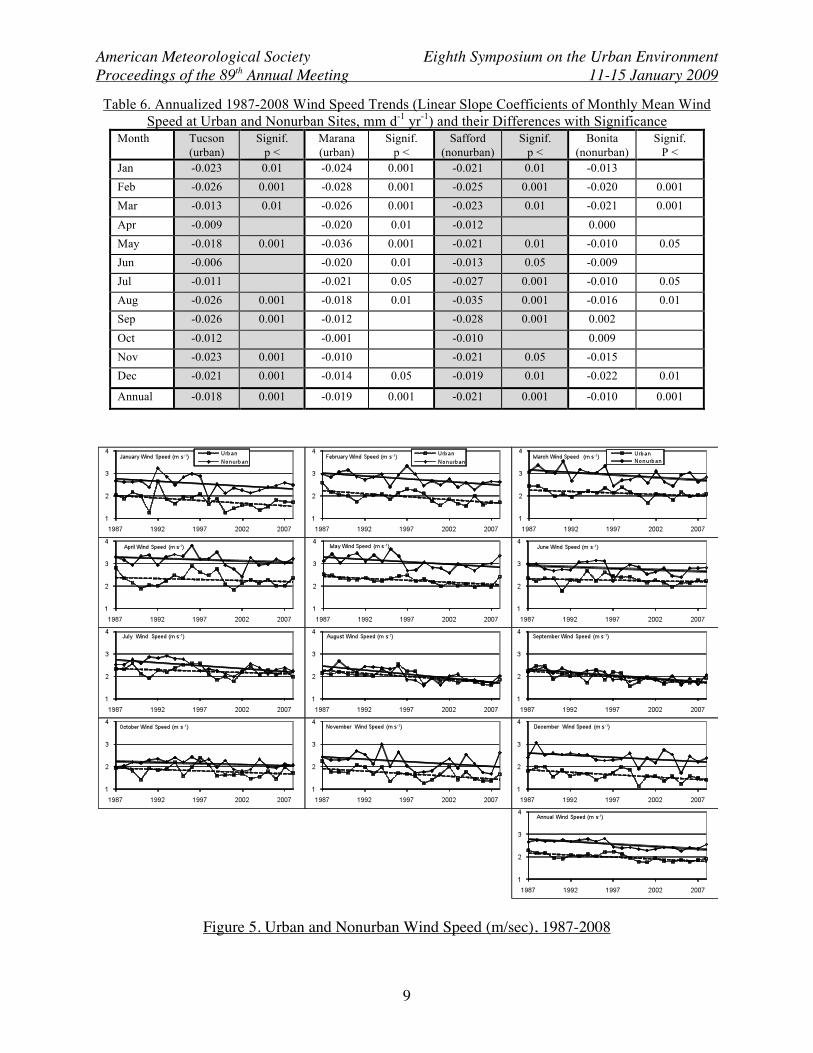
Additional analyses were undertaken to investigate why ETref trends appear to be time-invariant
despite increases in both Tmin and Tmax. Time series analyses of relative humidity and radiation
resulted in indiscernible trends; however, wind speed demonstrated significant decreasing trends
that were also observed at other AZMET stations in the vicinity of Tucson (Table 6 and Figure
5). Whether these trends are related to increased surface roughness from vegetation and other
features (e.g., the built environment near urban stations), or the result of synoptic processes
remains under investigation.
American Meteorological Society Eighth Symposium on the Urban Environment
Proceedings of the 89th Annual Meeting 11-15 January 2009
8
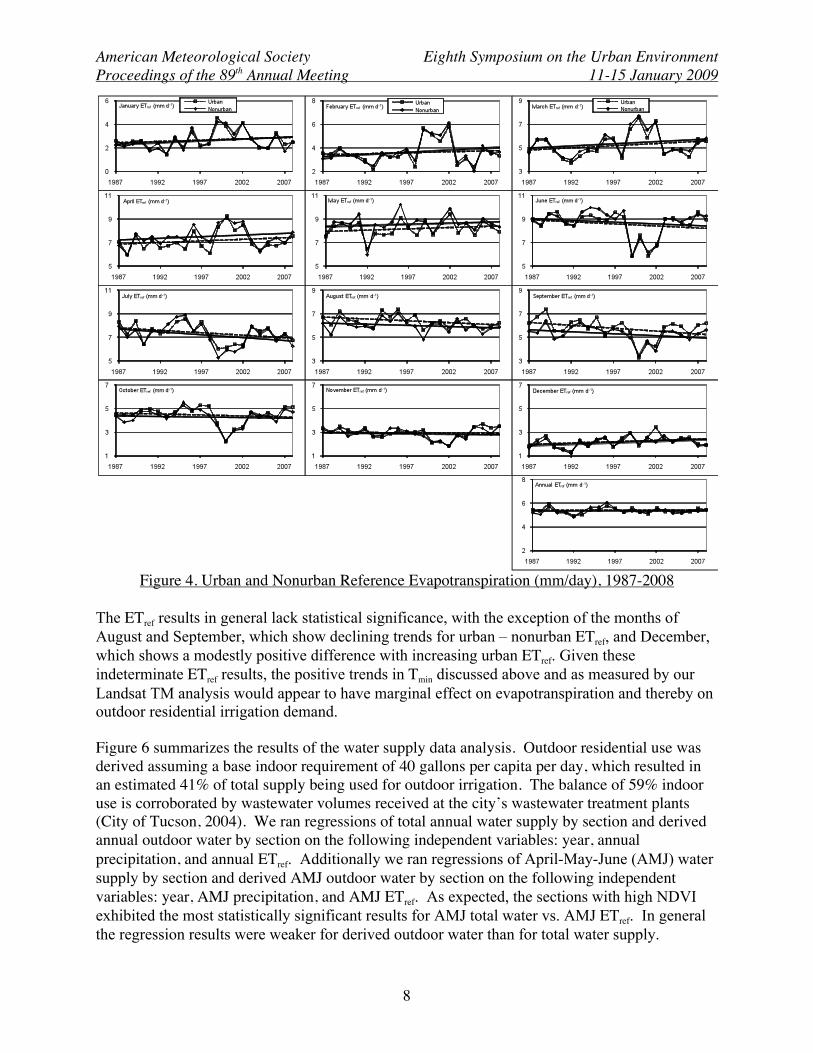
Figure 4. Urban and Nonurban Reference Evapotranspiration (mm/day), 1987-2008
The ETref results in general lack statistical significance, with the exception of the months of
August and September, which show declining trends for urban – nonurban ETref, and December,
which shows a modestly positive difference with increasing urban ETref. Given these
indeterminate ETref results, the positive trends in Tmin discussed above and as measured by our
Landsat TM analysis would appear to have marginal effect on evapotranspiration and thereby on
outdoor residential irrigation demand.
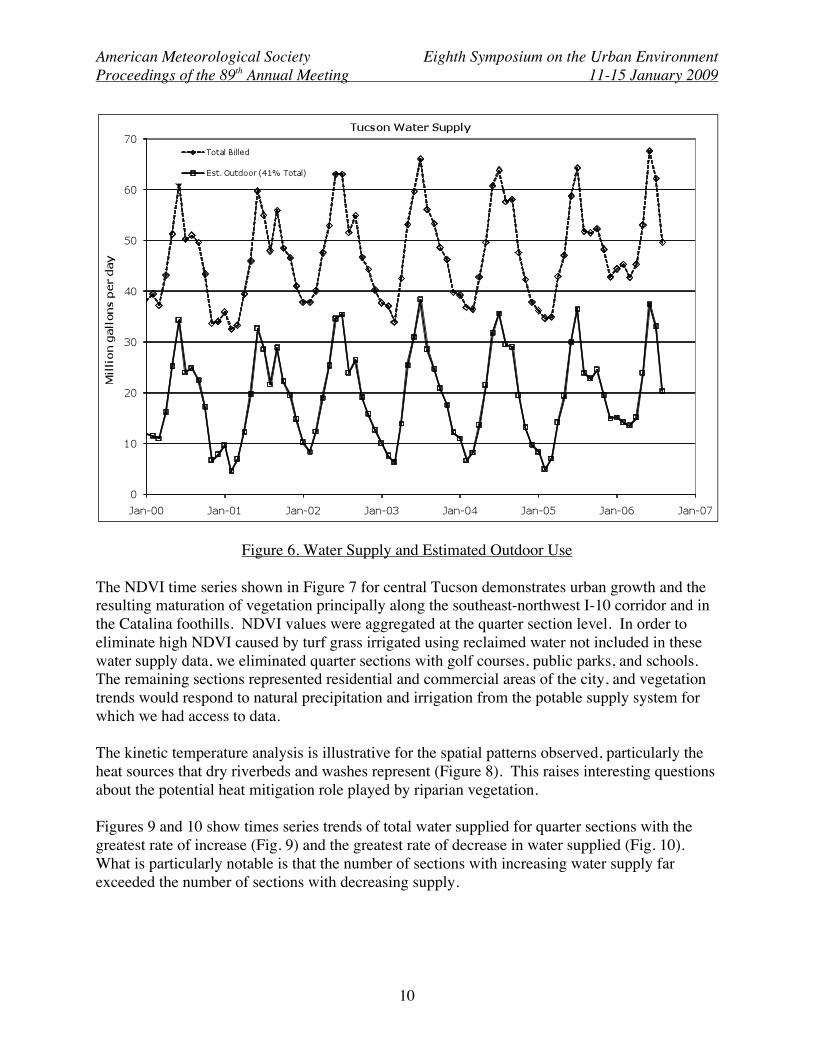
Figure 6 summarizes the results of the water supply data analysis. Outdoor residential use was
derived assuming a base indoor requirement of 40 gallons per capita per day, which resulted in
an estimated 41% of total supply being used for outdoor irrigation. The balance of 59% indoor
use is corroborated by wastewater volumes received at the city’s wastewater treatment plants
(City of Tucson, 2004). We ran regressions of total annual water supply by section and derived
annual outdoor water by section on the following independent variables: year, annual
precipitation, and annual ETref. Additionally we ran regressions of April-May-June (AMJ) water
supply by section and derived AMJ outdoor water by section on the following independent
variables: year, AMJ precipitation, and AMJ ETref. As expected, the sections with high NDVI
exhibited the most statistically significant results for AMJ total water vs. AMJ ETref. In general
the regression results were weaker for derived outdoor water than for total water supply.
American Meteorological Society Eighth Symposium on the Urban Environment
Proceedings of the 89th Annual Meeting 11-15 January 2009
9
Table 6. Annualized 1987-2008 Wind Speed Trends (Linear Slope Coefficients of Monthly Mean Wind
Speed at Urban and Nonurban Sites, mm d-1
yr-1
) and their Differences with Significance Month Tucson
(urban)
Signif.
p <
Marana
(urban)
Signif.
p <
Safford
(nonurban)
Signif.
p <
Bonita
(nonurban)
Signif.
P <
Jan -0.023 0.01 -0.024 0.001 -0.021 0.01 -0.013
Feb -0.026 0.001 -0.028 0.001 -0.025 0.001 -0.020 0.001
Mar -0.013 0.01 -0.026 0.001 -0.023 0.01 -0.021 0.001
Apr -0.009 -0.020 0.01 -0.012 0.000
May -0.018 0.001 -0.036 0.001 -0.021 0.01 -0.010 0.05
Jun -0.006 -0.020 0.01 -0.013 0.05 -0.009
Jul -0.011 -0.021 0.05 -0.027 0.001 -0.010 0.05
Aug -0.026 0.001 -0.018 0.01 -0.035 0.001 -0.016 0.01
Sep -0.026 0.001 -0.012 -0.028 0.001 0.002
Oct -0.012 -0.001 -0.010 0.009
Nov -0.023 0.001 -0.010 -0.021 0.05 -0.015
Dec -0.021 0.001 -0.014 0.05 -0.019 0.01 -0.022 0.01
Annual -0.018 0.001 -0.019 0.001 -0.021 0.001 -0.010 0.001
Figure 5. Urban and Nonurban Wind Speed (m/sec), 1987-2008
American Meteorological Society Eighth Symposium on the Urban Environment
Proceedings of the 89th Annual Meeting 11-15 January 2009
10
Figure 6. Water Supply and Estimated Outdoor Use
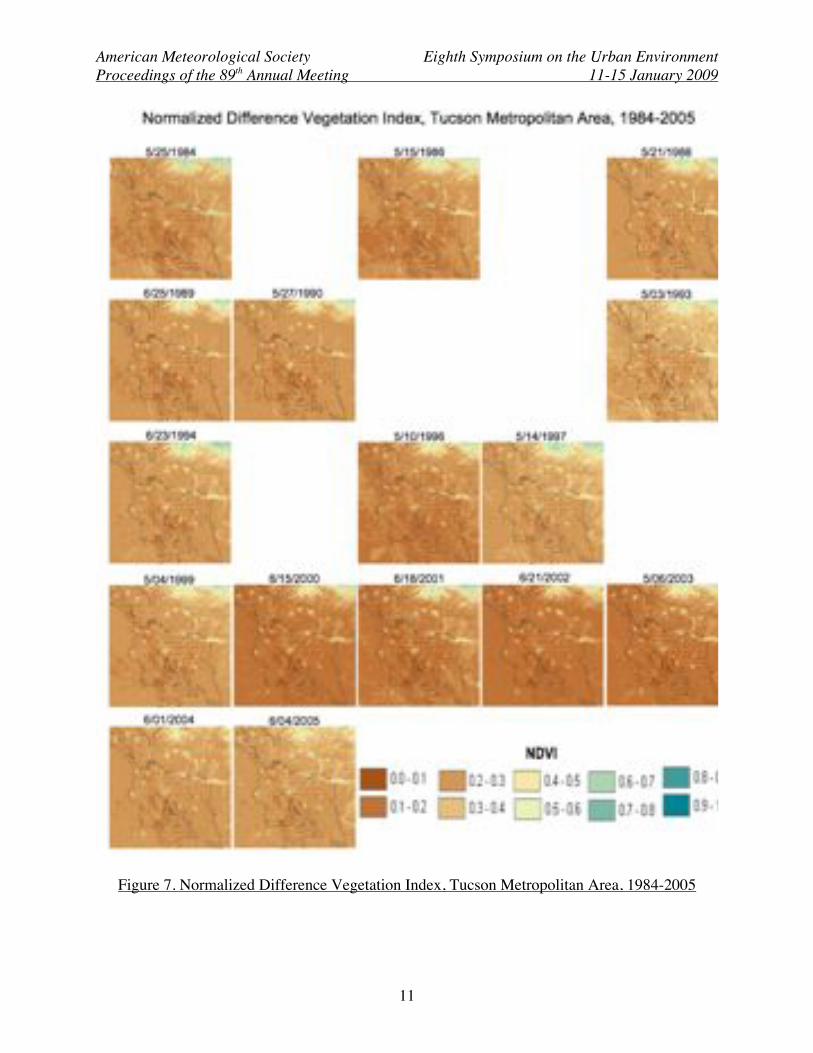
The NDVI time series shown in Figure 7 for central Tucson demonstrates urban growth and the
resulting maturation of vegetation principally along the southeast-northwest I-10 corridor and in
the Catalina foothills. NDVI values were aggregated at the quarter section level. In order to
eliminate high NDVI caused by turf grass irrigated using reclaimed water not included in these
water supply data, we eliminated quarter sections with golf courses, public parks, and schools.
The remaining sections represented residential and commercial areas of the city, and vegetation
trends would respond to natural precipitation and irrigation from the potable supply system for
which we had access to data.
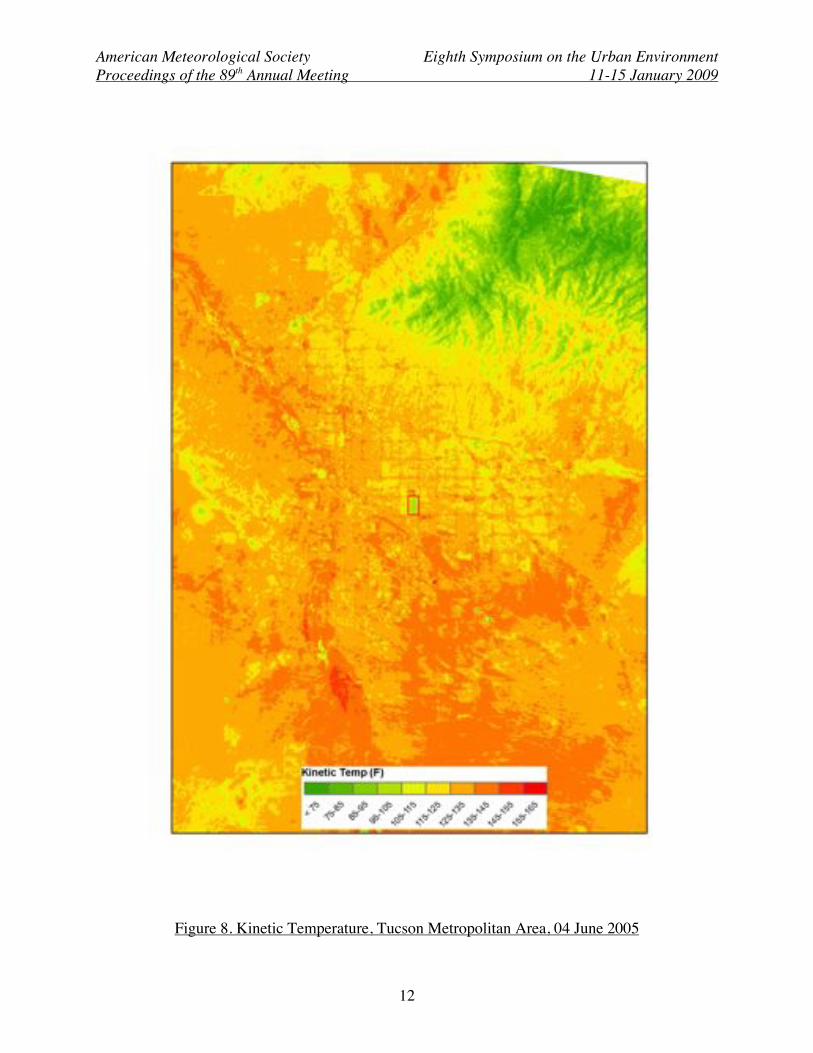
The kinetic temperature analysis is illustrative for the spatial patterns observed, particularly the
heat sources that dry riverbeds and washes represent (Figure 8). This raises interesting questions
about the potential heat mitigation role played by riparian vegetation.
Figures 9 and 10 show times series trends of total water supplied for quarter sections with the
greatest rate of increase (Fig. 9) and the greatest rate of decrease in water supplied (Fig. 10).
What is particularly notable is that the number of sections with increasing water supply far
exceeded the number of sections with decreasing supply.
American Meteorological Society Eighth Symposium on the Urban Environment
Proceedings of the 89th Annual Meeting 11-15 January 2009
11
Figure 7. Normalized Difference Vegetation Index, Tucson Metropolitan Area, 1984-2005
American Meteorological Society Eighth Symposium on the Urban Environment
Proceedings of the 89th Annual Meeting 11-15 January 2009
12
Figure 8. Kinetic Temperature, Tucson Metropolitan Area, 04 June 2005

American Meteorological Society Eighth Symposium on the Urban Environment
Proceedings of the 89th Annual Meeting 11-15 January 2009
13
Figure 9.
Total Annual Supply Trends for Quarter Sections with Greatest Rate of Increase in Supply
Figure 10.
Total Annual Supply Trends for Quarter Sections with Greatest Rate of Decrease in Supply

American Meteorological Society Eighth Symposium on the Urban Environment
Proceedings of the 89th Annual Meeting 11-15 January 2009
14
Conclusion
Tucson, Arizona is warming at a rate faster than the surrounding nonurban areas, with important
implications for vegetation in the built environment. The urban heat island effect is most
pronounced in the pre-monsoon months of February – May when outdoor irrigation demand is
highest. Warming that occurs earlier in the season, e.g., beginning in February, extends the
period of water demand. However, despite warmer minimum and maximum temperatures in the
pre-monsoon period, reference evapotranspiration does not demonstrate statistically significant
increasing trends for the 19897-2008 period of record. In fact, the only significant trend results
for ETref were monsoon season (July and August) declines, resulting in time-invariant
evaporative demand for water. Temperature increases are offset by wind speed decreases at both
urban and nonurban stations. Further work is required to explore potential effects that vegetation
and the built environment have on wind speeds.
Results of the NDVI analysis indicate a general greening trend over time, particularly for turf
grass on golf courses, parks, and schools. Controlling for turf grass, NDVI is higher in the urban
core although the most marked increases are for the developing urban fringes. Regression
analysis of change in NDVI with change in outdoor water use over time did not yield the
expected positive relationship. The water use analysis indicates that less than half of total water
supply is used for outdoor purposes.
Residents’ choice of vegetation type and amount and timing of irrigation are important
determinants of outdoor water demand. Further work is required to realistically reflect water
users’ practices. Finally, demand forecasting must account for water pricing, perceptions of and
responses to scarcity, and policy initiatives promoting (or inhibiting) water conservation.
Acknowledgments
This research was supported by the Water Resources Research Center and the University of
Arizona under a 104B grant from the United States Geological Survey. Special thanks are
offered to Tucson Water for making the water supply data available, and to staff of the Arizona
Regional Image Archive.
References
Ahmad, M., T.W. Biggs, H. Turral, C.A. Scott. 2006. Application of SEBAL approach and
MODIS time-series to map vegetation water use patterns in the data scarce Krishna river
basin of India. Water Science & Technology 53(10): 83–90.
Arnfield, A. J. 2003. Two decades of urban climate research: a review of turbulence, exchanges
of energy and water, and the urban heat island. International Journal of Climatology 23:
1-26.
American Meteorological Society Eighth Symposium on the Urban Environment
Proceedings of the 89th Annual Meeting 11-15 January 2009
15
Brazel, A.J. 2003. Future climate in central Arizona: heat and the role of urbanization.
Consortium for the Study of Rapidly Urbanizing Regions. Research Vignette No. 2,
September 2003.
Brookshire, D.S., S. Burness, J.M. Chermak, and K. Krause. 2002. Western urban water demand.
Nat. Resour. J. 42(4): 873-898, 2002.
Chavez, P.S. Jr. 1996. Image-based atmospheric corrections—revisited and revised.
Photogrammetric Engineering and Remote Sensing 62(9): 1025-1036.
City of Tucson Water Department. 2004. Water Plan: 2000-2050. November 22, 2004.
Comrie, A.C. 2000. Mapping a wind-modified urban heat island in Tucson, Arizona (with
comments on integrating research and undergraduate learning). Bulletin of the American
Meteorological Society 81(10): 2417-2431.
Golden, J.S. 2003. The built environment induced urban heat island effect in rapidly urbanizing
arid regions – a sustainable urban engineering complexity. Environmental Sciences 1(4):
321-349.
Grimmond C.S.B., and Oke, T.R. 1995: Comparison of heat fluxes from summertime
observations in the suburbs of four North American cities. J. Applied Meteorology 34:
873-889.
Hansen, J., R. Ruedy, J. Glascoe, and M. Sato. 1999. GISS analysis of surface temperature
change. J. Geophysical Research 104(D24-D30): 997-1022.
Huxman, T. E., K. A. Snyder, D. Tissue, A. J. Leffler, K. Ogle, W. T. Pockman, D. R. Sandquist,
D. L. Potts, and S. Schwinning. 2004. Precipitation pulses and carbon fluxes in semiarid
and arid ecosystems. Oecologia 141:254-268.
Kliman, Susan Schaefer, and Andrew C. Comrie. 2004. Effects of vegetation on residential
energy consumption. Home Energy July/August 2004: 38-42.
Lee, Ickjai. 2004. Mining multivariate associations within GIS environments. Innovations in
Applied Artificial Intelligence. pp. 1062-1071. Springer: Berlin / Heidelberg.
Lo, C.P., D.A. Quattrochi, and J.C. Luvall. 1997. Application of high-resolution thermal infrared
remote sensing and GIS to assess the urban heat island effect. International Journal of
Remote Sensing 18(2): 287 – 304. doi 10.1080/014311697219079.
Lougeay, R., M.J. Stoll, and A.J. Brazel. 1994. Surface emissivity calibration of Landsat thermal
data: Creating an urban surface temperature map of Phoenix, Arizona. Geograph. Bull.,
36, 74–82.
Megdal, Sharon. 2006. Water Resource Availability for the Tucson Metropolitan Area. Water
Resources Research Center, University of Arizona, Tucson.
Morehouse, Barbara J. 2000. Climate impacts on urban water resources in the Southwest: the
importance of context. Journal of the American Water Resources Association 36(2): 265-
277.
Roth, M., T.R. Oke, and W.J. Emery. 1989. Satellite-derived urban heat islands from three
coastal cities and the utilization of such data in urban climatology. International Journal
of Remote Sensing 10(11): 1699-1720
Sandholt, I., Kjeld Rasmussen, and Jens Andersen. 2002. A simple interpretation of the surface
temperature/vegetation index space for assessment of surface moisture status. Remote
Sensing of Environment 79: 213-224.
Scott, C.A., W.G.M. Bastiaanssen, M. Ahmad. 2003. Mapping root zone soil moisture using
remotely sensed optical imagery. ASCE Journal of Irrigation and Drainage Engineering
129(5): 326-335.

American Meteorological Society Eighth Symposium on the Urban Environment
Proceedings of the 89th Annual Meeting 11-15 January 2009
16
Scott, R. L., T. E. Huxman, W. L. Cable, and W. E. Emmerich. 2006. Partitioning of
evapotranspiration and its relation to carbon dioxide exchange in a Chihuahuan Desert
shrubland. Hydrological Processes 20:3227-3243.
U.S. Geological Survey EROS Data Center, Distributed Active Archive Center
(http://edcdaac.usgs.gov/landsat7/faq_calculations.html).
Voogt, J.A. and T.R. Oke. 1998. Effects of urban surface geometry on remotely-sensed surface
temperature. International Journal of Remote Sensing 19(5): 895 – 920. doi
10.1080/014311698215784.
Weng, Qihao, Dengsheng Lu, and Bingqing Liang. 2006. Urban surface biophysical descriptors
and land surface temperature variations. Photogrammetric Engineering & Remote
Sensing 72(11): 1275-1286.
Weng, Qihao, Dengsheng Lu, and Jacquelyn Schubring. 2004. Estimation of land surface
temperature – vegetation abundance relationship for urban heat island studies. Remote
Sensing of Environment 89: 467 – 483. doi:10.1016/j.rse.2003.11.005.
Wilhelmi, Olga V., Kathleen L. Purvis, and Robert C. Harriss. 2004. Designing a geospatial
information infrastructure for mitigation of heat wave hazards in urban areas. Natural
Hazards Rev. 5(3): 147-158. doi:10.1061/(ASCE)1527-6988(2004)5:3(147).