the evolution of structures asset management in wisconsin … · the evolution of structures asset...
TRANSCRIPT

Dietsche, J.S. 1
The Evolution of Structures Asset Management in Wisconsin 1
April 21, 2017 2
Word Count: 4686 3
4
Joshua S. Dietsche 5
Wisconsin Department of Transportation 6
4802 Sheboygan Avenue, Room 601, Madison, WI 53707 7
Phone: 608-266-8353 8
Fax: 608-266-5166 9
Dietsche, J.S. 2
ABSTRACT 1
Beginning in the early-2000s, the Wisconsin DOT (WisDOT) Bureau of Structures began a concerted 2 effort to develop processes and tools to help manage the Wisconsin structures inventory. The first major 3 step was the development of a data management tool; the Highway Structures Information System 4 (HSIS). This application provides WisDOT with a means to collect, store, and manage structure 5 inventory, design, rating, and inspection data. 6
A second step was aimed at documenting and standardizing bridge preservation practices across the state. 7 Organizationally, WisDOT divides the state into five regions. Each has their own maintenance, planning, 8 and scoping staff, with oversight from WisDOT central office. To promote consistency amongst the 9 regions, WisDOT created the Bridge Preservation Policy Guide. This guide provides an inventory of 10 preservation actions and also addresses goals, objectives, and performance measures. The aim is to lay the 11 groundwork for more consistent bridge work activities (maintenance, rehabilitation, replacement) around 12 the state. 13
Most recently, WisDOT has focused on developing a tool to provide recommendations for current and 14 future bridge work actions. The result of this work is the Wisconsin Structures Asset Management System 15 (WiSAMS). WiSAMS relies heavily on the inventory data and inspection data stored in HSIS and uses a 16 set of rules and deterioration modeling to determine current and future optimal work. The WiSAMS rules 17 are a logical extension of policy in the Bridge Preservation Policy Guide. 18
As a whole, WiSAMS and WisDOT’s structures asset management program represent a substantial step 19 forward into better management of the Wisconsin structures inventory. 20
Dietsche, J.S. 3
INTRODUCTION 1
The Moving Ahead for Progress in the 21st Century (MAP-21) legislation contains the following 2 definition for asset management (FHWA, 2012): 3
Asset management is a strategic and systematic process of operating, maintaining, and 4 improving physical assets, with a focus on both engineering and economic analysis based 5 upon quality information, to identify a structured sequence of maintenance, preservation, 6 repair, rehabilitation, and replacement actions that will achieve and sustain a desired 7 state of good repair over the life-cycle of the assets at minimum practicable cost. 8
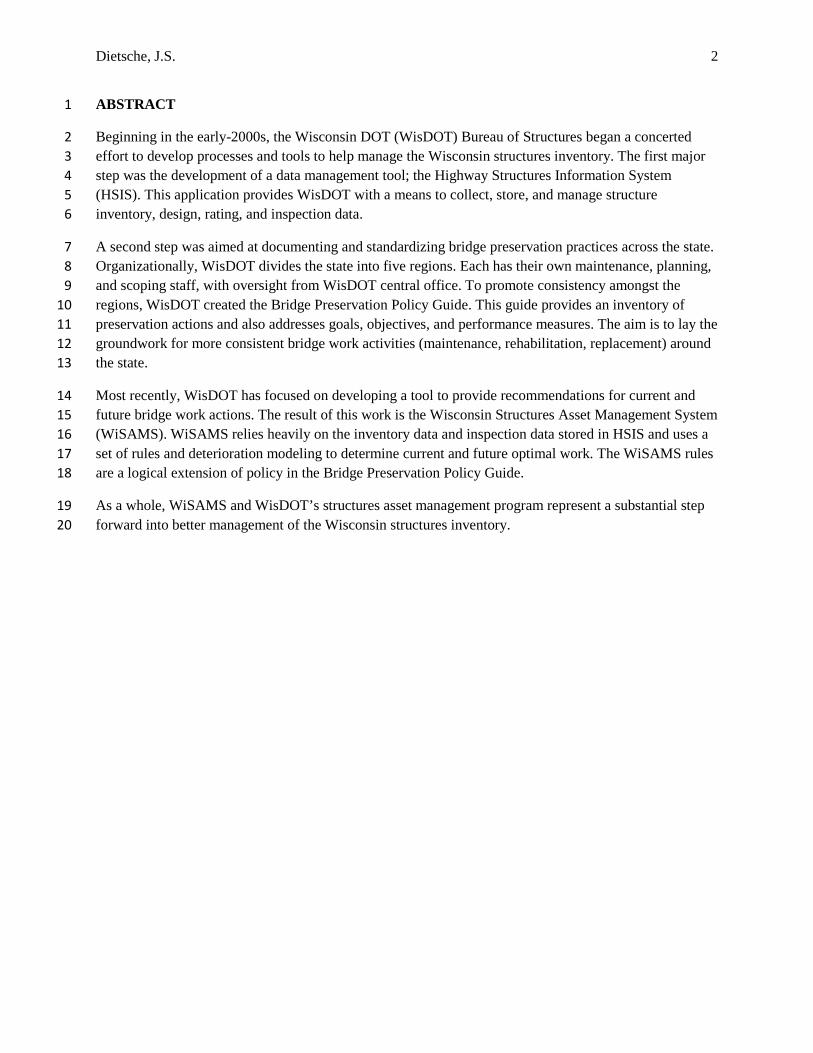
The Wisconsin Department of Transportation (WisDOT) has developed and is implementing a structures 9 asset management program that meets FHWA’s definition. At its most basic level, structures asset 10 management is practiced as shown in Figure 1. The process is continually refreshing itself and is 11 dependent on quality data. 12
FIGURE 1 Basic Asset Management Cycle 13
Inventory and inspection data are the foundation necessary to implement a systematic approach to 14 maximizing the life of a given structure. WisDOT has developed tools to assist with the collection, 15 storage, and manipulation of the data. The next step is the derivation of data-driven recommendations for 16 structures work that will optimize the amount of usable life for a given structure. WisDOT accomplishes 17 this using recently-developed software tools. Next is the implementation of those work recommendations 18 by WisDOT regional planning, scoping, and project development personnel. When these projects are 19 complete, the structure is opened (or re-opened) to traffic and must be inspected at regular intervals, per 20 Federal Highway Administration (FHWA) guidelines. These inspections record the current condition of 21
Dietsche, J.S. 4
the structure, which is collected, stored, and used to help produce recommendations for future structure 1 work - starting the whole process again. This paper documents the process, procedures, and tools that 2 WisDOT has developed in order to implement a modern structures asset management program. 3
The Wisconsin Bridge Inventory 4
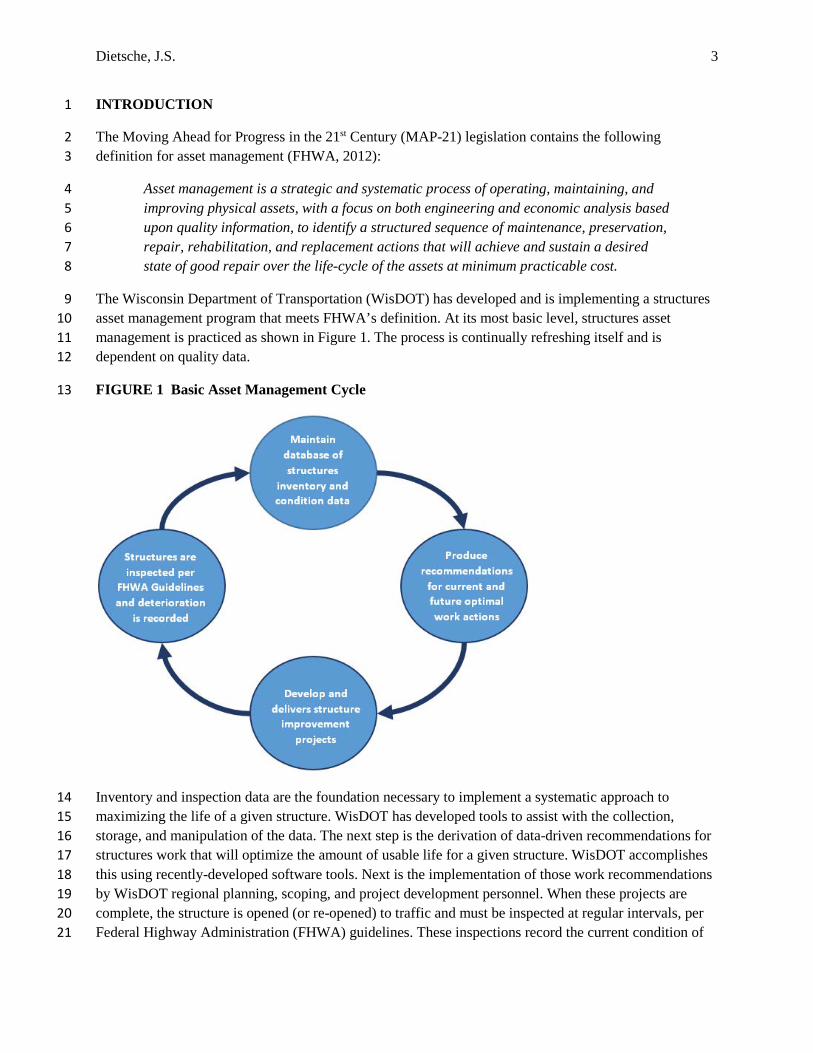
To set the context for WisDOT asset management practice, it’s helpful to understand the nature of current 5 Wisconsin bridge inventory. Per the 2016 WisDOT Bureau of Structures Annual Bridge Report (WisDOT 6 BOS 2016), there are 14,116 bridges in the state. Roughly 1/3 of the inventory is state-owned, 2/3 local-7 owned, with the specific break-down shown in Figure 2. Also shown below is a breakdown of state-8 owned bridges by superstructure type. Prestressed girder bridges are the dominant superstructure type in 9 Wisconsin. Most new bridges constructed in Wisconsin are either prestressed I-girder or haunched 10 concrete slab structures, depending on span length. 11
FIGURE 2 Wisconsin Bridge Inventory – Owner and Superstructure Type (WisDOT BOS, 2016) 12
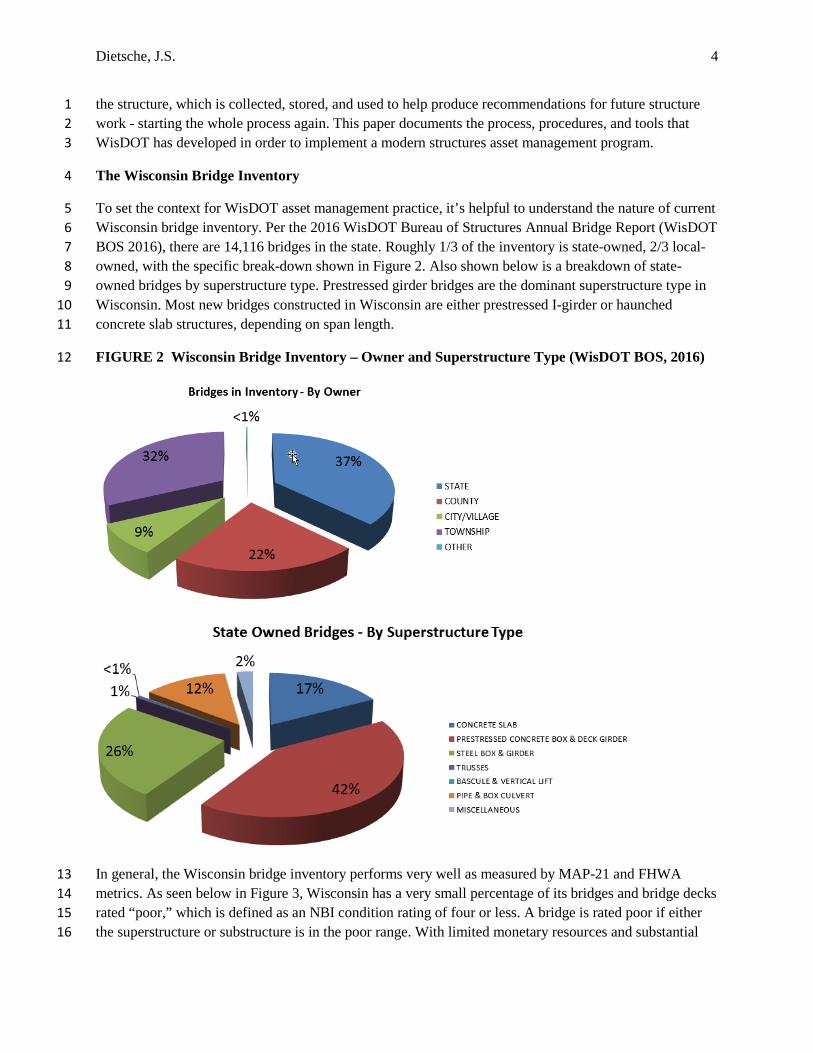
In general, the Wisconsin bridge inventory performs very well as measured by MAP-21 and FHWA 13 metrics. As seen below in Figure 3, Wisconsin has a very small percentage of its bridges and bridge decks 14 rated “poor,” which is defined as an NBI condition rating of four or less. A bridge is rated poor if either 15 the superstructure or substructure is in the poor range. With limited monetary resources and substantial 16
Dietsche, J.S. 5
needs, the challenge for WisDOT’s structures asset management program in coming years is to maintain 1 the performance displayed below. 2
FIGURE 3 NBI Condition Rating of State-Owned Wisconsin Bridges and Bridge Decks, by 3 Number of Bridges (WisDOT BOS, 2016) 4
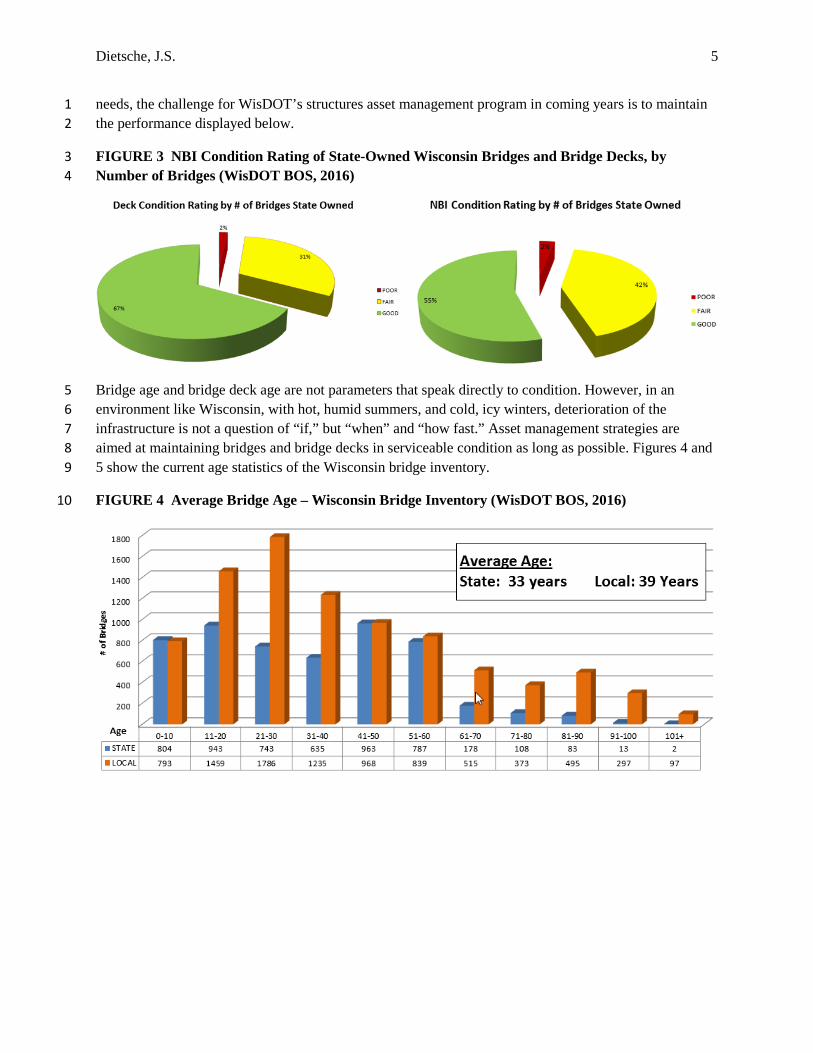
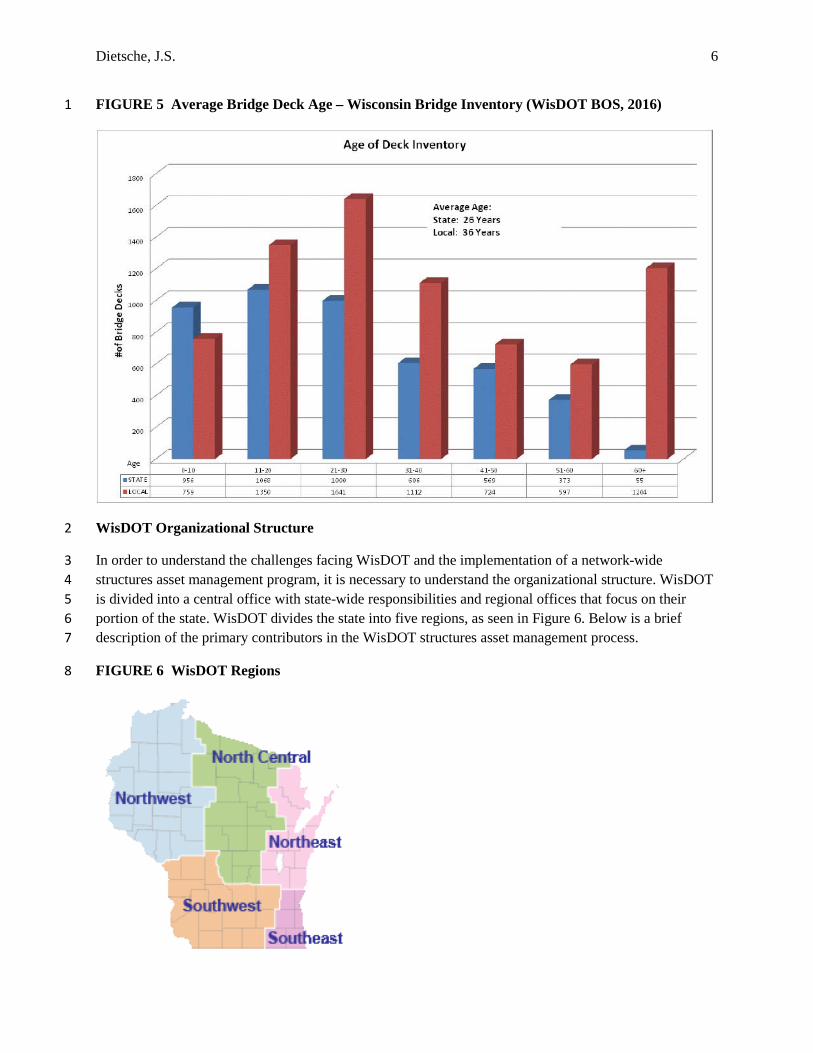
Bridge age and bridge deck age are not parameters that speak directly to condition. However, in an 5 environment like Wisconsin, with hot, humid summers, and cold, icy winters, deterioration of the 6 infrastructure is not a question of “if,” but “when” and “how fast.” Asset management strategies are 7 aimed at maintaining bridges and bridge decks in serviceable condition as long as possible. Figures 4 and 8 5 show the current age statistics of the Wisconsin bridge inventory. 9
FIGURE 4 Average Bridge Age – Wisconsin Bridge Inventory (WisDOT BOS, 2016) 10
Dietsche, J.S. 6
FIGURE 5 Average Bridge Deck Age – Wisconsin Bridge Inventory (WisDOT BOS, 2016) 1
WisDOT Organizational Structure 2
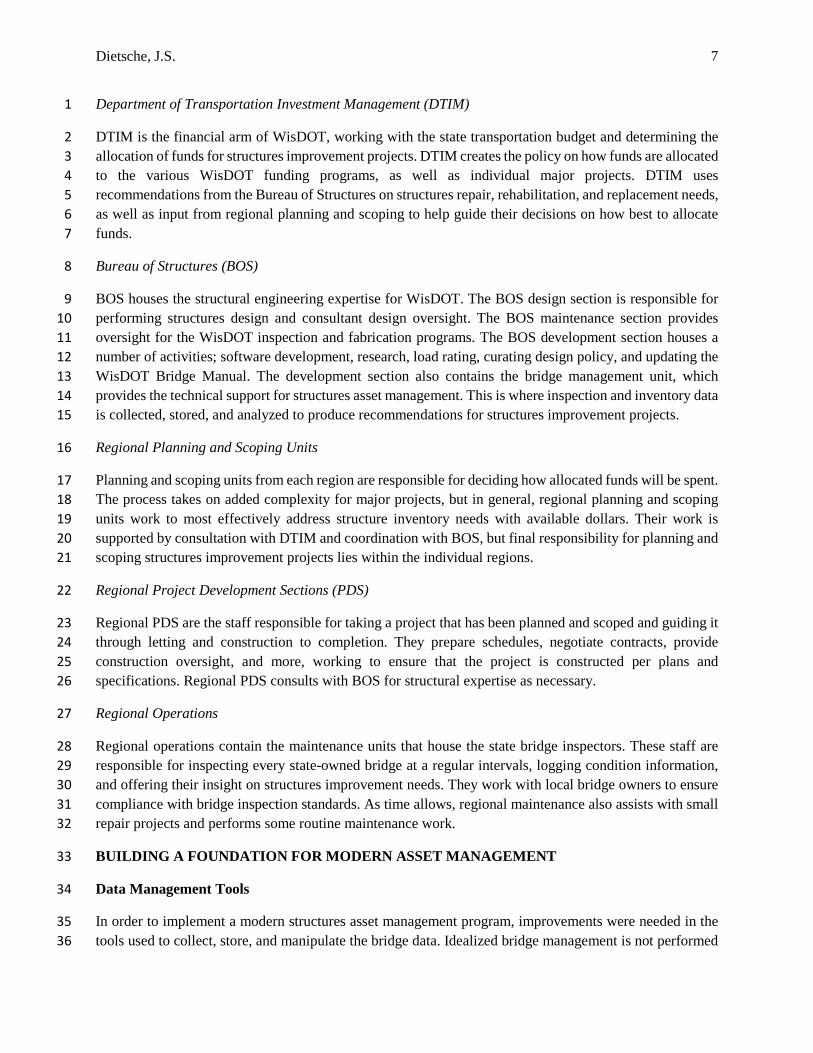
In order to understand the challenges facing WisDOT and the implementation of a network-wide 3 structures asset management program, it is necessary to understand the organizational structure. WisDOT 4 is divided into a central office with state-wide responsibilities and regional offices that focus on their 5 portion of the state. WisDOT divides the state into five regions, as seen in Figure 6. Below is a brief 6 description of the primary contributors in the WisDOT structures asset management process. 7
FIGURE 6 WisDOT Regions 8
Dietsche, J.S. 7
Department of Transportation Investment Management (DTIM) 1
DTIM is the financial arm of WisDOT, working with the state transportation budget and determining the 2 allocation of funds for structures improvement projects. DTIM creates the policy on how funds are allocated 3 to the various WisDOT funding programs, as well as individual major projects. DTIM uses 4 recommendations from the Bureau of Structures on structures repair, rehabilitation, and replacement needs, 5 as well as input from regional planning and scoping to help guide their decisions on how best to allocate 6 funds. 7
Bureau of Structures (BOS) 8
BOS houses the structural engineering expertise for WisDOT. The BOS design section is responsible for 9 performing structures design and consultant design oversight. The BOS maintenance section provides 10 oversight for the WisDOT inspection and fabrication programs. The BOS development section houses a 11 number of activities; software development, research, load rating, curating design policy, and updating the 12 WisDOT Bridge Manual. The development section also contains the bridge management unit, which 13 provides the technical support for structures asset management. This is where inspection and inventory data 14 is collected, stored, and analyzed to produce recommendations for structures improvement projects. 15
Regional Planning and Scoping Units 16
Planning and scoping units from each region are responsible for deciding how allocated funds will be spent. 17 The process takes on added complexity for major projects, but in general, regional planning and scoping 18 units work to most effectively address structure inventory needs with available dollars. Their work is 19 supported by consultation with DTIM and coordination with BOS, but final responsibility for planning and 20 scoping structures improvement projects lies within the individual regions. 21
Regional Project Development Sections (PDS) 22
Regional PDS are the staff responsible for taking a project that has been planned and scoped and guiding it 23 through letting and construction to completion. They prepare schedules, negotiate contracts, provide 24 construction oversight, and more, working to ensure that the project is constructed per plans and 25 specifications. Regional PDS consults with BOS for structural expertise as necessary. 26
Regional Operations 27
Regional operations contain the maintenance units that house the state bridge inspectors. These staff are 28 responsible for inspecting every state-owned bridge at a regular intervals, logging condition information, 29 and offering their insight on structures improvement needs. They work with local bridge owners to ensure 30 compliance with bridge inspection standards. As time allows, regional maintenance also assists with small 31 repair projects and performs some routine maintenance work. 32
BUILDING A FOUNDATION FOR MODERN ASSET MANAGEMENT 33
Data Management Tools 34
In order to implement a modern structures asset management program, improvements were needed in the 35 tools used to collect, store, and manipulate the bridge data. Idealized bridge management is not performed 36
Dietsche, J.S. 8
bridge-by-bridge, but rather at a network-level. Wisconsin has over 5,000 state-owned bridges; a large 1 amount of data to store and manipulate manually. As computer technology evolved, WisDOT moved from 2 paper to digital files, utilizing a mainframe database to store bridge data. Limited by the available 3 technology, the system was accessible only in the WisDOT central office, so data entry and extraction was 4 difficult and time-consuming. Collection of data was a manual, time-intensive process and subject to error. 5 The data management system as a whole was not conducive to network-level structures asset management. 6
With the advent of the internet, a more-connected, accessible database became a possibility. WisDOT took 7 advantage of this technological advance by developing a new database to collect and store structure 8 inventory and inspection data. The Highway Structures Information System (HSIS), was initially developed 9 in the early-2000s by collaboration of a computer software programmer and WisDOT bridge management 10 engineers. Continuing this relationship, HSIS has continued to be enhanced to meet WisDOT needs. Some 11 notable features of HSIS include: 12
• A web-based interface in order to be widely accessible for parties both internal and external to WisDOT. 13 • Live updates; as new inventory information is input or new inspections are uploaded, that information 14
is immediately available to access. 15 • The ability for bridge inspectors to upload inspections directly to the HSIS site. 16 • Compatibility with multiple internet browsers and mobile devices (tablets, smartphones). 17 • The ability for any user to select parameters from drop-down menus and query information from the 18
database. 19 • The ability to easily create and make available customized reports to meet various business area needs. 20 • A portal to access bridge plans, shop drawings, and other design documents. 21 • Compatibility with other applications used by WisDOT for easy transfer of data. 22
The creation of HSIS was a necessary and critical step on the path toward structures asset management. 23 HSIS gives WisDOT the capability to collect, store, and manipulate all the data necessary for structures 24 asset management activities. 25
Bridge Preservation Policy 26
From the MAP-21 legislation, asset management aims to “…identify a structured sequence of maintenance, 27 preservation, repair, rehabilitation, and replacement actions that will achieve and sustain a desired state of 28 good repair over the life-cycle of the assets at minimum practicable cost.” (FHWA, 2012) Implicit in this 29 definition is the development of policy to document standard practice for the actions noted; maintenance, 30 preservation, repair, rehabilitation, and replacement. WisDOT addressed this with the creation of the BOS 31 Bridge Preservation Policy Guide (BPPG) (WisDOT BOS, 2016). Completed in the summer of 2015, the 32 BPPG serves as the basis for optimal treatment decisions regarding state-owned bridges. It offers a state-33 wide baseline for planning and scoping bridge projects over the life-cycle of the structure. The BPPG 34 represents a collaborative effort among members of the BOS development and maintenance sections, as 35 well as regional bridge inspection program managers. In addition, BOS elicited input from a consultant 36 subject-matter expert and coordinated the final version of the document with WisDOT’s FHWA liaison. In 37 creating the BPPG, WisDOT aimed to address the following: 38
• Establish goals and strategies for bridge preservation. 39 • Create bridge preservation-specific objectives and related performance measures. 40

Dietsche, J.S. 9
• Identify a set of bridge preservation activities to meet program goals and establish eligibility criteria 1 for each. 2
Goals and Strategies for Bridge Preservation 3
As stated in the BPPG, “the main goal of a bridge preservation program is to maximize the useful life of 4 bridges in a cost effective way. To meet this goal, many of the strategies are aimed at applying the 5 appropriate bridge preservation activities at the proper time, resulting in longer service life at an optimal 6 life cycle cost.” More specifically, the BPPG documents the following goals: 7
• Maintain bridges in a “state of good repair” using cost-effective strategies. 8 • Implement timely preservation treatments on structurally-sound bridges to promote optimal life-cycle 9
costs, extend overall service life, and extend the time between major rehabilitation and replacement 10 activities. 11
• Limit adverse impacts to traffic operations and various affected stakeholders. 12 • Promote and support budgeting of preventive maintenance activities. 13 • Establish and monitor progress of performance goals related to preservation of bridges. 14 • Optimize the benefits and effectiveness of long-term maintenance investments in achieving a “state of 15
good repair” for WisDOT’s bridge inventory. 16
The BOS Bridge Preservation Policy Guide also documents strategies to meet the stated goals. In general, 17 the strategies are aimed at using data-driven methods to maximize the efficiency and effectiveness of the 18 program. Some of these strategies include: 19
• Regular analysis of the bridge inventory data to establish conditions and trends related to 20 performance. 21
• Develop estimates of needed financial resources at the project and program level. 22 • Prioritize, plan, and perform preservation treatments. 23
The strategies noted above indicate the need for a systematic method to analyze data on a network-wide 24 basis. This need lead WisDOT to develop an asset management application, which is discussed in more 25 detail later in this document. 26
Bridge Preservation Objectives and Related Performance Measures 27
In order to evaluate the effectiveness of the stated goals and strategies, the BPPG defines a set of specific 28 objectives and performance measures. Though at the early stage of implementation, it is WisDOT’s intent 29 to use these performance measures as one tool to evaluate the effectiveness of the bridge preservation 30 policy and its implementation. The objectives and performance measures identified are shown below in 31 Table 1. 32

Dietsche, J.S. 10
TABLE 1 Bridge Preservation Objectives and Performance Measures (WisDOT BOS, 2016) 1
Bridge Preservation Activities and Eligibility Criteria 2
Using the experience of WisDOT bridge maintenance personnel combined with a literature review and a 3 consultant subject-matter expert, the BPPG establishes parameters for the consideration of bridge 4 preservation activities. Covering deck, superstructure, and substructure, the identified activities are 5 considered cost-effective, provided they are applied to the right bridge at the appropriate time. The 6 WisDOT bridge preservation activities are shown in Table 2 below. 7

Dietsche, J.S. 11
TABLE 2 Bridge Preservation Activities (WisDOT BOS, 2016) 1
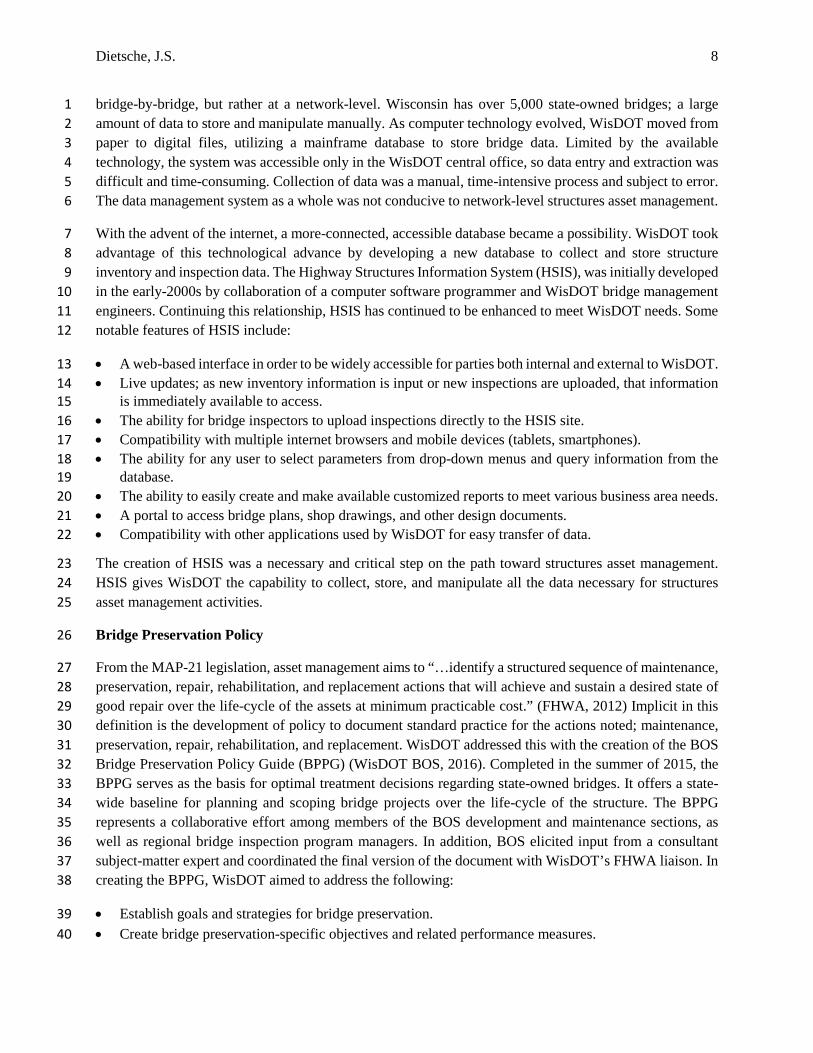
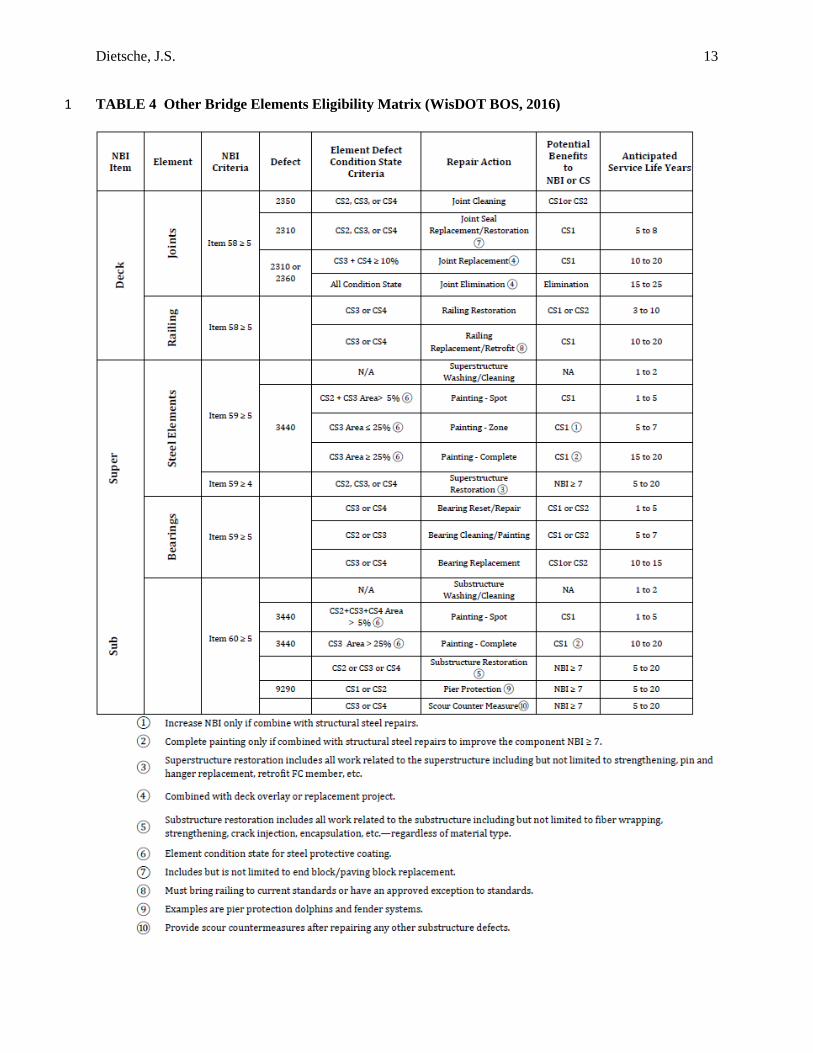
In order to provide guidance to maintenance, programming, and scoping personnel on when each activity 2 should be considered, the BPPG contains eligibility criteria. Based on a combination of NBI and element-3 level condition data, the criteria aims to provide a window for when each activity is appropriate; when it 4 will provide a cost-effective way to extend the life of the structure. Guidance provided is intended to be 5 used with sound engineering judgment and any other available data, such as ground-penetrating radar 6 surveys, infrared surveys, chloride test results, etc. Eligibility criteria is shown in Tables 3 and 4 below. 7
Dietsche, J.S. 12
TABLE 3 Concrete Deck/Slab Eligibility Matrix (WisDOT BOS, 2016) 1
Dietsche, J.S. 13
TABLE 4 Other Bridge Elements Eligibility Matrix (WisDOT BOS, 2016) 1
Dietsche, J.S. 14
With this policy document complete, data collection and storage policies established, and the HSIS 1 application reaching a fully-developed stage, the foundation was established for implementing a modern 2 structures asset management program. As noted previously, in order to efficiently implement bridge 3 preservation strategies, tools are required to be able to analyze inventory and condition data on a network-4 wide basis. 5
Asset Management Tools 6
Even before the development of HSIS and the Bridge Preservation Policy Guide, BOS understood the need 7 for structures asset management; the need to provide guidance on future bridge rehabilitation or 8 replacement needs to WisDOT planning and programming engineers. In the late 1990s, BOS partnered with 9 DTIM to provide 6-year work projections for every state-owned bridge in Wisconsin. There were obvious 10 limitations; condition data was not as detailed as modern element-based inspection data, the equations used 11 to extrapolate future deterioration were somewhat-crude, and work recommendations were limited to only 12 activities available at the time in WisDOT’s Financial Integrated Improvement Programming System 13 (FIIPS). Meaningful interaction between BOS and DTIM or BOS and regional planning/scoping personnel 14 was limited. Based on feedback from regional personnel, the value of these early asset management 15 recommendations was minimal. The development of HSIS and the move to element-based bridge 16 inspections presented an opportunity to implement a more effective structures asset management program. 17
Using the BPPG as a reference, the next step in the process was the creation of an asset management 18 application to provide recommendations for future work based on current data. This application represents 19 WisDOT’s efforts to address the first portion of the MAP-21 definition of asset management; to develop a 20 “strategic and systematic process of operating, maintaining, and improving physical assets, with a focus 21 on both engineering and economic analysis based upon quality information…” The application took 22 shape in the form of the Wisconsin Structures Asset Management System, or WiSAMS. 23
The Wisconsin Structures Asset Management System (WiSAMS) 24
The WiSAMS application was developed in-house, using a software engineer in the BOS development 25 section for the programming. Subject-matter direction came from BOS bridge management engineers. The 26 application utilizes inventory and condition data stored in the HSIS and applies the policies established in 27 the BOS Bridge Preservation Policy Guide. In order to forecast needs, future bridge conditions are 28 extrapolated using present-day condition data and applying deterioration curves. This was the initial scope 29 of WiSAMS. 30
WiSAMS Background Logic 31
The first and primary issue in creating WiSAMS was to determine how to translate preservation policy 32 into a logic that could be applied systematically to a set of data. This was accomplished by establishing a 33 set of “rules.” These rules take the form of “if-then” statements. An evaluation of a given condition 34 parameter is performed. If the evaluation criteria is met, then a specific work action is assigned. For 35 illustration, WiSAMS rules #1 and #10 are shown below. 36
Dietsche, J.S. 15
WiSAMS Rule #1: 1
• If the all of the following criteria are met… 2 o The current NBI rating for substructure is less than or equal to 3, and; 3 o The structure is scour critical; 4
• …then the recommended work action is “REPLACE STRUCTURE.” 5
WiSAMS Rule #10: 6
• If the all of the following criteria are met… 7 o The current NBI rating for superstructure is less than or equal to 3, and; 8 o The structure is > 50 years old, and; 9 o The superstructure is fracture critical; 10
• …then the recommended work action is “REPLACE STRUCTURE.” 11
The rules shown above are relatively simple in nature and rely largely on NBI condition data. As 12 WisDOT compiles a history of element-based inspection data, WiSAMS rules will transition to the more 13 detailed, element-based condition data. Some current rules are more complex and take into account 14 element-based condition data, as seen below. 15
WiSAMS Rule #32: 16
• If the all of the following criteria are met… 17 o The number of previous overlays (concrete or asphalt) is less than 4, and; 18 o The current NBI rating for deck is greater than or equal to 6, and; 19 o The total quantity of deck area in CS-2, CS-3, and CS-4 for defect 1080 (delaminations, 20
spalls, and patches) is less than 5% of the total deck area, and; 21 o The total quantity of deck area in CS-2, CS-3, and CS-4 for defect 3210 (debonding, spalls, 22
patched area, pothole – wearing surface) is greater than 20% of the total deck area, or; 23 o The total quantity of deck area in CS-2, CS-3, and CS-4 for defect 3220 (crack – wearing 24
surface) is greater than 50% of the total deck area, or; 25 o The total quantity of deck area in CS-3 and CS-4 for defect 8911 (abrasion, wear, rutting, or 26
loss of friction – wearing surface) is greater than 20% of the total deck area; 27 • …then the recommended work action is “CONCRETE OVERLAY.” 28
For a given bridge, the WiSAMS application will pull the relevant condition and inventory data from 29 HSIS. That data is then used to evaluate each of the rules, in order. When the criteria for a given rule is 30 met, the process stops and the associated work action for that rule is reported as the optimal work action. 31 It should be noted that for a bridge in good condition, there may be no recommended work. It is also 32 important to note that the WiSAMS rules, including those shown above, are a representation of the policy 33 defined in the BPPG. Recommended work actions that are produced from the WiSAMS application are an 34 extension of the policy set forth in the guide. 35
Forecasting Future Work Actions 36
As described above, the process for identifying work actions depends on structure condition data. 37 Condition data is updated based on inspections, which typically occur on a 2-year cycle. Present-day 38 condition data is based on the most recent inspection and thus provides an accurate account of the current 39
Dietsche, J.S. 16
condition of the structure. In order to project future work actions, there is a need to project future 1 condition data. This is accomplished through the use of deterioration curves. The curves used in 2 WiSAMS were derived using historic Wisconsin NBI condition data as well as some national element-3 based condition data. These curves are applied to current condition data and used to derive predicted 4 condition data in future years. WiSAMS uses this predicted future condition to produce recommended 5 future work actions. This information is a critical piece of the structures asset management puzzle. With 6 recommended future work actions, regional planning and scoping engineers now have better information 7 to help apply allocated funds to most effectively maintain their bridge inventory in a state of good repair. 8
Other WiSAMS Features 9
WiSAMS is intended to be a tool used to provide information to DTIM and region personnel with the best 10 information available in order to most effectively program and scope bridge preservation activities. 11 Working toward this goal, WiSAMS output provides information beyond just current and future 12 recommended work actions. Some of this information includes: 13
• Cost estimates: For recommended work actions, WiSAMS uses cost data from projects recently let by 14 WisDOT. 15
• Condition Assessment Index (CAI): While the CAI is still being developed and refined, the intent is 16 to provide a single parameter to capture the overall condition of the structure. Individual element 17 condition will contribute to this measure, with each being weighted based on criticality. When 18 complete, the CAI will provide a quick-glance measure of structure condition. The CAI will also 19 display the effects of work actions performed on the structure. 20
• Priority Index (PI): Similar to the CAI, the PI is still being developed and refined. The intent of this 21 parameter is to provide a standard, objective measure to assist with the prioritization of work actions. 22 For example, Average Daily Traffic (ADT) is one factor that will contribute to this measure. A bridge 23 that sees a lot of traffic is more critical than one with low traffic counts. Similarly, bridges that are 24 currently load posted may take priority over those that are not. Each factor contributing to the PI will 25 be weighted and summed to provide an overall priority index. 26
The intent of all WiSAMS output is to aid in better programming and scoping of bridge work. WiSAMS 27 output can be modified or enhanced as necessary to help meet this goal. 28
WiSAMS AND THE WISDOT STRUCTURES ASSET MANAGEMENT PROGRAM 29
As noted above, BOS houses the structural expertise for WisDOT, but the regional offices and DTIM are 30 the primary entities responsible for funding allocations, project selection, planning, scoping, and delivery. 31 Success of this initiative depends on BOS effectively communicating, coordinating, and collaborating 32 with these entities. Figure 7 below is a high-level representation of the asset management process at 33 WisDOT. 34
WiSAMS is an important tool and a key component of WisDOT’s structures asset management program. 35 The primary WiSAMS output takes the form of projected future work actions and associated costs. 36 Having this information allows BOS to supply more accurate, more refined information to DTIM for 37 purposes of allocating funding; a method to better identify funding needs and the timing for that funding. 38 BOS will also supply reports directly to regional planning and scoping personnel, formatted to best serve 39 their business needs. Here the collaborative process will be key. BOS depends on the feedback loop from 40

Dietsche, J.S. 17
the regions to help assess the quality of the recommendations produced by WiSAMS. Constructive 1 feedback on the output help BOS staff identify refinements that may be needed in the WiSAMS logic to 2 produce recommendations that are more in line with actual observed bridge condition and deterioration. 3 The refinements may take the form of modified deterioration curves, additional deterioration curves, or 4 modifying the WiSAMS logic (rules) used to derive work recommendations. 5
FIGURE 7 WisDOT Structures Asset Management Overview 6

Dietsche, J.S. 18
Implementing WiSAMS and its output represents a major step forward from past WisDOT practice, but it 1 must be noted that WiSAMS is a tool to be used as part of a larger asset management effort. To that end, 2 BOS has shifted resources to be able to better support asset management efforts. This support takes many 3 forms, including: 4
• Answering questions on WiSAMS recommendations and supplying data to regional planning and 5 scoping staff as necessary. 6
• Working with regional planning and scoping staff to analyze various scenarios based on variable 7 funding, corridor/interchange coordination, coordination with roadway projects, or other scenarios. 8
• Attending regional planning and scoping meetings to offer a structural perspective on potential bridge 9 projects. 10
• Coordinating with DTIM personnel to offer perspectives on how various funding levels or 11 distribution of funds may impact the overall condition of the Wisconsin bridge inventory. 12
• Creating and providing asset management-related materials – reports, tables, charts, graphs, maps, or 13 other visuals – to the various stakeholders. 14
• Creating and delivering presentations and talking points to promote bridge preservation and asset 15 management strategies throughout WisDOT. 16
BOS is at the front-end of fully implementing WiSAMS and structures asset management. As WiSAMS 17 was being developed, BOS engineers took advantage of a number of existing forums to give presentations 18 and raise awareness on WiSAMS, bridge preservation, and structures asset management. As a working 19 version of WiSAMS became available, BOS engineers held interactive workshops in the several regional 20 offices around the state in order to further educate planning and scoping staff. Current implementation 21 activities are focused on the regular distribution of WiSAMS reports and interacting with regional 22 planning and scoping staff to implement WiSAMS recommendations, as described in the bullet points 23 above. 24
The final phase of implementation will be establishing a program effectiveness measure. The measure 25 will incorporate the bridge preservation objectives enumerated in the BOS Bridge Preservation Policy 26 Guide, but also aim to evaluate how closely actual programmed work matches WiSAMS 27 recommendations. As WiSAMS recommendations are intentionally idealized, 100% correlation is not 28 expected or required. Rather, the measure will aim to identify projects that successfully and cost-29 effectively implement bridge preservation strategies and learn from those successes. There is also value in 30 studying those projects that do not meet program effectiveness measures and identify why that was the 31 case so that modifications may be made for future planning, if necessary. 32
The work noted above has put WisDOT in the position to implement a modern, data-driven asset 33 management program with the aim to most effectively spend taxpayer dollars to keep the Wisconsin 34 infrastructure safe and serving the travelling public. 35
CONCLUSION 36
The Wisconsin Department of Transportation is tasked with building and maintaining an effective, 37 efficient transportation infrastructure to serve the citizens of the state. WisDOT has a responsibility to use 38 allotted taxpayer funds wisely. As described above, recent advances in data collection, management, and 39 analysis have allowed WisDOT to implement a new structures asset management program grounded in 40 data and analytics. But even with this step forward, WisDOT is still very much just scratching the surface 41
Dietsche, J.S. 19
of what is possible. Every day WisDOT asset management engineers are working on tasks such as 1 improving how we project deterioration, how we prioritize improvement projects, how we quantify risk, 2 and more. WisDOT is a large organization with a lot of moving parts. Implementing change on a large-3 scale is not easy, but WisDOT is committed to continual improvement in the management of 4 transportation assets today and into the future. 5

Dietsche, J.S. 20
REFERENCES 1
FHWA, Moving Ahead for Progress in the 21st Century Act (MAP-21), A Summary of Highway 2 Provisions, 2012. 3
Wisconsin Department of Transportation, Bureau of Structures; Annual Bridge Report, 2016. 4
Wisconsin Department of Transportation, Bureau of Structures; Bridge Preservation Policy Guide, 5 Version 1.02, 2016. 6