the evolution of dusty disks around low-mass pre-main sequence
TRANSCRIPT
The Evolution of Dusty Disks Around Low-Mass Pre-Main SequenceStars
by
Catherine C. Espaillat
A dissertation submitted in partial fulfillmentof the requirements for the degree of
Doctor of Philosophy(Astronomy and Astrophysics)in The University of Michigan
2009
Doctoral Committee:
Professor Nuria P. Calvet, ChairProfessor Fred C. AdamsProfessor Lee W. HartmannAssociate Professor Edwin A. BerginAssistant Professor Jon M. Miller

Copyright c© Catherine C. Espaillat
All Rights Reserved2009
Para mi familia.
ii
Acknowledgements
This thesis is the product of three and a half years of support from generous colleagues
and it is a pleasure for me to acknowledge their contributions to this work. First and
foremost, I would like to express my gratitude to Nuria Calvet for being an insightful
and supportive advisor and, more importantly, a mentor. Over these past few years,
she has challenged and supported me to go beyond my expectations and to settle for
nothing short of my best. Under her astute guidance and tutelage, I have learned
a great deal about star formation and the field of astronomy. I am also indebted
to Paola D’Alessio for sharing her disk codes with me. This thesis would not have
been possible without her knowledge, support, and patience. My thesis committee
members Fred Adams, Ted Bergin, Nuria Calvet, Lee Hartmann, and Jon Miller also
provided invaluable feedback and direction for this work.
I would like to thank Ted Bergin, Cesar Briceno, Nuria Calvet, Paola D’Alessio,
William Forrest, Elise Furlan, Lee Hartmann, Jesus Hernandez, Kevin Luhman,
Melissa McClure, James Muzerolle, Joan Najita, Charlie Qi, Ben Sargent, and Dan
Watson for providing comments on papers which have been incorporated into this
thesis. Nuria Calvet, Elise Furlan, and Jesus Hernandez also kindly provided figures.
Chapters 3, 4, 5, and 6 of this thesis are based on publications in the Astro-
physical Journal Letters (Espaillat et al., 2007a,b, 2008a,b). Chapters 2 and 7 are
iii
partially based on publications to appear in the Astrophysical Journal (Furlan et al.
submitted, Espaillat et al. in preparation). This thesis was supported in part by the
University of Michigan Rackham Merit Fellowship Program, the Woodrow Wilson
National Fellowship Foundation, the Andrew W. Mellon Foundation, NASA Ori-
gins grant NNX08AH94G, Jet Propulsion Laboratory grants 1309768 and 1344183,
Chandra Space Observatory grant GO8–9029X, and Hubble Space Telescope grant
GO–11145.01–A.
Finally, I would like to thank my family and my friends for relentlessly cheering
me on in the writing of this thesis. ¡Sı, se puede!
iv
Contents
Dedication . . . . . . . . . . . . . . . . . . . . . . . . . . . . . . . . . . . . . . . . . . . . . . . . ii
Acknowledgements . . . . . . . . . . . . . . . . . . . . . . . . . . . . . . . . . . . . . . . . . . iii
List of Figures . . . . . . . . . . . . . . . . . . . . . . . . . . . . . . . . . . . . . . . . . . . . . ix
List of Tables . . . . . . . . . . . . . . . . . . . . . . . . . . . . . . . . . . . . . . . . . . . . . . xvi
List of Abbreviations . . . . . . . . . . . . . . . . . . . . . . . . . . . . . . . . . . . . . . . . xvii
Abstract . . . . . . . . . . . . . . . . . . . . . . . . . . . . . . . . . . . . . . . . . . . . . . . . . xix
Chapter
1 Introduction . . . . . . . . . . . . . . . . . . . . . . . . . . . . . . . . . . . . . . . . 1
1.1 Dust Grain Growth and Settling in Dusty Accretion Disks . . . . 3
1.1.1 Linking Theory & Observations with Models . . . . . . . 6
1.2 Clearing in Dusty Disks . . . . . . . . . . . . . . . . . . . . . . . . . . . . . 9
1.2.1 Transitional and Pre-transitional Disks . . . . . . . . . . . 10
1.2.2 Disk Clearing Mechanisms . . . . . . . . . . . . . . . . . . . . 11
1.3 Overview of the Thesis . . . . . . . . . . . . . . . . . . . . . . . . . . . . . 14
2 Modeling Irradiated Accretion Disks Around T Tauri Stars . . 34
2.1 Introduction . . . . . . . . . . . . . . . . . . . . . . . . . . . . . . . . . . . . . 35
2.2 Overview of the D’Alessio Code . . . . . . . . . . . . . . . . . . . . . . . 36
2.2.1 Vertical Disk Structure . . . . . . . . . . . . . . . . . . . . . . . 37
v
2.2.2 Disk Surface Density and Mass . . . . . . . . . . . . . . . . . 39
2.2.3 The Effect of Dust Opacity on Disk Structure . . . . . . . 40
2.2.4 Inner Disk Wall . . . . . . . . . . . . . . . . . . . . . . . . . . . . 41
2.3 Grid of Disk Models . . . . . . . . . . . . . . . . . . . . . . . . . . . . . . . 43
2.4 Results . . . . . . . . . . . . . . . . . . . . . . . . . . . . . . . . . . . . . . . . 45
2.4.1 Disk Properties . . . . . . . . . . . . . . . . . . . . . . . . . . . . 45
2.4.2 SED Simulations . . . . . . . . . . . . . . . . . . . . . . . . . . . 48
2.4.3 Comparison to Observations . . . . . . . . . . . . . . . . . . . 50
2.5 Discussion & Conclusions . . . . . . . . . . . . . . . . . . . . . . . . . . . . 52
3 Probing the Dust and Gas in the Transitional Disk of CS Cha
with Spitzer . . . . . . . . . . . . . . . . . . . . . . . . . . . . . . . . . . . . . . . . . 111
3.1 Introduction . . . . . . . . . . . . . . . . . . . . . . . . . . . . . . . . . . . . . 112
3.2 Observations . . . . . . . . . . . . . . . . . . . . . . . . . . . . . . . . . . . . 114
3.3 Analysis . . . . . . . . . . . . . . . . . . . . . . . . . . . . . . . . . . . . . . . . 114
3.3.1 Dust Properties . . . . . . . . . . . . . . . . . . . . . . . . . . . . 114
3.3.2 Gas Properties . . . . . . . . . . . . . . . . . . . . . . . . . . . . 117
3.4 Discussion & Conclusions . . . . . . . . . . . . . . . . . . . . . . . . . . . . 118
4 CVSO 224: A Slowly Accreting ∼10 Myr Old Transitional Disk
in Orion OB1a . . . . . . . . . . . . . . . . . . . . . . . . . . . . . . . . . . . . . . . 125
4.1 Introduction . . . . . . . . . . . . . . . . . . . . . . . . . . . . . . . . . . . . . 125
4.2 Observations & Data Reduction . . . . . . . . . . . . . . . . . . . . . . . 127
4.3 Analysis . . . . . . . . . . . . . . . . . . . . . . . . . . . . . . . . . . . . . . . . 128
4.3.1 Accretion Properties . . . . . . . . . . . . . . . . . . . . . . . . 128
vi
4.3.2 Disk Properties . . . . . . . . . . . . . . . . . . . . . . . . . . . . 129
4.4 Discussion & Conclusions . . . . . . . . . . . . . . . . . . . . . . . . . . . . 131
5 On the Diversity of the Taurus Transitional Disks: UX Tau A
& Lk Ca 15 . . . . . . . . . . . . . . . . . . . . . . . . . . . . . . . . . . . . . . . . . 138
5.1 Introduction . . . . . . . . . . . . . . . . . . . . . . . . . . . . . . . . . . . . . 139
5.2 Observations & Data Reduction . . . . . . . . . . . . . . . . . . . . . . . 140
5.3 Analysis . . . . . . . . . . . . . . . . . . . . . . . . . . . . . . . . . . . . . . . . 141
5.3.1 Model Parameters . . . . . . . . . . . . . . . . . . . . . . . . . . 141
5.3.2 UX Tau A . . . . . . . . . . . . . . . . . . . . . . . . . . . . . . . . 142
5.3.3 Lk Ca 15 . . . . . . . . . . . . . . . . . . . . . . . . . . . . . . . . 143
5.4 Discussion & Conclusions . . . . . . . . . . . . . . . . . . . . . . . . . . . . 145
6 Confirmation of a Gapped Primordial Disk Around LkCa 15 . 153
6.1 Introduction . . . . . . . . . . . . . . . . . . . . . . . . . . . . . . . . . . . . . 154
6.2 Observations & Data Reduction . . . . . . . . . . . . . . . . . . . . . . . 156
6.3 Analysis . . . . . . . . . . . . . . . . . . . . . . . . . . . . . . . . . . . . . . . . 157
6.4 Discussion & Conclusions . . . . . . . . . . . . . . . . . . . . . . . . . . . . 158
7 Unveiling the Innermost Regions of Disks with Gaps and Holes 164
7.1 Introduction . . . . . . . . . . . . . . . . . . . . . . . . . . . . . . . . . . . . . 164
7.2 Observations & Data Reduction . . . . . . . . . . . . . . . . . . . . . . . 167
7.3 Analysis . . . . . . . . . . . . . . . . . . . . . . . . . . . . . . . . . . . . . . . . 168
7.3.1 LkCa 14 . . . . . . . . . . . . . . . . . . . . . . . . . . . . . . . . . 169
7.3.2 UX Tau A . . . . . . . . . . . . . . . . . . . . . . . . . . . . . . . . 170
7.3.3 DM Tau . . . . . . . . . . . . . . . . . . . . . . . . . . . . . . . . . 171
vii
7.3.4 GM Aur . . . . . . . . . . . . . . . . . . . . . . . . . . . . . . . . . 172
7.4 Discussion & Conclusions . . . . . . . . . . . . . . . . . . . . . . . . . . . . 174
8 Summary & Conclusions . . . . . . . . . . . . . . . . . . . . . . . . . . . . . . . 192
8.1 The Transitional Disks . . . . . . . . . . . . . . . . . . . . . . . . . . . . . 192
8.2 The Pre-Transitional Disks . . . . . . . . . . . . . . . . . . . . . . . . . . 194
8.3 Neon Gas in the Planet-Forming Regions of T Tauri Disks . . . . 196
8.4 Comparing Pre-Transitional and Transitional Disk Observations
with Planet Formation Theories . . . . . . . . . . . . . . . . . . . . . . . 197
8.5 Directions for the Future . . . . . . . . . . . . . . . . . . . . . . . . . . . . 199
References . . . . . . . . . . . . . . . . . . . . . . . . . . . . . . . . . . . . . . . . . . . . . . . . 202
viii

List of Figures
Figure
1.1 Spectral energy distributions of Class I, Class II, and Class III objects 20
1.2 Inner disk of classical T Tauri stars . . . . . . . . . . . . . . . . . . . . . . . . 21
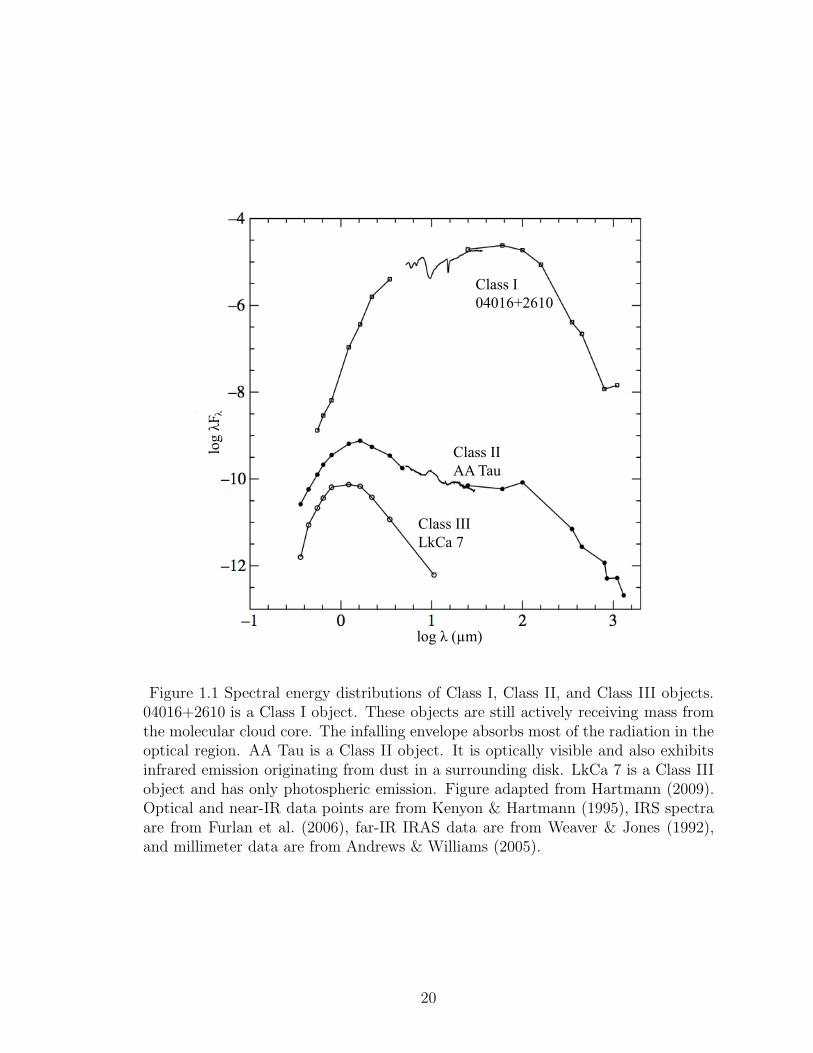
1.3 Artist’s conception of the innermost disk region of classical T Tauri
stars . . . . . . . . . . . . . . . . . . . . . . . . . . . . . . . . . . . . . . . . . . . . . 22
1.4 Spectral energy distributions of T Tauri stars with disks in Taurus . . 23
1.5 Characteristic temperatures of a disk model with well-mixed ISM-
sized dust . . . . . . . . . . . . . . . . . . . . . . . . . . . . . . . . . . . . . . . . . . 24
1.6 SEDs of disks with varying amounts of dust settling . . . . . . . . . . . . 25
1.7 Models of disks with well-mixed ISM-sized grains compared to the
observed median Taurus SED . . . . . . . . . . . . . . . . . . . . . . . . . . . . 26
1.8 Models of disks with grain growth and dust settling compared to the
observed median Taurus SED . . . . . . . . . . . . . . . . . . . . . . . . . . . . 27
1.9 Grain growth in T Tauri disks . . . . . . . . . . . . . . . . . . . . . . . . . . . 28
1.10 Indications of dust evolution in disks around TTS . . . . . . . . . . . . . 29
1.11 Spectral energy distributions of transitional disks in Taurus . . . . . . . 30
1.12 Model fit to the broad-band SED of GM Aur . . . . . . . . . . . . . . . . . 31
1.13 Continuum millimeter emission of GM Aur . . . . . . . . . . . . . . . . . . 32
ix
1.14 Schematic of the disk structure of full, pre-transitional, and transi-
tional disks . . . . . . . . . . . . . . . . . . . . . . . . . . . . . . . . . . . . . . . . . 33
2.1 Characteristic disk heights . . . . . . . . . . . . . . . . . . . . . . . . . . . . . . 60
2.2 Characteristic temperatures of a disk model with well-mixed dust and
amax=1 mm . . . . . . . . . . . . . . . . . . . . . . . . . . . . . . . . . . . . . . . . 61
2.3 Disk surface density and mass . . . . . . . . . . . . . . . . . . . . . . . . . . . . 62
2.4 Relationship between dust opacity, grain size, and wavelength . . . . . 63
2.5 Dust opacity for silicate grains . . . . . . . . . . . . . . . . . . . . . . . . . . . 64
2.6 Rosseland mean optical depth of disk models with M∗=0.5 M� . . . . 65
2.7 Rosseland mean optical depth of disk models with M∗=0.2 M� . . . . 66
2.8 Temperature structure of disk models with M∗=0.5 M� and M =10−10
M� yr−1 . . . . . . . . . . . . . . . . . . . . . . . . . . . . . . . . . . . . . . . . . . . 67
2.9 Temperature structure of disk models with M∗=0.5 M� and M =10−9
M� yr−1 . . . . . . . . . . . . . . . . . . . . . . . . . . . . . . . . . . . . . . . . . . . 68
2.10 Temperature structure of disk models with M∗=0.5 M� and M =10−8
M� yr−1 . . . . . . . . . . . . . . . . . . . . . . . . . . . . . . . . . . . . . . . . . . . 69
2.11 Temperature structure of disk models with M∗=0.5 M� and M =10−7
M� yr−1 . . . . . . . . . . . . . . . . . . . . . . . . . . . . . . . . . . . . . . . . . . . 70
2.12 Temperature structure of disk models with M∗=0.2 M� and M =10−10
M� yr−1 . . . . . . . . . . . . . . . . . . . . . . . . . . . . . . . . . . . . . . . . . . . 71
2.13 Temperature structure of disk models with M∗=0.2 M� and M =10−9
M� yr−1 . . . . . . . . . . . . . . . . . . . . . . . . . . . . . . . . . . . . . . . . . . . 72
x
2.14 Temperature structure of disk models with M∗=0.2 M� and M =10−8
M� yr−1 . . . . . . . . . . . . . . . . . . . . . . . . . . . . . . . . . . . . . . . . . . . 73
2.15 Cumulative flux to radius R settled disk models with M∗=0.5 M� and
M =10−10 M� yr−1 . . . . . . . . . . . . . . . . . . . . . . . . . . . . . . . . . . . 74
2.16 Cumulative flux to radius R settled disk models with M∗=0.5 M� and
M =10−9 M� yr−1 . . . . . . . . . . . . . . . . . . . . . . . . . . . . . . . . . . . . 75
2.17 Cumulative flux to radius R settled disk models with M∗=0.5 M� and
M =10−8 M� yr−1 . . . . . . . . . . . . . . . . . . . . . . . . . . . . . . . . . . . . 76
2.18 Cumulative flux to radius R settled disk models with M∗=0.5 M� and
M =10−7 M� yr−1 . . . . . . . . . . . . . . . . . . . . . . . . . . . . . . . . . . . . 77
2.19 Cumulative flux to radius R settled disk models with M∗=0.2 M� and
M =10−10 M� yr−1 . . . . . . . . . . . . . . . . . . . . . . . . . . . . . . . . . . . 78
2.20 Cumulative flux to radius R settled disk models with M∗=0.2 M� and
M =10−9 M� yr−1 . . . . . . . . . . . . . . . . . . . . . . . . . . . . . . . . . . . . 79
2.21 Cumulative flux to radius R settled disk models with M∗=0.2 M� and
M =10−8 M� yr−1 . . . . . . . . . . . . . . . . . . . . . . . . . . . . . . . . . . . . 80
2.22 SEDs for disk models with M∗=0.5 M� and astronomical silicates . . 81
2.23 SEDs for disk models with M∗=0.2 M� and astronomical silicates . . 82
2.24 SEDs for disk models at different inclinations with M∗=0.5 M� and
astronomical silicates . . . . . . . . . . . . . . . . . . . . . . . . . . . . . . . . . . 83
2.25 SEDs for disk models at different inclinations with M∗=0.2 M� and
astronomical silicates . . . . . . . . . . . . . . . . . . . . . . . . . . . . . . . . . . 84
xi
2.26 Dependence of disk emission on grain size for a disk model of M∗=0.5
M� and astronomical silicates . . . . . . . . . . . . . . . . . . . . . . . . . . . . 85
2.27 Dependence of silicate emission on grain size for a disk model of
M∗=0.5 M� and astronomical silicates . . . . . . . . . . . . . . . . . . . . . . 86
2.28 Dependence of wall and outer disk emission on grain size for a disk
model of M∗=0.5 M� and astronomical silicates . . . . . . . . . . . . . . . 87
2.29 Dependence of disk emission on grain size for a disk model of M∗=0.2
M� and astronomical silicates . . . . . . . . . . . . . . . . . . . . . . . . . . . . 88
2.30 Dependence of silicate emission on grain size for a disk model of
M∗=0.2 M� and astronomical silicates . . . . . . . . . . . . . . . . . . . . . . 89
2.31 Dependence of wall and outer disk emission on grain size for a disk
model of M∗=0.2 M� and astronomical silicates . . . . . . . . . . . . . . . 90
2.32 Comparison of SEDs for disk models with M∗=0.5 M� and different
silicate compositions . . . . . . . . . . . . . . . . . . . . . . . . . . . . . . . . . . 91
2.33 Comparison of SEDs for disk models with M∗=0.2 M� and different
silicate compositions . . . . . . . . . . . . . . . . . . . . . . . . . . . . . . . . . . 92
2.34 SEDs for disk models with M∗=0.5 M� and olivine silicates . . . . . . . 93
2.35 SEDs for disk models with M∗=0.2 M� and olivine silicates . . . . . . . 94
2.36 Dependence of disk emission on grain size for a disk model of M∗=0.5
M� with olivine silicates . . . . . . . . . . . . . . . . . . . . . . . . . . . . . . . 95
2.37 Dependence of silicate emission on grain size for a disk model of
M∗=0.5 M� with olivine silicates . . . . . . . . . . . . . . . . . . . . . . . . . 96
xii
2.38 Dependence of wall and outer disk emission on grain size for a disk
model of M∗=0.5 M� with olivine silicates . . . . . . . . . . . . . . . . . . . 97
2.39 Dependence of disk emission on grain size for a disk model of M∗=0.2
M� with olivine silicates . . . . . . . . . . . . . . . . . . . . . . . . . . . . . . . 98
2.40 Dependence of silicate emission on grain size for a disk model of
M∗=0.2 M� with olivine silicates . . . . . . . . . . . . . . . . . . . . . . . . . 99
2.41 Dependence of wall and outer disk emission on grain size for a disk
model of M∗=0.2 M� with olivine silicates . . . . . . . . . . . . . . . . . . . 100
2.42 Emission for a disk with large grains and a low mass accretion rate
around a 0.5 M� star . . . . . . . . . . . . . . . . . . . . . . . . . . . . . . . . . . 101
2.43 Median SED of Taurus compared to disk models with M∗=0.5 M�
and astronomical silicates . . . . . . . . . . . . . . . . . . . . . . . . . . . . . . . 102
2.44 Median SED of Chamaeleon K5–M2 stars compared to disk models
with M∗=0.5 M� and astronomical silicates . . . . . . . . . . . . . . . . . . 103
2.45 Median SED of Chamaeleon M3–M8 stars compared to disk models
with M∗=0.2 M� and astronomical silicates . . . . . . . . . . . . . . . . . . 104
2.46 Median SED of Taurus compared to disk models with M∗=0.5 M�
and olivine silicates . . . . . . . . . . . . . . . . . . . . . . . . . . . . . . . . . . . 105
2.47 Median SED of Chamaeleon K5–M2 stars compared to disk models
with M∗=0.5 M� and olivine silicates . . . . . . . . . . . . . . . . . . . . . . 106
2.48 Median SED of Chamaeleon M3–M8 stars compared to disk models
with M∗=0.2 M� and olivine silicates . . . . . . . . . . . . . . . . . . . . . . 107
xiii

2.49 Slope of SED between 13 μm and 31 μm versus the equivalent width
of the 10 μm silicate emission feature for disk models with M=0.5 M� 108
2.50 Spectral indices of targets in Taurus, Chamaeleon, and Ophiuchus
compared with disk models . . . . . . . . . . . . . . . . . . . . . . . . . . . . . 109
2.51 Simulations of gapped disks compared to a typical full disk model . . 110
3.1 SED of CS Cha . . . . . . . . . . . . . . . . . . . . . . . . . . . . . . . . . . . . . . 121
3.2 SED and transitional disk model of CS Cha . . . . . . . . . . . . . . . . . . 122
3.3 Models of CS Cha with big grains versus small grains . . . . . . . . . . . 123
3.4 Comparison of L[NeII] with LX and M in TTS. . . . . . . . . . . . . . . . . 124
4.1 SED of CVSO 224. . . . . . . . . . . . . . . . . . . . . . . . . . . . . . . . . . . . 135
4.2 Hectochelle spectrum of CVSO 224 and best-fit accretion model. . . . 136
4.3 SED and transitional disk model of CVSO 224. . . . . . . . . . . . . . . . 137
5.1 SED and pre-transitional disk model of UX Tau A. . . . . . . . . . . . . . 149
5.2 SED and pre-transitional disk model of Lk Ca 15. . . . . . . . . . . . . . 150
5.3 SED and transitional disk model of Lk Ca 15. . . . . . . . . . . . . . . . . 151
5.4 Comparison of pre-transitional and transitional disk model fits to the
near-infrared emission of Lk Ca 15 . . . . . . . . . . . . . . . . . . . . . . . . 152
6.1 Near-infrared SpeX spectra of LkCa 15 . . . . . . . . . . . . . . . . . . . . . 160
6.2 Veiling of LkCa 15 . . . . . . . . . . . . . . . . . . . . . . . . . . . . . . . . . . . . 161
6.3 Near-infrared excess spectrum of LkCa 15 . . . . . . . . . . . . . . . . . . . 162
6.4 Schematic of pre-transitional disk structure . . . . . . . . . . . . . . . . . . 163
xiv
7.1 FAST spectrum of UX Tau A compared to spectral type standards . 178
7.2 FAST spectrum of GM Aur compared to spectral type standards . . . 179
7.3 K-band SpeX spectrum of the diskless T Tauri star LkCa 14 compared
to dwarf standard stars . . . . . . . . . . . . . . . . . . . . . . . . . . . . . . . . 180
7.4 Near-infrared excess emission of LkCa 14 relative to standard stars . 181
7.5 K-band SpeX spectrum of UX Tau A compared to dwarf standard stars182
7.6 Near-infrared excess emission of UX Tau A relative to a G6.5 standard183
7.7 Near-infrared excess emission of UX Tau A relative to a G8 standard 184
7.8 Near-infrared excess emission of UX Tau A relative to a K2 standard 185
7.9 K-band SpeX spectrum of DM Tau compared to dwarf standard stars 186
7.10 Near-infrared excess emission of DM Tau relative to standard stars . 187
7.11 K-band SpeX spectrum of GM Aur compared to dwarf standard stars 188
7.12 Near-infrared excess emission of GM Aur relative to a K3 standard . 189
7.13 Near-infrared excess emission of GM Aur relative to a K5 standard
with rK=0 . . . . . . . . . . . . . . . . . . . . . . . . . . . . . . . . . . . . . . . . . 190
7.14 Near-infrared excess emission of GM Aur relative to a K5 standard
with rK=0.1 . . . . . . . . . . . . . . . . . . . . . . . . . . . . . . . . . . . . . . . . 191
xv
List of Tables
Table
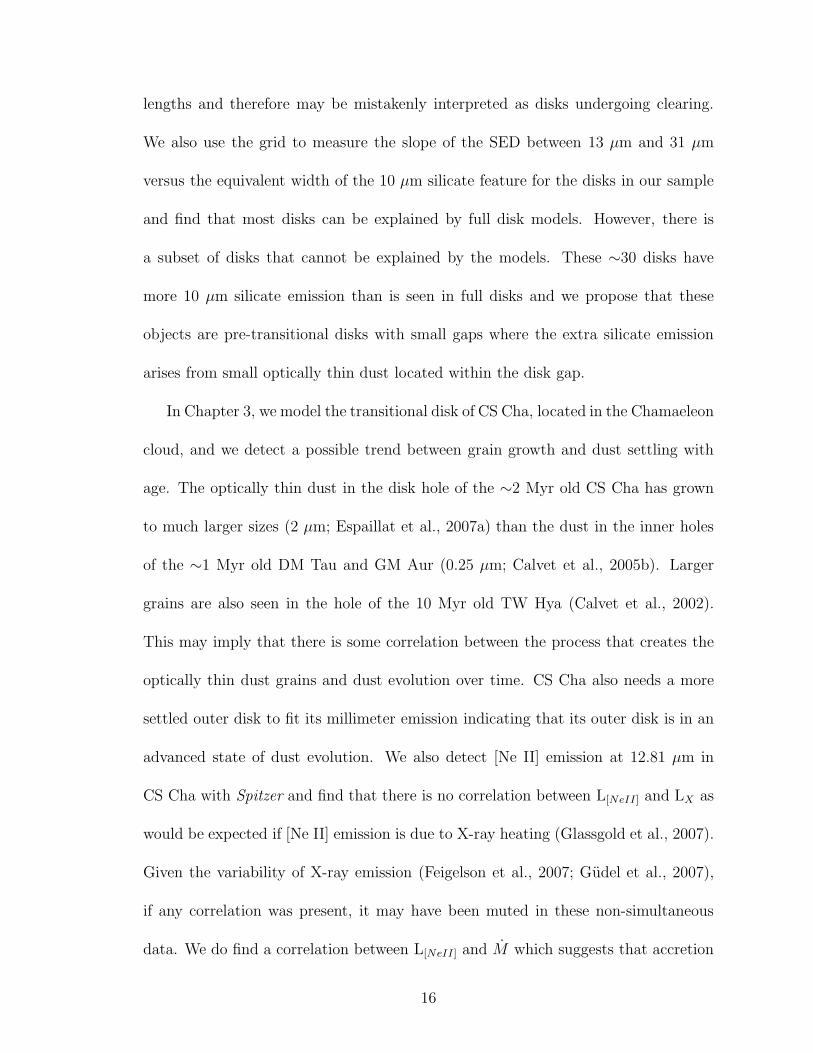
1.1 Stellar and Disk Characteristics of Known Transitional and Pre-transitional
Disk Sources . . . . . . . . . . . . . . . . . . . . . . . . . . . . . . . . . . . . . . . . . 19
2.1 Stellar Properties Adopted for Disk Model Grids . . . . . . . . . . . . . . . 58
2.2 Disk Model Properties for Grid using Astronomical Silicates & M∗=0.5M�
58
2.3 Disk Model Properties for Grid using Astronomical Silicates & M∗=0.2M� 58
2.4 Disk Model Properties for Grid using Olivine Silicates & M∗=0.5M� 59
2.5 Disk Model Properties for Grid using Olivine Silicates & M∗=0.2M� . 59
3.1 Stellar and Model Properties of CS Cha . . . . . . . . . . . . . . . . . . . . . 120
4.1 Stellar and Model Properties of CVSO 224 . . . . . . . . . . . . . . . . . . . 134
5.1 Stellar and Model Properties of UX Tau A and LkCa 15 . . . . . . . . . . 148
7.1 Log of SpeX Observations . . . . . . . . . . . . . . . . . . . . . . . . . . . . . . . 177
7.2 Characteristics of SpeX Sample . . . . . . . . . . . . . . . . . . . . . . . . . . . 177
xvi
List of Abbreviations
2MASS Two Micron All Sky Survey
ALMA Atacama Large Millimeter Array
AOR Astronomical Observation Request
ATCA Australia Telescope Compact Array
BCD Basic Calibrated Data
CARMA Combined Array for Research in Millimeter Astronomy
CIDA Centro de Investigaciones de Astronomıa
CVSO CIDA Variability Survey of Orion OB1
CTTS Classical T Tauri Star
FAST FAst Spectrograph for the Tillinghast Telescope
HR Hertzsprung–Russell
IRAC Infrared Array Camera
IRAF Image Reduction and Analysis Facility
IRAS Infrared Astronomical Satellite
IR Infrared
IRS Infrared Spectrograph
IRTF Infrared Telescope Facility
ISM Interstellar Medium
xvii
MIPS Multiband Imaging Photometer for Spitzer
MMT Multimirror Telescope
MOPEX Mosaicker and Point source Extractor
MRI Magnetorotational Instability
NASA National Aeronautics and Space Administration
Ne Neon
SED Spectral Energy Distribution
SMA Submillimeter Array
SMART Spectral Modeling, Analysis, and Reduction Tool
SSC Spitzer Science Center
TTS T Tauri Star
ROSAT Roentgen Satellite
USNO United States Naval Observatory
UV Ultraviolet
WTTS Weak T Tauri Star
YSO Young Stellar Object
xviii
Abstract
The evolution of protoplanetary disks is intricately tied to the origin of planets. The
details of how these disks evolve from initially well-mixed distributions of gas and
dust into systems composed mostly of rocky planets and gas giants like our own
solar system is not well understood and is a fundamental question in astronomy. It
is widely accepted that dust grain growth and settling to the disk midplane play
an integral part in creating the planetesimals that amalgamate into planets. Newly
formed planets will then interact with the disk, clearing the material around them-
selves and creating gaps. To get a more complete view of planet formation one should
therefore study the observational signatures of dust growth, settling, and clearing in
disks.
Here we present simulated spectral energy distributions of disks around low-mass
classical T Tauri stars of various masses, accretion rates, inclinations, grain sizes, dust
compositions, and amounts of settling. We find that the majority of observed disks
lie within the parameter space probed by the models and are therefore “full disks.”
However, some disks have spectral energy distributions that cannot be explained by
the full disk models. Some of these disks have a significant deficit of flux in the near-
and mid-infrared but show substantial emission beyond 20 μm, similar to what is
seen in full disks, indicating that the hot, inner regions of these “transitional disks”
xix
have undergone significant dust clearing. Here we model the transitional disks of CS
Cha and CVSO 224. CS Cha is located in the ∼2 Myr old Chamaeleon star–forming
region. We show it has an optically thick circumstellar disk inwardly truncated at
∼43 AU with some small, optically thin dust within the innermost 1 AU of its inner
disk hole. CS Cha also has large grains and a more settled outer disk suggesting that
it is in an advanced state of dust evolution. CVSO 224 is the only transitional disk
located within the ∼10 Myr old 25 Orionis group in Orion OB1a. We find a ∼7 AU
inner disk hole that contains a small amount of optically thin dust and measure
an accretion rate of 7×10⁻¹¹ M� yr−1 in this object, making it one of the slowest
accreting transitional disks detected so far.
We also present evidence for a new class of disk: the pre-transitional disks. These
disks have significant near-infrared excesses (2 – 5 μm), similar to what is seen in
full disks, which indicates the presence of an optically thick inner disk. However,
these pre-transitional disks also have a deficit of flux in the mid-infrared (5 – 20 μm)
and significant emission at longer wavelengths, similar to transitional disks. This
points to a gap within the disk rather than an inner disk hole. The pre-transitional
disks around UX Tau A and LkCa 15 have gaps of 56 and 46 AU respectively. UX
Tau A’s gap is devoid of small grains while LkCa 15 has some small optically thin
dust within its gap. We analyze near-infrared spectra between 2–5 μm for LkCa 15
and UX Tau A and demonstrate that the near-IR excess of both can be fit with a
single-temperature blackbody at the dust destruction temperature. This indicates
that the near-infrared excesses of LkCa 15 and UX Tau A originate from the wall of
an optically thick inner disk at the dust destruction radius, independently confirming
xx
that these disks have gaps within their dust distributions.
This study of disks around pre-main sequence stars contributes new details on
dust evolution. We report a range of grain sizes, settling, and inner disk hole radii
in transitional disks as well as newly identified disks with gaps in their dust distribu-
tions. Our model grid of simulated disk SEDs also reveals that some observed disks
in Taurus, Chamaeleon, and Ophiuchus cannot be explained by full disk models and
are not known to be transitional or pre-transitional disks. We propose that these
objects are pre-transitional disks with smaller gaps than previously observed, em-
phasizing that much still remains to be understood regarding the dust component of
disks. A systematic study of disks around young stars is needed in order to provide
needed insight and constraints to aid in theoretical modeling of dust evolution and
planet formation.
xxi
Chapter 1
Introduction
We now know that planetary systems are relatively common around other stars
(e.g. Butler et al., 2006). The origin of these extrasolar planets is intricately tied
to the evolution of their primeval protoplanetary disks. These disks are composed
of gas and dust and are formed in the collapse of high-density regions in molecular
cores (Shu et al., 1987). As a result of angular momentum conservation, the collapse
of a rotating molecular core will result in a protostar surrounded by a disk (Terebey
et al., 1984), typically after ∼ 0.1 – 0.2 Myr. The disk material will dissipate through
accretion onto the star, accretion onto planets, and photoevaporation by ultraviolet
radiation from the central star. Characteristic timescales for disk accretion and
photoevaporation are about 1 – 10 Myr and 10 Myr, respectively. Planet formation is
thought to occur within 3 – 10 Myr, while the disk material is still present and before
the star reaches the main sequence (see Hartmann 2009 for a review). Therefore, to
learn more about the origin of planets, we must understand the evolution of dusty
disks around pre-main sequence stars.
Young stellar objects (YSOs; Strom, 1972) are those which have not yet reached
the zero-age main sequence. YSOs include protostars, Herbig Ae/Be stars, T Tauri
stars, and young brown dwarfs. Protostars are young stars which are still receiving
1
material from their infalling molecular cloud core. In Herbig Ae/BE stars, T Tauri
stars, and brown dwarfs, the natal core is gone or has been exhausted and these
objects have been observed with and without disks. Herbig Ae/Be stars have spectral
types A – B and masses of 2 – 10 M�. T Tauri stars have spectral types ranging from
F – M and stellar masses of 0.08 – 2 M�. Brown dwarfs by definition have masses
less than 0.08 M�.
In order to categorize these objects based on their spectral energy distributions
(SEDs) Lada (1987) introduced a classification system based on the slope of the SED
between 2.2 – 25 μm (a = dlog(λFλ)/dlog(λ)). Class I objects (a > 0) have SEDs
with increasing infrared emission, as expected from protostars (Figure 1.1). Class II
objects (−2 < a < 0) have relatively flat or negative slopes, corresponding to excess
emission from dust in a disk around a pre-main sequence star (Figure 1.1). Class III
objects (a < −2) have photospheric slopes and those Herbig Ae/BE stars, T Tauri
stars, and brown dwarfs without disks fall into this category (Figure 1.1). In this
thesis, we focus on Class II T Tauri objects.
T Tauri stars (TTS) can also be classified based on their accretion properties. In
weak T Tauri stars (WTTS), material is no longer being accreted onto the star while
classical T Tauri stars (CTTS) are still actively accreting material. The equivalent
width of Hα is commonly used to identify the presence of accretion. Classical T
Tauri stars have Hα equivalent widths greater than 3 A for spectral types K0–K5, 10
A for K7–M2.5, 20 A for M3–M5.5, and 40 A for M6–M7.5 (White & Basri, 2003).
The present paradigm of mass transfer from the disk onto the star is magnetospheric
accretion. In this model theory, the inner disk is truncated by the stellar magnetic
2
field and matter accretes from the disk onto the star via magnetic field lines (Hart-
mann et al., 1994; Muzerolle et al., 1998, 2001) forming an accretion shock at the
stellar surface (Figures 1.2 and 1.3). The observed emission lines (e.g. Hα) form in
the free-falling material within the accretion columns (Calvet & Hartmann, 1992;
Hartmann et al., 1994; Muzerolle et al., 1998, 2001) while the excess continuum that
dominates in the UV is formed in the accretion shock (Calvet & Gullbring, 1998).
This excess continuum adds to the star’s emission and “veils” stellar absorption lines
in the optical, making them appear less deep (Hartigan et al., 1989). Measurements
of the accretion luminosity based on this excess have been used to estimate mass
accretion rates and typical values for classical TTS are ∼10−8 M� yr−1 (Hartmann
et al., 1998; Gullbring et al., 1998). In this thesis, we will focus mainly Class II
objects which are accreting.
The processes by which accreting disks around pre-main sequence stars evolve into
planetary systems are a source of ongoing investigation. Dust growth and settling
must play an important role in forming the planetesimals which will grow into planets
that can clear the disk. To understand our origins, one should therefore study dust
growth, settling, and clearing in disks. This thesis is an attempt to move us a few
steps closer to this goal.
1.1 Dust Grain Growth and Settling in Dusty Accretion
Disks
Accretion disks form around stars as a consequence of angular momentum conserva-
tion. Material from the infalling envelope cannot fall radially onto the star. Instead,
3
it will cross the equator at some distance from the star, where it encounters material
falling from the opposite side of the envelope. This encounter results in a shock,
where the vertical component of the material is dissipated. After some adjustment,
material will remain in the midplane, rotating at near Keplerian velocities around the
star (Terebey et al., 1984; Hartmann, 2009). Angular momentum is then conserved
in the disk by transporting a small amount of disk material to very large radii while
most of the disk material accretes onto the star.
Assuming that the accretion disk is steady and optically thick, it emits like a
blackbody with T ∝ R−3/4 where T and R are the temperature and radius, respec-
tively. However, observed SEDs of disks are less steep than the λFλ ∝ λ−4/3 expected
from this temperature distribution (Kenyon & Hartmann, 1987). By taking into ac-
count stellar irradiation of the disk, Kenyon & Hartmann (1987) showed that disks
which flare with radius can explain the observed SEDs. This is because flared disks
can capture more radiation from the star and so the temperature falls less steeply
with radius as T ∝ R−3/7 (if disks are vertically isothermal and the height is a fixed
number of scale heights) and the resulting SED is less steep than a flat disk.
These flared, irradiated accretion disks are made up of gas and dust. While the
gas dominates the mass of the disk, the dust controls most of what we see of the
disk since the dust opacity dominates over the opacity of the gas. Thus the dust sets
the heating and structure of the disk and hence its scattered and thermal emission.
The dust also heats the gas in the disk through collisions (e.g. Glassgold et al.,
2004). Small micron-sized dust grains have high opacities at optical and infrared
wavelengths and thus are the main absorbers of stellar radiation when present and
4

contribute strongly to the disk’s infrared emission and 10 μm silicate emission. Bigger
grains have lower opacities at optical and infrared wavelengths and higher opacities
at longer wavelengths and contribute strongly at millimeter wavelengths.
The evolution of the dust in the disk is significant, especially given that the first
steps in making a planet are the growth of grains and subsequent settling to the
midplane. Grains grow mainly by sticking to one another after they collide (Weiden-
schilling et al., 1997). These collisions occur due to relative velocities between grains
of different sizes which are induced by the gas. The gas in the disk moves slightly
slower than the Keplerian velocity due a radial pressure gradient which adds to the
centrifugal force to counteract the star’s gravity. Small grains (< cm) are strongly
coupled to the gas and move at the same angular velocity of the gas. However, grains
are denser than gas and do not feel a radial pressure gradient and drift inward with
velocities that increase with grain size. Large grains (> m) are not coupled to the
gas and move in Keplerian orbits. They drift inward with velocities that decrease
with grain size due to friction with the slower moving gas which causes them to lose
angular momentum. Concurrently, grains are also settling to the disk midplane due
to the vertical component of the gravitational force of the star. Since the orbital
period is shortest in the inner disk, grain growth and settling occur the fastest here,
leading to inside-out dust evolution (Dullemond & Dominik, 2004, 2005).
There are major discrepancies between dust evolution theories and the obser-
vations. Weidenschilling et al. (1997) showed it is theoretically possible to form
km-sized planetesimals from sub-micron sized grains within 105 years through colli-
sional coagulation. However, grains with sizes up to 100 μm are severely depleted
5
within 104 yrs and so the observed spectral energy distributions should show no sil-
icate emission and have weak infrared continuum emission by 1 Myr (Dullemond
& Dominik, 2004, 2005). If turbulence is taken into account, the upper and lower
layers of the disk will mix and the depletion of small grains will occur on even faster
timescales since smaller grains from the upper layers will be accreted by larger grains
in the midplane (Dullemond & Dominik, 2005). Yet disks with substantial infrared
emission are observed in older clouds. About 65% of all T Tauri stars in the ∼1
Myr old Taurus cloud have substantial infrared excesses (Furlan et al., 2006). Most
noticeably, the 10 μm silicate emission feature, which is indicative of small grains,
is present in 90% of disk-bearing stars in Taurus (Figure 1.4; Furlan et al., 2006),
but it is absent in the simulations which predict that small grains will be severely
depleted by this age (Dullemond & Dominik, 2004, 2005). Dullemond & Dominik
(2005) have proposed that ongoing destructive collisions between grains are needed
to produce small grains to replenish the upper disk layers.
1.1.1 Linking Theory & Observations with Models
To compare the observations with theory in more detail, one must first develop so-
phisticated, self-consistent models of disks in order to quantify their properties. In
this thesis we use the disk models of D’Alessio et al. (1998, 1999, 2001, 2005, 2006).
The D’Alessio models are self-consistent models of irradiated accretion disks around
T Tauri stars. The model assumes a steadily accreting disk and includes heating by
viscous dissipation (using the α prescription of Shakura & Syunyaev, 1973), irradia-
tion by the central star, radioactive decay, and cosmic rays; irradiation is the main
6
heating agent. The disk is a mixture of gas and dust, which are thermally coupled.
Input parameters to the code are the stellar properties (luminosity, radius, effec-
tive temperature), the mass accretion rate (M), the viscosity parameter α following
Shakura & Syunyaev (1973), and the amount of settling.
The structure of the disk is solved iteratively since the height of the disk depends
on the irradiation heating, which depends on the vertical structure of the disk. The
solution of the structure equations indicates that the disk is not vertically isother-
mal. Stellar radiation enters the disk at an angle thus stellar radiation tends to be
deposited in the uppermost layers of the disk (Calvet et al., 1991; Malbet & Bertout,
1991). In addition, the dust opacity is higher at the wavelengths where stellar ra-
diation is absorbed than at the wavelengths where the disk is emitting. These two
effects result in a “super heating” of the upper disk layers (Calvet et al., 1991, 1992;
Chiang & Goldreich, 1997), making them hotter than the photospheric layers, if the
disk is optically thick, or than the disk midplane, if the disk is optically thin. To
illustrate these effects Figure 1.5 illustrates the temperature of the uppermost layers
(T0), the midplane temperature (Tm), and the photospheric temperature (Tphot),
defined in the region where the disk is optically thick. The surface temperature of a
viscous disk (Tvis) is shown for comparison. See Chapter 2.2.1 for a more detailed
discussion of the vertical disk structure.
Grain growth is parameterized in the D’Alessio models by incorporating two
populations of grains. The grain-size distribution follows a power-law of a−3.5, where
a is the grain radius, as is observed in the interstellar medium (ISM; Mathis et al.,
1977). The minimum and maximum sizes of the dust grains in the upper layers
7
and midplane of the disk are adjustable. The initial steps of planet formation are
coagulation of dust grains followed by settling to the midplane (Weidenschilling et al.,
1997). Dust growth and settling are simulated by depleting the small dust in the
upper layers of the disk. Assuming a constant dust-to-gas ratio at each radius, this
decrease of small grains in the upper layers results in an increase of larger grains
in the disk midplane. We define a settling parameter, ε = ζup/ζst, which measures
the mass fraction of the small grains in the upper layers relative to the standard
dust-to-gas mass ratio. As the grains grow and sink downward to the midplane, the
dust-to-gas mass ratio in the upper layers will decrease as the dust-to-gas mass ratio
in the midplane increases. Since small grains have high opacities at the wavelengths
of the stellar emission, this decrease in the number of small grains will lead to a
decrease in the opacity of the upper disk layers and less stellar radiation will be
absorbed and re-emitted by the dust. The resulting disk emission will decrease as
settling increases (Figure 1.6).
The D’Alessio models have been used to confirm theoretical signatures of dust
grain growth and settling in T Tauri disks. D’Alessio et al. (1999) showed that models
of disks with uniformly mixed, small ISM-sized (0.005 – 0.25 μm) dust grains failed
to explain observations of T Tauri disks (Figure 1.7). The models produced too much
infrared emission and too little millimeter emission, pointing to an over-abundance
of small grains, which have higher opacities at shorter wavelengths and therefore
emit more strongly in the infrared, and not enough large grains, which emit strongly
in the millimeter. D’Alessio et al. (2006) later incorporated grain growth and dust
settling into their disk model and demonstrated that a disk which includes settling
8
and millimeter-sized grains in the midplane can reproduce the median observed SED
of disks in the Taurus cloud (Figure 1.8; D’Alessio et al., 2006). The D’Alessio et al.
studies were pivotal in illustrating that disks displayed signatures of grain growth
and settling. Moreover, with the advent of the Spitzer Space Telescope, we can now
see that there appears to be a large diversity of dust grain growth and settling in
disks, even in those of a given age (Figure 1.9).
1.2 Clearing in Dusty Disks
Studies of disks in populations of various ages have yielded interesting clues to disk
dissipation (e.g. Haisch et al., 2001; Gomez & Kenyon, 2001; Gutermuth et al., 2004;
Hernandez et al., 2005; Hartmann et al., 2005; Megeath et al., 2005; Carpenter et al.,
2006; Lada et al., 2006; Sicilia-Aguilar et al., 2006). Hernandez et al. (2007) stud-
ied stars located in star–forming regions of ages 1 – 10 Myr and showed that the
percentage of TTS with excess near-infrared emission above photospheric levels, in-
dicative of the presence of disks, decreases with age (Figure 1.10, left). At 1 Myr
about 80% of TTS have disks, at 5 Myr 15% do so, and at 10 Myr the fraction is
10%. One can conclude that disks around TTS dissipate mostly within ∼ 10 Myr.
Hernandez et al. (2007) also found that the median near-infrared slope decreases with
age (Figure 1.10, right). Near-infrared emission comes from hot dust in the inner
regions of disks, and so a decrease of near-infrared emission indicates that the inner
regions of these disks are clearing. Therefore, not only are disks disappearing with
age, the amount of their near-infrared emission decreases with age. Near-infrared
studies of gas in the inner disk also find that the amount of gas decreases with age
9
(Pascucci et al., 2006; Carmona et al., 2007). The overall picture is that, with a few
exceptions, young ∼ 1 Myr old regions are dominated by TTS with disks displaying
strong near-infrared excess while at ∼ 10 Myr most TTS have no disks, and the few
that still have disks exhibit weak near-infrared excesses. Below we discuss a more
dramatic form of disk clearing.
1.2.1 Transitional and Pre-transitional Disks
Over the past two decades, we have detected several disks with a significant deficit of
flux in the near- and mid- infrared (2 – 20 μm) yet substantial excesses comparable
to optically thick disks at longer wavelengths (>20 μm) (e.g. Strom et al., 1989;
Skrutskie et al., 1990; Calvet et al., 2002, 2005b). The lack of near- and mid-infrared
flux in these disks has been attributed to the removal of the hot dust close to the
star which emits at shorter wavelengths, indicating the presence of inner disk holes.
These “transitional disks” (Strom et al., 1989) have been proposed to be the link
between Class II objects with full, accreting disks and Class III objects which show
only photospheric emission. To date, studies of eight transitional disks with Spitzer
IRS spectra have been published (Table 1.1). These objects have been modeled with
optically thick disks containing inner holes where the frontally illuminated disk rim
or “wall” of the inwardly truncated outer disk contributes to the rise in emission
beyond 20 μm (Figures 1.11 and 1.12; D’Alessio et al., 2005; Calvet et al., 2005b;
Hughes et al., 2009). Millimeter interferometric imaging has confirmed the presence
inner disk holes in TW Hya (Hughes et al., 2007) and GM Aur (Figure 1.13; Hughes
et al., 2009).
10
Transitional disks exhibit diverse properties. The estimated truncation radii of
these disks cover a wide range, from 1 AU in Hen 3–600 (Uchida et al., 2004) to
43 AU in CS Cha (Chapter 3; Espaillat et al., 2007a). Some transitional disks
have inner holes which are mostly cleared of small dust grains and exhibit no near-
infrared excess (e.g. DM Tau, CoKu Tau/4). The rest have a small yet detectable
near-infrared excess produced by some sub-micron and micron sized optically thin
dust remaining within the inner disk hole (e.g. Calvet et al., 2005b, 2002; Espaillat
et al., 2007a; Uchida et al., 2004).
Two years ago, we identified a new class of disk with inner disk clearing. These
“pre-transitional disks” have gaps within their disks as opposed to the inner holes
observed in transitional disks. Pre-transitional disks have a deficit of mid-infrared
flux (5 – 20 μm) and substantial emission beyond 20 μm as is seen in transitional
disks, but they have substantial emission in the near-infrared (2 – 5 μm), indicating
the presence of an optically thick inner disk separated by a gap from an outer disk
(Figure 1.14). UX Tau A and LkCa 15 are two such pre-transitional disks in the
Taurus cloud (Chapter 5; Espaillat et al., 2007b). Their properties are listed in
Table 1.1 and we will discuss them in greater detail in Chapter 5.
1.2.2 Disk Clearing Mechanisms
Several mechanisms have been proposed to create the inner disk holes seen in tran-
sitional disks. These mechanisms include dynamical clearing (i.e. planets, stellar
companions), grain growth, photoevaporation, and the magnetorotational instability
(MRI).
11
Planet formation theories predict that newly forming planets should interact with
the surrounding disk, clearing the material around themselves through tidal distur-
bances (Goldreich & Tremaine, 1980; Ward, 1988; Rice et al., 2003; Paardekooper &
Mellema, 2004; Quillen et al., 2004; Varniere et al., 2006). Planet clearing simulations
have been able to reproduce the observed SEDs of transitional disks, particularly in
the case of GM Aur (Rice et al., 2003). However, stellar companions can also dy-
namically clear the inner disk in a similar fashion (Mathieu et al., 1991; Artymowicz
& Lubow, 1994). Aside from dynamical clearing, grain growth has been proposed as
a disk clearing mechanism. Since dust evolves on faster timescales in the inner parts
of the disk, eventually the small grains which contribute to the near-IR emission of
the disk will grow causing a flux deficit in the SED (Dullemond & Dominik, 2004,
2005). It has also been proposed that X-rays from the star can activate the MRI in
the ionized inner wall of the disk which will lead material to accrete from the wall
onto the star, creating a hole in the disk that grows from the inside-out (Chiang &
Murray-Clay, 2007). This MRI clearing mechanism predicts a correlation between
the radius of the wall and the mass accretion rate and X-ray luminosity of the star.
Radiation from the central star can also photoevaporate the surrounding disk (Hol-
lenbach et al., 1994; Clarke et al., 2001). High energy photons from the star will heat
the upper disk layers. The ionized gas will then attain a higher thermal energy than
the gravitational potential energy and become unbound at the gravitational radius,
Rg ∼ 7(M∗/M�)AU (Hollenbach et al., 1994). The typical value of the mass loss
rate in this photoevaporative wind is ∼4×10⁻¹⁰ M� yr−1 (Clarke et al., 2001). As
the disk evolves viscously, the mass accretion rate decreases with time, eventually
12
reaching this value. When the disk accretion rate is this low, the outer disk mass is
below ∼0.005 M� (Alexander & Armitage, 2007). At this point, the photoevapora-
tive wind takes over and the disk is not resupplied within Rg (Clarke et al., 2001)
and inward accretion onto the star will essentially stop. Once the isolated inner disk
drains onto the star on the viscous timescale, the inner edge of the outer disk will
be directly irradiated by the star and the hole will continue to grow outward as the
disk continues to be photoevaporated (Alexander & Armitage, 2007). The timescale
for the disk accretion rate to fall below the wind rate is a few Myr. The isolated
inner disk will drain onto the star in <105 yr, and then the outer disk will be cleared
within a few <105 yr (Alexander & Armitage, 2007).
Stellar mass companions have been confirmed within a few transitional disks.
CoKu Tau4, HD98800B, and Hen 3–600 have stellar companions within their holes
and their truncated disks are most likely due to clearing by the companion (Ireland
& Kraus, 2008; Furlan et al., 2007; Uchida et al., 2004). Guenther et al. (2007) also
found a companion in the inner hole of CS Cha although the separation of the stellar
pair is less than 5 AU (Eike Guenther, private communication) which is too small
to explain the truncation of the outer disk at ∼ 43 AU (Espaillat et al., 2007a) with
existing models (Artymowicz & Lubow, 1994). Additional clearing mechanisms may
be involved in clearing CS Cha’s hole. TW Hya, GM Aur, DM Tau, LkCa 15, and
UX Tau A are single stars down to about a few AU (White & Ghez, 2001; Ireland
& Kraus, 2008) and no information exists on the multiplicity of CVSO 224.
Grain growth cannot explain the holes of the transitional disks around GM Aur,
TW Hya, DM Tau, and CVSO 224 because they all have 10 μm silicate emission
13

features and the simulations predict there should be no small grains in the inner disk
and hence no silicate emission (Dullemond & Dominik, 2005). The holes of GM Aur,
TW Hya, DM Tau, and CVSO 224 can potentially be explained by the MRI. However,
in order for this mechanism to work, an inner disk hole must already be present and
so the MRI does not preclude planet formation nor is it an independent form of
clearing. Photoevaporation cannot explain the holes of GM Aur, TW Hya, and DM
Tau since their outer disks are massive (Mdisk > 0.05 M�; Calvet et al., 2002, 2005b)
and their accretion rates are higher than the photoevaporative wind rate (Table 1.1).
Photoevaporation could potentially explain the hole of CVSO 224 given its low mass
accretion rate (Table 1.1; Chapter 4), however, its Spitzer IRS spectrum suggests
it has a massive disk, contrary to what is expected in photoevaporative models
(Alexander & Armitage, 2007). The exact mass of its outer disk cannot be currently
estimated due to a lack of millimeter observations. The MRI, photoevaporation, and
grain growth cannot explain the gaps seen in the pre-transitional disks around UX
Tau A and LkCa 15 given that these inside-out clearing mechanisms cannot account
for a remnant optically thick inner disk. According to current disk clearing theories,
it seems that planet formation is most likely the dominant factor in clearing the inner
disks of transitional and pre-transitional disks.
1.3 Overview of the Thesis
In this thesis, we will explore disks located within the Taurus, Chamaeleon, Ophi-
uchus, and Orion star–forming regions, with a particular emphasis on transitional
and pre-transitional disks, in order to provide a fuller picture of dust evolution around
14
pre-main sequence stars. This will help refine theories of planet formation and de-
velop timescales for the evolution of planetary systems.
The ∼1–3 Myr old Taurus cloud (Hartmann, 2003) is currently the most studied
star–forming region. Its low levels of extinction (Kenyon & Hartmann, 1995) and
nearby distance of 140 pc (Kenyon et al., 1994) make it an ideal test site. The
Chamaeleon star–forming region is similar to Taurus in that it has relatively low
levels of extinction, distributed star formation, and is close to the sun at a distance
of 160 pc (Whittet et al., 1997). Chamaeleon has a median age of 2 Myr (Luhman,
2004), with objects ranging from 0.3 to 6 Myr in age (Luhman, 2007). The Ophiuchus
region is the youngest studied here at an age of 0.1–1 Myr (Luhman & Rieke, 1999).
It is located at 140 pc and its core is heavily embedded (Bontemps et al., 2001). We
also study sources in the Ophiuchus off-core region which is less extincted and has
an estimated age of 2 Myr (Wilking et al., 2005). Our last region, the Orion OB1
association, is a very large cloud complex located at ∼450 pc (Genzel & Stutzki,
1989). Within this region we look at the ∼10 Myr old 25 Orionis group (Briceno
et al., 2007) located in the Orion OB1a sub-association of Orion OB1 (Briceno et al.,
2005).
In Chapter 2, we explore the general characteristics of disks in Taurus, Chamaeleon,
and Ophiuchus. In order to do this, we constructed a grid of ∼240 disks with the
models of D’Alessio et al. (2006). This grid was calculated for different stellar masses,
mass accretion rates, inclinations, grain sizes, dust compositions, and amounts of set-
tling. We find that settled disks with low accretion rates and large grains will produce
SEDs with a significant near-IR flux but substantially less emission at longer wave-
15
lengths and therefore may be mistakenly interpreted as disks undergoing clearing.
We also use the grid to measure the slope of the SED between 13 μm and 31 μm
versus the equivalent width of the 10 μm silicate feature for the disks in our sample
and find that most disks can be explained by full disk models. However, there is
a subset of disks that cannot be explained by the models. These ∼30 disks have
more 10 μm silicate emission than is seen in full disks and we propose that these
objects are pre-transitional disks with small gaps where the extra silicate emission
arises from small optically thin dust located within the disk gap.
In Chapter 3, we model the transitional disk of CS Cha, located in the Chamaeleon
cloud, and we detect a possible trend between grain growth and dust settling with
age. The optically thin dust in the disk hole of the ∼2 Myr old CS Cha has grown
to much larger sizes (2 μm; Espaillat et al., 2007a) than the dust in the inner holes
of the ∼1 Myr old DM Tau and GM Aur (0.25 μm; Calvet et al., 2005b). Larger
grains are also seen in the hole of the 10 Myr old TW Hya (Calvet et al., 2002).
This may imply that there is some correlation between the process that creates the
optically thin dust grains and dust evolution over time. CS Cha also needs a more
settled outer disk to fit its millimeter emission indicating that its outer disk is in an
advanced state of dust evolution. We also detect [Ne II] emission at 12.81 μm in
CS Cha with Spitzer and find that there is no correlation between L[NeII] and LX as
would be expected if [Ne II] emission is due to X-ray heating (Glassgold et al., 2007).
Given the variability of X-ray emission (Feigelson et al., 2007; Gudel et al., 2007),
if any correlation was present, it may have been muted in these non-simultaneous
data. We do find a correlation between L[NeII] and M which suggests that accretion
16

related EUV heating may be important in producing [Ne II] emission.
In Chapter 4, we model the transitional disk of CVSO 224 (Espaillat et al., 2008b),
located in 25 Ori. It is one of the slowest accreting transitional disks found to date and
provides a unique opportunity to explore the role of photoevaporation in transitional
disks since its low M is in line with photoevaporative clearing theories. While it
does have a low mass accretion rate, CVSO 224 has a significant infrared excess
beyond 20 μm indicating that there is still a substantial outer disk in this object,
contrary to what is expected from photoevaporative clearing models (Alexander &
Armitage, 2007). Follow-up millimeter studies with the SMA or CARMA are needed
to measure the mass of the outer disk in order to test if photoevaporation is the
mechanism behind CVSO 224’s clearing.
In Chapter 5, we identify a new class of “pre-transitional disks” around the stars
UX Tau A and LkCa 15 in the Taurus cloud using broad-band Spitzer IRAC pho-
tometry and IRS spectra (Espaillat et al., 2007b). We model UX Tau A and LkCa
15 with gaps of ∼56 AU and ∼46 AU respectively. The location of LkCa 15’s outer
wall at ∼46 AU is in agreement with millimeter imaging (Pietu et al., 2006). In
addition, we find that UX Tau A contains crystalline silicates in its outer disk (� 56
AU) while LkCa 15’s silicates are amorphous and pristine.
In Chapter 6, we provide the first independent confirmation of a gap in the
protoplanetary disk of LkCa 15 (Espaillat et al., 2008a). We previously showed
that the substantial near-infrared excess of LkCa 15 could be explained by either
optically thick primordial disk material or by optically thin dust (Espaillat et al.,
2007b). In order to resolve this issue, we obtained a medium resolution near-infrared
17

SpeX spectrum spanning the wavelength range 2 – 5 μm (Espaillat et al., 2008a).
We fit the near-IR excess of LkCa 15 with a single-temperature blackbody of 1600
K, within the range of dust sublimation temperatures found for a larger sample of
disks by Monnier & Millan-Gabet (2002). This is firm evidence that the near-infrared
excess of LkCa 15 originates from the wall of an optically thick inner disk at the dust
destruction radius.
In Chapter 7, we present near-infrared Spex spectra of the pre-transitional disk
UX Tau A as well as the transitional disks GM Aur and DM Tau. We demonstrate
that the inner disk of UX Tau A is optically thick and confirm its membership in the
pre-transitional disk class. We also show that the origin of the near-infrared excess
in transitional and pre-transitional disks is different in nature.
In Chapter 8, we provide a summary of the thesis and propose directions for
future work.
18
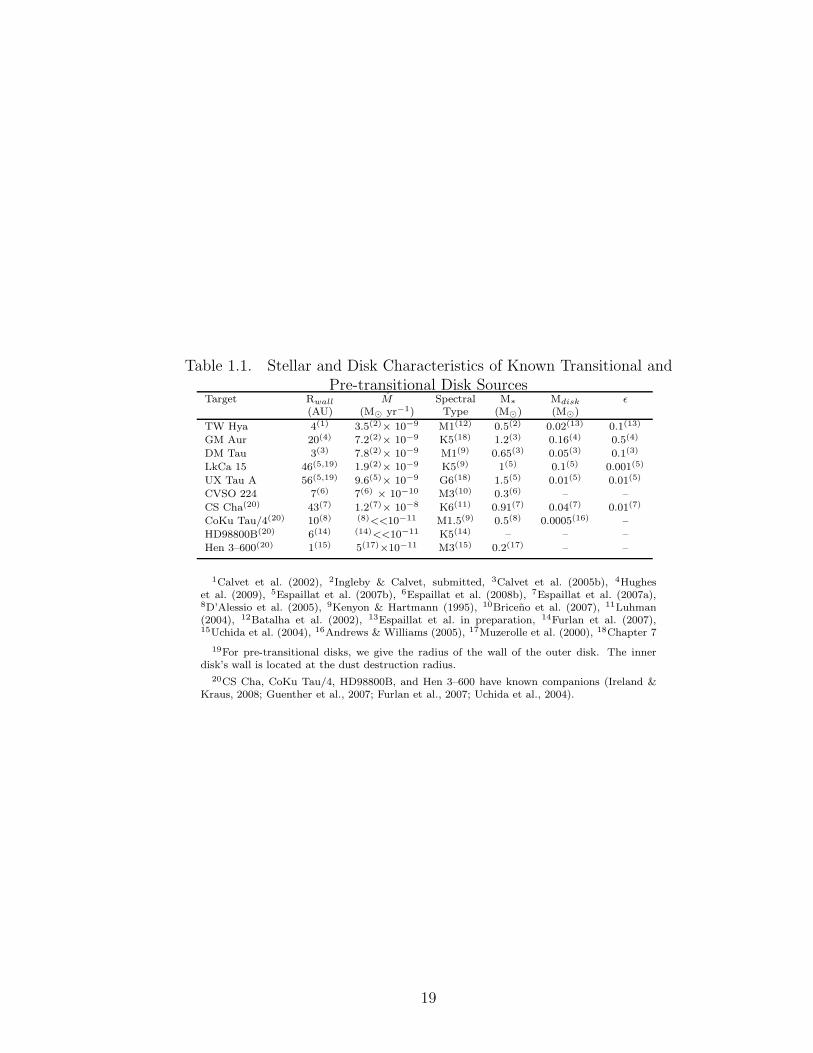
Table 1.1. Stellar and Disk Characteristics of Known Transitional andPre-transitional Disk Sources
Target Rwall M Spectral M∗ Mdisk ε(AU) (M� yr−1) Type (M�) (M�)
TW Hya 4(1) 3.5(2)× 10−9 M1(12) 0.5(2) 0.02(13) 0.1(13)
GM Aur 20(4) 7.2(2)× 10−9 K5(18) 1.2(3) 0.16(4) 0.5(4)
DM Tau 3(3) 7.8(2)× 10−9 M1(9) 0.65(3) 0.05(3) 0.1(3)
LkCa 15 46(5,19) 1.9(2)× 10−9 K5(9) 1(5) 0.1(5) 0.001(5)
UX Tau A 56(5,19) 9.6(5)× 10−9 G6(18) 1.5(5) 0.01(5) 0.01(5)
CVSO 224 7(6) 7(6) × 10−10 M3(10) 0.3(6) – –
CS Cha(20) 43(7) 1.2(7)× 10−8 K6(11) 0.91(7) 0.04(7) 0.01(7)
CoKu Tau/4(20) 10(8) (8)<<10−11 M1.5(9) 0.5(8) 0.0005(16) –
HD98800B(20) 6(14) (14)<<10−11 K5(14) – – –
Hen 3–600(20) 1(15) 5(17)×10−11 M3(15) 0.2(17) – –
1Calvet et al. (2002), 2Ingleby & Calvet, submitted, 3Calvet et al. (2005b), 4Hugheset al. (2009), 5Espaillat et al. (2007b), 6Espaillat et al. (2008b), 7Espaillat et al. (2007a),8D’Alessio et al. (2005), 9Kenyon & Hartmann (1995), 10Briceno et al. (2007), 11Luhman(2004), 12Batalha et al. (2002), 13Espaillat et al. in preparation, 14Furlan et al. (2007),15Uchida et al. (2004), 16Andrews & Williams (2005), 17Muzerolle et al. (2000), 18Chapter 7
19For pre-transitional disks, we give the radius of the wall of the outer disk. The innerdisk’s wall is located at the dust destruction radius.
20CS Cha, CoKu Tau/4, HD98800B, and Hen 3–600 have known companions (Ireland &Kraus, 2008; Guenther et al., 2007; Furlan et al., 2007; Uchida et al., 2004).
19
Class I
04016+2610
Class II
AA Tau
Class III
LkCa 7
log λ (μm)
log λ
Fλ
Figure 1.1 Spectral energy distributions of Class I, Class II, and Class III objects.04016+2610 is a Class I object. These objects are still actively receiving mass fromthe molecular cloud core. The infalling envelope absorbs most of the radiation in theoptical region. AA Tau is a Class II object. It is optically visible and also exhibitsinfrared emission originating from dust in a surrounding disk. LkCa 7 is a Class IIIobject and has only photospheric emission. Figure adapted from Hartmann (2009).Optical and near-IR data points are from Kenyon & Hartmann (1995), IRS spectraare from Furlan et al. (2006), far-IR IRAS data are from Weaver & Jones (1992),and millimeter data are from Andrews & Williams (2005).
20

Figure 1.2 Inner disk of classical T Tauri stars. The dust disk is truncated at thedust sublimation radius, i.e. the radius at which the dust sublimation temperatureis reached and dust can no longer exist. Within the dust sublimation radius thereis only gas which is truncated at the magnetospheric radius and is channeled ontothe star via magnetic field lines and impacts the star at the accretion shock. Thehot continuum from the accretion shock veils the absorption lines in the optical andis conspicuous in the ultraviolet. The inner disk emits primarily in the infrared andat larger radii the disk emits in the far-infrared and radio. Scattered light from thedisk surface is observed mainly at optical wavelengths. Figure taken from Hartmann(2009).
21
Figure 1.3 Artist’s conception of the innermost disk region of classical T Tauri stars.The bright ring corresponds to the wall of the truncated dust disk located at the dustsublimation temperature. The inner gaseous disk is truncated by the stellar magneticfield. Art by L. Belerique. Figure taken from Calvet & D’Alessio (in press).
22
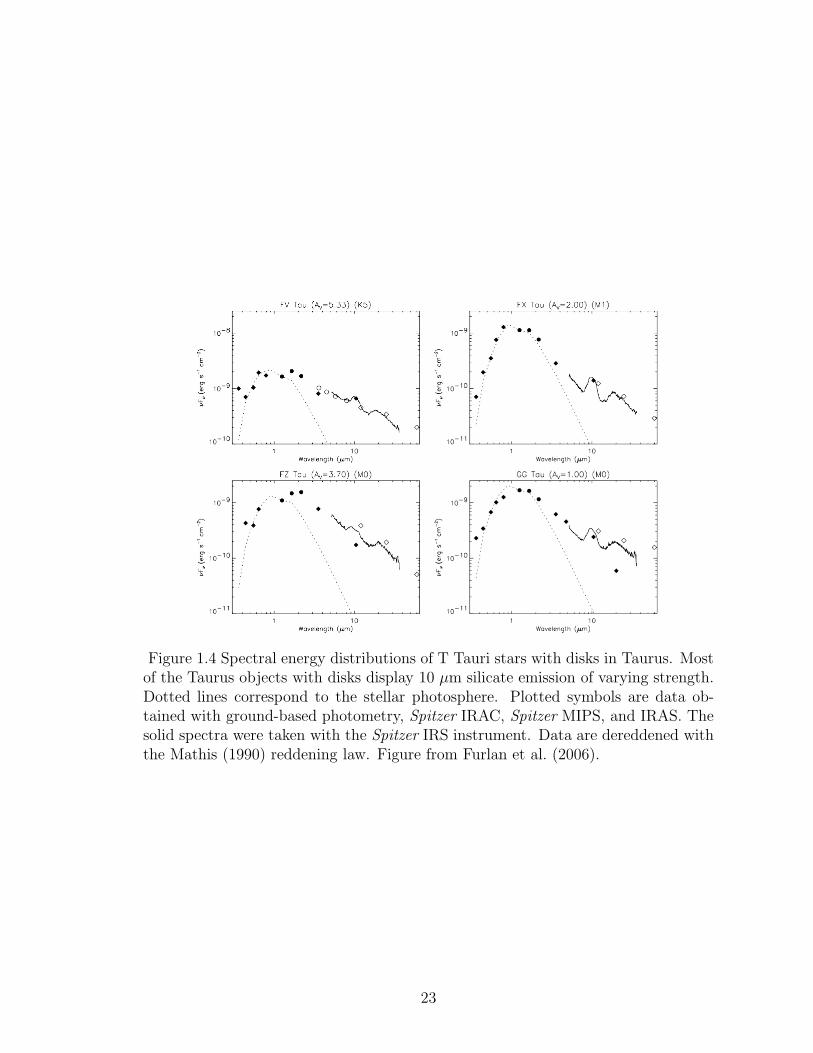
Figure 1.4 Spectral energy distributions of T Tauri stars with disks in Taurus. Mostof the Taurus objects with disks display 10 μm silicate emission of varying strength.Dotted lines correspond to the stellar photosphere. Plotted symbols are data ob-tained with ground-based photometry, Spitzer IRAC, Spitzer MIPS, and IRAS. Thesolid spectra were taken with the Spitzer IRS instrument. Data are dereddened withthe Mathis (1990) reddening law. Figure from Furlan et al. (2006).
23

Figure 1.5 Characteristic temperatures of a disk model with well-mixed ISM-sizeddust. Shown here are the surface temperature expected from a simple viscous disk(Tvis, green), the disk surface (T0, cyan), the disk midplane (Tm, dark blue), andthe disk photosphere (Tphot, red), defined in the regions where the disk is opticallythick to its own radiation. The model shown here has M∗ = 0.5 M�, R∗ = 2 R�, T∗= 4000 K, and M = 10−8 M� yr−1. Figure from Calvet & D’Alessio (in press).
24
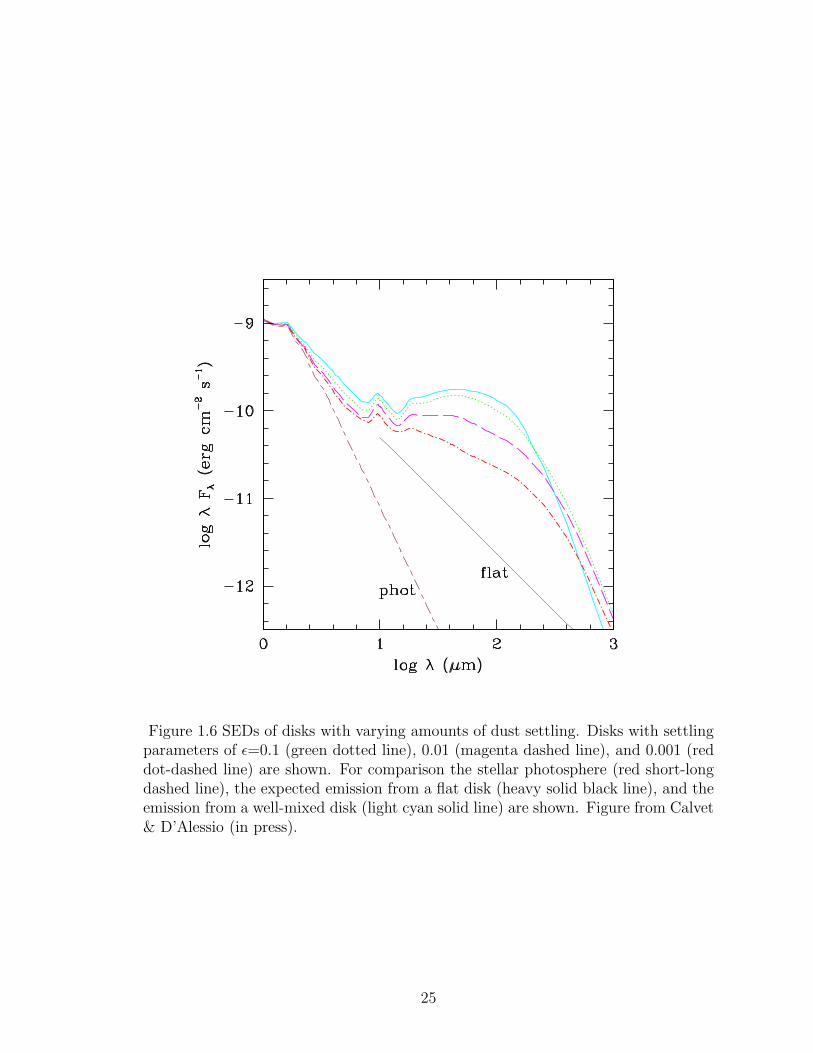
Figure 1.6 SEDs of disks with varying amounts of dust settling. Disks with settlingparameters of ε=0.1 (green dotted line), 0.01 (magenta dashed line), and 0.001 (reddot-dashed line) are shown. For comparison the stellar photosphere (red short-longdashed line), the expected emission from a flat disk (heavy solid black line), and theemission from a well-mixed disk (light cyan solid line) are shown. Figure from Calvet& D’Alessio (in press).
25
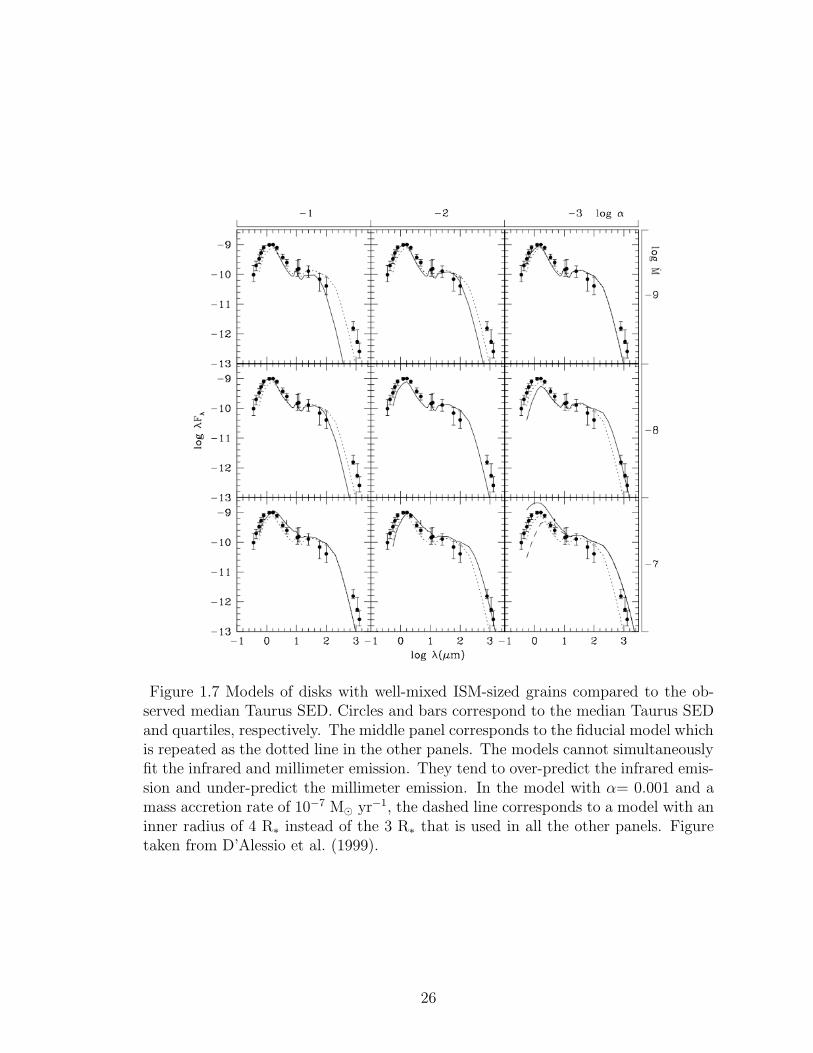
Figure 1.7 Models of disks with well-mixed ISM-sized grains compared to the ob-served median Taurus SED. Circles and bars correspond to the median Taurus SEDand quartiles, respectively. The middle panel corresponds to the fiducial model whichis repeated as the dotted line in the other panels. The models cannot simultaneouslyfit the infrared and millimeter emission. They tend to over-predict the infrared emis-sion and under-predict the millimeter emission. In the model with α= 0.001 and amass accretion rate of 10−7 M� yr−1, the dashed line corresponds to a model with aninner radius of 4 R∗ instead of the 3 R∗ that is used in all the other panels. Figuretaken from D’Alessio et al. (1999).
26
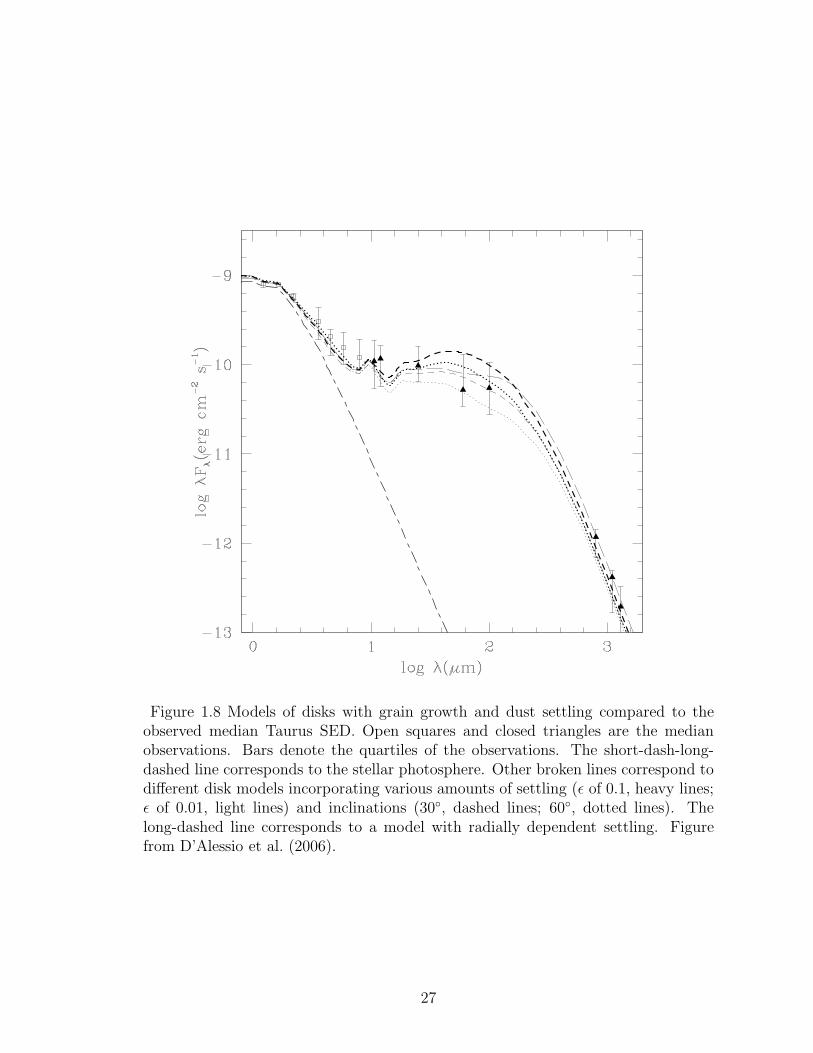
Figure 1.8 Models of disks with grain growth and dust settling compared to theobserved median Taurus SED. Open squares and closed triangles are the medianobservations. Bars denote the quartiles of the observations. The short-dash-long-dashed line corresponds to the stellar photosphere. Other broken lines correspond todifferent disk models incorporating various amounts of settling (ε of 0.1, heavy lines;ε of 0.01, light lines) and inclinations (30◦, dashed lines; 60◦, dotted lines). Thelong-dashed line corresponds to a model with radially dependent settling. Figurefrom D’Alessio et al. (2006).
27
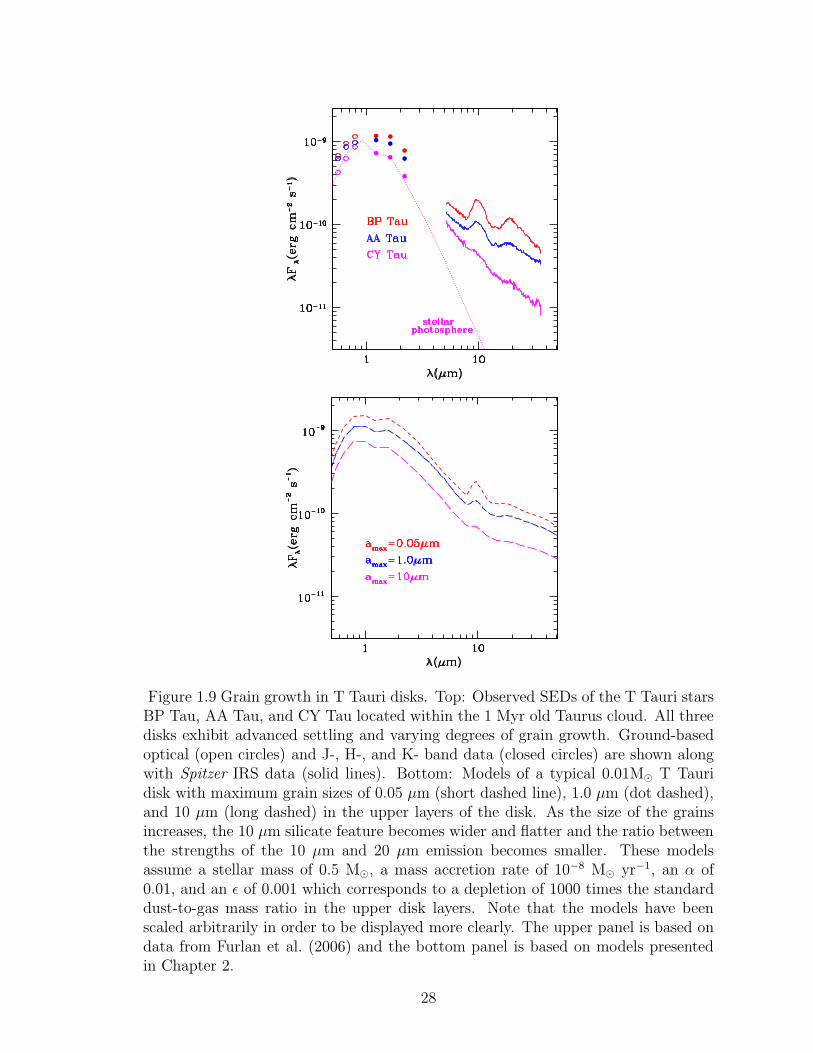
Figure 1.9 Grain growth in T Tauri disks. Top: Observed SEDs of the T Tauri starsBP Tau, AA Tau, and CY Tau located within the 1 Myr old Taurus cloud. All threedisks exhibit advanced settling and varying degrees of grain growth. Ground-basedoptical (open circles) and J-, H-, and K- band data (closed circles) are shown alongwith Spitzer IRS data (solid lines). Bottom: Models of a typical 0.01M� T Tauridisk with maximum grain sizes of 0.05 μm (short dashed line), 1.0 μm (dot dashed),and 10 μm (long dashed) in the upper layers of the disk. As the size of the grainsincreases, the 10 μm silicate feature becomes wider and flatter and the ratio betweenthe strengths of the 10 μm and 20 μm emission becomes smaller. These modelsassume a stellar mass of 0.5 M�, a mass accretion rate of 10−8 M� yr−1, an α of0.01, and an ε of 0.001 which corresponds to a depletion of 1000 times the standarddust-to-gas mass ratio in the upper disk layers. Note that the models have beenscaled arbitrarily in order to be displayed more clearly. The upper panel is based ondata from Furlan et al. (2006) and the bottom panel is based on models presentedin Chapter 2.
28
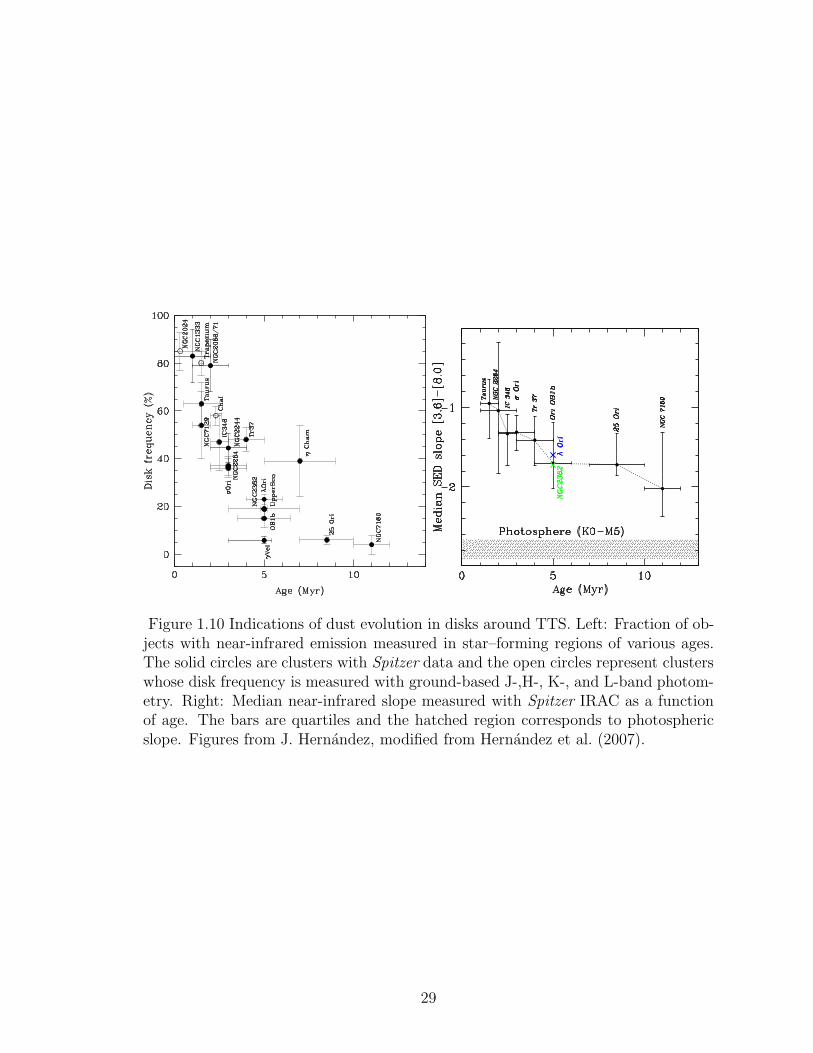
Figure 1.10 Indications of dust evolution in disks around TTS. Left: Fraction of ob-jects with near-infrared emission measured in star–forming regions of various ages.The solid circles are clusters with Spitzer data and the open circles represent clusterswhose disk frequency is measured with ground-based J-,H-, K-, and L-band photom-etry. Right: Median near-infrared slope measured with Spitzer IRAC as a functionof age. The bars are quartiles and the hatched region corresponds to photosphericslope. Figures from J. Hernandez, modified from Hernandez et al. (2007).
29
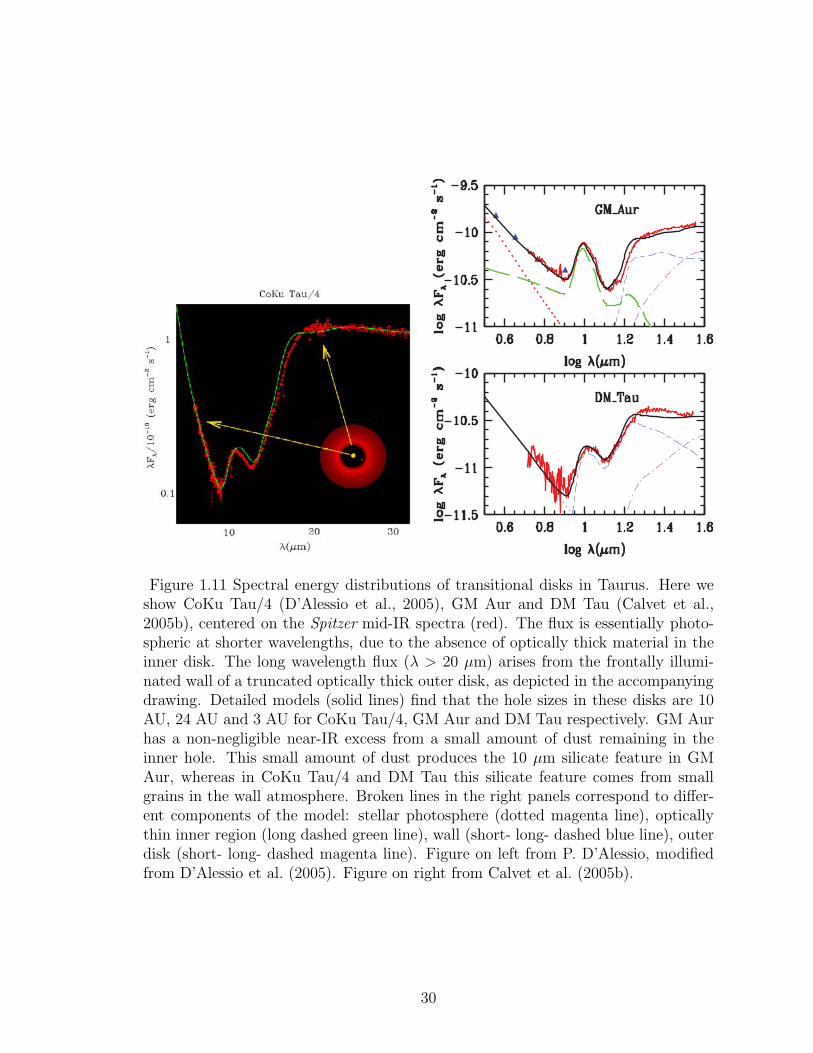
Figure 1.11 Spectral energy distributions of transitional disks in Taurus. Here weshow CoKu Tau/4 (D’Alessio et al., 2005), GM Aur and DM Tau (Calvet et al.,2005b), centered on the Spitzer mid-IR spectra (red). The flux is essentially photo-spheric at shorter wavelengths, due to the absence of optically thick material in theinner disk. The long wavelength flux (λ > 20 μm) arises from the frontally illumi-nated wall of a truncated optically thick outer disk, as depicted in the accompanyingdrawing. Detailed models (solid lines) find that the hole sizes in these disks are 10AU, 24 AU and 3 AU for CoKu Tau/4, GM Aur and DM Tau respectively. GM Aurhas a non-negligible near-IR excess from a small amount of dust remaining in theinner hole. This small amount of dust produces the 10 μm silicate feature in GMAur, whereas in CoKu Tau/4 and DM Tau this silicate feature comes from smallgrains in the wall atmosphere. Broken lines in the right panels correspond to differ-ent components of the model: stellar photosphere (dotted magenta line), opticallythin inner region (long dashed green line), wall (short- long- dashed blue line), outerdisk (short- long- dashed magenta line). Figure on left from P. D’Alessio, modifiedfrom D’Alessio et al. (2005). Figure on right from Calvet et al. (2005b).
30
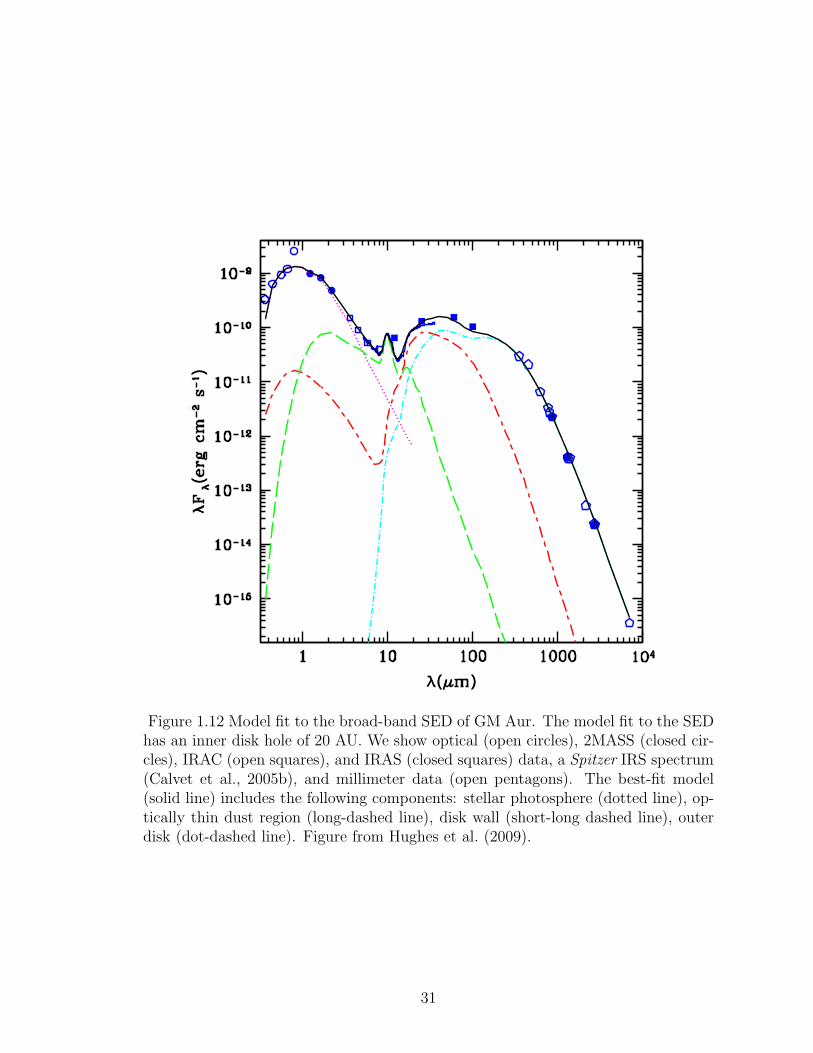
Figure 1.12 Model fit to the broad-band SED of GM Aur. The model fit to the SEDhas an inner disk hole of 20 AU. We show optical (open circles), 2MASS (closed cir-cles), IRAC (open squares), and IRAS (closed squares) data, a Spitzer IRS spectrum(Calvet et al., 2005b), and millimeter data (open pentagons). The best-fit model(solid line) includes the following components: stellar photosphere (dotted line), op-tically thin dust region (long-dashed line), disk wall (short-long dashed line), outerdisk (dot-dashed line). Figure from Hughes et al. (2009).
31
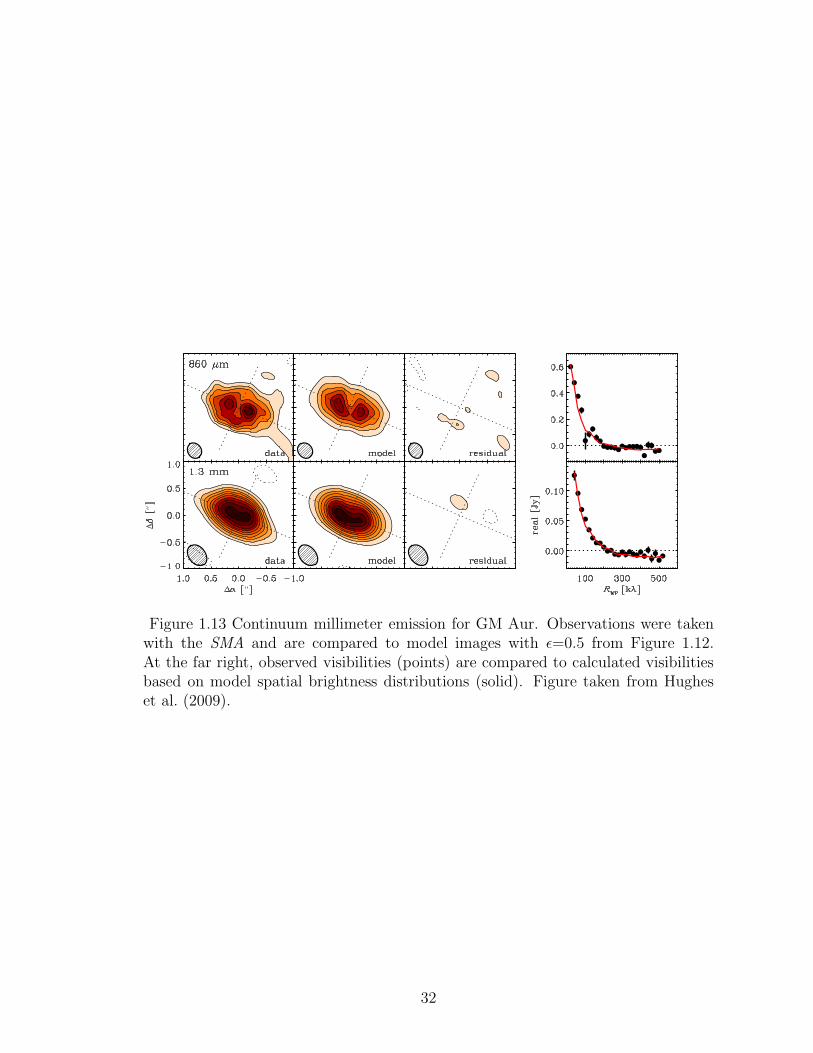
Figure 1.13 Continuum millimeter emission for GM Aur. Observations were takenwith the SMA and are compared to model images with ε=0.5 from Figure 1.12.At the far right, observed visibilities (points) are compared to calculated visibilitiesbased on model spatial brightness distributions (solid). Figure taken from Hugheset al. (2009).
32
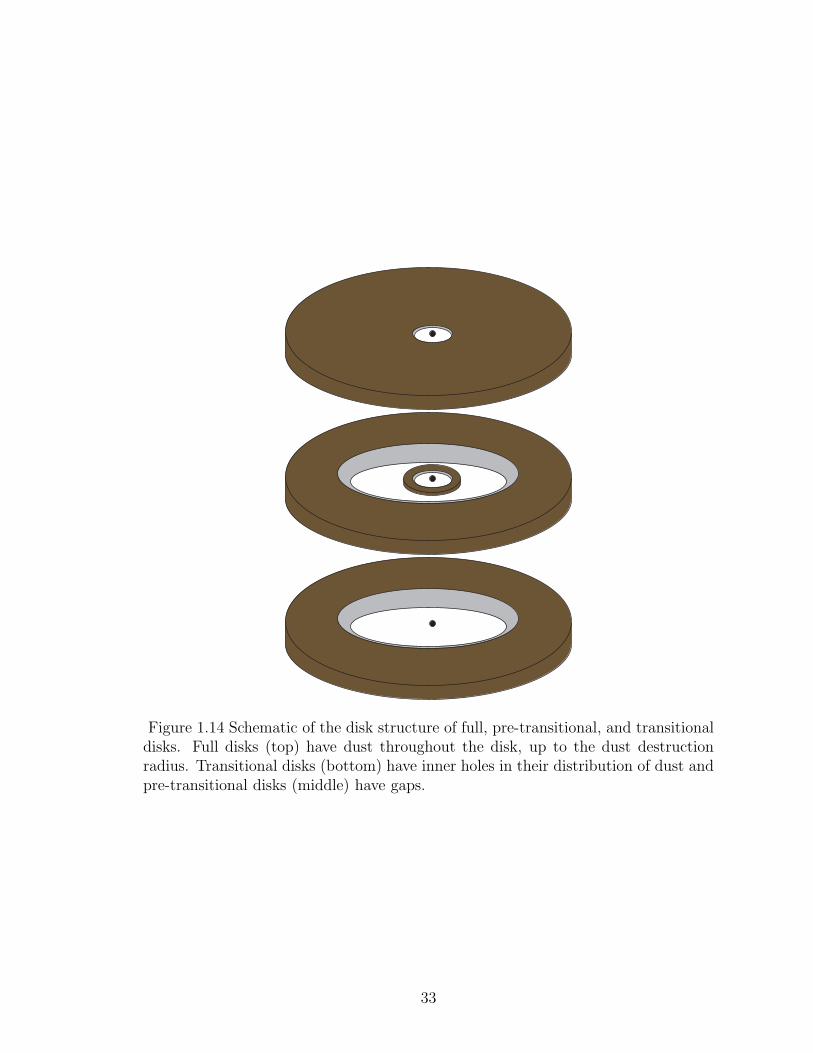
Figure 1.14 Schematic of the disk structure of full, pre-transitional, and transitionaldisks. Full disks (top) have dust throughout the disk, up to the dust destructionradius. Transitional disks (bottom) have inner holes in their distribution of dust andpre-transitional disks (middle) have gaps.
33
Chapter 2
Modeling Irradiated Accretion Disks Around T
Tauri Stars
Abstract: In order to make a first attempt at describing the overall qualities of
disks in Taurus, Chamaeleon, and Ophiuchus we created a grid of ∼240 disk models
with the codes of D’Alessio et al. We present the physical properties and simulated
SEDs of disks around 0.5 M� and 0.2 M� stars with mass accretion rates between
10−7 and 10−10 M� yr−1, various amounts of dust settling, and different maximum
grain sizes in the upper disk layers. We find that slowly accreting, settled disks with
large grains in the upper layers will have SEDs that display a significant near-IR flux,
as is seen in full disks, but substantially less emission at longer wavelengths. Such
disks may be mistakenly interpreted as undergoing clearing. We explore the effects of
incorporating different silicates in the disk and compare the resulting spectral energy
distributions to the median SEDs of Taurus and Chamaeleon. We also use the grid
to measure the slope of the SED between 13 μm and 31 μm versus the equivalent
width of the 10 μm silicate feature. Aside from the well-known transitional and pre-
transitional disks, most of the disks can be explained by typical “full” disk models.
However, there is a subset of ∼30 disks which show stronger silicate emission than
can be explained by the full disk models. We propose that these objects are pre-
34
transitional disks with small gaps (< 20 AU) where the extra silicate emission comes
from optically thin small dust located within these disk gaps. Detailed modeling in
conjunction with millimeter interferometric images are needed to confirm this.
2.1 Introduction
The Taurus, Chamaeleon, and Ophiuchus star–forming regions are young clouds lo-
cated within 160 pc of the Sun (Kenyon et al., 1994; Whittet et al., 1997; Bontemps
et al., 2001). Taurus and Chamaeleon are distributed populations of low-mass pre-
main sequence stars (Kenyon & Hartmann, 1995; Luhman, 2004) while Ophiuchus
consists of a densely populated core region and a distributed off-core region (Bon-
temps et al., 2001; Wilking et al., 2005).
Currently, the Taurus cloud is the most studied star–forming region. With Spitzer
IRS spectra, Furlan et al. (2006) showed that disks in Taurus are not uniform in their
mid-IR SEDs. They are experiencing grain growth and dust settling as evidenced
by the strength of their 10 μm silicate features and varying mid-infrared slopes.
Furlan et al. (2006) confirmed this by comparing the data to a grid of D’Alessio
et al. disk models spanning different amounts of settling. In fact, most of the disks
seemed to have undergone substantial settling, with ε of 0.01 and 0.001 corresponding
to depletions of 100–1000 times the standard dust-to-gas mass ratio in their upper
layers.
Here we do a more extensive grid and compare it to disks in Taurus, Chamaeleon,
and Ophiuchus. This sample contains over 240 disks and given that individual,
detailed modeling is time-intensive, we leave SED fits to future works. However,
35
with a grid of models we can test the general effects of dust composition, settling,
inclination, mass accretion rate, and stellar mass on the SEDs. We find that ∼70%
of the sample can be explained by full disk models. About ∼10% of the sample
cannot be accounted for by full disk models and are known to be transitional and
pre-transitional disks (see Section 1.2.1). However, ∼20% of the sample cannot be
explained by the full disk models and they are also not known to be transitional or
pre-transitional disks. We propose that these “outliers” are pre-transitional disks.
The recently identified pre-transitional disks have an optically thick inner disk
separated from an optically thick outer disk by an optically thin gap (Espaillat et al.,
2007b, 2008a). These disks with gaps provide a unique insight into the relationship
between dust clearing and planets since their structure is most likely due to planet
formation in its early stages, before the inner disk has drained onto the star. To
date, we have only detected large gaps of ∼50 AU and the smaller gaps expected
during the initial stages of planet formation have yet to be found. We propose that
the “outliers” in Taurus, Chamaeleon, and Ophiuchus are pre-transitional disks with
small gaps (<10 AU).
2.2 Overview of the D’Alessio Code
The D’Alessio code assumes that disks are steady (i.e. the mass accretion rate is
constant), geometrically thin, and in vertical hydrostatic equilibrium. The mass
accretion rate is constant throughout the disk and the viscosity is parameterized by
α as per the viscosity prescription of Shakura & Syunyaev (1973). The disk is heated
by viscous dissipation, radioactive decay, cosmic rays, and stellar irradiation. In most
36
cases, viscous dissipation dominates the heating at the midplane at small radii (< 1
AU) and irradiation dominates at all other radii. The code assumes that dust and
gas are thermally coupled, which is unlikely in the uppermost disk layers.
The next section summarizes the work of Calvet et al. (1991, 1992), D’Alessio
et al. (1998, 1999, 2001, 2005, 2006), and Calvet & D’Alessio (in press). See those
works for a more detailed treatment of the following.
2.2.1 Vertical Disk Structure
Calvet et al. (1991) showed that disks are not vertically isothermal. As stellar ra-
diation enters the disk, it does so at an angle to the normal of the disk surface
(θ0 = cos−1μ0). A fraction of the stellar radiation is scattered and the stellar ra-
diation captured by the disk is ∼ (σT 4∗ /π)(R∗/R)2μ0. The star emits its energy
mostly at shorter wavelengths and it is at these short wavelengths that the opacity
of the dust in the disk is high. The stellar energy is absorbed by the dust at short
wavelengths and gets re-emitted at longer wavelengths, corresponding to the local
temperature of the disk, where the opacity of the dust is lower. Disks around hotter
stars will capture more energy, and therefore have higher temperatures, than disks
around cooler stars. The incident stellar radiation decreases with height in the disk
since only a fraction of the stellar radiation (dτs/μ0) reaches each height (z). The
subscript s refers to the “stellar” range.
From the equation of conservation of energy, the vertical temperature profile can
be written as
κP (T )σT 4(z)
π= κP (T )Jd(z) + κP (T∗)
σT 4∗
π
(R∗R
)2
e−τs/μ0 (2.1)
37
where κP is the Planck mean opacity and Jd is the mean intensity (Calvet et al., 1991;
D’Alessio et al., 1998, 1999). The subscript d refers to the “disk” range (i.e. the local
disk temperature and emissivity). In the uppermost layers, the disk is optically thin
and so τs/μ0 � 1 and e−τs/μ0 = 1. As the stellar radiation penetrates deeper into
the disk, less of it is absorbed because the optical depth increases, and therefore the
temperature decreases. The temperature also depends on μ0 and the more the disk
is flared, the hotter the disk will be at a given z.
D’Alessio et al. (1998) give the full set of differential equations that describe the
disk vertical structure and solve them in detail. Figure 2.1 shows the characteristic
heights in the disk. zs is the height of the disk surface defined where τs ∼ 1 along
the radial direction from the star, which is where most of the stellar radiation is
absorbed; Hm is the gas scale height evaluated at the midplane temperature; zphot is
the photospheric height where τRoss ∼ 1, i.e. where the disk is optically thick to its
own radiation. Note that the disk stays optically thick to the stellar radiation out to
very large radii, even if the disk becomes thin to its own radiation.
Figure 2.2 shows that in the inner disk (< 1 AU), the temperatures in the mid-
plane of the disk (Tmid) are higher than the temperatures in the upper layers of the
disk (T0) for typical conditions. Note that the plateau occurs at the dust sublimation
temperature. Here the disk is very optically thick to its own radiation and effectively
captures the energy, which is provided dominantly by viscous heating at these small
radii. This can also be seen in the fact that the surface temperature of a viscous
disk (Tvis) is similar to the photospheric temperature (Tphot), defined in the region
where the disk is optically thick. At larger radii, irradiation heating dominates.
38
Further out, the disk surface temperature is greater than the midplane temperature
(T0 > Tmid) and the disk becomes optically thin beyond ∼ 50 AU to its own radi-
ation; here the temperature is nearly isothermal in the midplane. At all radii, the
surface temperature is higher than the photospheric temperature (T0 > Tphot) and
the upper layers of the disk are hotter than the deeper layers where τR ∼ 1 and the
continuum forms. This “chromospheric effect” (Calvet et al., 1991, 1992) in the disk
atmosphere leads to emission features, most notably the 10 μm silicate feature.
2.2.2 Disk Surface Density and Mass
Unlike most other disk models, the disk surface density of the D’Alessio models can be
self-consistently calculated from the irradiated disk equations. From the conservation
of angular momentum, the surface density is
Σ =M
4πν
[1 −
(R∗R
)1/2], (2.2)
where M is the mass accretion rate, R∗ is the stellar radius, and ν is the viscosity.
With ν = αcsH = αc2s/ΩK (Shakura & Syunyaev, 1973)
Σ =M
4πα
ΩμmH
k < T >
[1 −
(R∗R
)1/2], (2.3)
where Ω is the Keplerian angular velocity and < T > is the vertically averaged
temperature. The disk mass is given by
Md =∫ Rd
Ri
Σ2πRdR (2.4)
where Rd and Ri are the outer and inner radii of the disk, respectively. Figure 2.3
illustrates the surface density and mass of the disk as a function of radius. While
39
the surface density decreases with radius, the surface area of the disk increases with
radius and so the mass of the entire disk is mostly in the outer disk. As is seen in
Figure 2.3, Σ ∝ R−1 given that T ∝ R−1/2 (Equation 2.1).
2.2.3 The Effect of Dust Opacity on Disk Structure
The opacity of the disk, and hence the temperature structure, is controlled by dust.
The dust opacity depends on changes in the dust due to grain growth and settling.
Grains grow through collisional coagulation and settle to the disk midplane due to
gravity (Weidenschilling et al., 1997; Dullemond & Dominik, 2004, 2005).
Smaller grains have higher opacities at shorter wavelengths than at longer wave-
lengths. Bigger grains have higher opacities than small grains at longer wavelengths
and less at shorter wavelengths. The models assume spherical grains with a distri-
bution of a−p where a is the grain radius between amin and amax. Figure 2.4 shows
how the opacity varies with wavelength for dust distributions of p = 2.5 and 3.5 for
different maximum sizes and temperatures for mixtures with silicates, troilite, ice,
and organics (Pollack et al., 1994). One can see that a mixture with a smaller amax
has a larger opacities at shorter wavelengths than mixtures with a larger amax. As
the maximum grain size increases, the opacity of the dust mixture becomes higher
at longer wavelengths.
The dust opacity sets the location of the disk surface, zs. Since zs is defined by
the height where τs ∼ 1, small grains will reach this limit higher in the disk relative to
big grains. Smaller grains result in a higher zs at each radius, and hence lead to more
disk flaring. Therefore, μ0 is larger and more stellar irradiation will be intercepted
40
by the disk and the disks will be hotter. Bigger grains have lower opacities in the
near-IR and as a result will have less flaring and lower temperatures.
Increased settling will also lower zs. The code assumes settling does not vary
with radius, which is likely untrue given that evolutionary timescales are more rapid
closer to the star, but we leave an exploration of this to future work. The settling is
parameterized by ε = ζsmall/ζstandard where ε is equal to the dust-to-gas mass ratio in
the upper layers of the disk relative to the standard dust-to-gas mass ratio. Settling
lowers zs since it decreases the dust-to-gas mass ratio of the upper disk; as a result,
there are less grains overall and fewer small grains, with a corresponding decrease
in the opacity and flaring. The resulting decrease in infrared emission is similar to
what one would see if we increased the grain size in the upper disk layers. However,
one difference between increasing the settling and increasing the grain size is that
with settling, small grains remain in the upper disk layers and so we still see silicate
emission. With grain growth, the silicate emission disappears since larger grains do
not have this feature in their opacity.
2.2.4 Inner Disk Wall
According to the magnetospheric accretion model, the inner disk is truncated by the
stellar magnetic field. However, the stellar radiation will destroy the dust out to a
radius where the it is at the dust sublimation temperature. This will create an inner
edge or “wall” of the dust disk which is frontally illuminated by the star (Natta et al.,
2001). Here we review D’Alessio et al. (2005)’s treatment of the inner disk wall. This
treatment assumes the gas between the magnetospheric truncation radius and the
41
dust destruction radius is optically thin and does not contribute to the heating of
the wall.
The wall’s optical depth increases radially and is optically thin closest to the
star. The stellar radiation impinges directly onto the wall, with an angle of 0◦ to the
normal of the wall’s surface. The wall is also assumed to be vertical and flat with
evenly distributed dust. In addition, light is isotropically scattered.
Following Calvet et al. (1991, 1992), the radial distribution of temperature for
the wall atmosphere is
Td(τd)4 =
F0
4σR[(2 +
3
q) + (
κs
κd− 3
q)e−qτd)] (2.5)
where F0 = L∗ + Lacc/4πR2wall, σR is the Stefan-Boltzmann constant, τd is the total
mean optical depth in the disk, and κs and κd are the mean opacities at the stellar
and disk temperatures. The wall atmosphere has an inversion in the temperature
with radius (T(τd=0)>T(τd ∼1)) and so emission features can also originate in the
wall. To get the location of the wall, one sets τd = 0 and
Rwall = [(L∗ + Lacc)
16πσR
(2 + qκs
κd
)]1/2 1
T 20
. (2.6)
At the dust sublimation radius T0 = Tsub, which is usually taken to be 1400 K. L∗
is the stellar luminosity and Lacc (∼ GM∗M/R∗) is the luminosity of the accretion
shock onto the stellar surface, which also heats the inner wall. The opacity in the
wall (κs/κd) is due to silicates and smaller dust grains will have a larger opacity ratio
and hence a larger Rwall.
42
2.3 Grid of Disk Models
We created a grid of ∼240 disks with the models of D’Alessio et al. for comparison
with disks in Taurus, Chamaeleon, and Ophiuchus. This grid was calculated for
stellar masses of 0.5 M� and 0.2 M�, corresponding to spectral types of about K7
and M5 respectively. We obtained stellar parameters by using the pre-main-sequence
tracks of Baraffe et al. (2002). For the 0.5 M� star, we adopted a R∗ of 2 R�, a
temperature of 4000 K, and a L∗ of 0.9 L� (Table 2.1). For the 0.2 M� star, we
adopted a R∗ of 1.4 R�, a temperature of 3240 K, and a L∗ of 0.2 L� (Table 2.1). To
plot the simulated SEDs in Section 2.4.2, we used photospheric colors from Kenyon
& Hartmann (1995) scaled to the flux of the adopted stellar parameters in the J-band
assuming a distance of 140 pc (Table 2.1).
For the dust opacity, we use amorphous silicates with a standard dust-to-gas mass
ratio of 0.004 and graphite with a standard dust-to-gas mass ratio of 0.0025 (Draine
& Lee, 1984), both with ISM-sized dust with amin of 0.005 μm and amax of 0.25 μm
(Mathis et al., 1977) in the upper layers and amin of 0.005 μm and amax of 1000 μm
in the disk midplane with a p of 3.5 (see Section 2.2.3). Graphite opacities are taken
from Draine & Lee (1984). Given the difference in opacity between different silicate
compositions (Figure 2.5), we test the effect of incorporating different silicates on the
simulated SED by comparing SEDs with astronomical silicates from Draine & Lee
(1984) to those with olivine silicates from Dorschner et al. (1995). We note that the
peak of the opacity at ∼10 μm is about the same for both dust compositions, however,
the olivine silicates have more flux above the continuum in the ∼10 μm feature. The
astronomical silicates have higher opacities at ∼2–7 μm. We also explore the effects
43
of changing amax in the upper disk layers for both silicate compositions.
In each grid we use mass accretion rates of 10−7, 10−8, 10−9, and 10−10 M�
yr−1, inclinations of 20◦, 40◦, 60◦, and 80◦, an α parameter of 0.01, and settling
parameters (ε) of 1, 0.1, 0.01, and 0.001. The outer disk radius is taken to be 300
AU in all cases and we adopt a distance of 140 pc to the star. Tables 2.2 and 2.3
list the sublimation radii, wall heights, and disk masses for grids using astronomical
silicates in disks around stars with stellar masses of 0.5 M� and 0.2 M�, respectively.
Tables 2.4 and 2.5 list the same information for grids using olivines in disks around
stars with stellar masses of 0.5 M� and 0.2 M�. The dust sublimation radius is
obtained following Equation 2.6 and the disk mass is calculated with Equation 2.4.
The height of the wall (hwall) is typically taken to be a free parameter whose value
is set by fitting to the observations (Calvet et al., 2005b; D’Alessio et al., 2005),
however, here we assume that the wall is the same height as the disk behind it at the
dust sublimation radius (Rsub). In Tables 2.2 through 2.5 we present the height of
the wall in terms of both AU and the gas scale height. In some cases, the value of the
Toomre parameter (Q = cs(Tc)Ω/πGΣ) is greater than or equal to 1 at radii greater
than ∼100 AU in disks with mass accretion rates of 10−7 M� yr−1, indicating that
these disks are are gravitationally unstable. Since the model approximations are no
longer valid in these cases, we do not present those disks in this work.
Several of the following figures have been presented in D’Alessio et al. (2006)
for the case of a disk using astronomical silicates around a 0.5 M� star (Table 2.2),
however, here we present these cases again in order to facilitate comparison with our
other grids.
44
2.4 Results
2.4.1 Disk Properties
Here we explore the basic effects of stellar mass, mass accretion rate, and settling on
the structure and properties of disks with astronomical silicates. Using a different
silicate composition will not significantly alter the main conclusions of this section
and so we do not present results using olivine silicates.
The disk is optically thick to its own radiation when the Rosseland mean optical
depth (τR) is greater than 1. This sets the height (zphot) above which the disk is
optically thin and it is from this “disk atmosphere” that silicate features originate.
In Figures 2.6 and 2.7 we present τR as a function of radial distance in the disk,
integrated from the disk midplane to the surface. For disks with a mass accretion
rate of 10−10 M� yr−1, the disk is optically thick to its own radiation within ∼1 AU;
for disks accreting at 10−9 M� yr−1 the transition from optically thick to optically
thin occurs at ∼5 AU; for disks accreting at 10−8 M� yr−1 this occurs at ∼30 AU,
and for disks accreting at 10−7 M� yr−1 this happens at ∼100 AU.
The range over which τR > 1 sets the radii where the photospheric temperature
(Tphot) is defined in Figures 2.8 through 2.14. For each stellar mass, accretion rate,
and settling parameter explored in this chapter, the photospheric temperature is
lower than that of the disk surface (Tphot < T0), resulting in a “chromospheric effect”
(Calvet et al., 1991, 1992) which causes the silicate emission feature to always be in
emission in our model grid, unless the feature is extinguished by the disk itself.
By comparing the viscous temperature (Tvis) with the photospheric temperature,
45
one can see that in some cases viscous heating is important in the midplane of the
inner disk. Viscous heating dominates when the midplane temperature is higher than
the photospheric temperature (Tc > Tphot). This occurs in disks with mass accretion
rates of 10−9 M� yr−1 (Figures 2.9 and 2.13), 10−8 M� yr−1 (Figures 2.10 and 2.14),
and 10−7 M� yr−1 (Figure 2.11). In these disks, the inner regions are very optically
thick to their own radiation(τR � 1; Figures 2.6 and 2.7) and are more efficient at
trapping their own energy. Note that the plateau in Tc seen in disks accreting at
10−8 M� yr−1 and 10−7 M� yr−1 occurs at the dust destruction temperature (1400
K). In disks with low mass accretion rates (Figures 2.8 and 2.12), the photospheric
temperature is similar to the midplane temperature (Tc ∼ Tphot). This indicates
that the disk becomes optically thick to its own radiation at the midplane. We will
explore the implications of this new result in Sections 2.4.2 and 2.5.
Figures 2.15 through 2.21 present the cumulative emergent flux as a function of
disk radius at wavelengths of 7 μm, 10 μm, 16 μm, 25 μm, 40 μm, 100 μm, and
1000 μm for mass accretion rates, settling parameters, and stellar masses used in our
model grid. The emission is calculated for disks which are face-on with a negligible
contribution from the wall, which is assumed to be flat and vertical. We find that
all of the 10 μm silicate emission originates within the inner 20 AU of disks around
0.5M� stars and from within 10 AU for 0.2 M� stars. For disks with mass accretion
rates of 10−10 M� yr−1, around 0.5 M� stars, 80% of the emission shortwards of 10
μm comes from within .5 AU for ε=0.001 and 2AU for ε=1.0; around 0.2 M� stars,
80% of this emission is from within 0.15 AU for ε=0.001 and .5 AU for ε=1.0. For
disks with M of 10−9 M� yr−1, around 0.5 M� stars, 80% of the emission shortwards
46
of 10 μm comes from within .7 AU for ε=0.001 and 2AU for ε=1.0; around 0.2 M�
stars, 80% of this emission is from within 0.2 AU for ε=0.001 and .5 AU for ε=1.0.
For disks with mass accretion rates of 10−8 M� yr−1, around 0.5 M� stars, 80% of
the emission shortwards of 10 μm comes from within 1 AU for ε=0.001 and 2AU for
ε=1.0; around 0.2 M� stars, 80% of this emission is from within 0.2 AU for ε=0.001
and .25 AU for ε=1.0. For disks with M of 10−7 M� yr−1, 80% of the emission
shortwards of 10 μm comes from within 0.6 AU for ε=0.001 around 0.5 M� stars.
These results show that the 10 μm silicate emission feature and the emission from
shorter wavelengths is a good tracer of the innermost disk.
Overall, 50% of the millimeter emission comes from within 70 AU in disks around
0.5 M� stars and from within 60 AU in disks around 0.2 M� stars. For disks with
mass accretion rates of 10−10 M� yr−1, around 0.5 M� stars, 50% of the millimeter
emission is from within 20 AU for ε of 0.001 and 70 AU for ε of 1; around 0.2 M�
stars, 50% of the millimeter emission is from within 15 AU for ε of 0.001 and 60 AU
for ε of 1. For mass accretion rates of 10−9 M� yr−1, around 0.5 M� stars, 50% of
the millimeter emission is from within 20 AU for ε of 0.001 and 60 AU for ε of 1;
around 0.2 M� stars, 50% of the millimeter emission is from within 15 AU for ε of
0.001 and 40 AU for ε of 1. For mass accretion rates of 10−8 M� yr−1, around 0.5
M� stars, 50% of the millimeter emission is from within 40 AU for ε of 0.001 and 50
AU for ε of 1; around 0.2 M� stars, 50% of the millimeter emission is from within
20 AU for ε of 0.001 and 35 AU for ε of 1. For mass accretion rates of 10−7 M�
yr−1, 50% of the millimeter emission is from within 60 AU for ε of 0.001 around 0.5
M� stars. In summary, about 25% of the millimeter emission comes from within the
47
inner optically thick regions of the disk (see Figures 2.6 and 2.7).
2.4.2 SED Simulations
In Figures 2.22 and 2.23 we present simulated SEDs for disks using astronomical
silicates around 0.5 M� and 0.2 M� stars for various mass accretion rates and settling
parameters at an inclination of 60◦. Extinction of the star by the disk is included
and it is significant in those disks with less settling, and hence a higher disk surface
which leads to greater extinction of the star by the outer disk. For a 0.2 M� star
with a mass accretion rate of 10−8 M� yr−1 and a settling parameter of 1.0, the
silicate emission feature is strongly extincted by the outer disk and appears to be
in absorption. Extinction of the star by the disk becomes even more apparent at
higher inclinations. Figures 2.24 and 2.25 illustrate the effect of inclination on the
resultant disk emission. While inclination effects can cause significant flux deficits
in the infrared, the stellar emission will be extinguished as well and so inclined disks
will not have SEDs which resemble those of transitional disks.
In Figure 2.26 we illustrate the effect of increasing the grain size in the upper
layers of the disk. The emission from wavelengths of ∼10 μm out to a few hundred
microns tends to decrease with increasing grain size because the opacity in the upper
layers decreases as the grain size increases. The millimeter emission remains about
the same since most of this emission comes from the midplane at larger radii. The
10 μm feature is also “washed out” as the maximum grain size increases (Figure 2.27).
In Figure 2.28, we show the contributions to the SED from the wall emission and the
thermal disk emission. The wall dominates the emission in the near-IR and the disk
48

emission dominates at longer wavelengths. When compared to the disks around 0.5
M� stars, the disks around 0.2 M� stars have less silicate emission relative to the
continuum for each amax in grid (Figures 2.29, 2.30, and 2.31). This is because the
disks in the 0.2 M� grid have lower disk surface temperatures overall relative to the
disks in the 0.5 M� grid.
The strength of the silicate emission also changes for different adopted silicate
compositions. Figures 2.32 and 2.33 compare disks with astronomical and olivine
silicates with ε of 0.1 and 0.001 around 0.5 M� and 0.2 M� stars, respectively. The
results are reflective of the silicate opacities shown in Figure 2.5. Around both stars,
the disks in the olivine grid have more silicate emission above the continuum at 10
μm and 20 μm and the disks with astronomical silicates have slightly more near-IR
emission. In Figures 2.34 and 2.35 we present simulated SEDs for disks around 0.5
M� and 0.2 M� stars with olivine silicates. When compared to Figures 2.22 and 2.23,
it is apparent that the disks with olivine silicates have more prominent 10 μm and
20 μm silicate features.
In Figure 2.36 we illustrate the effect of increasing the grain size in the upper
layers of the disk when adopting olivine silicates. The 10 μm feature is also “washed
out” as the maximum grain size increases (Figure 2.37) as was seen in the case of
astronomical silicates. In contrast, there is a difference in the near-IR emission: grain
size distributions with amax > 1 μm have stronger near-IR emission than distributions
with smaller amax. The contribution to the 10 μm silicate emission from the wall is
larger for smaller grain sizes in the case of olivine silicates (Figure 2.38) than was
seen for astronomical silicates. For disks around 0.2 M� stars with olivine silicates,
49
increasing the maximum grain size leads to weaker silicate emission features as well
(Figures 2.39). However, there is no significant difference in the near-IR emission as
was seen in the disks around 0.5 M� stars with olivine silicates (Figure 2.40) and
the contribution of the wall to the silicate emission is even higher (Figure 2.41). We
note that if we varied the height of the wall these relative differences in the near-IR
emission and the wall’s contribution to the silicate feature could be adjusted.
In Section 2.4.1 we found that in disks with low mass accretion rates, the pho-
tospheric temperature was similar to the midplane temperature, indicating that the
disk becomes optically thick to its own radiation at the midplane and that we are
seeing down to the midplane of the disk. In Figure 2.42 we illustrate the effect of
using a large amax (10 μm) in the upper disk layers in a very settled disk (ε=0.001)
with a mass accretion rate of 10−10 M� yr−1 around a 0.5 M� star. We find that
relative to disks with higher accretion rates, even those with larger grains, the very
low opacities due to using large grains in a slowly accreting, settled disk results in a
SED with a significant deficit of flux at longer wavelengths, even in the millimeter.
When taken in conjunction with the relatively “normal” near-IR excess, the observed
SEDs of such disks may be mistaken as disks with clearing or as small, outwardly
truncated disks.
2.4.3 Comparison to Observations
In Figures 2.43, 2.44, and 2.45 we compare the models using astronomical silicates
to the median observed SEDs of K5–M2 stars in Taurus as well as K5–M2 and
M3–M8 stars in Chamaeleon, respectively. For the higher mass stars in Taurus and
50
Chamaeleon, the models which provide the best fit to the medians have mass accre-
tion rates of 10−8 M� yr−1 and 10−7 M� yr−1 (Figures 2.43 and 2.44). For the lower
mass stars in Chamaeleon, the models with higher mass accretion rates of 10−9 M�
yr−1 and 10−8 M� yr−1 also fit the median observed SED better (Figure 2.45). Using
olivine silicates improves the fits to the medians at ∼20 μm and beyond, however, it
is still difficult to account for the upper quartile of the median (Figures 2.46 , 2.47,
and 2.48). We discuss possible explanations for this discrepancy in Section 2.5.
In order to compare the models to the observations with a diagnostic which is
less dependent on the resultant disk flux, we measure the slope of the SED between
13–31μm versus the equivalent width of the 10 μm silicate feature. Figure 2.49
shows that the grid covers a large parameter space with 10 μm silicate equivalent
widths ranging from ∼0.2–3.5 and slopes between 13–31 μm of ∼-0.5–1. When
comparing the parameter space covered by the grid (polygon, Figure 2.50) with the
observations (points, Figure 2.50) we find that the full disk models can account for
∼70% of the disks in Taurus, Chamaeleon, and Ophiuchus. The vast majority of
the most extreme outliers with the steepest slopes and the most silicate emission,
are well-known transitional and pre-transitional disks (labeled points, Figure 2.50)
and account for ∼10% of the observations. However, ∼20% of the disks cannot be
explained by full disk models and are not known to be transitional or pre-transitional
disks.
51
2.5 Discussion & Conclusions
We expand the previous grid done by D’Alessio et al. (2006) to stellar masses of
0.2 M� and 0.5 M�, mass accretion rates of 10−7 to 10−10 M� yr−1, inclinations
spanning ∼ 0 to ∼90◦, settling parameters of 1, 0.1, 0.01, and 0.001, maximum grain
sizes of 0.05 μm–1000 μm in the upper disk layers, and dust compositions including
astronomical and olivine silicates. We find that the disk is optically thick to its own
radiation (τR > 1) within 1 AU for disks with accretion rates of 10−10 M� yr−1, 5
AU for disks accreting at 10−9 M� yr−1, 30 AU for disks accreting at 10−8 M� yr−1,
and 100 AU for disks accreting at 10−7 M� yr−1. For all of the disks in our grids,
the disk surface temperature is higher than the temperature at the disk photosphere,
defined as where τR > 1, leading to a “chromospheric effect” which causes silicate
features to appear in emission (Calvet et al., 1991, 1992).
We find differences between disks around 0.5 M� stars and 0.2 M� stars. All
emission at wavelengths of 10 μm and shorter arises from the inner 20 AU of disks
around 0.5 M� stars and 10 AU for 0.2 M� stars. About 50% of millimeter emission
originates in the inner 70 AU of disks around 0.5 M� stars and 60 AU for 0.2 M�
stars. In each, an increase in amax in the upper layers of the disk leads to a decrease in
the disk emission between wavelengths of 10 μm to a few 100 μm, but the millimeter
emission remains the same. The biggest difference between adopting astronomical or
olivine silicates in the disk is the strength of the silicate emission; for olivines, this
emission is much stronger.
In disks with low mass accretion rates, we find that the photospheric temperature
is similar to the midplane temperature, indicating that the disk becomes optically
52
thick to its own radiation at the midplane. In essence, we are peering down to the
midplane of the disk, past the upper layers. This has important implications on disk
studies of slowly accreting disks. Previously, we had no good tracers of the midplane
in the innermost disk of TTS. These results indicate that Spitzer IRS spectra are a
powerful tool in accessing not only the upper layers of the disk but also the midplane
of the disk. This finding encourages further study of disks with low mass accretion
rates in order to probe the dust in the inner disk midplane.
Our disk grid demonstrates that full disks can produce SEDs with a very wide
variety of appearances, particularly in their slopes and their amount of infrared
emission. In attempting to identify additional transitional disks in Taurus, Najita
et al. (2007b) selected objects with infrared emission which was weaker than the
median SED of observed disks in Taurus and showed that their “transitional disks”
have systematically lower mass accretion rates than other disks in Taurus. However,
here we show that settled disks will have the steep slopes and weak excesses which
Najita et al. (2007b) interpreted as indicators of inner disk holes. As a result, many of
the disks in Najita et al. (2007b) which were classified as transitional disks are most
likely disks which have undergone significant settling. We also explored the effect
of incorporating large grains in slowly accreting, settled disks and found that such
disks will have a significant near-IR flux, as is seen in full disks, but substantially less
emission at longer wavelengths. The observed SEDs of such disks may be mistakenly
interpreted as undergoing clearing in the inner disk or as being outwardly truncated
to small radii. This highlights the importance of detailed modeling in ascertaining
disk structure.
53
In order to make a general comparison to disks in Taurus and Chamaeleon, we
attempted to fit the disk models to the median observed SEDs in these star–forming
regions. We find that models with mass accretion rates between ∼10−8 M� yr−1
and ∼10−7 M� yr−1 are in better agreement with the observed medians. These mass
accretion rates are higher than the average value of ∼10−8 M� yr−1 that has been
measured for CTTS (Hartmann et al., 1998; Gullbring et al., 1998). This discrepancy
between the slowly accreting disk models and the medians may indicate that mass
accretion rates in TTS are actually higher than the average measured TTS mass
accretion rate. These mass accretion rate measurements are based on measurements
of the excess luminosity above the photosphere in the ultraviolet and at optical
wavelengths (0.32–0.54 μm). However, measurements at 0.84 and 1 μm indicate that
there is excess emission at these redder wavelengths (White & Hillenbrand, 2004;
Edwards et al., 2006). Fitting this excess at redder wavelengths with an accretion
shock model which incorporates multiple accretion columns carrying different energy
fluxes (thereby resulting in a range of temperatures in the regions of the photosphere
heated by the accretion shock) Ingleby & Calvet (submitted) get up to a factor of 2
increase in the mass accretion rate relative to previous measurements. Therefore, it
is possible that the accretion rates of TTS are higher than previously measured and
that the fit of the higher accretion rate models to the median SED is a reflection of
this. Some of the discrepancy between the models and the median SEDs may also
reflect that we are trying to fit a median observed SED that encompasses several
stellar luminosities with a model which uses a single stellar luminosity. It is also
possible that there is some discrepancy in the dust opacity. If there were some other
54
unknown contributor to the opacity at 1 μm where the stellar radiation is absorbed,
the disks would be hotter and produce more near-IR emission. Alternatively, in
constructing the median it is assumed that each object is a full disk, however, some
objects which have been assumed to be full disks might actually have gaps. If this
is the case, it would be inappropriate to fit full disk models to a median that is not
truly representative of a full disk.
In fact, further comparison of the models with the observations indicates that
some disks which have previously been thought to be full disks may actually have
gaps. About ∼20% of disks in Taurus, Chamaeleon, and Ophiuchus are “outliers”
which cannot be explained by full disk models when comparing the slope of our
simulated SEDs between 13 μm – 31 μm versus the equivalent width of the 10 μm
silicate feature to that of observed disks. This subset of objects has significantly
more 10 μm silicate emission than can be explained by a full disk. One possible
explanation is that the optically thick disks of these outliers have optically thin gaps
that are filled with small optically thin dust from which the extra 10 μm silicate
emission arises. This has been seen in the case of the pre-transitional disk of LkCa 15
(Espaillat et al., 2007b). LkCa 15’s ∼46 AU gap contains 4×10⁻¹¹ M� of optically
thin dust within the inner 5 AU of the gap which accounts for most of its strong
10 μm silicate emission. The gap detected in LkCa 15 is quite large, reflecting an
observational bias toward picking out pre-transitional disks with large gaps since
their mid-infrared deficits will be more obvious in Spitzer spectra. Smaller gaps will
not have as obvious of a deficit and will be difficult to detect. These “outliers” in
10 μm silicate emission may be pre-transitional disks in the incipient stages of disk
55
gap opening with smaller gaps than previously observed, filled with small dust.
Given that the majority of the 10 μm silicate emission traces traces the dust within
the inner 1 AU of the disk (see Figures 2.15 through 2.21), the Spitzer IRS instrument
will be most sensitive to clearings in which some of the dust located at radii <1 AU
has been removed. Because of this, the IRS cannot easily detect gaps whose inner
boundary is outside of 1 AU. As is seen in Figure 2.51, a disk with a gap ranging from
5 – 10 AU will be difficult to distinguish from a full disk and it will be up to ALMA
to detect gaps in disks a radii greater than 1 AU. One can speculate that as the gap
grows with time, it will be more easily detected by the IRS instrument. As the inner
disk accretes onto the star and the gap grows, we will begin to see part of the outer
wall, which had been previously obscured by the inner disk (see Figure 2.51). When
this happens, the SED begins to differ from that of a full disk beyond 20 μm. When
the inner disk is quite small we will see significant departures from a full disk SED
assuming that the outer wall is now fully illuminated and that there is some optically
thin dust in the inner disk (see Figure 2.51). Such a disk will have very strong 10 μm
silicate emission, as is observed in the outliers, supporting our proposal that the
outliers could be pre-transitional disks (see Section 1.2.1 for a review). Given that
the outliers have not been previously identified as pre-transitional disks from visual
inspection of their SEDs, it is likely that the outliers have gaps less than 10 AU since
Figure 2.51 indicates that a gap spanning radii of ∼0.2–10 AU in the disk should
lead to an obvious deficit in the SED. We note that this disk structure is similar to
that of the pre-transitional disk of LkCa 15 (Section 5.3.3), which may indicate that
LkCa 15 is representative of the last stages of gap opening, before the inner disk
56
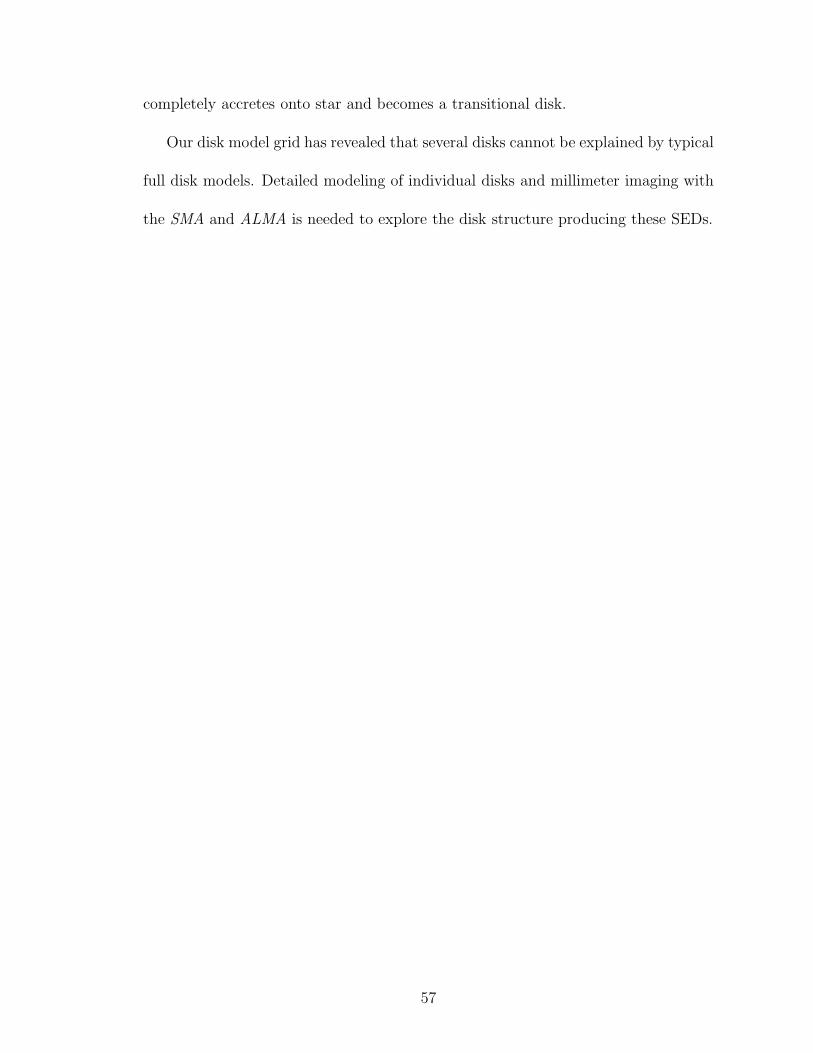
completely accretes onto star and becomes a transitional disk.
Our disk model grid has revealed that several disks cannot be explained by typical
full disk models. Detailed modeling of individual disks and millimeter imaging with
the SMA and ALMA is needed to explore the disk structure producing these SEDs.
57
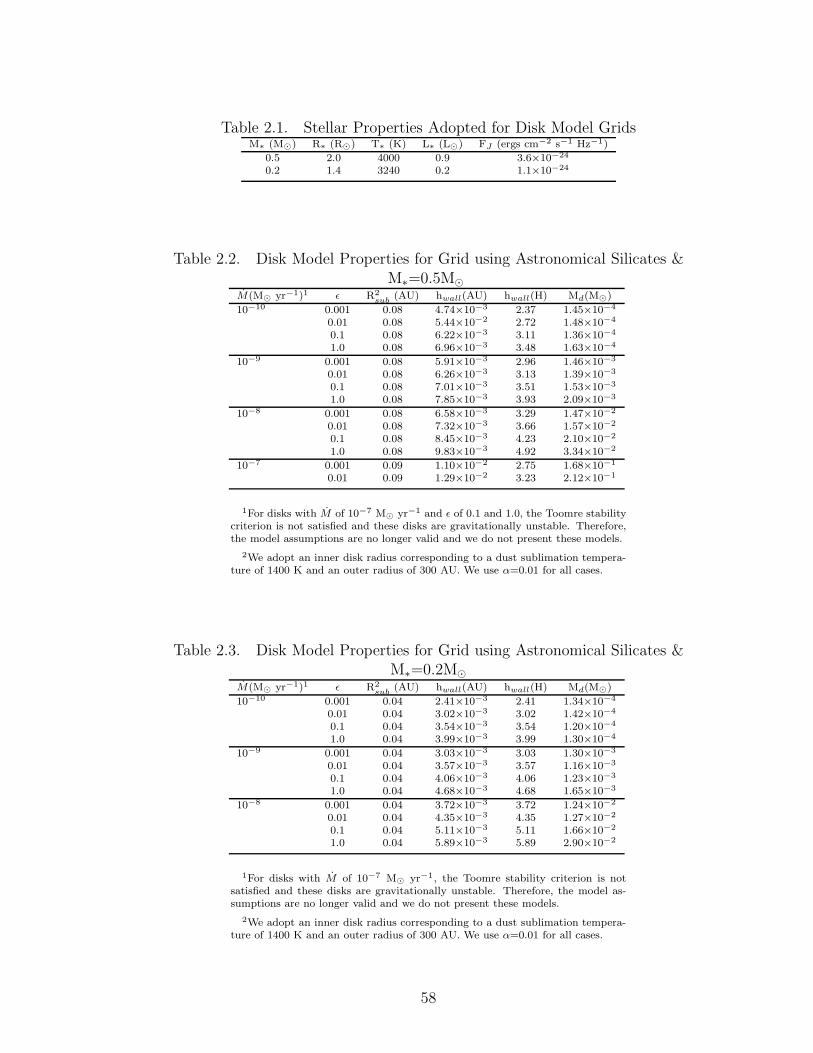
Table 2.1. Stellar Properties Adopted for Disk Model GridsM∗ (M�) R∗ (R�) T∗ (K) L∗ (L�) FJ (ergs cm−2 s−1 Hz−1)
0.5 2.0 4000 0.9 3.6×10⁻²⁴
0.2 1.4 3240 0.2 1.1×10⁻²⁴
Table 2.2. Disk Model Properties for Grid using Astronomical Silicates &M∗=0.5M�
M(M� yr−1)1 ε R2sub
(AU) hwall(AU) hwall(H) Md(M�)
10−10 0.001 0.08 4.74×10⁻³ 2.37 1.45×10⁻⁴
0.01 0.08 5.44×10⁻² 2.72 1.48×10⁻⁴
0.1 0.08 6.22×10⁻³ 3.11 1.36×10⁻⁴
1.0 0.08 6.96×10⁻³ 3.48 1.63×10⁻⁴
10−9 0.001 0.08 5.91×10⁻³ 2.96 1.46×10⁻³
0.01 0.08 6.26×10⁻³ 3.13 1.39×10⁻³
0.1 0.08 7.01×10⁻³ 3.51 1.53×10⁻³
1.0 0.08 7.85×10⁻³ 3.93 2.09×10⁻³
10−8 0.001 0.08 6.58×10⁻³ 3.29 1.47×10⁻²
0.01 0.08 7.32×10⁻³ 3.66 1.57×10⁻²
0.1 0.08 8.45×10⁻³ 4.23 2.10×10⁻²
1.0 0.08 9.83×10⁻³ 4.92 3.34×10⁻²
10−7 0.001 0.09 1.10×10⁻² 2.75 1.68×10⁻¹
0.01 0.09 1.29×10⁻² 3.23 2.12×10⁻¹
1For disks with M of 10−7 M� yr−1 and ε of 0.1 and 1.0, the Toomre stabilitycriterion is not satisfied and these disks are gravitationally unstable. Therefore,the model assumptions are no longer valid and we do not present these models.
2We adopt an inner disk radius corresponding to a dust sublimation tempera-ture of 1400 K and an outer radius of 300 AU. We use α=0.01 for all cases.
Table 2.3. Disk Model Properties for Grid using Astronomical Silicates &M∗=0.2M�
M(M� yr−1)1 ε R2sub
(AU) hwall(AU) hwall(H) Md(M�)
10−10 0.001 0.04 2.41×10⁻³ 2.41 1.34×10⁻⁴
0.01 0.04 3.02×10⁻³ 3.02 1.42×10⁻⁴
0.1 0.04 3.54×10⁻³ 3.54 1.20×10⁻⁴
1.0 0.04 3.99×10⁻³ 3.99 1.30×10⁻⁴
10−9 0.001 0.04 3.03×10⁻³ 3.03 1.30×10⁻³
0.01 0.04 3.57×10⁻³ 3.57 1.16×10⁻³
0.1 0.04 4.06×10⁻³ 4.06 1.23×10⁻³
1.0 0.04 4.68×10⁻³ 4.68 1.65×10⁻³
10−8 0.001 0.04 3.72×10⁻³ 3.72 1.24×10⁻²
0.01 0.04 4.35×10⁻³ 4.35 1.27×10⁻²
0.1 0.04 5.11×10⁻³ 5.11 1.66×10⁻²
1.0 0.04 5.89×10⁻³ 5.89 2.90×10⁻²
1For disks with M of 10−7 M� yr−1, the Toomre stability criterion is notsatisfied and these disks are gravitationally unstable. Therefore, the model as-sumptions are no longer valid and we do not present these models.
2We adopt an inner disk radius corresponding to a dust sublimation tempera-ture of 1400 K and an outer radius of 300 AU. We use α=0.01 for all cases.
58
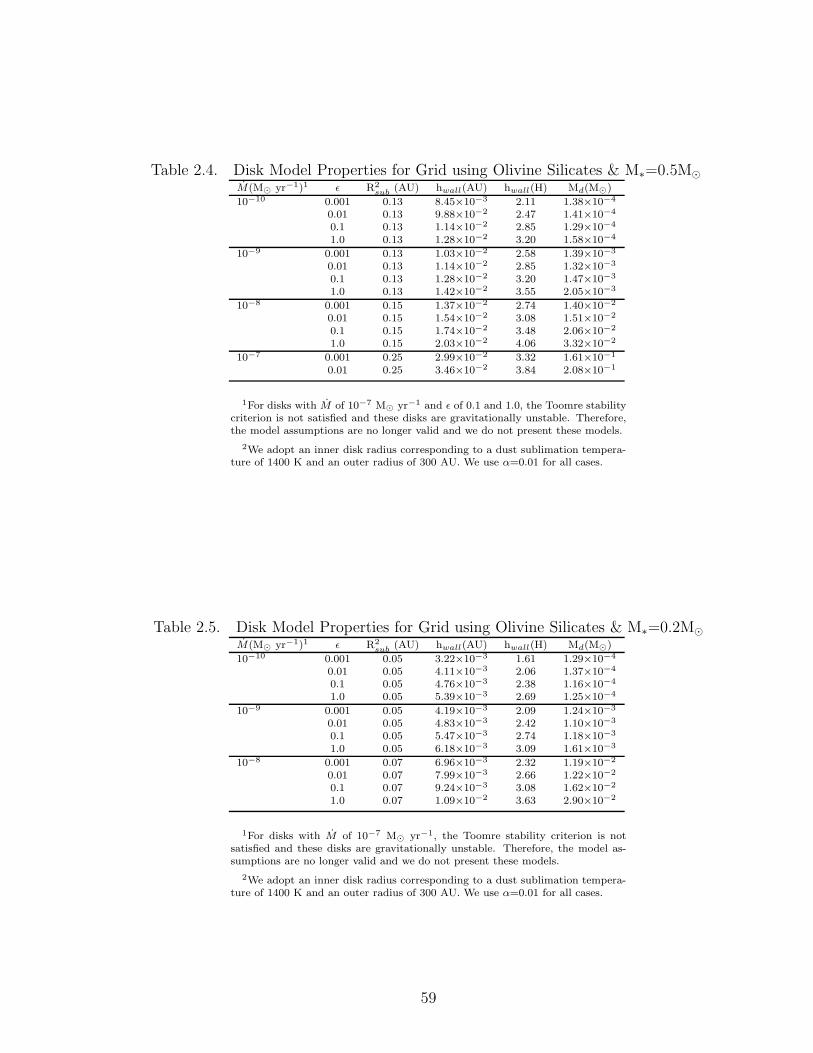
Table 2.4. Disk Model Properties for Grid using Olivine Silicates & M∗=0.5M�M(M� yr−1)1 ε R2
sub (AU) hwall(AU) hwall(H) Md(M�)
10−10 0.001 0.13 8.45×10⁻³ 2.11 1.38×10⁻⁴
0.01 0.13 9.88×10⁻² 2.47 1.41×10⁻⁴
0.1 0.13 1.14×10⁻² 2.85 1.29×10⁻⁴
1.0 0.13 1.28×10⁻² 3.20 1.58×10⁻⁴
10−9 0.001 0.13 1.03×10⁻² 2.58 1.39×10⁻³
0.01 0.13 1.14×10⁻² 2.85 1.32×10⁻³
0.1 0.13 1.28×10⁻² 3.20 1.47×10⁻³
1.0 0.13 1.42×10⁻² 3.55 2.05×10⁻³
10−8 0.001 0.15 1.37×10⁻² 2.74 1.40×10⁻²
0.01 0.15 1.54×10⁻² 3.08 1.51×10⁻²
0.1 0.15 1.74×10⁻² 3.48 2.06×10⁻²
1.0 0.15 2.03×10⁻² 4.06 3.32×10⁻²
10−7 0.001 0.25 2.99×10⁻² 3.32 1.61×10⁻¹
0.01 0.25 3.46×10⁻² 3.84 2.08×10⁻¹
1For disks with M of 10−7 M� yr−1 and ε of 0.1 and 1.0, the Toomre stabilitycriterion is not satisfied and these disks are gravitationally unstable. Therefore,the model assumptions are no longer valid and we do not present these models.
2We adopt an inner disk radius corresponding to a dust sublimation tempera-ture of 1400 K and an outer radius of 300 AU. We use α=0.01 for all cases.
Table 2.5. Disk Model Properties for Grid using Olivine Silicates & M∗=0.2M�M(M� yr−1)1 ε R2
sub (AU) hwall(AU) hwall(H) Md(M�)
10−10 0.001 0.05 3.22×10⁻³ 1.61 1.29×10⁻⁴
0.01 0.05 4.11×10⁻³ 2.06 1.37×10⁻⁴
0.1 0.05 4.76×10⁻³ 2.38 1.16×10⁻⁴
1.0 0.05 5.39×10⁻³ 2.69 1.25×10⁻⁴
10−9 0.001 0.05 4.19×10⁻³ 2.09 1.24×10⁻³
0.01 0.05 4.83×10⁻³ 2.42 1.10×10⁻³
0.1 0.05 5.47×10⁻³ 2.74 1.18×10⁻³
1.0 0.05 6.18×10⁻³ 3.09 1.61×10⁻³
10−8 0.001 0.07 6.96×10⁻³ 2.32 1.19×10⁻²
0.01 0.07 7.99×10⁻³ 2.66 1.22×10⁻²
0.1 0.07 9.24×10⁻³ 3.08 1.62×10⁻²
1.0 0.07 1.09×10⁻² 3.63 2.90×10⁻²
1For disks with M of 10−7 M� yr−1, the Toomre stability criterion is notsatisfied and these disks are gravitationally unstable. Therefore, the model as-sumptions are no longer valid and we do not present these models.
2We adopt an inner disk radius corresponding to a dust sublimation tempera-ture of 1400 K and an outer radius of 300 AU. We use α=0.01 for all cases.
59
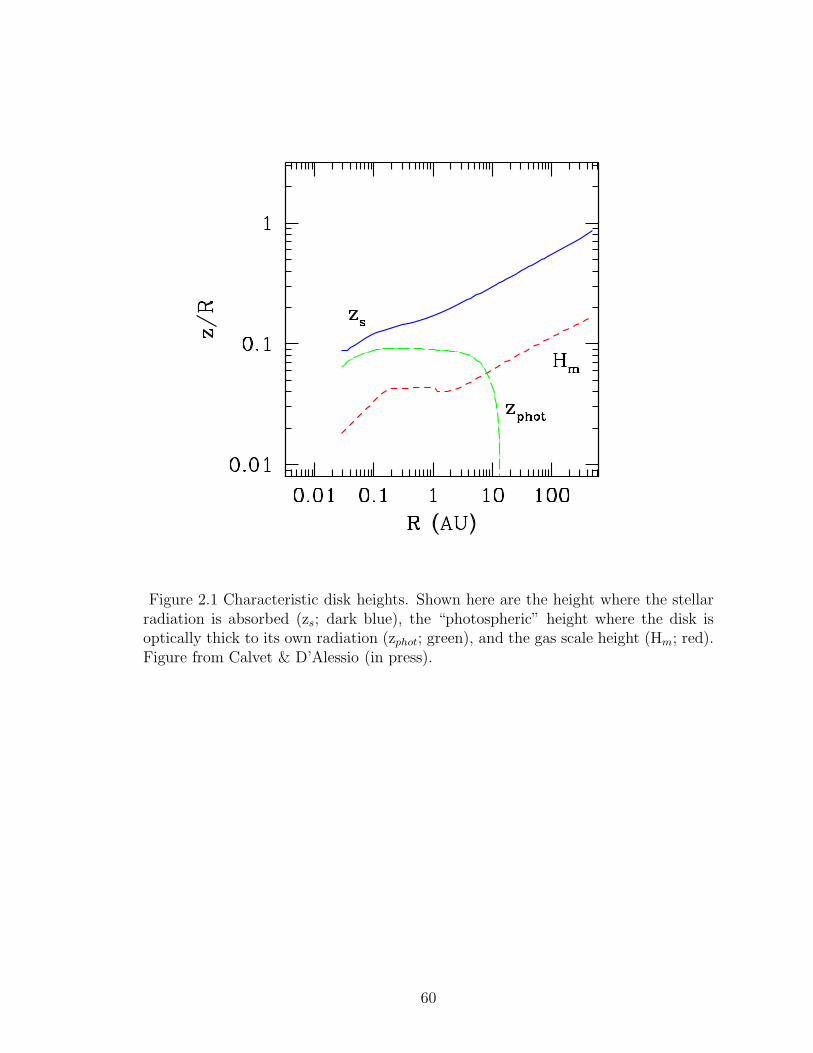
Figure 2.1 Characteristic disk heights. Shown here are the height where the stellarradiation is absorbed (zs; dark blue), the “photospheric” height where the disk isoptically thick to its own radiation (zphot; green), and the gas scale height (Hm; red).Figure from Calvet & D’Alessio (in press).
60
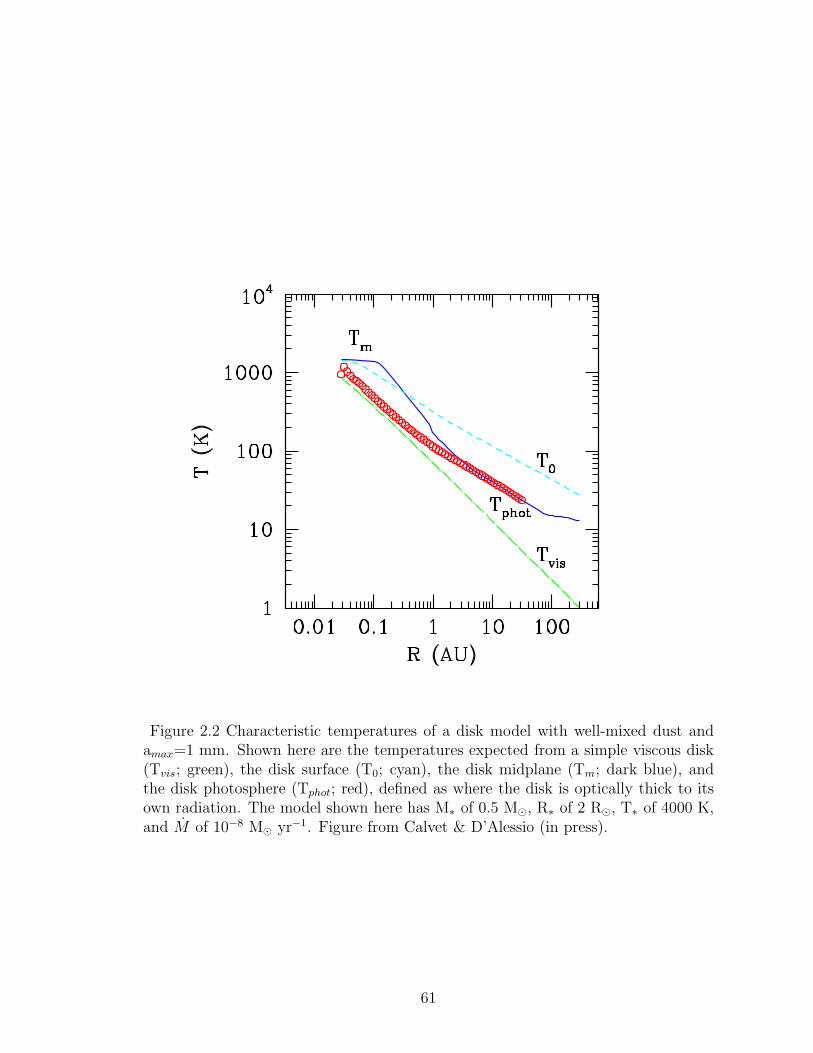
Figure 2.2 Characteristic temperatures of a disk model with well-mixed dust andamax=1 mm. Shown here are the temperatures expected from a simple viscous disk(Tvis; green), the disk surface (T0; cyan), the disk midplane (Tm; dark blue), andthe disk photosphere (Tphot; red), defined as where the disk is optically thick to itsown radiation. The model shown here has M∗ of 0.5 M�, R∗ of 2 R�, T∗ of 4000 K,and M of 10−8 M� yr−1. Figure from Calvet & D’Alessio (in press).
61
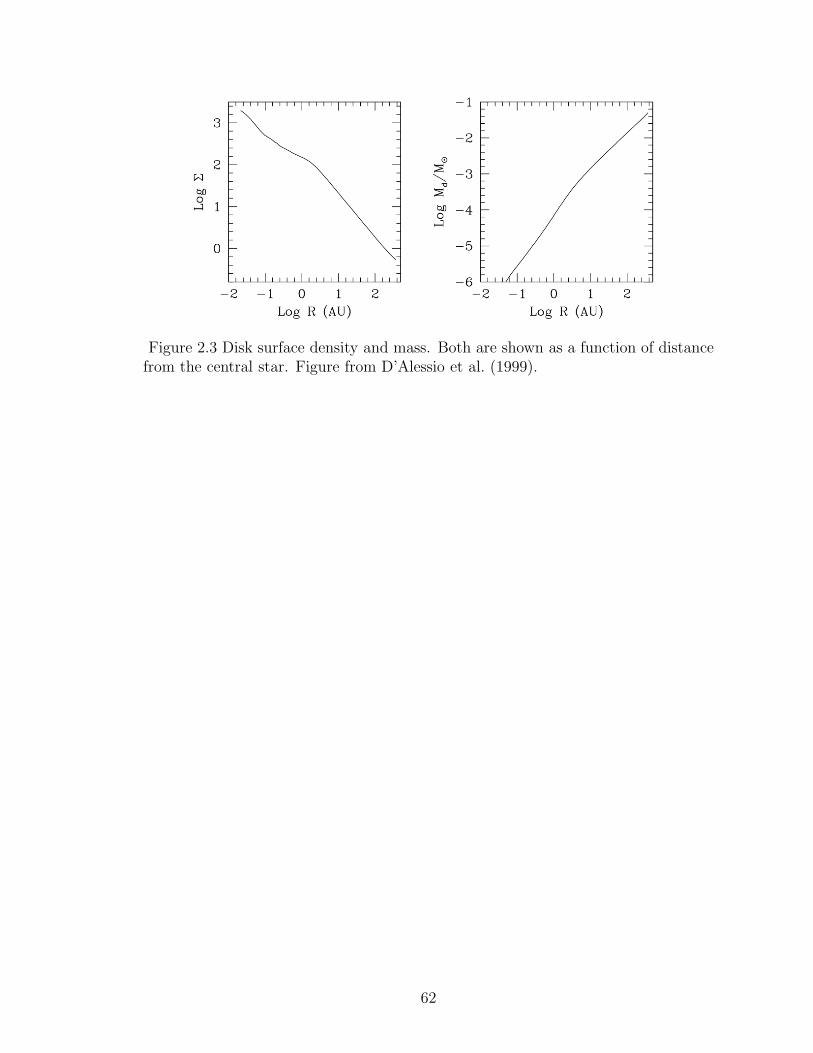
Figure 2.3 Disk surface density and mass. Both are shown as a function of distancefrom the central star. Figure from D’Alessio et al. (1999).
62

Figure 2.4 Relationship between dust opacity, grain size, and wavelength. Top panelscorrespond to a grain size distribution with p = 3.5 and bottom panels have p = 2.5.Grains with amax = 1 μm (dashed line), 1 mm (solid line), and 10 cm (dotted line)are shown. In the left panels, the dust is at a temperature of 100 K and consists ofsilicates, troilite, water ice, and organics (Pollack et al., 1994). In the right panels,the dust is at a temperature of 300 K and ice has been sublimated. The emission at10 μm is dominated by silicates and it decreases as the maximum grain size increases.Figure from D’Alessio et al. (2001).
63

1 10 1000.01
0.1
1
10
100
Figure 2.5 Dust opacity for silicate grains. We show dust opacities for astronomicalsilicates (broken black line) from Draine & Lee (1984) and olivine silicates (solid redline) from Dorschner et al. (1995).
64

0.01 0.1 1 10 100 10000.001
0.01
0.1
1
10
100
1000
0.01 0.1 1 10 100 10000.001
0.01
0.1
1
10
100
1000
0.01 0.1 1 10 100 10000.001
0.01
0.1
1
10
100
1000
0.01 0.1 1 10 100 10000.001
0.01
0.1
1
10
100
1000
0.01 0.1 1 10 100 10000.001
0.01
0.1
1
10
100
1000
0.01 0.1 1 10 100 10000.001
0.01
0.1
1
10
100
1000
0.01 0.1 1 10 100 10000.001
0.01
0.1
1
10
100
1000
0.01 0.1 1 10 100 10000.001
0.01
0.1
1
10
100
1000
0.01 0.1 1 10 100 10000.001
0.01
0.1
1
10
100
1000
0.01 0.1 1 10 100 10000.001
0.01
0.1
1
10
100
1000
0.01 0.1 1 10 100 10000.001
0.01
0.1
1
10
100
1000
0.01 0.1 1 10 100 10000.001
0.01
0.1
1
10
100
1000
0.01 0.1 1 10 100 10000.001
0.01
0.1
1
10
100
1000
0.01 0.1 1 10 100 10000.001
0.01
0.1
1
10
100
1000
Figure 2.6 Rosseland mean optical depth of disk models with M∗=0.5 M�. τR wasintegrated vertically from the midplane to the disk surface and is shown as a functionof radial location in the disk. The disk is optically thick to its own radiation whenτR > 1. Clockwise from top left, panels correspond to disks with mass accretion ratesof 10−10, 10−9, 10−7, and 10−8 M� yr−1. We show τR for ε = 0.001 (dark blue), 0.01(red), 0.1 (green), and 1.0 (cyan).
65
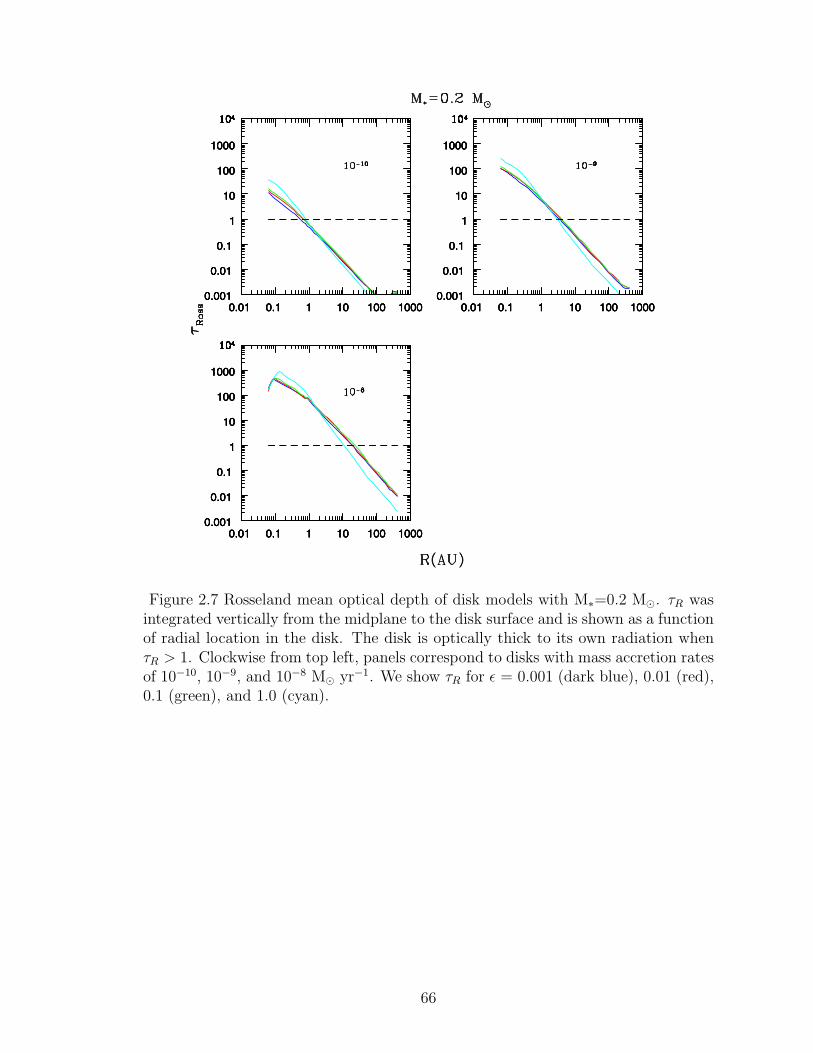
0.01 0.1 1 10 100 10000.001
0.01
0.1
1
10
100
1000
0.01 0.1 1 10 100 10000.001
0.01
0.1
1
10
100
1000
0.01 0.1 1 10 100 10000.001
0.01
0.1
1
10
100
1000
0.01 0.1 1 10 100 10000.001
0.01
0.1
1
10
100
1000
0.01 0.1 1 10 100 10000.001
0.01
0.1
1
10
100
1000
0.01 0.1 1 10 100 10000.001
0.01
0.1
1
10
100
1000
0.01 0.1 1 10 100 10000.001
0.01
0.1
1
10
100
1000
0.01 0.1 1 10 100 10000.001
0.01
0.1
1
10
100
1000
0.01 0.1 1 10 100 10000.001
0.01
0.1
1
10
100
1000
0.01 0.1 1 10 100 10000.001
0.01
0.1
1
10
100
1000
0.01 0.1 1 10 100 10000.001
0.01
0.1
1
10
100
1000
0.01 0.1 1 10 100 10000.001
0.01
0.1
1
10
100
1000
Figure 2.7 Rosseland mean optical depth of disk models with M∗=0.2 M�. τR wasintegrated vertically from the midplane to the disk surface and is shown as a functionof radial location in the disk. The disk is optically thick to its own radiation whenτR > 1. Clockwise from top left, panels correspond to disks with mass accretion ratesof 10−10, 10−9, and 10−8 M� yr−1. We show τR for ε = 0.001 (dark blue), 0.01 (red),0.1 (green), and 1.0 (cyan).
66
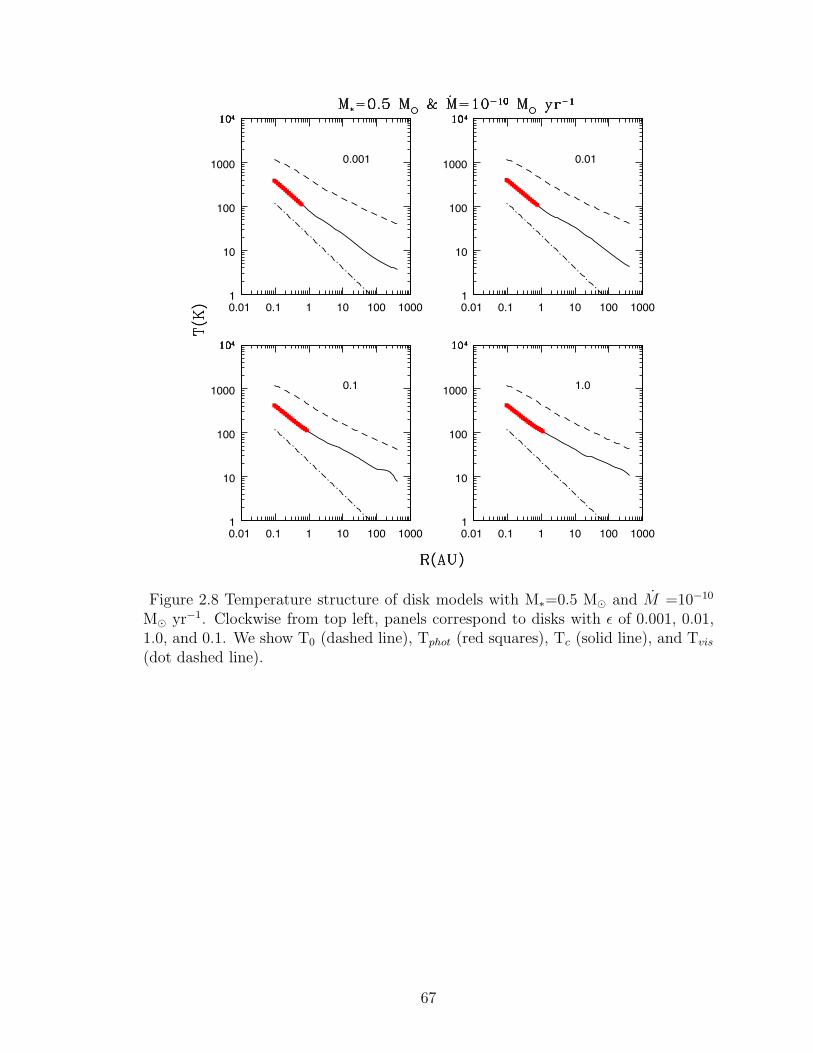
0.001
0.01 0.1 1 10 100 10001
10
100
1000 0.01
0.01 0.1 1 10 100 10001
10
100
1000
0.1
0.01 0.1 1 10 100 10001
10
100
1000 1.0
0.01 0.1 1 10 100 10001
10
100
1000
Figure 2.8 Temperature structure of disk models with M∗=0.5 M� and M =10−10
M� yr−1. Clockwise from top left, panels correspond to disks with ε of 0.001, 0.01,1.0, and 0.1. We show T0 (dashed line), Tphot (red squares), Tc (solid line), and Tvis
(dot dashed line).
67
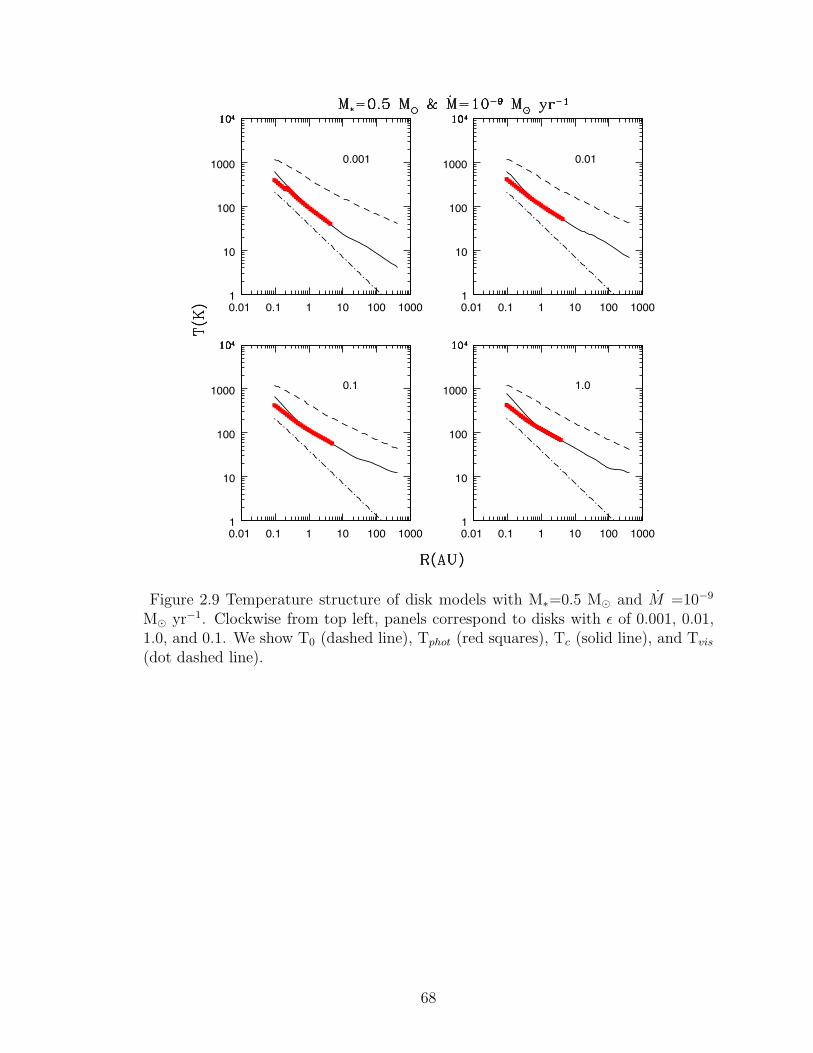
0.001
0.01 0.1 1 10 100 10001
10
100
1000 0.01
0.01 0.1 1 10 100 10001
10
100
1000
0.1
0.01 0.1 1 10 100 10001
10
100
1000 1.0
0.01 0.1 1 10 100 10001
10
100
1000
Figure 2.9 Temperature structure of disk models with M∗=0.5 M� and M =10−9
M� yr−1. Clockwise from top left, panels correspond to disks with ε of 0.001, 0.01,1.0, and 0.1. We show T0 (dashed line), Tphot (red squares), Tc (solid line), and Tvis
(dot dashed line).
68
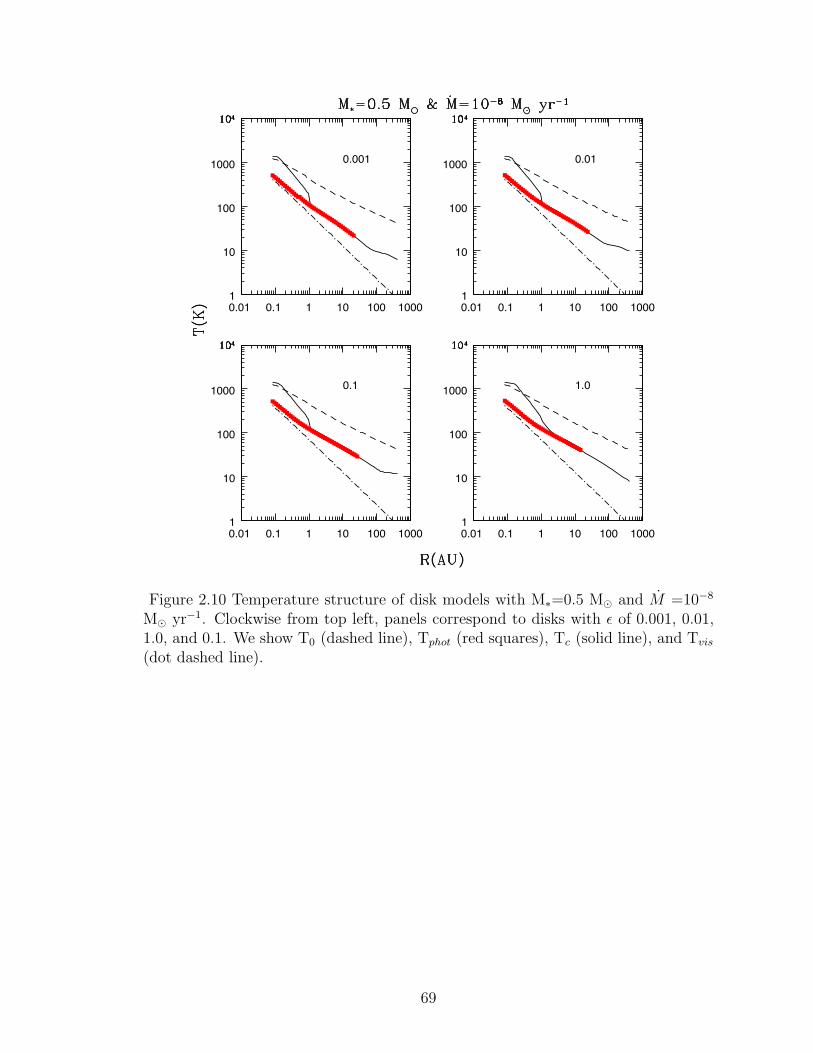
0.001
0.01 0.1 1 10 100 10001
10
100
1000 0.01
0.01 0.1 1 10 100 10001
10
100
1000
0.1
0.01 0.1 1 10 100 10001
10
100
1000 1.0
0.01 0.1 1 10 100 10001
10
100
1000
Figure 2.10 Temperature structure of disk models with M∗=0.5 M� and M =10−8
M� yr−1. Clockwise from top left, panels correspond to disks with ε of 0.001, 0.01,1.0, and 0.1. We show T0 (dashed line), Tphot (red squares), Tc (solid line), and Tvis
(dot dashed line).
69

0.001
0.01 0.1 1 10 100 10001
10
100
1000 0.01
0.01 0.1 1 10 100 10001
10
100
1000
Figure 2.11 Temperature structure of disk models with M∗=0.5 M� and M =10−7
M� yr−1. Left and right panels correspond to disks with ε of 0.001 and 0.01, respec-tively. We show T0 (dashed line), Tphot (red squares), Tc (solid line), and Tvis (dotdashed line).
70
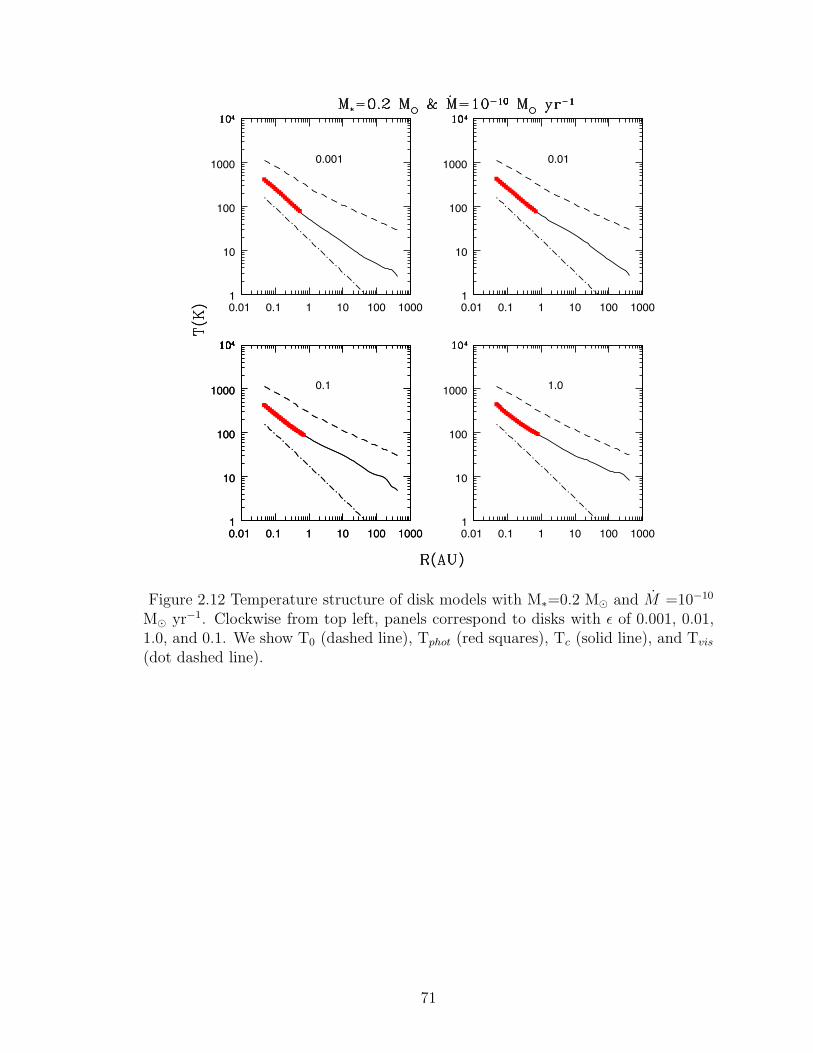
0.001
0.01 0.1 1 10 100 10001
10
100
1000 0.01
0.01 0.1 1 10 100 10001
10
100
1000
0.01 0.1 1 10 100 10001
10
100
1000 0.1
0.01 0.1 1 10 100 10001
10
100
1000 1.0
0.01 0.1 1 10 100 10001
10
100
1000
Figure 2.12 Temperature structure of disk models with M∗=0.2 M� and M =10−10
M� yr−1. Clockwise from top left, panels correspond to disks with ε of 0.001, 0.01,1.0, and 0.1. We show T0 (dashed line), Tphot (red squares), Tc (solid line), and Tvis
(dot dashed line).
71

0.001
0.01 0.1 1 10 100 10001
10
100
1000 0.01
0.01 0.1 1 10 100 10001
10
100
1000
0.1
0.01 0.1 1 10 100 10001
10
100
1000 0.1
0.01 0.1 1 10 100 10001
10
100
1000
Figure 2.13 Temperature structure of disk models with M∗=0.2 M� and M =10−9
M� yr−1. Clockwise from top left, panels correspond to disks with ε of 0.001, 0.01,1.0, and 0.1. We show T0 (dashed line), Tphot (red squares), Tc (solid line), and Tvis
(dot dashed line).
72

0.001
0.01 0.1 1 10 100 10001
10
100
1000 0.01
0.01 0.1 1 10 100 10001
10
100
1000
0.01 0.1 1 10 100 10001
10
100
1000 0.1
0.01 0.1 1 10 100 10001
10
100
1000 1.0
0.01 0.1 1 10 100 10001
10
100
1000
Figure 2.14 Temperature structure of disk models with M∗=0.2 M� and M =10−8
M� yr−1. Clockwise from top left, panels correspond to disks with ε of 0.001, 0.01,1.0, and 0.1. We show T0 (dashed line), Tphot (red squares), Tc (solid line), and Tvis
(dot dashed line).
73
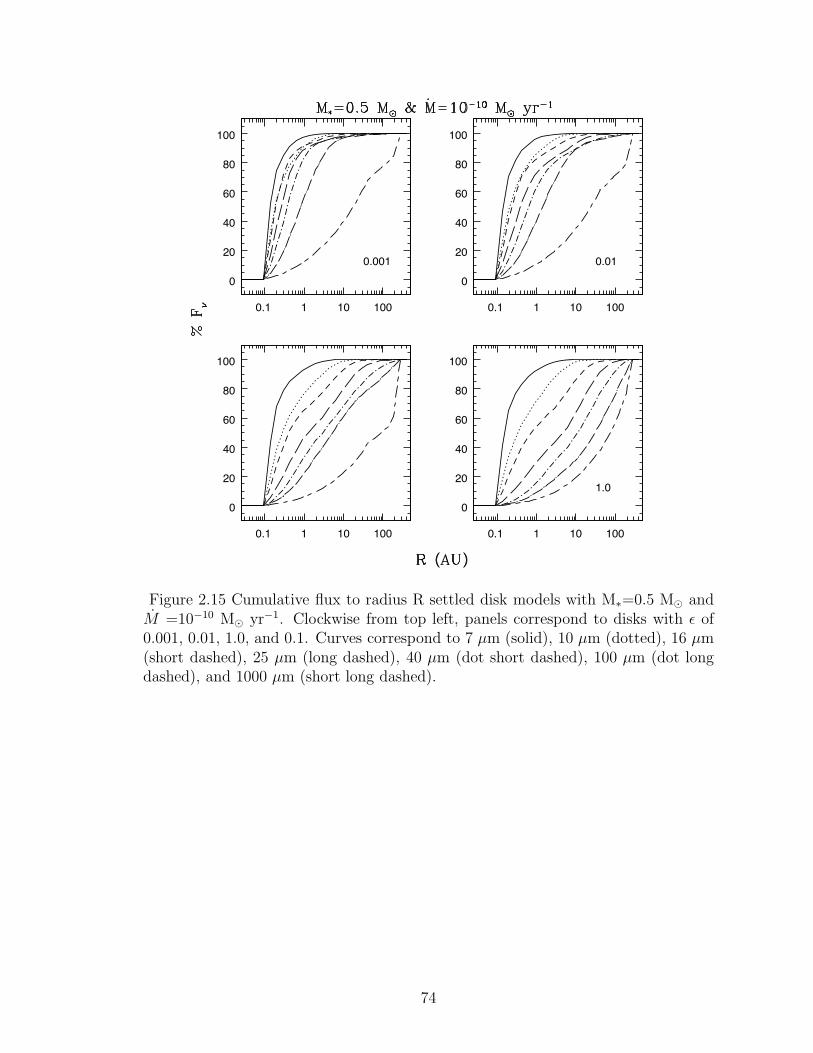
0.001
0.1 1 10 100
0
20
40
60
80
100
0.01
0.1 1 10 100
0
20
40
60
80
100
0.1 1 10 100
0
20
40
60
80
100
1.0
0.1 1 10 100
0
20
40
60
80
100
Figure 2.15 Cumulative flux to radius R settled disk models with M∗=0.5 M� andM =10−10 M� yr−1. Clockwise from top left, panels correspond to disks with ε of0.001, 0.01, 1.0, and 0.1. Curves correspond to 7 μm (solid), 10 μm (dotted), 16 μm(short dashed), 25 μm (long dashed), 40 μm (dot short dashed), 100 μm (dot longdashed), and 1000 μm (short long dashed).
74

0.001
0.1 1 10 100
0
20
40
60
80
100
0.01
0.1 1 10 100
0
20
40
60
80
100
0.1 1 10 100
0
20
40
60
80
100
1.0
0.1 1 10 100
0
20
40
60
80
100
Figure 2.16 Cumulative flux to radius R settled disk models with M∗=0.5 M� andM =10−9 M� yr−1. Clockwise from top left, panels correspond to disks with ε of0.001, 0.01, 1.0, and 0.1. Curves correspond to 7 μm (solid), 10 μm (dotted), 16 μm(short dashed), 25 μm (long dashed), 40 μm (dot short dashed), 100 μm (dot longdashed), and 1000 μm (short long dashed).
75
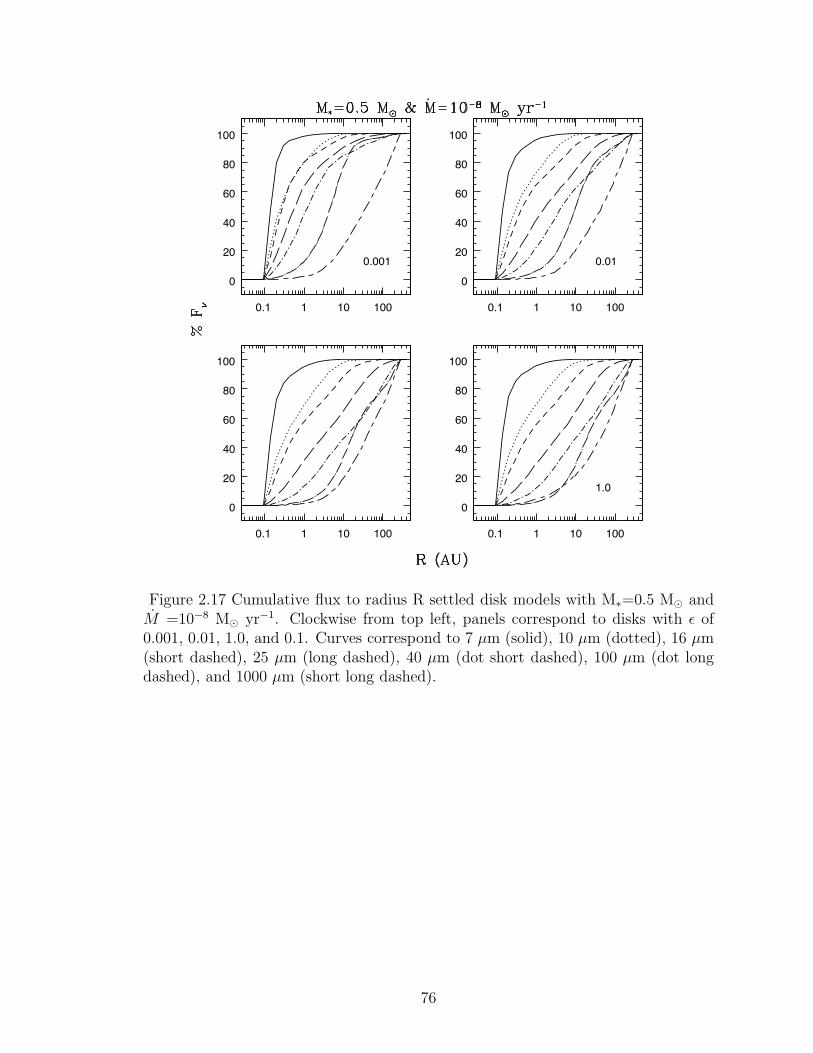
0.001
0.1 1 10 100
0
20
40
60
80
100
0.01
0.1 1 10 100
0
20
40
60
80
100
0.1 1 10 100
0
20
40
60
80
100
1.0
0.1 1 10 100
0
20
40
60
80
100
Figure 2.17 Cumulative flux to radius R settled disk models with M∗=0.5 M� andM =10−8 M� yr−1. Clockwise from top left, panels correspond to disks with ε of0.001, 0.01, 1.0, and 0.1. Curves correspond to 7 μm (solid), 10 μm (dotted), 16 μm(short dashed), 25 μm (long dashed), 40 μm (dot short dashed), 100 μm (dot longdashed), and 1000 μm (short long dashed).
76
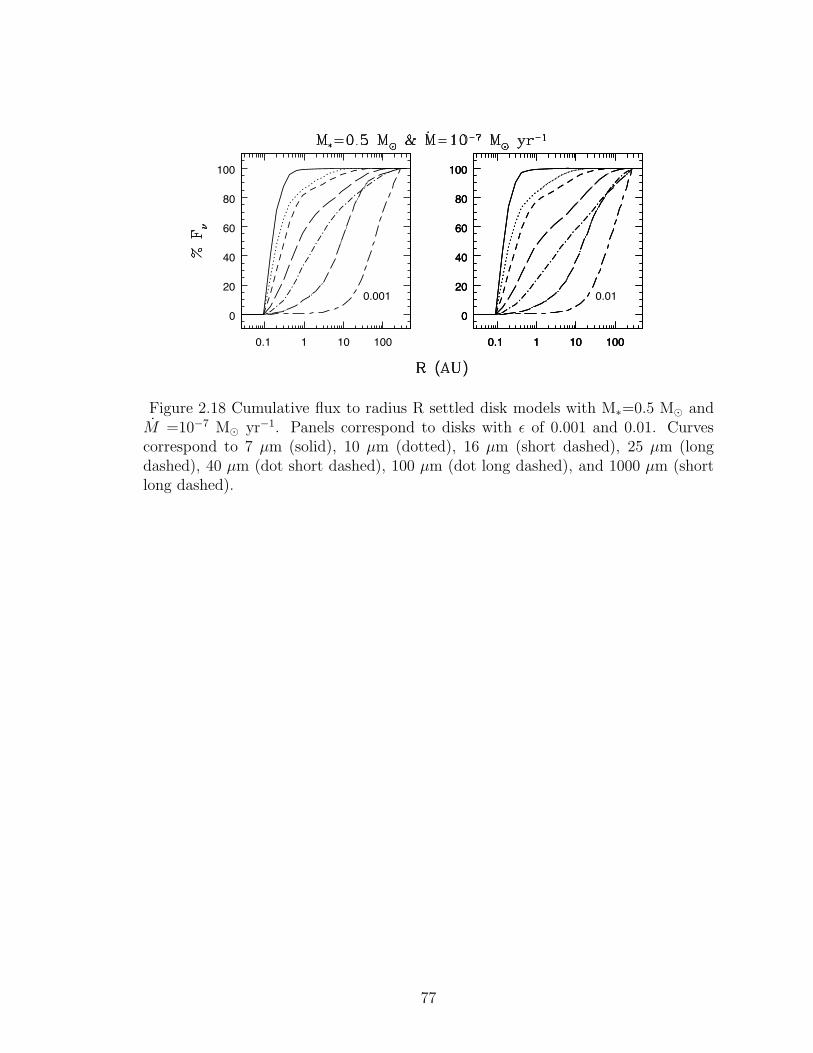
0.001
0.1 1 10 100
0
20
40
60
80
100
0.01
0.1 1 10 100
0
20
40
60
80
100
0.1 1 10 100
0
20
40
60
80
100
0.1 1 10 100
0
20
40
60
80
100
Figure 2.18 Cumulative flux to radius R settled disk models with M∗=0.5 M� andM =10−7 M� yr−1. Panels correspond to disks with ε of 0.001 and 0.01. Curvescorrespond to 7 μm (solid), 10 μm (dotted), 16 μm (short dashed), 25 μm (longdashed), 40 μm (dot short dashed), 100 μm (dot long dashed), and 1000 μm (shortlong dashed).
77
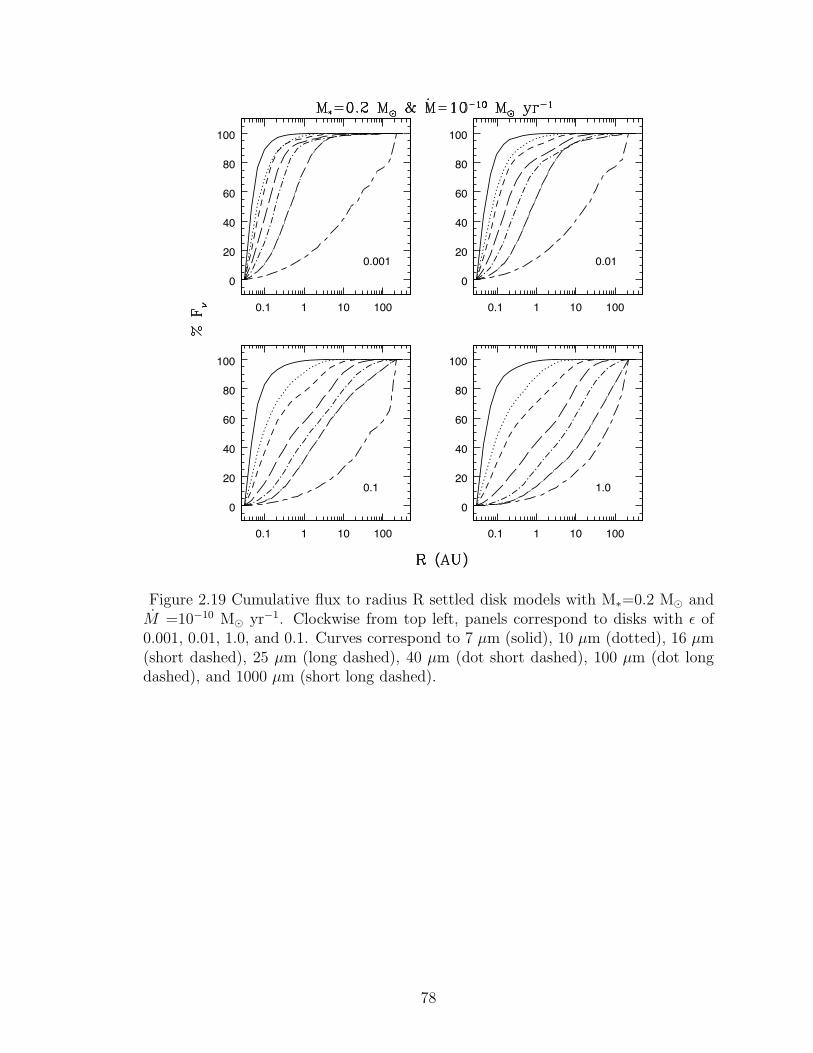
0.001
0.1 1 10 100
0
20
40
60
80
100
0.01
0.1 1 10 100
0
20
40
60
80
100
0.1
0.1 1 10 100
0
20
40
60
80
100
1.0
0.1 1 10 100
0
20
40
60
80
100
Figure 2.19 Cumulative flux to radius R settled disk models with M∗=0.2 M� andM =10−10 M� yr−1. Clockwise from top left, panels correspond to disks with ε of0.001, 0.01, 1.0, and 0.1. Curves correspond to 7 μm (solid), 10 μm (dotted), 16 μm(short dashed), 25 μm (long dashed), 40 μm (dot short dashed), 100 μm (dot longdashed), and 1000 μm (short long dashed).
78
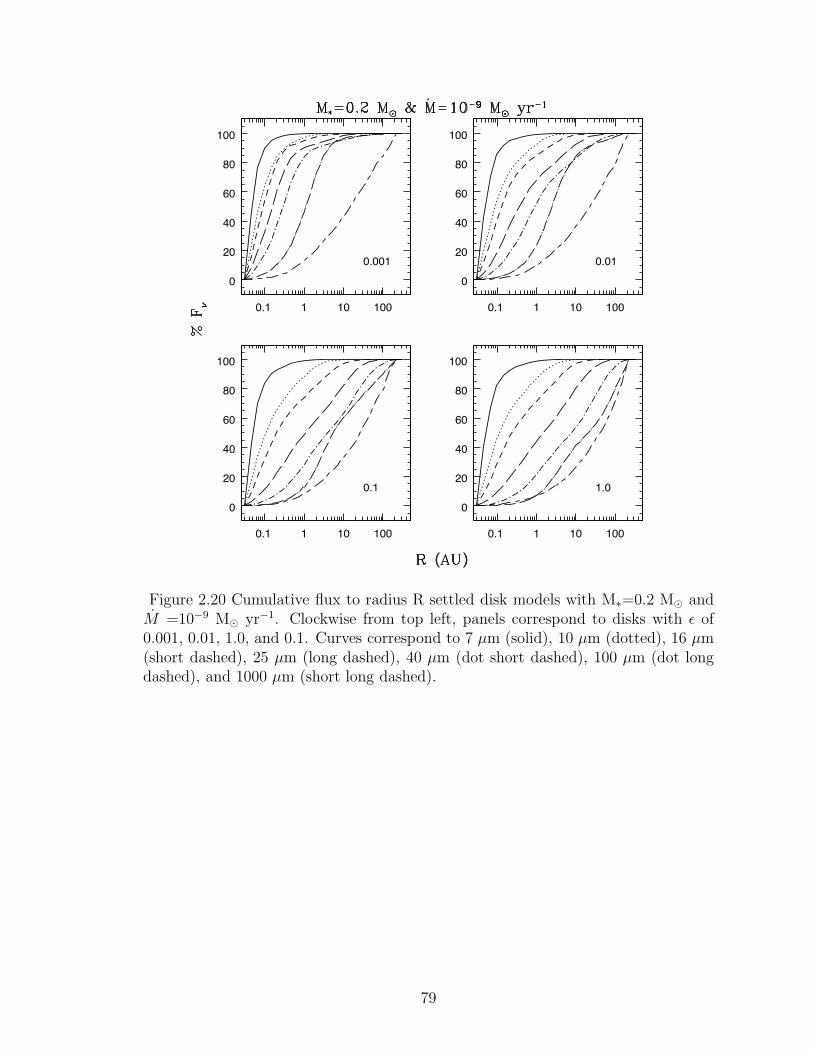
0.001
0.1 1 10 100
0
20
40
60
80
100
0.01
0.1 1 10 100
0
20
40
60
80
100
0.1
0.1 1 10 100
0
20
40
60
80
100
1.0
0.1 1 10 100
0
20
40
60
80
100
Figure 2.20 Cumulative flux to radius R settled disk models with M∗=0.2 M� andM =10−9 M� yr−1. Clockwise from top left, panels correspond to disks with ε of0.001, 0.01, 1.0, and 0.1. Curves correspond to 7 μm (solid), 10 μm (dotted), 16 μm(short dashed), 25 μm (long dashed), 40 μm (dot short dashed), 100 μm (dot longdashed), and 1000 μm (short long dashed).
79
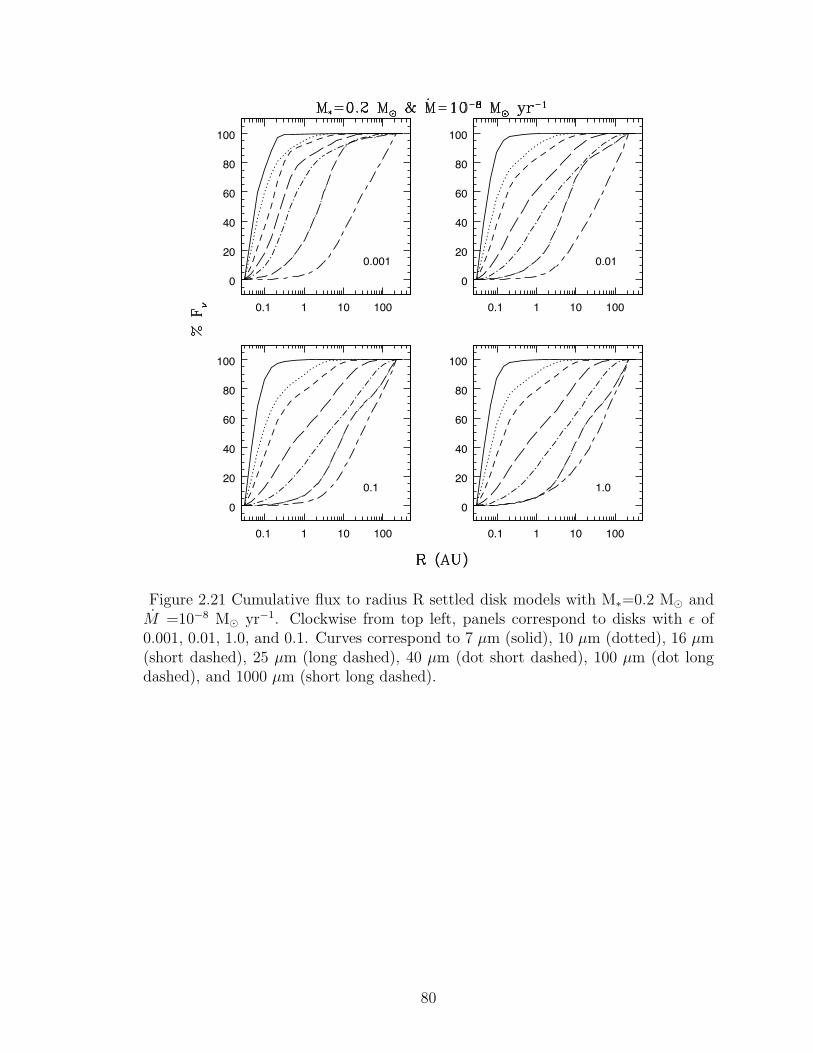
0.001
0.1 1 10 100
0
20
40
60
80
100
0.01
0.1 1 10 100
0
20
40
60
80
100
0.1
0.1 1 10 100
0
20
40
60
80
100
1.0
0.1 1 10 100
0
20
40
60
80
100
Figure 2.21 Cumulative flux to radius R settled disk models with M∗=0.2 M� andM =10−8 M� yr−1. Clockwise from top left, panels correspond to disks with ε of0.001, 0.01, 1.0, and 0.1. Curves correspond to 7 μm (solid), 10 μm (dotted), 16 μm(short dashed), 25 μm (long dashed), 40 μm (dot short dashed), 100 μm (dot longdashed), and 1000 μm (short long dashed).
80
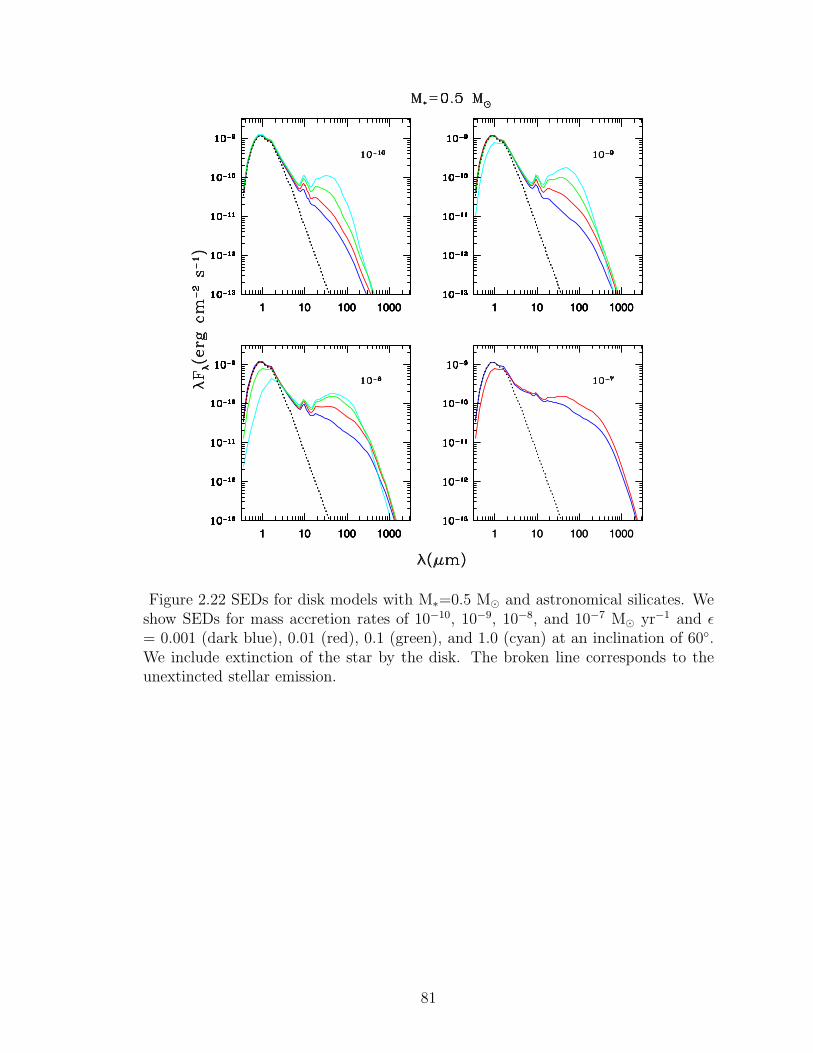
1 10 100 10001 10 100 10001 10 100 10001 10 100 1000 1 10 100 10001 10 100 10001 10 100 10001 10 100 1000
1 10 100 10001 10 100 10001 10 100 10001 10 100 1000 1 10 100 10001 10 100 1000
Figure 2.22 SEDs for disk models with M∗=0.5 M� and astronomical silicates. Weshow SEDs for mass accretion rates of 10−10, 10−9, 10−8, and 10−7 M� yr−1 and ε= 0.001 (dark blue), 0.01 (red), 0.1 (green), and 1.0 (cyan) at an inclination of 60◦.We include extinction of the star by the disk. The broken line corresponds to theunextincted stellar emission.
81

1 10 100 10001 10 100 10001 10 100 10001 10 100 1000 1 10 100 10001 10 100 10001 10 100 10001 10 100 1000
1 10 100 10001 10 100 10001 10 100 10001 10 100 1000
Figure 2.23 SEDs for disk models with M∗=0.2 M� and astronomical silicates. Weshow SEDs for mass accretion rates of 10−10, 10−9, 10−8, and 10−7 M� yr−1 and ε= 0.001 (dark blue), 0.01 (red), 0.1 (green), and 1.0 (cyan) at an inclination of 60◦.We include extinction of the star by the disk. The broken line corresponds to theunextincted stellar emission.
82

1 10 100 10001 10 100 10001 10 100 10001 10 100 1000
0.001
1 10 100 10001 10 100 10001 10 100 10001 10 100 1000
0.01
1 10 100 10001 10 100 10001 10 100 10001 10 100 1000
0.1
1 10 100 10001 10 100 10001 10 100 10001 10 100 1000
1.0
Figure 2.24 SEDs for disk models at different inclinations with M∗=0.5 M� andastronomical silicates. We show SEDs with a mass accretion rate of 10−8 M� yr−1
and ε = 0.001, 0.01, 0.1, and 1.0 for inclinations of 20◦ (cyan), 40◦ (green), 60◦ (red),and 80◦ (dark blue). In the cases where i = 80◦, we plot the scattered emission(broken dark blue line) and the thermal emission (solid dark blue line) separately.
83
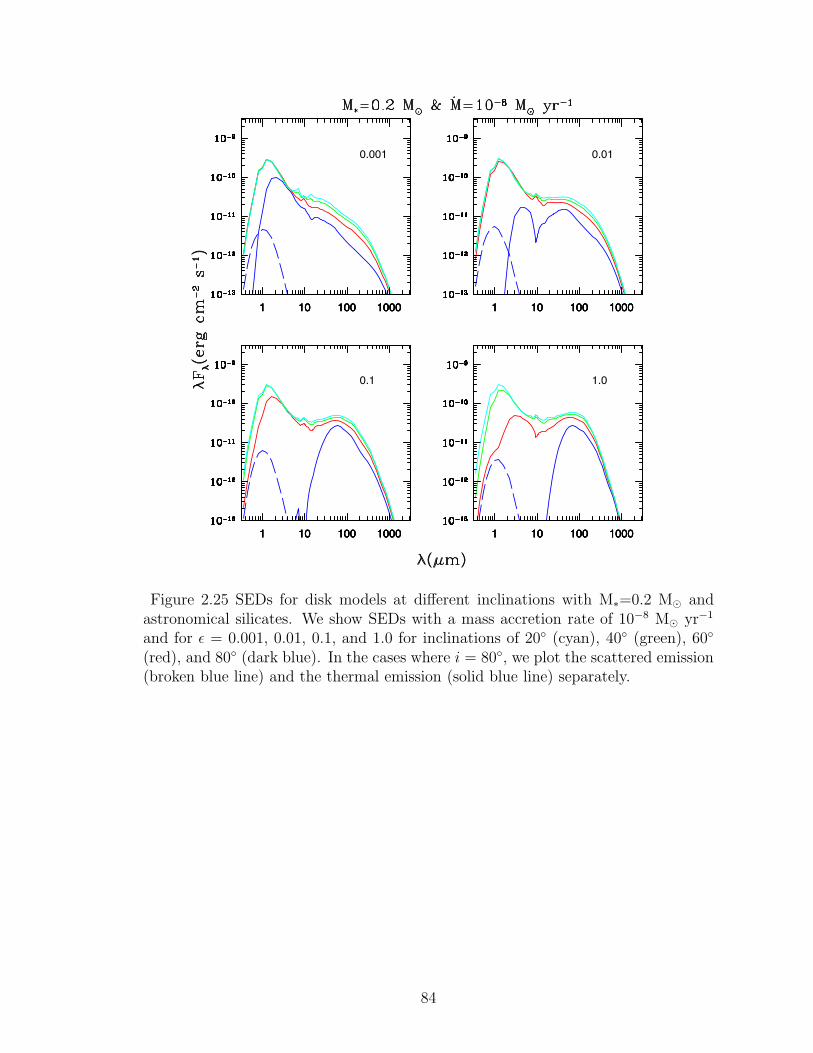
1 10 100 10001 10 100 10001 10 100 10001 10 100 1000
0.001
1 10 100 10001 10 100 10001 10 100 10001 10 100 1000
0.01
1 10 100 10001 10 100 10001 10 100 10001 10 100 1000
0.1
1 10 100 10001 10 100 10001 10 100 10001 10 100 1000
1.0
Figure 2.25 SEDs for disk models at different inclinations with M∗=0.2 M� andastronomical silicates. We show SEDs with a mass accretion rate of 10−8 M� yr−1
and for ε = 0.001, 0.01, 0.1, and 1.0 for inclinations of 20◦ (cyan), 40◦ (green), 60◦
(red), and 80◦ (dark blue). In the cases where i = 80◦, we plot the scattered emission(broken blue line) and the thermal emission (solid blue line) separately.
84
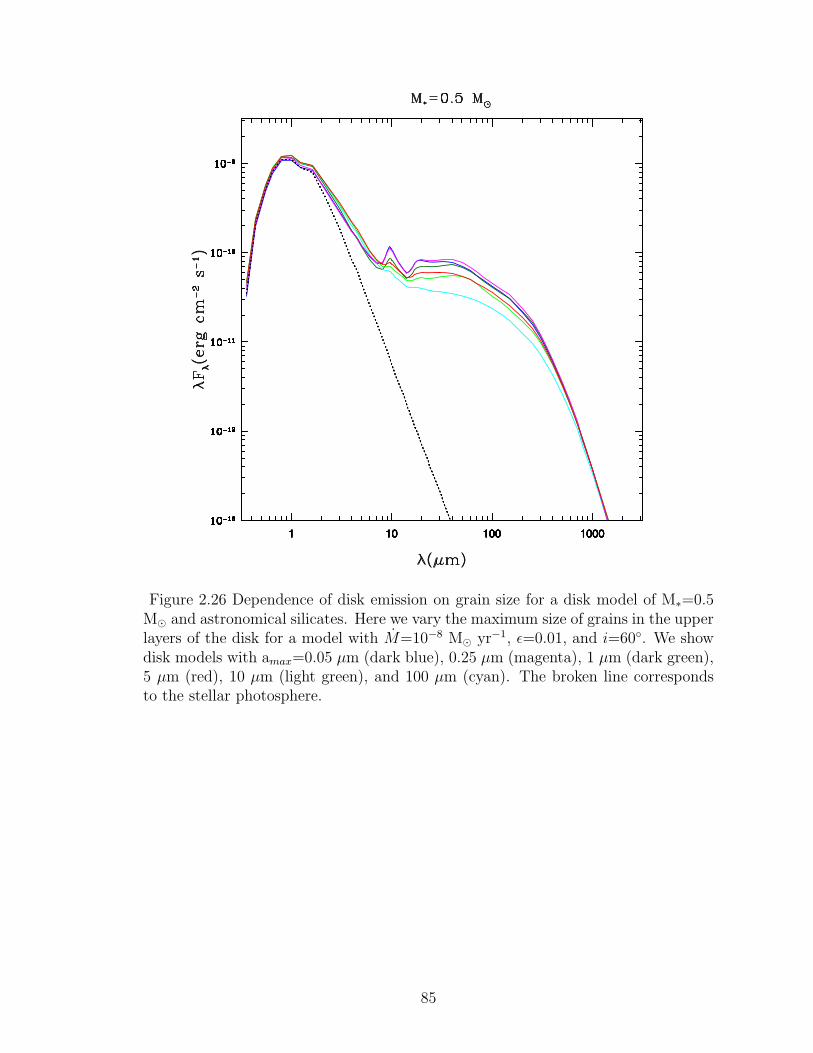
1 10 100 10001 10 100 10001 10 100 10001 10 100 10001 10 100 10001 10 100 1000
Figure 2.26 Dependence of disk emission on grain size for a disk model of M∗=0.5M� and astronomical silicates. Here we vary the maximum size of grains in the upperlayers of the disk for a model with M=10−8 M� yr−1, ε=0.01, and i=60◦. We showdisk models with amax=0.05 μm (dark blue), 0.25 μm (magenta), 1 μm (dark green),5 μm (red), 10 μm (light green), and 100 μm (cyan). The broken line correspondsto the stellar photosphere.
85
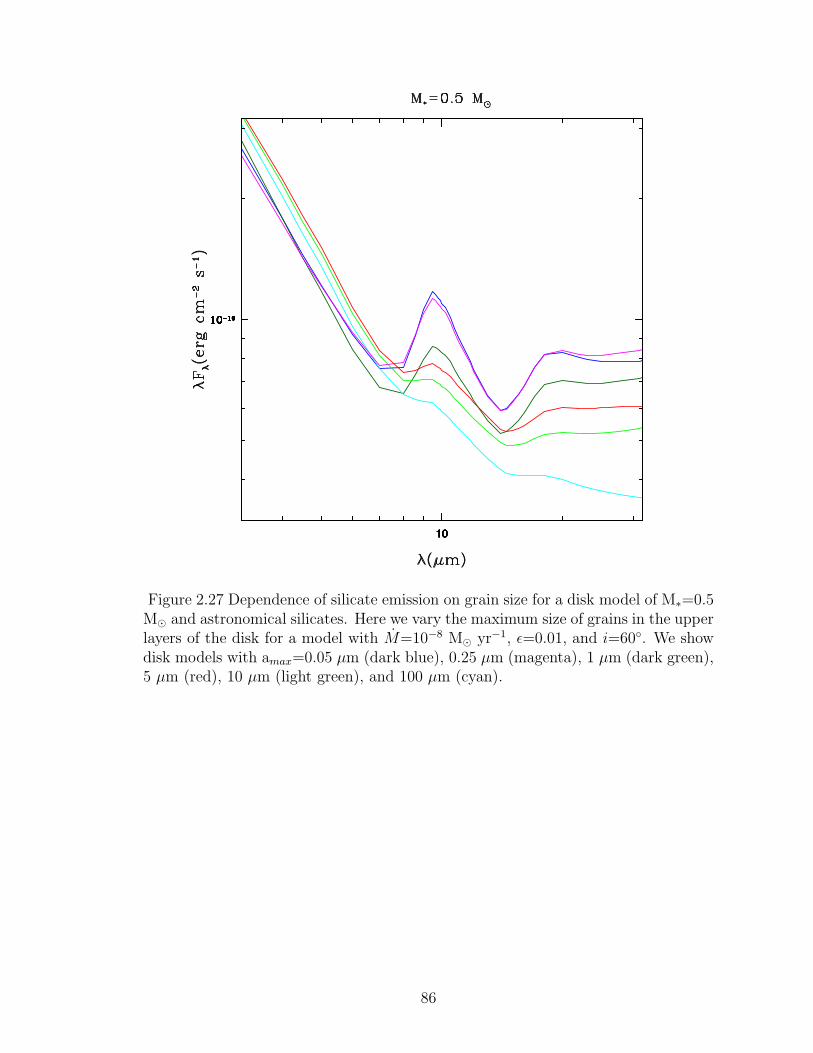
101010101010
Figure 2.27 Dependence of silicate emission on grain size for a disk model of M∗=0.5M� and astronomical silicates. Here we vary the maximum size of grains in the upperlayers of the disk for a model with M=10−8 M� yr−1, ε=0.01, and i=60◦. We showdisk models with amax=0.05 μm (dark blue), 0.25 μm (magenta), 1 μm (dark green),5 μm (red), 10 μm (light green), and 100 μm (cyan).
86
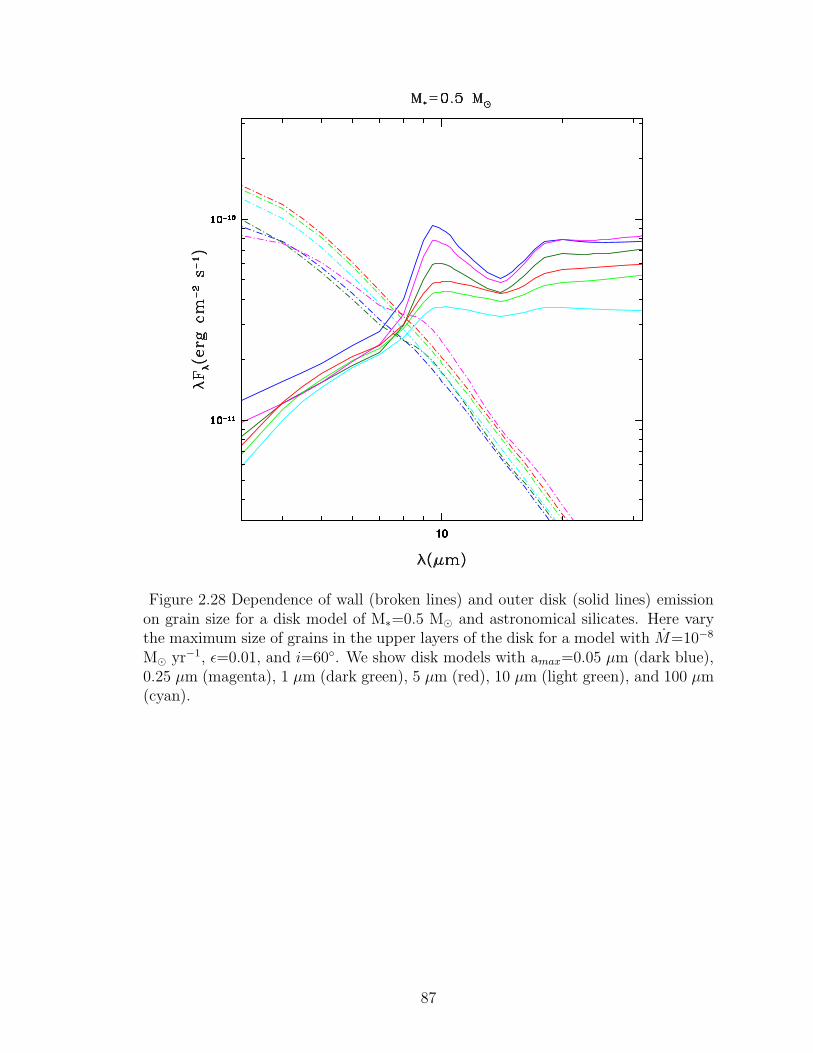
101010101010
Figure 2.28 Dependence of wall (broken lines) and outer disk (solid lines) emissionon grain size for a disk model of M∗=0.5 M� and astronomical silicates. Here varythe maximum size of grains in the upper layers of the disk for a model with M=10−8
M� yr−1, ε=0.01, and i=60◦. We show disk models with amax=0.05 μm (dark blue),0.25 μm (magenta), 1 μm (dark green), 5 μm (red), 10 μm (light green), and 100 μm(cyan).
87
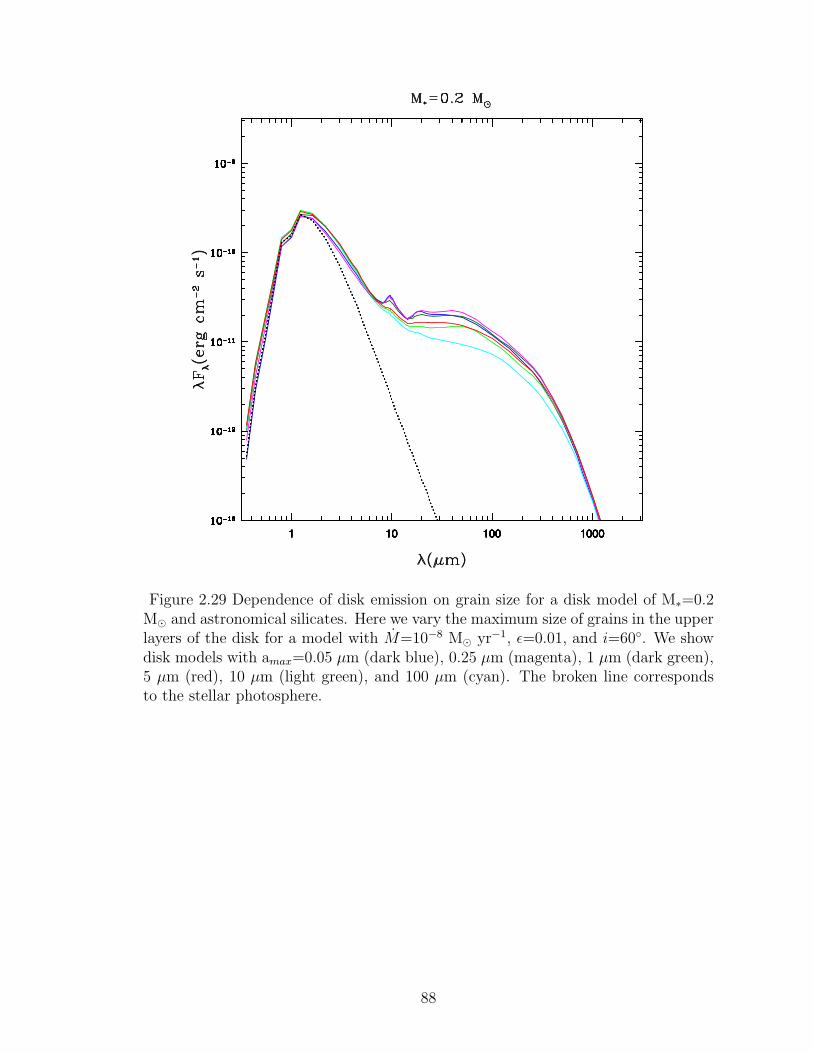
1 10 100 10001 10 100 10001 10 100 10001 10 100 10001 10 100 10001 10 100 1000
Figure 2.29 Dependence of disk emission on grain size for a disk model of M∗=0.2M� and astronomical silicates. Here we vary the maximum size of grains in the upperlayers of the disk for a model with M=10−8 M� yr−1, ε=0.01, and i=60◦. We showdisk models with amax=0.05 μm (dark blue), 0.25 μm (magenta), 1 μm (dark green),5 μm (red), 10 μm (light green), and 100 μm (cyan). The broken line correspondsto the stellar photosphere.
88
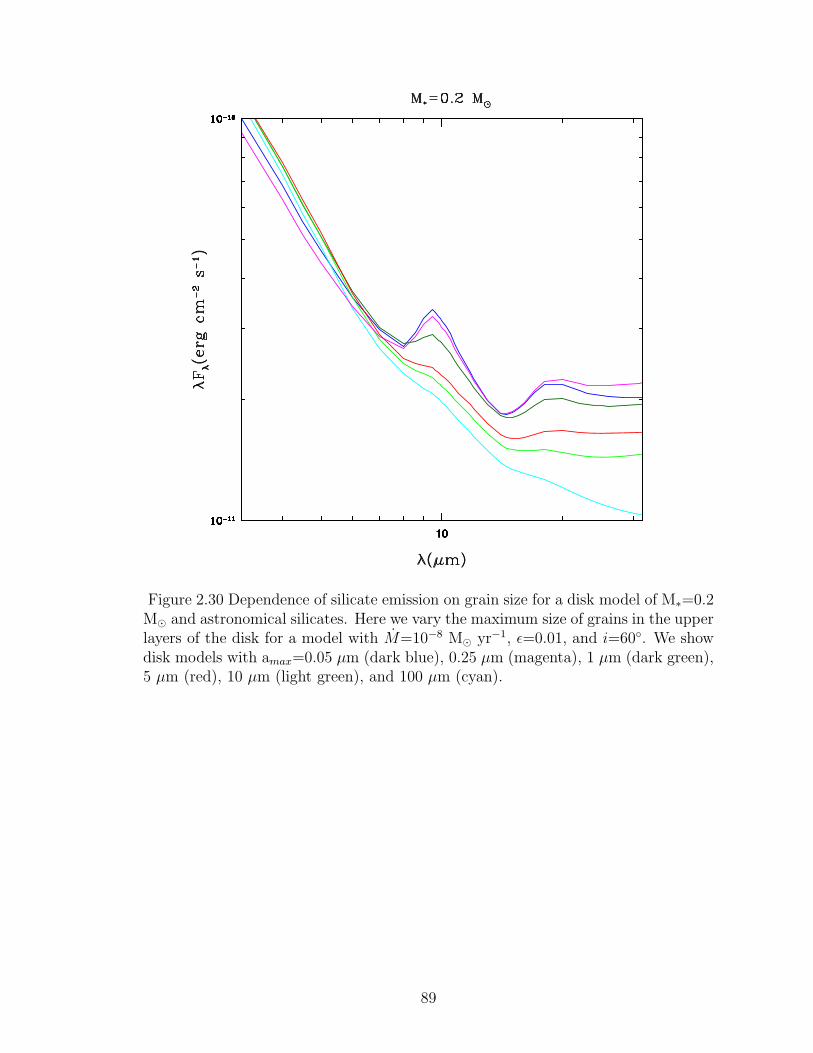
101010101010
Figure 2.30 Dependence of silicate emission on grain size for a disk model of M∗=0.2M� and astronomical silicates. Here we vary the maximum size of grains in the upperlayers of the disk for a model with M=10−8 M� yr−1, ε=0.01, and i=60◦. We showdisk models with amax=0.05 μm (dark blue), 0.25 μm (magenta), 1 μm (dark green),5 μm (red), 10 μm (light green), and 100 μm (cyan).
89
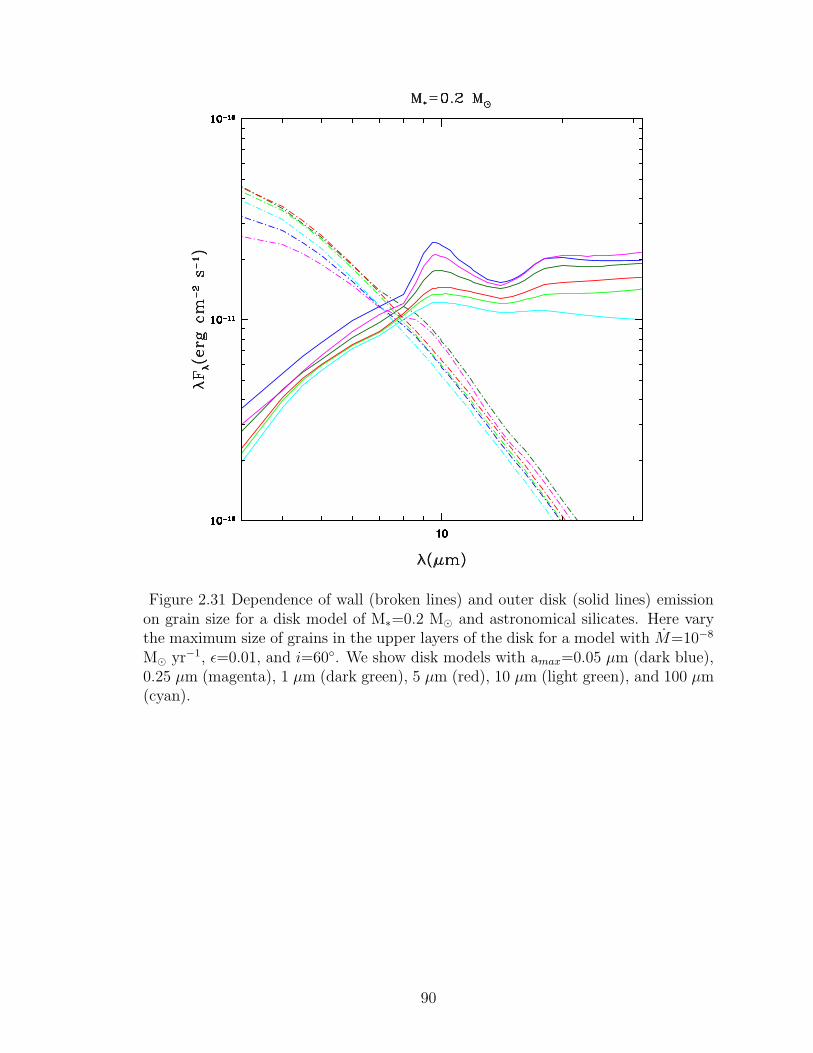
101010101010
Figure 2.31 Dependence of wall (broken lines) and outer disk (solid lines) emissionon grain size for a disk model of M∗=0.2 M� and astronomical silicates. Here varythe maximum size of grains in the upper layers of the disk for a model with M=10−8
M� yr−1, ε=0.01, and i=60◦. We show disk models with amax=0.05 μm (dark blue),0.25 μm (magenta), 1 μm (dark green), 5 μm (red), 10 μm (light green), and 100 μm(cyan).
90
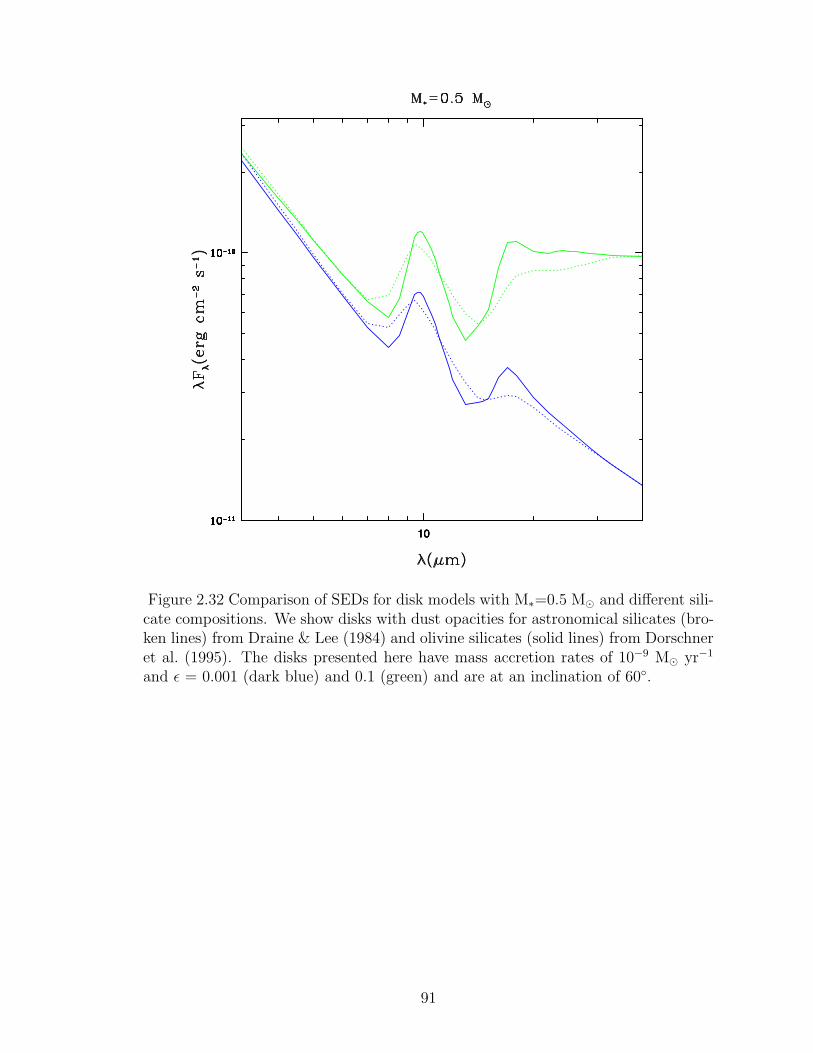
10101010
Figure 2.32 Comparison of SEDs for disk models with M∗=0.5 M� and different sili-cate compositions. We show disks with dust opacities for astronomical silicates (bro-ken lines) from Draine & Lee (1984) and olivine silicates (solid lines) from Dorschneret al. (1995). The disks presented here have mass accretion rates of 10−9 M� yr−1
and ε = 0.001 (dark blue) and 0.1 (green) and are at an inclination of 60◦.
91

10101010
Figure 2.33 Comparison of SEDs for disk models with M∗=0.2 M� and different sili-cate compositions. We show disks with dust opacities for astronomical silicates (bro-ken lines) from Draine & Lee (1984) and olivine silicates (solid lines) from Dorschneret al. (1995). The disks presented here have mass accretion rates of 10−9 M� yr−1
and ε = 0.001 (dark blue) and 0.1 (green) and are at an inclination of 60◦.
92
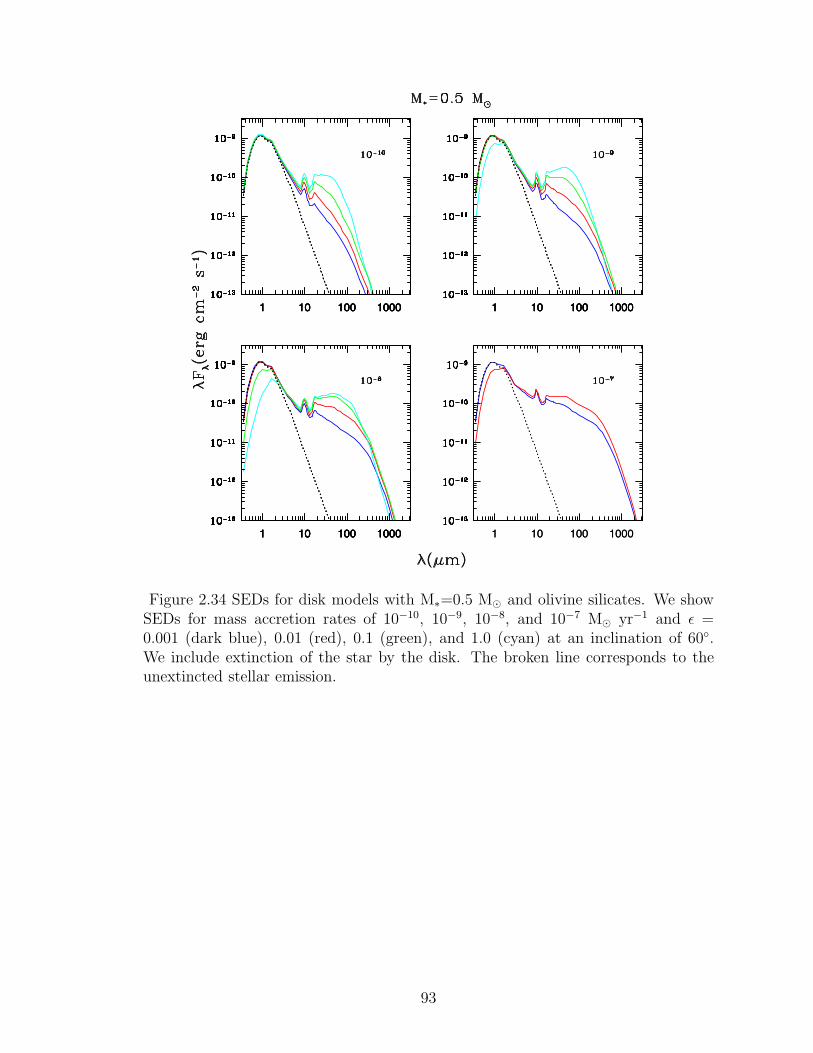
1 10 100 10001 10 100 10001 10 100 10001 10 100 1000 1 10 100 10001 10 100 10001 10 100 10001 10 100 1000
1 10 100 10001 10 100 10001 10 100 10001 10 100 1000 1 10 100 10001 10 100 1000
Figure 2.34 SEDs for disk models with M∗=0.5 M� and olivine silicates. We showSEDs for mass accretion rates of 10−10, 10−9, 10−8, and 10−7 M� yr−1 and ε =0.001 (dark blue), 0.01 (red), 0.1 (green), and 1.0 (cyan) at an inclination of 60◦.We include extinction of the star by the disk. The broken line corresponds to theunextincted stellar emission.
93
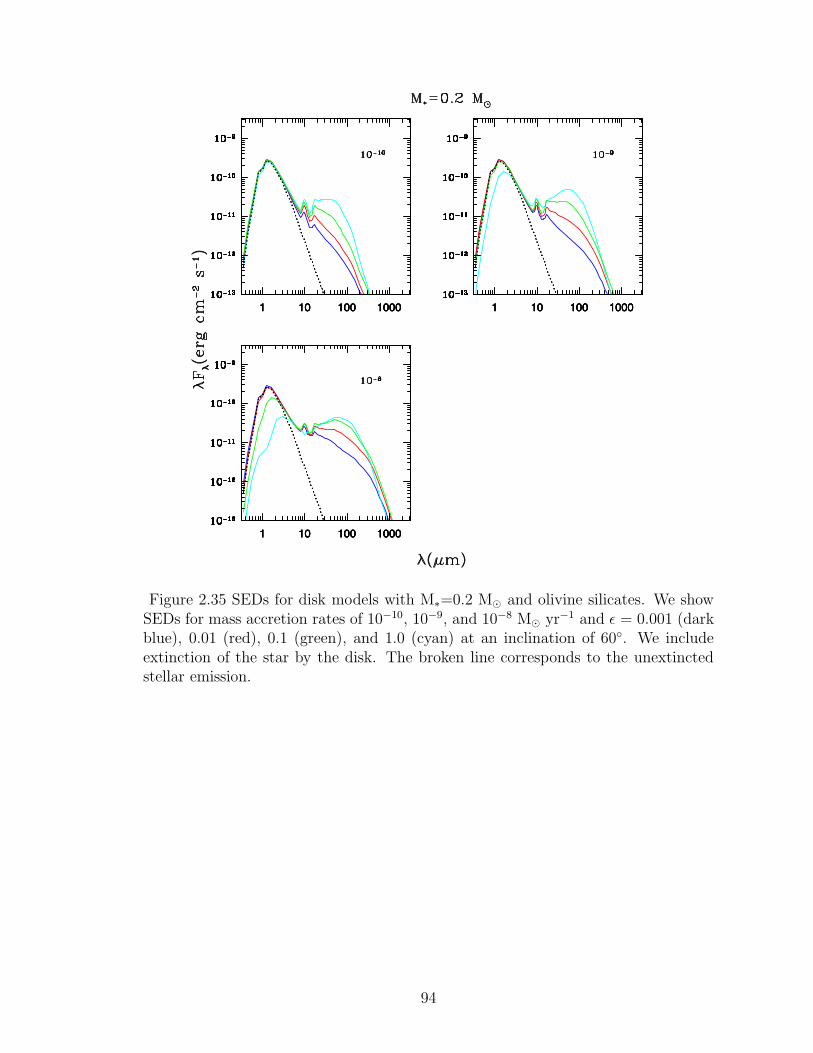
1 10 100 10001 10 100 10001 10 100 10001 10 100 1000 1 10 100 10001 10 100 10001 10 100 10001 10 100 1000
1 10 100 10001 10 100 10001 10 100 10001 10 100 1000
Figure 2.35 SEDs for disk models with M∗=0.2 M� and olivine silicates. We showSEDs for mass accretion rates of 10−10, 10−9, and 10−8 M� yr−1 and ε = 0.001 (darkblue), 0.01 (red), 0.1 (green), and 1.0 (cyan) at an inclination of 60◦. We includeextinction of the star by the disk. The broken line corresponds to the unextinctedstellar emission.
94
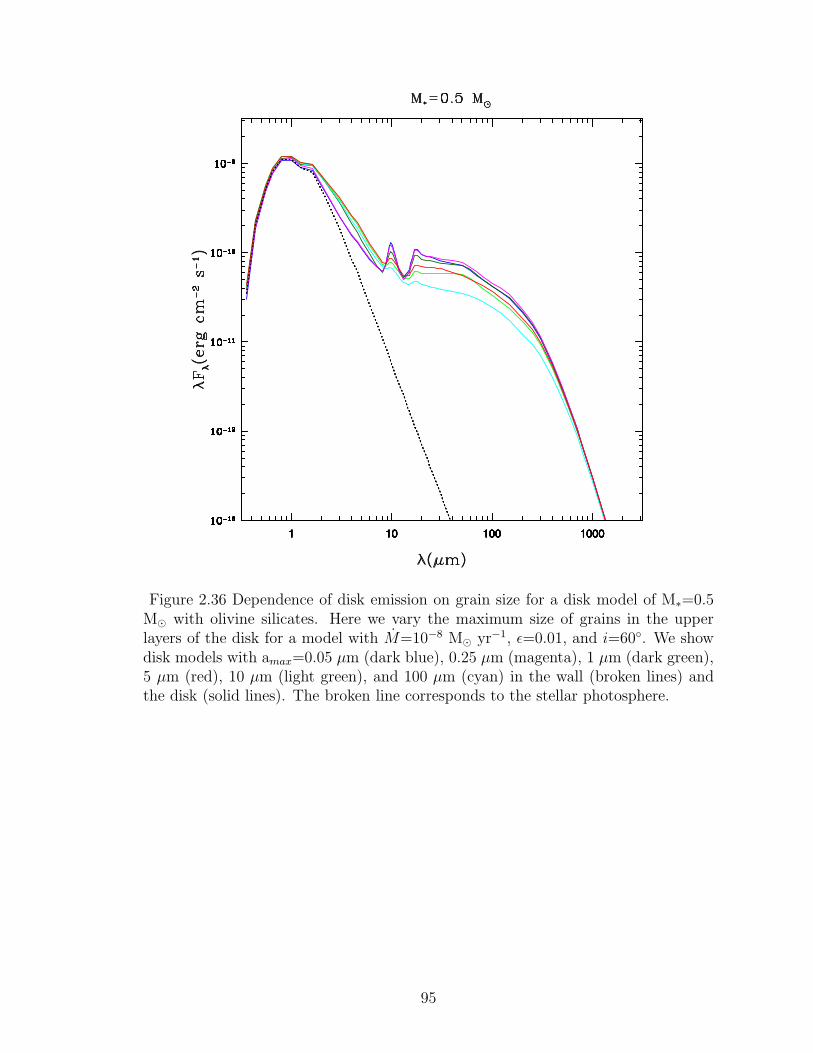
1 10 100 10001 10 100 10001 10 100 10001 10 100 10001 10 100 10001 10 100 1000
Figure 2.36 Dependence of disk emission on grain size for a disk model of M∗=0.5M� with olivine silicates. Here we vary the maximum size of grains in the upperlayers of the disk for a model with M=10−8 M� yr−1, ε=0.01, and i=60◦. We showdisk models with amax=0.05 μm (dark blue), 0.25 μm (magenta), 1 μm (dark green),5 μm (red), 10 μm (light green), and 100 μm (cyan) in the wall (broken lines) andthe disk (solid lines). The broken line corresponds to the stellar photosphere.
95
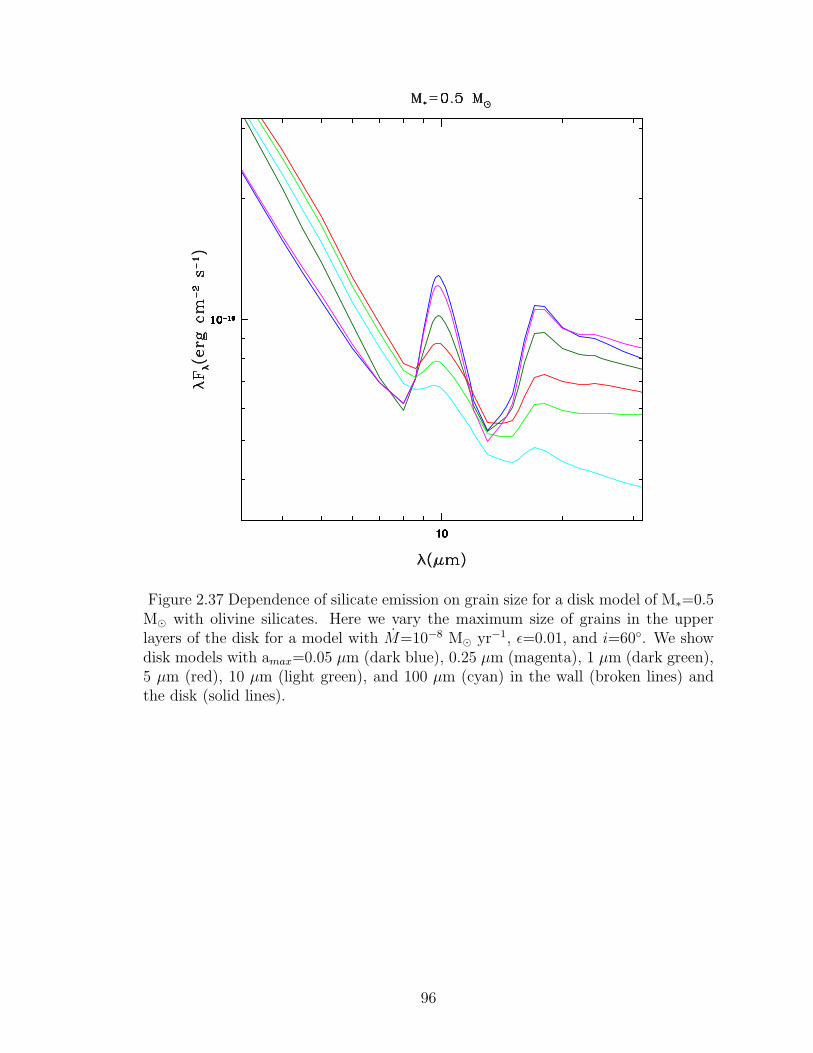
101010101010
Figure 2.37 Dependence of silicate emission on grain size for a disk model of M∗=0.5M� with olivine silicates. Here we vary the maximum size of grains in the upperlayers of the disk for a model with M=10−8 M� yr−1, ε=0.01, and i=60◦. We showdisk models with amax=0.05 μm (dark blue), 0.25 μm (magenta), 1 μm (dark green),5 μm (red), 10 μm (light green), and 100 μm (cyan) in the wall (broken lines) andthe disk (solid lines).
96
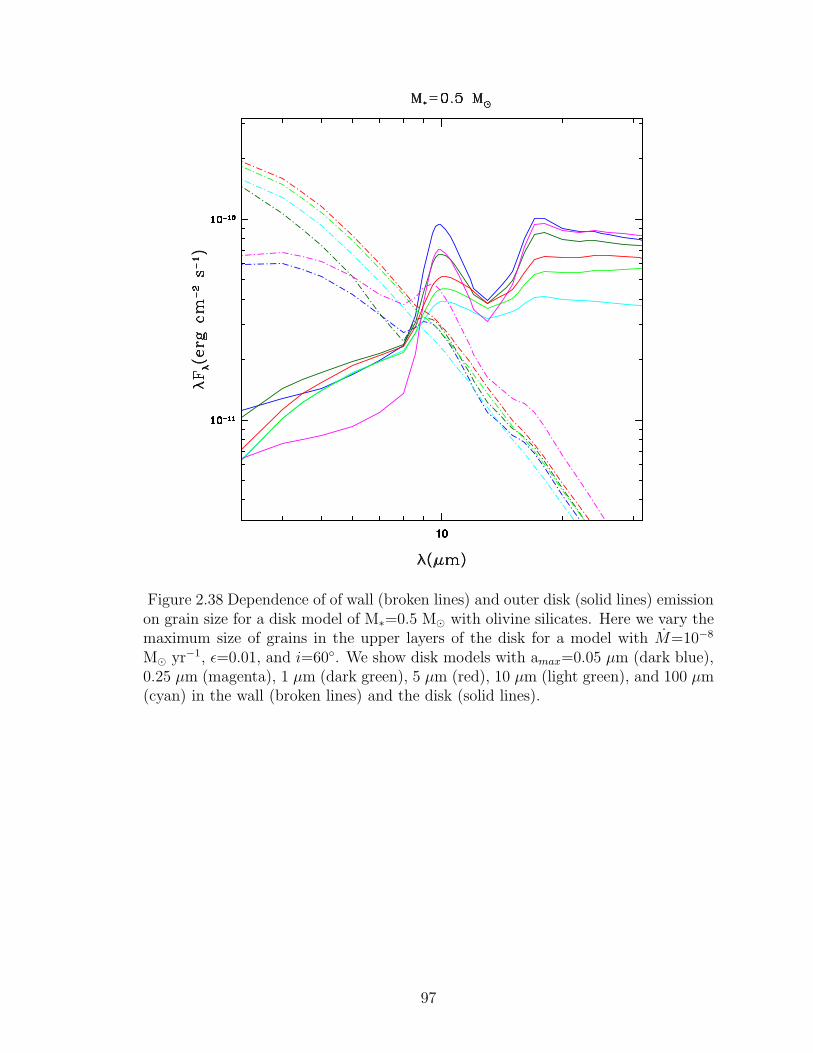
101010101010
Figure 2.38 Dependence of of wall (broken lines) and outer disk (solid lines) emissionon grain size for a disk model of M∗=0.5 M� with olivine silicates. Here we vary themaximum size of grains in the upper layers of the disk for a model with M=10−8
M� yr−1, ε=0.01, and i=60◦. We show disk models with amax=0.05 μm (dark blue),0.25 μm (magenta), 1 μm (dark green), 5 μm (red), 10 μm (light green), and 100 μm(cyan) in the wall (broken lines) and the disk (solid lines).
97
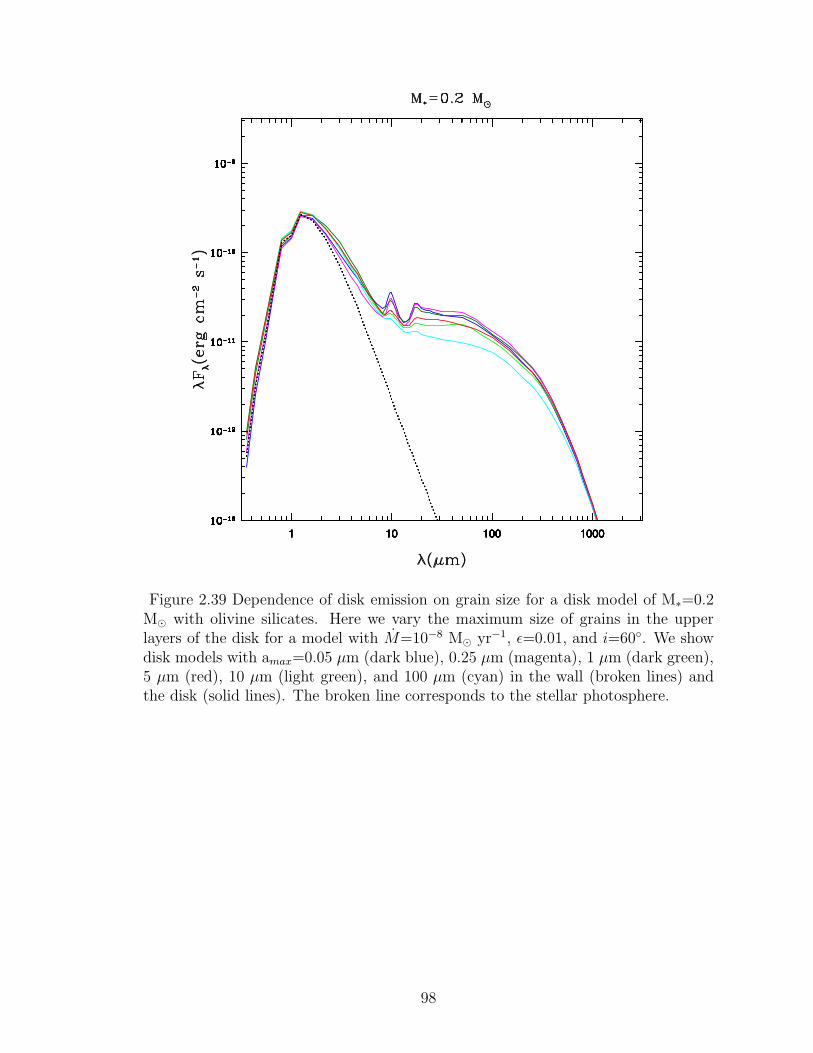
1 10 100 10001 10 100 10001 10 100 10001 10 100 10001 10 100 10001 10 100 1000
Figure 2.39 Dependence of disk emission on grain size for a disk model of M∗=0.2M� with olivine silicates. Here we vary the maximum size of grains in the upperlayers of the disk for a model with M=10−8 M� yr−1, ε=0.01, and i=60◦. We showdisk models with amax=0.05 μm (dark blue), 0.25 μm (magenta), 1 μm (dark green),5 μm (red), 10 μm (light green), and 100 μm (cyan) in the wall (broken lines) andthe disk (solid lines). The broken line corresponds to the stellar photosphere.
98
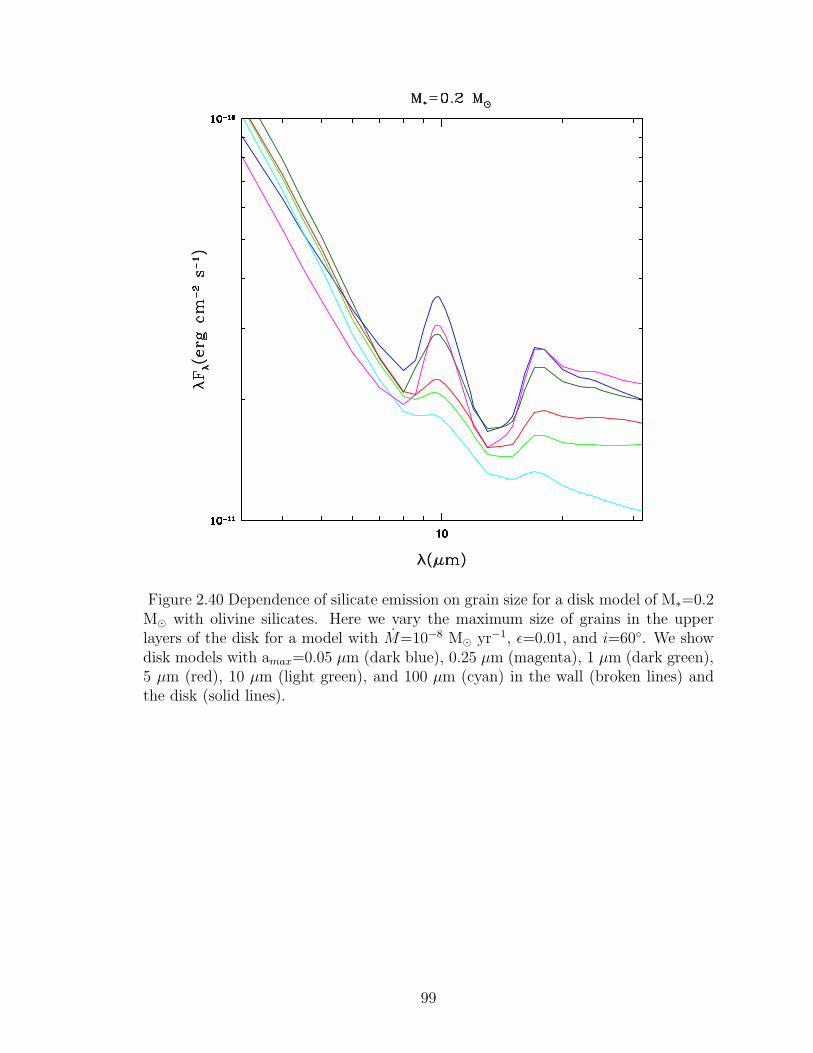
101010101010
Figure 2.40 Dependence of silicate emission on grain size for a disk model of M∗=0.2M� with olivine silicates. Here we vary the maximum size of grains in the upperlayers of the disk for a model with M=10−8 M� yr−1, ε=0.01, and i=60◦. We showdisk models with amax=0.05 μm (dark blue), 0.25 μm (magenta), 1 μm (dark green),5 μm (red), 10 μm (light green), and 100 μm (cyan) in the wall (broken lines) andthe disk (solid lines).
99
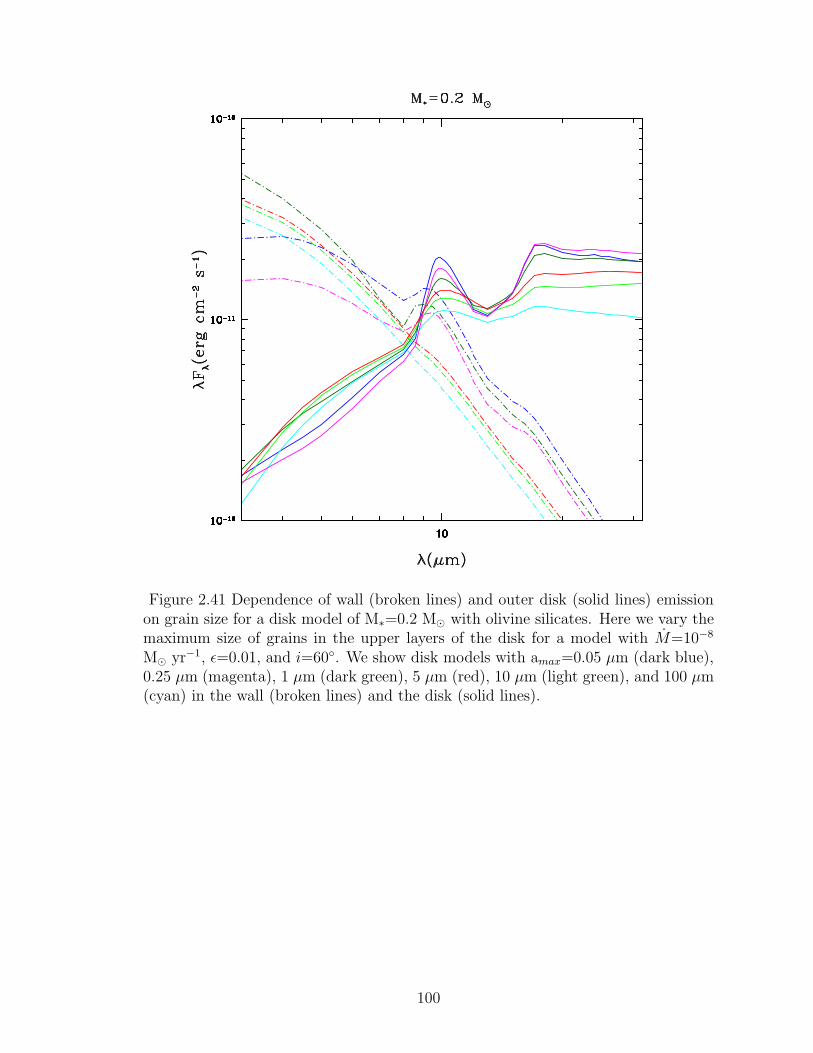
101010101010
Figure 2.41 Dependence of wall (broken lines) and outer disk (solid lines) emissionon grain size for a disk model of M∗=0.2 M� with olivine silicates. Here we vary themaximum size of grains in the upper layers of the disk for a model with M=10−8
M� yr−1, ε=0.01, and i=60◦. We show disk models with amax=0.05 μm (dark blue),0.25 μm (magenta), 1 μm (dark green), 5 μm (red), 10 μm (light green), and 100 μm(cyan) in the wall (broken lines) and the disk (solid lines).
100
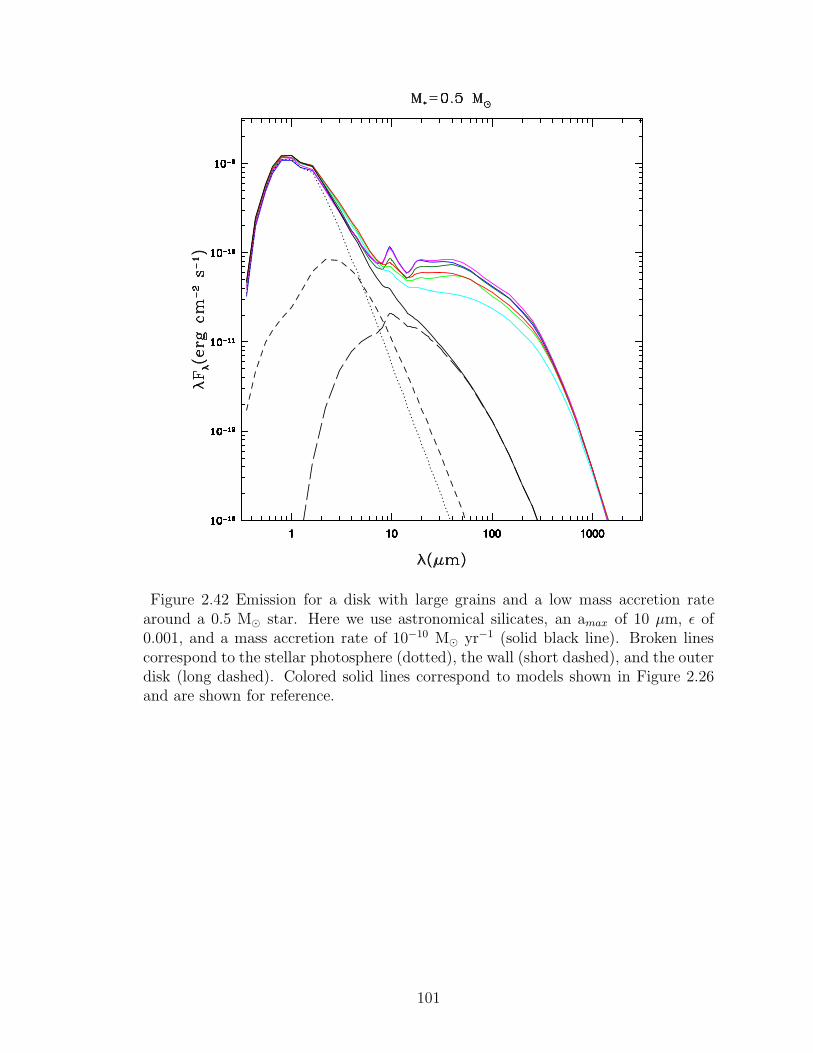
1 10 100 10001 10 100 10001 10 100 10001 10 100 10001 10 100 10001 10 100 10001 10 100 1000
Figure 2.42 Emission for a disk with large grains and a low mass accretion ratearound a 0.5 M� star. Here we use astronomical silicates, an amax of 10 μm, ε of0.001, and a mass accretion rate of 10−10 M� yr−1 (solid black line). Broken linescorrespond to the stellar photosphere (dotted), the wall (short dashed), and the outerdisk (long dashed). Colored solid lines correspond to models shown in Figure 2.26and are shown for reference.
101
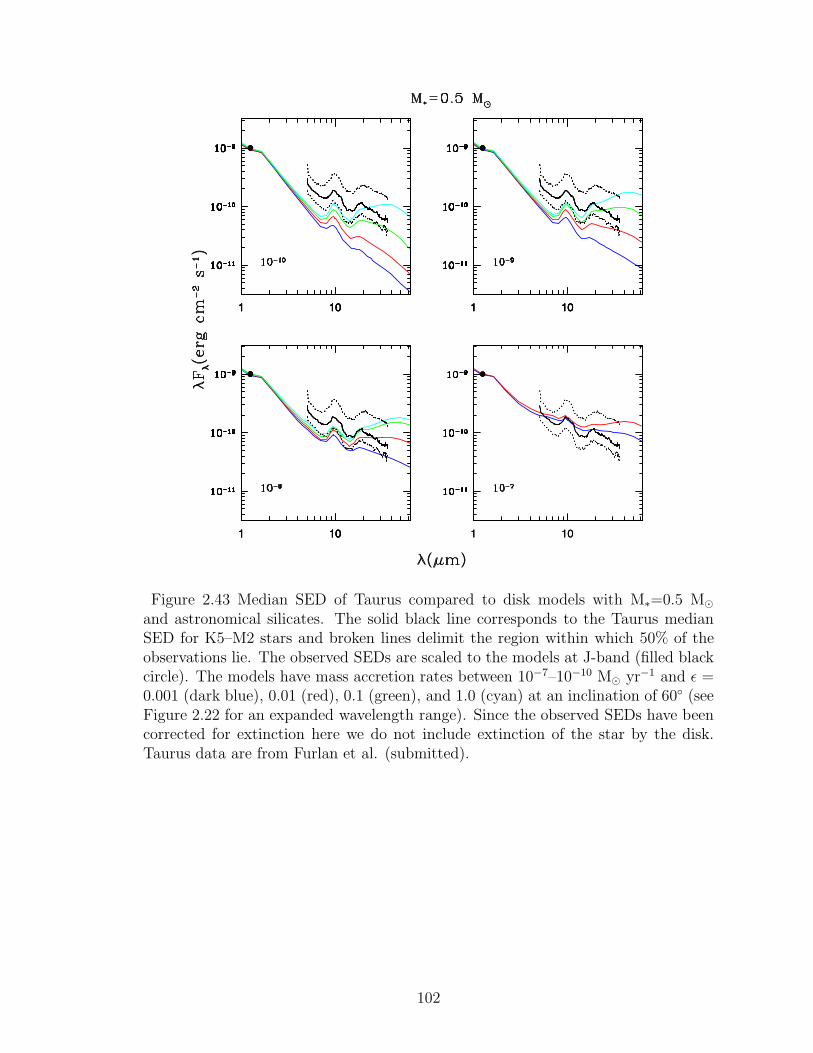
1 101 101 101 10 1 101 101 101 10
1 101 101 101 10 1 101 10
Figure 2.43 Median SED of Taurus compared to disk models with M∗=0.5 M�and astronomical silicates. The solid black line corresponds to the Taurus medianSED for K5–M2 stars and broken lines delimit the region within which 50% of theobservations lie. The observed SEDs are scaled to the models at J-band (filled blackcircle). The models have mass accretion rates between 10−7–10−10 M� yr−1 and ε =0.001 (dark blue), 0.01 (red), 0.1 (green), and 1.0 (cyan) at an inclination of 60◦ (seeFigure 2.22 for an expanded wavelength range). Since the observed SEDs have beencorrected for extinction here we do not include extinction of the star by the disk.Taurus data are from Furlan et al. (submitted).
102
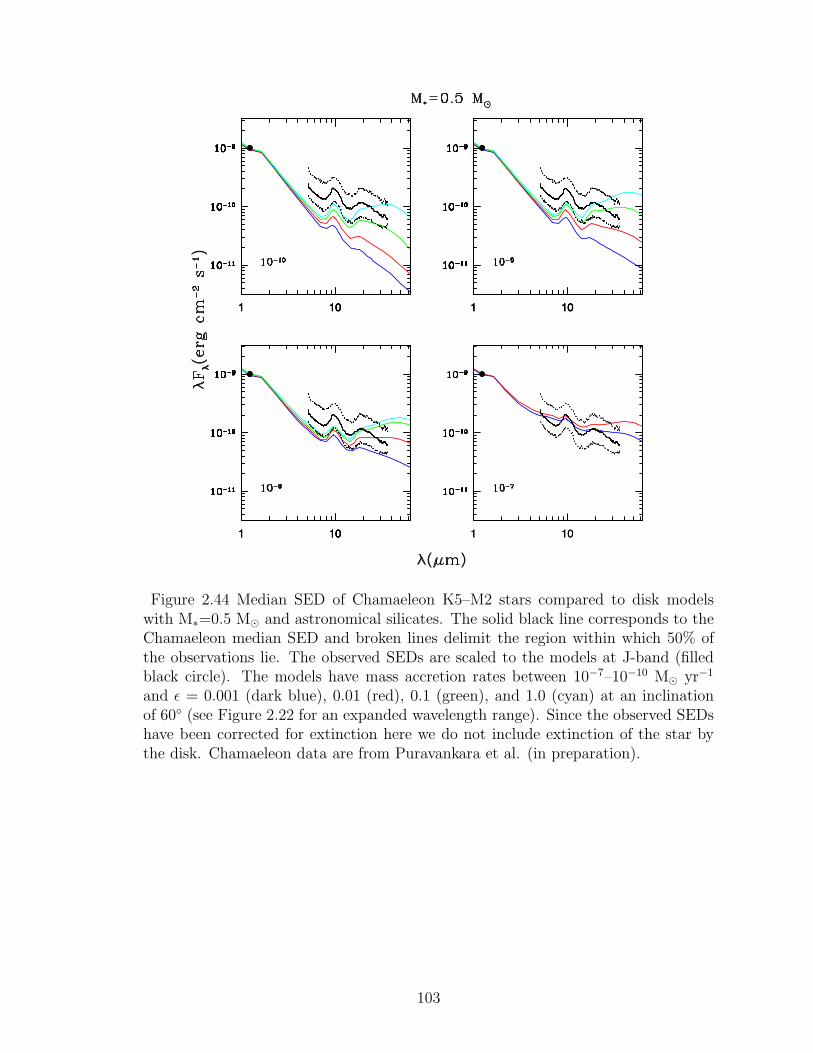
1 101 101 101 10 1 101 101 101 10
1 101 101 101 10 1 101 10
Figure 2.44 Median SED of Chamaeleon K5–M2 stars compared to disk modelswith M∗=0.5 M� and astronomical silicates. The solid black line corresponds to theChamaeleon median SED and broken lines delimit the region within which 50% ofthe observations lie. The observed SEDs are scaled to the models at J-band (filledblack circle). The models have mass accretion rates between 10−7–10−10 M� yr−1
and ε = 0.001 (dark blue), 0.01 (red), 0.1 (green), and 1.0 (cyan) at an inclinationof 60◦ (see Figure 2.22 for an expanded wavelength range). Since the observed SEDshave been corrected for extinction here we do not include extinction of the star bythe disk. Chamaeleon data are from Puravankara et al. (in preparation).
103
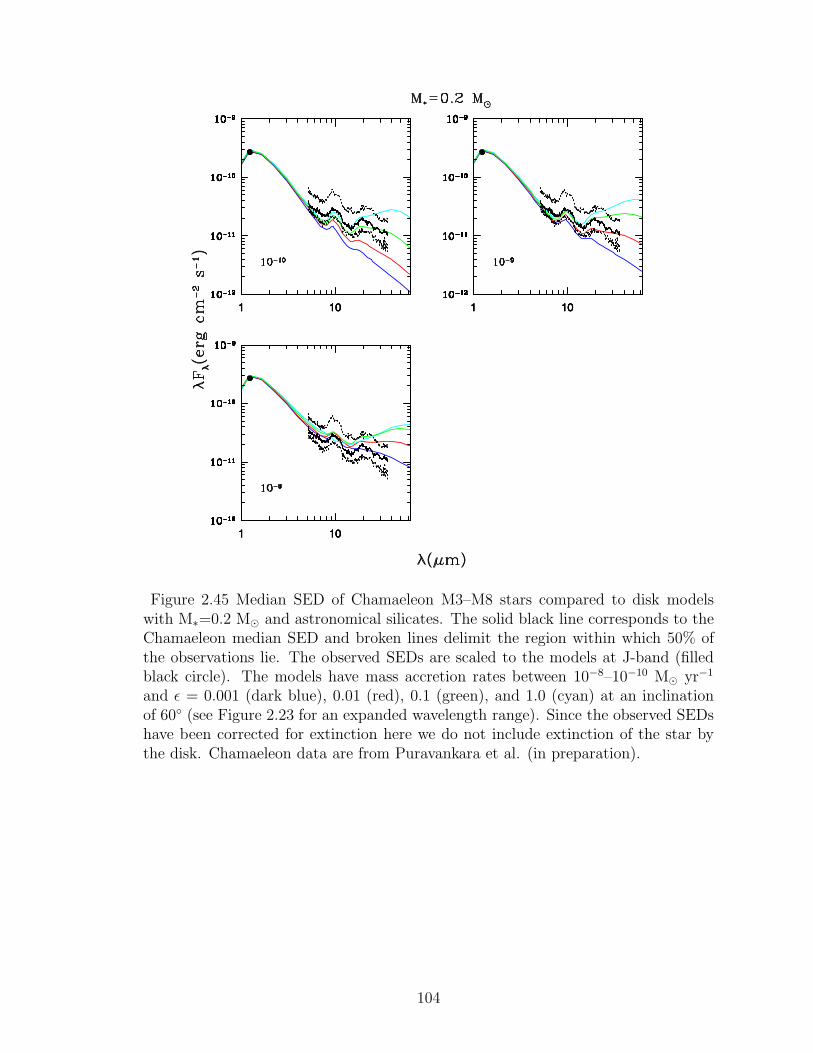
1 101 101 101 10 1 101 101 101 10
1 101 101 101 10
Figure 2.45 Median SED of Chamaeleon M3–M8 stars compared to disk modelswith M∗=0.2 M� and astronomical silicates. The solid black line corresponds to theChamaeleon median SED and broken lines delimit the region within which 50% ofthe observations lie. The observed SEDs are scaled to the models at J-band (filledblack circle). The models have mass accretion rates between 10−8–10−10 M� yr−1
and ε = 0.001 (dark blue), 0.01 (red), 0.1 (green), and 1.0 (cyan) at an inclinationof 60◦ (see Figure 2.23 for an expanded wavelength range). Since the observed SEDshave been corrected for extinction here we do not include extinction of the star bythe disk. Chamaeleon data are from Puravankara et al. (in preparation).
104
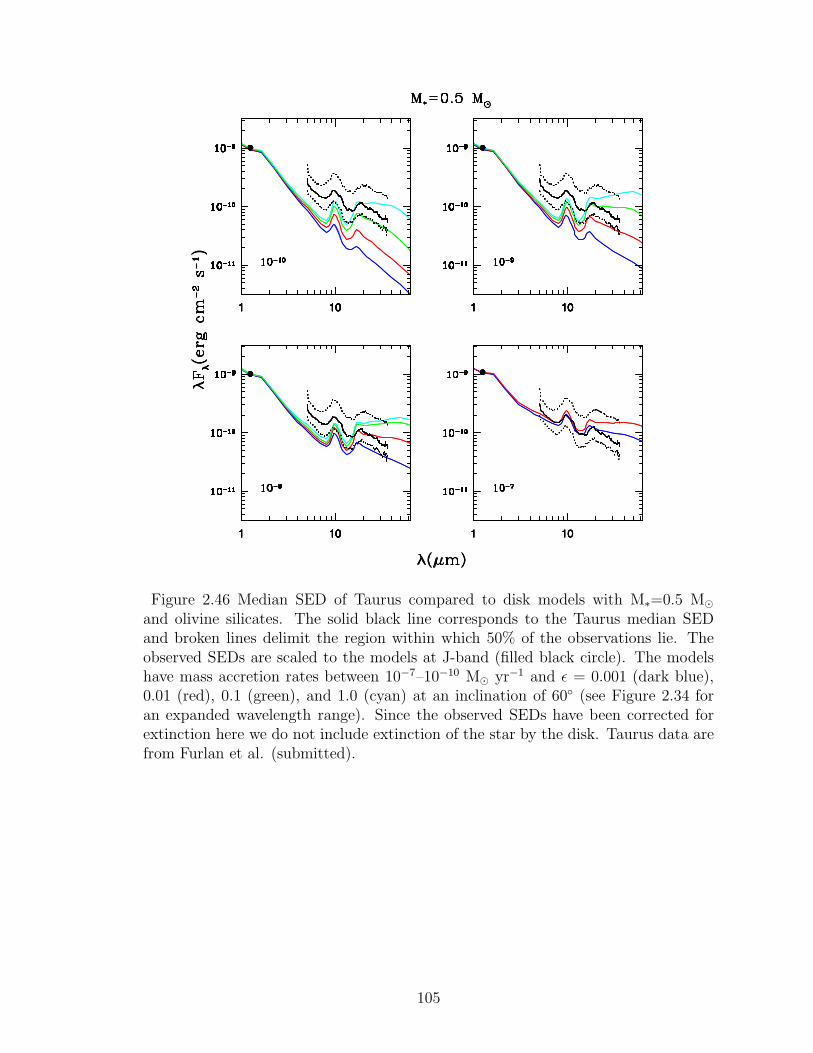
1 101 101 101 10 1 101 101 101 10
1 101 101 101 10 1 101 10
1 101 101 101 10 1 101 101 101 10
1 101 101 101 10 1 101 10
Figure 2.46 Median SED of Taurus compared to disk models with M∗=0.5 M�and olivine silicates. The solid black line corresponds to the Taurus median SEDand broken lines delimit the region within which 50% of the observations lie. Theobserved SEDs are scaled to the models at J-band (filled black circle). The modelshave mass accretion rates between 10−7–10−10 M� yr−1 and ε = 0.001 (dark blue),0.01 (red), 0.1 (green), and 1.0 (cyan) at an inclination of 60◦ (see Figure 2.34 foran expanded wavelength range). Since the observed SEDs have been corrected forextinction here we do not include extinction of the star by the disk. Taurus data arefrom Furlan et al. (submitted).
105
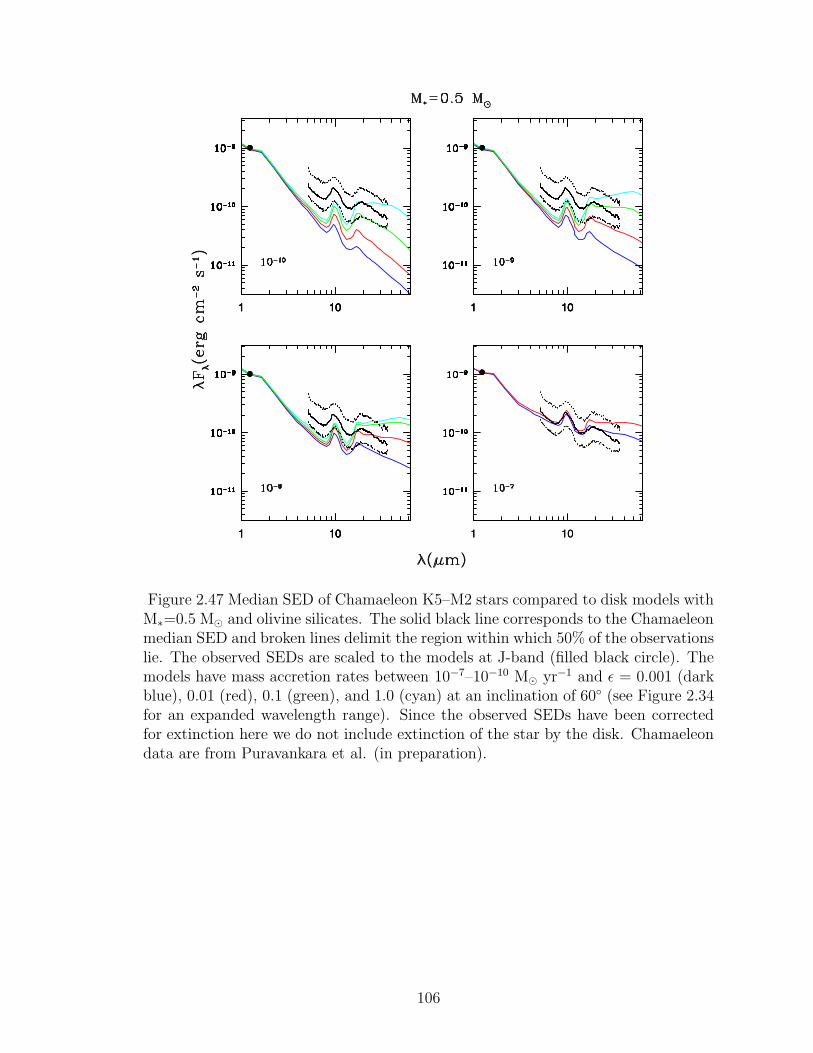
1 101 101 101 10 1 101 101 101 10
1 101 101 101 10 1 101 10
Figure 2.47 Median SED of Chamaeleon K5–M2 stars compared to disk models withM∗=0.5 M� and olivine silicates. The solid black line corresponds to the Chamaeleonmedian SED and broken lines delimit the region within which 50% of the observationslie. The observed SEDs are scaled to the models at J-band (filled black circle). Themodels have mass accretion rates between 10−7–10−10 M� yr−1 and ε = 0.001 (darkblue), 0.01 (red), 0.1 (green), and 1.0 (cyan) at an inclination of 60◦ (see Figure 2.34for an expanded wavelength range). Since the observed SEDs have been correctedfor extinction here we do not include extinction of the star by the disk. Chamaeleondata are from Puravankara et al. (in preparation).
106
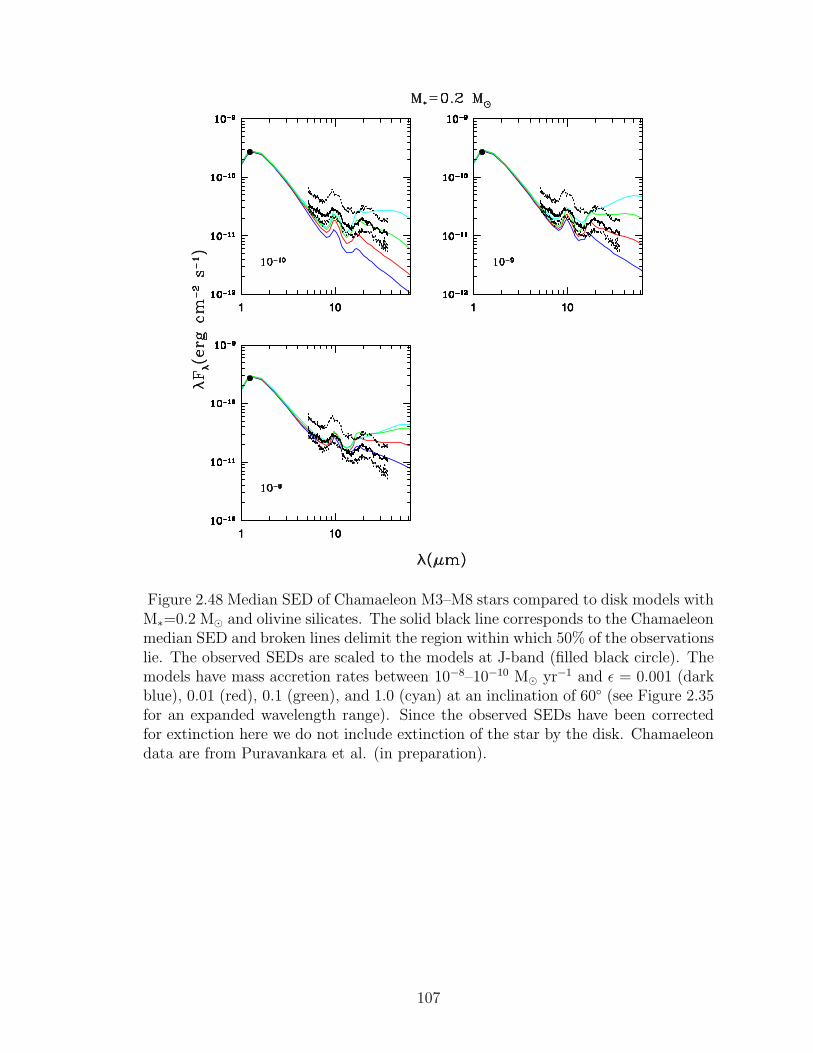
1 101 101 101 10 1 101 101 101 10
1 101 101 101 10
Figure 2.48 Median SED of Chamaeleon M3–M8 stars compared to disk models withM∗=0.2 M� and olivine silicates. The solid black line corresponds to the Chamaeleonmedian SED and broken lines delimit the region within which 50% of the observationslie. The observed SEDs are scaled to the models at J-band (filled black circle). Themodels have mass accretion rates between 10−8–10−10 M� yr−1 and ε = 0.001 (darkblue), 0.01 (red), 0.1 (green), and 1.0 (cyan) at an inclination of 60◦ (see Figure 2.35for an expanded wavelength range). Since the observed SEDs have been correctedfor extinction here we do not include extinction of the star by the disk. Chamaeleondata are from Puravankara et al. (in preparation).
107
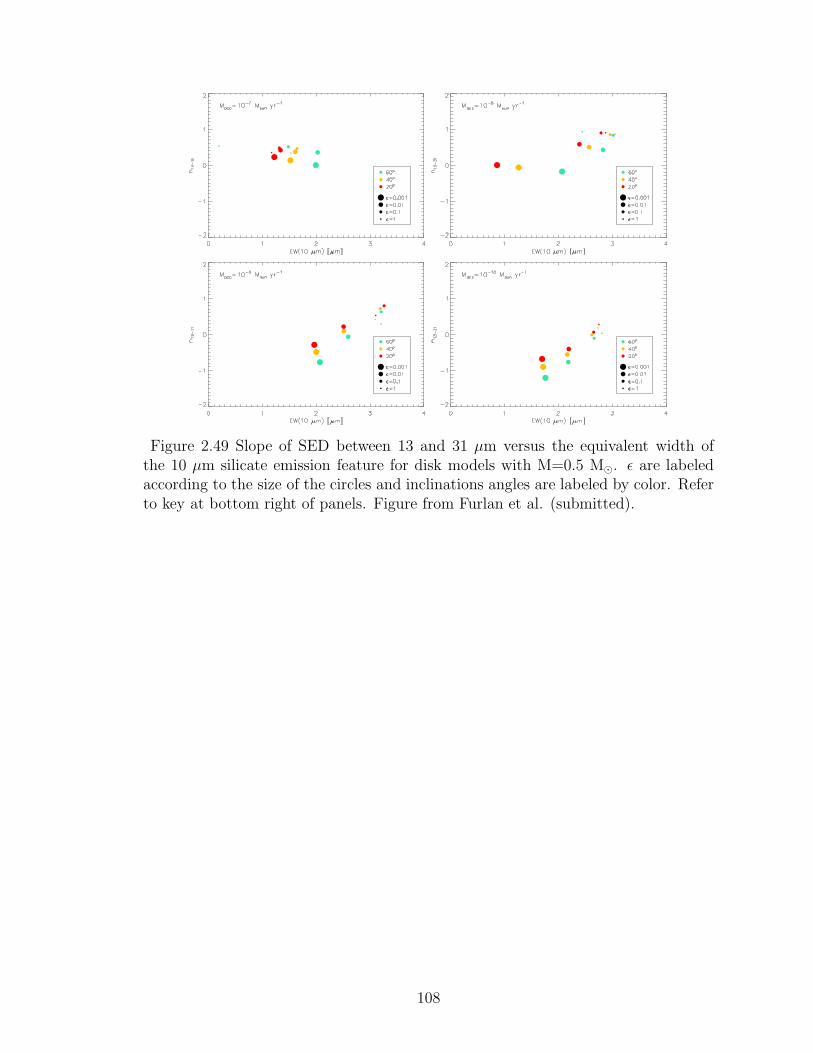
Figure 2.49 Slope of SED between 13 and 31 μm versus the equivalent width ofthe 10 μm silicate emission feature for disk models with M=0.5 M�. ε are labeledaccording to the size of the circles and inclinations angles are labeled by color. Referto key at bottom right of panels. Figure from Furlan et al. (submitted).
108
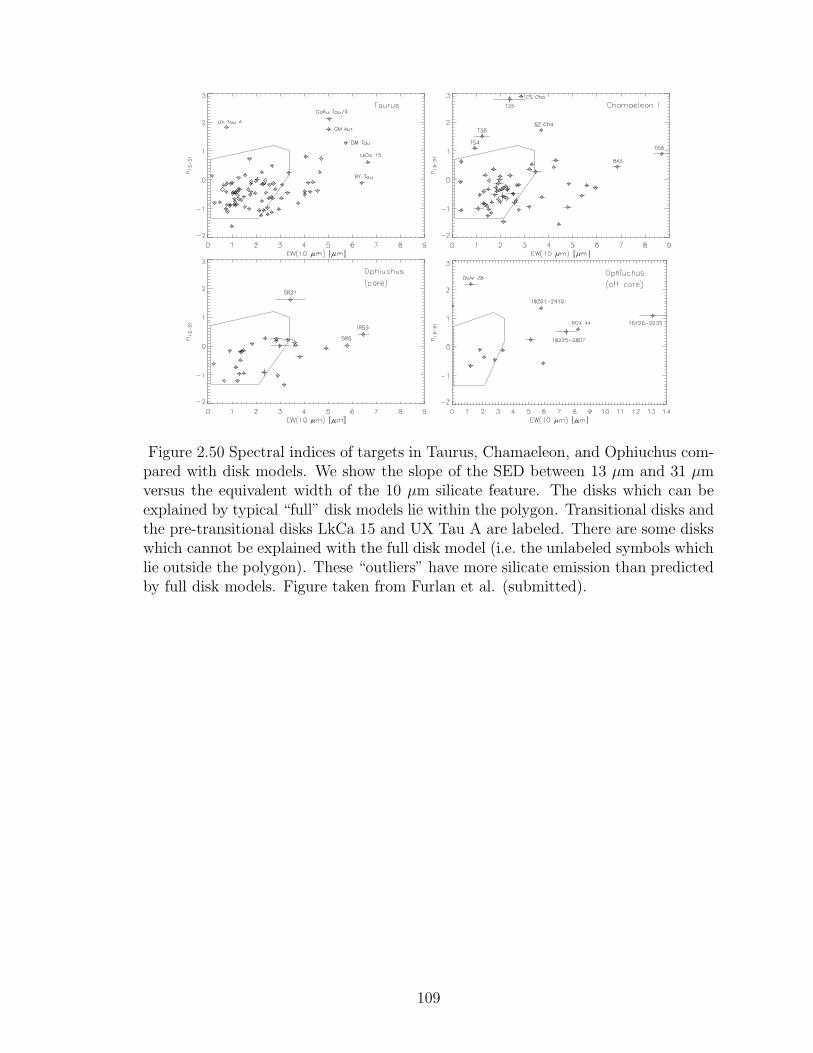
Figure 2.50 Spectral indices of targets in Taurus, Chamaeleon, and Ophiuchus com-pared with disk models. We show the slope of the SED between 13 μm and 31 μmversus the equivalent width of the 10 μm silicate feature. The disks which can beexplained by typical “full” disk models lie within the polygon. Transitional disks andthe pre-transitional disks LkCa 15 and UX Tau A are labeled. There are some diskswhich cannot be explained with the full disk model (i.e. the unlabeled symbols whichlie outside the polygon). These “outliers” have more silicate emission than predictedby full disk models. Figure taken from Furlan et al. (submitted).
109
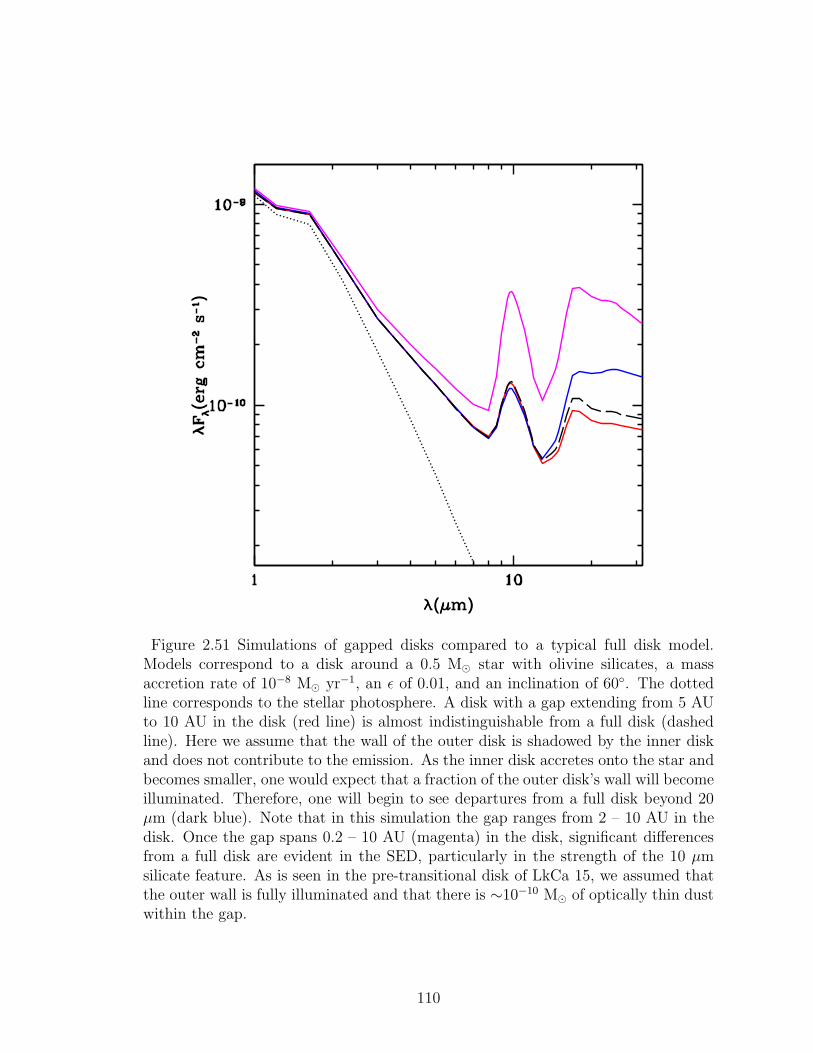
Figure 2.51 Simulations of gapped disks compared to a typical full disk model.Models correspond to a disk around a 0.5 M� star with olivine silicates, a massaccretion rate of 10−8 M� yr−1, an ε of 0.01, and an inclination of 60◦. The dottedline corresponds to the stellar photosphere. A disk with a gap extending from 5 AUto 10 AU in the disk (red line) is almost indistinguishable from a full disk (dashedline). Here we assume that the wall of the outer disk is shadowed by the inner diskand does not contribute to the emission. As the inner disk accretes onto the star andbecomes smaller, one would expect that a fraction of the outer disk’s wall will becomeilluminated. Therefore, one will begin to see departures from a full disk beyond 20μm (dark blue). Note that in this simulation the gap ranges from 2 – 10 AU in thedisk. Once the gap spans 0.2 – 10 AU (magenta) in the disk, significant differencesfrom a full disk are evident in the SED, particularly in the strength of the 10 μmsilicate feature. As is seen in the pre-transitional disk of LkCa 15, we assumed thatthe outer wall is fully illuminated and that there is ∼10−10 M� of optically thin dustwithin the gap.
110
Chapter 3
Probing the Dust and Gas in the Transitional
Disk of CS Cha with Spitzer
Abstract: Here we present the Spitzer IRS spectrum of CS Cha, a member of
the ∼2 Myr old Chamaeleon star–forming region, which reveals an optically thick
circumstellar disk truncated at ∼43 AU, the largest hole modeled in a transitional
disk to date. Within this inner hole, ∼5×10⁻⁵ lunar masses of dust are located in
a small optically thin inner region which extends from 0.1 to 1 AU. In addition, the
disk of CS Cha has bigger grain sizes and more settling than the previously modeled
transitional disks DM Tau, GM Aur, and CoKu Tau/4, suggesting that CS Cha is
in a more advanced state of dust evolution. The Spitzer IRS spectrum also shows
[Ne II] 12.81 μm fine-structure emission with a luminosity of 1.3 × 1029 ergs s−1,
indicating that optically thin gas is present in this ∼43 AU hole, in agreement with
Hα measurements and a UV excess which indicate that CS Cha is still accreting 1.2
× 10−8 M� yr−1. We do not find a correlation of the [Ne II] flux with LX , however,
there is a possible correlation with M , which if confirmed would suggest that EUV
fluxes due to accretion are the main agent for formation of the [Ne II] line.
111

3.1 Introduction
The Spitzer Space Telescope (Werner et al., 2004) has dramatically improved the
ability to study the dust in disks by giving us detailed spectral energy distributions
(SEDs) in the mid-infrared, where the dust dominates the emission. Spitzer In-
frared Spectrograph (Houck et al., 2004) observations of T Tauri stars have provided
strong evidence of dust evolution, particularly in the well surveyed ∼1-2 Myr old
Taurus-Auriga star–forming region (Furlan et al., 2006). The most notable evidence
of dust evolution lies in the observations of transitional disks. These disks have
characteristics that fall between those objects that have clear evidence for disks and
those objects with no disk material; the SEDs point to inner holes in the disk. All
transitional disks have a significant deficit of flux in the near-IR which has been
explained by modeling the disks with truncated optically thick disks (Uchida et al.,
2004; Calvet et al., 2005b; D’Alessio et al., 2005).
CoKu Tau/4 is one of these transitional disks in Taurus (Forrest et al., 2004;
D’Alessio et al., 2005). The SED of this object is photospheric below 8 μm and
rises at longer wavelengths, showing weak silicate emission at 10 μm; this can be
explained by the emission of the frontally illuminated edge or “wall” of an outer
disk truncated at 10 AU from the star (D’Alessio et al., 2005) and the weak silicate
emission arises in the atmosphere of the wall. There are no small grains in the
inner disk, in agreement with CoKu Tau/4’s classification as a non-accreting, weak
T Tauri star. Hydrodynamical simulations indicate that this hole may be due to the
formation of a planet (Quillen et al., 2004). Other studies point to photoevaporation
of the disk by the star (Alexander & Armitage, 2007). However, the clearing in the
112
inner disk of CoKu Tau/4 is most likely due to clearing by its companion (Ireland &
Kraus, 2008). Similar to CoKu Tau/4, DM Tau has been modeled with an inner disk
region free of small dust and a truncated optically thick disk at 3 AU (Calvet et al.,
2005b). However, this star is still accreting, indicating that gas should still remain
in the inner disk region. GM Aur, which is also accreting, was modeled by Calvet
et al. (2005b) with an optically thick disk truncated at 24 AU and a small amount
of dust in the inner disk which leads to its observed near-IR excess. This disk hole
could also be due to a planet (Rice et al., 2003). TW Hya, a transitional disk in the
∼10 Myr old TW Hya association (Jayawardhana et al., 1999; Webb et al., 1999),
has an outer optically thick disk with a 4 AU hole filled with an inner optically thin
region populated by a small amount of dust (Calvet et al., 2002; Uchida et al., 2004).
Not only has Spitzer been a powerful tool in exploring the dust evolution in
circumstellar disks, it also has the potential to access new probes of the gas evolution
in these disks, an area of study which is still in its infancy and largely uncertain. High-
resolution molecular spectroscopy has permitted us to access abundant molecular
tracers within the inner disk such as H2 and CO (Bergin et al., 2004; Najita et al.,
2007b). A new gas diagnostic has emerged in the mid-infrared with the detection of
[Ne II] emission with Spitzer. [Ne II] emission at 12.81 μm has been detected from
a few T Tauri stars that were observed as part of the FEPS Spitzer Legacy program
(Pascucci et al., 2007) as well as in the transitional disks CS Cha, DM Tau, and TW
Hya (Espaillat et al., 2007a).
We will present and analyze Spitzer IRS data of CS Cha, a transitional disk in
the ∼2 Myr old Chamaeleon star–forming region (Luhman, 2004).
113
3.2 Observations
CS Cha was observed by the Spitzer IRS instrument on 11 July 2005 in Staring
Mode (AOR ID: 12695808). We used the short- and long-wavelength, low-resolution
(SL, LL) modules of IRS at a resolving power of λ/δλ = 60 – 100. The total exposure
time was 28 and 12 seconds for SL and LL respectively. We reduced the data with
the SMART package (Higdon et al., 2004). We follow the same reduction procedure
as Calvet et al. (2005b). The 12.81 μm [Ne II] line is not extended and is consistent
with the CS Cha point source.
The photometry at 24 and 70 μm was extracted from the MIPS post-BCD mo-
saicked images (AOR ID: 3962112) using the aperture photometry routine in the
Astronomical Point Source Extraction (APEX) software package developed by the
SSC (Makovoz & Marleau, 2005). An aperture of radius 14.′′94, with a sky annulus
between 29.′′88and 42.′′33, was used at 24 μm while an aperture of radius 29.′′55, with a
sky annulus between 39.′′40 and 68.′′95, was used at 70 μm. Both fluxes were aperture
corrected by factors of 1.143 at 24 μm and 1.298 at 70 μm, as calculated by Su et al.
(2006). No color correction was applied.
3.3 Analysis
3.3.1 Dust Properties
Figure 3.1 shows the SED of CS Cha consisting of optical (Gauvin & Strom, 1992),
2MASS, L-band (Luhman, 2004), Spitzer IRS, IRAS (Gauvin & Strom, 1992), MIPS,
and millimeter (Henning et al., 1993) data. We also show the median SED of Taurus
(D’Alessio et al., 1999; Furlan et al., 2006) which emphasizes the stark deficit of flux
114
in the near infrared, an indicator of an inner disk hole, which is characteristic of
transitional disks.
A distance of 160 pc to Chamaeleon I (Whittet et al., 1997) and a spectral type
of K6 from Luhman (2004) are adopted. The extinction is calculated by fitting the
observed photospheric colors to the photosphere calibrated by a standard K6 star
with an effective temperature of 4205 K (Kenyon & Hartmann, 1995). Data are
then dereddened with an AV of 0.8 and the Mathis (1990) reddening law. Stellar
parameters (M∗, R∗, L∗) are listed in Table 3.1; the mass was derived from the Siess
et al. evolutionary tracks (Siess et al., 2000). An inclination angle of 60◦ to the line
of sight is adopted.
The SED suggests a UV excess which is thought to be formed in the accretion
shock on the stellar surface (Calvet & Gullbring, 1998). This is supported by Hα
equivalent widths of 20 A (Luhman, 2004) and 65 A (Hartigan, 1993), which indicate
CS Cha is accreting (White & Basri, 2003). We calculate a mass accretion rate of
1.2 × 10⁻⁸ M� yr−1 from this U-band excess following Gullbring et al. (1998), with
a typical uncertainty of a factor of 2 or 3 (Calvet et al., 2004).
We model CS Cha as a truncated optically thick disk with a frontally illuminated
vertical wall and an inner optically thin region. The black solid line in Figure 3.2 is
the best fit model to the observations; different model components are represented
by the broken lines. We use a grain-size distribution that follows a power-law of
the form a−3.5, where a is the grain radius, with amin of 0.005 μm and amax of 5
μm. The structure and emission of the optically thick disk (Figure 3.2) is calculated
with models including dust settling following D’Alessio et al. (2006), where we use
115
millimeter fluxes (Henning et al., 1993; Lommen et al., 2007) and MIPS to constrain
the outer disk properties. Input parameters are the stellar properties and the mass
accretion rate of the disk (M), the viscosity parameter (α), the dust composition,
and the settling parameter ε = ζup/ζst, i.e. the mass fraction of the small grains in
the upper layers relative to the standard dust-to-gas mass ratio (D’Alessio et al.,
2006). Table 3.1 shows all relevant values. The disk mass, 0.04 M�, is determined by
the mass surface density which is proportional to M/α and the assumed disk radius.
This result is not inconsistent with the disk mass of 0.021 M� derived by Henning
et al. (1993) from 1.3 mm fluxes.
The optically thick disk has an edge or “wall” directly exposed to stellar radiation
(Figure 3.2). The radiative transfer in the wall atmosphere is calculated following
D’Alessio et al. (2005) with the following inputs: stellar mass (M∗), stellar radius
(R∗), M , stellar effective temperature (T∗), maximum and minimum grains sizes,
temperature of the optically thin wall atmosphere (Twall). See Table 3.1 for the
wall’s location (Rwall), maximum grain size (amax), and other parameters.
The emission at 10 μm comes from the optically thin inner region (Calvet et al.,
2005b) which extends up to 1 AU from the star and has a minimum grain size of 1.9
μm and a maximum grain size of 2.1 μm (Figure 3.2). The total emission is scaled
to the vertical optical depth at 10 μm, τ0 ∼ 0.009. This region is populated by ∼
10−12 M� or ∼5×10⁻⁵ Mmoon of uniformly distributed dust. This small amount of
dust leads to the slight 5 – 8 μm excess above the photosphere (most easily seen in
Figure 3.3). The dust in this region is composed of 88% amorphous silicates, 5%
of amorphous carbon, 5% organics, 1% troilite and less than 1% of enstatite and
116
forsterite.
Figure 3.3 illustrates the necessity of larger grains in both the wall and optically
thin inner region to fit the observations. The solid line corresponds to the model of
the wall and optically thin region with the larger grain sizes which we adopted above.
The dotted line corresponds to models with the smaller, ISM-like grains, as are found
in the Taurus transitional disks CoKu Tau/4, DM Tau, and GM Aur. Figure 3.3
shows that larger grains have better agreement with the slope of the SED beyond 15
μm and are necessary to produce the slight near-infrared excess, the shape of the 10
μm feature, and the >20 μm IRS emission in CS Cha.
3.3.2 Gas Properties
We detect [Ne II] fine-structure emission at 12.81 μm (2P1/2 →2 P3/2) in CS Cha (see
Figure 3.3). Using the IRAF tool SPLOT, we find the integrated line flux,∫
Fλdλ,
to be 4.3±0.6 × 10⁻¹⁴ ergs cm−2 s−1 or 1.3 × 1029 ergs s−1.
Glassgold et al. (2007) have recently suggested that circumstellar disks exposed
to stellar X-rays would produce [Ne II] fine-structure emission at a level that would
be detectable with Spitzer in nearby star–forming regions. In the Glassgold et al.
(2007) model, the disk surface is both ionized and heated by stellar X-rays. Ne ions
(primarily Ne+ and Ne2+) are produced through X-ray ionization and destroyed by
charge exchange with atomic hydrogen and radiative recombination. Alternatively,
(Gorti & Hollenbach, 2009) propose that EUV photons from the stellar chromosphere
and/or stellar accretion can create an ionized HII-region-like layer at the disk surface
that can also produce significant [Ne II] emission.
117
3.4 Discussion & Conclusions
CS Cha shows clear evidence of advanced dust evolution in relation to other tran-
sitional disks: it has significant grain growth and substantial settling in its outer
disk. The dust in the wall of the outer disk in CS Cha has grown to much larger
sizes (5 μm) than the dust in the transitional disks CoKu Tau/4, DM Tau, GM Aur,
and TW Hya, all of which have maximum grain sizes in the outer wall of 0.25 μm
(D’Alessio et al., 2005; Calvet et al., 2005b, 2002; Uchida et al., 2004), and CS Cha
has large grains in the inner optically thin region as well, similar to TW Hya (Sargent
et al., 2006). CS Cha also needs more settling in the outer disk (ε = 0.01) to fit the
far-infrared and millimeter data, indicating much higher dust depletion in the upper
layers than found in GM Aur and DM Tau, which were modeled with ε = 0.1 and
0.5, respectively (Calvet et al., 2005b; Hughes et al., 2009) . In addition, CS Cha
further stands out due to its large hole size, having the largest modeled to date at
∼ 43 AU. This large inner hole serves to decrease the mid-infrared dust continuum
and hence increase the line to continuum ratio, facilitating the detection of [Ne II]
fine-structure emission.
The luminosity of the [Ne II] 12.81 μm line in CS Cha is strong compared to
other [Ne II] detections in disks. The luminosity seen in DM Tau is 1.3 × 1028 ergs
s−1 and for GM Aur the 5 σ upper limit is 7.4 × 1028 ergs s−1 (measured from
spectra in Calvet et al., 2005b). TW Hya shows [Ne II] emission at 12.81 μm with a
luminosity of 3.9 × 1028 ergs s−1 (measured from Uchida et al., 2004). In addition,
the luminosities seen in four CTTS that were observed in the FEPS survey are ∼1028
ergs s−1 (Pascucci et al., 2007).
118

To gain insight into the origin of the Neon emission we compare L[NeII] to LX
and M in Figure 3.4. We see no apparent correlation between L[NeII] and LX as
was reported by Pascucci et al. (2007) and as would be expected from the X-ray
heating model of Glassgold et al. (2007), which suggests that other processes like
viscous heating, jets, and UV heating are involved (Glassgold et al., 2007). We find
a possible correlation between L[NeII] and M which suggests that accretion related
heating may play a substantial role in producing [Ne II] emission. Accretion related
processes that affect the disk heating are viscous dissipation and irradiation by UV
emission from the accretion shock region. Calvet et al. (2004) show that FUV fluxes
scale with Lacc, and a similar scaling is expected for the EUV; in turn, Gorti &
Hollenbach (2009) show that EUV heating and ionization can result in significant
[Ne II] emission.
Nevertheless, both the X-ray and EUV heating models under-predict the L[NeII]
seen in CS Cha (Glassgold et al., 2007; Pascucci et al., 2007). We note that the
optically thin inner region of CS Cha is populated by large grains, which would
favor UV flux penetration of the gas (Aikawa & Nomura, 2006) and possibly lead
to enhanced L[NeII]. Further exploration of the gas and dust in other transitional
disks is necessary to test any link between these components. Similarly, jets and
outflows, which are also characteristic of sources with higher accretion rates, may
contribute to a positive trend. High resolution spectroscopy of CS Cha can explore
this contribution from the jet (Takami et al., 2003).
119
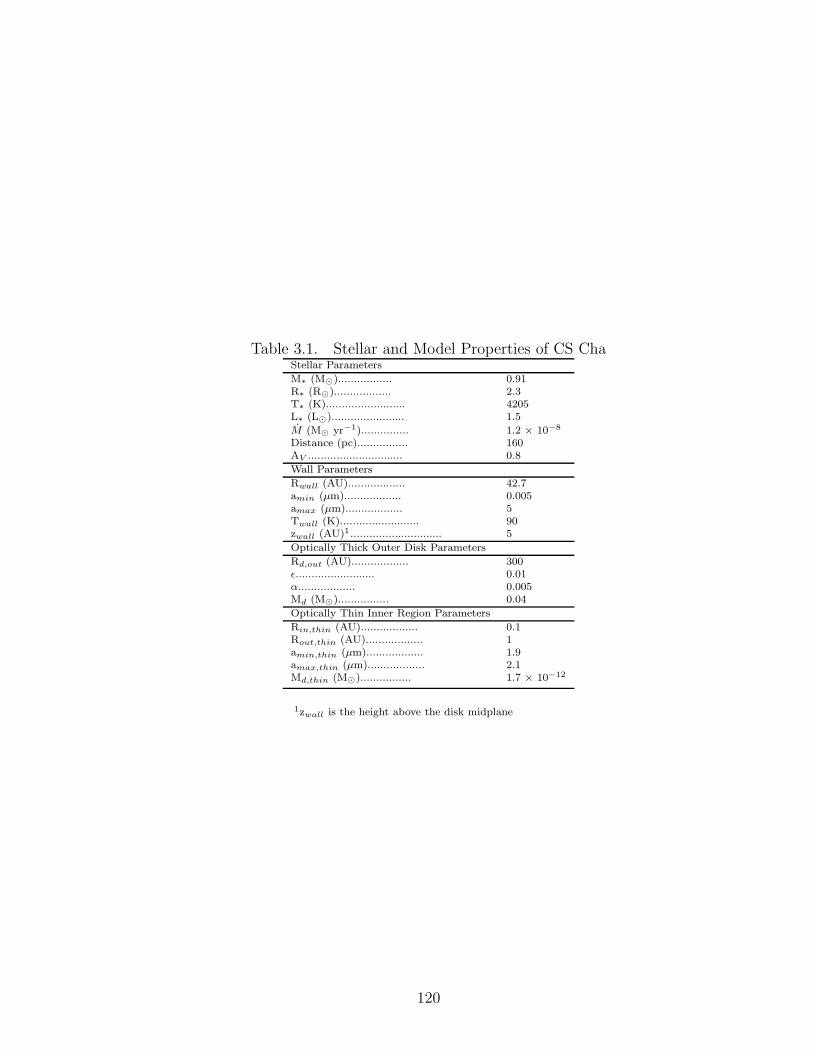
Table 3.1. Stellar and Model Properties of CS ChaStellar Parameters
M∗ (M�)................. 0.91R∗ (R�).................. 2.3T∗ (K)......................... 4205L∗ (L�)....................... 1.5
M (M� yr−1)............... 1.2 × 10⁻⁸
Distance (pc)................ 160AV .............................. 0.8
Wall Parameters
Rwall (AU).................. 42.7amin (μm).................. 0.005amax (μm).................. 5Twall (K)......................... 90zwall (AU)1............................. 5
Optically Thick Outer Disk Parameters
Rd,out (AU).................. 300ε......................... 0.01α.................. 0.005Md (M�)................ 0.04
Optically Thin Inner Region Parameters
Rin,thin (AU).................. 0.1Rout,thin (AU).................. 1amin,thin (μm).................. 1.9amax,thin (μm).................. 2.1Md,thin (M�)................ 1.7 × 10⁻¹²
1zwall is the height above the disk midplane
120
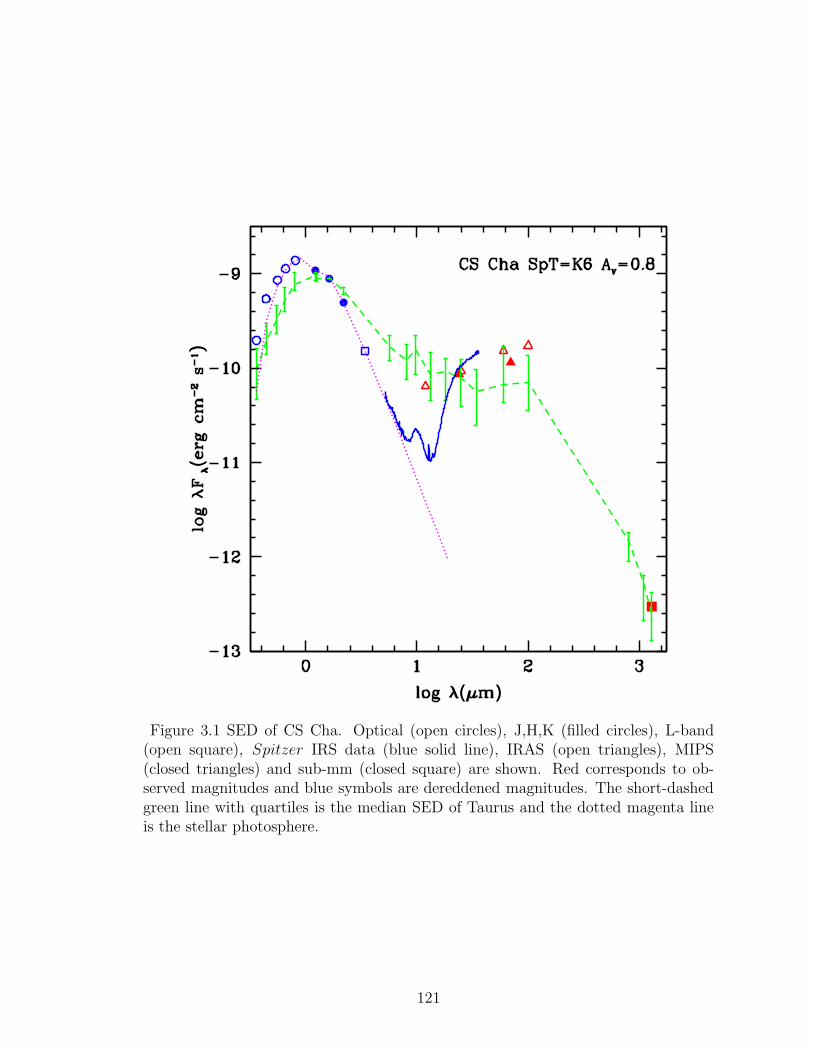
Figure 3.1 SED of CS Cha. Optical (open circles), J,H,K (filled circles), L-band(open square), Spitzer IRS data (blue solid line), IRAS (open triangles), MIPS(closed triangles) and sub-mm (closed square) are shown. Red corresponds to ob-served magnitudes and blue symbols are dereddened magnitudes. The short-dashedgreen line with quartiles is the median SED of Taurus and the dotted magenta lineis the stellar photosphere.
121
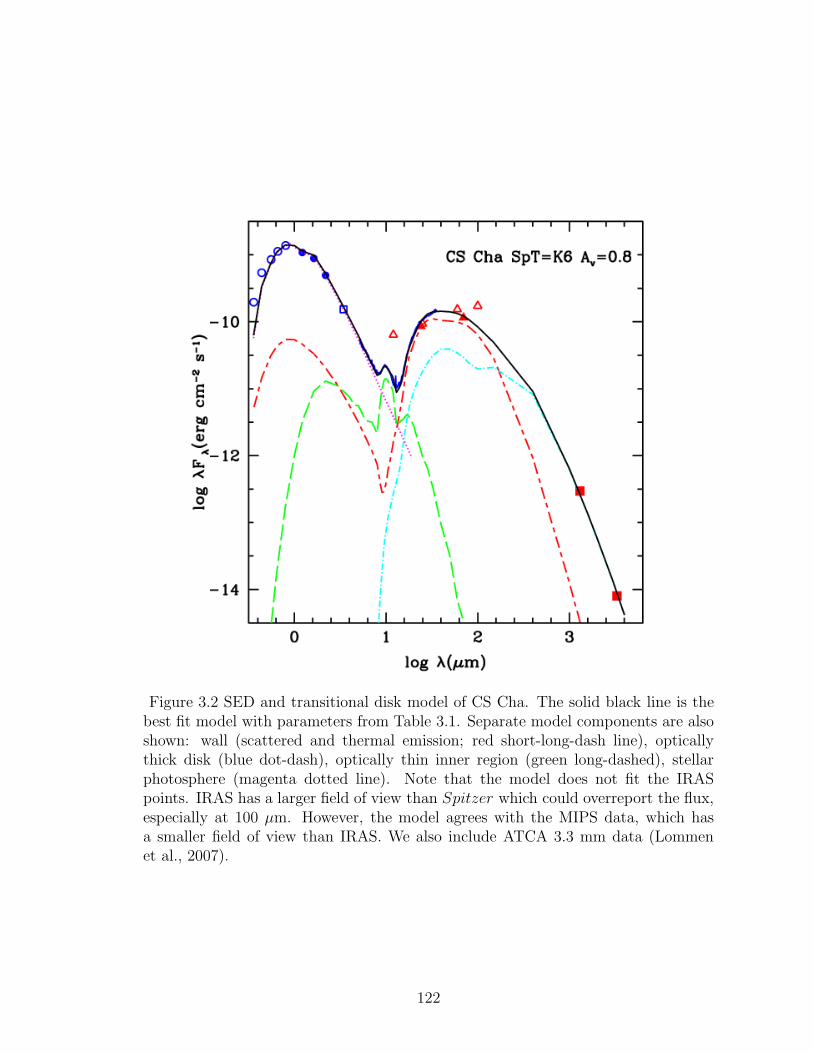
Figure 3.2 SED and transitional disk model of CS Cha. The solid black line is thebest fit model with parameters from Table 3.1. Separate model components are alsoshown: wall (scattered and thermal emission; red short-long-dash line), opticallythick disk (blue dot-dash), optically thin inner region (green long-dashed), stellarphotosphere (magenta dotted line). Note that the model does not fit the IRASpoints. IRAS has a larger field of view than Spitzer which could overreport the flux,especially at 100 μm. However, the model agrees with the MIPS data, which hasa smaller field of view than IRAS. We also include ATCA 3.3 mm data (Lommenet al., 2007).
122
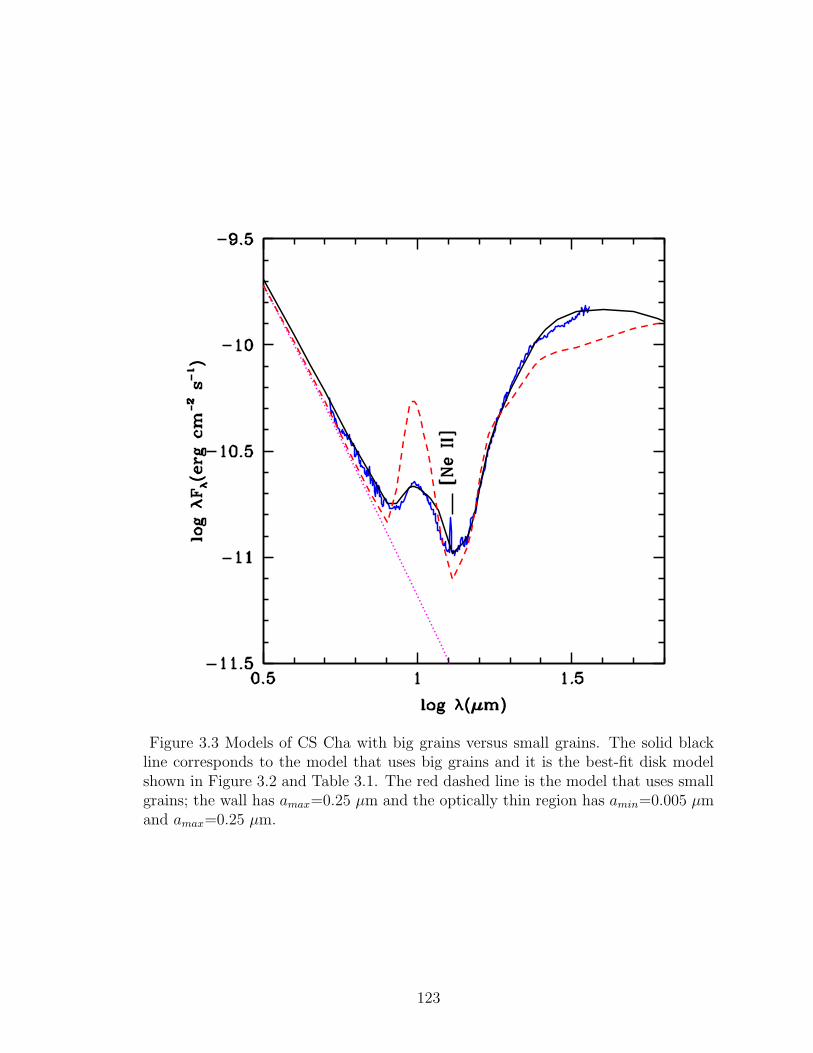
Figure 3.3 Models of CS Cha with big grains versus small grains. The solid blackline corresponds to the model that uses big grains and it is the best-fit disk modelshown in Figure 3.2 and Table 3.1. The red dashed line is the model that uses smallgrains; the wall has amax=0.25 μm and the optically thin region has amin=0.005 μmand amax=0.25 μm.
123
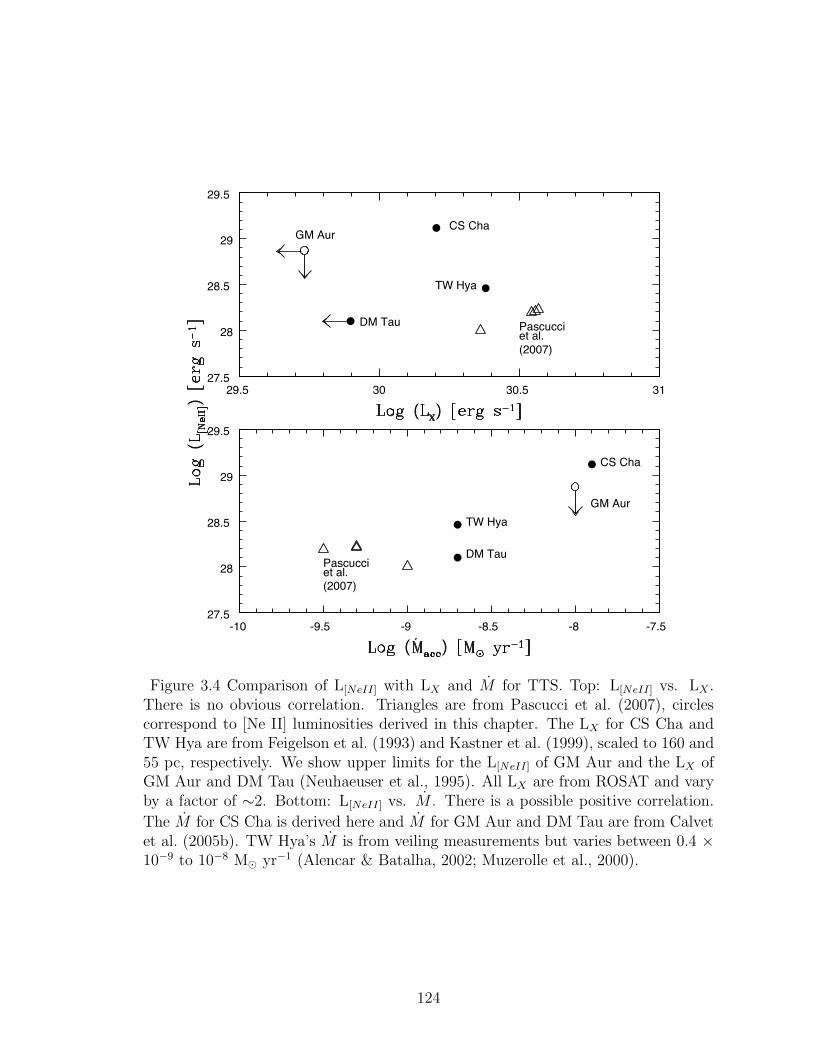
29.5 30 30.5 3127.5
28
28.5
29
29.5
CS Cha
TW Hya
DM Tau Pascucci et al. (2007)
GM Aur
-10 -9.5 -9 -8.5 -8 -7.527.5
28
28.5
29
29.5
CS Cha
TW Hya
DM TauPascucci et al. (2007)
GM Aur
Figure 3.4 Comparison of L[NeII] with LX and M for TTS. Top: L[NeII] vs. LX .There is no obvious correlation. Triangles are from Pascucci et al. (2007), circlescorrespond to [Ne II] luminosities derived in this chapter. The LX for CS Cha andTW Hya are from Feigelson et al. (1993) and Kastner et al. (1999), scaled to 160 and55 pc, respectively. We show upper limits for the L[NeII] of GM Aur and the LX ofGM Aur and DM Tau (Neuhaeuser et al., 1995). All LX are from ROSAT and varyby a factor of ∼2. Bottom: L[NeII] vs. M . There is a possible positive correlation.
The M for CS Cha is derived here and M for GM Aur and DM Tau are from Calvetet al. (2005b). TW Hya’s M is from veiling measurements but varies between 0.4 ×10⁻⁹ to 10−8 M� yr−1 (Alencar & Batalha, 2002; Muzerolle et al., 2000).
124
Chapter 4
CVSO 224: A Slowly Accreting ∼10 Myr Old
Transitional Disk in Orion OB1a
Abstract: Here we present the Spitzer IRS spectrum of CVSO 224, the sole transi-
tional disk located within the ∼10 Myr old 25 Orionis group in Orion OB1a. A model
fit to the spectral energy distribution of this object indicates a ∼7 AU inner disk
hole that contains a small amount of optically thin dust. In previous studies, CVSO
224 had been classified as a weak-line T Tauri star based on its Hα equivalent width,
but here we find an accretion rate of 7×10⁻¹¹ M� yr−1 based on high-resolution
Hectochelle observations of the Hα profile. CVSO 224’s low M is in line with photo-
evaporative clearing theories. However, the Spitzer IRS spectrum of CVSO 224 has a
substantial mid-infrared excess beyond 20 μm which indicates that it is surrounded
by a massive outer disk. Millimeter measurements are necessary to constrain the
mass of the outer disk around CVSO 224 in order to confirm that photoevaporation
is not the mechanism behind creating its inner disk hole.
4.1 Introduction
Stars surrounded by transitional disks have characteristics that fall between objects
that have clear evidence for disks and stars with no disk material. They have deficits
of infrared flux at λ < 8 μm but show strong excesses at longer wavelengths, indicating
125

that the innermost regions have undergone significant clearing of small dust grains
(Strom et al., 1989; Skrutskie et al., 1990).
The Spitzer Space Telescope has greatly improved our resolution in the infrared
and has recently provoked extensive modeling studies of several transitional disks
around T Tauri stars e.g TW Hya (Uchida et al., 2004), GM Aur, DM Tau (Calvet
et al., 2005b), CS Cha (Espaillat et al., 2007a), HD 98800B (Furlan et al., 2007),
and Hen 3-600 (Uchida et al., 2004). These objects have been explained as inwardly
truncated disks which are optically thick to the stellar radiation, with most of the
mid-infrared emission originating in the inner edge or “wall” of the outer disk. Spec-
tral energy distributions (SEDs) point to holes in these disks of less than ∼46 AU.
The inner holes of the transitional disks around DM Tau and CoKu Tau/4 are cleared
of small dust grains (D’Alessio et al., 2005; Calvet et al., 2005b) while the transi-
tional disks GM Aur, TW Hya, CS Cha, HD 98800B, and Hen 3-600 have a small yet
detectable near-infrared excess produced by some submicron and micron sized opti-
cally thin dust remaining in the inner disk hole (Calvet et al., 2005b, 2002; Espaillat
et al., 2007a; Furlan et al., 2007; Uchida et al., 2004). In addition to these disks with
holes (i.e. large reductions of small dust grains from the star out to an outer optically
thick wall), the “pre-transitional disk” class has recently been identified (Espaillat
et al., 2007b). These objects, exemplified by UX Tau A and LkCa 15, have an inner
optically thick disk separated from an outer optically thick disk by an optically thin
gap (Espaillat et al., 2007b, 2008a). See Section 1.2.2 for more details on possible
clearing mechanisms for these gaps and holes.
While most transitional disk studies have focused on objects located in 1–2 Myr
126
old star–forming regions with relatively isolated star formation, here we present de-
tailed modeling of CVSO 224, the only transitional disk located in the ∼10 Myr old
25 Orionis group (Briceno et al., 2007) in the Orion OB1a subassociation (Briceno
et al., 2005).
4.2 Observations & Data Reduction
We present the SED of CVSO 224, which is also known as 1a 1200 (Hernandez et al.,
2007) and 05254675+0143303 (2MASS), in Figure 4.1. B- and R-band photometry
were taken from the USNO database. V- and I-band photometry (Briceno et al.,
2007) as well as J-, H-, and K-band (2MASS) are shown. IRAC and MIPS data were
taken from Hernandez et al. (2007).
A value of the extinction, AV , of 0.21 for CVSO 224 is derived from fitting an
M3 photosphere (Kenyon & Hartmann, 1995) to the observations (scaled at J-band),
and the data are dereddened with the Mathis (1990) reddening law. The derived
AV is consistent with a mean extinction of 0.5 mag found toward Orion OB1a by
Calvet et al. (2005a). Stellar parameters (M∗, R∗; Table 4.1) are derived from the
HR diagram and the Siess et al. evolutionary tracks (Siess et al., 2000) using a T∗
of 3470 K (Kenyon & Hartmann, 1995) for an M3 star (Briceno et al., 2007). The
distance to 25 Orionis is 330 pc (Briceno et al., 2007).
CVSO 224 was observed by the Spitzer IRS instrument on March 8, 2006 (AOR
ID: 16264960) with the short-wavelength, low-resolution (SL) module of IRS and the
long-wavelength, low-resolution (LL) module, covering ∼5 to 40 μm, at a resolving
power of λ/δλ = 60 – 100. The observation was carried out in IRS Staring Mode.
127
We used the Spectral Modeling, Analysis, and Reduction Tool (SMART) software
package developed by the IRS instrument team (Higdon et al., 2004) to extract
and calibrate the spectrum. Furlan et al. (2006) can be consulted for further data-
reduction details.
In Figure 4.2 we show the high-resolution (R∼34,000) spectrum of CVSO 224
centered on the Hα 6563A line. It was obtained with the Hectochelle multifiber
instrument (Szentgyorgyi et al. 1998) mounted on the 6.5m MMT at Mt. Hopkins,
Arizona for the dataset presented in Briceno et al. (2007). We refer the reader to
that article for details on the observations and data reduction.
4.3 Analysis
4.3.1 Accretion Properties
According to theories of magnetospheric accretion, the inner disk is truncated by the
stellar magnetic field and material is channeled onto the star via accretion columns
(Figure 1.2). This leads to strong, broad Hα emission profiles due to the high tem-
peratures and velocities of the accreting material (Muzerolle et al., 2001). White &
Basri (2003) showed that a star is accreting if EW(Hα) ≥ 20 A for M3 stars. Ac-
cording to this criterion, CVSO 224, a M3 star (Briceno et al., 2007) with EW(Hα)
of ≤ 20 A, can be classified as a weakly accreting T Tauri star (WTTS) (Briceno
et al., 2007). However, some stars which lie just below this EW(Hα) limit could be
slow accretors (Barrado y Navascues & Martın, 2003). When analyzing the high-
resolution spectrum of CVSO 224 taken with Hectochelle (Figure 4.2) we find that
the width of the Hα profile at 10% is larger than 200 km/s indicating that this star
128
is accreting (White & Basri, 2003).
We estimated the accretion rate using the magnetospheric accretion models of
Muzerolle et al. (2001). See that paper for the details of the fitting procedure.
In short, we calculated models using the mass, radius, and effective temperature of
the star as fixed inputs. The gas temperature, density (calculated from M), and
inclination were then varied to find the best fit to the observed line profile. The
profile of CVSO 224 has a central self-reversal as seen in WTTS (e.g. Figure 1 of
Muzerolle et al. 2000), but also has broad wings and redshifted absorption. This
suggests that we are seeing signatures of both the stellar chromosphere and the
accreting material traveling in the magnetospheric field lines. Since the line core is
dominated by chromospheric emission, which is not included in the models, only the
line wings were considered in the fit. The resultant best-fit model parameters are
i=30◦, Tmax=12,000 K, M=7×10⁻¹¹ M�yr−1. The inclination angle derived here
is constrained to about 15◦ of the nominal value of 30◦ since the actual geometry
is likely much more complicated (Muzerolle et al., 2001). We adopt this value for
CVSO 224 since there is no other estimate for the inclination angle.
4.3.2 Disk Properties
When we compare CVSO 224 to the median SED of Taurus (Figure 4.1; D’Alessio
et al., 1999; Furlan et al., 2006) which has been shown to be representative of a
full disk (D’Alessio et al., 1999, 2006), it is apparent that there is a strong infrared
deficit, indicating that CVSO 224 is surrounded by a transitional disk. We follow
D’Alessio et al. (2005) to calculate the structure and emission of the optically thick
129
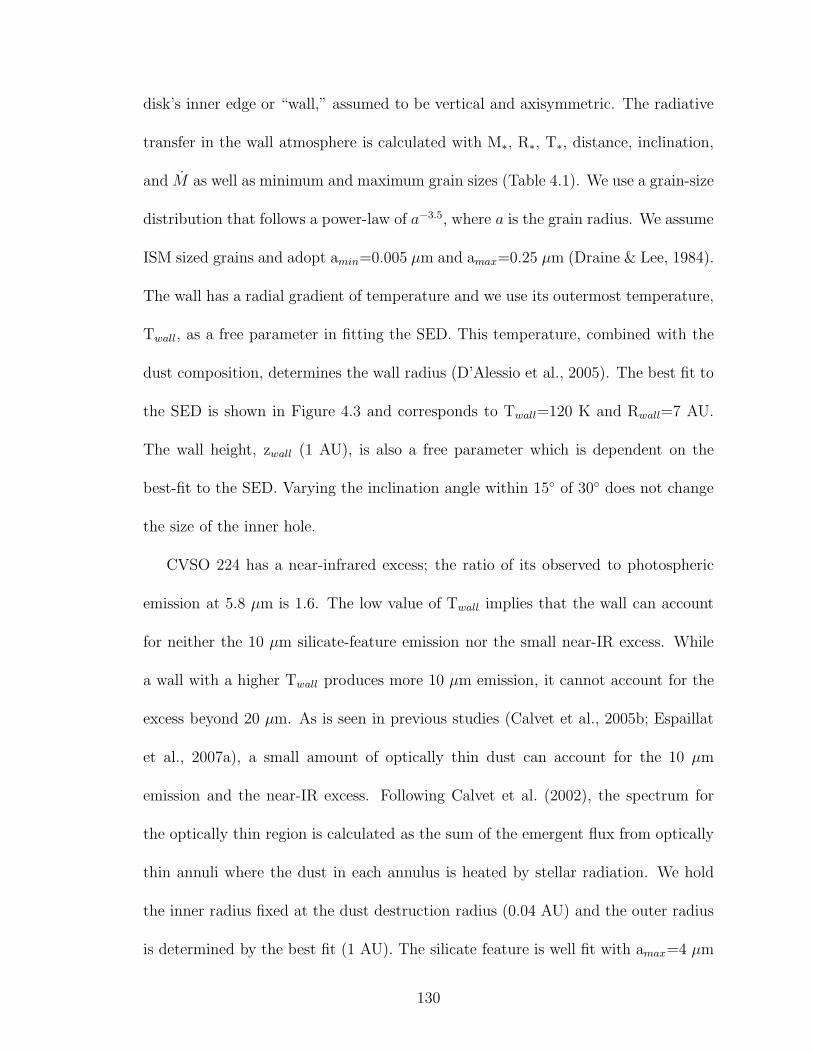
disk’s inner edge or “wall,” assumed to be vertical and axisymmetric. The radiative
transfer in the wall atmosphere is calculated with M∗, R∗, T∗, distance, inclination,
and M as well as minimum and maximum grain sizes (Table 4.1). We use a grain-size
distribution that follows a power-law of a−3.5, where a is the grain radius. We assume
ISM sized grains and adopt amin=0.005 μm and amax=0.25 μm (Draine & Lee, 1984).
The wall has a radial gradient of temperature and we use its outermost temperature,
Twall, as a free parameter in fitting the SED. This temperature, combined with the
dust composition, determines the wall radius (D’Alessio et al., 2005). The best fit to
the SED is shown in Figure 4.3 and corresponds to Twall=120 K and Rwall=7 AU.
The wall height, zwall (1 AU), is also a free parameter which is dependent on the
best-fit to the SED. Varying the inclination angle within 15◦ of 30◦ does not change
the size of the inner hole.
CVSO 224 has a near-infrared excess; the ratio of its observed to photospheric
emission at 5.8 μm is 1.6. The low value of Twall implies that the wall can account
for neither the 10 μm silicate-feature emission nor the small near-IR excess. While
a wall with a higher Twall produces more 10 μm emission, it cannot account for the
excess beyond 20 μm. As is seen in previous studies (Calvet et al., 2005b; Espaillat
et al., 2007a), a small amount of optically thin dust can account for the 10 μm
emission and the near-IR excess. Following Calvet et al. (2002), the spectrum for
the optically thin region is calculated as the sum of the emergent flux from optically
thin annuli where the dust in each annulus is heated by stellar radiation. We hold
the inner radius fixed at the dust destruction radius (0.04 AU) and the outer radius
is determined by the best fit (1 AU). The silicate feature is well fit with amax=4 μm
130
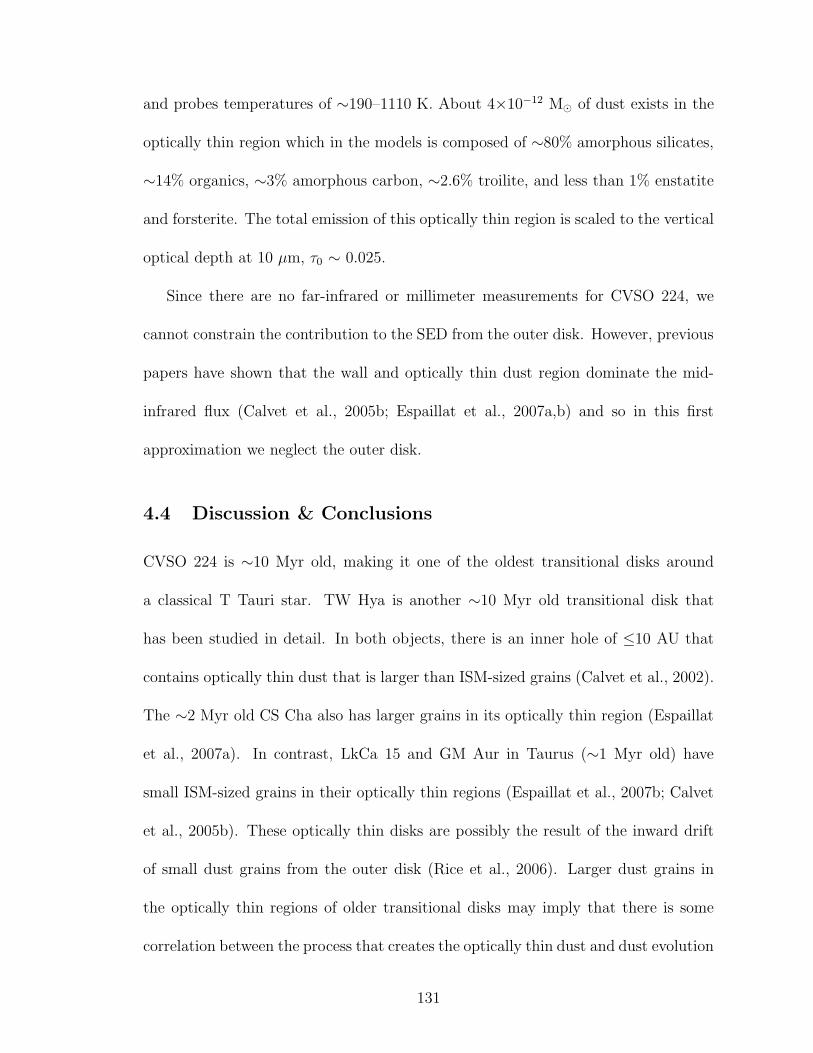
and probes temperatures of ∼190–1110 K. About 4×10⁻¹² M� of dust exists in the
optically thin region which in the models is composed of ∼80% amorphous silicates,
∼14% organics, ∼3% amorphous carbon, ∼2.6% troilite, and less than 1% enstatite
and forsterite. The total emission of this optically thin region is scaled to the vertical
optical depth at 10 μm, τ0 ∼ 0.025.
Since there are no far-infrared or millimeter measurements for CVSO 224, we
cannot constrain the contribution to the SED from the outer disk. However, previous
papers have shown that the wall and optically thin dust region dominate the mid-
infrared flux (Calvet et al., 2005b; Espaillat et al., 2007a,b) and so in this first
approximation we neglect the outer disk.
4.4 Discussion & Conclusions
CVSO 224 is ∼10 Myr old, making it one of the oldest transitional disks around
a classical T Tauri star. TW Hya is another ∼10 Myr old transitional disk that
has been studied in detail. In both objects, there is an inner hole of ≤10 AU that
contains optically thin dust that is larger than ISM-sized grains (Calvet et al., 2002).
The ∼2 Myr old CS Cha also has larger grains in its optically thin region (Espaillat
et al., 2007a). In contrast, LkCa 15 and GM Aur in Taurus (∼1 Myr old) have
small ISM-sized grains in their optically thin regions (Espaillat et al., 2007b; Calvet
et al., 2005b). These optically thin disks are possibly the result of the inward drift
of small dust grains from the outer disk (Rice et al., 2006). Larger dust grains in
the optically thin regions of older transitional disks may imply that there is some
correlation between the process that creates the optically thin dust and dust evolution
131
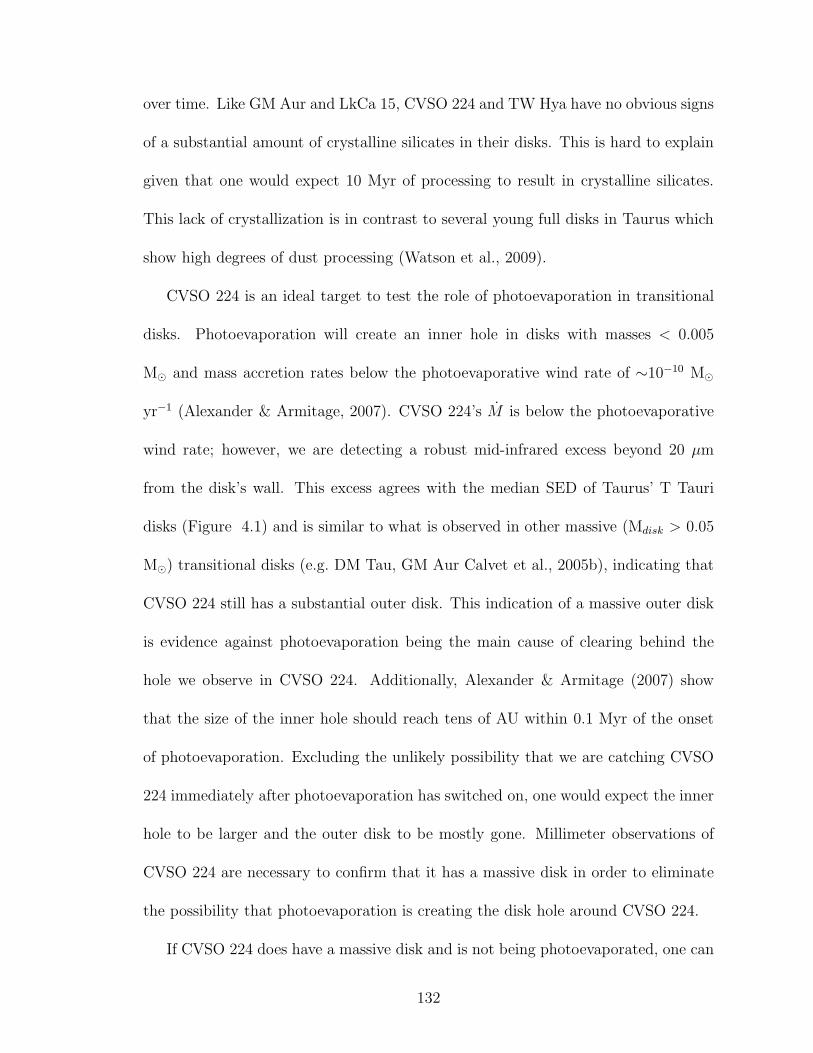
over time. Like GM Aur and LkCa 15, CVSO 224 and TW Hya have no obvious signs
of a substantial amount of crystalline silicates in their disks. This is hard to explain
given that one would expect 10 Myr of processing to result in crystalline silicates.
This lack of crystallization is in contrast to several young full disks in Taurus which
show high degrees of dust processing (Watson et al., 2009).
CVSO 224 is an ideal target to test the role of photoevaporation in transitional
disks. Photoevaporation will create an inner hole in disks with masses < 0.005
M� and mass accretion rates below the photoevaporative wind rate of ∼10−10 M�
yr−1 (Alexander & Armitage, 2007). CVSO 224’s M is below the photoevaporative
wind rate; however, we are detecting a robust mid-infrared excess beyond 20 μm
from the disk’s wall. This excess agrees with the median SED of Taurus’ T Tauri
disks (Figure 4.1) and is similar to what is observed in other massive (Mdisk > 0.05
M�) transitional disks (e.g. DM Tau, GM Aur Calvet et al., 2005b), indicating that
CVSO 224 still has a substantial outer disk. This indication of a massive outer disk
is evidence against photoevaporation being the main cause of clearing behind the
hole we observe in CVSO 224. Additionally, Alexander & Armitage (2007) show
that the size of the inner hole should reach tens of AU within 0.1 Myr of the onset
of photoevaporation. Excluding the unlikely possibility that we are catching CVSO
224 immediately after photoevaporation has switched on, one would expect the inner
hole to be larger and the outer disk to be mostly gone. Millimeter observations of
CVSO 224 are necessary to confirm that it has a massive disk in order to eliminate
the possibility that photoevaporation is creating the disk hole around CVSO 224.
If CVSO 224 does have a massive disk and is not being photoevaporated, one can
132
speculate that the M of the outer disk, Mdisk, is actually higher than the observed
accretion rate onto the star, Mstar. One way to create a situation where M star is
less than Mdisk is with planet formation. If a planet is forming in the disk, the
mass coming from the outer disk is shared by the planet and the inner disk (Lubow
& D’Angelo, 2006; Najita et al., 2007a; Alexander & Armitage, 2007). Lubow &
D’Angelo (2006) show that the mass accretion rate past a planet and into the inner
disk is 10–25 % of the mass accretion rate outside the planet’s orbit. Alternatively,
the low mass accretion rate of CVSO 224 could also be due to a stellar companion.
Hen 3-600 is another weakly accreting ∼10 Myr old transitional disk (5×10⁻¹¹ M�
yr−1; Muzerolle et al. 2000) whose hole is most likely due to dynamical clearing by
its companion (Uchida et al., 2004). Its low M also indicates that photoevaporation
should be clearing this disk, however, Hen 3-600 has a small hole (∼1 AU; Uchida et
al. 2004) and its infrared excess (Low et al., 2005) indicates a substantial outer disk.
Hen 3-600’s M star could be limited by binary tidal forces (Artymowicz & Lubow,
1996) and not be reflective of Mdisk.
CVSO 224 presents an opportune test of photoevaporation and planet formation
in older disks and further observations of this object will help clarify the role of
photoevaporation in disk clearing. Millimeter studies of CVSO 224 are necessary to
derive the mass of its outer disk. If a massive disk is present, its low M could be due
to a planetary or stellar companion and more study will be needed to distinguish
between these two scenarios.
133
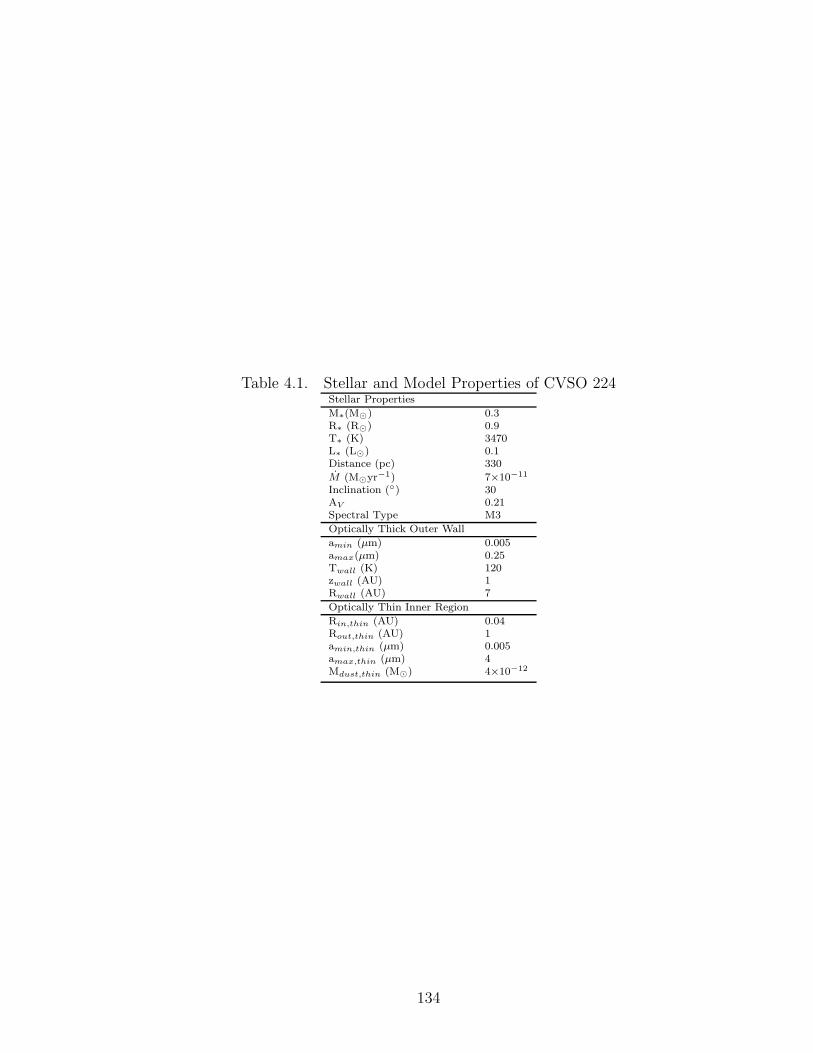
Table 4.1. Stellar and Model Properties of CVSO 224Stellar Properties
M∗(M�) 0.3R∗ (R�) 0.9T∗ (K) 3470L∗ (L�) 0.1Distance (pc) 330
M (M�yr−1) 7×10⁻¹¹
Inclination (◦) 30AV 0.21Spectral Type M3
Optically Thick Outer Wall
amin (μm) 0.005amax(μm) 0.25Twall (K) 120zwall (AU) 1Rwall (AU) 7
Optically Thin Inner Region
Rin,thin (AU) 0.04Rout,thin (AU) 1amin,thin (μm) 0.005amax,thin (μm) 4Mdust,thin (M�) 4×10⁻¹²
134
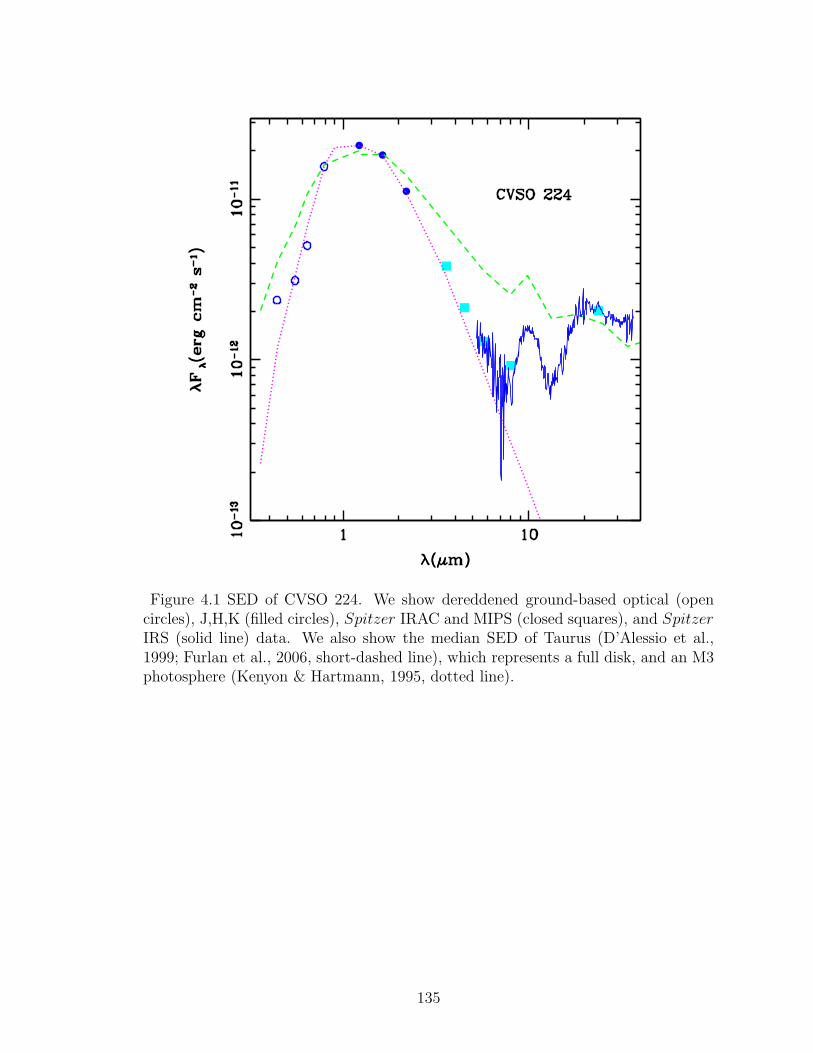
Figure 4.1 SED of CVSO 224. We show dereddened ground-based optical (opencircles), J,H,K (filled circles), Spitzer IRAC and MIPS (closed squares), and SpitzerIRS (solid line) data. We also show the median SED of Taurus (D’Alessio et al.,1999; Furlan et al., 2006, short-dashed line), which represents a full disk, and an M3photosphere (Kenyon & Hartmann, 1995, dotted line).
135
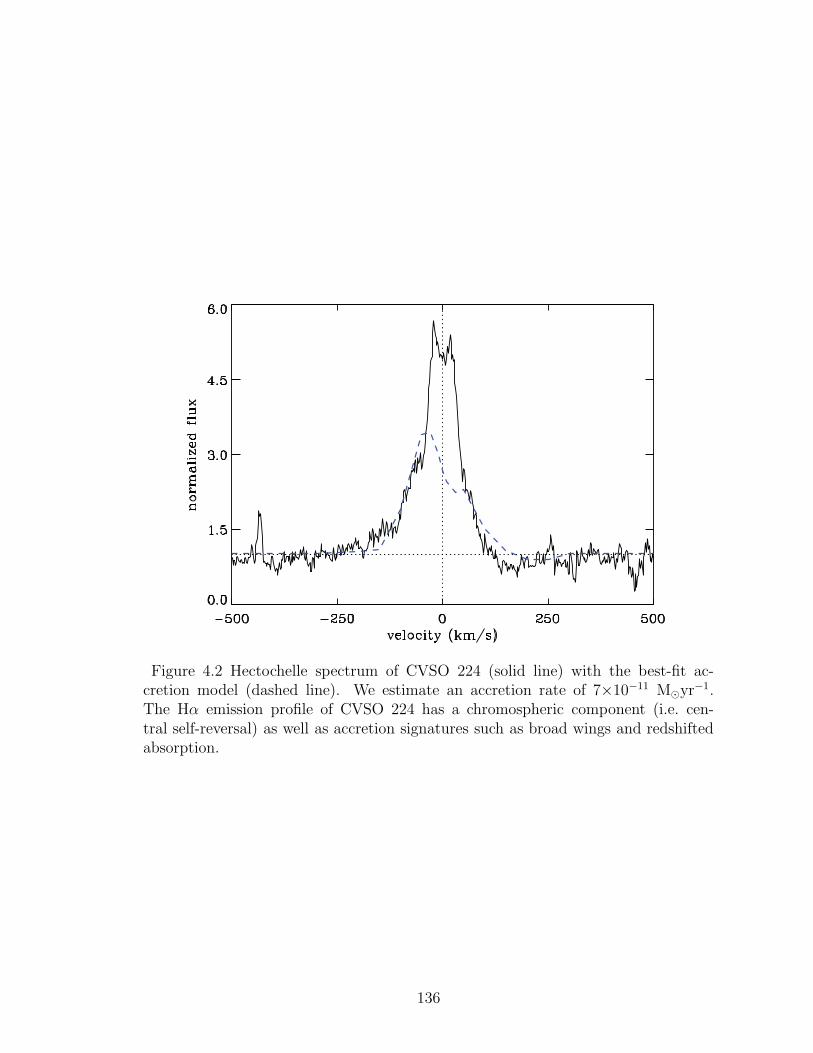
Figure 4.2 Hectochelle spectrum of CVSO 224 (solid line) with the best-fit ac-cretion model (dashed line). We estimate an accretion rate of 7×10⁻¹¹ M�yr−1.The Hα emission profile of CVSO 224 has a chromospheric component (i.e. cen-tral self-reversal) as well as accretion signatures such as broad wings and redshiftedabsorption.
136
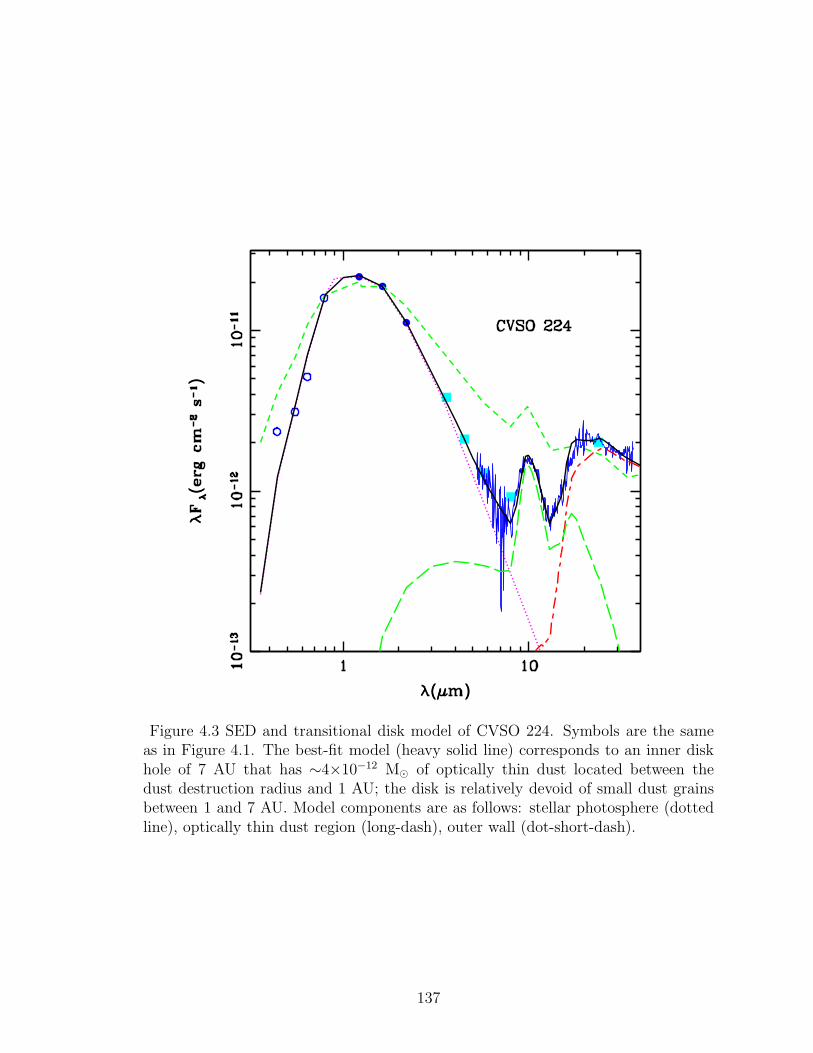
Figure 4.3 SED and transitional disk model of CVSO 224. Symbols are the sameas in Figure 4.1. The best-fit model (heavy solid line) corresponds to an inner diskhole of 7 AU that has ∼4×10⁻¹² M� of optically thin dust located between thedust destruction radius and 1 AU; the disk is relatively devoid of small dust grainsbetween 1 and 7 AU. Model components are as follows: stellar photosphere (dottedline), optically thin dust region (long-dash), outer wall (dot-short-dash).
137

Chapter 5
On the Diversity of the Taurus Transitional Disks:
UX Tau A & Lk Ca 15
Abstract: The recently recognized class of “transitional disk” systems consists of
young stars with optically-thick outer disks but inner disks which are mostly devoid
of small dust. Here we introduce a further class of “pre-transitional disks” with
significant near-infrared excesses which indicate the presence of an optically thick
inner disk separated from an optically thick outer disk; thus, the spectral energy
distributions of pre-transitional disks suggest the incipient development of disk gaps
rather than inner holes. In UX Tau A, our analysis of the Spitzer IRS spectrum
finds that the near-infrared excess is produced by an inner optically thick disk and
a gap of ∼56 AU is present. The Spitzer IRS spectrum of LkCa 15 is suggestive of
a gap of ∼46 AU, confirming previous millimeter imaging. In addition, UX Tau A
contains crystalline silicates in its disk at radii � 56 AU which poses a challenge to
our understanding of the production of this crystalline material. In contrast, LkCa
15’s silicates are amorphous and pristine. UX Tau A and LkCa 15 increase our
knowledge of the diversity of dust clearing in low-mass star formation.
138
5.1 Introduction
Previous studies have revealed stars with inner disks that are mostly devoid of small
dust, and these “transitional disks” have been proposed as the bridge between Class
II objects, young stars surrounded by full disks accreting material onto the central
star, and Class III objects, stars where the protoplanetary disk is mostly dissipated
and accretion has stopped (Strom et al., 1989; Skrutskie et al., 1990; Stassun et al.,
2001).
New spectra from the Spitzer Space Telescope which greatly improve our reso-
lution in the infrared have been used to define the class of “transitional disks” as
those with spectral energy distributions (SEDs) characterized by a significant deficit
of flux in the near-infrared relative to optically thick full disks, and a substantial
infrared excess in the mid- and far-infrared. Extensive modeling studies of several
transitional disks around T Tauri stars (D’Alessio et al., 2005; Uchida et al., 2004;
Calvet et al., 2005b; Espaillat et al., 2007a) and F-G stars (Brown et al., 2007) have
been presented. In particular, the SEDs of the transitional disks of the T Tauri stars
CoKu Tau/4 (D’Alessio et al., 2005), TW Hya (Calvet et al., 2002; Uchida et al.,
2004), GM Aur, DM Tau (Calvet et al., 2005b), and CS Cha (Espaillat et al., 2007a)
have been explained by modeling the transitional disks with truncated optically thick
disks with most of the mid-infrared emission originating in the inner edge or “wall”
of the truncated disk. In all these cases, except in CoKu Tau/4, material is accreting
onto the star, so gas remains inside the truncated disk, but with a small or negligible
amount of small dust, making these regions optically thin.
Here we present models of UX Tau A and LkCa 15, low-mass pre-main sequence
139
stars in the young, ∼1 Myr old Taurus star–forming region which have been pre-
viously reported as transitional disks (Furlan et al., 2006; Bergin et al., 2004). We
present evidence for gaps in optically thick disks, as opposed to “inner holes,” that
is, large reductions of small dust from the star out to an outer optically thick wall.
5.2 Observations & Data Reduction
Figures 5.1 and 5.2 are plots of the spectral energy distributions for UX Tau A
and LkCa 15 respectively. For Lk Ca 15, the reduction of the Spitzer Infrared Array
Camera (IRAC) images (Program 37) was done with SSC pipeline S14.0 and the
post-BCD (Basic Calibrated Data) MOPEX v030106 (Makovoz et al., 2006). We
extracted the photometry of this object using the apphot package in IRAF, with
an aperture radius of 10 pixels and a background annulus from 10 to 20 pixels.
Fluxes at 3.6, 4.5, 5.8, and 8.0 μm are 7.55, 7.35, 7.24, 6.41 mag (1 σ=0.05 mag).
The Submillimeter Array (SMA) observations of LkCa 15 were made on September
6th, 2003 using the Compact Configuration of six of the 6 meter diameter antennas
at 345 GHz with full correlator bandwidth of 2 GHz. Calibration of the visibility
phases and amplitudes was achieved with observations of the quasar 0423-013 and
0530+135, typically at intervals of 20 minutes. Observations of Uranus provided
the absolute scale for the flux density calibration and the uncertainties in the flux
scale are estimated to be 20%. The data were calibrated using the MIR software
package (http://www.cfa.harvard.edu/∼cqi/mircook.html). Fluxes at 216.5, 226.5,
345.2, and 355.2 GHz are 121.4±4.3, 152.8±5.2, 416.8±37.6, and 453.1±48.1 mJy
respectively.
140

5.3 Analysis
5.3.1 Model Parameters
We follow D’Alessio et al. (2006, 2005) to calculate the structure and emission of
the optically thick disk and the wall. Input parameters for the optically thick disk
are the stellar properties, the mass accretion rate of the disk (M), the viscosity
parameter (α), and the settling parameter ε = ζup/ζst, i.e. the mass fraction of
the small grains in the upper layers relative to the standard dust-to-gas mass ratio
(D’Alessio et al., 2006). We use a grain-size distribution that follows a power-law of
the form a−3.5, where a is the grain radius, with a minimum grain size of 0.005 μm.
In the upper, optically thin layer of the disk, the maximum grain size is 0.25 μm. In
the midplane of the disk, the maximum grain size is 1 mm. The radiative transfer
in the wall atmosphere is calculated with the stellar properties, M , the maximum
and minimum grain sizes, and the temperature of the optically thin wall atmosphere
(Twall). Table 5.1 lists the maximum grain sizes of the walls and other relevant
parameters. We use the same dust composition as Espaillat et al. (2007a) unless
otherwise noted.
In each case we use a distance of 140 pc to Taurus (Kenyon et al., 1994). We
assume an outer disk radius of 300 AU. Spectral types and stellar temperatures are
adopted from Kenyon & Hartmann (1995). Data are dereddened with the Mathis
(1990) reddening law and extinctions are derived from fitting a standard stellar pho-
tosphere (Kenyon & Hartmann, 1995) to the data. Stellar parameters (M∗, R∗, L∗)
are derived from the HR diagram and the Siess et al. evolutionary tracks (Siess
141
et al., 2000). Mass accretion rates are estimated from the U-band excess following
Gullbring et al. (1998) with a typical uncertainty of a factor of 3 (Calvet et al., 2004).
5.3.2 UX Tau A
The sharp flux increase in the SED of UX Tau A (Figure 5.1) can be modeled by an
optically thick outer disk truncated at ∼56 AU. The wall of the outer disk dominates
the flux in the mid- and far-infrared while the outer optically thick disk contributes
to most of the flux in the millimeter. We note that UX Tau A is in a multiple system
(Furlan et al., 2006), with the closest component at 2.′′6 ∼ 360 AU in projection; thus,
the outer disk may have a smaller Rdisk,out than assumed here, which may decrease
the disk mass but not the derived wall properties amax, Twall, and zwall which are
constrained by the best fit to the mid-infrared. In modeling the outer disk, we hold
M fixed and vary α; this is equivalent to finding the best-fit disk mass since Md ∝
M/α.
When compared to the median SED of Taurus (Figure 5.1; D’Alessio et al., 1999;
Furlan et al., 2006) which has been shown to be representative of an optically thick
continuous disk (D’Alessio et al., 1999, 2006), UX Tau A’s relatively strong mid-
infrared deficit makes it apparent that its disk is not continuous i.e. it is not a “full
disk.” However, in contrast with the other transitional disks found around TTS, the
near-infrared portion of UX Tau A’s SED agrees with the median SED of TTS in
Taurus; this indicates that optically thick material remains in the innermost part of
the disk in contrast to all other transitional disks modeled so far. Since the inner disk
is optically thick, it must have a sharp gas-dust transition at the dust destruction
142
radius as “full disks” in CTTS (Muzerolle et al., 2003; D’Alessio et al., 2006). In
Figure 5.1 we show the contribution from the wall of an optically thick inner disk
located at the dust destruction radius at 0.16 AU, assuming Twall=1400 K. The best
fit is obtained with large grains, in agreement with the lack of a 10 μm silicate feature.
The flux deficit in the SED around 10 μm puts an upper limit to the extent of the
inner optically thick disk to <0.18 AU.
5.3.3 Lk Ca 15
Our analysis of a model fit to LkCa 15 shows an optically thick disk truncated at
∼46 AU, as delineated by millimeter interferometric imaging (Pietu et al., 2006).
The outer optically thick disk contributes to most of the flux in the millimeter and
the wall of the outer disk contributes much of the flux in the mid- and far-infrared
(Figure 5.2).
The near-infrared portion of the SED of LkCa 15 lies below the median SED of
Taurus, so the case for an optically thick inner disk is not as clear cut as in UX Tau
A. However, the near-IR excess above the photosphere in Lk Ca 15 is substantially
higher than is seen in GM Aur (Calvet et al., 2005b), TW Hya (Calvet et al., 2002;
Uchida et al., 2004), or CS Cha (Espaillat et al., 2007a), where the optically thin inner
disk contains a small amount of dust. Our analysis suggests that an optically thick
inner disk wall at the dust destruction radius (0.12 AU) can account for the significant
near-infrared excess in Lk Ca 15 (Figure 5.2), and that the optically thick component
cannot extend beyond 0.15 AU. We also require 4×10⁻¹¹ M� of optically thin dust
between 0.15 and 5 AU to produce the 10 μm silicate feature. This optically thin dust
143
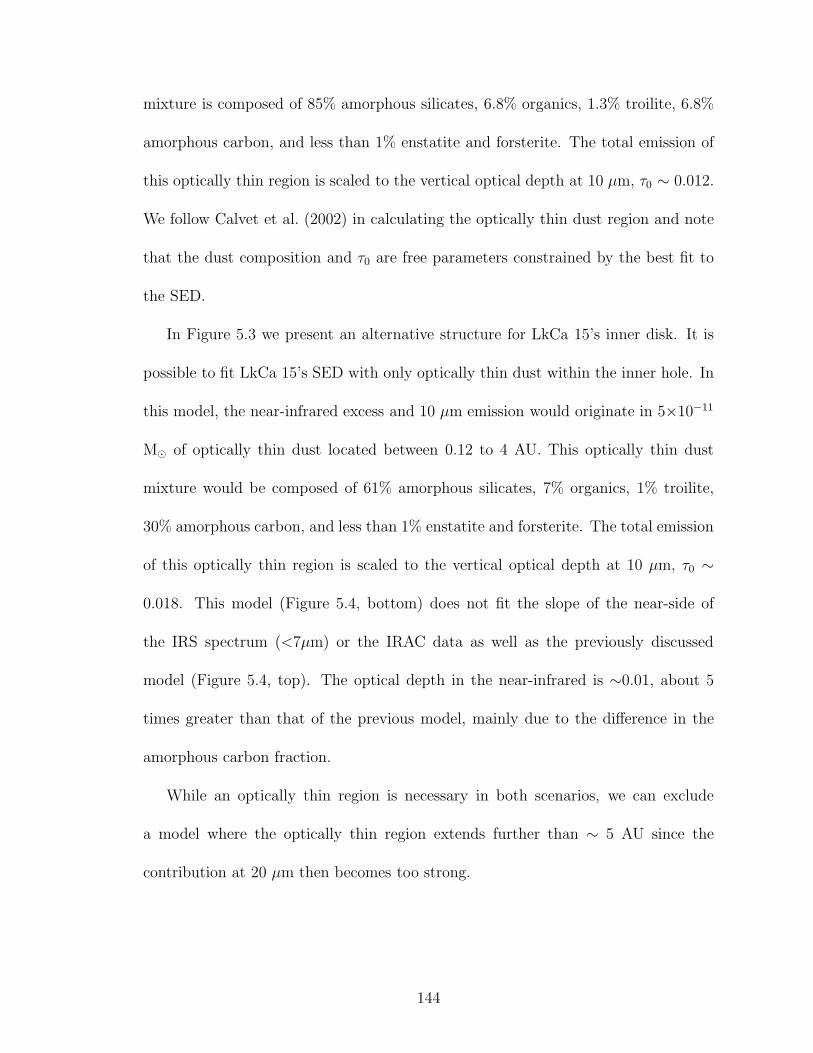
mixture is composed of 85% amorphous silicates, 6.8% organics, 1.3% troilite, 6.8%
amorphous carbon, and less than 1% enstatite and forsterite. The total emission of
this optically thin region is scaled to the vertical optical depth at 10 μm, τ0 ∼ 0.012.
We follow Calvet et al. (2002) in calculating the optically thin dust region and note
that the dust composition and τ0 are free parameters constrained by the best fit to
the SED.
In Figure 5.3 we present an alternative structure for LkCa 15’s inner disk. It is
possible to fit LkCa 15’s SED with only optically thin dust within the inner hole. In
this model, the near-infrared excess and 10 μm emission would originate in 5×10⁻¹¹
M� of optically thin dust located between 0.12 to 4 AU. This optically thin dust
mixture would be composed of 61% amorphous silicates, 7% organics, 1% troilite,
30% amorphous carbon, and less than 1% enstatite and forsterite. The total emission
of this optically thin region is scaled to the vertical optical depth at 10 μm, τ0 ∼
0.018. This model (Figure 5.4, bottom) does not fit the slope of the near-side of
the IRS spectrum (<7μm) or the IRAC data as well as the previously discussed
model (Figure 5.4, top). The optical depth in the near-infrared is ∼0.01, about 5
times greater than that of the previous model, mainly due to the difference in the
amorphous carbon fraction.
While an optically thin region is necessary in both scenarios, we can exclude
a model where the optically thin region extends further than ∼ 5 AU since the
contribution at 20 μm then becomes too strong.
144
5.4 Discussion & Conclusions
Here we introduce the “pre-transitional disk” class where we see the incipient develop-
ment of disk gaps in optically thick protoplanetary disks as evidenced by significant
near-infrared excesses when compared to the Taurus median SED and previously
studied transitional disks (D’Alessio et al., 2005; Calvet et al., 2002; Uchida et al.,
2004; Calvet et al., 2005b; Espaillat et al., 2007a). The pre-transitional disk of UX
Tau A has a ∼56 AU gap as opposed to an inner hole. It is also possible to fit LkCa
15’s SED with a ∼46 AU gap that contains some optically thin dust; a model that
has a hole rather than a gap also fits its SED and future near-infrared interferometry
may be able to discriminate between these models. However, the truncation of LkCa
15’s outer disk at ∼46 AU is consistent with resolved millimeter interferometric ob-
servations (Pietu et al., 2006) which makes it one of three inner disk holes imaged in
the millimeter (TW Hya: Hughes et al. (2007); GM Aur: Hughes et al. (2009)). In
addition to our sample, the disks around F-G stars studied by Brown et al. (2007)
also belong to the pre-transitional disk category. The large gaps that are being de-
tected in pre-transitional disks are most likely due to observational bias since larger
gaps will create larger mid-infrared deficits in the SED. Smaller gaps will most likely
have less apparent dips in their SEDS and be more difficult to identify, however, if
their gaps contain some optically thin material the silicate emission in these objects
should be much stronger than can be explained by a full disk model.
The existence of an inner optically thick disk may be an indicator of the first
stages of disk clearing that will eventually lead to the the inner holes that have been
seen in previously reported transitional disks; this has important implications on
145
disk evolution theories since only planet-formation can account for this structure.
Hydrodynamical simulations have shown that a newly formed planet could accrete
and sweep out the material around it through tidal disturbances (Quillen et al.,
2004), even maintaining substantial accretion rates (Varniere et al., 2006). Moreover,
Najita et al. (2007a) have found that the intrinsic properties of transitional disks
may favor planet formation. Another proposed formation mechanism for the holes in
transitional disks is photoevaporation, in which a photoevaporative wind halts mass
accretion towards the inner disk and material in this inner disk is rapidly evacuated
creating an inner hole (Clarke et al., 2001); the hole then increases in size as the
edge continues photoevaporating (Alexander & Armitage, 2007). Neither this model
nor the inside-out evacuation induced by the MRI (Chiang & Murray-Clay, 2007)
would explain how an optically thick inner disk accreting at a sizable accretion rate
(see Table 5.1) would remain inside the hole. Rapid dust growth and settling has
also been proposed to explain the holes in disks (Dullemond & Dominik, 2004, 2005).
Again, this does not account for the presence of optically thick inner disk material
given that theory suggests grain growth should be fastest in the inner disk, not at
some intermediate radius (Dullemond & Dominik, 2004, 2005; Weidenschilling et al.,
1997).
Our sample also has interesting dust compositions (Watson et al., 2009). LkCa
15 has an amorphous silicate feature indicating little if any processing leading to
the crystallization seen in other young stars. Amorphous silicates are also seen in
CoKu Tau/4, DM Tau, and GM Aur (Sargent et al., 2006). In contrast, UX Tau
A is different from all the other transitional disks because it has crystalline silicate
146
emission features in addition to amorphous silicate emission features (Figure 5.1
inset). The wall at ∼56 AU is the main contributor to the crystalline silicate emission
since it dominates the flux in the mid- and far-infrared. This raises the question of
whether crystalline silicates are created close to the star or if they can be created in
situ at ∼56 AU. If the former, it challenges current radial-mixing theories, none of
which can get significant amounts of crystalline silicates out to this distance (Gail,
2001; Bockelee-Morvan et al., 2002; Keller & Gail, 2004). One possibility for in
situ processing may be collisions of larger bodies, which might produce small grains
heated sufficiently to create crystals (S. Kenyon, private communication).
Pre-transitional disks offer further insight into the diversity of the “transitional
disk” class and future studies of these disks will greatly advance our understanding
of disk evolution and planet formation.
147
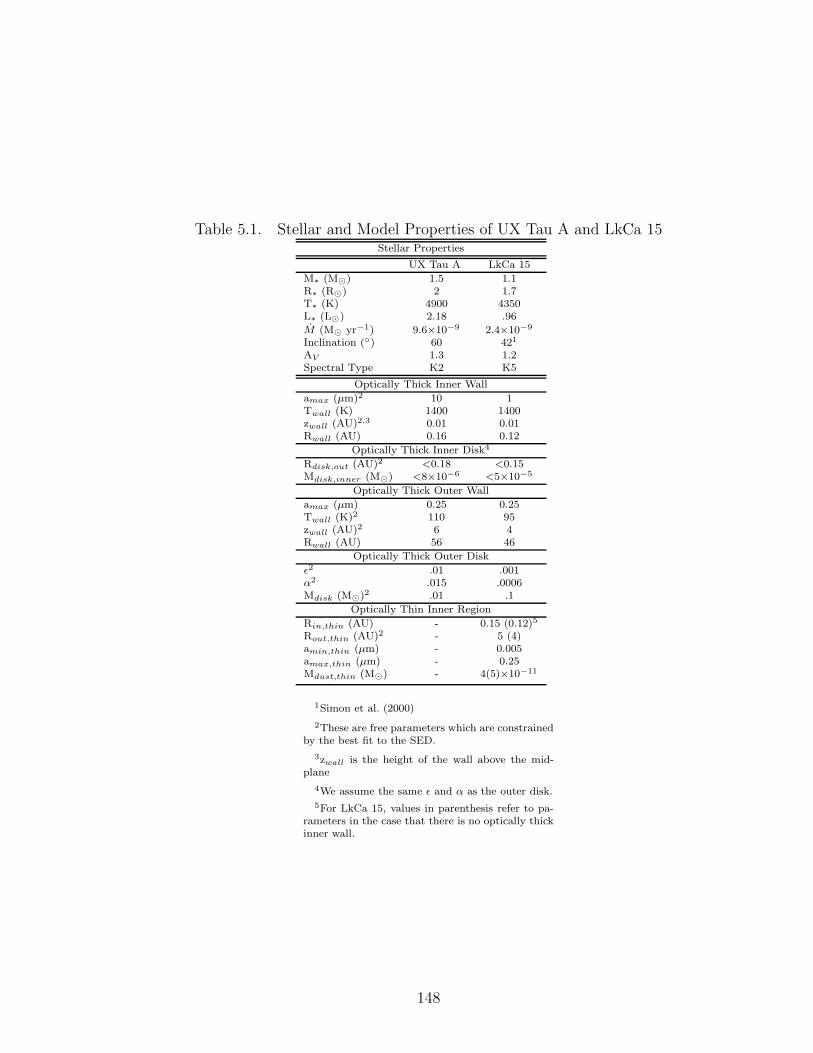
Table 5.1. Stellar and Model Properties of UX Tau A and LkCa 15Stellar Properties
UX Tau A LkCa 15
M∗ (M�) 1.5 1.1R∗ (R�) 2 1.7T∗ (K) 4900 4350L∗ (L�) 2.18 .96
M (M� yr−1) 9.6×10⁻⁹ 2.4×10⁻⁹
Inclination (◦) 60 421
AV 1.3 1.2Spectral Type K2 K5
Optically Thick Inner Wall
amax (μm)2 10 1Twall (K) 1400 1400zwall (AU)2,3 0.01 0.01Rwall (AU) 0.16 0.12
Optically Thick Inner Disk4
Rdisk,out (AU)2 <0.18 <0.15Mdisk,inner (M�) <8×10⁻⁶ <5×10⁻⁵
Optically Thick Outer Wall
amax (μm) 0.25 0.25Twall (K)2 110 95zwall (AU)2 6 4Rwall (AU) 56 46
Optically Thick Outer Disk
ε2 .01 .001α2 .015 .0006Mdisk (M�)2 .01 .1
Optically Thin Inner Region
Rin,thin (AU) - 0.15 (0.12)5
Rout,thin (AU)2 - 5 (4)amin,thin (μm) - 0.005amax,thin (μm) - 0.25Mdust,thin (M�) - 4(5)×10−11
1Simon et al. (2000)
2These are free parameters which are constrainedby the best fit to the SED.
3zwall is the height of the wall above the mid-plane
4We assume the same ε and α as the outer disk.
5For LkCa 15, values in parenthesis refer to pa-rameters in the case that there is no optically thickinner wall.
148
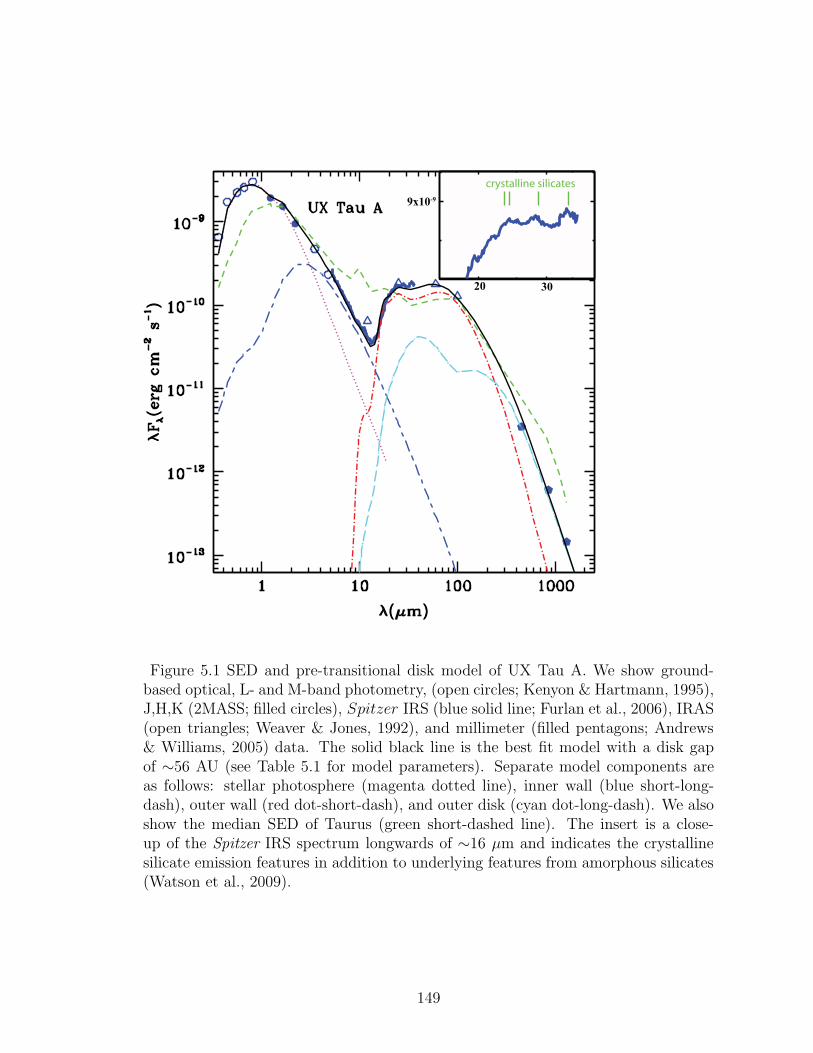
3020
9x10⁻⁹crystalline silicates
Figure 5.1 SED and pre-transitional disk model of UX Tau A. We show ground-based optical, L- and M-band photometry, (open circles; Kenyon & Hartmann, 1995),J,H,K (2MASS; filled circles), Spitzer IRS (blue solid line; Furlan et al., 2006), IRAS(open triangles; Weaver & Jones, 1992), and millimeter (filled pentagons; Andrews& Williams, 2005) data. The solid black line is the best fit model with a disk gapof ∼56 AU (see Table 5.1 for model parameters). Separate model components areas follows: stellar photosphere (magenta dotted line), inner wall (blue short-long-dash), outer wall (red dot-short-dash), and outer disk (cyan dot-long-dash). We alsoshow the median SED of Taurus (green short-dashed line). The insert is a close-up of the Spitzer IRS spectrum longwards of ∼16 μm and indicates the crystallinesilicate emission features in addition to underlying features from amorphous silicates(Watson et al., 2009).
149
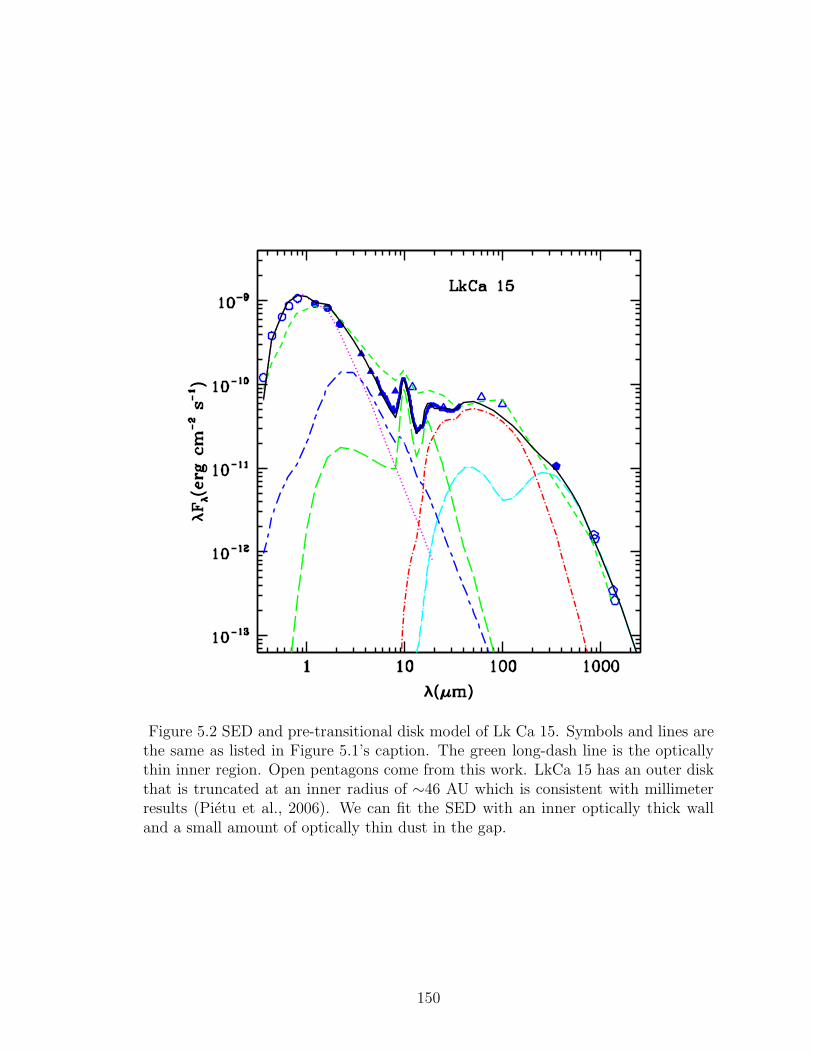
Figure 5.2 SED and pre-transitional disk model of Lk Ca 15. Symbols and lines arethe same as listed in Figure 5.1’s caption. The green long-dash line is the opticallythin inner region. Open pentagons come from this work. LkCa 15 has an outer diskthat is truncated at an inner radius of ∼46 AU which is consistent with millimeterresults (Pietu et al., 2006). We can fit the SED with an inner optically thick walland a small amount of optically thin dust in the gap.
150
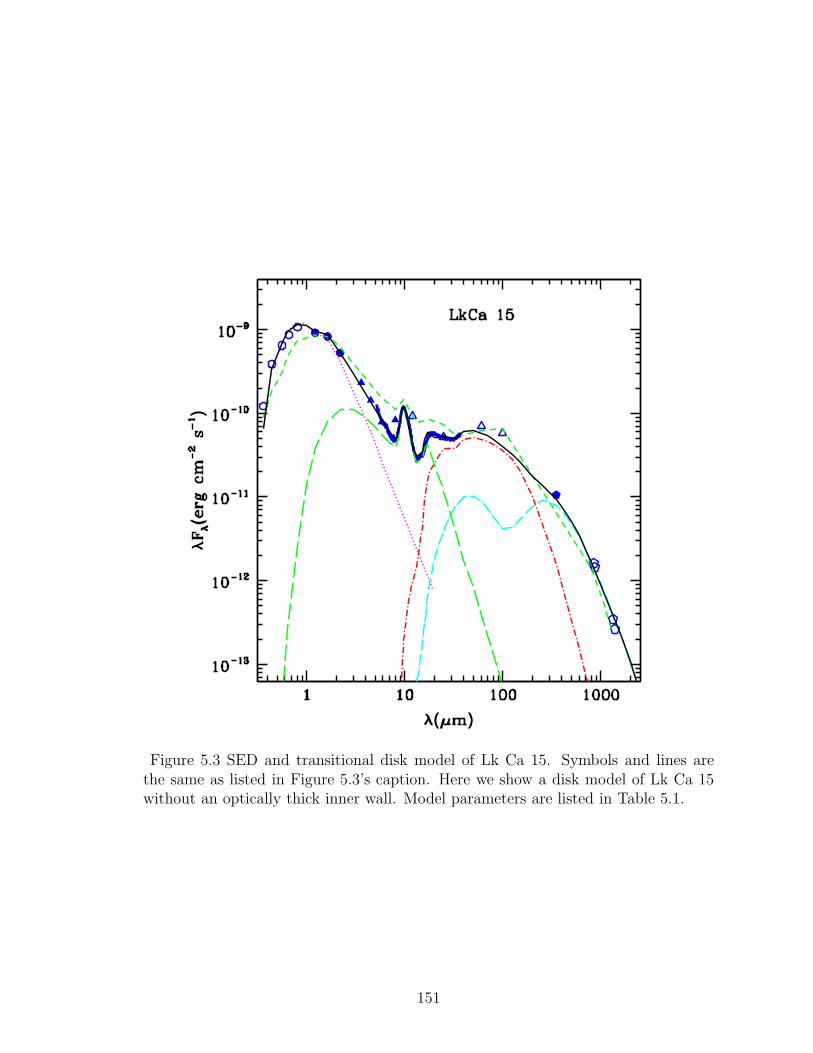
Figure 5.3 SED and transitional disk model of Lk Ca 15. Symbols and lines arethe same as listed in Figure 5.3’s caption. Here we show a disk model of Lk Ca 15without an optically thick inner wall. Model parameters are listed in Table 5.1.
151
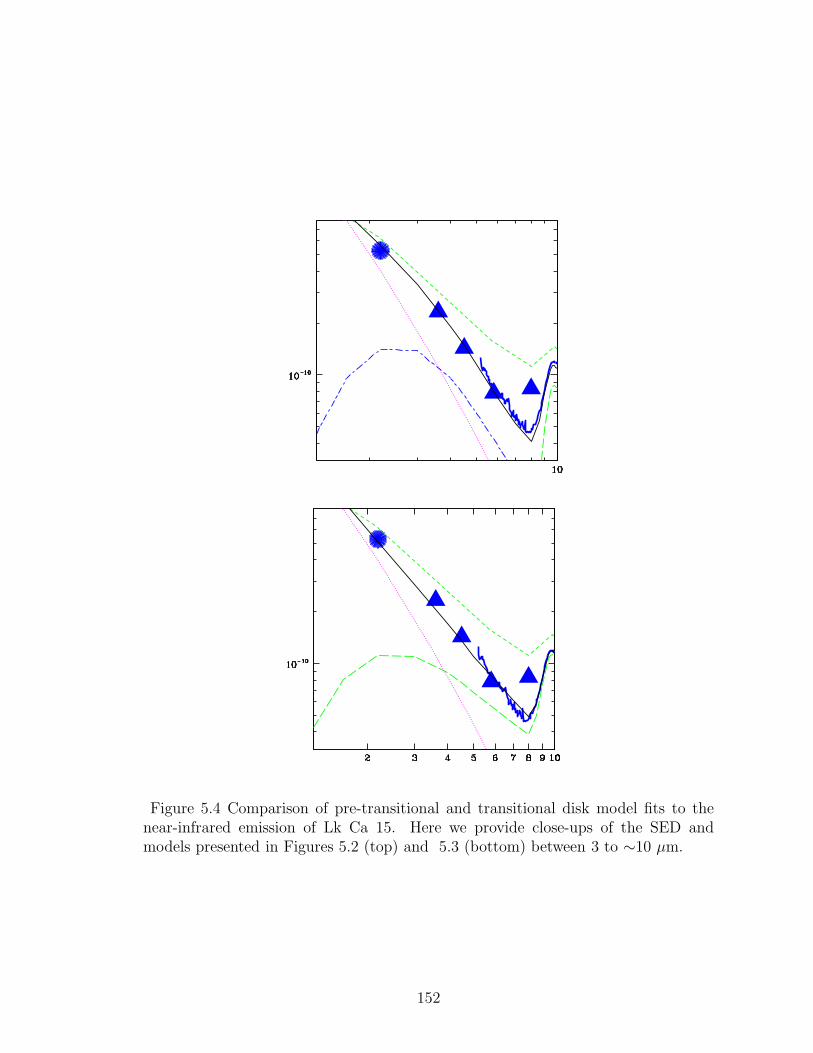
Figure 5.4 Comparison of pre-transitional and transitional disk model fits to thenear-infrared emission of Lk Ca 15. Here we provide close-ups of the SED andmodels presented in Figures 5.2 (top) and 5.3 (bottom) between 3 to ∼10 μm.
152
Chapter 6
Confirmation of a Gapped Primordial Disk
Around LkCa 15
Abstract: Recently, analysis of near-infrared broad-band photometry and Spitzer
IRS spectra has led to the identification of a new “pre-transitional disk” class whose
members have an inner optically thick disk separated from an outer optically thick
disk by an optically thin gap. This is in contrast to the “transitional disks” which
have inner disk holes (i.e. large reductions of small dust from the star out to an
outer optically thick wall). In LkCa 15, one of these proposed pre-transitional disks,
detailed modeling showed that although the near-infrared fluxes could be understood
in terms of optically thick material at the dust sublimation radius, an alternative
model of emission from optically thin dust over a wide range of radii could explain
the observations as well. To unveil the true nature of LkCa 15’s inner disk we obtained
a medium-resolution near-infrared spectrum spanning the wavelength range 2-5 μm
using SpeX at the NASA Infrared Telescope Facility. We report that the excess near-
infrared emission above the photosphere of LkCa 15 is a black-body continuum which
can only be due to optically thick material in an inner disk around the star. When
this confirmation of a primordial inner disk is combined with earlier observations of
an inner edge to LkCa 15’s outer disk it reveals a gapped structure. Forming planets
153

emerge as the most likely mechanism for clearing the gap we detect in this evolving
disk.
6.1 Introduction
The origin of a star and its planets is intricately tied to the evolution of the sys-
tem’s primordial accretion disk. These disks are composed of gas and dust and are
formed in the collapse of the star’s natal, molecular cloud (Terebey et al., 1984). As
time passes, the dust grains in these primordial disks evolve: they collide and stick,
eventually growing in size and perhaps forming planetary systems much like our own
(Weidenschilling et al., 1997). The finer details of how the disk material evolves from
an initially well-mixed distribution of gas and dust to a system composed mostly of
large solids like our own solar system is not well understood.
In recent years a growing number of primordial disks with signatures of dust evo-
lution hinting to the early stages of planet formation have been identified. Most of
these cases, dubbed “transitional disks,” (Strom et al., 1989) consist of stars with in-
ner holes in their disks that are mostly devoid of material. Within the past few years,
observations at mid-infrared wavelengths by the Spitzer Space Telescope have led us
to define transitional disks as those objects with small or negligible near-infrared flux
excesses over photospheric fluxes but with a substantial excess in the mid-infrared
and beyond. This flux deficit at near-infrared wavelengths relative to full disks ac-
creting material onto the star has been explained by modeling transitional disks as
optically thick disks with inner cleared regions; the mid-infrared emission originates
in the inner edge or “wall” of the truncated disk which is frontally illuminated by the
154
star (Calvet et al., 2005b). A small number of these transitional disks with detailed
Spitzer IRS spectra have been analyzed to date. The estimated truncation radii of
these disks cover a wide range, from ∼4 AU in DM Tau (Calvet et al., 2005b) to 46
AU in CS Cha (Espaillat et al., 2007a). Transitional disks have been found in all
ages where protoplanetary disks have been identified, from the ∼1–2 yr old Taurus
population (Calvet et al., 2005b) to the 10 Myr old TW Hya association (Calvet
et al., 2002) and 25 Ori (Espaillat et al., 2008b). In each case, the disk is accreting
mass onto the star so we can conclude that gas is being transported through the in-
ner cleared disk. In addition, in some cases a small amount of micron or sub-micron
dust coexists with the gas in this region, giving rise to an excess over photospheric
fluxes detected in the near infrared. Details of the distribution of this optically
thin dust are largely unknown, although near-infrared interferometric observations
suggest that this material is highly structured (Ratzka et al., 2007).
A new class of evolving disks has been identified very recently. Disks in this
class have inwardly truncated outer disks, as the transitional disks. However, their
significantly larger near-infrared excess, comparable to that of full disks, points to the
existence of a remaining optically thick disk separated by a gap from the outer disk. A
handful of these disks have been analyzed to date, including four around intermediate
mass stars (Brown et al., 2007) and two around classical T Tauri stars (Espaillat et al.,
2007b). In two of these cases, LkCa 15 and LkHα 330, millimeter interferometry has
confirmed the truncation of the outer disk (Pietu et al., 2006; Brown et al., 2008)
in agreement with the SED modeling (Espaillat et al., 2007b; Brown et al., 2007).
However, the substantial near-infrared excess of LkCa 15 could be explained by either
155
optically thick material or by 5×10⁻¹¹ M� of optically thin dust mixed with the gas
in the inner disk (Espaillat et al., 2007b). These contradictory hypotheses cannot
not be properly tested with the existing near-infrared data, which consists of 2MASS
and Spitzer broad-band photometry.
Here, we present detailed spectroscopic data that allows us to unambiguously
search for optically thick material in the inner disk of LkCa 15, a CTTS in the
Taurus cloud, in which an outer disk truncated at 46 AU has been imaged in the
millimeter (Pietu et al., 2006). We confirm that LkCa 15 belongs to the new class
of disks around young stellar objects, the “pre-transitional disks,” (Espaillat et al.,
2007b) where a gap is opening within the disk around a low mass pre-main sequence
star.
6.2 Observations & Data Reduction
We obtained a 2–5 μm spectrum of LkCa 15 with SpeX at the NASA Infrared
Telescope Facility (IRTF) (Rayner et al., 2003) on December 3, 2007. The spectrum
was reduced with Spextool (Cushing et al., 2004) and dereddened with the Mathis
dereddening law (Mathis, 1990) and an AV of 1.2 (Espaillat et al., 2007b). For our
template spectrum we use HD36003 (K5 V) which corresponds to the spectral type
of LkCa 15 (Kenyon & Hartmann, 1995) and was obtained from the IRTF Spectral
Library.1 In Figure 6.1 we present the medium resolution near-infrared spectra of
LkCa 15 and the K5 dwarf template.
1http://irtfweb.ifa.hawaii.edu/∼spex/IRTF Spectral Library/
156
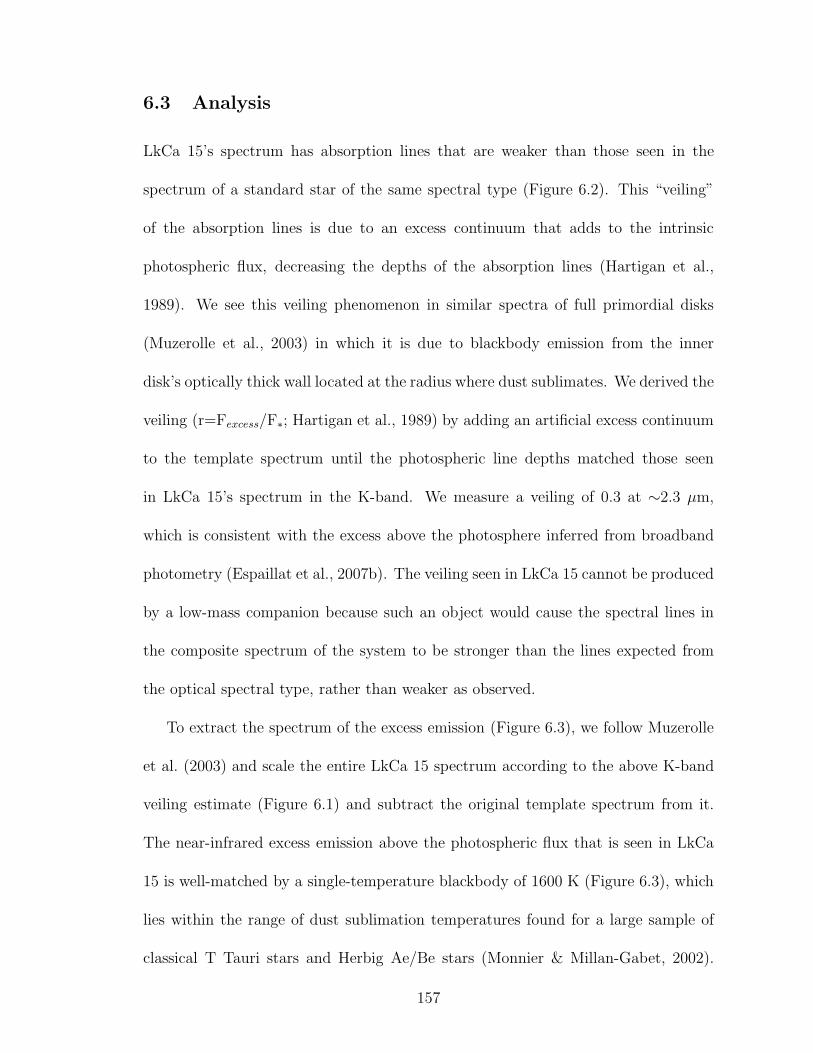
6.3 Analysis
LkCa 15’s spectrum has absorption lines that are weaker than those seen in the
spectrum of a standard star of the same spectral type (Figure 6.2). This “veiling”
of the absorption lines is due to an excess continuum that adds to the intrinsic
photospheric flux, decreasing the depths of the absorption lines (Hartigan et al.,
1989). We see this veiling phenomenon in similar spectra of full primordial disks
(Muzerolle et al., 2003) in which it is due to blackbody emission from the inner
disk’s optically thick wall located at the radius where dust sublimates. We derived the
veiling (r=Fexcess/F∗; Hartigan et al., 1989) by adding an artificial excess continuum
to the template spectrum until the photospheric line depths matched those seen
in LkCa 15’s spectrum in the K-band. We measure a veiling of 0.3 at ∼2.3 μm,
which is consistent with the excess above the photosphere inferred from broadband
photometry (Espaillat et al., 2007b). The veiling seen in LkCa 15 cannot be produced
by a low-mass companion because such an object would cause the spectral lines in
the composite spectrum of the system to be stronger than the lines expected from
the optical spectral type, rather than weaker as observed.
To extract the spectrum of the excess emission (Figure 6.3), we follow Muzerolle
et al. (2003) and scale the entire LkCa 15 spectrum according to the above K-band
veiling estimate (Figure 6.1) and subtract the original template spectrum from it.
The near-infrared excess emission above the photospheric flux that is seen in LkCa
15 is well-matched by a single-temperature blackbody of 1600 K (Figure 6.3), which
lies within the range of dust sublimation temperatures found for a large sample of
classical T Tauri stars and Herbig Ae/Be stars (Monnier & Millan-Gabet, 2002).
157
From this we conclude that the near-infrared excess of LkCa 15 originates from the
wall of an optically thick inner disk located at the dust destruction radius. When
these results are interpreted with previous Spitzer IRS and millimeter observations,
we can firmly state that this object has a gapped disk structure (Figure 6.4), making
LkCa 15 a member of the pre-transitional disk class.
6.4 Discussion & Conclusions
Unseen planets (Quillen et al., 2004; Rice et al., 2003) have been proposed to clear
out the large cavities within the primordial disks around GM Aur (Calvet et al.,
2005b), DM Tau (Calvet et al., 2005b), TW Hya (Calvet et al., 2002; Uchida et al.,
2004; Hughes et al., 2007), and CoKu Tau/4 (D’Alessio et al., 2005). However,
several other explanations are also possible. The inner disk holes in most of these
“transitional disks” can be explained by inside-out evacuation mechanisms like the
magneto-rotational instability (MRI; Chiang & Murray-Clay, 2007). In addition, a
stellar companion can inwardly truncate the outer disk as is most likely the cause of
the inner hole of CoKu Tau/4 (Ireland & Kraus, 2008).
Alexander & Armitage (2007) found that the accretion rates and disk masses of
GM Aur, DM Tau, and TW Hya suggest planet formation in these systems. This
still does not discount that the MRI is the main clearing agent in the inner disk given
that this mechanism is still viable in the presence of a planet. Consequently, inner
disk holes are not conclusive signatures of planet formation.
The origin of the gap in LkCa 15 can be evaluated against different mechanisms
that have been proposed to clear the inner disk, namely the MRI, photoevaporation,
158
stellar companions, and planet formation. The MRI operates on the ionized, frontally
illuminated wall of the inner disk and allows material to accrete onto the star leading
to inside-out clearing (Chiang & Murray-Clay, 2007); the MRI cannot account for
a remnant optically thick inner disk. In the photoevaporation model, a stellar wind
creates a small gap and halts the inward accretion of mass. Without replenishment
the inner disk quickly accretes onto the central star and only then can the hole grow
outward (Clarke et al., 2001). When the hole is about 46 AU, as is seen in LkCa 15,
no inner disk remains (Alexander & Armitage, 2007) so LkCa 15’s gap cannot be due
to photoevaporation. A companion star would have to be located at about 18 – 26
AU (Artymowicz & Lubow, 1994) in order to truncate the outer disk at 46 AU and
studies of LkCa 15 have revealed no stellar mass companion down to about 4 AU
(Leinert et al., 1993; Ireland & Kraus, 2008). Planet formation emerges as the most
likely explanation since a planet can create a gap about its orbit (Paardekooper &
Mellema, 2004; Varniere et al., 2006). The large gap of LkCa 15, which encompasses
the orbits of Mercury (.4 AU) and Neptune (30 AU), raises the interesting possibility
that we are seeing clearing due to multiple planets which would suggest that LkCa
15 may be an early analog of our own Solar system.
In conclusion, our observations confirm the presence of an inner optically thick
disk in LkCa 15. The existence of optically thick material inside a truncated disk pro-
vides significant insight into the models presented to date to explain the transitional
disks and calls for more detailed studies of this new class of disk.
159
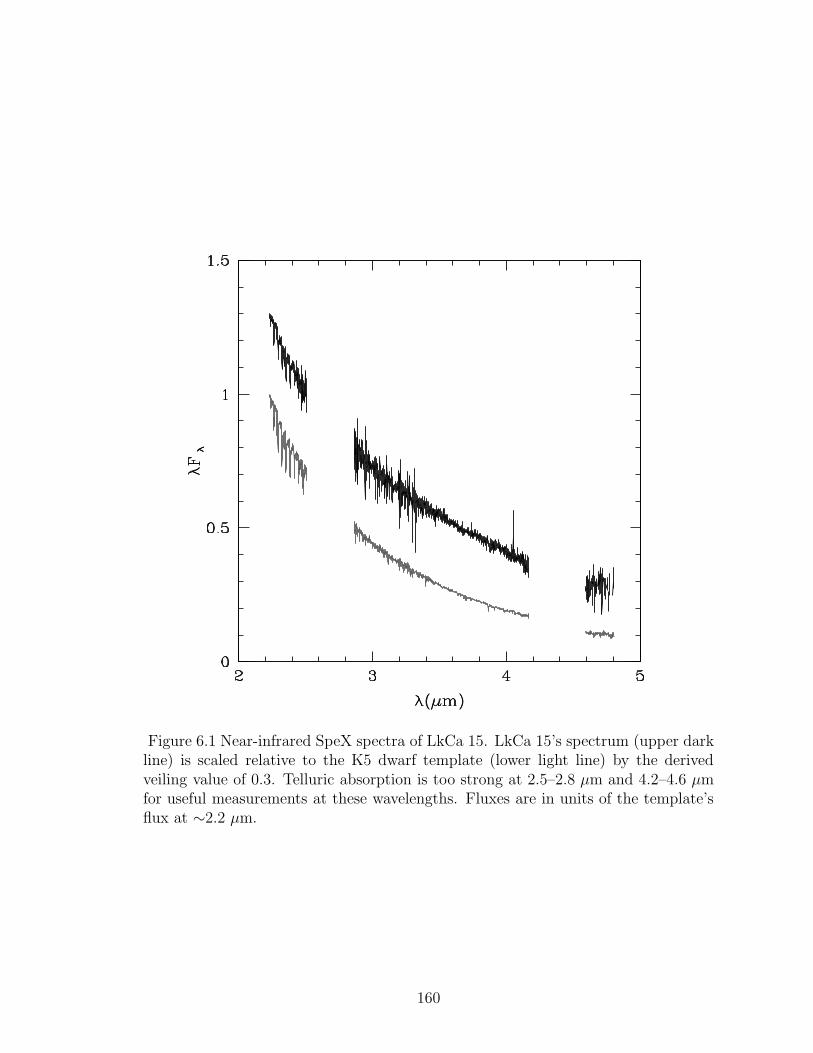
Figure 6.1 Near-infrared SpeX spectra of LkCa 15. LkCa 15’s spectrum (upper darkline) is scaled relative to the K5 dwarf template (lower light line) by the derivedveiling value of 0.3. Telluric absorption is too strong at 2.5–2.8 μm and 4.2–4.6 μmfor useful measurements at these wavelengths. Fluxes are in units of the template’sflux at ∼2.2 μm.
160
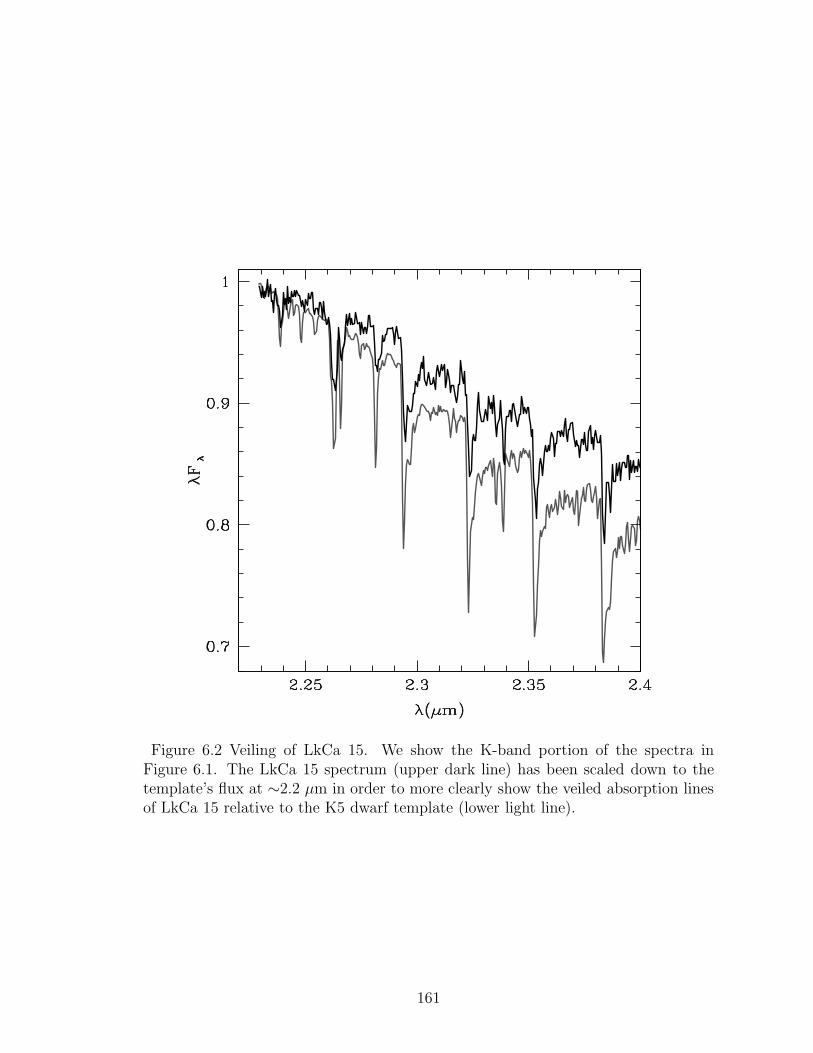
Figure 6.2 Veiling of LkCa 15. We show the K-band portion of the spectra inFigure 6.1. The LkCa 15 spectrum (upper dark line) has been scaled down to thetemplate’s flux at ∼2.2 μm in order to more clearly show the veiled absorption linesof LkCa 15 relative to the K5 dwarf template (lower light line).
161
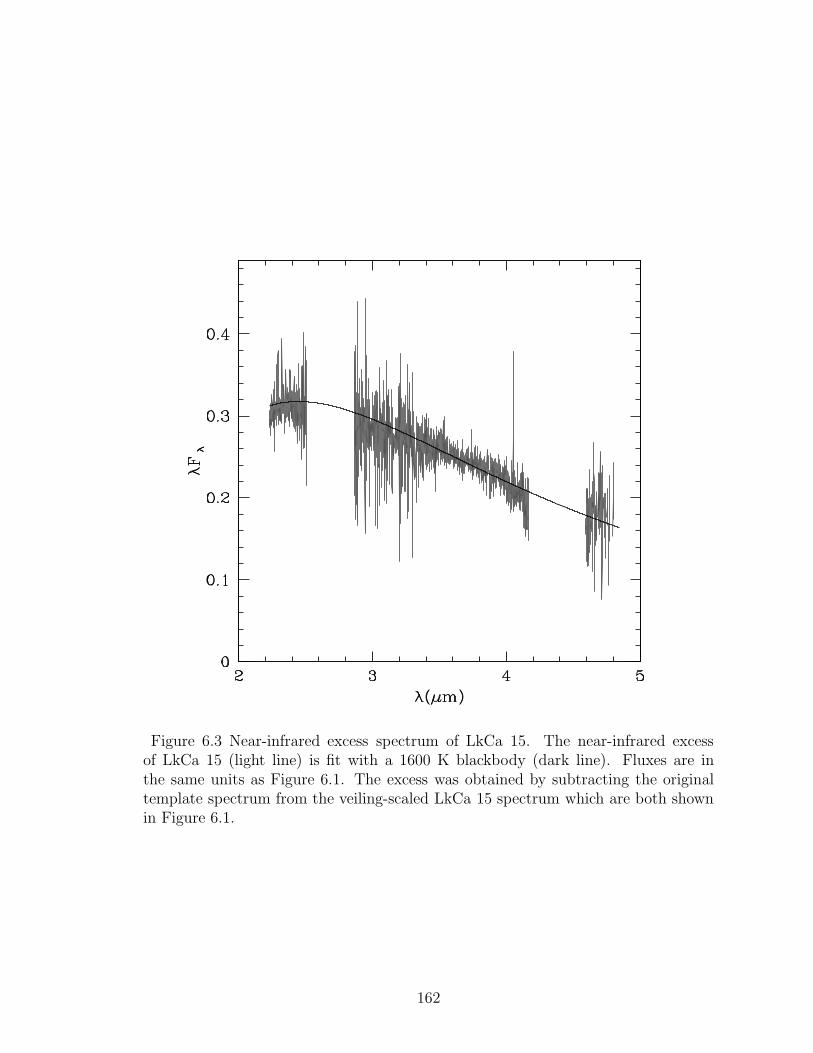
Figure 6.3 Near-infrared excess spectrum of LkCa 15. The near-infrared excessof LkCa 15 (light line) is fit with a 1600 K blackbody (dark line). Fluxes are inthe same units as Figure 6.1. The excess was obtained by subtracting the originaltemplate spectrum from the veiling-scaled LkCa 15 spectrum which are both shownin Figure 6.1.
162
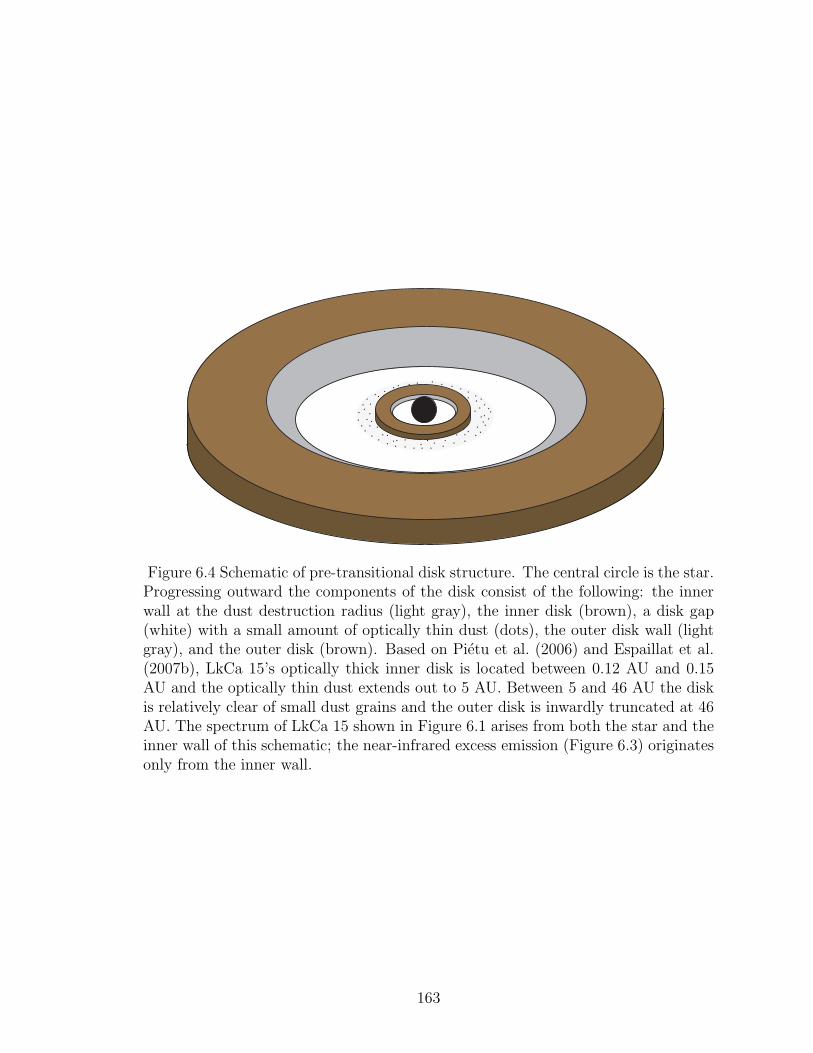
Figure 6.4 Schematic of pre-transitional disk structure. The central circle is the star.Progressing outward the components of the disk consist of the following: the innerwall at the dust destruction radius (light gray), the inner disk (brown), a disk gap(white) with a small amount of optically thin dust (dots), the outer disk wall (lightgray), and the outer disk (brown). Based on Pietu et al. (2006) and Espaillat et al.(2007b), LkCa 15’s optically thick inner disk is located between 0.12 AU and 0.15AU and the optically thin dust extends out to 5 AU. Between 5 and 46 AU the diskis relatively clear of small dust grains and the outer disk is inwardly truncated at 46AU. The spectrum of LkCa 15 shown in Figure 6.1 arises from both the star and theinner wall of this schematic; the near-infrared excess emission (Figure 6.3) originatesonly from the inner wall.
163
Chapter 7
Unveiling the Innermost Regions of Disks with
Gaps and Holes
Abstract: In the past few years several disks with inner holes that are relatively
empty of small dust grains have been detected and are known as transitional disks.
Recently, Spitzer has identified a new class of “pre-transitional disks” which have an
optically thick inner disk separated from an optically thick outer disk by an optically
thin disk gap. Near-infrared spectra with SpeX provided the first confirmation of a
gap in the pre-transitional disk of LkCa 15 by verifying that the near-infrared excess
emission in this object was due to an optically thick inner disk. In this chapter, we
present similar data for UX Tau A and demonstrate it has a pre-transitional disk
as well. We also present SpeX spectra of the transitional disks DM Tau and GM
Aur, and illustrate the differences between the inner disks of pre-transitional and
transitional disks.
7.1 Introduction
Several disks which have nearly photospheric near-infrared emission but substantial
excesses above the stellar photosphere at wavelengths beyond ∼20 μm have been
observed and are referred to as “transitional disks” (Strom et al., 1989). Using data
from the Spitzer Infrared Spectrograph (Houck et al., 2004), detailed modeling has
164
demonstrated that this flux deficit at near-infrared wavelengths relative to full disks
can be explained by optically thick disks with inner holes of < 40 AU (e.g. Calvet
et al., 2005b; Espaillat et al., 2007a, 2008b). In most cases these inner holes are not
completely devoid of material (e.g. GM Aur, TW Hya, CS Cha, CVSO 224); a small
amount of micron or submicron optically thin dust exists within the hole, giving rise
to a small infrared excess over photospheric fluxes as well as silicate emission (Calvet
et al., 2005b; Espaillat et al., 2007a, 2008b). Gas has also been detected within the
inner holes of transitional disks (e.g. Bergin et al., 2004; Salyk et al., 2007)
Recently, Spitzer identified a new class of “pre-transitional disks” around LkCa
15 and UX Tau A (Espaillat et al., 2007b). These disks have deficits of mid-infrared
flux (5 μm – 20 μm) and substantial excesses at longer wavelengths, as is seen
in the transitional disks. However, in contrast to the small near-infrared (2 μm
– 5 μm) excesses exhibited by some transitional disks, pre-transitional disks have
significant near-infrared excesses relative to their stellar photospheres, comparable
to the median spectral energy distribution of disks in Taurus (D’Alessio et al., 1999).
The distinctive shapes of these SEDs indicate that pre-transitional disks have an inner
disk separated from an outer disk and that we may be seeing the development of gaps
within protoplanetary disks. As a result, observations of these pre-transitional disks
provide a unique insight into the process of dust clearing since their structure is most
likely due to planet formation and not to other inside-out clearing mechanisms such
as photoevaporation (Clarke et al., 2001), the magnetorotational instability (Chiang
& Murray-Clay, 2007), or grain growth (Dullemond & Dominik, 2005) which have
been proposed to explain the inner holes of transitional disks.
165
While LkCa 15’s outer disk truncation at 46 AU has been imaged in the mil-
limeter (Pietu et al., 2006), Espaillat et al. (2007b) showed that the substantial
near-infrared excess of LkCa 15 could be explained by either optically thick mate-
rial or by ∼10−11 M� of optically thin dust mixed with the gas in the inner disk.
In order to resolve this issue, Espaillat et al. (2008a) obtained a medium resolution
near-infrared SpeX spectrum spanning the wavelength range 2 – 5 μm. This near-
infrared spectrum had absorption lines that were weaker relative to the spectrum of
a standard star of the same spectral type. This phenomena, called “veiling,” is also
observed in similar spectra of full disks and is explained by emission from dust lo-
cated at the dust sublimation radius (Muzerolle et al., 2003). Espaillat et al. (2008a)
measured a veiling factor (rK ; Hartigan et al., 1989) of 0.3±0.1 for LkCa 15 at ∼2.3
μm and fit the near-infrared excess from 2 – 5 μm with a single-temperature black-
body of 1600 K. These SpeX data confirmed that LkCa 15 had an inner optically
thick disk, making this observation the first independent verification of a gap in a
protoplanetary disk.
Espaillat et al. (2007b)’s identification of UX Tau A as a pre-transitional disk was
based on analysis of broad-band 2MASS and Spitzer IRAC photometry. In order to
further assess the nature of its inner disk, we present a near-infrared SpeX spectrum
of UX Tau A and confirm its gapped disk structure. To explore the differences
between the inner disks of pre-transitional and transitional disks we present similar
data for DM Tau and GM Aur. We present the spectrum of the weak T Tauri
star LkCa 14 and use this diskless star to test our measurement methods. We also
determine spectral types for our targets based on FAST optical spectra.
166

7.2 Observations & Data Reduction
Spectra for LkCa 14, DM Tau, GM Aur, and UX Tau A were obtained at the NASA
Infrared Telescope Facility facility using SpeX (Rayner et al., 2003). The dates of
the observations, the exposure times, and the signal-to-noise ratios for each target
are given in Table 7.1. We used the Long XD2.1 grating, covering 2.1 to 5.0 μm,
with a slit of 0.′′5×15′′ for a resolution (λ/δλ) of 1500. We extracted the data with
Spextool (Cushing et al., 2004) and corrected for telluric absorption using the xtellcor
routine (Vacca et al., 2003). Our telluric standards for LkCa 14, DM Tau, GM Aur,
and UX Tau A were HD25175, HD27761, HD27777, and HD30739, respectively. Bad
pixels and regions of high telluric noise (2.5–2.9 μm and 4.2–4.6 μm) were manually
removed from the spectra.
Low-dispersion optical spectra for our sample were obtained in 1995 and 1996
using the 1.5 m telescope of the Whipple Observatory with the FAst Spectrograph
for the Tillinghast Telescope (FAST) spectrograph (Fabricant et al., 1998), equipped
with the Loral 512×2688 CCD. The spectrograph was set up in the standard con-
figuration used for FAST COMBO projects, a 300 groove mm−1 grating and a 300′′
wide slit. This combination offers 3400 A of spectral coverage centered at 5500 A,
with a resolution of ∼6 A. The spectra were reduced at the Harvard-Smithsonian
Center for Astrophysics using software developed specifically for FAST COMBO ob-
servations. All individual spectra were wavelength-calibrated and combined using
standard IRAF routines.
167

7.3 Analysis
Classical T Tauri stars tend to have observed photospheric absorption lines which
are weaker than those of non-accreting stars. This “veiling” (Hartigan et al., 1989)
is due to an excess continuum which adds to the star’s emission and “fills in” stellar
absorption lines, making them appear weaker. In the optical and shorter wavelengths,
this is primarily due to the hot continuum which arises from the accretion shock onto
the star (Calvet & Gullbring, 1998). In the near-infrared, for stars which are not
strong accretors, veiling of photospheric absorption lines is mainly due to dust in the
disk (Muzerolle et al., 2003).
Here we extract the excess continuum due to dust by measuring the amount of
veiling of the target in the K-band. We estimated veiling by comparing the line
strengths in the target to those of a standard star of the same spectral type. Spectra
of standard stars were obtained from the IRTF Spectral Library (Rayner, J. T., Cush-
ing, M. C., Vacca, W. D. 2009, in preparation; Cushing et al., 2005).1 To measure the
veiling present in each target, we artificially veiled the standard spectra by adding a
continuum of Fexcess = r × Fstandard where r is the veiling factor (=Fexcess/F∗). The
standard spectra were veiled until the depths of the absorption lines matched those of
the target spectrum in the region from 2.20 – 2.28 μm. We then scaled the target by
1 + rK and subtracted the standard spectrum to measure the shape of near-infrared
excess emission. In order to measure the effect of adopting different spectral types on
the derived rK and excess emission, we compare the targets to a range of standards
based on spectral types derived previously in the literature and in this work.
1http://irtfweb.ifa.hawaii.edu/∼spex/IRTF Spectral Library/
168
Veiling measurements are dependent on the spectral types which are adopted. In
order to obtain a more accurate estimate on the veiling, we derived spectral types for
LkCa 14, DM Tau, GM Aur, and UX Tau A using FAST optical spectra. Spectral
types were obtained using the SPTCLASS tool,2 an IRAF/IDL code based on the
methods described in Hernandez et al. (2004). For LkCa 14 we find a spectral type of
K5.5±1.0; for UX Tau A we find G6.0±1.0; DM Tau has a spectral type of M1.5±1.0
and we find GM Aur has a spectral type of K5.5±1.0 (Table 7.2). In Figures 7.1
and 7.2 we illustrate the accuracy of the fitting procedure in the cases of UX Tau A
and GM Aur, respectively. In G-type stars, the metallic lines play an important role
in classifying the spectrum and in later type stars the molecular bands become more
important. The features used to classify UX Tau A are the Ca I, G-band (CH), Na
I, and Fe I lines. For GM Aur, the molecular bands TiO and CaH were used.
7.3.1 LkCa 14
In order to test our method of measuring the veiling and excess emission of TTS,
we analyzed the spectrum of LkCa 14, a single (White & Ghez, 2001), non-accreting
diskless T Tauri star in Taurus (Kenyon & Hartmann, 1995). The expectation is that
this object should have no K-band veiling since it does not exhibit excess emission
at near- and mid-IR wavelengths in its SED. We measure the veiling in LkCa 14 by
comparing its K-band spectrum to that of spectral standards. To explore the effect of
using different standards on our analysis, we adopted standards with spectral types
which agreed with that found by Herbig et al. (1986, M0) as well as those that fall
2http://www.astro.lsa.umich.edu/∼hernandj/SPTclass/sptclass.html
169
within the spectral classification errors from the previous section (K5.5±1.0). We
use standards with spectral types of M0 V (HD19305), K5 V (HD36003), and K7 V
(HD237903) and note that the IRTF library does not have spectra for K4 V or K6
V. In Figure 7.3, LkCa 14 is compared to each of the adopted standards and we find
that LkCa 14 has no veiling (rK=0±0.1) relative to each.
In order to extract the excess emission from 2–5 μm, if present, we first deredden
the spectra. The standards from the IRTF library have already been corrected for
reddening. We dereddened the spectrum of LkCa 14 using the visual extinction
derived from comparing B-, V- (Høg et al., 2000), R-band (Norton et al., 2007),
and 2MASS photometry to stellar photospheres from Kenyon & Hartmann (1995).
Assuming spectral types of M0, K5, and K7 for LkCa 14, we derive AV =0 in each
case. After scaling LkCa 14 to match the standard’s flux at 2.2 μm and subtracting
the standard (Figure 7.4), we find that there is no excess emission. When LkCa 14
is compared to a K5 standard (top, Figure 7.4) there is a small excess between ∼ 3.5
and 4.2 μm which is most likely due to errors in the spectral slopes of the objects.
We conclude that, as expected, LkCa 14 has no veiling and no excess emission.
7.3.2 UX Tau A
UX Tau A is a single star (White & Ghez, 2001, A. Kraus, private communication)
which is surrounded by a pre-transitional disk (Espaillat et al., 2007b). Its outer
wall is located at ∼56 AU and its gap is devoid of small dust grains. Earlier in this
chapter, we find a spectral type of G6.0±1.0 for UX Tau A. Here we compare UX
Tau A to spectral types of G6.5 V (HD115617) and G8 V (HD101501) which fall
170
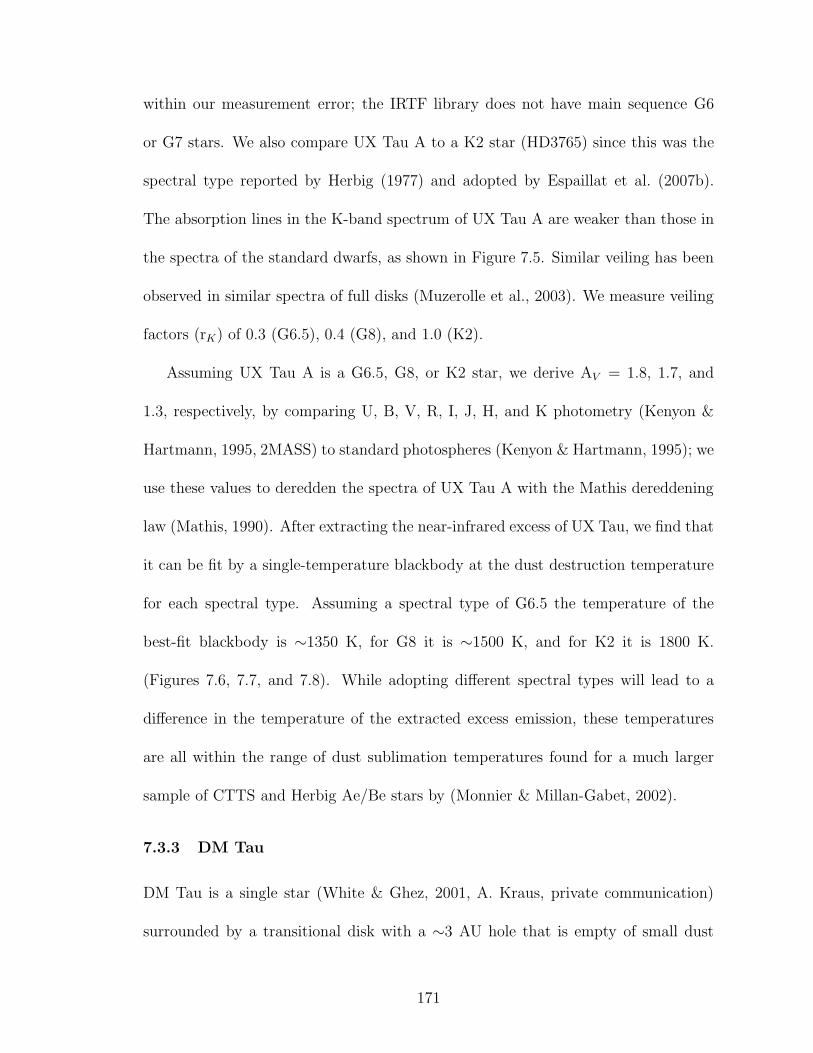
within our measurement error; the IRTF library does not have main sequence G6
or G7 stars. We also compare UX Tau A to a K2 star (HD3765) since this was the
spectral type reported by Herbig (1977) and adopted by Espaillat et al. (2007b).
The absorption lines in the K-band spectrum of UX Tau A are weaker than those in
the spectra of the standard dwarfs, as shown in Figure 7.5. Similar veiling has been
observed in similar spectra of full disks (Muzerolle et al., 2003). We measure veiling
factors (rK) of 0.3 (G6.5), 0.4 (G8), and 1.0 (K2).
Assuming UX Tau A is a G6.5, G8, or K2 star, we derive AV = 1.8, 1.7, and
1.3, respectively, by comparing U, B, V, R, I, J, H, and K photometry (Kenyon &
Hartmann, 1995, 2MASS) to standard photospheres (Kenyon & Hartmann, 1995); we
use these values to deredden the spectra of UX Tau A with the Mathis dereddening
law (Mathis, 1990). After extracting the near-infrared excess of UX Tau, we find that
it can be fit by a single-temperature blackbody at the dust destruction temperature
for each spectral type. Assuming a spectral type of G6.5 the temperature of the
best-fit blackbody is ∼1350 K, for G8 it is ∼1500 K, and for K2 it is 1800 K.
(Figures 7.6, 7.7, and 7.8). While adopting different spectral types will lead to a
difference in the temperature of the extracted excess emission, these temperatures
are all within the range of dust sublimation temperatures found for a much larger
sample of CTTS and Herbig Ae/Be stars by (Monnier & Millan-Gabet, 2002).
7.3.3 DM Tau
DM Tau is a single star (White & Ghez, 2001, A. Kraus, private communication)
surrounded by a transitional disk with a ∼3 AU hole that is empty of small dust
171
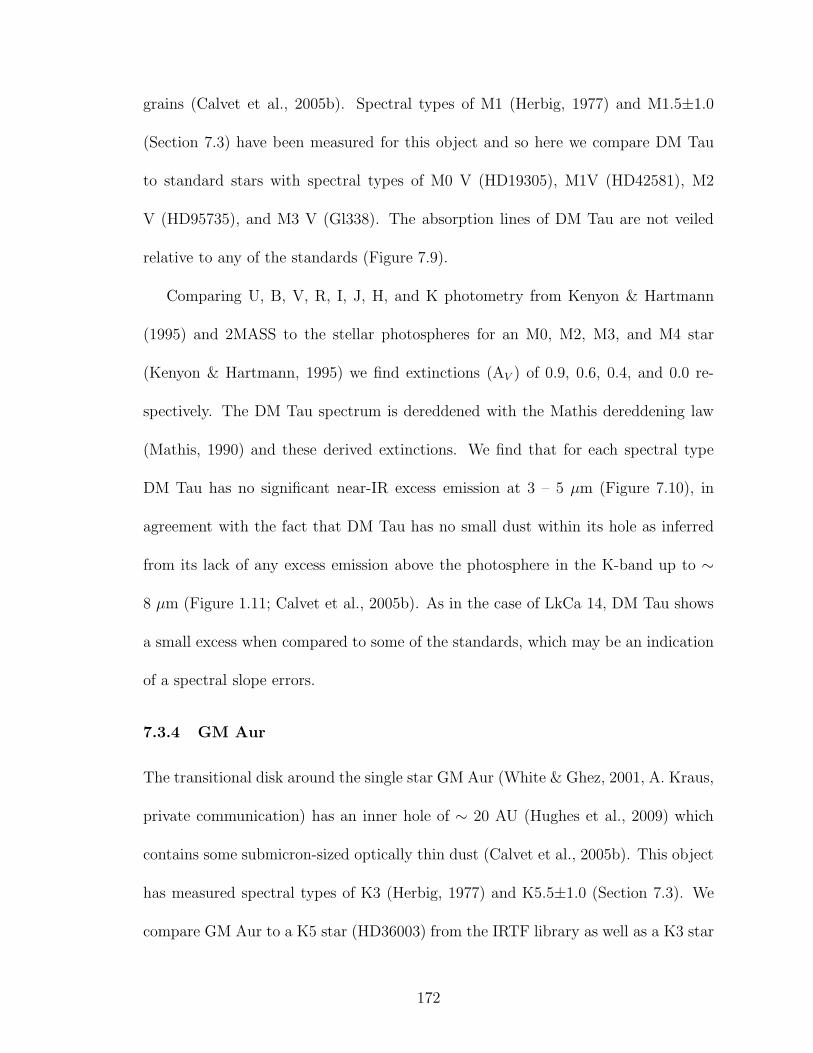
grains (Calvet et al., 2005b). Spectral types of M1 (Herbig, 1977) and M1.5±1.0
(Section 7.3) have been measured for this object and so here we compare DM Tau
to standard stars with spectral types of M0 V (HD19305), M1V (HD42581), M2
V (HD95735), and M3 V (Gl338). The absorption lines of DM Tau are not veiled
relative to any of the standards (Figure 7.9).
Comparing U, B, V, R, I, J, H, and K photometry from Kenyon & Hartmann
(1995) and 2MASS to the stellar photospheres for an M0, M2, M3, and M4 star
(Kenyon & Hartmann, 1995) we find extinctions (AV ) of 0.9, 0.6, 0.4, and 0.0 re-
spectively. The DM Tau spectrum is dereddened with the Mathis dereddening law
(Mathis, 1990) and these derived extinctions. We find that for each spectral type
DM Tau has no significant near-IR excess emission at 3 – 5 μm (Figure 7.10), in
agreement with the fact that DM Tau has no small dust within its hole as inferred
from its lack of any excess emission above the photosphere in the K-band up to ∼
8 μm (Figure 1.11; Calvet et al., 2005b). As in the case of LkCa 14, DM Tau shows
a small excess when compared to some of the standards, which may be an indication
of a spectral slope errors.
7.3.4 GM Aur
The transitional disk around the single star GM Aur (White & Ghez, 2001, A. Kraus,
private communication) has an inner hole of ∼ 20 AU (Hughes et al., 2009) which
contains some submicron-sized optically thin dust (Calvet et al., 2005b). This object
has measured spectral types of K3 (Herbig, 1977) and K5.5±1.0 (Section 7.3). We
compare GM Aur to a K5 star (HD36003) from the IRTF library as well as a K3 star
172
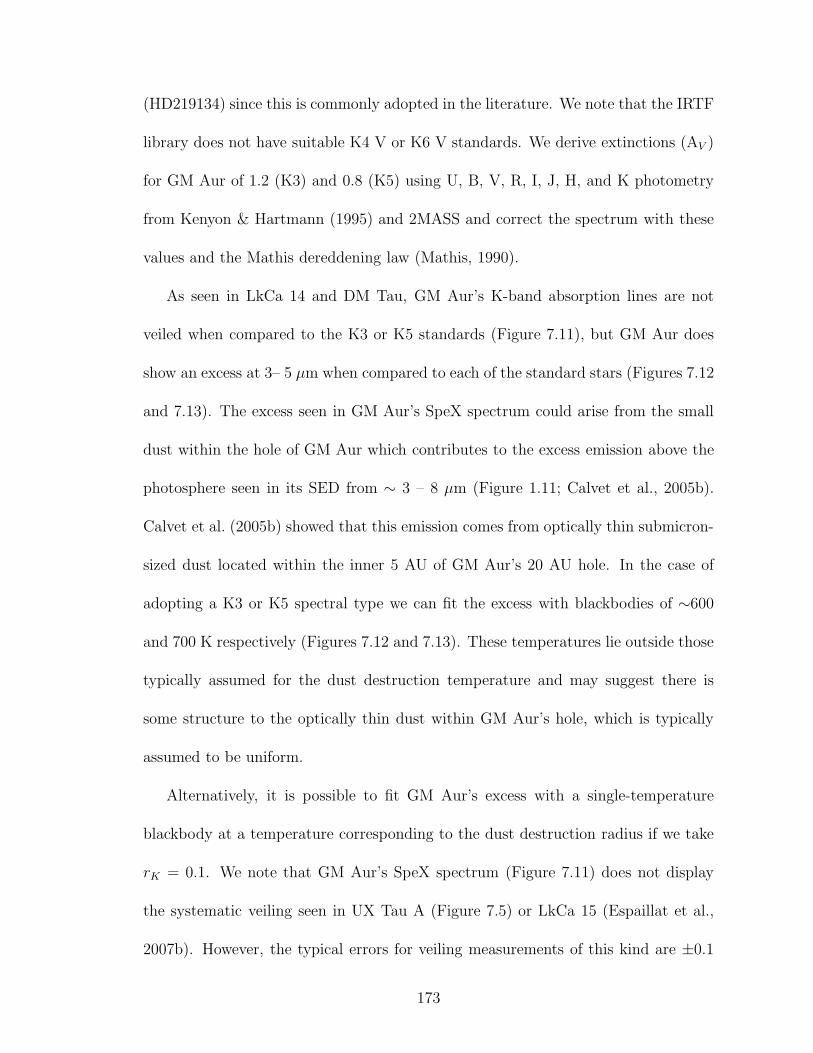
(HD219134) since this is commonly adopted in the literature. We note that the IRTF
library does not have suitable K4 V or K6 V standards. We derive extinctions (AV )
for GM Aur of 1.2 (K3) and 0.8 (K5) using U, B, V, R, I, J, H, and K photometry
from Kenyon & Hartmann (1995) and 2MASS and correct the spectrum with these
values and the Mathis dereddening law (Mathis, 1990).
As seen in LkCa 14 and DM Tau, GM Aur’s K-band absorption lines are not
veiled when compared to the K3 or K5 standards (Figure 7.11), but GM Aur does
show an excess at 3– 5 μm when compared to each of the standard stars (Figures 7.12
and 7.13). The excess seen in GM Aur’s SpeX spectrum could arise from the small
dust within the hole of GM Aur which contributes to the excess emission above the
photosphere seen in its SED from ∼ 3 – 8 μm (Figure 1.11; Calvet et al., 2005b).
Calvet et al. (2005b) showed that this emission comes from optically thin submicron-
sized dust located within the inner 5 AU of GM Aur’s 20 AU hole. In the case of
adopting a K3 or K5 spectral type we can fit the excess with blackbodies of ∼600
and 700 K respectively (Figures 7.12 and 7.13). These temperatures lie outside those
typically assumed for the dust destruction temperature and may suggest there is
some structure to the optically thin dust within GM Aur’s hole, which is typically
assumed to be uniform.
Alternatively, it is possible to fit GM Aur’s excess with a single-temperature
blackbody at a temperature corresponding to the dust destruction radius if we take
rK = 0.1. We note that GM Aur’s SpeX spectrum (Figure 7.11) does not display
the systematic veiling seen in UX Tau A (Figure 7.5) or LkCa 15 (Espaillat et al.,
2007b). However, the typical errors for veiling measurements of this kind are ±0.1
173
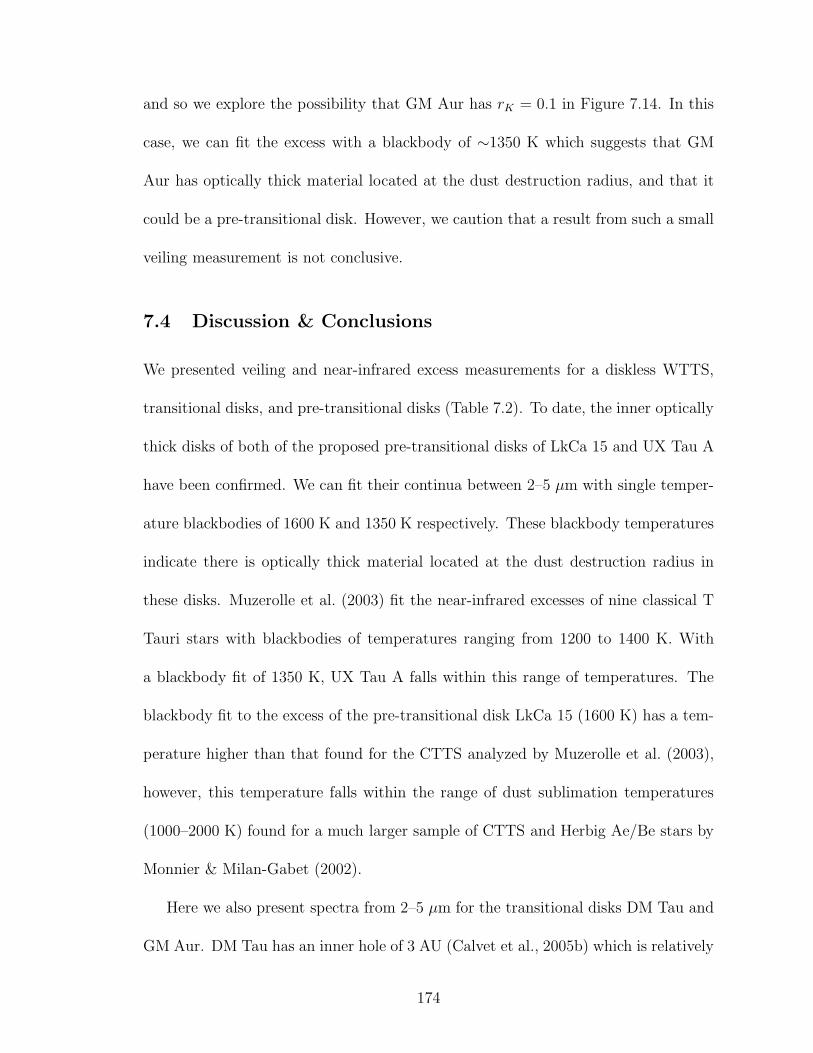
and so we explore the possibility that GM Aur has rK = 0.1 in Figure 7.14. In this
case, we can fit the excess with a blackbody of ∼1350 K which suggests that GM
Aur has optically thick material located at the dust destruction radius, and that it
could be a pre-transitional disk. However, we caution that a result from such a small
veiling measurement is not conclusive.
7.4 Discussion & Conclusions
We presented veiling and near-infrared excess measurements for a diskless WTTS,
transitional disks, and pre-transitional disks (Table 7.2). To date, the inner optically
thick disks of both of the proposed pre-transitional disks of LkCa 15 and UX Tau A
have been confirmed. We can fit their continua between 2–5 μm with single temper-
ature blackbodies of 1600 K and 1350 K respectively. These blackbody temperatures
indicate there is optically thick material located at the dust destruction radius in
these disks. Muzerolle et al. (2003) fit the near-infrared excesses of nine classical T
Tauri stars with blackbodies of temperatures ranging from 1200 to 1400 K. With
a blackbody fit of 1350 K, UX Tau A falls within this range of temperatures. The
blackbody fit to the excess of the pre-transitional disk LkCa 15 (1600 K) has a tem-
perature higher than that found for the CTTS analyzed by Muzerolle et al. (2003),
however, this temperature falls within the range of dust sublimation temperatures
(1000–2000 K) found for a much larger sample of CTTS and Herbig Ae/Be stars by
Monnier & Milan-Gabet (2002).
Here we also present spectra from 2–5 μm for the transitional disks DM Tau and
GM Aur. DM Tau has an inner hole of 3 AU (Calvet et al., 2005b) which is relatively
174
cleared of small dust as indicated by the lack of near-infrared emission in its Spitzer
IRS spectrum. However, it is still accreting and so we can infer that gas is located
within the hole. In our SpeX spectra, we detect Pfγ and Brα emission which confirms
accretion is still occurring in DM Tau (Muzerolle et al., 2001). In this object, we find
no veiling in the K-band as well as no excess near-infrared emission, resembling what
is seen in the diskless WTTS LkCa 14, indicating that the inner disk is relatively
devoid of dust.
GM Aur has a 20 AU hole (Calvet et al., 2005b; Hughes et al., 2009) as well
as a small excess above the photosphere in the near-infrared, as measured in its
Spitzer IRS spectrum, which has been interpreted as originating in optically thin
dust located within the disk hole (Calvet et al., 2005b). GM Aur is also accreting as
can be seen from its strong Pfγ and Brα emission in our SpeX spectrum. Here we
measure a veiling factor of 0±0.1 for GM Aur. Previously, Folha & Emerson (1999)
measured a veiling of 0.3±0.2 for GM Aur in the K-band with a spectral standard
of K7. Taking into account that absorption lines tend to be deeper in later spectral
types, this is likely to be an overestimate of the veiling. With our measured rK of
0, GM Aur has a small near-infrared excess that can be fit by a blackbody of ∼700
K. This does not fall within the range of typical dust destruction temperatures and
suggests GM Aur’s optically thin region may have some structure within it. If we
adopt an rK of 0.1 for GM Aur, which is within the veiling measurement errors, we
can fit its near-infrared emission with a blackbody of ∼1350 K. This may open the
possibility that GM Aur is actually a pre-transitional disk, resembling that of LkCa
15, however, the lack of systematic veiling in the K-band supports that there is no
175
veiling in GM Aur. Veiling derived from higher resolution spectra using appropriate
spectral standards are necessary to ascertain if there is actually veiling in GM Aur
in the K-band.
In conclusion, we confirm that the inner disk of UX Tau A is optically thick and
that it is a pre-transitional disk. Its near-infrared emission differs significantly from
that of the transitional disk of DM Tau which resembles the diskless star LkCa 14 in
the near-IR. Our results call the nature of GM Aur into question and high-resolution
spectra are needed to settle this issue.
176

Table 7.1. Log of SpeX ObservationsTarget K1
s Date Exposure (s) SNR2
LkCa 14 8.6 2009 Feb 18 1800 270DM Tau 9.5 2009 Feb 16 2400 170GM Aur 8.3 2009 Feb 14 1800 100UX Tau A 7.6 2009 Feb 14 1800 230
12MASS Point Source Catalog
2Measured at ∼2.2μm.
Table 7.2. Characteristics of SpeX SampleTarget Spectral AV rK Blackbody Temperature
Type of Excess Emission(K)
LkCa 14 K5.5 0 0 ...DM Tau M1.5 0.4 0 ...GM Aur K5.5 0.8 0 700LkCa 15 K51 1.22 0.33 16003
UX Tau A G6 1.8 0.3 1350
1LkCa 15 has a spectral type of K5±1.0 as measured by bothHerbig (1977) and this work.
2Value from Espaillat et al. (2007b).
3Value Espaillat et al. (2008a).
177
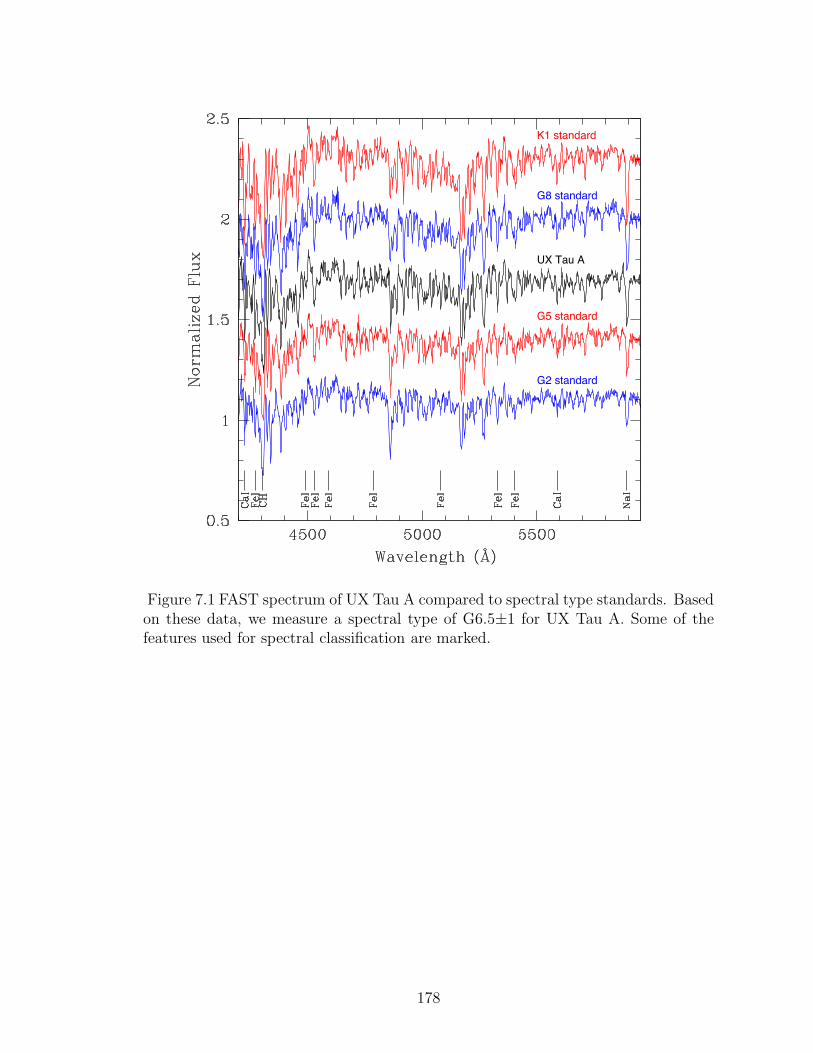
K1 standard
G8 standard
UX Tau A
G5 standard
G2 standard
Figure 7.1 FAST spectrum of UX Tau A compared to spectral type standards. Basedon these data, we measure a spectral type of G6.5±1 for UX Tau A. Some of thefeatures used for spectral classification are marked.
178

K7 standard
K6 standard
GM Aur
K5 standard
K4 standard
K3 standard
Figure 7.2 FAST spectrum of GM Aur compared to spectral type standards. Basedon these spectra, we measure a spectral type of K5.5±1 for GM Aur. Some of thefeatures used for spectral classification are marked.
179
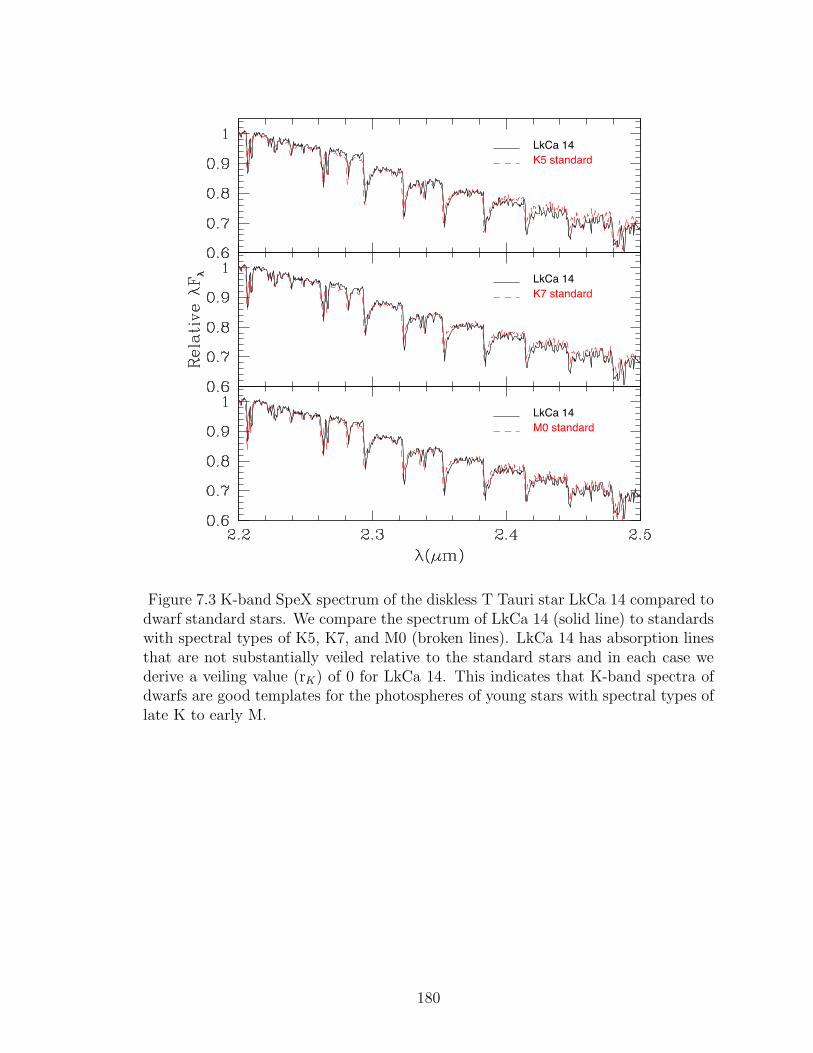
LkCa 14K5 standard
LkCa 14K7 standard
LkCa 14M0 standard
Figure 7.3 K-band SpeX spectrum of the diskless T Tauri star LkCa 14 compared todwarf standard stars. We compare the spectrum of LkCa 14 (solid line) to standardswith spectral types of K5, K7, and M0 (broken lines). LkCa 14 has absorption linesthat are not substantially veiled relative to the standard stars and in each case wederive a veiling value (rK) of 0 for LkCa 14. This indicates that K-band spectra ofdwarfs are good templates for the photospheres of young stars with spectral types oflate K to early M.
180
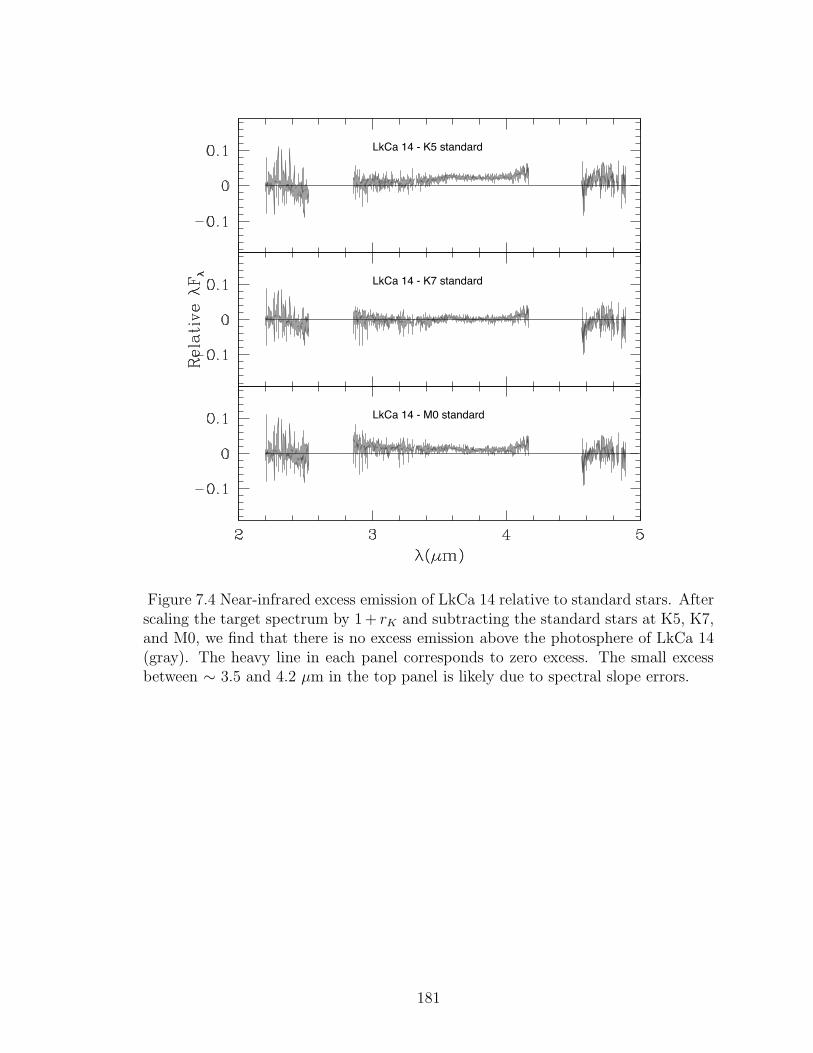
LkCa 14 - K5 standard
LkCa 14 - K7 standard
LkCa 14 - M0 standard
Figure 7.4 Near-infrared excess emission of LkCa 14 relative to standard stars. Afterscaling the target spectrum by 1 + rK and subtracting the standard stars at K5, K7,and M0, we find that there is no excess emission above the photosphere of LkCa 14(gray). The heavy line in each panel corresponds to zero excess. The small excessbetween ∼ 3.5 and 4.2 μm in the top panel is likely due to spectral slope errors.
181

UX Tau AG6.5 standard
UX Tau AG8 standard
UX Tau AK2 standard
Figure 7.5 K-band SpeX spectrum of UX Tau A compared to dwarf standard stars.We compare the spectrum of UX Tau A (solid line) to standards with spectral typesof G6.5, G8, and K2 (broken lines) after scaling the target to the standard at 2.2μm.The spectrum of UX Tau A has absorption lines that are weaker relative to thespectrum of the standard stars and we derive rK=0.3 (G6.5), rK=0.4 (G8), andrK=1.0 (K2) at ∼ 2.2 μm.
182

UX Tau A
G6.5 standard
Figure 7.6 Near-infrared excess emission of UX Tau A relative to a G6.5 standard.After normalizing the target to the standard star’s flux at 2.2 μm and then scalingthe target by 1 + rK , we subtracted the standard star (top, light line) from theveiling-scaled (rK=0.3) target spectrum (top, black line) to extract the shape of theexcess emission above the photosphere (bottom, gray). The near-infrared excess ofUX Tau A can be fit by a single-temperature blackbody of ∼1350 K (bottom, solidblack line). The emission feature at ∼ 4 μm is Brα.
183
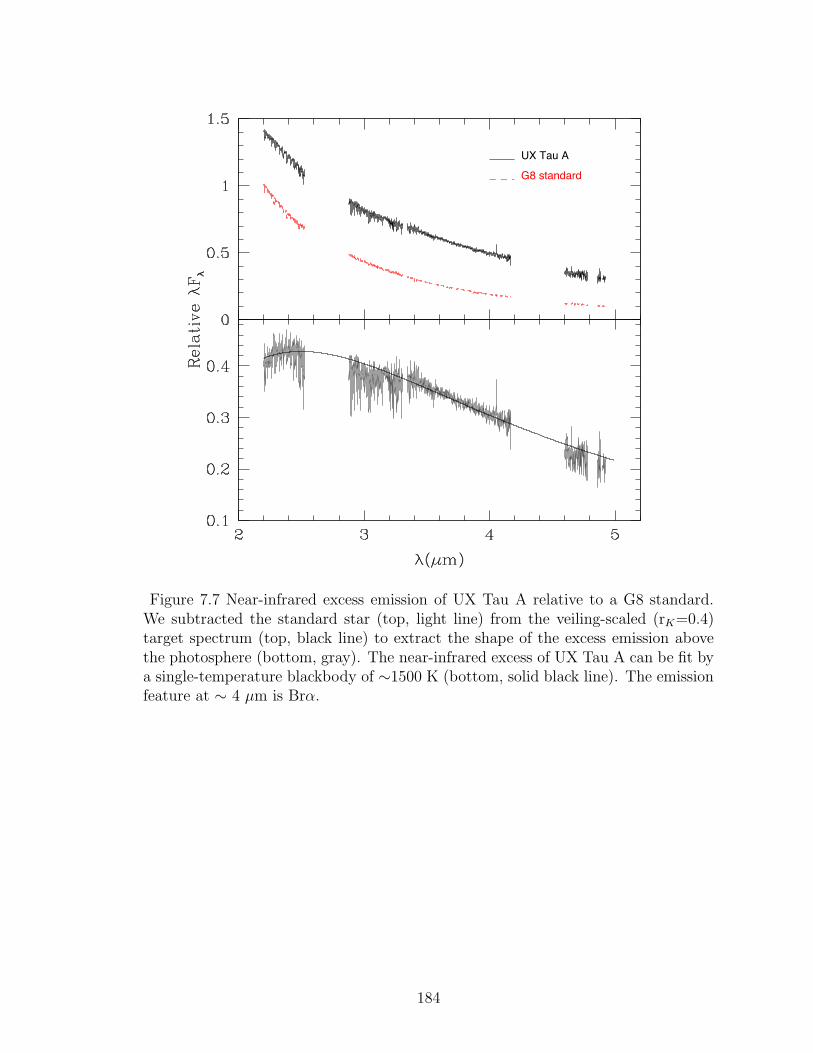
UX Tau A
G8 standard
Figure 7.7 Near-infrared excess emission of UX Tau A relative to a G8 standard.We subtracted the standard star (top, light line) from the veiling-scaled (rK=0.4)target spectrum (top, black line) to extract the shape of the excess emission abovethe photosphere (bottom, gray). The near-infrared excess of UX Tau A can be fit bya single-temperature blackbody of ∼1500 K (bottom, solid black line). The emissionfeature at ∼ 4 μm is Brα.
184
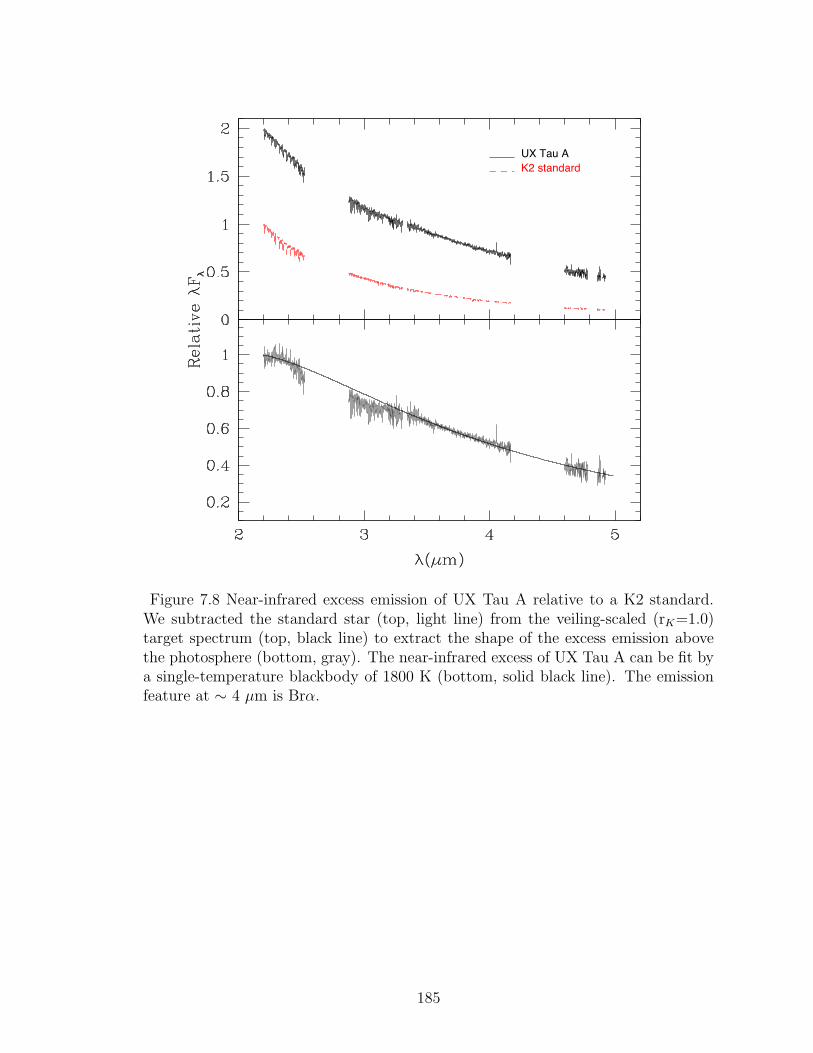
UX Tau AK2 standard
Figure 7.8 Near-infrared excess emission of UX Tau A relative to a K2 standard.We subtracted the standard star (top, light line) from the veiling-scaled (rK=1.0)target spectrum (top, black line) to extract the shape of the excess emission abovethe photosphere (bottom, gray). The near-infrared excess of UX Tau A can be fit bya single-temperature blackbody of 1800 K (bottom, solid black line). The emissionfeature at ∼ 4 μm is Brα.
185
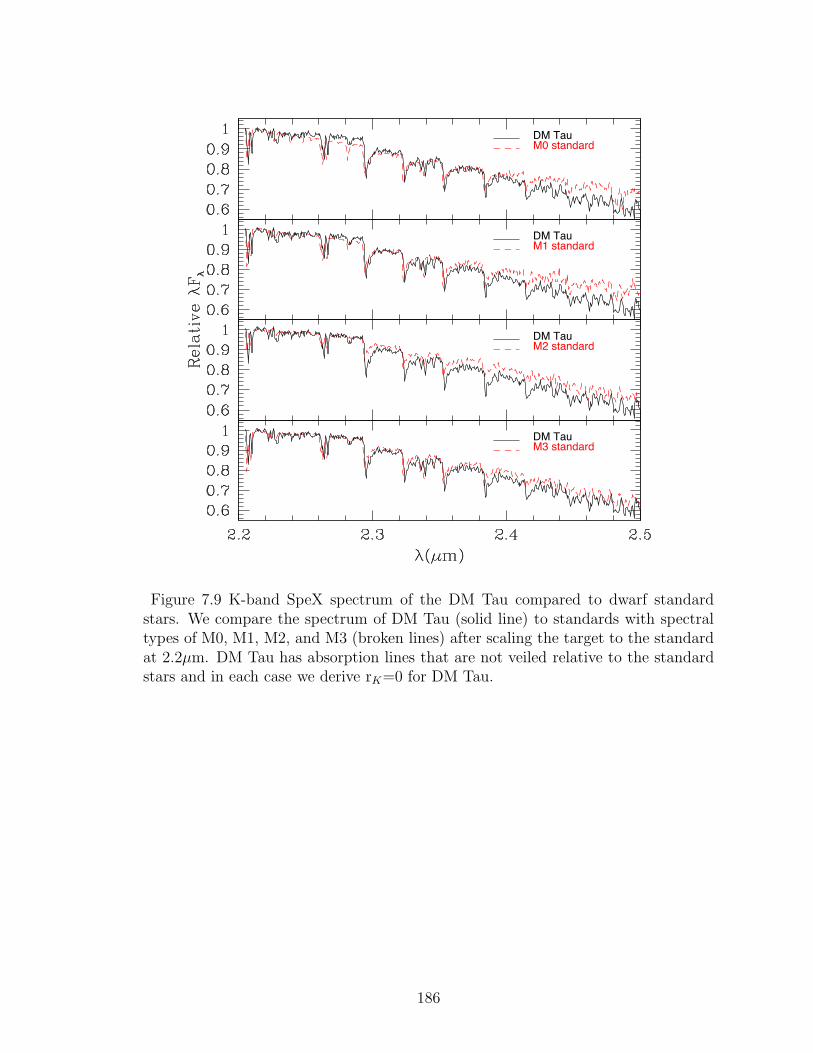
DM TauM0 standard
DM TauM1 standard
DM TauM2 standard
DM TauM3 standard
Figure 7.9 K-band SpeX spectrum of the DM Tau compared to dwarf standardstars. We compare the spectrum of DM Tau (solid line) to standards with spectraltypes of M0, M1, M2, and M3 (broken lines) after scaling the target to the standardat 2.2μm. DM Tau has absorption lines that are not veiled relative to the standardstars and in each case we derive rK=0 for DM Tau.
186

DM Tau - M0 standard
DM Tau - M1 standard
DM Tau - M2 standard
DM Tau - M3 standard
Figure 7.10 Near-infrared excess emission of DM Tau relative to standard stars.After normalizing the target to the standard star’s flux at 2.2 μm and then scalingthe target by 1 + rK , we extracted the excess emission above the photosphere of DMTau (gray), by subtracting standard stars with spectral types of M0, M1, M2, andM3 from the veiling-scaled target spectrum. Note that DM Tau was too faint toextract any data at wavelengths greater than ∼ 4.2 μm. The heavy lines correspondto zero excess. The emission features at ∼ 3.8 μm and ∼ 4 μm are Pfγ and Brαrespectively.
187
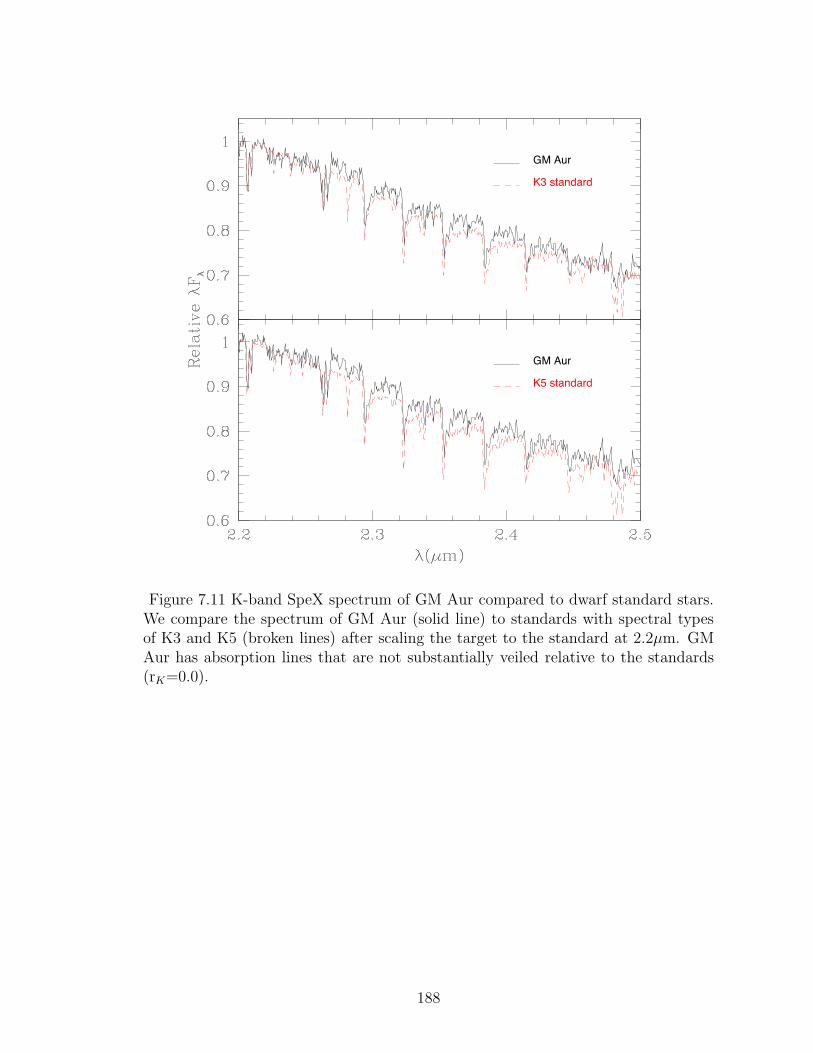
GM Aur
K3 standard
GM Aur
K5 standard
Figure 7.11 K-band SpeX spectrum of GM Aur compared to dwarf standard stars.We compare the spectrum of GM Aur (solid line) to standards with spectral typesof K3 and K5 (broken lines) after scaling the target to the standard at 2.2μm. GMAur has absorption lines that are not substantially veiled relative to the standards(rK=0.0).
188

GM AurK3 standard
Figure 7.12 Near-infrared excess emission of GM Aur relative to a K3 standard.After normalizing the target to the standard star’s flux at 2.2 μm and then scalingthe target by 1+rK , we subtracted the standard star (top, light line) from the veiling-scaled target spectrum (top, black line) and find that there is an excess above thephotosphere (bottom, gray) which can be fit by a ∼600 K blackbody (bottom, heavyline). The emission features at ∼ 3.8 μm and ∼ 4 μm are Pfγ and Brα respectively.
189
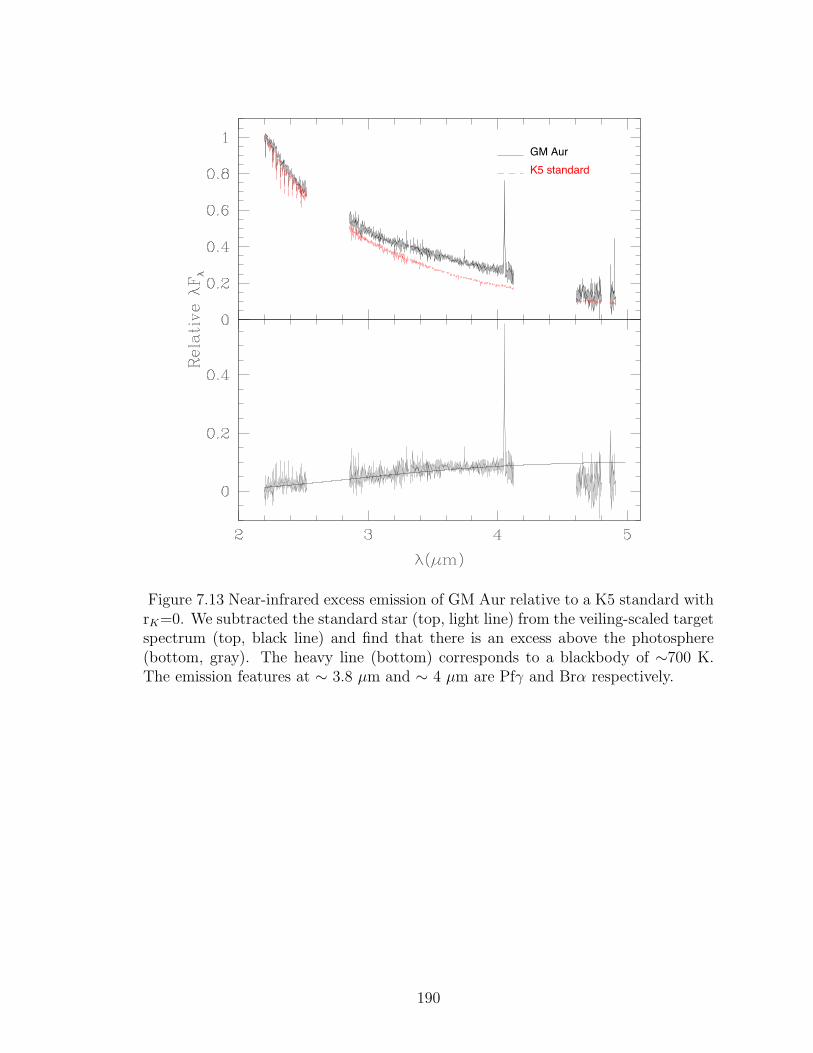
GM AurK5 standard
Figure 7.13 Near-infrared excess emission of GM Aur relative to a K5 standard withrK=0. We subtracted the standard star (top, light line) from the veiling-scaled targetspectrum (top, black line) and find that there is an excess above the photosphere(bottom, gray). The heavy line (bottom) corresponds to a blackbody of ∼700 K.The emission features at ∼ 3.8 μm and ∼ 4 μm are Pfγ and Brα respectively.
190
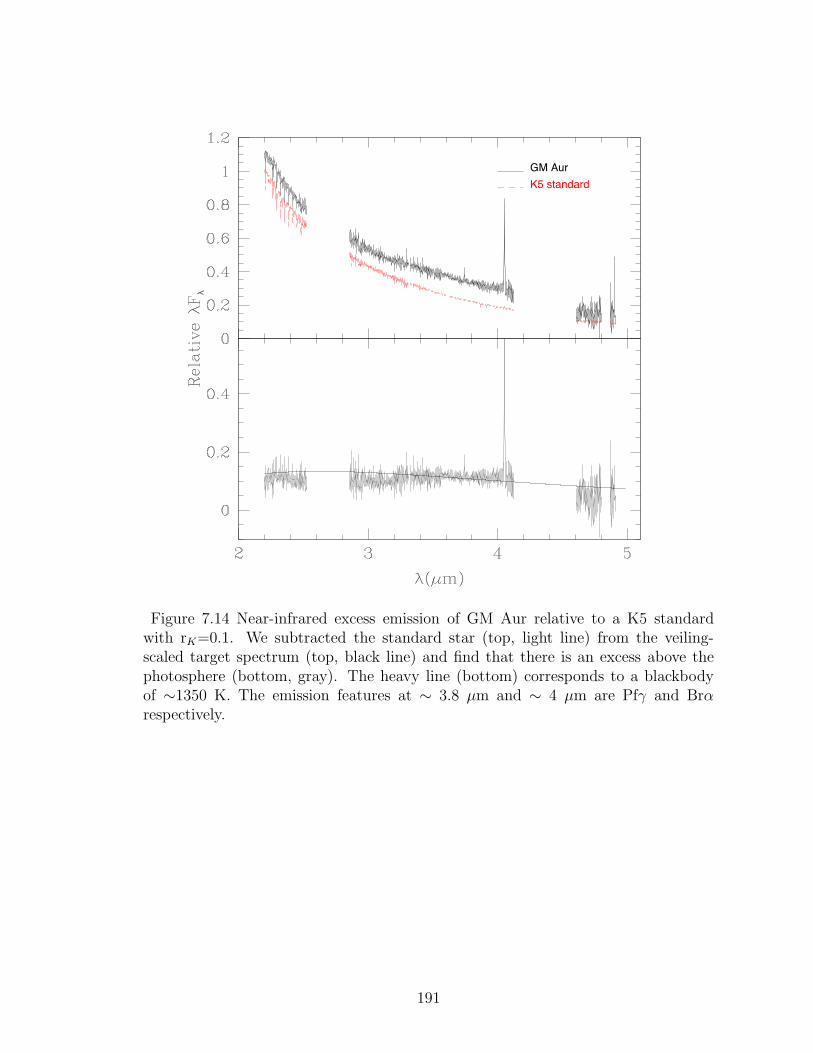
GM AurK5 standard
Figure 7.14 Near-infrared excess emission of GM Aur relative to a K5 standardwith rK=0.1. We subtracted the standard star (top, light line) from the veiling-scaled target spectrum (top, black line) and find that there is an excess above thephotosphere (bottom, gray). The heavy line (bottom) corresponds to a blackbodyof ∼1350 K. The emission features at ∼ 3.8 μm and ∼ 4 μm are Pfγ and Brαrespectively.
191
Chapter 8
Summary & Conclusions
In this thesis we showed that most disks in Taurus, Chamaeleon, and Ophiuchus
can be explained by full disk models. However, there a few disks which have gaps and
holes in their dust distributions and here we modeled the disk structure of a handful
of these pre-transitional disks and transitional disks. We also found that some disks
cannot be explained by the full disk models and are not known to be transitional or
pre-transitional disks. We proposed that these objects are pre-transitional disks with
smaller gaps than previously observed and are in the early stages of gap opening.
Our findings indicate that an extensive and detailed modeling survey of disks around
young stars would be fruitful and is needed to provide significant constraints on
grain growth, settling, and clearing in young disks to aid in theoretical models of
dust evolution and planet formation.
8.1 The Transitional Disks
With Spitzer IRS spectra, we have been able to study in great detail several “transi-
tional disks” which have nearly photospheric near-infrared emission but substantial
excesses at mid-infrared wavelengths and beyond as is seen in full disks. Sophis-
ticated disk models have shown that this flux deficit at near-infrared wavelengths
192
can be explained by optically thick disks with an inner hole (Calvet et al., 2005b;
D’Alessio et al., 2005; Espaillat et al., 2007a, 2008b). Most of these inner holes
are not completely empty and contain a small amount of small optically thin dust
(e.g. GM Aur, TW Hya, CS Cha, CVSO 224).
In Chapter 3, we modeled the disk of the ∼2 Myr old CS Cha with an inner hole
of ∼46 AU which contained small optically thin dust (Espaillat et al., 2007a). We
found that this optically thin dust has grown to much larger sizes (2μm) than the
ISM-sized dust within the inner holes of the younger ∼1 Myr old transitional disks in
Taurus. However, larger grains are also seen in the holes of the 10 Myr old TW Hya
(Calvet et al., 2002) and CVSO 224 (Espaillat et al., 2008b) and so there may be
a correlation between the process that creates the optically thin dust found within
inner disk holes and dust evolution. CS Cha also needs a more settled outer disk to
fit its far-infrared and millimeter data.
We also detected the slowest accreting transitional disk found to date, CVSO 224
in the ∼10 Myr old 25 Orionis group in Orion OB1a (Chapter 4; Espaillat et al.,
2008b). CVSO 224 provides a unique opportunity to explore the role of photoevap-
oration in transitional disks. While hydrodynamical simulations have shown that a
newly formed planet could accrete and sweep out the material around it through
tidal disturbances (Rice et al., 2006), photoevaporation has been proposed as an
alternate formation mechanism for the holes observed in transitional disks. A pho-
toevaporative wind can halt mass accretion towards the inner disk allowing material
in this inner disk to be rapidly evacuated creating an inner hole (Clarke et al., 2001);
the hole then increases in size as the edge continues photoevaporating (Alexander &
193

Armitage, 2007). However, the mass accretion rates and disk masses of GM Aur, DM
Tau, CS Cha, and TW Hya are too high for photoevaporation to occur. CVSO 224’s
low M is in line with photoevaporative clearing theories (Alexander & Armitage,
2007). However, CVSO 224 exhibits substantial emission between ∼20 – 40 μm in
its Spitzer IRS spectrum. This is evidence for a substantial outer disk in this object,
indicating that the disk is not being photoevaporated. This discrepancy could be
explained if the mass accretion rate of the outer disk is actually higher than what
we are measuring at the star which is possible if a planet is within CVSO 224’s hole
and is sharing the mass accretion flow with the star (Lubow & D’Angelo, 2006).
Follow-up millimeter studies are needed to confirm that the outer disk of CVSO 224
is massive in order to further support this idea.
8.2 The Pre-Transitional Disks
We have recently identified a new class of “pre-transitional disks” around the stars UX
Tau A and LkCa 15 in the Taurus cloud (Chapter 5; Espaillat et al., 2007b). These
pre-transitional disks have a deficit of mid-infrared flux (5 – 20 μm) and substantial
emission beyond 20 μm as is seen in the transitional disks, however, in contrast to the
small near-infrared excess exhibited by some transitional disks, pre-transitional disks
have significant near-infrared excesses (2 – 5 μm). These excesses are comparable to
the median SED of T Tauri disks in Taurus which is representative of an optically
thick full disk (D’Alessio et al., 1999). This indicates that the pre-transitional disks
have an optically thick inner disk and that we are seeing the development of gaps
within protoplanetary disks. UX Tau A has a 56 AU gap that is relatively empty of
194
small grains while LkCa 15’s 46 AU gap has a small amount of optically thin dust
within the inner 5 AU of the gap. The existence of an inner optically thick disk may
be an indicator of the first stages of disk clearing that will eventually lead to the the
inner holes that are seen in transitional disks.
We presented the first independent confirmation of a gap in a protoplanetary disk
(Chapter 6; Espaillat et al., 2008a). We obtained a medium resolution near-infrared
SpeX spectrum spanning the wavelength range 2-5 μm (Espaillat et al., 2008b) and
fit the near-IR excess of LkCa 15 with a single-temperature blackbody of 1600 K,
such as is seen in full disks (Muzerolle et al., 2003), indicating that the near-infrared
excess of LkCa 15 originates from the wall of an optically thick inner disk at the dust
destruction radius. In addition, we confirmed the gap in the pre-transitional disk of
UX Tau A (Chapter 7). Its near-infrared excess between 2–5 μm could be fit with a
single-temperature blackbody of 1500 K.
The gaps detected in UX Tau A and LkCa 15 are large (∼46–56 AU) and pre-
transitional disks with smaller gaps have not yet been detected. In Chapter 2, we
presented a first attempt at describing the overall qualities of disks in Taurus (Furlan
et al. submitted), Chamaeleon (Manoj et al. in prep), and Ophiuchus (McClure et al.
in prep) by creating a grid of ∼240 disks with the models of D’Alessio et al. (2006).
This grid was calculated for stellar masses of 0.2 M� and 0.5 M�, mass accretion
rates of 10−7 – 10−10 M� yr−1, inclinations spanning ∼ 0 to ∼90◦, an α parameter
of 0.01, settling parameters of 1, 0.1, 0.01, and 0.001, different dust compositions,
and various maximum grain sizes in the upper disk layers. Individual fits to SEDs
were not done. We used the grid to measure the slope of the SED between 13 μm
195
and 31 μm versus the equivalent width of the 10 μm silicate feature. Aside from the
well-known transitional and pre-transitional disks, most of the disks can be explained
by typical “full” disk models. However, there is a subset of ∼30 disks which show
stronger silicate emission than can be explained by the full disk models. We show
that this extra emission cannot be accounted for with smaller grains in the upper
disk layers or a different dust composition. We propose that these objects are pre-
transitional disks with small gaps (<20 AU) where the extra silicate emission comes
from optically thin small dust located within these disk gaps. Detailed modeling and
millimeter imaging is needed to explore this possibility.
8.3 Neon Gas in the Planet-Forming Regions of T Tauri
Disks
Significant gas must be present for giant planets to form and the lifetime of the gas
in the inner disk places an upper limit on the timescale for giant planet formation.
A new gas diagnostic has emerged in the mid-infrared with the detection of [Ne II]
emission with Spitzer. [Ne II] emission has been detected from a few disks that were
observed as part of the FEPS Legacy program (Pascucci et al., 2007) and the C2D
program (Lahuis et al., 2007) as well as in the transitional disks CS Cha, DM Tau,
and TW Hya in our GTO IRS Disks program (Espaillat et al., 2007a).
In Espaillat et al. (2007a), we found that there was no apparent correlation be-
tween L[NeII] and LX as would be expected from the X-ray heating model of Glassgold
et al. (2007) which has been proposed to explain this [Ne II] emission. However, these
measurements were based on non-simultaneous data and X-ray emission is known to
196
be variable (Feigelson et al., 2007; Gudel et al., 2007). Therefore, a correlation be-
tween L[NeII] and LX may have been missed. We did find a possible correlation
between L[NeII] and M which suggests that accretion related EUV heating may play
a substantial role in producing [Ne II] emission. Measurements of L[NeII], LX , and
Lacc in a larger sample of disks are required to test these proposed correlations.
8.4 Comparing Pre-Transitional and Transitional Disk Ob-
servations with Planet Formation Theories
There are two leading theories of planet formation: the core nucleated accretion
model and the gas instability model. According to the core nucleated accretion model
(Pollack et al., 1996; Bodenheimer et al., 2000), dust grains will grow into planetes-
imals which will accrete other planetesimals and then form solid cores. These cores
can become terrestrial planets or, if the cores are massive enough, gas giant cores
which can accrete the surrounding gas in the disk (Pollack et al., 1996; Bodenheimer
et al., 2000). The core accretion model can account for both terrestrial planets and
gas giants. For several years it was thought that the formation time for Jupiter-mass
planets via core accretion was longer than the lifetime of disks. However, Hubickyj
et al. (2005) show that by adopting low dust opacities the core’s envelope is smaller
and can therefore accrete faster. A Jupiter-mass planet with a core of 10 Earth-
masses can form at 5 AU in 1 Myr and in 5 Myr with a core of 5 Earth-masses
(Hubickyj et al., 2005), about half the time predicted by models using higher dust
opacities (for a review see Lissauer & Stevenson, 2007). In the gas instability model
(Boss, 2000; Mayer et al., 2002; Durisen et al., 2007), fragmentation due to gravita-
197

tional instabilities in the dense dust midplane (Goldreich & Ward, 1973) can form
Jupiter-mass clumps in the outer disk (Boss, 2000; Mayer et al., 2002). The gas in-
stability model can create Jupiter-mass gas giants within a few hundred years (Boss,
2000), but this model cannot explain the formation of lower mass ice giants like Nep-
tune or terrestrial planets. Since the core nucleated accretion model can account for
low–mass planets, it is currently the favored planet formation mechanism; however,
hybrid scenarios incorporating core accretion and gas instability are possible.
To date, over one hundred Jupiter-mass planets have been detected (Butler et al.,
2006). About eleven Neptune-mass planets have also been discovered (Santos et al.,
2004; McArthur et al., 2004; Butler et al., 2004; Vogt et al., 2005; Rivera et al., 2005;
Bonfils et al., 2005; Udry et al., 2006; Sousa et al., 2008; Bonfils et al., 2007; Melo
et al., 2007; Endl et al., 2008) and as the precision of radial velocity measurements
improves, this number is expected to increase. Neptune-mass planets may be the
result of failed core accretion, when the gas in the disk dissipated before the core
could accrete enough gas to form a Jupiter-mass planet. Such a situation is plausible
given that observational results find that disks begin to dissipate as early as 1 Myr
(Hernandez et al., 2007), but core accretion requires 1–5 Myr to form Jupiter mass
planets.
The detection of transitional and pre-transitional disks in young star–forming
regions seems to support the core accretion model. To clear out the relatively large
gaps and holes that have been detected, it is likely that more than one planet is
present in the inner disks of these objects. Since Jupiter-mass planets form within
1–5 Myr, it is plausible that the transitional and pre-transitional disks detected
198
in the ∼1–3 Myr old Taurus cloud (Hartmann, 2003) contain Jupiter-mass planets.
However, a typical disk will have a Jupiter mass (10−3 M�) at 6 AU and a Saturn mass
at 3 AU (see Figure 2.3). Therefore, it is unlikely that there would be several Jupiter-
mass planets clearing the gaps and holes we have detected. Instead, these disks could
also contain sub-Jupiter mass planets. The vast majority of transitional and pre-
transitional disks are still accreting material onto the star (see Table 1.1), indicating
that gas is still present within the inner disk. As a result, planets within gaps and
holes can still be accreting gas and growing in mass (Artymowicz & Lubow, 1996).
Therefore, most transitional and pre-transitional disks have enough mass within their
cleared regions to have formed multiple planets in situ and planet formation may still
be underway.
If the transitional and pre-transitional disks are a result of core accretion, then
this implies that we have yet to detect the smaller gaps which would indicate that
planet formation has just begun. In Chapter 2, we presented evidence based on
Spitzer IRS spectra for pre-transitional disks with small gaps that were filled with
optically thin dust. These disks could be the missing link in the evolution of planet
formation.
8.5 Directions for the Future
Given the importance of dust in disks and that dust is more easily observed than
gas at most wavelengths, the fact that so many questions remain regarding how dust
initially evolves into a planet and the planet’s ensuing effect on the dust calls for
a detailed study of dust evolution in young disks. The best targets on which to
199
undertake such a study are the disks around the low–mass pre–main sequence stars
in the star–forming clouds of Taurus, Chamaeleon, and Ophiuchus.
As we reviewed in Section 1.1, the first steps in making a planet are the growth
of grains and subsequent settling to the midplane. However, theory predicts that
grains with sizes up to 100 μm will be severely depleted within 104 years (Dullemond
& Dominik, 2004, 2005) which is in stark contrast to Spitzer observations which
reveal substantial infrared excesses and ubiquitous silicate emission from 1 Myr old
disks (Furlan et al., 2006). One should explore why almost none of the predicted
SEDs match the actual observations by taking a closer look at the amount of grain
growth and settling in these star–forming regions. In this thesis we find a range
of grain sizes and settling parameters amongst transitional disks. These results are
promising and call for larger, more detailed studies. We are developing the next
generation of the D’Alessio model, which will relax the assumption that the degree
of depletion throughout the disk is constant in order to explore how dust settling
varies throughout disks. A self-consistent analysis of SEDs and spatial brightness
distributions with these models can provide a direct quantification of the degree of
grain growth and the radial and vertical distribution of dust throughout the disk,
providing essential constraints to dust evolution models.
Currently, we have only detected large gaps of ∼50 AU (Espaillat et al., 2007b)
and the smaller gaps expected during the initial stages of planet formation have yet
to be found. However, there exists an unstudied subset of disks which we propose are
pre-transitional disks with small gaps (<10 AU; Section 2.5). These disks have more
silicate emission than a full disk, pointing to the existence of gaps in the optically
200
thick disks of these “outliers” that are filled will small optically thin dust from which
the extra emission arises. Using the D’Alessio model in conjunction with SEDs and
spatial brightness distributions obtained with the SMA and ALMA, one can constrain
the grain growth and settling of these pre-transitional disks as well as the sizes of
their gaps. The dust evolution in pre-transitional disks can then be compared to
that of full disks. If planets are clearing these gaps, then the dust evolution in pre-
transitional disks should be more advanced relative to the full disks since significant
dust evolution is needed to create planets.
Systematic, semi-empirical evidence will provide needed insight and constraints
to aid in theoretical modeling of dust evolution and planet formation, bringing us a
few steps closer to understanding the origin of our own solar system.
201
References
Aikawa, Y., & Nomura, H. 2006, ApJ, 642, 1152
Alencar, S. H. P., & Batalha, C. 2002, ApJ, 571, 378
Alexander, R. D., & Armitage, P. J. 2007, MNRAS, 375, 500
Andrews, S. M., & Williams, J. P. 2005, ApJ, 631, 1134
Artymowicz, P., & Lubow, S. H. 1994, ApJ, 421, 651
—. 1996, ApJ, 467, L77+
Baraffe, I., Chabrier, G., Allard, F., & Hauschildt, P. H. 2002, A&A, 382, 563
Barrado y Navascues, D., & Martın, E. L. 2003, AJ, 126, 2997
Batalha, C., Batalha, N. M., Alencar, S. H. P., Lopes, D. F., & Duarte, E. S. 2002,ApJ, 580, 343
Bergin, E., Calvet, N., Sitko, M. L., Abgrall, H., D’Alessio, P., Herczeg, G. J., Roueff,E., Qi, C., Lynch, D. K., Russell, R. W., Brafford, S. M., & Perry, R. B. 2004,ApJ, 614, L133
Bockelee-Morvan, D., Gautier, D., Hersant, F., Hure, J.-M., & Robert, F. 2002,A&A, 384, 1107
Bodenheimer, P., Hubickyj, O., & Lissauer, J. J. 2000, Icarus, 143, 2
Bonfils, X., Forveille, T., Delfosse, X., Udry, S., Mayor, M., Perrier, C., Bouchy, F.,Pepe, F., Queloz, D., & Bertaux, J.-L. 2005, A&A, 443, L15
Bonfils, X., Mayor, M., Delfosse, X., Forveille, T., Gillon, M., Perrier, C., Udry, S.,Bouchy, F., Lovis, C., Pepe, F., Queloz, D., Santos, N. C., & Bertaux, J.-L. 2007,A&A, 474, 293
Bontemps, S., Andre, P., Kaas, A. A., Nordh, L., Olofsson, G., Huldtgren, M.,Abergel, A., Blommaert, J., Boulanger, F., Burgdorf, M., Cesarsky, C. J., Ce-
202
sarsky, D., Copet, E., Davies, J., Falgarone, E., Lagache, G., Montmerle, T.,Perault, M., Persi, P., Prusti, T., Puget, J. L., & Sibille, F. 2001, A&A, 372, 173
Boss, A. P. 2000, ApJ, 536, L101
Briceno, C., Calvet, N., Hernandez, J., Vivas, A. K., Hartmann, L., Downes, J. J.,& Berlind, P. 2005, AJ, 129, 907
Briceno, C., Hartmann, L., Hernandez, J., Calvet, N., Vivas, A. K., Furesz, G., &Szentgyorgyi, A. 2007, ApJ, 661, 1119
Brown, J. M., Blake, G. A., Dullemond, C. P., Merın, B., Augereau, J. C., Boogert,A. C. A., Evans, II, N. J., Geers, V. C., Lahuis, F., Kessler-Silacci, J. E., Pontop-pidan, K. M., & van Dishoeck, E. F. 2007, ApJ, 664, L107
Brown, J. M., Blake, G. A., Qi, C., Dullemond, C. P., & Wilner, D. J. 2008, ApJ,675, L109
Butler, R. P., Vogt, S. S., Marcy, G. W., Fischer, D. A., Wright, J. T., Henry, G. W.,Laughlin, G., & Lissauer, J. J. 2004, ApJ, 617, 580
Butler, R. P., Wright, J. T., Marcy, G. W., Fischer, D. A., Vogt, S. S., Tinney,C. G., Jones, H. R. A., Carter, B. D., Johnson, J. A., McCarthy, C., & Penny,A. J. 2006, ApJ, 646, 505
Calvet, N., Briceno, C., Hernandez, J., Hoyer, S., Hartmann, L., Sicilia-Aguilar, A.,Megeath, S. T., & D’Alessio, P. 2005a, AJ, 129, 935
Calvet, N., D’Alessio, P., Hartmann, L., Wilner, D., Walsh, A., & Sitko, M. 2002,ApJ, 568, 1008
Calvet, N., D’Alessio, P., Watson, D. M., Franco-Hernandez, R., Furlan, E., Green,J., Sutter, P. M., Forrest, W. J., Hartmann, L., Uchida, K. I., Keller, L. D.,Sargent, B., Najita, J., Herter, T. L., Barry, D. J., & Hall, P. 2005b, ApJ, 630,L185
Calvet, N., & Gullbring, E. 1998, ApJ, 509, 802
Calvet, N., & Hartmann, L. 1992, ApJ, 386, 239
Calvet, N., Magris, G. C., Patino, A., & D’Alessio, P. 1992, Revista Mexicana deAstronomia y Astrofisica, 24, 27
Calvet, N., Muzerolle, J., Briceno, C., Hernandez, J., Hartmann, L., Saucedo, J. L.,& Gordon, K. D. 2004, AJ, 128, 1294
203
Calvet, N., Patino, A., Magris, G. C., & D’Alessio, P. 1991, ApJ, 380, 617
Carmona, A., van den Ancker, M. E., Henning, T., Goto, M., Fedele, D., & Stecklum,B. 2007, A&A, 476, 853
Carpenter, J. M., Mamajek, E. E., Hillenbrand, L. A., & Meyer, M. R. 2006, ApJ,651, L49
Chiang, E., & Murray-Clay, R. 2007, Nature Physics, 3, 604
Chiang, E. I., & Goldreich, P. 1997, ApJ, 490, 368
Clarke, C. J., Gendrin, A., & Sotomayor, M. 2001, MNRAS, 328, 485
Cushing, M. C., Rayner, J. T., & Vacca, W. D. 2005, ApJ, 623, 1115
Cushing, M. C., Vacca, W. D., & Rayner, J. T. 2004, PASP, 116, 362
D’Alessio, P., Calvet, N., & Hartmann, L. 2001, ApJ, 553, 321
D’Alessio, P., Calvet, N., Hartmann, L., Franco-Hernandez, R., & Servın, H. 2006,ApJ, 638, 314
D’Alessio, P., Calvet, N., Hartmann, L., Lizano, S., & Canto, J. 1999, ApJ, 527, 893
D’Alessio, P., Canto, J., Calvet, N., & Lizano, S. 1998, ApJ, 500, 411
D’Alessio, P., Hartmann, L., Calvet, N., Franco-Hernandez, R., Forrest, W. J., Sar-gent, B., Furlan, E., Uchida, K., Green, J. D., Watson, D. M., Chen, C. H.,Kemper, F., Sloan, G. C., & Najita, J. 2005, ApJ, 621, 461
Dorschner, J., Begemann, B., Henning, T., Jaeger, C., & Mutschke, H. 1995, A&A,300, 503
Draine, B. T., & Lee, H. M. 1984, ApJ, 285, 89
Dullemond, C. P., & Dominik, C. 2004, A&A, 421, 1075
—. 2005, A&A, 434, 971
Durisen, R. H., Boss, A. P., Mayer, L., Nelson, A. F., Quinn, T., & Rice, W. K. M.2007, in Protostars and Planets V, ed. B. Reipurth, D. Jewitt, & K. Keil, 607–622
Edwards, S., Fischer, W., Hillenbrand, L., & Kwan, J. 2006, ApJ, 646, 319
204

Endl, M., Cochran, W. D., Wittenmyer, R. A., & Boss, A. P. 2008, ApJ, 673, 1165
Espaillat, C., Calvet, N., D’Alessio, P., Bergin, E., Hartmann, L., Watson, D., Furlan,E., Najita, J., Forrest, W., McClure, M., Sargent, B., Bohac, C., & Harrold, S. T.2007a, ApJ, 664, L111
Espaillat, C., Calvet, N., D’Alessio, P., Hernandez, J., Qi, C., Hartmann, L., Furlan,E., & Watson, D. M. 2007b, ApJ, 670, L135
Espaillat, C., Calvet, N., Luhman, K. L., Muzerolle, J., & D’Alessio, P. 2008a, ApJ,682, L125
Espaillat, C., Muzerolle, J., Hernandez, J., Briceno, C., Calvet, N., D’Alessio, P.,McClure, M., Watson, D. M., Hartmann, L., & Sargent, B. 2008b, ApJ, 689, L145
Fabricant, D., Cheimets, P., Caldwell, N., & Geary, J. 1998, PASP, 110, 79
Feigelson, E., Townsley, L., Gudel, M., & Stassun, K. 2007, in Protostars and PlanetsV, ed. B. Reipurth, D. Jewitt, & K. Keil, 313–328
Feigelson, E. D., Casanova, S., Montmerle, T., & Guibert, J. 1993, ApJ, 416, 623
Folha, D. F. M., & Emerson, J. P. 1999, A&A, 352, 517
Forrest, W. J., Sargent, B., Furlan, E., D’Alessio, P., Calvet, N., Hartmann, L.,Uchida, K. I., Green, J. D., Watson, D. M., Chen, C. H., Kemper, F., Keller,L. D., Sloan, G. C., Herter, T. L., Brandl, B. R., Houck, J. R., Barry, D. J., Hall,P., Morris, P. W., Najita, J., & Myers, P. C. 2004, ApJS, 154, 443
Furlan, E., Hartmann, L., Calvet, N., D’Alessio, P., Franco-Hernandez, R., Forrest,W. J., Watson, D. M., Uchida, K. I., Sargent, B., Green, J. D., Keller, L. D., &Herter, T. L. 2006, ApJS, 165, 568
Furlan, E., Sargent, B., Calvet, N., Forrest, W. J., D’Alessio, P., Hartmann, L.,Watson, D. M., Green, J. D., Najita, J., & Chen, C. H. 2007, ApJ, 664, 1176
Gail, H.-P. 2001, A&A, 378, 192
Gauvin, L. S., & Strom, K. M. 1992, ApJ, 385, 217
Genzel, R., & Stutzki, J. 1989, ARA&A, 27, 41
Glassgold, A. E., Najita, J., & Igea, J. 2004, ApJ, 615, 972
Glassgold, A. E., Najita, J. R., & Igea, J. 2007, ApJ, 656, 515
205

Goldreich, P., & Tremaine, S. 1980, ApJ, 241, 425
Goldreich, P., & Ward, W. R. 1973, ApJ, 183, 1051
Gomez, M., & Kenyon, S. J. 2001, AJ, 121, 974
Gorti, U., & Hollenbach, D. 2009, ApJ, 690, 1539
Gudel, M., Padgett, D. L., & Dougados, C. 2007, in Protostars and Planets V, ed.B. Reipurth, D. Jewitt, & K. Keil, 329–344
Guenther, E. W., Esposito, M., Mundt, R., Covino, E., Alcala, J. M., Cusano, F., &Stecklum, B. 2007, A&A, 467, 1147
Gullbring, E., Hartmann, L., Briceno, C., & Calvet, N. 1998, ApJ, 492, 323
Gutermuth, R. A., Megeath, S. T., Muzerolle, J., Allen, L. E., Pipher, J. L., Myers,P. C., & Fazio, G. G. 2004, ApJS, 154, 374
Haisch, Jr., K. E., Lada, E. A., & Lada, C. J. 2001, ApJ, 553, L153
Hartigan, P. 1993, AJ, 105, 1511
Hartigan, P., Hartmann, L., Kenyon, S., Hewett, R., & Stauffer, J. 1989, ApJS, 70,899
Hartmann, L. 2003, ApJ, 585, 398
—. 2009, Cambridge Astrophysics Series, 47
Hartmann, L., Calvet, N., Gullbring, E., & D’Alessio, P. 1998, ApJ, 495, 385
Hartmann, L., Hewett, R., & Calvet, N. 1994, ApJ, 426, 669
Hartmann, L., Megeath, S. T., Allen, L., Luhman, K., Calvet, N., D’Alessio, P.,Franco-Hernandez, R., & Fazio, G. 2005, ApJ, 629, 881
Henning, T., Pfau, W., Zinnecker, H., & Prusti, T. 1993, A&A, 276, 129
Herbig, G. H. 1977, ApJ, 214, 747
Herbig, G. H., Vrba, F. J., & Rydgren, A. E. 1986, AJ, 91, 575
Hernandez, J., Calvet, N., Briceno, C., Hartmann, L., & Berlind, P. 2004, AJ, 127,1682
206
Hernandez, J., Calvet, N., Briceno, C., Hartmann, L., Vivas, A. K., Muzerolle, J.,Downes, J., Allen, L., & Gutermuth, R. 2007, ApJ, 671, 1784
Hernandez, J., Calvet, N., Hartmann, L., Briceno, C., Sicilia-Aguilar, A., & Berlind,P. 2005, AJ, 129, 856
Higdon, S. J. U., Devost, D., Higdon, J. L., Brandl, B. R., Houck, J. R., Hall, P.,Barry, D., Charmandaris, V., Smith, J. D. T., Sloan, G. C., & Green, J. 2004,PASP, 116, 975
Høg, E., Fabricius, C., Makarov, V. V., Urban, S., Corbin, T., Wycoff, G., Bastian,U., Schwekendiek, P., & Wicenec, A. 2000, A&A, 355, L27
Hollenbach, D., Johnstone, D., Lizano, S., & Shu, F. 1994, ApJ, 428, 654
Houck, J. R., Roellig, T. L., van Cleve, J., Forrest, W. J., Herter, T., Lawrence,C. R., Matthews, K., Reitsema, H. J., Soifer, B. T., Watson, D. M., Weedman,D., Huisjen, M., Troeltzsch, J., Barry, D. J., Bernard-Salas, J., Blacken, C. E.,Brandl, B. R., Charmandaris, V., Devost, D., Gull, G. E., Hall, P., Henderson,C. P., Higdon, S. J. U., Pirger, B. E., Schoenwald, J., Sloan, G. C., Uchida, K. I.,Appleton, P. N., Armus, L., Burgdorf, M. J., Fajardo-Acosta, S. B., Grillmair,C. J., Ingalls, J. G., Morris, P. W., & Teplitz, H. I. 2004, ApJS, 154, 18
Hubickyj, O., Bodenheimer, P., & Lissauer, J. J. 2005, Icarus, 179, 415
Hughes, A. M., Andrews, S. M., Espaillat, C., Wilner, D. J., Calvet, N., D’Alessio,P., Qi, C., Williams, J. P., & Hogerheijde, M. R. 2009, ApJ, 698, 131
Hughes, A. M., Wilner, D. J., Calvet, N., D’Alessio, P., Claussen, M. J., & Hoger-heijde, M. R. 2007, ApJ, 664, 536
Ireland, M. J., & Kraus, A. L. 2008, ApJ, 678, L59
Jayawardhana, R., Hartmann, L., Fazio, G., Fisher, R. S., Telesco, C. M., & Pina,R. K. 1999, ApJ, 521, L129
Kastner, J. H., Huenemoerder, D. P., Schulz, N. S., & Weintraub, D. A. 1999, ApJ,525, 837
Keller, C., & Gail, H.-P. 2004, A&A, 415, 1177
Kenyon, S. J., Dobrzycka, D., & Hartmann, L. 1994, AJ, 108, 1872
Kenyon, S. J., & Hartmann, L. 1987, ApJ, 323, 714
207

—. 1995, ApJS, 101, 117
Lada, C. J. 1987, in IAU Symposium, Vol. 115, Star Forming Regions, ed. M. Peim-bert & J. Jugaku, 1–17
Lada, C. J., Muench, A. A., Luhman, K. L., Allen, L., Hartmann, L., Megeath, T.,Myers, P., Fazio, G., Wood, K., Muzerolle, J., Rieke, G., Siegler, N., & Young, E.2006, AJ, 131, 1574
Lahuis, F., van Dishoeck, E. F., Blake, G. A., Evans, II, N. J., Kessler-Silacci, J. E.,& Pontoppidan, K. M. 2007, ApJ, 665, 492
Leinert, C., Zinnecker, H., Weitzel, N., Christou, J., Ridgway, S. T., Jameson, R.,Haas, M., & Lenzen, R. 1993, A&A, 278, 129
Lissauer, J. J., & Stevenson, D. J. 2007, in Protostars and Planets V, ed. B. Reipurth,D. Jewitt, & K. Keil, 591–606
Lommen, D., Wright, C. M., Maddison, S. T., Jørgensen, J. K., Bourke, T. L., vanDishoeck, E. F., Hughes, A., Wilner, D. J., Burton, M., & van Langevelde, H. J.2007, A&A, 462, 211
Low, F. J., Smith, P. S., Werner, M., Chen, C., Krause, V., Jura, M., & Hines, D. C.2005, ApJ, 631, 1170
Lubow, S. H., & D’Angelo, G. 2006, ApJ, 641, 526
Luhman, K. L. 2004, ApJ, 602, 816
—. 2007, ApJS, 173, 104
Luhman, K. L., & Rieke, G. H. 1999, ApJ, 525, 440
Makovoz, D., Khan, I., & Masci, F. 2006, in Society of Photo-Optical Instrumen-tation Engineers (SPIE) Conference Series, Vol. 6065, Society of Photo-OpticalInstrumentation Engineers (SPIE) Conference Series, ed. C. A. Bouman, E. L.Miller, & I. Pollak, 330–341
Makovoz, D., & Marleau, F. R. 2005, PASP, 117, 1113
Malbet, F., & Bertout, C. 1991, ApJ, 383, 814
Mathieu, R. D., Adams, F. C., & Latham, D. W. 1991, AJ, 101, 2184
Mathis, J. S. 1990, ARA&A, 28, 37
208
Mathis, J. S., Rumpl, W., & Nordsieck, K. H. 1977, ApJ, 217, 425
Mayer, L., Quinn, T., Wadsley, J., & Stadel, J. 2002, Science, 298, 1756
McArthur, B. E., Endl, M., Cochran, W. D., Benedict, G. F., Fischer, D. A., Marcy,G. W., Butler, R. P., Naef, D., Mayor, M., Queloz, D., Udry, S., & Harrison, T. E.2004, ApJ, 614, L81
Megeath, S. T., Hartmann, L., Luhman, K. L., & Fazio, G. G. 2005, ApJ, 634, L113
Melo, C., Santos, N. C., Gieren, W., Pietrzynski, G., Ruiz, M. T., Sousa, S. G.,Bouchy, F., Lovis, C., Mayor, M., Pepe, F., Queloz, D., da Silva, R., & Udry, S.2007, A&A, 467, 721
Monnier, J. D., & Millan-Gabet, R. 2002, ApJ, 579, 694
Muzerolle, J., Calvet, N., Briceno, C., Hartmann, L., & Hillenbrand, L. 2000, ApJ,535, L47
Muzerolle, J., Calvet, N., & Hartmann, L. 1998, ApJ, 492, 743
—. 2001, ApJ, 550, 944
Muzerolle, J., Calvet, N., Hartmann, L., & D’Alessio, P. 2003, ApJ, 597, L149
Najita, J. R., Carr, J. S., Glassgold, A. E., & Valenti, J. A. 2007a, in Protostars andPlanets V, ed. B. Reipurth, D. Jewitt, & K. Keil, 507–522
Najita, J. R., Strom, S. E., & Muzerolle, J. 2007b, MNRAS, 378, 369
Natta, A., Prusti, T., Neri, R., Wooden, D., Grinin, V. P., & Mannings, V. 2001,A&A, 371, 186
Neuhaeuser, R., Sterzik, M. F., Schmitt, J. H. M. M., Wichmann, R., & Krautter,J. 1995, A&A, 297, 391
Norton, A. J., Wheatley, P. J., West, R. G., Haswell, C. A., Street, R. A., CollierCameron, A., Christian, D. J., Clarkson, W. I., Enoch, B., Gallaway, M., Hellier,C., Horne, K., Irwin, J., Kane, S. R., Lister, T. A., Nicholas, J. P., Parley, N.,Pollacco, D., Ryans, R., Skillen, I., & Wilson, D. M. 2007, A&A, 467, 785
Paardekooper, S.-J., & Mellema, G. 2004, A&A, 425, L9
Pascucci, I., Gorti, U., Hollenbach, D., Najita, J., Meyer, M. R., Carpenter, J. M.,Hillenbrand, L. A., Herczeg, G. J., Padgett, D. L., Mamajek, E. E., Silverstone,
209
M. D., Schlingman, W. M., Kim, J. S., Stobie, E. B., Bouwman, J., Wolf, S.,Rodmann, J., Hines, D. C., Lunine, J., & Malhotra, R. 2006, ApJ, 651, 1177
Pascucci, I., Hollenbach, D., Najita, J., Muzerolle, J., Gorti, U., Herczeg, G. J.,Hillenbrand, L. A., Kim, J. S., Carpenter, J. M., Meyer, M. R., Mamajek, E. E.,& Bouwman, J. 2007, ApJ, 663, 383
Pietu, V., Dutrey, A., Guilloteau, S., Chapillon, E., & Pety, J. 2006, A&A, 460, L43
Pollack, J. B., Hollenbach, D., Beckwith, S., Simonelli, D. P., Roush, T., & Fong,W. 1994, ApJ, 421, 615
Pollack, J. B., Hubickyj, O., Bodenheimer, P., Lissauer, J. J., Podolak, M., & Green-zweig, Y. 1996, Icarus, 124, 62
Quillen, A. C., Blackman, E. G., Frank, A., & Varniere, P. 2004, ApJ, 612, L137
Ratzka, T., Leinert, C., Henning, T., Bouwman, J., Dullemond, C. P., & Jaffe, W.2007, A&A, 471, 173
Rayner, J. T., Toomey, D. W., Onaka, P. M., Denault, A. J., Stahlberger, W. E.,Vacca, W. D., Cushing, M. C., & Wang, S. 2003, PASP, 115, 362
Rice, W. K. M., Armitage, P. J., Wood, K., & Lodato, G. 2006, MNRAS, 373, 1619
Rice, W. K. M., Wood, K., Armitage, P. J., Whitney, B. A., & Bjorkman, J. E. 2003,MNRAS, 342, 79
Rivera, E. J., Lissauer, J. J., Butler, R. P., Marcy, G. W., Vogt, S. S., Fischer, D. A.,Brown, T. M., Laughlin, G., & Henry, G. W. 2005, ApJ, 634, 625
Salyk, C., Blake, G. A., Boogert, A. C. A., & Brown, J. M. 2007, ApJ, 655, L105
Santos, N. C., Israelian, G., & Mayor, M. 2004, A&A, 415, 1153
Sargent, B., Forrest, W. J., D’Alessio, P., Li, A., Najita, J., Watson, D. M., Calvet,N., Furlan, E., Green, J. D., Kim, K. H., Sloan, G. C., Chen, C. H., Hartmann,L., & Houck, J. R. 2006, ApJ, 645, 395
Shakura, N. I., & Syunyaev, R. A. 1973, A&A, 24, 337
Shu, F. H., Adams, F. C., & Lizano, S. 1987, ARA&A, 25, 23
Sicilia-Aguilar, A., Hartmann, L., Calvet, N., Megeath, S. T., Muzerolle, J., Allen,L., D’Alessio, P., Merın, B., Stauffer, J., Young, E., & Lada, C. 2006, ApJ, 638,
210
897
Siess, L., Dufour, E., & Forestini, M. 2000, A&A, 358, 593
Simon, M., Dutrey, A., & Guilloteau, S. 2000, ApJ, 545, 1034
Skrutskie, M. F., Dutkevitch, D., Strom, S. E., Edwards, S., Strom, K. M., & Shure,M. A. 1990, AJ, 99, 1187
Sousa, S. G., Santos, N. C., Mayor, M., Udry, S., Casagrande, L., Israelian, G., Pepe,F., Queloz, D., & Monteiro, M. J. P. F. G. 2008, A&A, 487, 373
Stassun, K. G., Mathieu, R. D., Vrba, F. J., Mazeh, T., & Henden, A. 2001, AJ, 121,1003
Strom, K. M., Strom, S. E., Edwards, S., Cabrit, S., & Skrutskie, M. F. 1989, AJ,97, 1451
Strom, S. E. 1972, PASP, 84, 745
Su, K. Y. L., Rieke, G. H., Stansberry, J. A., Bryden, G., Stapelfeldt, K. R., Trilling,D. E., Muzerolle, J., Beichman, C. A., Moro-Martin, A., Hines, D. C., & Werner,M. W. 2006, ApJ, 653, 675
Takami, M., Bailey, J., & Chrysostomou, A. 2003, A&A, 397, 675
Terebey, S., Shu, F. H., & Cassen, P. 1984, ApJ, 286, 529
Uchida, K. I., Calvet, N., Hartmann, L., Kemper, F., Forrest, W. J., Watson, D. M.,D’Alessio, P., Chen, C. H., Furlan, E., Sargent, B., Brandl, B. R., Herter, T. L.,Morris, P., Myers, P. C., Najita, J., Sloan, G. C., Barry, D. J., Green, J., Keller,L. D., & Hall, P. 2004, ApJS, 154, 439
Udry, S., Mayor, M., Benz, W., Bertaux, J.-L., Bouchy, F., Lovis, C., Mordasini, C.,Pepe, F., Queloz, D., & Sivan, J.-P. 2006, A&A, 447, 361
Vacca, W. D., Cushing, M. C., & Rayner, J. T. 2003, PASP, 115, 389
Varniere, P., Blackman, E. G., Frank, A., & Quillen, A. C. 2006, ApJ, 640, 1110
Vogt, S. S., Butler, R. P., Marcy, G. W., Fischer, D. A., Henry, G. W., Laughlin,G., Wright, J. T., & Johnson, J. A. 2005, ApJ, 632, 638
Ward, W. R. 1988, Icarus, 73, 330
211
Watson, D. M., Leisenring, J. M., Furlan, E., Bohac, C. J., Sargent, B., Forrest,W. J., Calvet, N., Hartmann, L., Nordhaus, J. T., Green, J. D., Kim, K. H.,Sloan, G. C., Chen, C. H., Keller, L. D., d’Alessio, P., Najita, J., Uchida, K. I., &Houck, J. R. 2009, ApJS, 180, 84
Weaver, W. B., & Jones, G. 1992, ApJS, 78, 239
Webb, R. A., Zuckerman, B., Platais, I., Patience, J., White, R. J., Schwartz, M. J.,& McCarthy, C. 1999, ApJ, 512, L63
Weidenschilling, S. J., Spaute, D., Davis, D. R., Marzari, F., & Ohtsuki, K. 1997,Icarus, 128, 429
Werner, M. W., Roellig, T. L., Low, F. J., Rieke, G. H., Rieke, M., Hoffmann, W. F.,Young, E., Houck, J. R., Brandl, B., Fazio, G. G., Hora, J. L., Gehrz, R. D.,Helou, G., Soifer, B. T., Stauffer, J., Keene, J., Eisenhardt, P., Gallagher, D.,Gautier, T. N., Irace, W., Lawrence, C. R., Simmons, L., Van Cleve, J. E., Jura,M., Wright, E. L., & Cruikshank, D. P. 2004, ApJS, 154, 1
White, R. J., & Basri, G. 2003, ApJ, 582, 1109
White, R. J., & Ghez, A. M. 2001, ApJ, 556, 265
White, R. J., & Hillenbrand, L. A. 2004, ApJ, 616, 998
Whittet, D. C. B., Prusti, T., Franco, G. A. P., Gerakines, P. A., Kilkenny, D.,Larson, K. A., & Wesselius, P. R. 1997, A&A, 327, 1194
Wilking, B. A., Meyer, M. R., Robinson, J. G., & Greene, T. P. 2005, AJ, 130, 1733
212