the eutectic crystallization of nacl.2h2o and ice · ice from a nacl solution, obtained by solution...
TRANSCRIPT

The eutectic crystallization of NaCl.2H2O and ice
Citation for published version (APA):Swenne, D. A. (1983). The eutectic crystallization of NaCl.2H2O and ice Eindhoven: Technische HogeschoolEindhoven DOI: 10.6100/IR50645
DOI:10.6100/IR50645
Document status and date:Published: 01/01/1983
Document Version:Publisher’s PDF, also known as Version of Record (includes final page, issue and volume numbers)
Please check the document version of this publication:
• A submitted manuscript is the version of the article upon submission and before peer-review. There can beimportant differences between the submitted version and the official published version of record. Peopleinterested in the research are advised to contact the author for the final version of the publication, or visit theDOI to the publisher's website.• The final author version and the galley proof are versions of the publication after peer review.• The final published version features the final layout of the paper including the volume, issue and pagenumbers.Link to publication
General rightsCopyright and moral rights for the publications made accessible in the public portal are retained by the authors and/or other copyright ownersand it is a condition of accessing publications that users recognise and abide by the legal requirements associated with these rights.
• Users may download and print one copy of any publication from the public portal for the purpose of private study or research. • You may not further distribute the material or use it for any profit-making activity or commercial gain • You may freely distribute the URL identifying the publication in the public portal.
If the publication is distributed under the terms of Article 25fa of the Dutch Copyright Act, indicated by the “Taverne” license above, pleasefollow below link for the End User Agreement:
www.tue.nl/taverne
Take down policyIf you believe that this document breaches copyright please contact us at:
providing details and we will investigate your claim.
Download date: 04. May. 2019


TBE EUTEC'l'IC CRYSTAI.I.IZATION OF NaCl.2BzO .AND ICE
'l'BE EUTECTIC CRYSTALLIZATION OF NaCl.2B20 AND ICE
PROEFSCHRIFT
TER VERKRIJGING VAN DE GRAAD VAN DOCTOR IN DE TECHNISCHE WETENSCHAPPEN A.AN DE TECHNISCHE HOOESCHOOL EINDHOVEN, OP GEZAG VAN DE RECTOR MAGNlFICUS, PROF. DR. S. T. M. ACIERMANS, VOOR EEN COMMJSSIE AANGEWEZEN DOOR HET COLLEGE VAN DEKANEN IN HET OPENBAAR TE VERDEDIGEN OP
VRJJDAG 11 NOVEMBER 1983 TE 14.00 UUR
DOOR
DIRK ADRIA.AN SWENNE
GEBOREN TE EINDHOVEN

DIT PROEFSCHRIFT IS GOEDGEKEURD DOOR DE PROMOTOREN
PROF.DR.IR.D.THOENES
PROF.DR.IR.H.A.C.THIJSSEN
© 1983 by O.A.Swenne

Acknowledgements
I wish to express my thanks and appreciation to the students messrs. F. van Dijk, J. van den Heijkant, R. van Herten, E. Linthorst, C. Smits, R. Vervoort and T. de Weerd for their contribution to the experimental and theoretical studies. I would also like to thank messrs. W. Hiethaar, Th. van der Hoeven and B. Wienk of Akzo Zout Chemie Research for their valuable advice. I am indebted to the members of the Vakgroeo Fysische Technologie for their co-operation during this investigation. Thanks also to Anniek van Benrnelen for conscientiously typing the manuscript and to 11\Y wife, Ida Goede for skilfully preparing the figures and doing the scissors-and-paste work. The financial support of Akzo Zout Chemie is greatly appreciated.
iii

Contents
Acknowledgements Contents Summary Samenvatting 1. Introduction
1.1. Salt 1.1.1. Salt sources, methods of recovery,
production and uses 1.1.2. The system NaCl-H2o 1.1.3. The issue of energy
1.2. Freezing processes 1.2 .1. Overview
a. Eutectic freezing processes a.a. Eutectic freezing processes with
direct cooling a.a.a. Direct contact cooling without
evaporation a.a.b. Direct contact cooling with
evaporation a.a.c. Direct contact cooling with
hydrate formation a.a.d. Direct cooling by evaporation
of water a.b. Eutectic freezing process with in-
direct cooling b. Noneutectic and partly eutectic freezing
processes 1.2.2. State of the art
1.3. Objective of this study and set-up of thesis 2. Direct contact cooling ~ith evaporation
2.1. Introduction
iv
2.2. The shape and size of a two-phase drop 2.2.1. Classification of shapes 2.2.2. The size of a two-phase drop in a stirring
tank
iii iv ix xi
1 1 1
1
4
4
4
7
8
9
9
9
9
11

2.2.3. The shape of a two-phase drop as a function of the vapour mass fraction
2.2.4. The motion of a rising two-phase drop in a quiescent liquid
2.3. Heat transfer to two-phase drops 2.3.1. Heat transfer to a rising evaporating two
phase drop in a quiescent liquid 2.3.2. Heat transfer to a rising condensing two
phase drop in a quiescent liquid 2.3.3. Heat transfer between two invniscible liquid
layers with simultaneous boiling and stirring 2.3.4. Heat transfer to evaporating drops in a
stirring-tank 2.3.5. Heat transfer to evaporating drops in a
eutectic stirring-crystallizer 2.4. The particle size distributions of drops and of
bubbles 2.5. Conclusions
3. Crystal nucleation and growth 3.1. Introduction 3.2. Crystal single growth
3.2.1. Interfacial energy 3.2.2. Homogeneous nucleation 3.2.3. Crystal growth rate 3.2.4. Growth classification 3.2.5. Heterogeneous nucleation
3.3. Ice single growth 3.3.1. Introduction 3.3.2. C-axis growth 3.3.3. A-axis growth
a. A-axis growth in pure water b. A-axis growth in NaCl solutions
3.4. NaCl.2H2o single growth 3.5. Heat and mass transfer
3.5.1. Introduction 3.5.2. Models
13
15
16
16
19
19
19
19
24
24 25 25 26
26
28
29 30
31 31 31 33
34
40
41 41 41
v

a. Isotropic turbulence model b. Slip velocity model c. Penetration model d. Transpiring and shrinking
3.5.3. Correlations 3.6. Secondary nucleations
3.6.1. Introduction 3.6.2. Sources of nuclei 3.6.3. Detachment mechanisms
a. Spontaneous detachment b. Fluid shear c. Crystal-crystallizer collisions d. Crystal-crystal collisions
42 44 44 45 45
3.6.4. Relative importance of detachment mechanisms 46 3.6.5. Rate controlling stages 46 3.6.6. Correlations 47 3.6.7. Theoretical models 47
3.7. Ice growth from a NaCl solution in a stirring-tank 48 3.7.1. Ice growth in a batch crystallizer 48
a. Ice growth in a batch crystallizer with direct coo 1 i ng
b. Ice growth in a batch crystallizer with indirect cooling
3. 7 .2. Ice growth in a continuous crystallizer with 49 direct-contact cooling
3.8. Particle size distributions 3.8.1. Representation of distributions
50
50
3.8.2. The steady state continuous mixed suspension 54 mixed product removal crystallizer
3.9. Conclusions 57 4. Crystallization experiments
4.1. Introduction 59
59
60
60 60 61 63 64
vi
4.2. Set-up and procedure 4.2.1. General description of set-up 4.2.2. Crystallizer 4.2.3. Brine circuit 4.2.4. Refrigerant circuit 4.2.5. Purity of substances

4.3. Measurement techniques 64 4.3.1. Subcooling 64 4.3.2. Temperatures 65 4.3.3. Pressure 65 4.3.4. Flow rates 66 4.3.5. Crystallizer volume 66 4.3.6. Stirring speed 66 4.3.7. Particle size 66 4.3.8. Crystal shape 68 4.3.9. Drop concentration 68 4.3.10.Crystal mass fraction 68 4.3.11.Residence time 69 4.3.12.Growth rate 69 4.3.13. Nucleation rate 69 4.3.14. Purity of crystals 69
4.4. Results 70 4.4.1. Qualitative observations 70 4.4.2. Unsteady state behaviour 71 4.4.3. Crystal size 74 4.4.4. Drops 85 4.4.5. Purity of crystals 87
4.5. Discussion 87 4.5.1. Crystal shape 87 4.5.2. Unsteady state behaviour and crystal size 87
distributions 4.5.3. The influence of pressure 89
a. Introduction b. Determination of hd and he of a two
phase drop c. Subcooling detennination d. Growth and nucleation
4.5.4. The influence of T, Na and b 4. 5 . 5 . Drops 4.5.6. Purity of crystals
4.6. Conclusions 5. Separation of two solids in a hydrocyclone
5.1. Introduction 5.2. Hydrocyclone properties
94 98 99 99
101 101
101
vii

5.3. Experimental set-up and procedure 5.3.1. Set-up 5.3.2. Procedure
5.4. Results 5.5. Conclusions
6. Cone 1 us ions 6.1. Conclusions of this study 6.2. Scaling-up
103 103
106
107
107 110 110
111 6.3. Economical feasibility 112
A. Power consumption of freezing processes 114 A.1. Introduction 114 A.2. Eutectic freezing process with saturated feed 114 A.3. Eutectic freezing process with unsaturated feed 115 A.4. Noneutectic and partly eutectic freezing processes 118
with saturated feed A.5. Process with incomplete ice-NaC1.2H20 separation 118 A.6, Process with incomplete crystal-brine separation 121
B. Calculation of the size of a two-phase drop in a 124 st i rri ng-tank
Notation References Curriculum vitae
viii
127 132 141

Summary
This thesis deals with the eutectic crystallization of NaCl.2H2o and ice from a NaCl solution, obtained by solution mining, with the object of separating NaCl from H20. The eutectic freezing process is an alternative for the evaporation of the NaCl solution. Calculations have shown that under certain conditions the freezing process may be more economical than the evaporation process. As the freezing process had hardly been investigated, it was chosen as the subject of the present study. In the framework of this study experiments with a continuous stirringcrystallizer containing 2 litres of suspension were conducted, the heat being removed by means of direct-contact cooling with evaporation of freon 114. In the experiments NaCl.2H20 and ice crystals grew separately. The following quantities were determined: the size, size distribution, shape, growth velocity, nucleation rate and purity of the ice and NaCl.2H20 crystals, the size, size distribution and concentration of the freon drops and the subcooling. These quantities were determined as functions of average residence time, freon pressure, stirring rate and crystal
' mass fraction .. It appeared that for a residence time of 15 minutes and a crystal mass fraction of 5% the sizes of ice and NaCl.2H2o crystals were approximately 100 µm. The size increased with increasing residence time T as ,o. 3
and with increasing crystal mass fraction b as b-0·2• The pressure and stirring rate had little or no influence on the crystal size. The size distribution of the NaCl.2H2o was exponential, that of the ice exhibited a maximum. The ice growth was heat or mass transfer limited, that of NaCl.2H2o was partly inbuilding limited. The nucleation of both kinds of crystal was slightly surface regeneration limited, and crystal-crystal collisions made a larger contribution to the total nucleation than crystal-crystallizer collisions. The freon drops had sizes of approximately 50 µm. °the subcooling was approximately 0.1 K for a residence time of 15 minutes. The separation of the crystals formed in the eutectic crystallization process was studied in a hydrocyclone of 1 cm in diameter with a model system at ambient temperature. The separation efficiencies of the light
ix
and heavy particles were determined as functions of pressure drop, overflow/underflow ratio, and particle mass fraction. The fraction of light particles appearing in the overflow increased to approximately 98% with increasing overflow/underflow ratio, and the fraction of heavy particles appearing in the underflow was approximately 98% under all conditions. The conclusion is that the eutectic freezing process for separating NaCl from H2o is technically feasible. It may be economically feasible for a grass root plant, if high purity salt is required or if the energy prices remain high.
x

Samenvattiog
Dit proefschrift behandelt de eutectische kristallisatie van NaC1.2H2o en ijs uit een door "solution mining" verkregen NaCl-oplossing, met als doel NaCl en H2o te scheiden. Het eutectisch vriesproces is een alternatief voor het indampen van de NaCl-oplossing. Uit berekeningen is gebleken dat onder bepaalde ornstandigheden het vriesproces goedkoper kan zijn dan het indampproces. Aangezien het vriesproces nog nauwelijks onderzocht was, werd het gekozen als onderwerp van deze studie. In het kader van dit onderzoek werden experirnenten uitgevoerd met een 2 liter kristallisator, waarbij de warmte werd onttrokken door middel van direct contact koeling met verdamping van freon 114. In de experimenten bleken de NaCl .2H2o- en ijskristallen gescheiden van elkaar te ontstaan. De volgende grootheden werden bepaald: de grootte, grootteverdeling, vorm, groeisnelheid, nucleatiesnelheid en zuiverheid van de ijs- en NaC1.2H20-kristallen, de grootte, grootteverdeling en concentratie van de freondruppels, en de onderkoeling. Deze grootheden werden bepaald als functies van de gemiddelde verblijftijd, freondruk, roersnelheid en kristalmassafractie. Het bleek dat voor een verblijftijd van 15 minuten en een kristalmassafractie van 5% de ijs- en NaCl.2H20-kristallen ongeveer 100 µm groot waren. De afmeting nam toe met toenemende verb1ijftijd, als ,o. 3
en met toenemende kristalmassafractie b als b-0·2. De druk en de roersnelheid hadden weinig of geen invloed op de. kristalgrootte. De grootteverdeling van het NaCl .2H2o was exponentieel. die van het ijs vertoonde een maximum. De ijsgroei was warmte- of massatransportgelimiteerd, die van het NaCl.2H2o was gedeeltelijk inbouwgelimiteerd. De nucleatie van beide kristalsoorten was enigszins "surface regeneration limited", en kristal-kristal botsingen droegen meer bij tot de totale nucleatie dan kristal-kristallisator botsingen. De freondruppels hadden afmetingen van ongeveer 50 µm. De onderkoeling was ongeveer 0.1 K voor een verblijftijd van 15 minuten. De scheiding van de in het eutectisch vriesproces gevormde kristallen werd bestudeerd bij omgevingstemperatuur met een modelsysteem in een hydrocycloon van 1 cm diameter. De scheidingsefficienties van de lichte en zware deeltjes werden bepaald als functies van drukval, overloop/ onderstroom-verhouding, en deeltjesmassafractie. De fractie lichte
xi

deeltjes in de overloop nam toe met toenemende overloop/onderstroomverhouding tot ongeveer 98%, en de fractie zware deeltjes in de onderstroom was onder al le omstandigheden ongeveer 98%. De conclusie is dat het eutectisch vriesproces om NaCl en H20 te scheiden technisch realiseerbaar is. Het is wellicht economisch haalbaar voor een "grass root plant" als zout met een hoge zuiverheid is vereist of als de energieprijzen hoog blijven.
xii

1. Introduction
1.1. Salt
1.1.1. Salt Sources, Methods of Recovery, Production and Uses
Salt {sodium chloride} is principally obtained from the following three sources:
{i} Rock salt: the salt is mined or quarried. This source yields 45 Mt/a of salt.
(ii} Sea salt: the salt is obtained from sea water, the water of which being removed by solar evaporation. This source yields 60 Mt/a of salt.
{iii) Salt obtained by solution mining. This source accounts for 65 Mt/a of salt. In this process, water is pumped into a brine well {bore hole}, the salt dissolves in the water, and subsequently the solution is pumped up. From this solution 20 Mt/a of salt is obtained by evaporation of water in closed vessels, mostly in multi-effect evaporators. This salt is called "vacuum salt". The rest of the solution is used directly in industry.
The total annual world production thus amounts to 170 Mt. About 50% of the quantity of salt is utilized for the industrial production of c1 2, NaOH and Na2co3. Further data can be found in [Ka 60].
1.1.2. The System NaCl-HzO
Figure 1.1 shows the phase diagram of the system NaCl-H2o between T = 250 K and T = 280 K. Two components are present: NaCl and H2o. The phases that may exist are: vapour, solution, ice, solid NaCl and solid NaCl .2H2o. The degrees of freedom that are possible are: temperature (T}, pressure (p} and mass fraction NaCl (w}. According to Gibbs' phase rule, the sum of the number of degrees of freedom and the number of phases equals 4 for this system. Only 4 phases can thus exist simultaneously; temperature, pressure and composition are then fixed. This occurs at point E: the eutectic point {TE = 252.03 K, wE = 0.2331, pE = 92.6 Pa) and at point P: the peritectic point {Tp = 273.25 K, wp = 0.26285, Pp= 464 Pa).
1

280
T (K)
t
270
260
250
slope: ~ = 14 kK dw NaCl & saturated solution
Ti = 273.16 K
P; = 611.2 Pa P wh = 0.61863 1---------~----------i Wp = 0.26285
Pp = 464 Pa Tp = 273.25 K
unsaturated
ice &
unsaturated
solution
E
NaC1.2H20 &
saturated so 1 uti on
NaCl & NaCl • 2Hz0
1--------L-----------1TE = 252.03 K WE = 0.2331
PE = 92.6 Pa
0.0 0.2 0.4 0.6 0.8 - w (1)
1.0
Fig!AX'e 1.1. Phase diagram of NaCl-H2o. In each point of the diagram the vapour is in equiZibrium
u>ith the other phases.
The phase diagram is 3-dimensional, with pressure as the third variable, but because the pressure has a negligible influence on the equilibrium temperature or on the equilibrium composition, the vapour is omitted in this diagram. In each point of the diagram the vapour volume is assumed to be negligible compared to the volume of the other phases. If the pressure of the system is increased, the vapour is no longer in equilibrium with the other phases. Then the melting temperature of ice and the eutectic temperature will decrease and the peritectic temperature and composition will increase. In the eutectic point, vapour, solution. ice and NaCl.2H20 are in equilibrium and in the peritectic point, vapour, solution. NaCl and NaCl.2H2o are in equilibrium. The point where vapour, solution. ice and NaCl are in equilibrium is the metastable eutectic point. It was found
2

at T = 250.8 K, w = 0.23 [Me 05). The intersection of the extended ice and NaCl solubility curves, however, is T = 249.6 K, w = 0.26. This discrepancy has not been explained so far. In addition t? NaCl.2H20 another NaCl hydrate is known: NaCl.H20, but only as a molecule, not as a crystal lattice [Au 78). NaCl has the mineralogical name of "halite" and it occurs in 2 crystal fonns [Ba 68). The low pressure {p < 20 GPa) structure is cubic. NaCl .2H2o has the mineralogical name of "hydrohalite" and has a monoclinic lattice [Kl 74). Ice occurs in 11 crystal fonns [Mi 80]. The stable low pressure {p < 100 MPa, T < 100 K) crystal structure is hexagonal, and is called ice Ih. Only the low pressure structures of NaCl and ice are relevant to this study. All three kinds of crystals {NaCl, NaCl.2H2o ice Ih) are colourless.
100 slope: if! = 50 kJ/g
dw
- unsaturated solution l;T>
;:;- 0 -~ .......
:::i.: -100 ~ ~ ' m T. :5-200 ~ l c <11
L30o
-400
0.0
ice & NaCl .2H2o
0.2 0.4
Figu:t.>e 1. 2. Enthalpy diagram of NaCZ-H20.
NaCl & saturated solution
0.6
Tp = 273.25 K
TE = 252.03 K
T; = 273.16 K
0.8 - w (1)
1.0
H = 0 for "liquid water and solid NaCZ at T = 273.15 K.
In each point of the diagram the vapour is in equiZibriwn
with the other phases.
3

Figure 1.2 shows the enthalpy diagram for the system NaCl-H2o between T = 250 K and T = 290 K; in this diagram H = 0 is taken for liquid water and solid NaCl at T = 273.15 K [Fa 56, Ku 57]. From this diagram specific heats and heats of melting can be read. The enthalpy H is also a function of pressure, but in this temperature range the pressure has only little influence on H. In the diagram the vapour volume is assumed to be negligible compared to the volume of the other phases.
1.1.3. The Issue of Energy
As has been mentioned in section 1.1.1, multi-effect evaporation is a widely applied method of separating NaCl form H2o. The energy costs of this process depend on several factors and constitute a considerable part of the total production costs. In view of the rising energy prices in the past it became of interest to consider less-energy consuming alternatives. Freezing processes appear to be promising from an energy point of view. Therefore, this type of processes was chosen as a subject for this study.
1.2. Freezing Processes
1.2.1. Overview
Freezing processes applied to produce NaCl from brine can be divided into two categories: eutectic and noneutectic processes. Both categories can be subdivided into two subcategories: processes with direct cooling and processes with indirect cooling. Direct cooling can be effected by means of a nonevaporating nonsoluble refrigerant, an evaporating nonsoluble refrigerant, an evaporating hydrate former or by evaporation of water. Power consumptions of the freezing processes are calculated in appendix A.
a. Eutectic Freezing Processes ,
Figure 1.3 shows the principle of the eutectic freezing process. The solution is cooled to T = 252 K (the eutectic temperature}. At the trajectory T = 273 K + T = 252 K some NaCl.2H2o crystallizes. At T = 273 K the solution is (partly} frozen in the crystallizer. Because this freezing occurs at the eutectic temperature, ice as well as
4

NaCl.2H2o crystal.lizes. These two kinds of crystals are then fed to a separator. This device separates the ice-NaCl.2H20-brine slurry into an ice-brine and a NaCl.2H20-brine slurry. Separation can be effected on the ground of the density difference of the two substances: ice is lighter than the brine, NaCl.2H20 is heavier than the brine. The NaCl.2H2o crystals are heated and dissociated at T = 273 K into NaCl and saturated solution. The solution is recirculated to the crystallizer. The NaCl is the end product. The ice crystals are heated, washed and melted at T = 273 K. The resulting water can be used to dissolve new salt. If flow Qhl' 011 , Qh or Qi is partly recirculated to the crystallizer, the ice or NaCl.2H2o crystal concentration in the crystallizer can be varied independently of residence time or total production.
a.a. Eutectic Freezing Processes with Direct Cooling
a.a.a. Direct Contact Cooling without Evaporation
An immiscible nonevaporating liquid of temperature lower than TE is suspended in the slurry and separated from the slurry afterwards. The density difference between the slurry and the refrigerant is utilized to separate them. This method is not economically feasible, because the power consumption and the size of the compressors are prohibitively large.
a.a.b. Direct Contact Cooling with Evaporation
An immiscible liquid is suspended in the slurry and evaporated by lowering the pressure. Table 1.1 lists possible refrigerants. Some literature is available [Ba 75, Ba 77, Ba 78, Fl 75, Fl 79, St 73a, St 73b]. This process may be economically feasible.
a.a.c. Direct Contact Cooling with Hydrate Fonnation
An immiscible liquid is suspended in the slurry. The heat is removed by evaporating part of the refrigerant. The remaining refrigerant forms a hydrate (solid) which decomposes at a higher temperature into water and vapour. This process may be economically feasible.
a.a.d. Direct Cooling by Evaporation of Water
In this process the heat is removed by evaporation of water. This process is not economically feasible because the compressors are prohibit-
5

Nae 1. 2H2o & ice
& solution
NaCl solution ~~~~~____,.~~~~-+-~
crys ta 11 i zer
solution
product water
washing water
ice & solution
Qil
solution
Figure 1.3. Principle of eutectic fPeezing pPOcess (with diPect cooling
with evapoPation).
NaCl .2H20
&
solution
crys ta 11 i zer
solution
NaCl solution
NaCl solution
Figia>e 1.4. Principle of noneuteatic fPeezing pPOaess (with diPect
cooling with evapoPation).
6

Substance Structural Fonnula Tb (p= 101 kPa) Ref.
Fll13 CF2 = CFCl 244.8 Ba 60 isobutene CH2 = C - (CH3)2 266.3 Br 62 1-butene CH = CH - CH2 - CH3 266.9 Ba 60 FC318 Cf z - (CF2)z - 9F2 267.6 Ba 60 1,3-butadiene CH2 = CH - CH = CH2 268.8 Ba 60 n-butane CH3 - (CH2)2 - CH3 272.7 Ba 78
2-transbutene} CH3 - CH = CH - CH 3 274.0 Br 62
2-ci sb utene 276.9 Br 62 Fl14 CC1F2 - CC1F2 277.0 Br 62 Fl33a CF3 - CH2Cl 280.1 Ba 60 1-butyne CH :: C - CH2 - CH3 281.3 Br 62 neopentane C - (CH3)4 288.8 Ba 60
Fl112a CC1 2 = CF2 293.6 Br 62 Fl42 CH2Cl - CHF2 309 .2 Br 62
Tab le 1. 1. Compounds that form no hyd:l'ate and are in.so Zub Ze in ?Jater.
ively large.
a.b. Eutectic Freezing Process with Indirect Cooling
The heat is removed by cooling the wall of the vessel. Indirect cooling is not economically feasible. Some literature is available [Ne 54, Th 56. BJI 79, no 101 •
b. Noneutectic and Partly Eutectic Freezing Processes
Figure 1.4 shows the principle of the noneutectic freezing process. In this process no ice is formed. The product solution can be used to dissolve new salt. Processes intermediate between eutectic and noneutectic freezing processes are also conceivable. These processes are not economically feasible because of the high capital investments of the entire equipment.
1.2.2. State of the Art
Of the processes in section 1.2.l only knowledge about the thermo-
7

dynamic properties was available. The crystal size and crystal size distribution as functions of conditions were unknown. The size of the separation and of the washing equipment and consequently the capital costs depend on the crystal size. Also unknown was the performance of equipment that separates two kinds of crystals, one heavier and one lighter than the liquid. It appeared that due to lack of data it could not be calculated whether freezing fs a cheaper method of salt recovery than evaporation.
1.3. Objective of this Study and Set-up of Thesis
The objective of this study was to produce the data that were still unknown. As has been mentioned in section 1.2.1, only alternatives a.a.b and a.a.c are perhaps economically feasible. Only direct contact cooling with evaporation has been proved to be possible [St 73b]; so it was decided to study this process. In addition, the separation of two solids was studied, in the device that has proved to function well [St 73b]: a hydrocyclone. Chapter 2 presents a theoretical model of direct contact evaporation. In chapter 3 the theory and the literature on crystallization is reviewed. Chapter 4 deals with the experimental data on eutectic crystallization of NaC1.2H2o and ice. The data on the separation experiments in a hydrocyclone are presented in chapter 5. The main conclusions of this work are given in chapter 6.
8

2. Direct Contact Cooling with Evaporation
2.1. Introduction
In this chapter the theory of direct contact cooling with evaporation is presented. In this process a liquid refrigerant is injected into a stirring-tank filled with suspension. The refrigerant must be only slightly miscible with the bulk liquid, and the bulk liquid must be much less volatile than the refrigerant. The refrigerant is evaporated by maintaining a low pressure by means of a compressor. In this way, heat is withdrawn from the bulk liquid. The size, shape and motion of evaporating refrigerant drops is studied in section 2.2. The heat transfer characteristics of evaporating refrigerant drops are treated in section 2.3. In section 2.4 the particle size distributions of drops and of bubbles are mentioned. The main conclusions of this chapter are given in section 2.5.
2.2. The Shape and Size of a Two-phase Drop
2.2.1. Classification of Shapes
In this section the shape of a drop. consisting of a liquid and its vapour ("two-p~ase drop"), in another. inmiscible liquid will be described. First. consider a liquid 1 upon which a drop of liquid 2 is dripped {see figure 2.1).
vapour (1&2) vapour (1&2)
liquid 2 liquid 2 iquid l
Liquids mutually saturated Liquids mutually saturated.
Fi(JUN 2.1. Fi(JUN 2. 2.
Initially this drop will take the shape of a lens. Next, either of two things will happen: the drop spreads over liquid 1 or it remains a lens.
9

The lens will spread if cr1 ~ cr2 + cr12 , where cr1 is the jnterfacial tension between liquid 1 and the vapour, cr2 the interfacial tension between liquid 2 and the vapour, and cr12 the interfacial tension between liquid 1 and liquid 2. If the lens does not spread and p2 > p1, then the drop will sink to the bottom. Next, consider a layer of liquid 2 upon which a drop of liquid 1 is dripped (see figure 2.2). Now the lens will spread if cr2 ~ cr1 + cr12 . If cr 12 > icr 1 - cr2!. the lens will spread in neither case. In these experiments the drop must of course be prevented from evaporating. From these experiments the shape of a vapour bubble at the interface of the two liquids can be deduced (see figure 2.3).
liquid 2 (saturated with liquid 1)
vapour (1&2) vapour (1&2) vapour (1&2)
~ t) b f)
0 2 : 0 1 + 0 12 0 12 :lcr1- 0 21 0 1 : 0 2 + 0 12
1 iqui d 1 (saturated with liquid 2)
Figure 2.3
If liquid 2 spreads over liquid 1, one could say that liquid 1 and the vapour "don• t want to see each other". It appears that the vapour bubble withdraws into liquid 2. The cr's can also be measured by a surface tension measuring instrument, but the spreading experiment is a convenient way to determine which of the three cases is at hand. Next consider an evaporating drop having surface tension crd imnersed in a liquid having surface tension crc. Figures 2.4, 2.5 and 2.6 show the shapes of the evaporating drops.
10

~ 0 0 ~=10- 3
~= 0.01 ~=0.03
0 c ~ 0 d + 0 cd
0 0 ~=0.01 ~=0.03
ocd >loc - odl
0 0 0 0 0
®
FigUPe 2.4 FigUPe 2.5 FigUPe 2.6
~ : evaporating liquid D : vapour
FigUPes 2.4, 2.5, 2.6. Evaporating drop immersed in a nonvoZatiZe
Ziquid.
In figures 2.4 and 2.5 is denoted the evaporated fraction t of the total drop mass. The shapes of two-phase drops were determined photographically, those of figure 2.4 by Sideman & Taitel [Si 64], Simpson et al. [Si 73b] and Pinder [Pi 80]. those of figure 2.5 by Tochitani et al. [To 77a] (furanglycerol), and those of figure 2.6 by Iida & Takashima [Ii 80] {aceton & methanol-silicone oil). To prevent explosive evaporation. the nucleation (creation of vapour bubble) must be induced. In a stirred suspension the nucleation is induced by collisions. Homogeneous nucleation has been described byJarviset al. [Ja 75] and Avedisian & Andres [Av 78].
2.2.2. The Size of a Two-phase Drop in a Stirring-tank
In figure 2.7 the vapour bubble is apt to rise under the influence of the buoyancy force (also see Selecki & Gradon [Se 72]}. This will happen if
{2.1)
where Fis the upward force {=buoyancy force minus weight). his the distance over which the bubble penetrates liquid 2, A2v is the area of
11

F
liquid 2 h
liquid 1 vapour
FiguPe 2. 7.
the part of the sphere, wetted by liquid 2, and A12 is the liquid to
liquid interfacial area. A force is the derivate of an energy, hence an energy balance is equivalent to a force balance as far as the possibility of motion is concerned. · The upward force equals:
The differentials of the areas are: dA2v = 2lrrvdh and dA12 = 2lr(h - rv)dh~ Expression 2.1 must hold for all h (O ~ h ~ 2rv) so
This is true for a 11 r v :: 0 if cr 1:: cr2 +cr 12 • If cr2'.:cr1 +a 12 or 0 12> I cr 1 - cr2 I only bubbles with radius
can rise and leave the interface. The same principle can be applied to a two-phase drop in a continuous liquid. This calculation is presented in appendix B. The result is shown in figure 2.8. For a given acceleration of the two-phase drop and for a given vapour mass fraction, this figure shows the size rv* of the vapour bubble for which the bubble detaches from the liquid drop. It is shown that this critical radius decreases if the acceleration increases.
12

9
8
7
6
-..... 5 I Ci)
N ......... ("I') 4 E ("I')
I 0 ..... 3
~ i<
> 2 !...
t 1
0
Figure
0.0
2. 8.
0.2 0.4 0.6 0.8 1.0 -- c; (1)
r v*: bubble radius for 1.1Jhich bubble d.etaches from droplet
at given acceleration a.
The critical radius for n-butane is larger than the critical radius for Fl14, because for n-butane the buoyancy force and the inertial force have the same direction but for F114 these forces have opposite directions.
2.2.3. The Shape of a Two-phase Drop as a Function of the Vapour Mass Fraction
Tochitani et al. [To 77a] present a model in which ~(B) is given, where s is the half opening-angle. The total two-phase drop is assumed to be spherical (figure 2.9). It can be shown that
13

FiguP8 2.9. d
Figur>e 2. 10.
Pv(2 - 3cose + cos 3e} ~ =~-------------------------------
pd(2 + 3coss - cos 3s} + Pv(2- 3cose + cos3a}
Pinder [Pi 80] found the following correlation by measurements:
p p p a = ~ f 1 ~ 3 tan 2 (~ arctan l}
2 dollc g ---z-z· crd Pc
(2.2}
-1 P1 = -7.91 m d0 - 0.1565 (where d0 is the initial drop diameter) P2 = 6.205 P3 = -6.032.
Pinder fixed ~ by using a mixture of a volatile and a nonvolatile component as the dispersed phase. When the drop size does not increase further. a is detennined. The areas of the liquid to liquid interface (Acd>• of the vapour to continuous liquid interface (Acv>• of the vapour to dispersed liquid interface (Adv> and of the total two-phase drop (A} can be determined as follows. Assume the vapour bubble to be spherical (figure 2.10}. The equivalent drop diameter is defined as de = ( d1
2d2} 1/3 where d1 is the largest dimension and d2 is the smallest dimension of the total twophase drop.
14

. Then A = Trd/ Acv= 2Trr /(1- cosB)
2 Adv= 2Trrv (1 + COSB)
Acd= A - Acv de== (1- i:; + (pd/pv}F;}l/3do
Figures 2.11 to 2.16 show B. AcvlArJ. A~vlArJ. Acd/Ao• de/d0 as of i:;, both axis linear, where Ao == Trd0 •
1T 40
B t 0.8
Acv Adv AO AO t t
0 1 0 1 -t;. -i:;
(2.3} functions
1 - t;
Figure 2.11. Figure 2.12. Figure 2.13.
5 4
1.2 1.0 A de
Acd ~ ao AO t t 1 t
0 1 l 0 -t;. 1
-t;. -E:.
Figure 2.14. Figure 2. 16. Figure 2. 18.
2.2.4. The Motion of a Rising Two-phase Drop in a Quiescent Liquid
This subject is described by Tochitani et al. [To 75], Selecki & Gradon [Se 76] and Mokhtarzadeh & El-Shirbini [Mo 79a]. A general theoretical treatment of two-phase drops is given by Mokhtarzadeh & El-Shirbini [Mo 79b].
15

2.3. Heat Transfer to Two-phase Drops
2.3.1. Heat Transfer to a Rising, Evaporating Two-phase Drop in a Quiescent Liquid
Two evaporation regimes can be distinguished: one with ad ~ ac + acd and one with ac ~ ad + acdor acd > lac - crdl (see figures 2.4, 2.5 and 2.6). . Selecki & Gradon [Se 72] incorrectly distinguished the regimes ac < crd and crc > crd. This error has gone unnoticed thus far because nobody has studied the case ac < crd and crcd > lcrc - ad!' The subcooling of a two-phase drop, AT, is defined as: the temperature of the bulk liquid T1, minus the equilibrium temperature corresponding to the boiling pressure of the dispersed liquid at the given depth Tb. (The drops are so large that the curvature effect (see section 3.2.2) plays no role.) The area that is used to define the heat transfer coefficient h~ is the total two-phase drop area A. The case crd ::-_ crc + crcd is treated by Selecki & Gradon [Se 72] and Gradon & Selecki [Gr 77]. No heat transfer coefficient is calculated or measured, however. The case ac ~ crd + crcdorcrcd > lac - crdl has been studied by several authors: In their experiments they allow evaporating drops to rise in a warm liquid; the size as a function of time is then determined. From this function de(t), the overall heat transfer coefficient h
0 has been determined. The experiments were conducted at atmo
spheric pressure. Sideman & Taitel [Si 64] 'developed a model of the heat transfer to an evaporating drop and found:
h = kc ( 3coss - cos 3s + 2)! Pee~ c a;- 1T
(2.4)
Tochitani et al. [To 77b] developed a model resulting in:
k . 2/3 1/3 he = o.463 a; (1T - s + ~) Pee · (2.5)
Simpson et al. [Si 73b] developed a model (sloshing model) yielding:
16

12 k a116 h - d d - 2 173 d 1/2 (2.6)
\Id 0
and 25 70 (de/ d0) 116
ho = _l _+_o_.-2-06_(_de_/_do_).,..5""T'/ 1 ..... 2 (2.7)
Sideman & Taitel [Si 64] found from experiments that for butane in sea water h0 = 1500 .:!:. 700 W/(m2K). with a slight maximum at t; = 0.03 and a decrease of h0 at larger ~T (4K < ~T < 13K) (figure 2.17E). Tochitani et al. [To 77b] found for pentane in glycerol qualitatively the same relation (slight maximum, ah/a~T < 0), but their h0 is one order of magnitude smaller than the h0 of Sideman & Taitel for butane in sea water. Simpson et al. [Si 73b] report that for butane in a NaCl-solution the h
0 = 2500.:!:_500W/(m2K). In their experiments h0 appeared to be independ
ent of ~T (2K < ~T < SK), however, and to increase monotonously as a function oft; (ah /at;> 0) (figure 2.18F). Furthermore, they found for de/do > 2 (t; > 0.03) that h0 is independent of the NaCl concentration (0 < w < 0.08). Prakash & Pinder [Pr 67], Sideman & Isenberg [Si 67] and Raina & Grover [Ra 82] give some more results. Experiments with various systems (no butane, no NaCl solution, up to high µc (10 mPas), Pc> pd) conducted by Adams & Pinder [Ad 72] revealed that
-h- = 7550 kd Pr -0. 75 ( µc )4.3 Bo0.33' oO CIQ c µc + µd
(Pc - Pd)g do 2
where the Bond number Bo= a (also called the Eotvos number Eo) and ho0 is the overall cd heat transfer coefficient based on Ao and averaged over t;.
From figure 2.17 it is seen that h0(t;) is approximately constant. Therefore h00 A0 = h0 f A(t;) c!E;. Because A/Ao = (de/d0)2 this yields with equation 2.3: O
17

h l} oO
- c; (1)
(2.8)
Figure 2.17. Heat transfer ooefj'iaient h as a funotion of vapoUP mass
fro.otion t; for n-butane in a IV 0.04 NaCl so"lution.
Data f'l'Om various authors (see text seotion 2.2.1).
Figure 2.17 shows the various results of h(t;). To compare these results. for the refrigerant, NaCl mass fraction, and initial drop diameter the following choise had to be made: n-butane, w = 0.04 and d0 = 3.7 mm respect i ve ly • Curve A represents equation 2.4 with the rise velocity according to [Si 64}: figure 14 and S(t;) according to equation 2.2 with d0 = 3.7 mm.
18

Curve B shows equation 2.5 with rise velocity according to [Si 73bJ: equation 3 and B(~) according to equation 2.2. Curve C illustrates equation 2.6 with d0 = 3.75 mm. Curve D represents equation 2.7 with d0 = 3.75 mm. Curves El,2 are [Si 641: figure 17, butane - sea water (d0 = 3.6 mm) with El : lff = 4K, E2 : AT = 7K. Curve Fis [Si 73J: figure 8 (d0 = 3.75 mm). Curve G represents equation 2.8 with d0 = 3.7 mm.
2.3.2. Heat Transfer to a Rising Condensing Two-phase Drop in a Quiescent Liquid
This case is described by Sideman & Hirsch [Si 65bJ and by Isenberg & Sideman [Is 70]. This phenomenon does not occur in the type of processes we studied; it is therefore not treated here.
2.3.3. Heat Transfer Between Two Immiscible Liquid Layers with Simul-taneous Boiling and Stirring
This case is treated by Fortuna & Sideman [Fo 68J. It occurs at very low stirring rates, which are not applied in this study, for which reason this case is not treated here.
2.3.4. Heat Transfer to Evaporating Drops in a Stirring-tank
Sideman & Barsky [Si 65aJ conducted experiments in a stirring-tank with high dispersed phase concentration {Em= 0.03). Heat was supplied by a heating plate and the bulk subcooling was measured. The results can be represented by (Ptv1/
1 "'AT Ec2, where P is the heating power supplied by the heating plate and E: the agitation power per liquid mass. The exponents c1 and c2 depend on Rea and are approximately unity.
2.3.5. Heat Transfer to Evaporating Drops in a Eutectic Stirring Crysta 11 i zer
In a eutectic crystallizer the bulk temperature T1 ·is fixed. The heat of crystallization is removed by evaporating a refrigerant by means of a compressor. If the refrigerant is com~letely suspended, the pressure is a variable. If the refrigerant is (partly) present as a layer on the bottom of the tank, the pressure is fixed. If the refrigerant floats
19

upon the suspension, then Ps = Pe(T1); if the suspension floats upon the refrigerant, then Ps = Pe(T1) - Ph• where Ps =surface pressure, Pe = equilibrium pressure and ph = hydrostatic pressure across the suspension. It is assumed that both layers have the temperature r 1. If the drops are fully suspended, the following model is applicable: Consider a horizontal slice with thickness dz in the crystallizer. The slice generates a refrigerant vapour mass flow density
l drJ> _ h0 AT b. T ( z) dz
Of ~ 0 y ' (2.9)
with zb the 11boilinq depth": the depth where Ph= Pe(T1), and Ar is the drop area density (m-1) (total drop interfacial area divided by bulk suspension volume, see section 3.8.1). From section 2.2.l it is clear that for conditions that have not been experimentally studied, h0 is best predicted by equation 2 .• 8. The results of section 4.4.4 show that the maximum drop size d"" 150 µm; therefore, do is taken to be 150 µm. Then for a eutectic NaCl solution with n-butane as a refrigerant equation 2.8 yields h0 = 1300 W/m2K, and with Fll4 as a refrigerant ho = 310 W/m2K. This difference is principally caused by the difference in thermal conductivity of n-butane and Fll4. Equation 2.8 is applicable only if the velocity of the drop relative to the surrounding liquid equals the rise velocity in a gravitation field. In a stirring-crystallizer this velocity is larger. The above h0 's are therefore lower limits. In the calcu·lation of h
0 of Fll4, (Pc - pd) is
replaced by (Pd - Pc). Two cases can now be distinguished: zb < z1 and zb > z1, w~ere z1 is the suspension depth. In the first case there is a zone where no evaporation takes place, in the second case evaporation takes place everywhere in the suspension. If zb < z1• equation 2.9 can be integrated to give
(2.10)
The function I(ps) for Fll4 is presented in figure 2.18.
20

3
zb (m)
~Ts (K) 1 30 zb
I:~j AT(z)dz (Km) 0 t
2
1
0
0 10 20 30 40 - Ps (kPa)
Figure 2.18. Boiling depth zb, ~UPfaae subaooling AT8
(= Tl - Tb,s)
and I as a funation of BUPfaae pressu!'e p . s
If zb > z1, equation 2.9 can be integrated to give:
20
10
(2.11)
The function J(z1,ps) for F114 is shown in figure 2.19. It is now possible to calculate Ar by means of equation 2.10 or equation 2.11. The area of a two-phase drop can be determined from the size of a two-phase drop (see section 2.2.2) and from this the refrigerant volume fraction Ev can be calculated. If (part'of) the suspension is heated all the refrigerant will evaporate. The refrigerant volume fraction can then be measured and the refrigerant mass fraction Em calculated. The vapour mass fraction of a two-phase drop averaged over
21

7
1.2 ~ 6 1.0
0.8
5 0.6
- 4 parameter z1 (m) J2 0.4 N 3 "1:1 -N -..... <J 2 0.2 ,....
N"-~O II
"'?
t 1
0 0 10 20 30
-Ps (kPa)
Figw:oe 2 .19. J as a funation of eurfaae pressure with parameter
the liquid d.epth zz.
all drops can now be written as
EV pd - 1 Em pl
~ = • with pl = the suspension mass density • pd - 1 Py
The time derivate of the vapour volume is given by
dVv h0 AT A at= PVLV
and because
40
the growth velocity of the drops dde/dt equals 2h0 AT/pvlv (0 = 111111/s). where O denotes order of magnitude. For the evaporation time 'v of a drop, this result yields:
p L d_ p l T :: V V \) {(_!!)! _ 1}
v 2 h0 t.T Py (O = 100 ms).
22

Integration of this equation gives the evaporation time averaged over all drops:
d p L p ~ T = _J! V V {(~)"' v z1 ~ pv
zl dz If Ps f: 0.6 Pt> = 0 .6 Pe and zb > z1 the function f: = f 1iT can be approximated by linearization of p(T) to give O
where c = 8,0 K/m for Fl14. The residence time averaged over all drops in the crystallizer is
with m1 = suspension mass and er> = 4>At• the refrigerant mass flow, where At = cross-sectional area of the tank. Because 'f">> :rv• the refrigerant will be present mostly as a vapour. In this section it is assumed that AT is a function of the depth z. It could be, however, that as a result of strong agitation the drops have about the same temperature everywhere in the tank. The following argumentation shows that the assumption is correct: The rate at which heat is supplied to the drop is P1 = h0 ~ de2AT (0 = 100 µW), The minimum rate at which heat should be supplied to satisfy the requirement is P2 = vz Pp cp ~ d/ ~T, in which vz is the vertical component of the drop velocity and Pp and cp: the density and specific heat of the total two-phase drop respectively (Pp cp de3 does not vary much as a function of~). It appears that P2 is 0 = 1 µW, so the drops are heated fast enough to reach the AT which corresponds to the given depth.
23
2.4. The Particle Size Distributions of Drops and of Bubbles
In a continuous stirring-tank reactor (CSTR) drops and bubbles have a particle size distribution (PSD) which is approximately normal. Under certain conditions the tail is longer than the tail of a normal distribution [ Ze 72].
2. 5. Con cl us ions
(i) An evaporating refrigerant drop consists of a liquid and a vapour part, which stick together ("two-phase drop") by interfacial tension.
(ii) If in a stirring-tank the vapour bubble grows too large, it is torn from the liquid drop.
(iii) The heat trans fer coefficient of an evaporating two-phase drop in a still liquid is of the order of magnitude of 1 kW/m2K.
(iv} In a stirring-tank, the growth velocity of a two-phase drop is of the order of magnitude of 1 mm/s, the evaporation time is of the order of magnitude of 100 ms.
(v) The subcooling of a two-phase drop is a function of the depth.
24
The temperature of the drop corresponds to the local boiling pressure.
•

3. Crystal Nucleation and Growth
3.1. Introduction
In this chapter crystal nucleation and growth are described for the follCMing two conditions: {i) nucleation and growth of a single crystal under a well controlled
flow regime; (ii) nucleation and grCMth of crystals in a stirring-tank.· Case (i) is treated in sections 3.2 to 3.4; case {ii) is treated in section 3.5 to 3.8. Nucleation is the creation of a new crystal. Two kinds of nucleation can be distinguished: primary nucleation and secondary nucleation. Primary nucleation is nucleation that occurs in the absence of parent crystals of the crystallizing material. Secondary nucleation is nucleation due to the presence of parent crystals of the crystallizing material. Primary nucleation can be subdivided into: homogeneous and heterogeneous nucleation. Homogeneous nucleation is nucleation that occurs in the absence of any solid material. Heterogeneous nucleation is nucleation due to the presence of solid material other than the crystallizing material. By convention, the growth velocity of single crystals is denoted by v, the growth velocity of bulk crystals is denoted by G. In section 3.2 is treated the theory of single crystal nucleation and grCMth. More details about this subject can be found in [De 66, Tr 75, Wo 73]. Section 3.3 gives the literature experimental data on ice single growth. The literature on nucleation and growth of NaCl.2H20 crystals is treated {very briefly) in section 3.4. Section 3.5 describes models and correlations of heat and mass transfer in a stirring-tank, and section 3.6 deals with models and correlations of secondary nucleation. Experimental data on ice nucleation and grCMth in a stirring-tank as presented in the literature are given in section 3.7. Section 3.8 deals with the theory of particle size distributions. The main conclusions of this chapter are given in section 3.9.
25

3.2. Crystal Single Growth
3.2.1. Interfacial Energy
The particle, liquid and interface free energies are denoted by FP, F1 and F1 respectively, and the particle, liquid and interface free enthalpies by GP, G1 and Gi respectively. The quantity F; is called the interfacial free energy. The total free energy F of the system equals FP + F1 + F1, the total free enthalpy G of the system equals Gp+ G1 +
G;. The interfacial energy y is defined by y: = -b;cCF;-Gi)lT,V,µ· [J/m2l [Tr 75, p.561. It can be shown that the reversible work requir~d to increase the area A of the particle equals oW = ydA. Note that the interface is an open thermodynamical system. Interfacial tension is defined by cr: = f- [N/m]: the force required to increase the area divided by the length ~ver which the force acts (see figure 3.1).
A
L
Figu:J?e 3.1. Interfaae.
For fluids the interfacial tension satisfies the relation [De 66, p.61):
where nj,i [moll: amount of substance of component j adsorbed at the interface (surface excess). If y is isotropic, the relation between cr and y is given by [Tr 75, p. 70]:
26

For fluids the interfacial energy is not dependent on the strain (oy/alj = 0) so a= y, In general, for crystals a~ y because a crystal can sustain stresses. In the literature the quantities cr, y, Fi and F;/A are often confused. The interfacial energy of crystals can be anisotropic. It can be represented in a 3-dimensional polar diagram, which is called a Wulff diagram. An example of a Wulff diagram is shown in figure 3.2.
Pi(JUI'e 3. 2. Two-dimensional cross-secticm of Wulff diagr>am (bent lines)
and equilibl'ium shape of crystal (stroight lines).
The shape of a crystal in equilibrium with its vapour or liquid (or bubble or droplet in a crystal, or a bubble in a liquid or a droplet in a vapour} is given by the Wulff theorem: Draw planes perpendicular to the radius vectors that intersect the points where 3y/38 and 3y/3$ are discontinuous. The crystal has the shape composed by these planes. The equilibrium shape satisfies the conditions [De 66, p.299]: d ~ crij = 0 and {dF}T,V = O. If Fis minimum, the equilibrium is stable.JFor a bubble in a liquid or a droplet in a vapour y is isotropic, so the equilibrium shape is a sphere. The determination of y is not simple. The results of various methods can differ by a factor 2. For an overview of methods see e.g. [Wo 73, ch .2]. The interfacial energy may depend on the growth velocity of the crystal or on the bulk concentration of a foreign component (see section 3.3.3.b}.
27

3.2.2. Homogeneous Nucleation
Consider a spherical nucleus. The driving force for crystallization equals [Wo 73, p.23]: 8G = 4nr28G; + jnr38Gp• where 8Gi = y and 8GP = - ppLnfiT/Tm • with 8T ~ 0 and Tm: equilibrium temperature for r = ro (see figure 3.3).
t
-- r
Figw:>e 3. 3. Free enthalpy difference foi' cPystaZ.
From ~r 8G = 0 follows the critical radius
2T * - Y m r - µ-e;r , p m
(3 .1)
an unstable equilibrium. Crystals with radius r > r* will grow until all liquid has solidified {if the process is isothermal) or until subcooling has vanished (8T = 0) (if the process is adiabatic) with a probability > 0.5; crystals with r < r* will dissolve (or melt) with a probability> 0.5. Therefore, the melting point of a spherical crystal with radius r equals
2y Tm T = T -m pplmr (3.2)
At a concave part of a surface the melting point is locally higher than
Tm. This result also applies for liquid-vapour and solid-vapour equilibriums, if Lm is replaced by Lv or Ls respectively. As a result of statistical fluctuations crystals with r > r* can dissolve (or melt) too. So in principle a suspension is only stable if
28

only one crystal is present. This means that in a suspension the mean crystal size steadily increases owing to the growth of the larger crystals at the cost of the smaller ones. This process is called ripening. If a liquid is cooled below a certain temperature, the (homogeneous) nucleation suddenly increases very much. At and below this temperature equation 3.2 does not apply [Wo 73, p.26].
3.2.3.Crystal Growth Rate
Figure 3.4 shows the temperatures appearing at a growing crystal in a solution.
liquid crystal
Tm
AW00
melting point depression
T e (r=oo) 2yT (r=oo) e curvature
h.T pp[mr effect Te
growth- A(W· - W ) 1 00 mass transfer
driving force
oT i nbui ldi ng
heat transfer
Figure 3. 4. Temperatures at arystal interface.
The interface temperature is given by
2yT00
Ti = T - -::"""'!"-: - AW • - oT , m ppi.mr i
29

where wi: the concentration of the solute at the interface, 1 a known constant and oT the driving force for inbuilding. The bulk subcooling is given by AT = Te(r=<>} - T00 •
Several heat and mass transport models for crystal growth can be presented. These models give v(vf,AT,w~,r}: the growth velocity of the ctystal tip as a function of flow velocity vf• of subcooling AT and of concentration of the solute w~ in the liquid, and of the radius of the (cylindrical) tip (see, for example, [Si 75]}. Experimentaliy, however, it has been observed that v is detennined unam-biguously by vf' AT and w00 • Thus it follows that av/ar = 0. Obviously, an additional condition is satisfied. It is assumed that this additional condition is the "maximum velocity criterion": Most models predict a maximum in v(r}. It is now assumed that the radius r of the growing tip will adjust itself in such a way that v is maximum. Thus the additional condition is represented by av;ar = 0, which_ gives v(vf,AT,w00). This criterion can be justified by a stability argument: if an area does not grow with the maximum velocity, it is overgrown by areas where v is maximum.
3.2.4. Growth Classification
At least three kinds of crystal growth can be distinguished: two-dimensional nucleation growth, screw dislocation growth and continuous (or nonnal) growth. In the two-dimensional nucleation growth process a crystal grows monolayer after monolayer on a smooth surface; in the screw dislocation growth process the crystal grows on screw dislocations; in the continuous (or normal) growth process the roughness of the surface is such that all places of the surface are equally suitable for growth. The three processes have the following growth velocities v as functions of the inbuilding subcooling OT [Wo 73, ch.SJ: two-dimensional nucleation growth: v ~exp(- 1/oT); screw dislocation growth : v ~ (oT} 2; continuous (or normal} growth : v ~ oT. The bulk subcooling can be determined experimentally. By means of heat conduction and diffusion models the quantities Ti - T
00 and wi can be
calculated as functions of vf. If y and r are known or if the maximum velocity criterion is applied, the inbuilding subcooling oT can be calculated.
30

If in an experiment several bulk subcoolings ~Tare applied, the growth velocity as a function of inbuilding subcooling v(oT) can be calculated subsequently, and from this the growth mechanism can be derived. If, however, (Ti - T00 ) + A(wi - w
00) >> oT, the growth mechanism cannot be
determined in this way.
3.2.5. Heterogeneous Nucleation
Heterogeneous nucleation is the nucleation upon a foreign particle. Because the critical radius r* can be attained (locally) with fewer molecules than needed for a spherical particle, the subcooling for heterogeneous nucleation is smaller than that for homogeneous nucleation. For a plane substrate the following relations can be derived (see figure 3.5):
crystal (2)
~liquid (1)
substrate (foreign particle) (3)
FigUPe 3.5. Nucleation on foreign particle.
If cr12 > icr13 - cr23 1. a lens-shaped crystal forms; if cr13 > cr12 + cr23 , the crystal covers the substrate entirely; if cr23 > cr12 + cr13 , no crystal arises on the substrate.
3.3. Ice Single Growth
3.3.1. Introduction
Ice is known to have at least 11 crystal lattices. The crystal structure under normal conditions (P < 100 MPa, 100 K < T < 273 K) is called ice Ih and has a hexagonal lattice (P63/11111c). The unit cell is shown in figure 3.6.
31

730 pm I
I I
C I I
r--- -- --l
450 pm
Figu~e 3.6. Unit cell of ice Ih.
Several measurements on ice growth have been carried out: in still and in flowing water {figure 3.7), in pure water and in NaCl solutions up tow~ = 0.06, in the a-axis direction and in the c-axis direction and with different subcoolings.
liquid
tiT
Figure 3. 7. G!'ObJing ceystal in flObling liquid.
Growth velocities of crystals have been detennined in capillaries and in free conditions. The two methods generally give different results. Because in a stirring-crystallizer only free-growing crystals are present, only the literature on free-growing crystals will be treated in this chapter.
32

The a-axis growth. rate is two orders of magnitude faster than the c-axis growth rate. Therefore, ice crystals grow into flat plates. A literature directory on ice growth is to be found in [Ke 79].
3.3.2. C-axis Growth
The c-axis growth of free-growing ice crystals is described by Simpson et al. 1 [Si 73al and Simpson et al. 2 [Si 76]. From comparison with measurements carried out in capillaries it appears that a free-growing crystal grows an order of magnitude more slowly than a crystal in a capillary. Simpson et al. 1 [Si 73a] found that Ve= 1.734 10-6 exp(- 0.234/8T) in pure water. The flow velocity vf has no influence on vc. Simpson et al. 2 [Si 76] correlated their data by vc = 2.5 10-6 exp(-0.320/8T) for pure water. The ·flow velocity has a slight effect on vc: for 8T ~ 200 mK the growth velocity increases with increasing flow velocity (avc/avf > O}. For NaCl solutions the growth rate decreases with increasing salt concentration (avc/aw00 < 0) (see figure 3.8}. The method described in section 3.2.4 can be applied to calculate the inbuilding subcooling 8T. For pure water this results in
a
1
a: Yf=l25 11111/S
Wcc=O
b: vf=50 mm/s w.,=O
c: w.,=0.0l
d: w.,=0.02
e: w.,=0.03
f: w.,=0.04
0.1..._~~~~--''--->-~~~--' 10 20
Figure o. 8. C-a:cis growth rate of iae arystaZ.
33

vc = 2.5 10-6 exp(- 0.159/oT). An exponential correlationship has also been found for NaCl solutions. The c-axis growth is thus a two-dimensional nucleation growth (see section 3.2.4).
3.3.3. A-axis Growth
a. A-axis growth in Pure Water
The experimental results of various authors for the a-axis growth rate in quiescent pure water are shown in figure 3.9.
104 ~----,------,
va (µm)
t s
103
10
1
0.1 1 10 -AT (K)
1: Hu 69b:va=3.0 10·4.n2•22
2: Ry 69: va=9.0 10·5ar2•5
3: Si 73a:va=2.0 10·4ar3
4: Gi 76: v =1.0 10-4llT3
5: Ka 77: /=1.18 l0-4llT2•17 a
FigUPe 3.9. A-axis gT'ObJth Pate of
ice in quiescent
pupe 1'1ateP.
The growth rate in flowing pure water has been studied by several authors: Fernandez & Barduhn [Fe 671 found va = 4.66 10-3 v/12 t.r312• These authors developed a boundary layer model in which they assumed that the growth rate is limited by heat transport, that the ice conducts no heat, and that va is negligible compared to vf. In addition, they applied the maximum velocity criterion (see section 3.2.3}. This model results in
34

va = A1 y-l/2 vfi/2 6T312, where A1 is a known constant. Because the model is in agreement with the experimental results, they concluded that the inbuilding kinetic resistance is not a rate-controlling factor. Combining the theoretical and experimental results, the interfacial energy y can be determined: y = 32 !:. 2 mJ/m2• Huige & Thijssen [Hu 69b] correlated their data for a fixed vf by va = c1 6Tc2. with c2 ~ 1.5 and ac1/avf > 0. They found, however, that the exponent of vf is smaller than 0.5 if vf > 50 mm/s and approaches zero if vf > 100 nm/s. These authors used the same model as Fernandez & Barduhn, apart from the assumption that the heat transport is the growth-rate limiting factor. They used a literature value of y = 20 mJ/m2
determined by a different method (see [Vl 74] for an overview of methods}, and so they were able to determine the contribution to 6T of the heat transport and of the inbuilding kinetic resistance separately. They found that the curvature effect accounts for 30% of the total sub-cool ing ((Tm - Te}/6T = 0.3), that the inbuilding resistance accounts for 10% to 30% of the total subcooling ((Te - Ti)/6T = 0.1 at Vf'"' 20mm/s and (Te - T;}/6T = 0.3 at vf ~ 200 nm/s), and that the heat transport accounts for 60% to 40% of the total subcooling ({Ti - T
00)/6T = 0.6 at
vf ~ 20 11111/s and (Ti - T00 )/6T = 0.4 at vf ~ 200 nm/s). Vlahakis & Barduhn [Vl 74] found va = 4.56 io-3 vf112 6T312. In the same way as Fernandez & Barduhn they determined y from this correlation. They found y = 33 mJ/m2• Simpson et al. 1 [Si 73a] correlated their data by va = 3.8 10-3 vf112 6T312• Simpson et al. 2 [Si 75] developed two new models: the creeping flow model and the ice conduction model. In the creeping flow model they assume that the flow around the ice crystal is creeping flow and that the heat conduction along streamlines is much smaller than the heat conduction across streamlines. In the ice conduction model it is assumed that the heat generated at the tip is conducted through the ice and is removed by forced convection perpendicular to the growth velocity. In addition, it is assumed that the temperature in a plane perpendicular to the growth direction is constant. In both models the crystal tip is a parabolic cylinder and the maximum velocity criterion is applied.
35

Like the boundary layer model, both models give a growth velocity relation of the form
(3.3)
with A= A2, A3 a known constant for the creeping flow model and the ice conduction model respectively. If the value ofy = 22 mJJm2 (realistic according to [Si 751) is used, both models give a better fit of the experimental data than the boundary layer model. Kallungal & Barduhn [Ka 77] found for vf > 10 lllll/s that va = 3.65 10-3 vf112 8T312. In the same way as Fernandez & Barduhn they derived from this correlation y = 52 mJ/m2. Furthermore, they measared va in the range 1 µm/s < vf < 10 mm/s to determine for which vf equation 3.3 is no longer valid: this relation predicts va = 0 for vf = 0, which is untrue (see figure 3.9). The range 10 µm/s < vf < 10 mm/s appears to be the transition region between ava/avf = 0 and va ~ vf112•
The transition takes place at higher vf for larger 8T. The results of the various authors are summarized in figures 3.10 and 3.11.
l0-2 l: Fe 67 2: Hu 69b
a: vf=8 nm/s
~ ( _!!! l b: Vf=210 Dlll/S V 2 S 3: Si 73a f 4: Vl 74 t 10- 5: Ka 77
a: vf=lO µm/s
b: Vf=l Dlll/S /
c: vf>60 m/s2a··/··
Zb
1 lQ,_8T (K)
36
Figure 3.10. A-a:eis g~th of ice arystai in pure water.

~ 10-2
.__....
t"r\; ,.-, 10-4
10-5
5b
5a 1: Fe 67 2: Hu 69b 3: Si 73a 4: Vl 74 5: Ka 77
a: ~T=0.1 K
1
10-6 b: ~T=l.O K
...__.___....___...___.~,,___.__~.___.____._~_.__.___,_~__.___,_~.___,____,
10-5 10-4 10-3 10-2 0.1 -vf (m/s)
1
Figure 3.11. A-a:eis growth rate of ice cr>ystaZ in pure water.
The models mentioned in this section will be applied in section 4.5.4.
b. A-axis Growth in NaCl Solutions
The models discussed in section a can be extended to ice single growth in solutions. Simpson et al. [Si 75] give a review of this subject. All models result in va = A(w
00) y(w
00)-l/2 vf112 ~T31 2 , with dA/dw
00 < 0.
Jones & Chadwick [Jo 71) measured y(w00
) for a stationary (:va = 0) ice crystal in NaCl solutions. They found a linear increase of y as a function of w
00 of dy/dw
00 = 290 mJ/m2 (for w
00 ~. 0.045).
Hardy & Coriell [Ha 73) found for pure water that y is not dependent on va. In NaCl solutions a melting ice crystal has a larger y than a growing crystal. For ice growth in a eutectic NaCl solution, the boundary layer model predicts A1 = 48 µm/s, the creeping flow model predicts A2 = 40 µm/s, and the ice conduction model predicts A3 = 38 µm/s. The diffusion coefficient which was needed for these calculations was estimated from D"' T/µ(T). The quantity 1T
1 in A1 was calculated using [Fe 68].
37

Measurements on ice growth in NaCl solutions were carried out by, among others, Simpson et al. [Si 73a] and Vlahakis & Barduhn [Vl 74]. Their main results are presented in figures 3.12 to 3.17.
103 103
~ vf=39 mm/s a: woo=2,5 10·3
b: W00=0.01
., c: w00
=0 > .,
d: woo=0.03 d t >
t e: W00=0.05
e
102
102
10 20 0 0.02 0.04 0.06
-woo (1) 1 0.1 - llT (K) Figu:r>e 3.12 FigW'e 3.13
t
lff=0.6 K
0 0.02 0.04 -woo (1)
- llT=0.6 K ~ woo=0.01 -?-., > w =0 t w:=o.02
woo=0.03 -----"'"" =0 .04 ----
0.06 woo=0.05 ----102
20 50 100 200 -vf (mm/s)
Figupe 3.14 Figupe 3.15
38

103 103
w.,,=9 10·3 -- a: vf=40 nn/s §.Iv. ~ b: vf=lO nn/s
c: vf=2 03 >
nm/s 03 >
t t 102 102
a
b 10 10
Lff=O .1 K W00=9 10-3 c
0.1 1 1 10 50 - tiT ( K) - vf (mm/s)
Figure J. 16 Figu:r>e 3.17
From figures 3.16 and 3.17 it appears that for a fixed w00 , the growth rate va increases if tiT or vf increases (ava/MT > O, av/avf > 0). From figures 3.12 to 3.15 it follows that va is not a monotonous function of w
00, because at fixed tiT and fixed vf it exhibits a maximum at
w,,, ~ 5.10-3. This maximum is more pronounced at high tiT than at low tiT and the position of the maximum is independent of tiT (see figure 3.12). The maximum is equally pronounced at high vf as at low vf• and the maximum is located at higher w00 at low vf than at high vf (see figure 3 .14). The maximum in va(w00 ) has also been found for glucose solutions [Hu 69b]. No explanation has been given for it. None of the models predict a maximum in va(w.,.,). The results of [Si 73al and [Vl 74] are difficult to compare because the authors did not measure at the same tiT, vf and w
00• Generally, how
ever, the measures va's of Vlahakis & Barduhn are higher than those predicted by the three models and (apart from the maxima) the measured va's of Simpson et al. are lower than those predicted by the models. Terwilliger & Oizio [Te 701 measured the NaCl concentration in the
39

vicinity of a growing ice crystal. The concentration profile appeared to be an exponential function of the distance to the crystal, and from this result the interface concentration can be determined by extrapolation. Janzow & Chao [Ja 73] studied the purity of the formed ice at w.,,=0.035. They found that the NaCl concentration in the ice does not depend much on 6T or vf, and equals approximately 0.2 w00 •
The kinetic constant u1:= va/6T is not well established. Jones [Jo 74] carried out measurements from which u1 can be calculated:
-5 he found u1 s 4.1 10 m/(sK) for w00
= 0.075. From the data of Huige & Thijssen [Hu 69b] a value of u1 = 3 10-3 m/(sK) can be derived for pure water. Kallungal & Barduhn [Ka 77] found u1 > 0.17m/(sK)forpure water. It is not clear why these results differ to such an extent. The models mentioned in this section and the purity results of Janzow & Chao will be used in chapter 4.
3.4. NaCl.2H2o Single Growth
The (monoclinic) lattice of NaCl.2H2o is shown in figure 3.18.
I
I I
I I I I ,.._ ___ _
,..
1010 pm
Figure 3.18. Unit cell of NaCl.2H2o.
To our knowledqe no studies on NaCl.2H20 growth or nucleation have been published as yet.
40

3.5. Heat and Mass Transfer
3.5.1. Introduction
This section describes the heat and mass transfer in terms of heat transfer. All statements are also valid for mass transfer, so everywhere in the text Nu can be replaced by Sh (and Pr by Sc), section 3.5.2.d excepted. For a sphere in an infinitely· large quiescent medium Nu equals 2. In a still medium filled with identical spheres with equal surface temperature Nu= 0 [Co 651. The heat transfer to a single sphere in a flowing medium is described by Nu > 2. Thus in a stirring-tank with several particles Nu may equal any positive number. (In practice, Nu has a maximum of the order of magnitude of 100.)
3.5.2. Models
Three models of heat transfer to particles in a stirring-tank are presented: the Isotropic Turbulence Model [Br 69b], the Slip Velocity Model [Ha 62] and the Penetration Model [Ha 62]. In addition, Shrinking and Transpiration can be taken into account [Br 69a].
a. Isotropic Turbulence Model
In the isotropic turbulence model of Kolmogoroff it is assumed that the kinetic energy of large eddies is transferred to smaller eddies in which it is dissipated. The size of the larger eddies is approximately equal to the size of the tank. The shape.of the smaller eddies is independent of the type of impeller and of the impeller geometry, so the Nusselt number is only a function of the agitation power per suspension mass, the particle diameter and the particle density, the liquid viscosity, the liquid Prandtl number and the liquid density: Nu (E, dp, v1, Pr1, Pp• p1), where Eis calculated by [Ba 63]:
(3.4)
The kinetic energy is dissipated mostly in eddies smaller than the dissipation scale: n := (}!E)114•
41

b. Slip Velocity Model
In this approach, first a correlation of the form Nu (Re,Pr) for fixed particles in a flowing liquid is established. Then the slip velocity (vs) of the particles in a stirring-tank is determined theoretically or experimentally, which is then used to calculate Re and from this Nu [Le 72a]. From data from several authors Hughmark [Hu 69a] found:
, Re< 2, tip> 14 kg/m3 (3.5) l
vs = 5.1 10-4 (dat::)l/3 v-1/3
v = 1 2 10-4 d 1/3 (d )4/9 \l-7/9 (l:,p)2/3 S • p at:: p • Re> 2, tip > 240 kg/m3
c. Penetration Model
In the penetration model it is assumed that as a;result of turbulence the particle is surrounded by a fluid having a varying temperature. So the heat transfer averaged over the particle area is a function of time, particularly if dp or t:.p is small, in which case steady state models. are not applicable. The penetration model does not give quantitative predictions.
d. Transpiring and Shrinking
If mass transfer is involved, two effects may occur: transpiring and shrinking. Transpiring is the radial liquid motion due to the density difference between solid and liquid. Shrinking is the size reduction of the particle as a result of dissolving or melting. These effects can be taken into account in transfer models. It appears that Nu is not affected by transpiring or shrinking and that Sh is not affected by transpiring. However, a shrinking sphere has a lower Sh and a growing sphere has a higher Sh than a sphere with constant diameter.
3.5.3. Correlations
Nu may be equal to any positive number (see section 3.5.1) .. Experiments show that correlations of the form Nu= 2 + c1 Rec2 Prc3 exhibit less scatter
C5 C6 than correlations of the form Nu = c4 Re Pr • Obviously the parti-cle density is so low that the particles interact little •
. All foll<Ming correlations have been determined for baffled stirring-
42

tanks with spherical particles. Harriot [Ha 62] found no effect of fJ.p on Nu if fJ.p < 400 kg m- 3, and Nu~ fJ.po. 4 if fJ.p > 400 kg m- 3• The volume fraction of particles has no influence on Nu if £V < 0.06. Sykes & Gomezplata [Sy 67] found
Nu = 2 + 0.109 Rea0·38 Pre o. 5 (3.6)
2 where Rea= {Nada p1)/J.J1• Brian et al. [Br 69b] found that Ar {Archimedes nuni>er), PP/P1 and the impeller type have no influence on Nu. Huige & Thijssen [Hu 72] correlated the data of several authors by:
I Nu = 2 + 1.3 Ko0· 17 Pr 0·25
Nu= 2 + 0.4 Ko0.243 p~C0.25 {Ko < 106 )
(Ko > 106)
(3. 7)
where the Kolmogoroff number Ko:= £dp4;v13• This group was named Kol
mogoroff number by [Sm 791. It is related to Rea by Ko= Po dp 4 Rea 3/(daVl ). Levins & Glastonbury's measurements [Le 72b] yielded:
} Nu= 2 + 0.47 Ko0·21 {~)0 · 17 Prc0•36 , fJ.p small
r Nu = 2 + 0.44 Rep1/ 2 Prc0.38 • fJ.p large (3.8)
where Rep is determined by means of the slip velocity model. Correlation (3.8.a) is applicable if fJ.p < 700 kg/m3 (dp = 1 mm), fJ.p < 1300 kg/m3
(dp = 300 µm), fJ.p < 3500 kg/m3 {dp = 100 µm), tip< 7000 kg/m3 (dp=60µm). In other cases correlation (3.8.b) should be used. Sano et al. [Sa 74] correlated their data by
Nu = 2 + 0.4 Ko1/ 4 Pr l/3 c
Boon-Long et al. [Bo 78] found
( 3.9)
dp 0.283 0.172 (£mml ) -0.011 (dt)0.019 Pr 0.461 Nu = 0.046 CC Rea Ga ~ 0:::- c
a , ppdp . p (3.10)
43

with Ga: Gallilei nuni>er. Smith & Sarofim [Sm 79] correlated their data by
d Nu = 2 + 1.18 ( a)O.lS K 0·2 Pr l/3 dt 0 c
The results of selected correlations are shown in figure 3.19.
Nu-2 p;m t 10
1
0.1
10-2 0.1 1 10
Figure J.19. Cor:Telations of section J.5.J
1: eq. 3.7 2: eq. 3.8.a 3: eq. 3.9 4: eq. 3.11
Pr=270
102 -Kol
103
For convenience Kot instead of Ko was taken for the
horizontal a:r:is.
3.6. Secondary Nucleation
3.6.1. Introduction
(3.11)
Secondary nucleation is the nucleation due to the presence of crystals of the crystallizing material. In stirring-tanks this is the most important nucleation mechanism. Several reviews on this subject have been published [Bo 76, Es 76, Ga 80], so a brief treatment of the subject will suffice here.
44

3.6.2. Sources of.Nuclei
The following two definitions will be used: A potential nucleus is an agglomerate of molecules. A nucleus is an agglomerate of molecules that will reach a (microscopical) detectable size by growth. Nuclei may arise, in quiescent solutions as well as in stirred solutions by the breaking off (detachment) of part of an existing crystal (parent crystal), or from the boundary layer of a crystal. These origins can be distinguished as follows [De 72): A substance with two enantiomorphic crystal forms (left and right handed) is used. Crystals of one of the two forms are added to a crystallizer and the percentage of product crystals with the same structure as the seed crystal is determined. The seed crystals generate nuclei of the same handedness, the bulk liquid generates nuclei of the two handednesses in equal amounts. At high 6T the nuclei originate from the solution (heterogeneous nucleation) at medium 6T they originate from the seed crystals, and at low ~T most, but not all, nuclei originate from the seed crystal. In the latter case the remaining nuclei are assumed to originate from the boundary layer of the seed crystal. The percentage of nuclei originating from the seed crystals increases with increasing stirring speed.
3.6.3. Detachment Mechanisms
It is observed that the nucleation rate (=Br) increases with increasin~
6T. It is now assumed that the probability of the creation of a second·· ary potential nucleus is independent of 6T, but that as a result of the larger6T, the critical radius is smaller (see section 3.2.2) so that more potential nuclei grow to visible crystals. This model is called the "survival theory" [Ga 721. The following four detachment mechanisms can be distinguished: spontaneous removal, fluid shear, crystal-crystallizer collisions and crystal-crystal collisions.
a. Spontaneous Detachment
If the growth of a crystal is irregular, a dendrite may develop that is thinner at the base than at the tip. Due to the smaller radius, the
45

melting point is lower (see section 3.2.2), so that the base can dissolve (or melt) and the tip detach from the crystal.
b. Fluid Shear
A liquid flow along a crystal can remove part of it [Ja 80). The number of produced nuclei increases with increasing 6T and with increasing liquid velocity.
c. Crystal-Crystallizer Collisions
Crystal-crystallizer collisions can be simulated by touching a crystal with a rod. The nunt>er of produced crystals increases with increasing .aT and with increasing impact energy, and is dependent on the crystal orientation. The production of nuclei due to collision with an object is called "contact nucleation" or "collision breeding".
d. Crystal-Crystal Collisions
By attaching a crystal to the rod, crystal-crystal collisions can be simulated. Nuclei can be produced also by this mechanism; the same statements as in c. are valid.
3.6.4. Relative Importance of Detachment Mechanisms
Of the four mechanisms mentioned, spontaneous detachment has the least important influence on nucleation in a stirring-crystallizer. By coating the crystallizer with soft material and adding dummy particles, the relative importance of the remaining three mechanisms can be determined [Ev 74a] (see also section 3.7.1.a). In several cases it was found that about half the nucleation can be ascribed to crystalcrystallizer collisions, about a quarter to crystal-crystal collisions and about a quarter to fluid shear • . 3.6.5. Rate Controlling Stages
Two (extreme) cases can be distinguished [Ev 74a]: The production of nuclei is controlled by the rate by which parent crystals can produce potential nuclei (surface regeneration limited) or by the rate by which potential nuclei can be removed from the parent crystal (removal limited). In the former case the number of nuclei per collision decreases if
46

the collision frequency increases, in the latter case it does not. In most instances the nucleation is removal limited; only if the parent crystals are small or if the stirring-rate is high, the nucleation can be surface regeneration limited.
3.6;6. Correlations
In stirring-crystallizers, the nucleation frequency density (Br• see section 3.8.l} can be detennined as a function of subcooling 8r, stirring speed Na and crystal mass fraction b. Instead of the crystal mass fraction the total crystal area or other distribution moments may be used. All moments yield an equally good correlation with Br in a continuous mixed suspension mixed product removal (CMSMPR} crystallizer [De 74]. The data of several authors can be represented by
cl c2 C3 Br = f 8T b Na (3.12}
with c1 ~ 2.5, c2 z 1 and c3 ~ 3. The factor f depends on the impeller type [Ga 79].
3.6.7. Theoretical Models
If nuclei are produced by crystal collisions only, Br can be represented by [Bo 76]:
where P: rate of energy supply to the crystal caused by collision, f1: number of generated potential nuclei per impact energy, f2: fraction of potential nuclei surviving to become nucleus.
The factor f1 is a function of 8T. because the surface morphology depends on 8 T and f 1 depends on the surface morph.o logy. According to the survival model f2 is also a function of 8r (see section 3.6.3). The factor P can be modelled and in this way the relative importance of the various removal mechanisms can be determined. Evans et al. [Ev 74b] designed an equation that can be approximated by
(3.13)
47

where the first term represents crystal-crystallizer collisions and the second term represents crystal-crystal collisions. The effect of the temperature on the nucleation frequency at constant llT is given by [We 80): Br I\, exp(-llEn/nRT), where t'.lEn can be positive as well as negative.
3.7. Ice Growth from a NaCl Solution in a Stirring-tank
3.7.1. Ice Growth in a Batch Crystallizer
a. Ice Growth in a Batch Crystallizer with Direct Cooling
Kane et al. [Ka 74) describe a method of determining the nucleation frequency per crystal (denoted by 13) in an ice batch crystallizer. The nucleation frequency per crystal equals the total nucleation frequency density divided by the crystal number density: 13:=.Br/Nr (see section 3.8.1). Evans et al. [Ev 74a] carried out these measurements (see also section 3.6.4). By coating the impeller, baffles or wall of the crystallizer with soft material and by adding dummy particles, the relative importance of the collisions with impeller, baffles, wall or other particles was determined. Impeller coating turned out to have the greatest influence: the use of this coating reduced 13 to 77% of its value with the uncoated impeller. Furthermore, it appeared that 13 I\, llT1·5 .:!:. 0·2 and that 13 increases with increasing agitation power or increasing crystal concentration (~ > 0, * > 0). Kane et al. [Ka 75) continued the measurements. They found that
13 0.2+0.1
I\, e: - •
Evans et al. [Ev 74b] developed a model for describing crystal-crystallizer and crystal-crystal collisions (see also section 3.6.7). Wey & Estrin [We 73) proposed a model from which follows the crystal size distribution as a function of various variables. Harriot [Ha 67) also describes growth velocity experiments.
b. Ice Growth in a Batch Crystallizer with Indirect Cooling
Using an indirectly cooled batch crystallizer Wey & Estrin [We 74) found:
48

where ac: the supersaturation of NaCl, and Ar: the ice crystal area density [m-1] (total crystal area divided by bulk suspension volume, see section 3.8.1). Estrin et al. [Es 75) counted the number of nuclei produced in a certain period of time {denoted by N) when a jet of w = 0.03 NaCl solution spouted against a mass of ice. This number is related to the jet subcooling by N ~ ar1· 7• No influence of the jet velocity was found. Garabedian & Strickland-Constable [Ga 74] studied the nucleation of ice in pure water. They found that fluid shear produces no nuclei but col-1 ision of an ice crystal with the impeller does.
3.7.2. Ice Growth in a Continuous Crystallizer with Direct~contact Cooling
Margolis et al. [Ma 71) measured particle size distributions of ice in a NaCl solution. The influence of residence time, of crystal concentration, of pressure and of stirring speed was studied. All observed crystal size distributions exhibit a maximum. These authors analysed their results in order to obtain the crystal growth velocity G{L). However, their results can also be analysed in a different way: The measured points of the crystal size distribution at the right-hand side of the maximum can be fitted to a straight line by a least-squares method, and the accuracy of this fitting can be calculated. The fitting yields the result that the growth velocities of the various runs do not differ significantly, apart from run # 45: the 95% confidence intervals of all runs, except of run# 45, contain G = 220 nm/s. Run# 45 has T = 390 s and G = 500 + 100 nm/s. All other runs have< = 780 s. So only the influence of T and G can be established. If the average diameter r10 is calculated by I 10 GT {equation 3.19), it appears that no significant influence of any variable on r10 can .be found. In a similar way, the nucleation frequency density {Br) can be shown to be dependent only on crystal concentration. Stahl & Weinspach [St 75] found
(3.14)
Orcutt [Or 69/70) presents a mathematical description of the directcontact freeze desalination process.
49

Nagashima & Maeda [Na 781 measured crystal size distributions and studied the influence of stirring. The PSD's of the ice crystals exhibit a maximum.
3.8. Particle Size Distributions
3.8.1. Representation of Distributions
This section describes the properties of particle size distributions (PSD). i.e. the number of particles as a function of their size. The principles of particle size distributions are described by Randolph & Larson [Ra 71]. A brief sununary of this subject is given below. In a crystallizer each particle has a certain size Lp,j· The function N(L) is defined as:
N(Lp :: L) N(L) := -.,.,._
V1
i.e. the number of particles with sizes smaller than L, divided by the suspension volume. If N(L) is depicted in a graph. a cumulative histogram is obtained, with equal vertical steps and with horizontal steps 8Lj. Let v1 + 00 then the maximum 8Lj + 0 and the distribution becomes continuous. The total particle concentration is given by
NT f.lr = V: = N(oo),
l
where NT is the total number of particles in volume v1• From the definition of N(L) follows that N(O) = 0. The differential distribution is given by
n(L) = d~[L), so N(L) = ~ n(u)du. 0
The volume distribution can also be defined. The volume of a particle is given by Vp(LP) = kyLp3• where ky is the volume shape factor (e.g. for a sphere ky = n/6). The cumulative volume distribution is defined by
50

L L V(L):= J VP(u) n(u) du = kv J u3n(u)du
0 0
The particle volume fraction equals VT = V(oo) (=e:y). Obviously V(O) = 0. The differential volume distribution is defined by
L v(L) := E~ , so V(L) = J v(u)du and
0
3 v(L) = kyL n(L).
Length and area distribution can be defined in a similar way. Table 3.1 shows a su11111ary of the results. The following average sizes can be define:
If all particles have the same size, their size is r 10 , their area kAI20
2, and their volume kyr303•
Particles can enter a size interval by breakage of a particle, by agglomeration of two particles, or by growth. For example, if a particle of size Lpl breaks into a particle of size LP2 and one of size LP3, then in the size distribution one particle of size Lpl is removed and two particles, of sizes LP2 and Lpj are added. The "cumulative excess birth function" is defined as
B(L) • lim f [Hz/m3l .= ~t-+O VlM vr--
where f is the number of particles created by breakage in time interval at and in volume v1 with size LP :; L minus the number of particles destroyed by breakage in time interval at and in volume v1 with size LP ~ L plus the number of particles created by agglomeration in time interval ~t and in volume v1 with size LP ~ L minus the number of
51

fiS
L
N(L) = J n(u)du (m-3] ~ = n(L) (m-4]
~ 0 N(O) = 0
~ L L ~ L(L) = J l(u)du = l un(u)du (m-2] ~ = l(L) = Ln(L) (m-3] !""
~ L(O) = 0 ~ L L ... c. ~ A(L) = J a(u)du = kA J .u2n(u)du (m-1] ~tl) = a(L) = kAL2n(L) [m-2] \I;)
03 .... 0 0 N ~ A(O) = 0 ~ L L 03 ~
V(L) = J v(u)du = ky J u3n(u)du (1] ~ = v(L) = kyL3n(L) (m-1] ~. !;J" $:: 0 0 ~ .... V(O) = 0 g 03
N = 1 (1] NT = N(oo) [m-3] (particle concentration) p (m-2] LP = LP 2 (m] LT = L(oo) (length density)
AP = kA LP [m2] Ar = A(oo) Cm.::11 (area density) VP = ky Lp3 [m3] VT = V(oo) (1] (particle volume fraction) (=ey)

particles destroyed by agglomeration in time interval AT and in volume v1 with size LP ~ L. This function is called an excess birth function because the death of particles is also taken account of. In the literature two functions are distinguished: Br and Dr• where Br - Dr = ~ or Br - Dr = B. The functions Br and Dr are thus sometimes differential birth and death functions and sometimes cumulative birth and death functions. The total nucleation frequency density is given by BT = 8(00 ).
Two examples of B(L) are given in figure 3.20. Figure 3.20a shows B(L) if no agglomeration occurs and if all particles are created with zero size, so B(L) = BT. Figure 3.20b shows B(L) if no agglomeration occurs and if particles break at any plane with equal chance (calculated from [Fi 721).
a
FigU:t'e 3.20. Cumulative e$aess birth funation B(L).
a. All nualei are areated with zero size.
b. The plane of breakage may lie anywhere in the arystal,
all planes in the ar'IJStal having the same ahanae of
beaoming the plane of breakage.
53

The linear growth velocity of a particle is defined by.
dL G(L):= or [m/s].
Name e0:= B(O), n°:= n(O) and G0:= G(O). A relation between these quantities can be derived as follows: Consider a'particle balance over the size interval (O,dL) in volume v1 during time At (see figure 3.21).
0 dL
Figu:l'e 3.21. Size inte~vai (0, dL).
The number of particles entering the size interval by nucleation (= e0v1At) equals the number of particles leaving the size interval by
0 0 0 0 0 growth (= n G v1 At), so B = n G •
3.8.2 The Steady State Continuous Mixed Suspension Mixed Product Removal Crystallizer
A continuous mixed suspension mixed product removal (CMSMPR) crystallizer is a continuous crystallizer the contents of which is ideally mixed and from which the crystals are withdrawn unclassified (the output flow has the same PSD as the crystallizer contents). Assume that the process is stationary, that the feed stream does not contain crystals and that all crystals have the same shape. It can then be shown that
!Vl ~ [G~L) n(L)] + Q n(L) - v1 ~ • O
l n(O) = n ·
(3.15)
54

where Q = volume flow of output [m3/s]. In this equation the first tenn describes the removal from an interval by growth, the second tenn the removal by output flow and the third the removal by nucleation or agglomeration. Equation 3.15 can be written as
il[ (ln ·~ = i; n ii[ - ii[ - '
)
d 1 (1 dB dG 1)
n{O) = n
The {ln n vs. L) plot has thus a stationary point for that value of L for which
{3.16)
The stationary point is a minimum if in it
a maximum if in it
In steady state the nuntier of nuclei produced in a period of time of At {= v1BrAt) equals the number of crystals leaving the crystallizer (= NTQAt). The residence time equals T = v1/Q so
{3.17)
We now make the following two assumptions:
{i) McCabe's growth law applies· here: ~ = 0, i.e. the growth rate is not dependent on the crystal size. So in this case Bo = n°G.
{ii) All nuclei are created with size zero (fragments that break from parent crystals have LP= 0) and no agglomeration occurs. In this case B(L)=BO =BT= B(00 ) and~= 0.
55

These two assumptions reduce equation 3.15 to
! GT dd~L) + n(L) = 0
n(O) = n°
with solution n(L) =no exp(-~). \>T
It can now be shown that
! [10 = GT
r 21 = 2GT
r 32 = 3GT
[lO = GT
r20 = .fl GT
L30 = h GT
{3.18)
( 3.19)
For later use, the following property of the exponential distribution must also be mentioned: The standard deviation of an exponential distribution equals the mean of this distribution:
p.20)
The growth velocity G can be detennir.ed experimentally from G = r 10/T (=equation 3.19) and BT from Br= VT/(kvTr30
3) (=equation 3.17). Define a dimensionless size x:= L/{GT). The distribution function can now be written as:
{r = 1 - (1 + x)e-x
56
Gen -x N- = e
T
i:1- = xe -x T
GTa _ 1 x2 e-x AT"""" - "2"

These functions give the PSD's in a CMSMPR crystallizer ana are aepic:ed in figure 3.22.
1.0
•H++++•••••••"•••••••••o """"
0 0 1 2 3 4 5
1.0
0 0 1 2 3 4 5
Figure 3. 22. Dimensionless particle size distributions fo:r t'7e CMS.'A?R
aryetaUizer.
3.9. Conclusions
(i) Crystals can be created by three nucleation mechanisms: homogeneous, heterogeneous or secondary nucleation. Of these, secondary nucleation is the most important by far in a stirring-crysta 11 i zer.
(ii) Ice crystals have two crystallographic axes. The growth rate in the a-axis direction is much larger than the c-axis growth rate, so ice generally grows into flat plates. The c-axis growth is two-dimensional nucleation growth. The a-axis growth rate can be represented by
57

(iii) Heat and mass transfer in a stirring-tank can be described by correlations of the form Nu (Re,Pr) or Nu (Ko,Pr).
(iv) Secondary nucleation of ice is attributable to crystal-crystallizer collisions for about 50%, crystal-crystal collisions for about 25%, and to fluid shear also for about 25%.
(v) In a continuous crystallizer, crystals with size-independent growth have a particle size distribution of the form of
0 L n = n exp(-n:r)· (vi) The particle size distribution of ice crystals exhibits a maximum.
58

· 4. Crystallization Experiments
4.1. Introduction
As explained in section 1.3, it is of interest to study the eutectic crystallization of NaCl.2H2o and ice. This chapter describes the experiments carried out. Section 4.2 gives a description of the equipment and experiment procedure, section 4.3 treats the measurement techniques, while section 4.4 deals with the results of the experiments, which are discussed in section 4.5. The conclusions of this chapter are presented in section 4.6. Experiments were conducted in a continuous stirring-crystallizer. Refrigeration was provided by direct-contact evaporation, for reasons explained in section 1.3. Continuous operation was chosen because in a large-scale plant this is cheaper than batch operation. The refrigerant should preferably be uninflammable and nontoxic, because otherwise special safety measures are required. In addition, it should be easily available. Of the substances mentioned in table 1.1, only Fl14 satisfies these requirements, so this refrigerant was chosen. It has low solubility and hydrolysis rate and can be easily separated from the brine [Jo 76, St 73c, St 73d, iJj..y 76a, iJj..y 76bJ. In this chapter liquid F114 will be denoted by LF114, gaseous F114 by GF114. The F114 can be supplied to the crystallizer in two ways (see also section 2.3.5): (i) The F114 can be supplied in such a way that a layer of LF114 is
always present at the bottom {besides the presence of two-phase drops in the suspension). The evaporation is then controlled by controlling the pressure; the pressure cannot be chosen independently.
(ii) The LF114 supply can be controlled and in this way the evaporation rate can be controlled; in this case the pressure is an independent variable.
Method {i) has the disadvantage that much Fll4 is carried along in the brine tube; this Fl14 must be separated from the brine and it makes sampling difficult. Large-scale equipment will also have these drawbacks. Therefore method (ii) was chosen. The independent variables are: the mean residence time of the suspension
59

< (which is assumed to be equal to the mean residence time of the crystals), the crystal mass fraction b, the pressure p and the stirring speed Na. The LF114 flow rate ~ is not an independent variable: it is fixed when the crystal mass fraction is chosen. The dependent variables are: the subcooling ~T. the crystal sizes and shapes, the purity of the crystals and the refrigerant drop sizes and concentration. In this chapter NaCl.2H2o will be called "hydrate".
4.2. Set-up and Procedure
4.2.1. General Description of Set-up
Figure 4.1 shows the equipment schematically. The set-up consists of two main circuits: the brine circuit and the F114 circuit. Closed circuits were chosen because otherwise large quantities of chemicals had to be used. In addition, level control of the suspension is not required in a closed-circuit configuration. The slurry (consisting of NaCl solution, two kinds of crystals, GF114 bubbles and LF114 droplets) flows from the crystallizer A through microscope cell B and subsequently through melter C. The brine, leaving the melter, (now consisting of solution and GF114), is separated in vapour-brine separatorD into solution and GF114. The GF114 is removed by compressor I and added to the F114 circuit. The brine flows through pump E, rotameter F and cooler G back to the crystallizer. The GF114 flows from the crystallizer thro~gh rotameter J to compressor K and is conducted to dryer M, together with the GF114 from the brine circuit. Then the F114 passes through condensor O and is accumulated in LF114 storage tank Q. From this tank the LF114 flows through rotameter Rand pump S back to the crystallizer.
4.2.2. Crystallizer
The crystallizer has the shape of a cylinder with inner diameter 190 11111
and height 300 11111. It has three walls: between the (perspex) inner wall and middle wall flows a cooling liquid of temperature T = 252 Kand the space between the middle wall and the outer wall is filled with dry air. The cooling liquid prevents heat losses, and the air prevents freezing of ice at the outside of the crystallizer. The slurry is stirred with a 6-blade stainless steel turbine impeller with diameter 60 11111, at 1/3 of the suspension height. From the experiments it appeared that the
60

dryer
N
Q
vapour
F brine
G B
0
c melter
microscope ce 11
A crys ta 11 i zer
FigUX'e 4.1. Experimental set-up.
brine
s 1 urry
crystals are best suspended if the impeller is situated at this height. At the walls. four stainless steel baffles. 20 11111 wide, are placed over the entire crystallizer height, and at 2 mm distance from the wall. The presence of this slit prevents caking of crystals at the baffles. The stirring rate is adjustable. The sealing of the impeller shaft is performed by a sliding mechanical seal. The s 1 urry is removed from the crys ta 11 i ze r at half depth , 60 mm from the center through a straight stainless steel pipe of 6 mm inner diameter. The LF114 and the return brine are dripped upon the suspension. A thermometer also is placed in the slurry.
4.2.3. Brine Circuit
The slurry flows through a tube to the microscope cell B. The tube .consists of (from inside to outside}: slurry, insulation, cooling liquid, insulation. The cooling liquid has a temperature of T = 252 K which does not deviate more than 100 mK from the eutectic
61

temperature anywhere in the tube. The fraction of crystal mass melting in this tube is negligible. The microscope except the ocular is placed in a cooled box at T = ~52 K. The microscope cell is shown in figure 4.2. In the cell, a portion of the circulating slurry can be i111110bilized. It can then be watched and photographed. After taking a photograph, the sample is again mixed with the slurry flow. The flow rate is not influenced by this action.
piston r---- -----, I , I I I I I I
detail
A~I ~0.4
Figu.Pe 4. 2. Miarosaope aell.
Outside the cooled box a camera is placed on top of the microscope. The microscope cell is placed between two crossed polarizing filters. The crystals at the negatives are 12 times their actual sizes. The melter C is a pipe surrounded by an adjustable electrical heating element. The vapour-brine separator D consists of a chanber in which the vapour bubbles can rise. The solution flows horizontally and the GF114 upwards. In the rising-pipe two electrical contacts are placed across which the electrical resistance is measured. At the top of the rising-pipe a magnetic valve H is situated which is automatically opened when the electrical resistance between the two contacts is high (no solution present
62

between the contact points) and which is closed when the resistance is low (solution present). The solution is pumped by peristaltic pump E with adjustable rotation speed from the vapour-brine separator to the rotameter F. Because of the l<M temperature, a silicone rubber tube had to be used in the pump. The cooler G is a spiral which is cooled by a cooling liquid of T = 243 K, and subsequently a spiral which is cooled by a cooling liquid of T = 252 K, so that, independently of the flow rate, the solution is cooled to T = 252 K (or to slightly above T = 252 K). The GF114, leaving the vapour-brine separator, is compressed by membrane compressor I. The flow rate of the brine that is recirculated to the crystallizer is kept constant by the peristaltic pump. The sampling technique will now be explained. Assume that at a certain moment the liquid level in the rising-pipe of the vapour-brine separator is above the contact point. The peristaltic pump draws liquid from the rising-pipe and no slurry is drawn from the crystallizer. The brine level will drop to below the contact point, the magnetic valve will open and the compressorwill draw slurry from the crystallizer, until the brine level in the rising-pipe is above the contact point again. Thus the slurry is drawn from the crystallizer in pulses. This pulse method has the advantage that jamming is prevented in the slurry tube and microscope cell. During the time that the magnetic valve is open, the microscope cell is operated and photographs are taken. The pulse period can be controlled by means of an electronic delay and is a few seconds. The volume change in the crystallizer which is caused by this method is about 1%.
4.2.4. Refrigerant Circuit
The GF114 flows from the crystallizer through rotameter J and then through membrane compressor K. The compressor has a by-pass valve L by which the volumetric flow rate is controlled (and as a consequence the pressure in the crystallizer, .because the mass flow rate is determined by the LF114 pump). The GF114 is conducted to dryer M, together with the GF114 from the brine circuit. The dryer consists of a pipe filled with silicagel. It is installed to prevent the water vapour in the GF114 fl<M from becoming ice in the condenser and so clogging the condenser.
63

The condenser O consists of a copper spiral which is cooled by a cooling liquid of T = 243 K. Because there is a small air leak in the low pressure part of the equipment, the vapour is slowly vented between the condenser and the storage tank. To compensate for the Fll4 loss, during each run some LF114 (of ambient temperature) is supplied between the dryer and the condenser. The LF114 is stored in a tank Q, which is cooled by a cooling liquid of T = 243 K. From there the LF114 flows to a rotameter R with three walls: from inside to outside: LF114, glass, cooling liquid (T = 243 K), glass, vacuum, glass. The vacuum prevents freezing of ice on the outer wall. From this rotameter the LF114 flows through a peristaltic pump S with adjustable rotation speed and with a pumping head cooled to T = 243 K. Because of the low temperature silicone rubber tube is used. Because the wall of the tube is thick, it does not swell owing to the affection by the LF114. The inlet pressure of the pump is higher than the outlet pressure. A pump was therefore not necessary, but a satisfactorily adjustable valve was not available. Next, the LF 114 is supplied to the crystallizer. All LF114-tubes are insulated.
4.2.5. Purity of Substances
To remove possibly accumulated oil or grease in the slurry part, the crystallizer and tubes were washed with hexane every 10 runs. The NaCl was extra pure (Merck Art. 6400) and the water was demineralized. Between every two runs the crystallizer and tubes were left filled with eutectic solution and just before each run it was replaced by fresh solution. The F114 had been obtained from Du Pont.
4.3. Measurement Techniques
4.3.1. Subcooling
The subcooling in the crystallizer was determined by means of a Thenno Electric N/N-24 TT type copper-constantane thermocouple, placed in a pipe of 8 nm outer diameter, the lower 50 nm of which were made of stainless steel and the rest of pertinax. The pertinax prevents heat
64

conduction through the wa 11 of the pipe. The pipe was fi 11 ed with glycerol up to 50 mm to improve the heat transfer from the thermocouple to the stainless steel tip. The tip of the pipe was placed at a distance of 2 mm from the bottom. Various positions in the crystallizer were tried out, viz. in the vicin-ity of the brine feed, or of the LF114 feed, or not in the vicinity of these feeds. The measured ~T appeared to be independent of the position of the thermocouple, within the inaccuracy of measurement (30 mK). The reference joint was placed in a eutectic reference system. This consisted of ice and hydrate crystals in a Dewar vessel. The contents of this vessel was stirred periodically to prevent segregation. The Dewar vessel was placed in the same cooled box as the microscope. To compensate for a possible zero bias of the voltage meter, the thermocouple voltage was compared to the short-cut voltage of the voltage meter. The difference of these two voltages was taken to be the thermocouple voltage. The voltage meter was a Hewlett-Packard 3465 B type digital multimeter, accurate to 1 µV. By measuring in this way the temperature difference between two eutectic reference systems, it appeared that this method has an accuracy of about 10 mK (averaged over a few measurements).
4.3.2. Temperatures
All temperatures of process flow streams were measured by copper-constantane thermocouples. These thennocouples appeared not to be chemically affected. The reference joints were placed in melting ice. The following temperatures were measured: of the brine feed, of the LF114 feed, of the microscope box, of the crystallizer wall cooling liquid (at inlet and outlet) and of the cooling liquid of the traced slurry tube (at inlet and outlet). The same voltage meter as in section 4. 3.1 was used.
4.3.3. Pressure
The pressure in the crystallizer was measured by a Wallace & Tiernan 1500-D-62A type Bourdon manometer, accurate to 200 Pa. The pressure relative to the atmospheric pressure was measured. The atmospheric pressure was determined by a Fuess 2k type mercury barometer, accurate to 200 µm Hg pressure. The absolute pressure in the crystallizer was deter-
65

mined from these values. This indirect method was necessary because no reliable absolute pressure meter was available.
4.3.4. Flow Rates
The flow rates were measured by means of Fisher & Porter rotameters. The brine flow with a type FP 1/4-16-G-5/81-SS, the GF114 flow with a type FP 1/4-25-G-5/81-SS, and the LF114 flow with a type 1/8-12-G-5/81-SA, the last mentioned being provided with two extra glass walls. Because the liquid-rotameters were fed by a peristaltic pump, the float moved up and down slightly. The accuracy was there.fore limited to 5%. The liquid-rotameters were calibrated with the process liquids and the flow rate through the GF114 rotameter was calculated by means of the relevant conversion formulae.
4.3.5. Crystallizer Volume
Eutectic NaCl solution was prepared by combining weighed quantities of NaCl and water. The volume of the quantity eutectic NaCl solution that was added to the crystallizer at the start of a run was measured in a measuring cylinder. The crystallizer volume equals this volume minus that of the brine circuit.
4.3.6. Stirring Speed
The stirring speed was measured by a Smiths K 1990 type mechanical rotation-speed meter, calibrated with a Pawer Instruments 1891-M type electronic frequency meter. The accuracy is 200 mHz.
4.3.7. Particle Size
The microscope cell is mounted on an Olympus E233199 microscope, with attached on it a Nikon F2 camera. Photographs were taken by ocular projection. The crystals in the negatives were measured on a NAC PH-3508 film motion analyser; this instrument produces a punch tape which was processed numerically on a Digital MINC-11 computer. The size scale was calibrated by photographing a micrometer division. The left and right positions of the crystals were measured; the difference of these was taken as the crystal size (see figure 4.3).
66

Figure 4. 3. Crystal size &tel'fllination.
For each run, 200 to 250 crystals were measured of both crystal kinds. The crystal kinds can be distinguished from each other and from the LF114 drops on the ground of shape and brightness. The brightness was influenced by the presence of the polarizing filters: NaCl.2H2o is much more birefringent than ice. (In reality the crystals appeared to be coloured in polarized white light. but this did not show in the black/ white photographs. so only brightness differences were shown.) Particle size distributions were determined from the string of crystal counts. The interval width was so chosen that the number of intervals with at least one crystal equalled about ~IN. where N is the number of measured crystals. Further were determined r10 := t(I;Lj)/N. t 20 := l(n/)/N, r 30 := l(EL/)tN ands:= l{EL/-{(Elj)Z)/N}/N-1 (standard deviation of distribution, see section 3.8). These quantities are estimates of the real population mean, etc. The left boundary of the 95% confidence interval forI10 (denoted by L10 .L) is defined as: that value of L10 for which the probability that the population mean is smaller than L·10 ,
1 equals 0.025.
The right boundray Lio.R and the left and right boundaries L2o,L,R' L30 .L,R and sL,R are defined in a similar way. These interval boundaries can be calculated by (for N > 30):
EL. J -
L10.L,R = T + tN-1
2 n. 1 + + tN-1 (2' a) N (N-1)
67

N(N-1)
3 El. l + + tN-1 (-z a) L30,L,R =
_ sV2(N-1)1
- 1 V2(N-1)' ! t00 {-z a)
where tN is the Student's distribution with N degrees of freedom and in this case a = 0.05.
4.3.8. Crystal Shape
The two volume shape factors (kv• see section 3.8.1) were determined from the photographs by selecting 30 crystals of both kinds that lay perpendicularly to the normal direction and measuring their length and thickness. Due to the small number of crystals that lay parallel to the viewing direction, the shape factor could not be determined· as a function of the independent variables {also see section 4.3.12).
4.3.9. Drop Concentration
Drop concentrations measured in arbitrary units were determined by counting the drops in the photographs.
4.3.10. Crystal Mass Fraction
The crystal mass fraction was calculated from a heat balance. The following quantities were determined: the heat needed to cool the feed brine to T = 252 K, the heat effect of the heating and evaporation of the Fll4, and the stirring power {calculated with equation 3.4 with Po = 5). The heat of crystallization (= b pl Qf,l Lm,E) equals the heat of vaporization of the F114 {= ~Lv) plus the heat required to warm the LF114 {= ~ 6.H) minus the heat required to cool the feed{=P1 cp,l6.TQf,l) minus the stirring power {Po p1 Na3 da5). Part of the LF114 did not evaporate in the crystallizer but in the melter. The quantity of LF114 that was evaporating in the crystallizer was determined by means of the GF114 rotameter. From these values follows the crystallization power and thus the crystal mass fraction.
68

In addition, an estimation of the crystal mass fraction b was maae oy visual examination through the microscope.
4.3.11. Residence Time
The average residence time was computed by<= VifQl ,f' i.e. the crystallizer volume divided by the volumetric flow rate of the brine feed. This residence time is assumed to be equal to the average crystal residence time.
4.3.12. Growth Rate
The growth rate was computed by G = r 10t< (equation 3.19). If the distribution is exponential and dG/dL = O, this is the growth velocity of the crystals (see section 3.8.2). In other cases this is a sort of average growth velocity. If the crystals do not grow at the same rate in every direction, it is also an average over all directions. It appears, however, from the shape of the hydrate crystals that the growth rate of hydrate crystals is not strongly direction-dependent. For ice, however, this is the case (see section 3.3.1), but by the sampling action, the ice crystals were turned and viewed perpendicularly to the basal plane, so in this way only the a-axis growth rate was determined. Some ice crystals lay parallel to the viewing-direction, so from the observations in the two directions the shape could be determined (see section 4.3.8).
4.3.13. Nucleation Rate
The nucleation frequency density is calculated with equation 3.17: I . 3 r 3 8T,h = (VT,h)/(kV,hT 30,h ) = (qhbP1)/(ph<kv,h 30,h ) and 8r,; analo-
gously. Here qh,qi is the composition of the eutectic mixture (qh =
0.3768; qi = 0.6232), pl, ph' P; the mass densities of slurry, hydrate and ice respectively, and kV,h' kv,i the hydrate and ice volume shape factors respectively (see section 3.8.1).
4.3.14. Purity of Crystals
The purity of the crystals was determined in a number of batch runs. In this section the meaning of "to dry" is: removing by heating all water molecules present in the crystal or on it.
69

Ice crystals were fon11ed by cooling aw = 0.20 solution to just above T = 252 K; hydrate crystals were produced (in a different run) by cooling aw= 0.26 solution to just above T = 252 K. The runs lasted 30 minutes starting from the first nucleation. The contents of the crystallizer was drawn off suddenly and filtered under suction. The hydrate crystals were weighed, dried and weighed again. Half of the ice crystals was treated in the same way and the other half was first heated, then washed in melt water and in demineralized water, and weighed, dried and weighed again. A number of salts with hydrate-like crystal shape and size were selected. The quantity of liquid left on these crystals after filtering was determined. It is assumed that this liquid was saturated solution. By weighing, drying and weighing again these salts, it could be determined how much solution was left on the crystals. In this way it was possible to deduce the purity of the hydrate crystals from these values. From the data referring to the ice the quantity of liquid left on the ice crystals after filtering was determined. It is assumed that this liquid is eutectic solution if the crystals are not washed, and pure water if the crystals are washed. From these values the purity of the ice crystals was determined. If it is not assumed that the washing is perfect, the value of this purity is a lower bound. The method used for hydrate has the drawback that it is not certain that the same quantity of liquid is left on the hydrate crystals as on the other crystals. However, it is not possible to wash hydrate crystals in a NaCl solution with a concentration equal to the hydrate composition, because no such solution exists.
4.4. Results
4.4.1. Qualitative Observations
It can be seen from the photographs that the hydrate crystals have a shape roughly resembling a sphere (with wel 1-defined angles but no plates or needles). The angles are mostly 120° (2~/3). The ice grows into plates with the average length-thickness ratio of 4. No clear angles are visible. The crystal shape appeared to be independent of the process conditions. Also the shape is not dependent on the crystal size. The volume shape
70
factor for hydrate is taken to be kv,h = n/6, for ice kV,i = n/24. Two-phase drops were not observed in the microscope cell, only LF114 drops and GF114 bubbles were observed. At a sudden pressure increase the drops did not change their volume, so it is assumed they were liquid drops. The photographs in figure 4. 4 show hydrate and ice crysta 1 s. LF114 drops and GF114 bubbles. The hydrate crystals lie apart, the ice crystals form agglomerates: several plates lie on top of each other. The ice crystals clot and cause caking in the crystallizer and clogging in the tubes. These effects occur occasionally, especially at low stirring speed or at high crystal mass fraction. During a run, the water vapour removed by the compressors is left in the dryer. Due to this effect the mass ratio ice/hydrate is decreased in such a measure, that at low b the ice may disappear. To compensate for this effect, so much water was added at the start of a run that the mass ratio had the right value at the moment the photographs were taken. The quantity of GF114 in the slurry tube is greater when the pressure in the crystallizer is higher. If the pressure is about the same as the Fl14 equilibrium pressure, the volume fraction GF114 may exceed 0.5, which makes sampling very difficult.
4.4.2. Unsteady State Behaviour
When the equipment is started, the temperature in the crystallizer first decreases to a certain value·and then increases to a higher value {the steady state temperature). The maximum of the subcooling is higher at higher ' or higher ~ and reaches at most about 600 mK. In figures 4.5 and 4.6 the function 8T{t) is shown for two runs. It appears that after 5, the subcooling is constant, so it is assumed that the state is then stationary and the crystal size distribution also. The photographs were therefore taken at least 5< after the first nucleation {at short residence times after B<). Nucleation starts at the maximum of the 8T(t) curve. First the ice nucleates; the first observable crystals are already rather large ("" 100 µm). If< is larger. the nucleation time difference is longer. Even if no water is added at the start of a run (see section 4.4.1), the ice nucleates first. If~ is changed suddenly during a run, 8T also changes. At low b this
71

Figure 4. 4. Photographs, showing: large round GF114 bubble, small round
LF114 droplets, hexagonally shaped NaCl . 2H2o crystals, and
agglomerating ice crystals .
= 1 mm.
72

400 600
r (mK)l
1' l 111 II II 500 I
1i11' 11 300 LIT (mK) I
Ill I I 111I1 t 400 1' 11 ~II 1 I 1111 Ill I I '1' 11 i li11l11I 1111 i
200 ~ 111 1
1
11 II I I .
I 100 f
I It 0 o I
0 2 4 6 8 0 2 4 6 8 t t
- - (1} - - (l} T T
Figi;.r>e 4. 5. llT(t) during starting-up. 4. 6. M( t) during star>ting-up.
~

change is followed more rapidly than at high b. At low b, the AT could not well be kept constant. If the pressure was suddenly increased, so that boiling stopped. then AT vanished in about a minute.
4.4.3. Crystal size
The main object of this study was the determination of the crystal sizes as functions of mean residence time (i:), stirring speed (Na), pressure (p) and crystal mass fraction (b). The results of these experiments are presented in this section. Only crystals with LP> 20 µm could be identified unambiguously. Unidentifiable crystals were not measured. Large crystals could be identified better than small ones. The ice crystals are difficult to measure (especially at high b) owing to agglomeration. The results are summarized in table 4.1. The temperature at runs# 43 and # 44 was higher than TE: only hydrate and ice was formed respectively. The uncertainties of i:, p and Na in table 4.1 are larger than could be expected from section 4.3: it was impossible to maintain these variables between narrower limits. All uncertainties in table 4.1 are 953 confidence 1 imi ts. In some cases L30 ,L appeared to be negative; ih such
cases L30 ,L was taken to be zero. Figure 4.7 shows some crystal size distributions. Most histograms do not have their maximum (modus) in the first interval. If the number of intervals with at least one crystal is denoted by N, then the modus for hydrate is 0.10 N and for ice 0.21 N, averaged over all runs. Figure 4.8 shows r 10 ,h and r10 ,i for runs # 38 to # 65. It can be seen that the 953 confidence intervals overlap in (almost) every case for similar runs. It follows that the results are reproducible. In figure 4.9 the results of similar runs are joined (the original Lj's are joined). It appears that for hydrate as well as for ice r10 increases with increasing i: and decreases with increasing b. No significant influence exerted by p or Na is observed. Experiments with a silicone rubber coated impeller (as in section 3.7.1.a) were not carried out. The reason was that it was assumed that, because the stirring speed has no significant influence, the influence of a coating is not significant either.
In all cases r10 < r20 < r30 and BT,h < BT,i' Further properties are given in table 4.2. It can be seen that, averaged
74

i: (s) p (kPa) N1
(Hz) b (l)
(t lkPa) (t 0.3Hz) (t 0.02)
22 1600:100
23 1600:100
25 1600tl00
26 1600:100
27 900t100
28 1600d00
29 900•100
30 900•100
31 900%100
32 llOOZlOO
33 850• 50
34 750• 50
35 680• 50
36 630t 50
37 590• 50
38 430t 40
39 430• 40
41 440• 40
26
35
34
24
27
32
28
24
24
20
21
30
30
28
29
30
31
30
15.0
15.0
15.0
10.0
10.0
11.7
13.3
11. 7
10.0
11.7
ll.3
10.0
15.0
11.7
13.3
13.3
13.3
13.3
0.10
0.09
0.09
0.08
o.os 0.08
o.os 0.05
0.04
b.07
0.08
0.04
0.04
0.04
0.03
0.03
0.04
0.03
tJT rlO,h
{mK) {µm)
r30,h
(µm)
-250
-200
-160
67•4 77*4 86+5 -6
110t20 160:1:20 200~~
82t9 llOtlO 140t20
78:1:9 100:1:20 230+20 -30
120:1:20 160t20 190+20 -30
86z9 llOt 10 130:20
100:10 130t30 11!0+40 -100
82s9 110*10
70t10 110:1:40
. 87t9 llOtlO
80tl0 110t20
86t8 llO:tlO
72*9 100t30
S9t7 80t10
59t8 80•30
66:1:6 79:t7
75:t9 100:t20
62:t7 80:1:10
130:t20
uo+so -140
130+10 -20
140+30 -40
130+10 -20
150+50 -150
100+10 -20
140+50 -140
91+7 -9
140+40 -90
100+10 -20
(10,i
(µm)
lOOtlO 140i20
170:20 220t30
111*9 130:20
lOOtlO 140d0
r30,1
{µm)
180+30 ·60
270+40 -50
110+40 -so
90+50 1 -190
86:t8 102:1:8 120:tlO
130t20 170t30 210+40 -so
62:t6 76:t8 90*10
+40 lOOtlO 120:t30 160_l60
lOOtlO 108:t9 114+9 -10
120:tl0 130:t1C
91*6 100t7
88:t8 110:t20
140+10 -20
109+8 -10
140+40 -140
93t7 106:1:9 120:t10
89:t6 101*7 110:1:10
75:t6 86:t7 100:1:10
84:1:9 100:t20 130~
6ti (nm/s)
38:t3 92 :t7 42:t 5
UO:tlO 140:tl0 70:t20
77t7 72:t6 51*9
69t6 92:t9 49t9
90%10 55t5 130:t40
67t6 llOtlO S4t9
86t8 44t4 110t20
68:t6 72t 7 90t20
85:t8 37:t 7 80:t20
65t6 80:1:20 .
75.,7 5lt9 90:1:20
63t6 4lt4 110:20
66:t6 62:t5 110:t20
SO:tS 5l:t5 90:1:20
6 b6 48:t4 100:t20
43:t4 150:t30
66:t6 42t4 l 70t40
50t5 62:1:6 140:t30
60tl0
110t20
70t10
60t10
100t20
80:1:20
70tl0
110:t20
110:20
140:t20
120t20
130:1:20
150t20
150t20
170:30
190t40
8r,h 8T,i
(MHz/m3) (MHz/m3)
;so~~ 4+6 -2
11+11 -5
11+22 -6
5+8 -3
12+15 -6
5+100 -4
14+23 -8
5+950 -4
16+19 -8
20+50 -10
14+19 -9
10 .... -8
40+80 -30
10~0 50+80
-40 20+530
-10 40+100
-30
60+180 -40
18+25 -9 .,
80+sso -so
40'*"" -30 200+300
-100 30+70
-20 500+7oo
-300
80~0 200+200
-100
200+200 -100
300+300 -100 +oo
100-100
200+300 -100 +400 200-200
700+900 -400
200+2400 -100
Table 4.1. Results of runs: subeoo'ling (AT), averoge crystal sizes (f,10, E20,L30J, standavddeviation of PSD
(s), gvowth ve'loeity (G) and nucleation rote (BT) as functions of vesidence time (T), pvessU'l'e (p),
sti'l"l'ing rote (Na) and crystal mass f'r'action (b). (Continued on page 76.)

' {s)
42 2400±100
43 2500:t:l00
44 2300±100
45 1200•100
47 1200•100
48 1200:1:100
49 1200±100
50 1200:1:100
53 1200'100
55 1200±100
56 1200±100
57 1200±100
58 1200±100
59 1200:1:100
60 2400±100
61 1200±100
63 1200•100
65 430±40
p (kPa) Na (Hz) b (1)
{•lkPa) (:0.3Hz) (±0.02)
30
30
30
21
21
33
33
30
30
30
30
30
30
30
30
30
30
30
13. 3
13.3
13.3
13. 3
13.3
13.3
13.3
13.3
13.3
6.7
16.7
6.7
16.7
6.7
13.3
13.3
13.3
13.3
0.05
0.05
0.05
0.05
0.05
0.05
0.05
0.15
0.15
0.05
0.05
0.05
0.05
0.05
0.15
0 01..0.02 • -0.01
0 Ol+0.02 . -0.01
0 01..0.02 . -0.01
Tabel 4.1. Continued from page 75.
AT [10,h
(mK) (µm)
r20,h r30,h r10,1
(pm) (µm) (11m)
-130 140:1: 10 160d0 170±20 107±9
+530 110:1:10 140±10 160~~g
r20,1
(µm)
r30,;
(µm)
120±10 140+lO 74±9 -20
78:1:7
+80 110•20 140:1:20 170+30 -40
-40 92±8 110±9 130:1:10 96±9 120:1:10 130:1:10 60.t6
-130 100± 10 140:1:20 180:20 102±8
-150 90%10 130±20 160z20 106±8
-120 80:1:10 120.20 150~~ 107±8
-140 70:1: 10 100±10 130±20 78±7
-140 73±9 100±10 130~~g 69•7
-140 120±10 160:20 180:20 110•10
-100 100:1:10 120:1:10 140±10 100±10
-150 67:1:9 90"10 120+10 -20 71•7
-110 100±10 120±10 140±10 90:9
120±10 140+10 98±9 -20
121±8 133+8 85:1:8 -9
120±10 140±10 82±8
92:1:7 102+7 73:1:7 -9
87±9 100:10 71:1:7
140:20
140±20
88:1:8
110±10
96±9
71:1:7
66±6
74:1:7
-160 88:1:9 111±9 130"10 91±7 106:8 120±10 67:6
-$'.) 100•10 130±10 160:20 88:1:8 106±9 120:10 82±8
-30 120± 10 140±10
-160 120±20 160:1:20
-370 93±8 110±10
160±10 170±20 200±20 230 +20 -30
72:1:7
190+20 160±10 180±10 200±20 100:10 -30
120± 10 120:1:10 140±10 160+lO -20
55±6
6ti • Gi 8r ,h 8T, i
(µm) (nm/s) (nm/s) (MHz/m3) (MHz/m3)
58±7 58±7 45±6
44.t6
80:1:10 50±10
66.t6 80:1:10 80±20
64±6 90±20 90:1:10
59±5 80±10 90±10
62±6 70±20 90±10
47:1:5 60±10 70±10
53±5 60.t!O. 60±10
85•8 100 ±20 90±20
88:1:8 $3:1:20 90±10
52±5 60:10 60±10
66.t6 80±20 80±10
55±5 70±20 80±10
60±6 42±6 37±5
100:1:10 100±10 140•20
89±8 100±30 130:20
75±7 220±40 280±60
11+12 -6
4+6 -2
5+8 -4
6+13 -4
30+30 -10
30+30 -10
4+4 -2
9+9 -5
14+20 -8
a+9 -4
11+11 -6
9+7 -3
1+4 -1
0 7+3.0 • -0.7 7+26 -7
30+60 -20
110+120 -60
100+130 -60
110+100 -60
100+110 -60
100+500 -300
soo+60° -300
50+240 -40
so+l30 -30
300+300 -100
110+220 -70
160+160 -90
220+150 -80
4+16 -4
5+22 -6
40+130 -40

;l: 0 ~
0
<Q !JN Runs: #38, •39, <Q In t:.N Runs: # 38, # 39,
~ In "ff.: #41 ~ 1TT #41 f T t
'!"- (lOW T) '!"- (!OW T)
~ ~ Q ?
~ -4
-s -5
-6 -6
0 50 100 150 200 250 300 350 400 0 60 lZO 180 240 300 - Li (µm) -Lh (IJlll)
~ 0 ;l: 0 <Q
Runs: •42, 143 <Q hN Runs: #42, #44 ~ In !JN i;: In NT. t1fi (high T) ~ t (high T)
'!"- '!"- -2 ~ ~ ~ <::J'
-3
-4
-5 L __ l_ -5
-6 -6
0 60 120 180 240 300 360 420 0 60 120 180 240 300 360 420 480 .... -Lh (µm) - L1 (11111) ....

...., ~
0 ~
0 CD
<Cl Runs: 145, 147 <Cl tJJ Runs: 145, #47
~ :;:: ln w.;
(low p} ~ I T (low p)
4'. . ':"" -2
~ ;:'l ., -3 (I> -3 . -4
-5 -5
-6
0 100 200 300 400 500 600 0 80 160 240 320 400 480 - Lh (um) - Li (um}
0 ":! ~ .... 1 <Cl ln tJJ Runs: #48, #49 Runs: #48, 149 ~ I NT {high p) (high p)
':"" 4'. . ~ ;:'l ~ -3 ';!> -3 .
-4 -4
-5 -5
-6 -6
0 90 180 270 360 450 540 0 60 120 180 240 300 - Lh (pm} - Li (11m)

;l! 0 ;l! 0
l ln lJN Runs: 155, 157, #5 <Q ln !Jll Runs: •55, 157,
t 1Jj (low Na) ~ t 1Jj 159
'!"- -2 '!"- -2 (low N8
)
:" :" ~ -3 ~. -3 .
-4 -4
-5 -5
-6 -6
0 70 140 210 280 350 420 490 0 50 100 150 200 250 300 -Lh (J,1111) -Li (JJlll)
;l! 0 ;l! <Q
ln /JN Runs: •56, #58 <Q 1 t.N Runs: 156, 158 i;::
~ t'1i' (high Na) ~ n JI: (high Na) f T
'!"- '!"-:" :" ~ ':'· -3
-5 -5 1 __
-6 -6
~ 0 40 80 120 160 200 240 280 320 0 80 160 240 320 400 480 -Lh (lllll) -L; (µm)
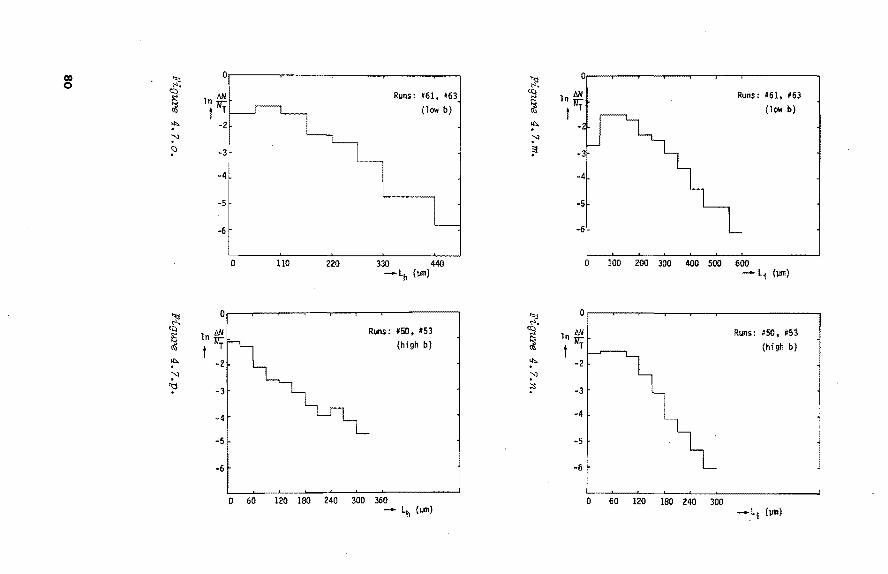
CJ) ;,;: 0 ;,;: 0 0
<Q
ln~ Runs: #61, #63 <Q ln tJJ Runs: •61, •63
~ i::
(low b) ~ NT (low b) t T t '!'> -2 '!'> ~ ~ ~ ~
-4 -4
-5 -5
-6 -6
0 llO 220 330 440 0 100 200 300 400 500 600 -Lh (\jlll) -L; ()Jiii)
0 0 '>j '>:J
""'· ""'· <Q ln AN Runs: #50, #53 <Q
ln AN Runs: N50, #53
~ NT (high b) ~ NT (high b) t t '!'> -2 '!'> -2
~ ~ '\:I -3
;:! -3
-4 -4
-5 -5
-6 -6
0 60 120 180 240 300 360 0 60 120 180 240 300 - Lh (µm) (Jllll)

~
l 180 '!" ;o [10 ~ §! (µm)
a 140 ~ Ol
"'" ~ N
()) 120 ...
~ «>
ti> "$
100 ()) «> N 80 «> a ~ s::i..
~ 60 H
(I,)
40 38 39 41 42 43 45 47 48 49 55 57 59 56 58 61 63 50 53 run 39 41 42 44 45 47 48 49 55 57 59 56 58 61 63 50 53
low high low high low high low high # low high low high low high low high
20 T T p p Na Na b b T T p p Na Na b b
hydrate ice 0
G:I ....

high b
low b high Na
low Na (I) CJ
high p .,...
low p
high T
Tow i:
high b low b
high Na
low Na (I)
high p ..... 40 s.. "O
low p >. .s:::
high T
low T
0 0 0 \0 .....,.. N 0 0 0 0 0 ...... 0 s ...... ...... co \0 q- N 0 ...... ;:J. 1.....1--
Figure 4. 9. Mean arystal size avevaged over :runs shown in figure 4. 8.
over all runs, ice crystals are a little larger than hydrate crystals, that the standard deviation of the distributions is smaller than according to the model in section 3.8.2, and that r 10 • r20 and I 30 are closer together than the model predicts. To represent the results of table 4.1 more conveniently, they were fitted with the model:
82

Averaged over all runs: according to equation 3.19 or 3.20
(20) = 1.31 (20). = 1.21 1.41 'rlO h rlO ,
(30) = 1.65 {30). = 1.42 1.82 [10 h [10 l
(30) = 1.25 (30). = 1.18 1.28 r2o h r20 ,
[10, i = 1.18
r10,h ({-\ = 0.83
L20,; 10 1.08
1.00
r20,h (f-). = 0.66 [30 . 10 , __ ._,
= 1.03
1.00
r30,h
Table 4. 2. Some properties foUowing from table 4.1
. CE C-r Cp CN Cb . [IO = e T · p Na b , and r 20 , r 30 , s, G, BT and fl T were f1 tted in a similar way, following the method described by Smillie· [Sm 66]. This fitting yields the results of table 4.3. The uncertainties listed are the 95% confidence intervals. It appears that forl. 10 , i:20 , i:30 , s, G and BT the influence of only -rand b is significant, for llT the influence of only -r.CThecefoC::• the results ofc table 4.1 were fitted with the model i:10 = e E -r T b b etc. and llT = e E -r -r. This yields the results of table 4.4. Table 4.5 su11111arizes the resulting equations.
83

fl CE c. Cp CM ~
1:10 ,h -12.5:1:4.3 0.38*0.14 -0.01:1:0.42 0 .Olt:0.26 -0.19=0.10
1:20,h -12.3"'4.5 0.34"'0.15 0.05:1:0.44 -0.02:t:0.27 ·0.15:t:O. ll
1:30,h -11.2*4.9 0.2.h0.16 0.05:0.48 -0.02:t:0.30 -0.10:1:0.12 '<.
511 -12.4o:5.5 0.25..0.19 0.11:0.54 -0.09:!:0.33 -0.05:t:0.13
6ti -12.4:t:4. l -0.60:1:0.14 -0.04:t:0.40 +0.02:0.25 -0.20:1:0.10
81 ,h 34:t:l4 -1.75"'0.48 -0. ltl.4 0.01:0.86 1.32:!:0.34
r10,1 -12 .8*5.2 0.30:!:0.17 0.03:0.51 0.18:0.29 -0 • 23:0 . 12
r20,; -12.9:t:5.5 0 .34:!:0.18 0.03:0.54 0.20:!:0.30 -o.21:t:0.12
r30,1 -13.4=6.3 0.35:!:0.21 0.09:0.62 0.23:0.35 -0 .19:!:0 .14
S; -16.6:t:7 .6 0.42:!:0.25 0.27:!:0.74 0.26:t:0.42 -o .18:t0 .17
Gi -13.1"5 .1 -0.69:t:O .17 0.06:!:0.50 0.20:t:0.28 -0.22:0.11
8T,i 41:20 -2 .07:t:O .66 -0.1:2.0 -0.8*1. l l.58:t0.45
LIT -10:1:22 -0.67:t:0.53 1.4:2.0 -0. 35:!:0. 89 0.14:t:0.34
Table 4. J. CE CT C CN Cb
Coeffiaients of model. f 1 e T p p N b , where a f1 = £10. L20• L30• s. G, BT, flT
f2 CE c Cb '{
rlO,h -12.6:1.1 0.38z0.14 -o .19:!:0 .10
r20,h -11.9:1.2 0.34"'0.15 -0 .15o:0.10
r30,h -10.8*1.3 0.23:t:0.16 -0. lO:t:0.11
sh -ll.5:t:l.5 0.25o:0.18 -0.06:t:0.13
% -12. 7:t:l. l -0.60:t:0.13 -0 . 20:!:0 . 10
81,h 32.2:t:3.8 -l.75:t:0.46 1. 32:!:0. 33
rlO,i -12.0:tl.4 0.3l:t:0.17 -0.23:0.11
r20,1 -12.l:t:l.5 0.35:t:0.18 -0.2l:t:0.12
r30,; -12.0:t:l.7 0.36:t:0.20 -0.19:t:0.14
Si -13.2:t:2.0 0.43:0.25 -0.19:t:0.17
Gi -12.0:t:l.4 -0. 70:0.17 -0.22:t:O. ll
81,; 37. 7:t:5.4 -2 .OS:tQ .66 1. 58:t:O. 45
LIT 2.0:t:3.3 -0.59:!:0.
Tab'le 4. 4. Coe ffiaients of mode i CE CT Cb
f 2 = e T b • whe~e CE c
f2 = £10. £20• r:JO. G, BT and of model. /J,T = e T s. T
84

hvdrate
r10 = 3.4 10·6 To.3a b-o .19
r2o = 6.8 10·6 To. 34 b-0.15
r30 = 2.0 lo·s To.23 b-0.10
S "l.O 10-5 T0.25 b-0.056
ice
r10 = 6.1 10·6 To.31 b-0.23
[20 " 5.6 10·6 T0.35 b-0.21
r30 = 6.1 10·6 T0.36 b-0.19
S " 1.9 10-6 10.43 b ·0.19
G = 3.1 10·6 T-0.60 b-0.20 6 = 6.1 10·6 T-0.70 b-0.22
8T = 9.6 1013 T-1.B bl. 3 BT = 2.4 1016 ,·2•1 bl.6
subcoolino
AT = 7.4 T-o.59
Table 4.5. Correlations of table 4.4 in foP111Ulae
In the fitting procedure the logarithms of the variables were calculated and subsequently the model was fitted linearly. To apply this linear regression, it is assumed that the error in the variables has mean zero and constant variance. Neither condition is satisfied in this case. This method can yet be applied if the error is small and approximately constant. To study the effect of this approximation, a sensitivity analysis was carried out. The variables were pertubated at random to simulate measuring errors, and the constants CE• CT etc. were calculated. This was repeated several times. It appeared that the averaged C's from the pertubated cases deviated systematically a few per cent from the C's from the unpertubated case. In all cases. however, the C's from the pertubated cases lie well inside the 70% confidence intervals of the C•s from the unpertubated case. It was concluded that the linear regression method may be applied in this case.
4.4.4. Drops
Figures 4.10 and 4.11 show an LF114 drop size distribution which was observed through the microscope. The distribution is approximately normal, the riqht-hand tail is longer than the tail of a normal distribution. The mean drop diameter ('C10 ,d) is not significantly dependent on T, Na• p orb and equals r 10 ,d = 50 ,:t 10 µm under all conditions. The drop concentration NT,d is dependent on T, p and Na. No significant influence exerted by b was observed. Drop concentrations can be
85

160
Ld (µm)
t 120
80
40
0
-...... .i... (II
~ c
~ 0.10 N ...... ~
<ti
E 0 c
t
I
0 40 80 120 160 -- Ld (µm}
Figure 4.10. Drop size distribution.
I
10-3 0.01 0.05 0.25 0.50 0.75 0.95 0.99 0.999
-- cumulative normalized number (1)
Figure 4.11. Drop size distri,bution.
86

determined with difficulty: at low b almost all drops are visible, but at high b almost all drops are covered by crystals. Therefore, no quantitative statements about NT d can be made. It is clear, however,
a a • a that ap NT,d > 0, aR:"NT,d > 0, il< NT,d < 0, i.e. a pressure or stirring-speed incre~se increases the drop concentration, a residencetime increase decreases the drop concentration (at constant b). To get an impression of the order of magnitude of the influences it can be roughly stated that NT ,d is proportional to Na and inversely proportional to'• and that the influence of p is stronger than when proportional (in the studied range).
4.4.5. Purity of Crystals
From the experiments (see section 4.3.14) with crystals similar to hydrate it appeared that ( 15 .±. 4 )111% (mass per cent) of the filtered wet crystals is liquid. The hydrate crystals consisted for(60 .±. 2)m% of NaCl (hydrate composition: w11 = 0 .6186). From the ice experiments it appeared that (48 .±. 2)m% of the filtered ice crystals is liquid. The ice crystals were found to consist of less than 0.12 m% of NaCl.
4.5. Discussion
4.5.1. Cr1stal Shape
The ice crystal shape found in this investigation is tn agreement with the shape found by Margolis et al. [Ma 71] and Nagashima & Maeda [Na 78] (see also section 3.7.2) viz. round platelike crystals and agglomerates. These plates are formed because the growth rate in the basal plane (va) is larger than that perpendicular to this plane (vc). The lengththickness ratio of 4 which was found in this investigation, is in reasonable agreement with the ratio of 2.9 measured by Margolis et al. From sections 3.3.2 and 3.3.3.b it can be deduced that valve~ 300 (at AT= 200 mK, w
00 = 0.04). This velocity ratio alone cannot explain
the lower length-thickness ratio found by Margolis et al. and in this ·study. It is therefore concluded that ice plates break apart in a stir
ring-crystallizer. 4.5.2. Unsteady State Behaviour and Crystal Size Distribut1ons
When the equipment is started, the AT shoots to a high value, and then reaches a stationary value. This can be explained by assuming that the
87

first nucleation is heterogeneous nucleation and that the steady state nucleation is secondary nucleation. Secondary nucleation occurs at a lower 8T than heterogeneous nucleation. The period from the moment that 8T = O to the moment of first nucleation is longer for longer T, because $ is then smaller. From figure 4.12 follows the reason why 8T is not well reproducible at low b {see section 4.4.2).
8T t
8T for neterogeneous nucleation
--- b
Figu:t>e 4. 12
At low crystal concentration I~ 8TI is rather large. In addition only a small fraction of the supplied LF114 is used for purposes of crystallization (see section 4.3.10). (According to equation 4.10.c this dependence reads 8T ~ b-0•2; heterogeneous nucleation is not taken into account in that model.) The maximum in the PSD of ice was also found by Margolis et al. [Ma 71] and Nagashima & Maeda [Na 78] (see also section 3.7.2). It can be explained by equation 3.16: the maximum is present if small crystals grow faster than large crystals or if not all nuclei arise with size zero (see also [Fi 72]), or both. From the unsteady state behaviour {see section 4.4.2) it is concluded that small ice crystals grow faster than large ice crystals: the first nucleated ice crystals are already rather large. Hydrate crystals do not exhibit a very pronounced maximum in their PSD's. This might be caused by identification difficulties (see section 4.4.3). Thei~ unsteady state behaviour is in agreement with this absence of a maximum: the first nucleated hydrate crystals are very small. From section 3.5.3 it appears that the heat and mass transfer coefficients for small parti'cles are larger than for large particles. It may
88

be concluded from this that small particles grow faster than large particles if no inbuilding limitation exists {oT«8T, see figure 3.4}. If the growth is inbuilding limited, then~= 0 and so the distribution is exponential. {This is not true for very small crystals [Ru 80, St 79].) The maximum is not caused by the curvature effect (equation 3.2) because the critical radius is much smaller than the modus of the PSD. It may be concluded that for ice the growth is heat or mass transfer limited, in agreement wi.th section 3.3.3.b, and that the hydrate growth is partly inbuilding controlled.
4.5.3. The Influence of Pressure
a. Introduction
In this section it will be explained why the pressure has no signifi-~
cant influence on G, Br or 8T. and hence on the other variables. · A possible influence on G or Br might be caused by the followin~ mechanism: The outer boundary layer of a two-phase drop is colder than the bulk liquid. If (part of} a crystal is present in that boundary layer, the growth rate is larger than in the bulk, and so is the nucleation rate. If the pressure is decreased, the subcooling in that boundary layer is increased (see e.g. figure 2.18), and the boundary layer growth and nucleation are increased. In subsection d it will be shown that the contribution of the boundary layer growth and nucleation is negligible compared to the total growth and nucleation. The possible influence on 8T might be caused by the following mechanism: The measured temperature in the crystallizer is a weighed average of the two-phase drop temperature, the bulk liquid temperature, and the crystal temperature. If the pressure is decreased, the two-phase drop temperature is decreased, and so the measured subcooling is increased. From subsection c it will appear that the contribution of the two-phase drops to the measured temperature is negligible compared to the contribution of the bulk liquid. In order to make these calculations, the heat transfer coefficients of a two-phase drop are calculated in subsection b.
b. Determination of hd~ of a Two-phase Drop
First the hd of a two-phase drop is calculated. Use the "sloshing model"
89

of Simpson et al. (equation 2.6): 1 0 1
kd a de o hd = 12 I I (~) .
1 '2' 0 2vd d0
(4.1)
Now assume that the acceleration to which a two-phase drop is subjected equals a= 100 m/s2 (rou£hly the acceleration of the impeller tip), that the initial drop diameter is d0 = 150 lJlll (the maximum observed drop diameter, see section 4.4.4), and that the effective diameter de= 1 lllll (in agreement with figure 2.8). These assumptions are somewhat speculative, but the final conclusions of this section remain valid, even if a, d0 or d are chosen different within realistic values. In the case of Fll4, equaiion 4.1 now gives hd 12 kW/(m2K). Next he is calculated. To this end the models of Sideman & Taitel and of Tochitani et al., the measurements of Sykes & Gomezplata, and· the correlation of Huige & Thijssen are applied. Assume f!='IT/2: the liquid to liquid interfacial area equals the vapour to continuous liquid interfacial area, and both equal the half sphere area. Furthermore, assume that the two-phase drop moves in the given acceleration field with the terminal velocity. Then the model of Sideman & Taitel (equation 2.4) yields:
k 3 1/2 1/2 2 h = c (3 cosf! - cos fl + 2) Pe = 20 kW/{m K) c a; 1T c
(4.2)
The model of Tochitani et al. (equation 2.5) gives:
The pressure influence experiments were conducted with Na = 13.3 Hz and da = 60 mm. The correlation of Sykes & Gomezplata (equation 3.6) yields
k he = -1:- (2 + 0.109 Re 0· 38 Pr 0•5) = 18 kW/(m2K) ue a c (4.4)
The correlation of Huige & Thijssen (equation 3.7) produces:
90

(4.5)
The he's of equations 4.4 and 4.5 are valid for an entire sphere. Because we have assumed that the liquid to liquid interfacial area equals the half sphere area, and because the heat transport is assumed to occur entirely through this area, these he's must be divided by 2. Because Prd = 11 and Pre = 46, the inside and outside temperature boundary layers are thinner than the convective boundary layers, so in the boundary layers the heat transfer occurs by means of conduction. The boundary layer thickness follows from: ar = k/h. The results are summarized in table 4.6.
Equation he (kW/(m2K)) h0
(kW/{m2K)) arc (µm)
4.2 20 7.5 30 4.4 9 5.1 60 4.5 5.4 3.5 90 4.3 4.4 3.2 120
TahZe 4.6.
The thickness Arc is the real thickness of the boundary layer at the conducting half of the sphere. The thickness averaged over the sphere is 2~ as large. The overall heat transfer coefficient h
0 was calculated
by h0
= {hd-l + hc-l)- 1• The boundary layer thickness ard at the inside of the liquid to liquid interfacial area equals 5 µm. The h0 's which were found here are in agreement with the minimum value calculated by equation 2.8 of h
0 = 310W/(m2K) (see also section2.3.5).
c. Subcooling Determination
For convenience, the crystals are omitted in this subsection; this has no influence on the result. The subcooling of the NaCl solution will be denoted by aTc and the subcooling of the two-phase drop by aTd. The measured subcooling (denoted
91

by AT1) is then given by:
(4.6}
From equation 2.11 it follows that the drop area density is given by
(4.7}
In the pressure influence experiments <f>v = 9 g/ {m2s ). Furthermore. take h0 = 5 kW/(m2K) (see table 4.6) then equation 4.7 yields:
-1 -5
~P = 21 kPa: AT = 0.3 m • Ev = 5 10 ;
-1 -4 p = 33 kPa: AT = 4 m • Ev = 7 10 ;
3 . where Ev = {Ay de)/6. From equation 2.3: (de/do) = 1 - ~ + Pd~/Pv it follows that ~ = 0.6. This means that when all F114 has evaporated, Ev = 0.01 if p = 21 kPa and Ev = 0.15 if p = 33 kPa. This is in agreement with qualitative observations in the brine tube after the melter. From the thermodynamical data [Ma 60] it follows that at the surface of the suspension ATd,s = 10 K if p =. 21 kPa, and that ATd,s = 1 K if p = 33 kPa. Because the depth is small, the two-phase drop subcooling approximately equals the surface subcooling everywhere in the tank (see section2.3.5}. The measured subcooling is about AT1 = 100 mK. Now equation 4.6 yields that for both pressures ATc = 99 mK. This is equal to AT1 within measuring error.
d. Growth and Nucleation
Apply the following model, valid at the conducting half of the sphere {see figure 4.13). The temperature AT{re} can be calculated with
AT{re> = (hd ATd +he ATC)/(hd +he>· In the outer boundary layer AT(r} is given by
92

re+llrc -r
Figure 4.13. Temperatures at interfaae of two-phase drop.
Assume a first order growth process: G =cg llT. The contribution to growth in the boundary layer of a drop now becomes:
re + llrc J G(r).2nr dr. re
The contribution to the growth in the bulk solution, adjacent to one drop, is given by
Now it appears that for all he's of table 4.6 and for both pressures the fraction of the growth in the boundary layer
re iflr J c G(r) 2nrdr re
Assume a second order process for the nucleation: BT= en llT2. In the same way as above it appears that the fraction of the nucleation that occurs in the boundary layer < 4 10-2• In the model the total amount of grc:Mth or nucleation increases less than 3%. if the pressure is decreased
93

from p = 33 kPa to p = 21 kPa. This 3% increase is not in contradiction with the experimental results. The inaccuracy of the measurements was too large to detect this increase.
4.5.4. The influence of T. Na and b
From tables 4.3 and 4.4 it appears that within rounding-off errors - 3 r Gh = l10,h/T, BT,h = (qhbp1)/{phkV,h'L30,h ), Gi = 10,i/T!and
BT,i = (qibp1)/(p;kv,;'L30 ,;3). The quantitaties G and BT were calculated in this way, so the correlations for G and Br follow from the other correlations. Instead of the independent variables (b,T), the variables (b, bp1/T) or (T, bp1/T) can be taken, where bp1/T equals the crystal production/ crystallizer volume [kg/{m3s)]. This conversion can be carried out in tables 4.3 and 4.4. The result in table 4.1 that I 10 < I 20 < I 30 , for hydrate as welJ as for ice, is in agreement with equation 3.19. The result in table 4.1 that BT,h < BT,i is caused by kv,h = 4 kv,i• BT being proportional to 1/kv· The correlation for BT,i in table 4.3 is in agreement with equation 3.14, apart from the influence of stirring speed Na: .Stahl & Weinspach found a more pronounced influence of Na. However, equation 3.14 was es tab 1 ished at a higher temperature and a lower NaCl concentration than the correlation for BT,i in table 4.3. A model is now introduced to explain the results of table 4.3, viz. the dependences of Gh, BT,h' G;, BT,i and ~Ton T, band Na. The dependences of r10 ,h and I 10 ,i follow from I 10 ,h = GhT and I 10 ,i ~ Gi' respectively. First, functions of the fonn Gh (Na.~T), Gi (Na.~T), BT,h (Na,b.~T) and BT,i (Na,b.~T) will be derived, together with functions of the form BT,h (Gh,b,T) and BT,i (Gi,b,T). This set of 6 equations can be rewritten to give 5 equations of the form: Gh (T,Na,b), Gi (T,Na,b), BT,h (T,Na,b), BT,i (T,Na,b) and ~T (T,Na,b). These 5 functions can be compared to the observed functions of table 4.3. It will appear that the 5 model functions do not agree with the 5 observed functions, even if the measurement accuracy is taken into account. The original 6 model functions are so adjusted that the model functions and the observed functions agree with each other. This adjustment is not unique, i.e. the model functions can be adjusted in many ways yielding agreement of
94

model and observation. Adjustment· is carried out in such a way that the adjusted model and the original model correspond most closely. The model equations will be derived as foll<Ms. In section 3.3.3.b three crystal growth models are described: the boundary layer model, the creeping fl<M model, and the crystal conduction model. All models predict G "'v/12 1::,,r312• These models can be applied here if the flow velocity vf is replaced by the slip velocity vs. From equation 3.5 it follows that vs"' c113 . If the slip velocity vs is calculated by means of either equation 3.5.a or equation 3.5.b, the Re nunber appears to be smaller than 2, therefore equation 3.5.a is applied here. From equation 3.4 it follows thatc"- N 3, so G =cg Na112 AT312, where cg is a constant. a A nucleation model is represented by equation 3.13. This equation yields Br"- c(c 7b + c8b2}f(AT). The relative values of c7 and c8 can differ from case to case. It will appear that the results of table 4.3 can be described best if c7b << c8b2 is taken, i.e. crystal-crystal collisions have a greater influence than crystal-crystallizer collisions. In order to model f(AT}, it is assumed that the probability of the breaking off of a potential nucleus is inversely proportional to its cross-sectional area (see figure 4.14).
crystal
Figure 4.14.
liquid
potential nucleus
Assume that the survival model (section 3.6.3) is valid and use equation 3.1 .• then it follows that Br"' AT2• N<M we get Br= cnN/b2Ar2, with en a constant.
95

Assume that equation 3.18 is satisfied: BrG3 = cu(b/<4), where
cu,h = (qhp1)/(6kv,hPh) = 0.090 and cu,i = (qiP1)/(6kv,iPi) = 1.05. Summarizing we have the following 6 equations (3 for hydrate and 3 for ice):
G = c N 1/2 /J,T3/2 g a
B = c N 3 b2 /J,T2 T n a
BrG3 = cu(b/<4)
(4.8)
These equations can be rewritten to give the following 5 equations (the equations for G and Br are valid for Gh, G1 , BT,h and Br,;):
G = c 3/13 c 4/13 c -3/13 ,-12/13 N -7/13 b-3/13 u g n a
B = c 4/13 c -12/13 c 9/13 ,-16/13 N 21/13 b22/13 T u g n a
/J,T = c 2/13 c -6/13 c -2/13 -8/13 N -9/13 b-2/13 u g n 1 a
In the equation for !J,T, the coefficients {cu,h' cg,h' cn,h} or {cu,i' cg,i' cn,i} can be substituted for {cu, cg' en}. The exponents of<, Na and b do not lie inside the 95% confidence intervals of the coefficients c .. CN and Cb respectively of tab.le 4.3; consequently the model 4.8 is not in agreement with the experimental results. We now try to bring the exponents of T, Na and b within the 95% confi-dence limits of table 4.3 by adjusting some exponents of equations 4.8. For that purpose take the model
c1/2 3c2/2 G = c
9 Na /J,T
3c3 2c4 2c5 Br = en Na b /J,T (4.9)
3 4 BTG = cu(b/T )
Evidently only the equations for G and Br are adjusted. The third equation is left unaltered. These equations can be rewritten to give the following 5 equations:
96

3c2 4c5 _ 3c2 _ 12c2 9c2c3-2c1c5 3c2(2c4-l) -
c6 c6 c6 c6 c6 c~
G = c Na b 0
u cg en 't
4c5 12c5 9c2 _ 16c5 27c2c3-6c1 c5 18c2c4+4c5 ---c6 c6 c6 c6
Na c6
b c6
BT = cu cg en 't
(4.10) 2 6 _.?___ _§_ 3c1+6c3 4c4-2
--- --..,..-c c6 c6 c6 c6 c6 llT = c 6 b u cg cn 't Na
where c6:= 9c2 + 4c5• Now determine the solution {cj} of equations 4l0 such that the exponents of T, Na and b satisfy the 95% confidence intervals of table 4.3 and such that
5 2 5 2 I: (cj,h-1) + I: (ck i-1)
j=l k=l ,
is minimum. This last condition provides the least deviation of the adjusted model (4.9) from the standard model (4.8). A brute force calculation yields:
hydrate: c1 = 1.01 C2 = 0.64 c3 = 0.82 C4 = 1.00 C5 = 1.16
ice:~~~ : ~:!~ . c3 =0.71
C4 = 1.00 c5 = 1.23.
These coefficients {cj} might be used to determine c9
and en such that equations 4.10 satisfy entirely the 95% confidence intervals of table 4.3. This determination is not possible, however, owing to the large uncertainties in CE (see table 4.3). Notice that from the exponent of T in equation 4.10.c it follows that 9c2 ~h+4c5 ,h = 9 c2,; + 4 c5,1, from the exponent of Na that 3c1,h+6c3,h = 3 c1,; + 6 c3,h' and from the exponent of b that
c4,h = c4,i" The model equations 3.9 now become:
97

Gh ~ Na0.51 ~T0.96
B ~ N-2.46 b2.00 ~T2.32 T ,h a
G. ~ N 0.62 ~T0.92 i a
B . ~ N 2.13 b2.00 ~T2.46 T, 1 a
(4.11)
It appears that G is proportional to ~T instead of to ~T31 2 as predicted. In the three models several assumptions are made which are not
(we 11) applicable in a s ti rring-crys ta 11 i zer. In a sti rri ng-crysta 11 i zer: (i) the crystal is not fixed but moves freely;
(ii) the flow is not in a constant direction; (iii) the length-thickness ratio of the crystals is smaller; (iv) the crystals have the shape of an ellipsoid and not of a parabolic
cylinder; {v) the tip radius is much larger.
Kallungal & Barduhn [Ka 77] (see also section 3.3.3.a) give some more comments on the models. The influence·of Na on BT is smaller than predicted. This can be explained by assuming that the nucleation is partly "surface regeneration limited" (see section 3.6.5). The influence of ~T on BT is larger than predicted. It is not clear why. To our knowledge, nothing has so far been published in the literature on this subject either. The correlation of BT has the same form as equation 3.12, with similar exponents. The exponent of b in equation 3.12 points to a major contribution of crystal-crystallizer collisions, the exponent of b in equa-tion 4.11, however, points to a major contribution of crystal-crystal co 11 is ions .
4.5.5. Drops
It appeared that the mean drop diameter r 10 ,d is not significantly dependent on any variable. It might be expected that [lO,d decreases if Na increases. It is observed, however, that the drop concentration NT,d increases with increasing Na. It can now be conceived that the drops coalesce and sink to the bottom at low Na. At low Na the mean drop size is larger but the large drops are present in the vicinity of
98

the bottom and are not removed through :the sample pipe, so the observed I 10 ,d is not dependent on Na. . It is physically plausible that T and p have no influence on r 10 ,d. The pressure appears to have a strong influence on NT,d" This is in agreement with equation 2.11: at constant$ the drop area density AT,d increases if p increases. Because I 10 ,d is independent of p, the drop concentration NT,d must increase if p increases. The residence time T has a negative influence on NT,d (~T NT,d < 0). The residence time T is (at constant b) inversely proportional to $ (if all LF114 evaporation is used for crystallization). Because r 10 ,d is not dependent on T, the refrigerant flow 9 will be proportional to NT,d and from this it follows that NT,d is inversely proportional to T.
A similar reasoning can be applied to the influence of b: at constant T, the crystal mass fraction b is proportional to$ and~~ NT,d~r10 ,d2 ' and because LlO,d is constant, NT,d must be proportional to b. There may be two causes for not arriving at this result:
(i} At high b the drops are covered by crystals and so are invisible. (ii) At low b the relation b ~ $ is not valid because a large part of
the LF114 is not used for crystallization (see section 4.3.10}. The PSD's of the drops correspond to those of section 2.4.
4.5.6. Purity of Crystals
The compositions of the hydrate and ice that were found (see section 4.4.5) do not deviate detectably from the compositions of pure hydrate and ice respectively. Therefore, the impurities are so slight that they could not be detected. The purity of the ice (< 0.12 m% NaCl} is much higher than found by Janzow & Chao (0.7 m% at w = 0.035} (section 3.3.b} who, however, experimented under different conditions.
4.6. Conclusions
(i) Ice crystals grow into round plates, with a diameter-height ratio = 4 and fonn agglomerates. Hydrate (NaCl.2H20) crystals are approximately spherical, with well-defined angles of 120°. The shape of both crystal kinds is independent of size and of conditions.
(ii} The particle size distributions for ice shCM a maximum and those for hydrate show a slight minimum. The ice growth is heat or mass
99

transfer limited, the hydrate growth is partly inbuilding controlled.
(iii) The size r 10 , growth rate G, nucleation rate Br and subcooling 6T as functions of the mean residence time T and crystal mass fraction b, can be represented by the fol lowing empi ri ca 1 correlations:
r10,h = 3.4 10-6 T0.38 b-0.19
r10,i = 6.1 10-6 To.31 b-0.23
Gh = 3.1 10-6 T-0.60 b-0.20
G; = 6.1 10-6 T-0.70b-0.22
Br,h = 9.6 1013 T-1.8 bl.3
Br . = 2.4 1016 T-2.1 bl.6 ,1
6T = 7.4 T-0·59 .
(iv) The growth rate G and nucleation rate BT can be expressed as functions of stirring-speed Na• crystal mass fraction b, and subcooling ~T. in terms of the theoretical model, as follows (note that 6T is a dependent variable):
Gh ~ Na0.51 6T0.96
B ~ N 2.46 b2.00 6T2.32 T ,h a
G; ~ Na0.62 6T0.92
B . ~ N 2.13 b'2.00 AT2.46 T,1 a " •
(v) For both kinds of crystal the nucleation is slightly surface regeneration limited, and crystal-crystal collisions have a greater contribution to the total nucleation than crystal-crystallizer collisions.
(vi) The LF114 drops have a size of r 10 ,d = 50 ± 10 ~m under all conditions. The drop concentration NT d is independent of b and a a a • ap NT,d > O, afL NT,d > O, aT NT,d < O.
(vii) The NaCl contentaof hydrate crystals is (60±_2) mass%, of ice crystals < 0.12 mass% (hydrate composition: wh = 0.6186).
100

5. Separation o·r Two Solids in a Hydrocyclone
5.1. Introduction
The NaCl.2H2o and ice crystals fonTied in the eutectic crystallizer are to be separated. Because ice floats on the brine and NaCl.2H2o sinks,
the separation can be perfonned using the density difference of the crystals. Two kinds of apparatus can be utilized: a settling tank or a hydrocyclone. The separation of two solids in a settling tank has been proved possible, but the process is very slow [Fe 81]. The separation in a hydrocyclone of a floating and sinking solid has also been proved [Mo 52]; it has a high efficiency [Jo 73, St 73b] (see
. also [Fl 75, Fl 79]) (see also section 1.2.1.a.a.b). Because the hydrocyclone operates well with the NaCl.2H20-ice-brine system, and because it is a compact device (important because of thermal insulation), the separation in this device was chosen for study purposes. The object of these experiments was to determine how the efficiency depends on operating conditions. No reference was found in the literature consulted, and it could not be calculated either, because the theory of the light-heavy solid hydrocyclonic separation is not yet adequately developed. The power consumption of the eutectic freezing process as a function of separation efficiency is calculated in appendix A (sections A.5. A.6). The theory of the hydrocyclone is briefly reviewed in section 5.2. In section 5.3 the experimental set-up and procedure of the hydrocyclone experiments are described, and section 5.4 gives the results. Finally, in section 5.5 the conclusions of this chapter are presented.
5.2. HYdrocyclone Properties
The properties of hydrocyclones are treated by Bradley [Br 65]. They are briefly reviewed here. Figure 5.1 shows a picture of a hydrocyclone.
101

feed inlet
~overflow
· vortex fHlder
0
FigUPe 5.1. Cross-seationa of a hydroeyalone.
The slurry is fed tangentially into the hydrocyclone. The floating solid leaves the hydrocyclone through the overflow, the sinking solid through the underflow. If either outlet conmunicates with the atmosphere, an air core develops. Measured velocity distributions are presented in figures 5.2, 5.3 and 5.4. The power consumption P of a hydrocyclone equals Qf Ap, i.e. the prod-uct of feed flow rate and pressure difference between inlet and underflow. This pressure difference is assumed to be equal to the pressure difference between inlet and overflow. The acceleration in the hydrocyclone as a function of radius can be calculated by a = vT/r2, with vT given by figure 5.4. The average residence time' equals Vc/Qf' i.e. the cyclone volume divided by the throughput. The pressure drop over a hydrocyclone is caused mainly by the kinetic energy of the feed stream: AP~ pvf2;2 hence Ap ~ Qf2/dc4• Various correlations are available (see e.g. [Ri 61]}.
102

-r
Fi(JUI'e 5.2. Axial velocity.
-r
FigUPe 5. 4. Tangential Velocity.
- r
Figure 5. 3. Radial velocity.
Figures 5.2, 5.3, 5.4.
Velocity pr>ofiles in hydr'ocyclone
at ar>oss-seations h1 and h 2 of
fig. 5.1. Right-hand end points
of aurves ar>e at cyclone z.Jall.
The volume split S:= (overflow volumetric rate)/(underflow volumetric rate) can be adjusted by varying the outlet diameters or by installing a valve in the overflow or underflow tube. A typical efficiency curve for a feed stream containing only heavy particles is given by figure 5.5.
5.3. Experimental Set-up and Procedure
5.3.1. Set-up
To study the separation of a floating and a sinking solid in a hydrocyclone, experiments were conducted with the equipment shown in figures 5.6. and 5.7.
103

EH
t
104
1.0
0.8
0.6
0.4
0.2
-d p
A
c
Figure 5. 5.
Typiaal effiaienay aurve.
Mass ft'aation of feed partiales appearing in underjlouJ versus partiale size.
p G
F
E
Figure 5. 6. Experimental set-up of separation equipment.

3
I"" ... . :_1 .
'
I
I
I
3.5
~i 0 ....
2.5
0 Lt'I
FigW'e 5. 7.
HydrocryaZone used in e:x:periments.
Dimensions in mm •
Because NaCl.2H2o and ice crystals of the correct size are difficult to produce. and to avoid insulation of the entire equipment. the experiments were carried out at antiient temperature with a model system. This comprised two kinds of particles and a liquid. One kind of particles had the same density, size distribution and shape as the ice crystals; the other had the same density, size distribution and shape as the NaCl.2H2o crystals. The liquid had the sal!E density and viscosity as the brine. The composition of the slurry is given in table 5.1. The detergent was added to wet the polypropene. The liquid was saturated with the heavy solid. The mass ratio heavy/light particles is the same as the mass ratio NaCl.2H20/ice in the eutectic point.
105

Floating particles: polypropene
Liquid: water 49.6 m% MgS04.7H20 24.6 m% glycerol 19.9 m% NH4Al(S04)2.12H20: 5.9 m% detergent 0.02m%
TabZe 5.1. Composition of modeZ suspension
In storage tank A (see figure 5.6) the particles are kept in suspension with impeller B. The suspension is fed into the hydrocyclone H by gear pump E (IBEX type MOG601X), with adjustable rotation speed. To dqmp pressure variations of the gear pump, a buffer vessel filled with air is connected to the pipe between the pump and the cyclone. The pressure drop over the hydrocyclone is measured by manometer G (Econosto, Wika). The underflow discharges in a funnel to provide an air core. At the outlet of the funnel two valves M are installed such that either a sample can be taken or the underflow can flow to the storage tank. The overflow can be pinched off by an adjustable restriction K, so that the overflow/underflow ratio can be controlled. Valves L conduct the suspension either to the measuring cylinder N or to the storage tank. Because the solubility of the heavy particles depends on temperature, the temperature of the storage tank is kept constant by refrigerator c (the suspension is heated by the power consumption in the hydrocyclone). (The melting of crystals in the ice-NaCl.2H20-brine system in the hydrocyclone due to the power consumption is negligible.) The suspension was renewed when the particle size distribution deviated from the original one, owing to ripening (see section 3.2.2) or grinding.
5.3.2. Procedure
To take a sample, the values L2 and M2 were opened simultaneously, and the valves L1 and M1 closed. After 5 seconds valves L1 and M1 were opened and L2 and M2 closed. The vo 1 ume of tapped s us pension was read from the measuring cylinders.
106

'fhe contents of the measuring cylinders was poured into separatory funnels to float the light particles and to sink the heavy ones. After one hour and a half both kinds of particles w~re tapped together with part of the liquid, and filtered {filter: Schot-Mainz, type 103 or 163). The heavy solid was washed in saturated NH4Al(S04)2 solution and subsequently in ethanol. Then the particles were dried at T = 340 Kand weighed. From these results the following two quantities were calculated:
E ·- mass flow of light particles in overflow and L"- mass flow of light particles in feed
E ·- mass flow of heavy particles in underflow H"- mass flow of heavy part1cles ln feed
The overall efficiency can be defined as:
5.4. Results
The functions EL, EH (S, 6p, b) were determined, i.e. the efficiencies as functions of volume split, of pressure drop and of total mass fraction particles. The result EL is shown in figures 5.8 and 5.9. In figure 5.8 it can be seen that aEL/aS > o. Figure 5.9 shows that aEL/a6p < O. Experiments conducted to study the influence of particle mass fraction revealed that if 2.0 ~ S ~ 3.0, and if 100 kPa ~ 6p ~ 700 kPa, and if
_0.05 ~ b ~ 0.15, then EL~ 0.98. In the studied range EH appears to be almost independent of the conditions and equals approx. 0.98 + 0.01.
5.5. Conclusions
(i) A suspension with similar properties as the eutectic suspension can be separated with high efficiency in a hydrocylone of 10 mm diameter.
(ii) The mass fraction of the floating particles in the feed stream that appears in the overflow (=EL) increases with increasing volume split ratio S (volumetric discharge rate overflow/underflow ratio) and, if S = 2.5, becomes approx. 0.99. The efficiency EL decreases with increasing pressure drop 6p. The efficiency EL
107

1.0
EL (1) t
0.6
0.4
0.2
0.0 j *
0
... • ••••• '.. • * • • • • * .. '
••• • • * •
.. * •
1
• *
*
2
•: Ap=lOO kPa
• : Ap=300 kPa
-tc: Ap=500 kPa
"': Ap=700 kPa
Ls (1) 4
Figure 5. 8. Fracticm of light particles appearing in overjlOUJ as a
functicm of volume split.
1.2
EL (1)
t ~~~~~~~~~~~~~~__,=2.0
------------S=l.5
0.8
0.6
=1.0 0.4
0.2
0.0 0 200 400 600 800
-Ap (kPa)
Figure 5.9. Fracticm of light particles appearing in overjlOUJ as a
functicm of pressure drop ~ith parameter volume split.
Curves a2'e intel'polations between measured points.
108

equals approx. 0.98 if 2 5 s 5 3, 0.05 5 b 5 0.15 and 100 kPa 5 Ap 5 700 kPa.
(iii) The mass fraction of the sinking particles in the feed stream that appears in the underflow (=EH) does not depend very much on conditions and in all cases equals approx. 0.98 .:!:. 0.01.
(iv) The overall efficiency E0
= I EL + EH - 1 I had a maximum of 0.96.
109

6. Conclusions
6.1. Conclusions of this study
This study of the eutectic freezing process for separating NaCl from H2o consists of three parts:
(i) A theoretical study of the relevant phenomena: the method of cooling and the crystallization.
(ii) An experimental study of the simultaneous crystallization of NaCl.2H20 and ice.
(iii) An experimental study of the separation of two model compounds in a hydrocyclone.
(i) One of the theoretically studied phenomena was "direct-contact cooling": In this process, heat is removed by continuously injecting liquid freon into the suspension and removing the freon vapour, so that the heat of vaporization of the freon is withdrawn from the suspension and equals the heat of crystallization of the crystals. From the theoretical studies it appeared that the freon, which is illllliscible with the salt solution, exists in the crystallizer as two-phase drops: freon liquid and freon vapour stick together by surface tension. The size of the two-phase drops increases because the vapour fraction increases. If the size reaches a certain value, the freon vapour bubble detaches from the freon liquid under the influence of the acceleration forces of the im• peller stirring the suspension. The liquid drop evaporates further and becomes again a two-phase drop. This continues until all liquid freon of the drop is evaporated. The present study also shows that there is a considerable heat flux at the freon to brine interface.
(ii) The crystallization experiments were carried out in a continuous stirring-crystallizer containing 2 litres of suspension. The heat was removed by "direct-contact cooling". It appeared that the ice and NaCl.2H2o crystals grow separately, in contrast to the crystals growing from eutectic melts of metals.
110
The main variables in this study were the crystal sizes. These appeared to be dependent on the mean residence time and on the crystal mass fraction. If the residence time was 15 minutes, the

salt hydrate crystals as well as the ice crystals had sizes of approximately 100 µm, No influence of the freon pressure and of the stirring rate could be determined. In the crystallizer the salt hydrate crystals grew separately, the ice crystals, however, had a tendency to agglomerate. To prevent agglomeration of ice crystals, the stir~ing rate must be higher than that needed to keep nonagglomerating crystals of similar properties in suspension.
(iii) As the ice and NaCl.2H2o crystals appeared to grow separately, they could be separated by using the density difference. In this investigation the separation was studied experimentally in a hydrocyclone. For technical reasons, these experiments were carried out with a model system. It appeared that separation could be well performed in a hydrocyclone of 1 cm in diameter. Under favourable conditions the separation efficiency was 98%.
6.2. Scaling-up
Knowledge about other aspects of this process, for example about the ice-washing column, was already available. Together with the results of this study there is n<M sufficient knowledge about the eutectic freezing process to conclude that this process is technically feasible. It is expected that scaling-up the crystallization equipment will not strongly affect the cyrstal nucleation and growth. Three remarks should be made, however.
(i} Stirring speed has at most a slight influence on nucleation and growth, so it is expected that if in a large crystallizer the stirring speed is so high as to prevent ice agglomeration, the crystal si.zes do not differ much from those found in this study. To ascertain this, it is reconmended to investigate the eutectic freezing process in a larger crystallizer than the one used in this study.
(ii) If the crystallizer is very large, the suspension depth may be larger than the boiling depth (see section 2.3.5). In the lower part of the crystallizer crystallization takes place, but no heat is withdrawn (the temperature equalization of the bulk is slow compared to the circulation (see section 4.4.2); the temperature
111

equalization of the refrigerant is fast compared to the circulation {see section 2.3.5.). Thus the production capacity is (approximately) proportional to the volume of the boiling zone. To avoid an unproductive part of the suspension, large crystallizers must have a comparatively large diameter/depth ratio. The boiling depth can be increased by applying a refrigerant with higher boiling pressure. However, in that case the refrigerant subcooling at the suspension surface can become so large that the nucleation rate BT becomes too high.
{iii) The separation equipment should be scaled up by applying many hydrocyclones of a size approximately equal to that used in this investigation [Br 65, ch.7].
6.3. Economical Feasibility
The economical feasibility of a process depends, among other things, on: {i) the capital investment;
{ii) the power consumption; {iii) the value of the product. The eutectic freezing process has in these respects the following advantages over the evaporation process:
{i) The temperatures of the salt solution in the eutectic freezing equipment are much lower than those of the salt solution in the evaporation equipment. Therefore, with the same degree of corrosion, cheaper construction materials may be used. In addition, expensive heat exchangers are not necessary.
{ii) Power consumption depends on the refrigerant applied. If a refrigerant with high heat of vaporization and low specific heat is used, the power consumption of the eutectic freezing point is lower than that of the evaporation process. Refrigerant Fll13 may fulfil these requirements.
{iii) In the eutectic freezing process, the salt is crystallized twice: first NaCl.2H2o is fonned which is subsequently dissociated into NaCl and saturated NaCl solution. In evaporation processes, the salt is crystallized only once. The purity of the salt in the eutectic freezing process is therefore higher than in the evaporation process. This is an advantage if a market for the high purity salt can be found.
112

The main drawback of the eutectic freezing process is the relatively large capital investment for the compressors. This might be reduced by using a refrigerant with a lower boiling temperature, such as Flll3. Confidential calculations have shown that for a grass root plant (i.e. there is no infrastructure yet) the eutectic freezing process could be economically feasible if a non-hydrate-fonning refrigerant with low boiling temperature were used, especially if high purity salt is required or if the energy prices remain high.
113

A. Power Consumption of Freezing Processes
A.l. Introduction
The thermodynamical minimum work .required to transform a system from one state to another equals the difference in free enthalpy nG of these states. The power consumption of such a transformation equals this minimum power consumption if the transfQrmation process is reversible. For the separation of a saturated NaCl solution into NaCl and H20 at T = 290 K the free enthalpy difference 8G = 107 kJ/kg NaCl [fly 77]. The amount of work WT required for a reversible evaporation process or a reversible freezing process therefore equals 107 kJ/kg NaCl. The calculation of the power consumption under actual conditions requires a different approach. This will be carried out in sections A.2, A.3 and A.4. In these sections only the theoretically minimum power consumption is calculated. The actual power consumption can then be determined by adjusting the subprocesses {e.g. taking into account a temperature difference for heat exchange, efficiencies of compression). Sections A.5 and A.6 present the theoretically minimum power consumption as a function of separation efficiencies.
A.2. Eutectic Freezing Process with Saturated Feed
The flow sheet of this process is shown in figure A.1. It is based on the production of 1 kg of NaCl. Heat flow Q1 can be partly exchanged with 04 + o7. An amount of cold {negative heat) Q11 := 04 + Q7 ~ o1 = 4.3 ±. 0.1 kJ is left, from which energy can be withdrawn on the trajectory T = 273 K ~ T = 290 K. The amount of energy that can be with drawn by means of a Carnot process from a substance having a constant specific heat (dcp/dT = 0) and whose temperature rises from T1 to T2, is given by:
W = ( T2 ln T2 - ) \ T 1 Q,
2 - Tl T1
where Q = cp(T2 - T1). The amount of work W which is required to cool a substance with
114

.solution
l m=m1 =w-=3.80 p
H = 245 m2 = 1.00
1-Wp 11\t = -=2.80
Wp
cooling 290.0K+273.2K
solution H = 37
solution t. NaCl .2Hz0
H -338
freezing 252.0K
m: mass in kg z: NaCl w: H 0 1: !~quid
solution H= 11 Q5=27Ss4
h: NaCL 2H20 Q: heat in kJ H: enthalpy in kJ
NaCl
m=mz= 1.00
H = 14
heating 273.2K+290 .OK
NaCl
H = 0
dissociating 273.2K
NaCl .2H20
H = -267
heating 252.0K+273.2K
H = -344
Q8=935.3 z0.2
water
1-wp m=nw=-w-· 2.80
p
H = 198
heating 273.2K+290.0K
water H = 0
melting 273.2K
ice H = -935
ice
H = -1056
Figure A.1. FlotJ sheet of euteatia freezing proaess with saturated
feed.
115

dcp/dT = 0 from T2 to T1 is also given by this fonnula. In the process under consideration an amount of energy of w1 = 0.130 ±. 0.003 kJ can be withdrawn. The heat Q2 can be exchanged partly with Q6 + Q9• The rest Q12 := Q2 - Q6 - Q9 = 190 ±. 20 kJ has to be carried off over the interval T = 252 K+ T = 273 K. For this purpose an amount of work w2 = 7.8 ±. 0.8 kJ is required. At T = 273 Kan amount of heat Q13 := Q12 + w2 = 200 ±. 20 kJ is delivered. For freezing at the eutectic temperature a Carnot machine is used between T = 252 K and T = 273 K. This requires an amount of work w3 = Q3/E1 =
89.3 ±. 0.4 kJ. where E1 = T1/(T2 - T2) = 11.89. At T = 273 Kan amount of heat Q14 := w3 + Q3 = 1151.0 ±. 0.6 kJ is delivered. Now an amount of heat Q15 := Q13 + Q14 - Q5 - Q8 = 140 ±. 20 kJ has to be removed from T = 273 K to T = 290 K. This is effected by means of a Carnot process: w4 = Q15JE2 = 8 ±. 1 kJ. where E2 = 16.26. Thus the total required theoretically minimum energy for the eutectic freezing process equals WT:= w2 + w3 + \~4 - w1 = 105 .:!:. 2 kJ, in agreement with section Al.
At T = 290 K an amount of heat Q16 := Q15 + w4 = 150 + 20 kJ is delivered. Note that
equals the heat of solution at T = 290 K. The specific heat of NaCl.2H2o was calculated using Kopp's rule, based on NaCl and ice. In the present calculation the heat effect of the dissolving in the brine well is omitted. Further it is assumed that the cooling-water temperature TK equals TK = 290 K. The same calculation can be carried out at other coolingwater temperatures. From this calculation it fol lows that WT(TK) can be represented by: WT(TK) = c1TK + c2, 273 K < TK < 320 K, where c1 = 480 J/K, c2 = -33 kJ. This is in agreement with the linear increase in ~G with T (see [flY 77]).
A.3. Eutectic Freezing Process with Unsaturated Feed
The flow sheet of this process is shown in figure A.2. A simflar calculation as presented in section A.2 gives the result shown in figure · A.3.
116

solution
1 m=m1 =wf
mz = 1.00 1-wf
11\.='Wf
cooling 290 .OK+273.2K
cooling 273.2K+252.0K
*
*: O<wf::WE: ml =!E =4.29
°'h = 0 WE-Wf
m.=--1 WEWf
m: mass in kg ~: ~aCl .2H20 1: 1ce z: NaCl w: H,,O 1: ltquid
cooling 273.2K+252 .OK
NaCl
m = mz = 1.00
. heating 273.2K+290.0K
dissociating 273.2K
heating 252.0K+273.2K
(wp-wE)(l-wh) ~----' °'h = (wh-wP J(wh ·itr o .o
1-wh m1 =--=0.99
wh-wE **
"h"Wp+wf-2whwf+whwPwf wf(wh-wP)
wh(l-wE) **: O<Wf:fWE: ml " wE(wh-wE} = 5.28
(wp-WE)(l-wh) °'h = (wh -wPJ(Wh -wE r 0 .08
wE-wf mi = wEWf
wh-wf WE::Wf9'p: ml = wf(wh -wE)
wh(l-wf) wE5wf:fWp: ml = wf(wh-wE)
water
heating 273.2K .. 290.0
melting 273.2K
heating 252 .OK+273.2K
wf-WE °'h = wf("h-wE)
WEWP-whwE+whw,wE-whw,wp-WfiE+whWf °'h = w,(wh -wE )(wh-wp}
mi = O
FigUPe A.2. FlOiil sheet of eutectic fl'eezing pl'Oaess with unsaturiated
feed.
117

~800 ~~~~~~~~~~~~~~~~~~~~~~~~~
~1; ,...__....600
1-::;i:
t 400
200
0
0 0.05 0.10 0.15 0.20 0.25 - wf (1)
FigUPe A.3. Power consumption of eutectic freezing process as a
function of feed concentration.
Cooling-water temperature = 290 K.
A.4. Noneutectic and Partly Eutectic Freezing Processes with Saturated Feed
The noneutectic process is depicted in figure A.4. A similar calculation as presented in section A.2 yields the minimum power consumption
WT= 15 .±. 5 kJ/kg NaCl. Partly eutectic freezing processes have power consumptions between WT= 15 kJ/kg NaCl and WT= 105 kJ/kg NaCl. The brine in the noneutectic process need not to be cooled to T = 252 K.
A.5. Process with Incomplete Ice-NaCl.2H2o Separation
The flow sheet of this process is shown in figure A.5. A similar calculation as presented in section A.2 gives the result shown in figure A.6.
118

,solution
H 1660
cooling 290.0K•273.2K
H = 250
solution wp
solution Wp H • 11
NaCl
H • 14
m • mz • 1.00
heating 273.2K->290.0K
NaCl
H 0
1-wh m=m1 =--•1.07
Wh-WP r-~~--...,.
H • 260
dissociation 273.2K
solution wp ( 1-wp)(wh-wE)
m = m1 = (wp-w[)(wh ·wp) = 26.9 NaCl .2H2o
cooling 273.2K•252.0K
m: mass in kg z: NaCl h: NaCl .2H2o 1: liquid H: enthalpy in kJ,
H • -267
1-Wp m= m. =--= 2.07
n Wh-WP
heating 252.0K•273.2K
NaC1.2H20
H = -344
solution
H = 1610
solution wE
heating 252.0K•290.0K
solution wE
H -1520
Figu.Pe A.4. Flow sheet of noneuteatia fJ>eezing pI'Oaess with satu:rated
feed.
119

solution
cooling 290.0K+273.2K
( 1-wp) (wh-whH;-whlh)
m" (wp-wh th )(wh -wP-whHi)
1-wh+whHi m" wh-wP-whHi
cooling & crystallizing 273.2K+252 .OK
freezing & separating 252.0K
NaCl
heating 273.2K+290.0K
m = 1.00
dissociating 273.2K
heating, melting & dissolving 250 .OK-+273. 2K
H; : mass fraction 1 ce in NaCl • 2H20 stream
Ih: mass fraetion NaC1.2ti2o in ice stream
solution
heating 273.2K+290.0K
heating, melting & dissolving 252 .OK+273.2K
Figur>e A.5. FlO!U sheet of eutectic freezing process with saturated
feed with incomplete ice-NaCl.2H2D separation.
120

0.5
Ih (1)
t 0.4
0.3
0.2
00
parameter: WT (H;,Ih)
WT ( 0 , 0 )
Figure A.6. The rielative inarease in the theoretiaally minimum power
aonswnption ~ith NaCl.2H20 in the iae and iae in the
NaCl.2H2o aompar>ed to the pure flows as a funation of
the mass fraation iae in the NaCl.2H2o stream (Hi) and
the mass fraation of NaCl.2H2o in the iae strieam (Ih).
Because all flows must be positive, Hi < (wh-wp)/wh = 0.58 and Ih < wp/wh = 0.42. The first expression indicates that the NaCl.2H2o may not contain so high an amount of ice that at heating the resulting solution is unsaturated. The second expression indicates that the ice may not contain so high an amount of NaCl.2H20 that at heating the resulting solution is saturated.
A.6. Process with Incomplete Crystal-Brine Separation
The flow sheet of this process is shown in figure A.7. A similar calculation as presented in section A.2 gives the result shown in figure A.8. Because all flows must be positive, H1 < (wh-wp) I {wh-wE) = 0. 92: the NaCl .2H2o flow may not contain so high an amount of liquid that at heating the resulting solution is unsaturated.
121

solution
cooling 290.0~273.2K
1-wEll m = Wp"WEll
1-wh tWhHl-wEHl m = wh ~wP-whHl+wEHl
NaCl
heating 273. 2K+290 .OK
m = l.00
dissociating 273.2K
( 1-wp}{Wh -whHltWEHl-wEll)
m- {wp-w[Il )(wh-wP-whHltWEHl}
cooling & crystallizing 273.2K+252 .OK
freezing & separating
252.0K
heating & dissolving
252 .OK+273.2K
H1: mass fraction solution in NaCl .2H20 stream
11: mass fraction solution in ice stream
solution
heating 273. 2K+290 .OK
heating & melting
252 .OK+273.2K
Figure A.?. FlOUJ sheet of euteatia freezing proaess with saturated
feed with inaomplete arystal-brine separation.
122

1.0.---~--.~~-,.~~-.-~~-,.-~--,
H1 ( 1)
t 0.8
0.6
0.4
0.2
00
O.OL-~--''--~~'--~-'--'--~~'--~~
0.0 0.2
,
0.4 0.6 0.8
- i, (1)
1.0
Pigu:l'e A.8. The I'elative increase in the theoI'etically minimum por.ver
consumption of the eutectic fI'eezing process with solution
in the NaCl. 8H8
o and ice streams compared to the pure
flows as a function of mass fraction solution in the
NaCl. 8H8o stream (Hz) and of mass fraction solution in
the ice stream (Iz).
123

B. Calculation of the Size of a Two-phase Drop in a Stirring-tank
In this appendix the principle described in section 2.2.2 is applied to a two-phase drop in a stirring-tank. As mentioned in sections 2.2.2 and 2.2.3, two cases should be distinguished: od ~ oc + ocd and
oc ~ oc + ocdorocd > loc - odl. If od ~ oc + ocdorocd > loc - odl a size rv* of the bubble exists, above which the droplet will be torn off from the bubble. Assume that the two-phase drop is subjected to an acceleration a and that the tearing-off process proceeds fast compared to the evaporating process, so that~ can be taken constant during the ripping-off process. Take the bubble to be spherical and the liquid to liquid interfacial area to be part of a sphere (as in figure 2.11). The bubble will be torn off if for all s: 0 < S < TI:
(B.1)
where A's are defined in section 2.1.3, Fv is the force acting on the bubble .• F d the force acting on the droplet, and xdv the distance between the centres of mass of the bubble and the droplet. The individual terms of expression B.1 will be calculated below. The model used is shown in figure B.1.
r Figure B.1. Model of a two-phaBe droop.
124
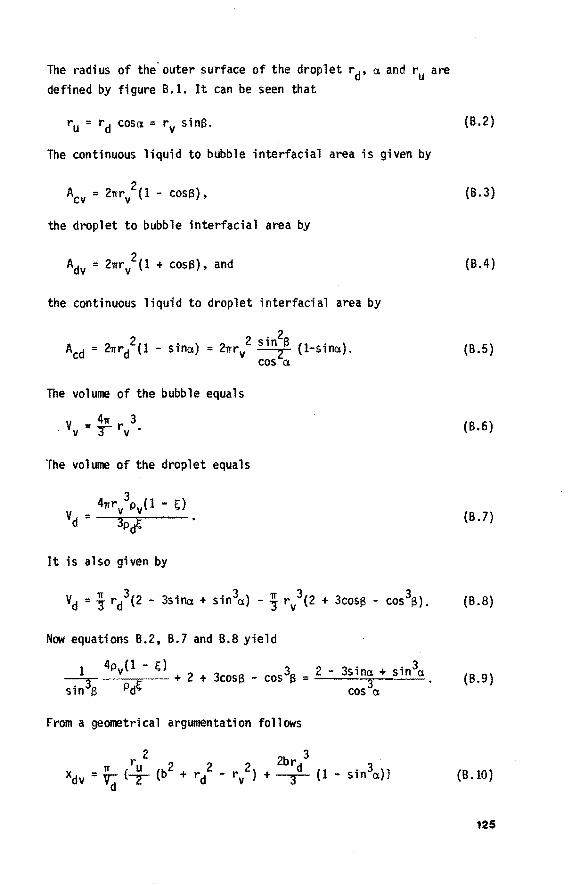
The radius of the· outer surface of the droplet rd' a and ru are defined by figure B.1. It can be seen that
The continuous liquid to bubble interfacial area is given by
2 Acv = 2nrv (1 - cose),
the droplet to bubble interfacial area by
2 Adv= 2nrv (1 + cosa). and
the continuous liquid to droplet interfacial area by
Acd = 2nr/Cl - sina) = 2nr/ ~ (1-sina). cos a
The volume of the bubble equals
V 4n 3 . v = r rv .
The volume of the droplet equals
It is also given by
Now equations B.2, B.7 and B.8 yield
1 4pv(l - ~) + 2 + 3cose - cos3e = 2 - 3sina + sin3a sin3a cos a
From a geometrical argumentation follows
(B.2)
(B.3)
(B.4)
(B.5)
(B.6)
(B.7)
(B.9)
(B .10)
125

where b = -rv cos$ - rd sina = -rv(cos$ - sin$tana). The force acting on the bubble equals
The force acting on the droplet equals
(B.11)
(B.12)
Equations B.2 to B.12 can be inserted in expression B.1. All terms in expression B.1. are now given as functions of$, rv• a and~. Because of the complexity of the problem, the following computation was carried out numerically by means of a computer. For a given ~ and acceleration a. the bubble radius that just satisfies expression B.1: rv* was determined. This calculation gives rv*(~.a).
The result of this calculation is shown in figure 2.8.
126

Notation
Quantity
Roman letters
unit
A
a
B
b
c
c
0
d
E
e F
f
G
g
H
h
I
J
area function in section 3.3.3 acceleration differential area density
m2
m/s m/s2
m-2
Hz/m3 excess nucleation rate literature nucleation rate crystal mass fraction
Hz/m3 or Hztm4
1
function in eq.B.10 and figure B.1 concentration exponent in correlation specific heat local constant
m kg/m3
1
J/(kg K)
variable m2ts di ff us i vi ty
death function di fferenti a 1
Hz/m3 or Hz/m4
1
diameter energy efficiency mathematical constant force free energy 1oca1 function free enthalpy growth rate acceleration due to gravity mass function of foreign substance in NaCl.2H20 flow enthalpy heat transfer coefficient height function in section 2.3.5 and figure 2.18 mass fraction of foreign substance in ice flow function in sections 2.3.5 and 4.5.3.c and figure 2.19
m J
1
1 N
J
variable J
m/s m/s2 1
J
W/(m2 K)
m
Km
1
Km
127

Quantity
k
L
m
N
n
0 p
p
Q
q
R
r
s s T
t
u
v v
w w x
y
z
128
thennal conductivity shape factor latent heat particle size differential length density mass nuni:>er stirring speed differential nunt>er density amount of substance order of magnitude pCMer constant in eq. 2.2 pressure heat volumetric discharge rate eutectic composition gas constant radius volume split ratio standard deviation of size temperature time Student's distribution kinetic constant dullllW variable in integral volume velocity differential volume density work NaCl mass fraction coordinate dimensionless size coordinate depth
unit
W/(Km) 1
J/kg m m-3
kg 1
Hz m-4
mol variable w 1
Pa J
m3/s 1
J/(Kmol) m
1
m
K
s 1
m/(s K) 1 m3
m/s m-1
J
1
m 1 m
m

Quantity
Greek letters
y
6.
0
E
Tl
e K
/..
]J
1T
p
E
a
T
probabi 1 i ty angle in app. B
half opening angle nucleation rate per crystal interfacial energy difference difference Kronecker synbol agitation power per liquid mass fraction of dispersed phase dissipation scale angle in spherical coordinates mass transfer coefficient constant in sections 3.2.3 and 3.2.4 dynamic viscosity chemical potential kinematic viscosity vapour mass fraction function in section 3.3.3.b mathematical constant mass density sum interfacial tension residence time refrigerant mass flow refrigerant flow density angle in spherical coordinates
Subscripts
Roman letters
A area axial
a impeller a-axis
unit
1
rad rad Hz
J/m2 1
1
1
W/kg 1
m
rad m/s K
Pas J/mol m2/s 1
1
1
kg/m3
1
N/m s kg/s kg/(m2s) rad
129

Subscripts
b
c c
d
E
e
f
g
H
h
j
K k
L
l
m
N
n
0
p
p
R
130
boiling crystal mass fraction hydrocyc 1 one continuous c-axis disperse drop {liquid) eutectic exponential factor equilibrium effective flow feed growth heavy {sinking) NaCl.2H20 hydrostatic interface ice local counter cooling water local counter left light {floating) liquid suspension mass melting stirring speed nucleation overall peritectic particle pressure right radial
Subscripts
r
s s
T
t
u
v v
w
x y
z
literature slip surface sublimation total tangential tank dummy volume vapour evaporation water x-axis y-azis NaCl z-axis
Greek letter
T residence time
Numbers
0 initial 10,20,31,30,32: defined in
section 3. 8.1 oo at distance oo
with oo degrees of freedom any other integer: local counter
Superscripts
0 {zero) : at L = 0
* critical averaged prime in section 3.3.3.b

S12eci a 1 svmbo 1 s unit
A area density m -1
L length density m -2
N nunt>er density m -3
v volume density 1
a partial differential 1
I nunt>er none
Dimensionless nunt>ers
gpdp 3ll.p Ar = 2 (Archimedes) 1
µ
2 gdp lip (Bond) (also called Eotvos number Eo) 1 Bo=--a
gp2d 3 Ga= --.f- (Gallilei) 1
µ
ed 4 Ko=~ (Kolmogoroff) 1
v
hd Nu = ~ (Nusselt) 1
Pe= dv:cp (P!clet) 1
Po = Pa
(power) 1 5 3 da pNa
c µ Pr=+ (Prandtl) 1
Re = dvp µ (Reynolds) 1
v Sc= 'D' (Schmidt) 1
kd Sh = --rf (Sherwood) 1
131

References
Ad 72 Adams AES, Pinder Kl: Average Heat Transfer Coefficient during the Direct Evaporation of a Liquid Drop; Can.J.Chem.Eng. 50 (1972) 707
Au 78 : Ault BS: Infrared Spectra of Argon Matrix-Isolated Alkali Halide Salt/Water Complexes; J.of the Am.Chem.Soc. 100 (1978) 2426
Av 78 Avedisian CT, Andres RP: Bubble Nucleation in Superheated Liquid-Liquid Emulsions; J. of Coll. and Interface Science 64 (1978) 438
Ba 60 Barduhn AJ, Towlson HE, Hu Y-C: The Properties of Gas Hydrates and their Use in Demineralizing Sea Water; Office of Saline Water, R & D Progress Report # 44, US Dept. of the Interior, 1960
Ba 63 : Bates RL, Fondy PL, Corpstein RR: An Examination of some Geometric Parameters of Impeller Power; I & EC Process Design and Development~ (1963) 310
Ba 68 Bassett WA, Takahashi T, Mao H-K, Weaver JS: Pressure-Induced Phase Transformation in NaCl; J. of Appl.Ph. 39 (1968) 319
Ba 75 Barduhn AJ, Lee S-C: Eutectic Temperatures for the Eutectic Freezing Process; AIChE, 68th Annual Meeting, Los Angeles 1975 Paper # 64c, Fiche # 70
Ba 77 Barduhn AJ: The Eute'ctic Freezing Process for Treating Waste Waters; Proceedings of the Third Iranian Congress of Chemical Engineering, Shiraz, Noven'ber 6-10, 1977, Volume 1, III 1
Ba 78 Barduhn AJ, Manudhane A.: The Eutectic Freezing Process for Treating Waste Waters; Proceedings 6th Intern.Symp. Fresh Water from the Sea i ( 1978) 23; Temperatures Required for Eutectic Freezing of Natural Waters; Desalination 28 (1979) 233
Bo 76 Botsaris GD: Secondary Nucleation - A Review; in: Industrial Crystallization, edited by J.W.Mullin, Plenum Press, New York and London, 1976
Bo 78 Boon-Long S, Laguerie C, Couderc JP: Mass Transfer from Suspended Solids to a Liquid in Agitated Vessels; Chem.Eng.Sc. 33 (1978) 813
132

Br 62 Briggs FA, Hu Y-C, Barduhn AJ: New Agents for Use in the Hydrate Process for Demineralizing Sea Water; Office of Saline Water, R. & D Progress Report I# 59, US Dept. of the Interior, 1962
Br 65 Bradley D: The Hydrocyclone; Pergamon Press, 1965 Br 69a Brian PLT, Hales HB: Effects on Transpiration and Changing
Diameter on Heat and Mass Transfer to Spheres; AIChE Journal 15 (1969) 419 '
Br 69b : Brian PLT, Hales HB, Sherwood TK: Transport of Heat and Mass between Liquids and Spherical Particles in an Agitated Tank; AIChE Journal 15 (1969) 727
Co 65 Cornish ARH: Note on Minimum Possible Rate of Heat Transfer from a Sphere when Other Spheres are Adjacent to it; Trans. Instn.Chem.Engrs. 43 (1965) T332
De 66 Defay R, Prigogine I, Bellemans A, Everett DH: Surface Tension and Absorption; Longmans, 1966
De 72 Denk Jr. EG, Botsaris GD: Fundamental Studies in Secondary Nucleation from Solution; J. of Crystal Growth 13/14 (1972) 493
De 74 Desai RM, Rachow JW, Timm DC: Collision Breeding: A Function of Crystal Moments and Degree of Mixing; AIChE Journal 20 (1974) 43
Es 75 Estrin J, Wang ML, Youngquist GR: Secondary Nucleation due to Fluid Forces Upon a Polycrystalline Mass of Ice; AIChE J9urnal !! (1975) 392
Es 76 : Estrin J: Secondary Nucleation; in: Preparation and Properties of Solid State Materials, Volume 2, edited by W.R.Wilcox, Marcel Dekker, New York and Basel, 1976
Ev 74a : Evans TW, Margolis G, Sarofim AF: Mechanisms of Secondary Nucleation in Agitated Crystallizers; AIChE Journal 20 (1974) 950
Ev 74b Evans TW, Sarofim AF, Margolis G: Models of Secondary Nucleation Attributable to Crystal-Crystallizer Collisions; AIChE Journal 20 (1974) 959
Fa 56 Fabry G: A Natriumklorid-Viz Elegy Entalpiadiagramja; Magy. Tud.Akad.Muszaki Tud.Oszt.Kozlemen. 21 (1957) 61; Das Enthalpiediagramn Wissriger Kochsalzlosungen; Acta Tech.Acad.Sci.Hung. 14 ( 1956) 313
133

Fe 67 Femandez R, Barduhn AJ: The Growth Rate of Ice Crystals; Proceedings 2nd European Symp. Fresh Water from the Sea ]_ (1967), paper# 90; Desalination .2_ (1967) 330
Fe 68 Fernandez R: The Growth of Ice in Flowing Water and NaCl Solutions; Dissertation Syracuse University, 1968
Fe 81 Fessas VP, Weiland RH: Convective Solids Settling Induced by a Buoyant Phase; AIChE Jounral 27 (1981) 588
Fi 72 Fitzgerald TJ, Vang T-C: Size Distribution for Crystallization with Continuous Growth and Breakage; Ind.Eng.Chem.Fund • .!! (1972) 588
Fl 75 Fluor Engineers and Constructors: Design and Specification Bid Package fora 10,000 GPO Eutectic Freezing Pilot Plant; Office of Water Research and Technology, Report PB-205455, US Dept. of the Interior, 1975
Fl 79 Fluor Engineers and Constructors: Design and Specification Bid Package for a 2,500 GPD Eutectic Freezing Pilot Plant; Office of Water Research and Technology, Report PB-295916, US Dept. of the Interior, 1979
Fo 68 Fortuna G, Sideman S: Direct Contact Heat Transfer between Immiscible Liquid Layers with Simultaneous Boiling and Stirring; Chem.Eng.Science 23 (1968) 1105
Ga 72 Garabedian H, Strickland-Constable RF: Collision Breeding of Crystal Nuclei: Sodium Chlorate.I; J. of Crystal Growth 13/14 (1972) 506
Ga 74 Garabedian H, Strickland-Constable RF: Collision Breeding of Ice Crystals; J. of Crystal Growth 22 (1974) 188
Ga 79 Garside J, Jancic SJ: Measurement and Scale-up of Secondary Nucleation Kinetics for the Potash Alum-Water System; AIChE Journal 25 (1979) 948
Ga 80 Garside J, Davey RJ: Secondary Contact Nucleation: Kinetics, Growth and Scale-up; Chem.Eng.Conmun. 1 (1980) 393
Gi 76 Gilpin RR: The Influence of Natural Convection on Dendritic Ice Growth; J. Of Crystal Growth 36 (1976) 101
Gr 77 Gradon L, Selecki A: Evaporation of a Liquid Drop Immersed in Another Immiscible Liquid. The Case of ac < ad; Int. J. Heat Mass Transfer 20 (1977) 459
Ha 62 Harriot P: Mass Transfer to Particles; AIChE Journal _!! (1962) 93
134

Ha 67 : Harriot P: The Growth of Ice Crystals in a Stirred Tank; AIChE Journal 13 (1967) 755
Ha 73 Hardy SC. Coriell SR: Surface Tension and Interface Kinetics of Ice Crystals Freezing and Melting in Sodium Chloride Solutions; J. of Crystal Growth 20 (1973) 292
Hu 69a Hughmark GA: Mass Transfer for Suspended Solid Particles in Agitated Liquids; Chem.Eng.Sc. 24 (1969) 291
Hu 69b Huige NJJ, Thijssen HAC: Rate Controlling Factors of Ice Crystal Growth from Supercooled Water and Glucose Solutions; Proceedings Symp.Ind.Crystallization, Instn. of Chem. Engrs •• London 15-16 April 1969, 69
Hu 72 Huige NJJ, Thijssen HAC: Production of Large Crystals by Continuous Ripening in a Stirrer Tank; J. Crystal Growth 13/14 (1972) 483
Ii 80 Iida Y, Takashima T: Direct-contact Heat Transfer Characteristics: Evaporation of a Drop Dropped onto a Hot Liquid Surface; Int. J. Heat Mass Transfer 23 (1980) 1263
Is 70 Isenberg J, Sideman S: Direct Contact Heat Transfer with Change of Phase: Bubble Condensation in Immiscible Liquids; Int. J. Heat Mass Transfer~ (1970) 997
Ja 73 Janzow EF, Chao BT: Salt Entrainment in Ice Crystallized from Brine; Desalination 12 (1973) 141
Ja 75 Jarvis TJ, Donohue MD, Katz JL: Bubble Nucleation Mechanisms of Liquid Droplets Superheated in Other Liquids; J. of Colloid and Interface Science 50 (1975) 359
Ja 80 : Jagannathan R, Sung CY, Youngquist GR, Estrin J: Fluid Shear Secondary Nucleation of Magnesium Sulfate and Potassium Aluminum Sulfate; AIChE Symp. Series 76, # 193 (1980) 90
Jo 71 Jones DRH, Chadwick GA: Experimental Measurement of SolidLiquid Interfacial Energies: The Ice-Water-Sodium Chloride System; J. of Crystal Growth 11 (1971) 260
Jo 73 : Johnson RA, Siegelman D, Stepakoff GL: Final Report on Eutectic Freezing Process Investigations; Office of Saline Water Contract 14-30-2945. AVSD-0089-73-RR, Avco Systems Division ( 1973).
Jo 74 Jones DRH: Deten11ination of the Kinetics of Ice-Brine Interfaces from the Shapes of Migrating Droplets; J. of Crystal Growth 26 (1974) 177
135

Jo 76 : Johnson RA, Gibson WE. Libby OR: Perfonnance of Liquid-Liquid Cyclones; Ind.Eng.Chem.Fundam. _!i (1976) 110
Ka 60 Kaufmann OW: Sodium Chloride. The Production and Properties of Salt and Brine; Reinhold. New York. 1960
Ka 74 Kane SG, Evans TW. Brian PLT. Sarofim AF: Oetennination of the Kinetics of Secondary Nucleation in Batch Crystallizers; AIChE Journal 20 (1974) 855
Ka 77 Kallungal JP, Barduhn AJ: Growth Rate of an Ice Crystal in Subcooled Pure Water; AIChE Journal 23 (1977) 294
Ke 79 Keese AM. Connolly TF, Battle GC: Crystal Growth Bibliography; Plenum, 1979
Kl 74 Klewe B, Pedersen B: The Crystal Structure of Sodium Chloride Oihydrate; Acta Cryst. B30 (1974) 2363
Ku 57 Kusunoki K: Construction of Enthalpy-Concentration Diagram for NaCl-H2o System; Kagaku Kogaku ~ (1957) 775
Le 72a Levins OM, Glastonbury JR: Particle-Liquid Hydrodynamics and Mass Transfer in a Stirred Vessel. Part I - Particle-Liquid Motion; Trahs.Inst.Chem.Engrs. 50 {1972) 32
Le 72b Levins OM, Glastonbury JR: Particle-Liquid Hydrodynamics and Mass Transfer in a Stirred Vessel. Part II - Mass Transfer; Trans.Inst.Chem.Engrs. 50 (1972) 132
Ma 60 Martin JJ: Thennodynamic Properties of Dichlorotetrafluoroethane; J. of Chemical and Engineering Data ~ {1960) 334
Ma 71 Margolis G, Sherwood TK, Brian PLT, Sarofim AF: The Performance of a Continuous Well Stirred Ice Crystallizer; Ind.Eng. Chem.Fundam. 10 {1971) 439
· Ma 75 : Mae S: Tyndall Figures at Grain Boundaries of Pure Ice; Nature 257 (1975) 382
Me 05 : Meyerhoffer W: in: Landolt-Bornstein: Physikalisch-Chemische Tabel len; 3rd ed., Julius Springer, Berlin 1905, p.556
Mi BO : Mishima 0, Endo S: Phase Relations of Ice Under Pressure; J.Chem.Phys. 73 {1980) 2454
Mo 52 : Moder JJ, Dahlstrom DA: Fine-Size. Close-Specific-Gravity Solid Separation with the Liquid-Solid Cyclone; Chem.Eng. Prog. 48 {1952) 75
Mo 79a Mokhtarzadeh MR, El-Shirbini AA: Motion of Bubbles and BubbleDroplets in an Immiscible Liquid; Wanne- und StoffUbertragung 12 (1979) 25
136

Mo 79b Mokhtarzadeh MR. El-Shirbini AA: A Theoretical Analysis of Evaporating Droplets in an IR111iscibl.e Liquid; Int. J. Heat Mass Transfer 22 (1979) 27
Na 78 Nagashima Y. Maeda S: Crystallization of Ice in Direct Contact Crystallizer Agitated by the Buoyancy Force of Secondary Refrigerant; Kagaku Kogaku Ronbunshu ~ (1978) 509
Ne 54 : Nelson KH. Thompson TG: Deposition of Salts from Sea Water by Frigid Concentration; J. of Marine Research Jl (1954) 166
Or 6900: Orcutt JC: Nucleation and Growth of Ice Crystals in Secondary Refrigerant Freezing; Desalination l (1969/70) 75
Pi 80 Pinder KL: Surface Area Prediction for Two Phase Drops in an Immiscible Liquid; Can.J.Chem.Eng. 58 (1980) 318
Pr 67 Prakash CB. Pinder KL: Direct Contact Heat Transfer Between Two Immiscible Liquids During Vaporization. Part II: Total Evaporation Time; Can.J.Chem.Eng. 45 (1967) 215
Ra 71 Randolph AD. LaJ;Son MA: Theory of Particulate Processes. Analysis and Techniques of Continuous Crystallizations; Academic Press, New York, San Francisco. London. 1971
Ra 82 Raina GK. Grover PD: Direct Contact Heat Transfer with Phase Change: Theoretical Model; AIChE Journal 28 (1982) 515
Ri 61 Rietema K: Perfonnance and Design of Hydrocyclones - II: Pressure Drop in the Hydrocyclone; Chem.Eng.Science 15 (1961) 303
Ru 80 Rusli IT, Larson MA, Garside J: Initial Growth of Secondary Nuclei Produced by Contact Nucleation; AIChE Symposium Series If 193, 76 ( 1980) 52
R.y 69 : Ryan BF: The Growth of Ice Parallel to the Basal Plane in Supercooled Water and Supercooled Metal Fluoride Solutions; J.Crystal Growth~ (1969) 284
Sa 74 : Sano Y, Yamaguchi N, Adachi T: Mass Transfer Coefficients for Suspended Particles in Agitated Vessels and Bubble Columns; J.Chem.Engng.Japan l (1974) 255
Se 72 Selecki A, Gradon L: Ueber den Verdampfungsmechanismus eines Sich in einer Nicht Mischbaren Flussigkett Bewegenden FlUssigkeitstropfens; Chemie-Ing.-Techn. 44 (1972) 1077
Se 76 Selecki A, Gradon L: Equation of Motion of an Expanding Vapour Drop in an Immiscible Liquid Medium; Int.J. Heat Mass Transfer 19 (1976) 925
137

Si 64 Sideman S, Taitel Y: Direct-contact Heat Transfer with Change of Phase: Evaporation of Drops in an Inmiscible liquid Medium; Int.J.Heat Mass Transfer J_ (1964) 1273
Si 65a Sideman S, Barsky Z: Turbulence Effect on Direct-contact Heat Transfer with Change of Phase: Effect of Mixing on Heat Transfer between an Evaporating Volatile liquid in Direct Contact with an Immiscible Liquid Medium; AIChE J . .!! (1965) 539
Si 65b : Sideman s. Hirsch G: Direct Contact Heat Transfer with Change of Phase: Condensation of Single Vapor Bubbles in an Inmiscible liquid Medium. Preliminary Studies; AIChE Journal 11 (1965) 1019
Si 67 Sideman S, Isenberg J: Direct Contact Heat Transfer with Change of Phase: Bubble Growth in Three-phase Systems; Proc. 2nd Intern. Symp. on Fresh Water from the Sea ! (1967) paper 33; Desalination ! (1967) 207
Si 73a Simpson HC, Beggs GC, Deans J, Nakamura J: The Growth of Ice Crystals; Proc. 4th Intern. Symp. Fresh Water from the Sea 1 (1973) 395; Desalination _!i (1974) 341
Si 73b Simpson HC, Beggs GC, Nazir M: Evaporation of Butane Drops in Brine; Proc. 4th Intern. Syrop. on Fresh Water from the Sea l (1973) 409; Desalination 15 (1974) 11
Si 75 Simpson HC, Beggs GC, Deans J: New Theories of the A-axis Growth of Ice Crystals; Int.J.Heat Mass Transfer 18 {1975) 615
Si 76 Simpson HC, Beggs GC, Nakamura J, Baxter A: The C-axis Growth Rate of Ice Crystals; Proc. 5th Intern. Symp. Fresh Water from the Sea 3 (1976) 189; Desalination 18 (1976) 219
Sm 66 Smillie KW: An Introduction to Regression and Correlation; Academic Press, 1966
Sm 79 Smith KA, Sarofim AF: Fundamental Studies of Desalination by Freezing; Office of Water Research and Technology Report PBS0-124316, US Dept. of the Interior (1979)
St 73a Stepakoff G, Siegelman D: Application of a Eutectic Freezing System to Industrial Wastewater Recycling; Nat.Conf. on Complete Water Reuse, AIChE, Washington DC, April 23-27, 1973
St 73b StepakoffGL, Siegelman 0, Johnson R, Gibson W: Development of a Eutectic Freezing Process for Brine Disposal; Proc. 4th Intern. Symp. on Fresh Water from the Sea 1 {1973) 421; Desa-
138

lination 12. (1974) 25 St 73c Stepakoff GL, Modica AP: The Hydrolysis of Halocarbon Refrige
rants in Freeze Desalination Processes. Part I: Solubility and Hydrolysis of Freon 114 (CC1F2CC1F2); Desalination ]1 {1973)85
St 73d Stepakoff GL, Modica AP: The Hydrolysis of Halocarbon Refrigerants in Freeze Desalination Processes. Part II: Theoretical Prediction of Hydrolysis Rates and Comparison with Experimental Data; Desalination 12 (1973) 239
St 75 Stahl D, Weinspach PM: Keint>ildung in GerUhrten Suspensionen aus Eiskristallen und Wassrigen Salzlosungen; Chemie-Ing.Techn. 47 (1975) 991
St 79 Strickland-Constable RF: Mechanism of Production and Growth Inhibition of Collision Crystallites; J. Chem. Soc. Farad. Trans. I. 75 { 1979) 921
Sy 67 Sykes P, Gomezplata A: Particle Liquid Mass Transfer in Stirred Tanks; Can. J. Chem. Engng. 45 (1967) 189
Te 70 : Terwilliger JP, Dizio SF: Salt Rejection Phenomena in the Freezing of Saline Solutions; Chem. Eng. Sc. 25 (1970) 1331
Th 56 Thompson TG, Nelson KH: Concentration of Brines and Deposition of Salts from Sea Water under Frigid Conditions; Am. J. of Science 254 (1956) 227
To 75 Tochitani Y, Mori YH, Komotori K: Vaporization of a Liquid Injected into an Immiscible Liquid; Warme- und StoffUbertragung .!!_ (1975) 249
To 77a : Tochitani Y, Mori YH, Komotori K: Vaporization of Single Liquid Drops in an Immiscible Liquid. Part I: Forms and Motions of Vaporizing Drops; Wanne- und StoffUbertragung 10 (1977) 51
To 77b Tochitani Y, Nakagawa T, Mori YH: Vaporization of Single Drops in an Immiscible Liquid. Part II: Heat Transfer Characteristics; Warme- und StoffUbertragung 10 (1977) 71
Tr 75 : Trivedi RK: Theory of Capillarity; in: Lectures on the Theory of Phase Transformations; ed. H.I.Aaronson, Metallurgical Society of AIME, New York, 1975
Vl 74 : Vlahakis JG, Barduhn AJ: Growth Rate of an Ice Crystal in Flowing Water and Salt Solutions; AIChE Journal 20 {1974) 581
We 73 Wey JS, Estrin J: Modeling the Batch Crystallization Process. The Ice-Brine System; Ind. Eng. Chem. Process Des. Develop.
139

12 ( 1973) 236 We 74 : Wey JS, Estrin J: The Growth and Nucleation of Ice in a Batch
Couette Flow Crystallizer; Desalination _!! (1974) 103 We 80 : Wey JS, Terwilliger JP: Effect of Temperature on Suspension
Crystallization Processes; Chem. Eng. Conmun. ± (1980) 297 Wo 73 : Woodruff DP: The Solid-Liquid Interface; Cambridge University
Press, 1973 Ze 72 : Zeitlin MA, Tavlarides LL: Fluid-Fluid Interactions and Hydro
dynamics in Agitated Dispersions: A Simulation Model; Can. J. Chem. Eng. 50 (1972) 207
3n: 79 BJiaHK AE, 0Kcnep1rntt.n;oaa J1TI: Pas,n;eJiett1:1.e Bo.n;ttoCoJieBblX oBT8KTMK npM TIOMO~ HanpaBJI8HHOH KpMCTaJIJIMsau;.11.11; i!LTip.11K.X.11M. 52 (1979) 1635; Blank AB, Eksperiandova LP: Separation of Water-Salt Eutectics by Directional Crystallization; J.Appl.Chemistry of the USSR 52 (1979) 1553
no 70 TiocneJIOB AA' qyXJiaHqeB Br: Tip.11MeHett.11e Bb!MOpalltl1BaH.11.ff ,n;JI.rr Bb!,n;eJieHM.rr CoJieH .113 PacTaopoa 8BTeKT.114ecKoro CocTaaa; lK.Tip.11K.X.l1M. 43 (1970) 1467; Pospelov AA, Chukhlantsev VG: Use of Freezing for Isolation of Salts from Solutions of Eutectic Composition; J.Appl. Chemistry of the USSR 43 (1970) 1478
ITy 77 Tiy1moB JIB, CT.IDKK.11H TIC, me.n;opoB MK: .l1HTerpaJibHble myHRIJ;ID'.l PacTBOpeH.11.ff B C.11cTeMe NaCl-H20 np.11 TeMnepaTypax .n;o 623°K M ~aBJiett.11.ffx .n;o 100 MTia; ~. TipMK.XMM. 50 {1977) 1004; Puchkov LV, Styazhkin PS, Fedorov FK: Integral Functions of Dissolution in the System NaCl-H2o at Temperatures up to 623°K and Pressure up to 100 MPa; J.Appl.Chem. USSR.§.£ (1977) 963
~ 76a m.11JiaTKMH BH' TIJIOTH.11KOB BT' A.mrureB AI': Pas,n;eJieH.11e mpeOHOB .11 Bo,D;b!; XOJIO.n;.11JIHhle MarrrnHhl H YcTpOHCTBa (1976) 77
~ 76b mMJiaTKMH BH, TIJIOTHMKoa BT, AJI.l1IlleB Ar: PacTBop.11MocTb mpeOHOB B Bo.n;e; XOJIO,D;. Tex. (1976) 23
140

Curriculum Vitae
Dick Swenne werd op 6 augustus 1954 in tindhoven geboren. Hij bezocht het Gemeentelijk Lyceum in Eindhoven en behaalde er in 1971 het HBS-B diploma. Daarna begon hij zijn studie aan de THE bij de afdeling Technische Natuurkunde. Hij studeerde af in 1979 bij Prof.Dr.l.J.F.Broer, in de vakgroep Theoretische Natuurkunde. In hetzelfde jaar trad hij in dienst van de THE als wetenschappelijk assistent bij de afdeling Scheikundige Technologie, in de vakgroep Fysische Technologie, waar hij het onderzoek uitvoerde dat in dit proefschrift wordt beschreven.
141

Stellingen
1. Het eventuele voordeel van het vriesproces ter verkrijging van zuiver water ten opzichte van het indampproces is niet, zoals Huige beweert, gelegen in het feit dat de kristallisatiewarmte van water ongeveer 1/7 is van de verdampingswarmte van water.
N.J.J.Huige, pPOefeahrift THE, 1972, p.4.
2. Het tweefasendruppelmodel beschreven in dit proefschrift geeft een betere beschrijving van de werkelijkheid dan het tweefasendruppelmodel van De Graauw.
J.de Graa.w, proefsahrift THD, 1968, p.41.
Dit proefsahrift, p.124.
3. Het zou de volksgezondheid bevorderen als er extra nicotine aan sigaretten wordt toegevoegd.
4. Volgens Schweers en Van Vianen produceren twee aangeslagen stemvorken drie tonen: hun eigen tonen en de verschiltoon, waarvan de frequentie gelijk is aan het verschil van de frequenties van de eigen tonen van de stemvorken. Deze verschiltoon wordt echter in werkelijkheid niet geproduceerd.
J.SdhuJeers en P.van Vianen, Natuurku:n.de op COPpu.saulaire grondslag,
deel d:rie voor de bovenbouw van het VHMO, 18e druk, Malmberg, 1968,
p.241.
5. In het Zeissplanetarium in Amsterdam staan in de ontvangsthal twee afbeeldingen van Einstein, waaruit blijkt dat volgens de Relativiteitstheorie Albert 2, die een verre ruimtereis heeft gemaakt, bij terugkomst op Aarde jonger is dan zijn tweelingbroer A'lbert 1. Dit volgt echter noch uit de Speciale, noch uit de Algemene Relativitei ts theori e.
R.H.Good, Am.J.Phys. 50 (1982) 232.

6. In tegenstelling tot wat De Vries beweert, hoeft de relatie tussen twee willekeurige grootheden X en Y niet van de vorm Y = k Xe (k en c constant) te zijn.
D.A.de Vries, Int.el.Beat Mass TI'al'lsfe1' 19 (1978) 1107.
7. Kirshner slaagt er niet in aan te tonen dat een fiets zelf-stabiel is. Dit komt omdat hij de snelheid waarmee het stuur vei-draait niet in de beschouwing heeft betrokken.
D.Ki1'sh:n.e1', Am.el.Phys. ~ (1980) 38.
el.Lob1ell and H.D.McKell, Am.el.Phys. 50 (1982) 1108.
8. In hun poging te verklaren waarom de lucht blauw is, vergeten Frohlich en Shaw rekening te houden met de Raman bijdrage en krijgen daai-door resultaten die verder af'Wijken van de werkelijkheid dan de door hen opgegeven onnauwkeurigheid aangeeft.
C.F?'l:Jhlich and G.E.5hctLJ, Applied Optics 19 (1980) 1773.
A.T.Young, Applied Optics 19 (1980) 3427.
D.A.Swenne. Eindhoven, 11 nove!IDer 1983.