the european medical technology industry - home page | … · · 2016-05-13ophthalmic and optical...
TRANSCRIPT

The European
Medical Technology industry


IN EUROPE
Table of Contents
What is Medical Technology? 01
Innovation 07
Employment 11
Companies 15
Expenditure on Medical Technology 17
MedTech Market 21
Trade 29
About MedTech Europe 35
References 37

What is Medical Technology?
1

Medical technology is technology used to ensure health in individuals suffering from a wide range of conditions
and is involved in an entire pathway from diagnosis to cure. It extends life and brings healthy life years, reduces
symptoms and prevents disease progression, thus playing an essential role in healthcare. Continuous medical
technology innovation enhances the quality and effectiveness of care. Billions of patients worldwide depend on
medical technology at home, at the doctor’s, at hospital and nursing homes. Wheelchairs, pacemakers, orthopaedic
shoes, spectacles and contact lenses, insulin pens, hip prostheses, condoms, oxygen masks, dental floss, MRI scanners,
pregnancy tests, surgical instruments, bandages, syringes, life-supporting machines: more than 500,000 MedTech
products (20,000 generic groups) are available today.
Good health is a prerequisite for well-being and economic prosperity. Medical technology, therapies and services
help people live healthier, more productive, socially active, independent lives and reinforce employability. In doing
so, medical technology contributes to steering healthcare onto a sustainable path and to ensuring economic growth
through better health of the workforce.
2

Diversity and classification of medical technology
Class III
Class IIB
Class IIA
Class I
Class D
Class C
Class B
Class A
Low risk
High risk
O+
B+
A-
AB-
O-
A+
Medical devices In Vitro Diagnostics1 2
3

CODE CLASSIFICATION EXAMPLE
01
02
03
04
05
06
07
08
09
10
11
12
13
14
15
16
Active implantable technology
Anaesthetic and respiratory technology
Dental technology
Electromechanical medical technology
Hospital hardware
In vitro diagnostic technology
Non-active implantable technology
Ophthalmic and optical technology
Reusable instruments
Single use technology
Technical aids for disabled
Diagnostic and therapeutic radiation technology
Complementary therapy devices
Biological-derived devices
Healthcare facility products and adaptations
Laboratory equipment
Cardiac pacemakers, neurostimulators
Oxygen mask, gas delivery unit, anaesthesia breathing circuit
Dentistry tools, alloys, resins, floss, brushes
X-ray machine, laser, scanner
Hospital bed
Pregnancy test, genetic test, glucose strip
Hip or knee joint replacement, cardiac stent
Spectacles, contact lenses, intraocular lenses, ophthalmoscope
Surgical instruments, rigid endoscopes, blood pressure cuffs,
stethoscopes, skin electrodes
Syringes, needles, latex gloves, balloon catheters
Wheelchairs, walking frames, hearing aids
Radiotherapy units
Acupuncture needles/devices, bio-energy mapping systems/software,
magnets, moxibustion devices, suction cups
Biological heart valves
Gas delivery systems
Most IVD which are not reagents
There are more than 500,000 medical technologies registered. These fall within 16 categories of products, as determined by the Global Medical Devices Nomenclature (GMDN) Agency.3
4

This risk classification ensures that appropriate safety measures are put in place before a product becomes available and guarantees that permanent monitoring during the lifetime of the high risk devices is conducted by specialised institutions. The number of devices approved remained steady between 2012 and 2013 with more than 3,100 medical devices that were approved by these institutions in Europe, around 560 of which were class III devices.4
Moreover, each technology comes with strict instructions for use and industry continuously invests in hands-on training for physicians. At the same time, clinical investigations comprised of thousands of patients, and interviews with physicians and patients enable the medical technology industry to continuously improve its products.
5

Medical Device - any instrument, apparatus, appliance, software, material or other article, whether used alone or in combination, including the
software intended by its manufacturer to be used specifically for diagnostic and/or therapeutic purposes and necessary for its proper application,
intended by the manufacturer to be used for human beings for the purpose of: diagnosis, prevention, monitoring, treatment or alleviation of
disease; diagnosis, monitoring, treatment, alleviation of or compensation for an injury or handicap; investigation, replacement or modification of
the anatomy or of a physiological process; control of conception; and which does not achieve its principal intended action in or on the human body
by pharmacological, immunological or metabolic means, but which may be assisted in its function by such means.1
In Vitro Diagnostics (IVD) – any medical device which is a reagent, reagent product, calibrator, control material, kit, instrument, apparatus,
equipment or system, whether used alone or in combination, intended by the manufacturer to be used in vitro for the examination of specimens,
including blood and tissue donations, derived from the human body, solely or principally for the purpose of providing information: concerning a
physiological or pathological state; or concerning a congenital abnormality; or to determine the safety and compatibility with potential recipients; or
to monitor therapeutic measures.2
Medical Technology (MedTech) – medical devices, in vitro diagnostics, imaging equipment and e-health solutions used to diagnose, monitor, assess
predispositions and treat patients suffering from a wide range of conditions.
Definitions:
6

InnovationIN EUROPE
7

Medical technology is characterised by a constant flow of innovations, which are the result of a high level of research and development within the industry, and of close co-operation with the users. Products typically have a lifecycle of only 18-24 months before an improved product becomes available.
In 2013, more than 10,000 patent applications were filed with the European Patent Office (EPO) in the field of medical technology – equivalent to 7 % of the total number of applications – more than any other technical field. 41% of these patent applications were filed from European countries (EU28, Norway and Switzerland) and 59% from other countries, with the majority of applications filed from US (39%).
In comparison, around 5,400 applications were filed in the pharmaceutical field and 5,400 in the field of biotechnology. While over the last decade the number of EPO filings in the field of medical technology has doubled, biotech and pharma patent applications were relatively stagnant.5
Patent applications in medical technology field filled with EPO in 2013
41%
59%EU28, Norway and Switzerland
Other countries
8

Top 10 technical fields in patent applications. Number of patent applications filed with EPO, 2013 5
10,668
5,3965,381
10,3079,1019,059
7,2446,640
6,1315,411
Medical technology
Electrical machinery, appartus, energy
Digital communication
Computer technology
Transport
Measurement
Organic fine chemistry
Engines, pumps, turbines
Pharmaceuticals
Biotechnology
9

Evolution of European patent applications by technical field 5
2004
2005
2006
2007
2009
2010
2011
2012
2013
2008
6,000
4,000
2,000
0
12,000
10,000
8,000
Num
ber o
f pat
ent a
pplic
atio
ns fi
led
with
EP
O
Medical Technology Pharmaceuticals Biotechnology
10

EmploymentIN EUROPE
11

The European medical technology industry employs more than 575,000 people. Germany has the highest absolute number of people employed in the medical technology sector, while the number of MedTech employees per capita is highest in Switzerland and Ireland6. This high level of employment shows that the medical technology industry is an important player in the European economy.In comparison, the US medical technology industry employs around 520,000 people7 while the European pharmaceutical industry employs 675,000 people8.
> 575,000 employees
Europe refers to EU28, Norway and Switzerland, unless specified otherwise.
12

Number of people employed in the medical technology industry 6
GBR 71,000
FRA 65,000
ESP 29,000
DEU 175,000
CHE 51,000
ITA 52,700
13

Number of people employed in the medical technology industry per 10,000 inhabitants6
16
75
70
65
60
55
50
45
40
35
30
25
20
15
10
5
0
CHE IRL DNK SWE DEU BEL GBR FRA NLD ITA PRT ESP GRC EUROPE USA
14

CompaniesIN EUROPE
15

There are almost 25,000 medical technology companies in Europe. Most of them are based in Germany, followed by the UK, Italy, Switzerland, Spain and France. Small and medium-sized companies (SMEs*) make up almost 95% of the medical technology industry, the majority of which employ less than 50 people (small and micro-sized companies)9.
* An enterprise is considered to be an SME if it employs fewer than 250 persons and has an annual turnover not exceeding €50 million (Small company - employs fewer than 50 persons and has a turnover of less than €10 million).
95%SMEs
25,000 medical technology companies in Europe.
16

Expenditure on Medical Technology
IN EUROPE
17

Expenditure on Medical Technology
In Europe, an average of 10.4% of gross domestic product is spent on healthcare. Of this figure, around 7.5% is attributed to medical technologies. The spending on medical technology varies significantly across European countries, ranging from around 5% to 10% of the total healthcare expenditure10.Expenditure on medical technology per capita in Europe is at around €195 (weighted average), compared with €380 in the US14.
18

Breakdown of total healthcare expenditure in Europe 15
0.8%
6.7%
7.5%
17%
75,5%
Inpatient & outpatient care, other
Pharmaceuticals & other medical non-durables
Medical technology
Medical devices
In vitro diagnostics
19

Per capita spending on various fields, in €, latest year available 10
€ 2,645
€ 450
€ 195
€ 385
€ 560
€ 1,600
0 500 1,000 1,500 2,000 2,500 3,000
Healthcare expenditure
Pharmaceuticals
MedTech
Defence
Environmental protection
Education
20

MedTech MarketIN EUROPE
21

The European medical technology market is estimated at roughly €100 billion.10
Based upon manufacturer prices the European medical technology market* is estimated to comprise approximately 28%11 of the world market. It is the second largest medical technology market after US (~40% 11).
€ 100 billion
22

European medical technology market* by country, based upon manufacturer prices, 2013 11
The biggest MedTech markets in Europe are Germany, France, United Kingdom, Italy and Spain11. The same countries form the top 5 IVD markets in Europe 12.
0%
5%
10%
15%
20%
25%
30%
35%
40%
DEU FRA GBR ITA ESP NLD CHE SWE BEL AUTOTHER
28%
16%
11% 10%
5%3% 4% 3% 3% 3%
14%
23

European IVD market by country, 2013 12
0%
5%
10%
15%
20%
25%
30%
35%
40%
DEU FRA GBRITA ESP NLD CHE POL BEL AUTOTHER
20%17%
7%
16%
9%
3% 3% 3% 3% 2%
16%
24

World medical technology market* by region, based upon manufacturer prices, 2013 11
0%
5%
10%
15%
20%
25%
30%
35%
40%
USA EUROPE JPN CHN RUS CANOTHER
BRA
39%
28%
9%
5%2% 2% 2%
12%
25

World medical technology market by area and sales growth, 2013-2020 13
Medical technology offers solutions for many disease areas. On a worldwide perspective, in vitro diagnostics are the largest sector, followed by cardiology and diagnostic imaging13.
Diagnostic Imaging
Orthopedics
Cardiology
In Vitro Diagnostics
Drug Delivery
Wound Management Dental
General & Plastic Surgery
Endoscopy
Ophthalmics
0%
2%
4%
6%
8%
10%
12%
14%
16%
2% 2.5% 3% 3.5
% 4% 4.5% 5% 5.5
% 6% 6.5%
% W
orld
wid
e M
arke
t Sha
re in
201
3
% Sales growth: CAGR 2013-2020Note: bullet size = worldwide sales 2020
Diabetic CareNephrology
26

European medical technology market* growth rates, based upon manufacturer prices, 2008-2013 11
The European medical technology* market has been growing on average by 4% per annum over the past 6 years. Demand fell in 2009 due to the economic crisis, resulting in the growth rate of only 1%. Market recovered in 2010, but growth rates fell back in 201111.
15%
10%
5%
0%
-5%
2008 2009 2010 2011 2012 2013
Annual growth rate Trend
27

The European IVD market growth has been slowing down over the last 6 years. While annual growth rates in the pre-crisis period were at around 2-4%, in 2012 the European market declined by 2.2% and is expected to have a decrease of around 2% in 201312.
* Market size estimated in manufacturers’ prices, not including margins, such as value added in the wholesaling and retailing, transportation costs, some taxes included in the final price, etc. Medical technology not including in vitro diagnostics.
European IVD market growth rates, 2008-2013 12
Annual growth rate Trend
15%
10%
5%
0%
-5%
2008 2009 2010 2011 2012 2013
28

TradeIN EUROPE
29

Europe has a positive medical technology trade* balance of €15.2 billion (2013), more than a twofold increase since 2006. In comparison, US medical technology trade surplus is at €5 billion.Main European MedTech trade partners are US, China and Japan11.
*Trade section does not include in vitro diagnostics in the figures for medical technology.
Europe’s trade surplus is estimated at €15.2 billion.
30
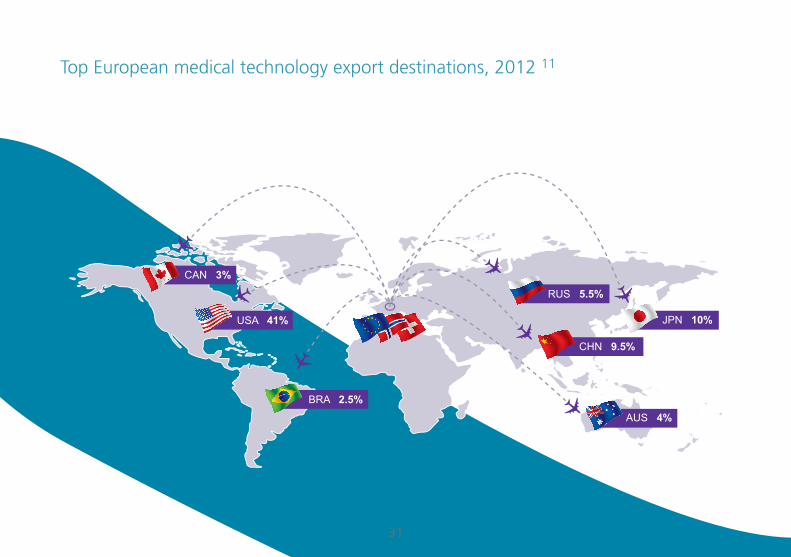
Top European medical technology export destinations, 2012 11
CAN 3%
USA 41%
BRA 2.5%
RUS 5.5%
CHN 9.5%
JPN 10%
AUS 4%
31

Top suppliers to European medical technology market (imports), 2012 11
USA 65%
SIN 2%
CHN 10.5%
JPN 7%
AUS 2%
32

Exports & imports of medical technology by country, 2013 (including European intra-trade) 11
0
5
10
15
20
DEU NLD BEL CHE IRL FRA GBR ITA SWE DNK AUT FIN ESP CZE POL
Import Export
In b
illio
n €
33

Medical technology trade balance by country, 2013 11
876543210
-1-2
DEU IRL
CHENLD BEL
DNKFIN
SWE
HUNLT
UEST
LVA
BULSVN
CZEAUT
HRVSVK
ROMGRC
PRTNOR
POL ITA GBRFRA
ESP
in b
illio
n €
34

About MedTech Europe
35

About MedTech Europe
MedTech Europe is an Alliance of European medical technology industry associations. The Alliance was founded in October 2012 and currently has two members being EDMA, representing the Europeanin vitro diagnostic industry, and Eucomed, representing the European medical devices industry.
The Alliance was established to represent the common policy interests of its members more effectively and efficiently. Its mission is to make value-based, innovative medical technology available to more people, while supporting the transformation of healthcare systems onto a sustainable path. As such, the medical devices and in vitro diagnostics industries are jointly executing their industry strategy.
In 2012 MedTech Europe published the “Contract for a Healthy Future”, the MedTech industry’s 5-year strategy, and “Creating Value in European Healthcare”. “Contract for a Healthy Future” details the role of Europe’s medical tech-nology industry in steering healthcare systems onto a sustainable path, while the “Creating Value in European Health-care”- publication explains how Europe’s medical technology industry isdelivering on the promise of the “Contract”. Both publications are available at www.reforminghealthcare.eu
36

References37

1 European Commission. The classification of medical devices is a ‘risk based’ system based on the vulnerability of the human body taking account of the potential risks associated with the devices. The classification rules are based on different criteria such as the duration of contact with the patient, the degree of invasiveness and the part of the body affected by the use of the device.
2 European Commission. IVD classification is based on the degree of health risk posed to an individual and public, and is related to the risk of an incorrect result arising from the use of the IVD.
3 Global Medical Devices Nomenclature (GMDN) Agency, 2010.
4 The European Association for Medical Devices of Notified Bodies - Medical Device Survey 2013: data from 28 Notified Bodies. CE mark is a verification that a device meets all regulatory requirements of the Directives which apply to it.
5 European Patent Office, Eucomed calculations. Medical technology as defined by World Intellectual Property Organization (based on the WIPO IPC-Technology con-cordance as revised in August 2014). European countries refer to EU + Norway, Switzerland. Patents are attributed by the country of residence of the applicant.
6 Eurostat, Eucomed calculations based on the data obtained from National Associations of 15 countries for the latest year available. Countries with (partially) provided data: Belgium, Czech Republic, Denmark, France, Germany, Greece, Ireland, Italy, Netherlands, Poland, Portugal, Spain, Sweden, UK, Switzerland. Europe refers to EU + Norway, Switzerland.
7 S. Tripp, M. Grueber, R. Helwig - The Economic Impact of the U.S. Advanced Medical Technology Industry, Battelle Technology Partnership Practice, March 2012.
8 EFPIA – The Pharmaceutical Industry in Figures. Key Data 2013. Europe refers to EU + Norway, Switzerland.
9 Eucomed calculations based on the data obtained from National Associations of 15 countries for the latest year available. Europe refers to EU + Norway, Switzerland.
10 WHO Global Health Expenditure Database, Eurostat, Eucomed calculations based on the data obtained from National Associations of 15 countries for the latest year available. Countries with (partially) provided data: Belgium, Czech Republic, Denmark, France, Germany, Greece, Ireland, Italy, Netherlands, Poland, Portugal, Spain, Sweden, UK, Switzerland. Europe refers to EU + Norway, Switzerland.
11 Espicom, Eucomed calculations. Manufacturer prices. Medical technology excluding in vitro diagnostics. Europe refers to EU (excluding Cyprus, Luxembourg, Malta) + Norway, Switzerland.
12 EDMA - European IVD Market Statistics Report 2013 - http://www.edma-ivd.eu/index.php?page=Market-Intelligence
13 World Preview 2013, Outlook to 2018: The Future of Medtech, EvaluateMedTech™, September 2013 - http://www.evaluategroup.com/MedTechWP2014
14 WHO; G. Donahoe and G.King - Estimates of Medical Device Spending in the United States, F.S.A., M.A.A.A. AdvaMed, 2012.
15 WHO, Eurostat, EFPIA, EDMA, Eucomed calculations. Europe refers to EU + Norway, Switzerland
38

Notes


www.medtecheurope.org
January 2014