the european benchmarking report on quality of …grouper.ieee.org/groups/td/dist/sd/doc/2014-08...
TRANSCRIPT

The European BenchmarkingReport on Quality of Supply
PES GM, 30 July 2014
Math BOLLEN
Luleå University of Technology
Skellefteå, Sweden
1
Werner FRIEDL
E-Control / CEER (energy regulator)
Vienna, Austria / Brussels, Belgium
• The European (regulated and deregulated)electricity market
• CEER - the Council of European Energy Regulators
• The Benchmarking report on quality ofelectricity supply
• Benchmarking on Continuity of Supply
• Cooperation IEEE and CEER
2

The European Electricity Market
3
Regulated monopoly
Deregulated openmarket
Deregulated openmarket
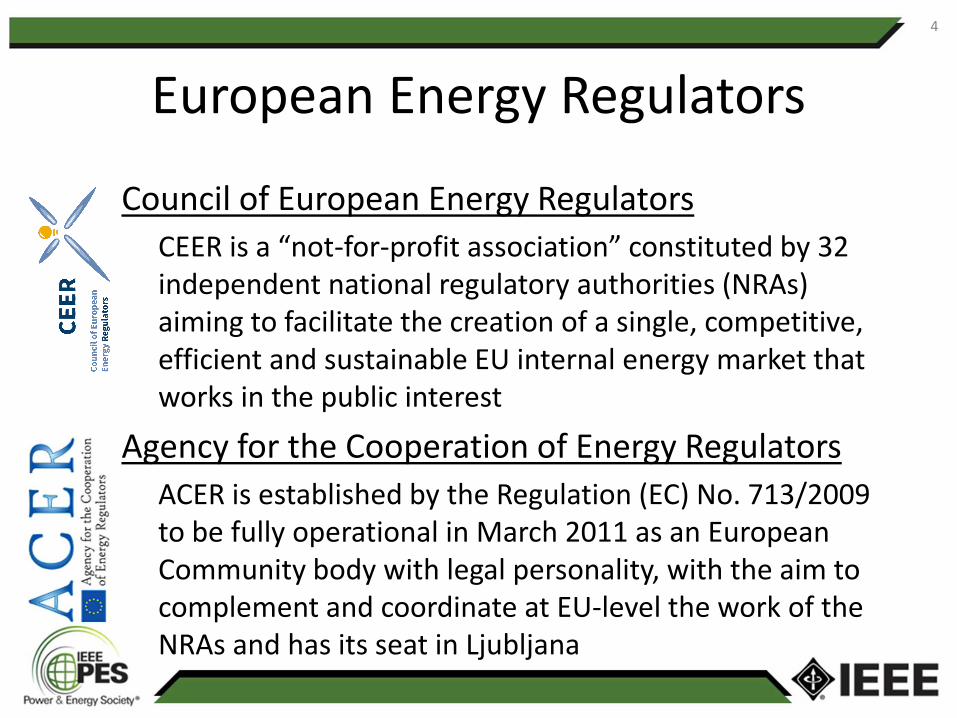
European Energy Regulators
Council of European Energy Regulators
CEER is a “not-for-profit association” constituted by 32independent national regulatory authorities (NRAs)aiming to facilitate the creation of a single, competitive,efficient and sustainable EU internal energy market thatworks in the public interest
Agency for the Cooperation of Energy Regulators
ACER is established by the Regulation (EC) No. 713/2009to be fully operational in March 2011 as an EuropeanCommunity body with legal personality, with the aim tocomplement and coordinate at EU-level the work of theNRAs and has its seat in Ljubljana
4
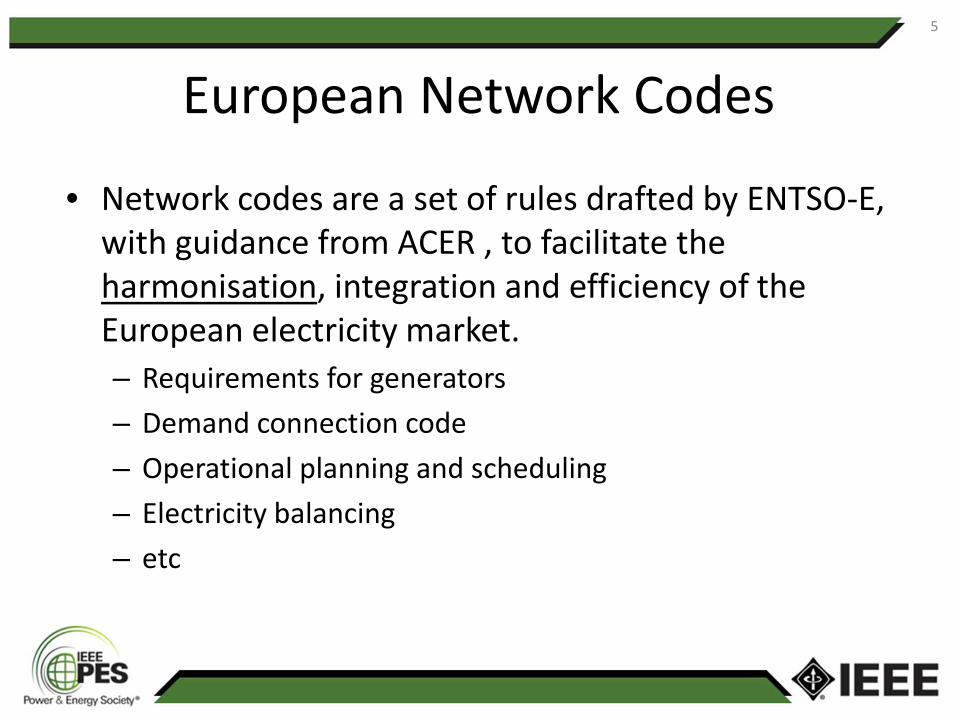
European Network Codes
• Network codes are a set of rules drafted by ENTSO-E,with guidance from ACER , to facilitate theharmonisation, integration and efficiency of theEuropean electricity market.
– Requirements for generators
– Demand connection code
– Operational planning and scheduling
– Electricity balancing
– etc
5

CEER - organisation
6
Electricity Quality of SupplyTask Force EQS TF
http://www.ceer.eu
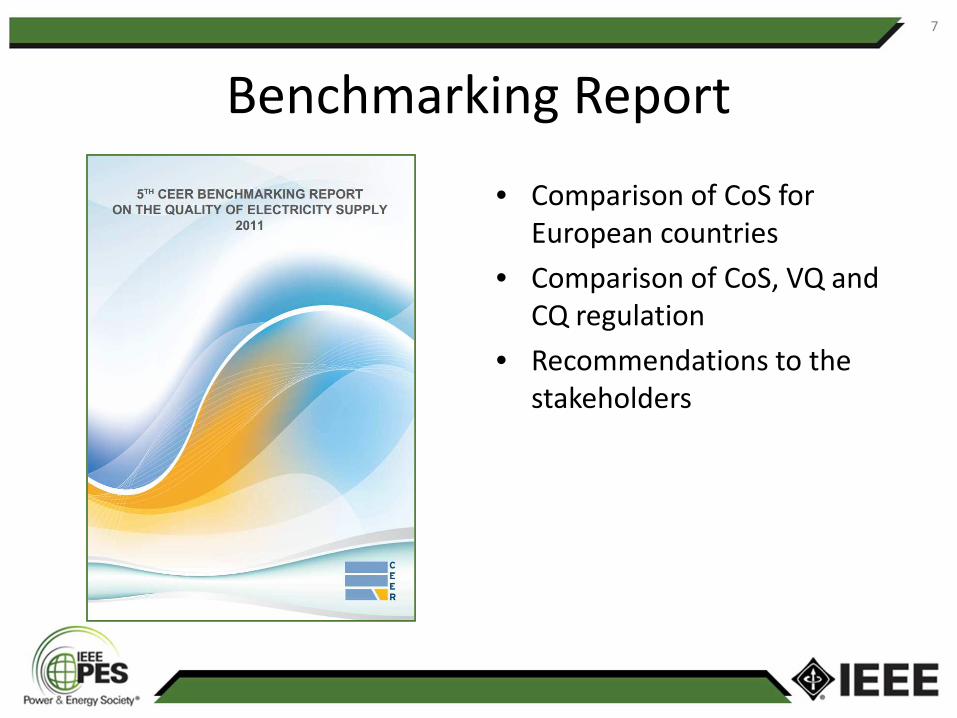
Benchmarking Report
• Comparison of CoS forEuropean countries
• Comparison of CoS, VQ andCQ regulation
• Recommendations to thestakeholders
7

Evolution of Benchmarking2001 2003 2005
2008
8
2011
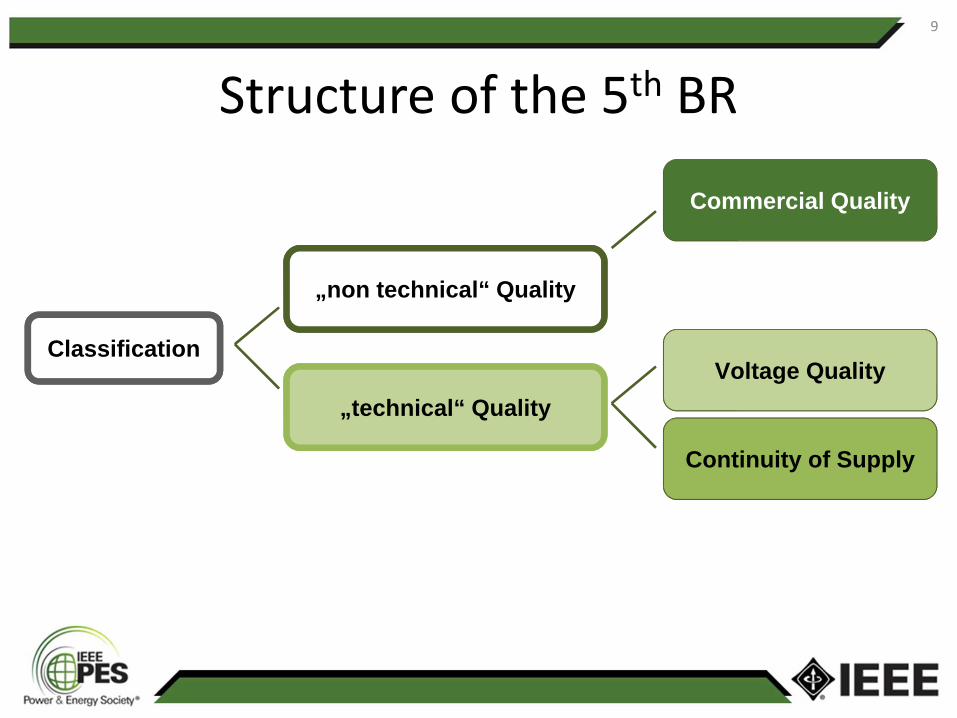
Structure of the 5th BR
„non technical“ Quality
„technical“ Quality
Commercial Quality
Voltage Quality
Continuity of Supply
Classification
9
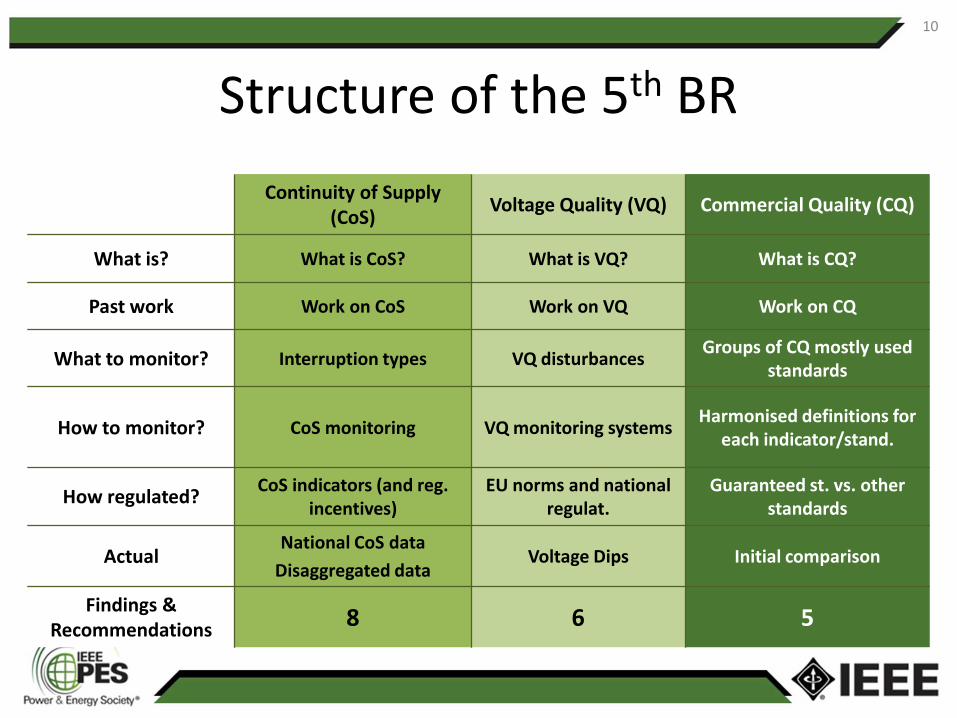
Structure of the 5th BR
Continuity of Supply(CoS)
Voltage Quality (VQ) Commercial Quality (CQ)
What is? What is CoS? What is VQ? What is CQ?
Past work Work on CoS Work on VQ Work on CQ
What to monitor? Interruption types VQ disturbancesGroups of CQ mostly used
standards
How to monitor? CoS monitoring VQ monitoring systemsHarmonised definitions for
each indicator/stand.
How regulated?CoS indicators (and reg.
incentives)EU norms and national
regulat.Guaranteed st. vs. other
standards
ActualNational CoS data
Disaggregated dataVoltage Dips Initial comparison
Findings &Recommendations
8 6 5
10

Voltage Quality - EN 50160
• Electricity as a product
• Set of “voltagecharacteristics” as minimumrequirements throughoutEurope
• 10-minute averages
• 95% of time, for allcustomers
11
National regulation
• EN 50160 is often used as a basis
– Measurement method
– Objective values for harmonics
• Sharpening the requirements in different ways
– 1 minute instead of 10 minutes
– 99 or 100 % instead of 95 %
– Different objectives for supply voltage variations
– Regulation on voltage dips
12

Recommendations on VQ from BR5
13
• #1A: Further improve EN 50160 as a harmonised instrument forvoltage quality regulation
• #2: Ensure individual voltage quality verification
• #3: Set reasonable emission limits for network users
• #4A: the scope of continuous voltage quality monitoringprograms should be broadened
• #4B: exploit the possibilities offered by smart meters withoutexcessive price increase for customers
• #5: define harmonized characteristics and indices for voltage dips
• #6: Ensure availability and regular publication of voltage qualitydata

Recommendations on CQ from BR5
14
• #1: Periodically review the national regulations of commercialquality
• #2: Enforce general standards of service in order to protectcustomers better
• #3: Properly prioritise the national regulations of commercialquality
• #4: Maximise the benefits of high tech developments forcustomers
• #5: Develop the regulation of customer relations

Continuity of Supply
Continuity of supply concerns interruptions inelectricity supply.
In other words: CoS focuses on the events during whichthe voltage at the supply terminals of a network userdrops to zero or nearly (practically) zero.
Continuity of supply can be described byvarious quality dimensions.
15

Benchmarking on Continuity of Supply I/II
16
Source: http://www.ceer.eu
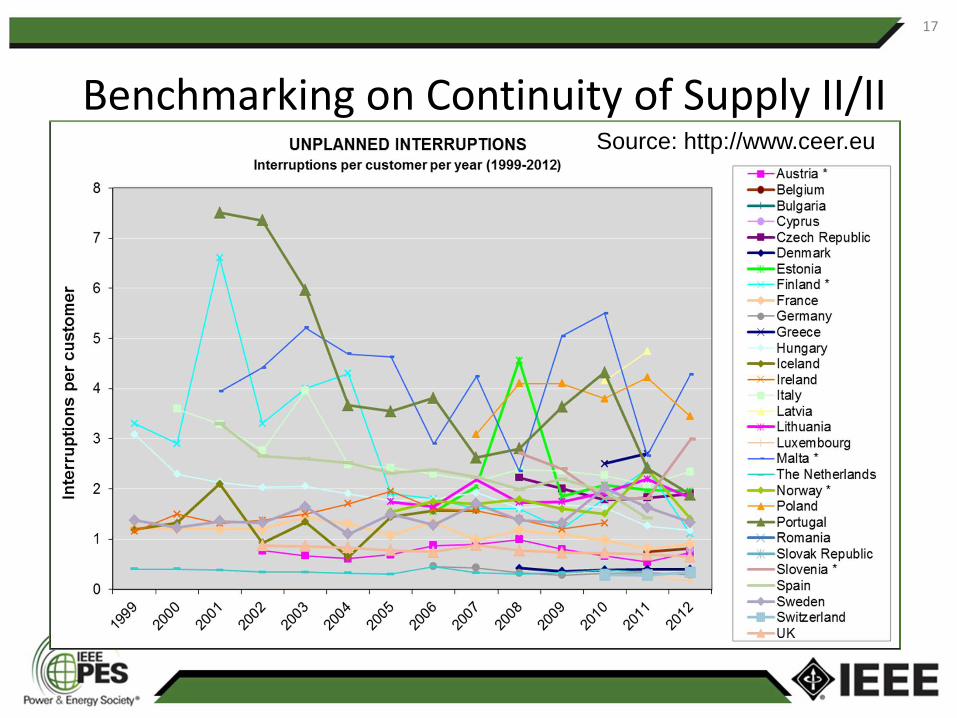
Benchmarking on Continuity of Supply II/II
17
Source: http://www.ceer.eu
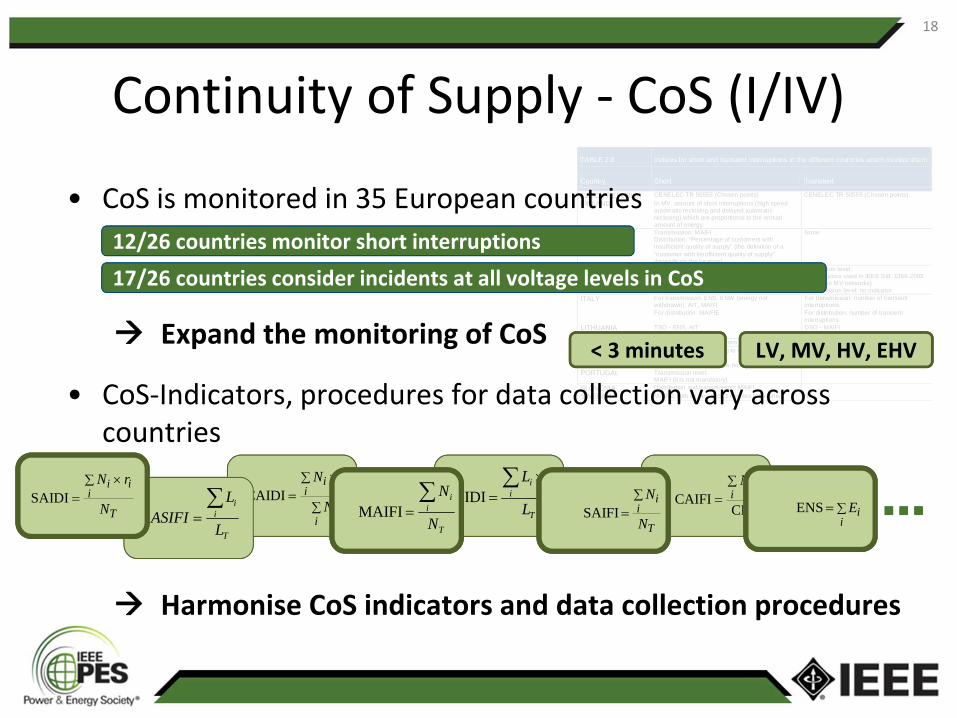
Continuity of Supply - CoS (I/IV)TABLE 2.8 Indices for short and transient interruptions in the different countries which monitor them
Country Short Transient
CZECH REPUBLIC CENELEC TR 50555 (Chosen points) CENELEC TR 50555 (Chosen points)
FINLAND In MV, amount of short interruptions (high speedautomatic reclosing and delayed automaticreclosing) which are proportional to the annualamount of energy.
FRANCE Transmission: MAIFIDistribution: “Percentage of customers withinsufficient quality of supply” (the definition of a
“customer with insufficient quality of supply”depends on the location)
None
HUNGARY Distribution level: the indicators used in IEEE Std.1366-2003: MAIFI (for MV networks)Transmission level: no indicator
Distribution level:the indicators used in IEEE Std. 1366-2003:MAIFI (for MV networks)Transmission level: no indicator
ITALY For transmission: ENS, ENW (energy notwithdrawn), AIT, MAIFI
For distribution: MAIFIE
For transmission: number of transientinterruptions.
For distribution: number of transientinterruptions.
LITHUANIA TSO - ENS, AITDSO - SAIDI, SAIFI
DSO - MAIFI
NORWAY Same as for long interruptions Included in short interruptions
POLAND Distribution level according to the IEEE Std. 1366-2003: MAIFITransmission level: there is no indicator
NA
PORTUGAL Transmission level:MAIFI (it is not mandatory)
SLOVENIA Distribution and transmission: MAIFI
SWEDEN MAIFIE with an period of 3 minutes for events NA
• CoS is monitored in 35 European countries
Expand the monitoring of CoS
• CoS-Indicators, procedures for data collection vary acrosscountries
Harmonise CoS indicators and data collection procedures
12/26 countries monitor short interruptions
17/26 countries consider incidents at all voltage levels in CoS
i
iEENSCNCAIFI
iiN
T
ii
N
N
SAIFIT
iii
L
rL
ASIDI
ii
iii
N
rN
CAIDI
T
ii
L
L
ASIFI
T
iii
N
rN
SAIDI
T
ii
N
NMAIFI
iiEENS
T
ii
N
N
SAIFIT
iii
N
rN
SAIDI
T
ii
N
NMAIFI
< 3 minutes LV, MV, HV, EHV
18

Continuity of Supply - CoS (II/IV)
0
100
200
300
400
500
600
1999
2000
2001
2002
2003
2004
2005
2006
2007
2008
2009
2010
Min
ute
slo
st
per
cu
sto
mer
France HV, MV, LV urban
France HV, MV, LV suburban
France HV, MV, LV rural
Italy HV, MV, LV urban
Italy HV, MV, LV suburban
Italy HV, MV, LV rural
Romania HV, MV, LV urban
Romania HV, MV, LV rural
Portugal HV, MV, LV urban
Portugal HV, MV, LV suburban
Portugal HV, MV, LV rural
Slovenia HV, MV urban
Slovenia HV, MV suburban
Slovenia HV, MV rural
0
100
200
300
400
1999
2000
2001
2002
2003
2004
2005
2006
2007
2008
2009
2010
Min
ute
slo
st
pe
ry
ea
r
Austria HV, MV
Bulgaria HV, MV
Czech Republic EHV, HV, MV, LV
Denmark HV, MV, LV
France EHV, HV, MV, LV
Germany EHV, HV, MV, LV
GB EHV, HV, MV, LV
Greece MV, LV
Hungary HV, MV, LV
Ireland HV, MV, LV
Italy EHV, HV, MV, LV
Lithuania HV, MV, LV
The Netherlands EHV, HV, MV, LV
Poland EHV, HV, MV, LV
Portugal EHV, HV, MV, LV
Romania HV, MV, LV
Slovak Republic EHV, HV, MV, LV
Slovenia EHV, HV, MV
Spain EHV, HV, MV, LV
Sweden EHV, HV, MV, LV
• CoS improvements trend to become stable(planned/not planned; with/without exceptional events
analyses in: graphical and table form)
Investigate CoS trends for a periodic review of regulation(analyse trends of the economic results of regulation)
• CoS is affected by network characteristics(urban/suburban/rural areas - analyses in: graphical and table form)
Assess disaggregated continuity data in order to identifypriorities – e.g.:
voltage level groups of customer by cause
19

Continuity of Supply - CoS (III/IV)y = 0,0016x + 0,177
R2
= 0,428
0%
10%
20%
30%
40%
50%
60%
70%
80%
90%
100%
0 100 200 300 400 500
Density, inhabitants per km²
Rate
of
un
derg
rou
nd
cab
les
MV
Netherlands
GermanySpain
Luxembourg
Great Britain
Italy
AustriaSweden
FranceNorway
IcelandSlovenia
Bulgaria
Estonia
Finland
Lithuania
GreeceIrelandHungary
Czech RepublicPoland
Portugal
• CoS levels are affected by network characteristics (e.g. cable)significant correlation between underground cables and high CoS; several indicators arecorrelated (e.g. population density) – difficult to assess specific impact
Promote cost-benefit analysis to improve the efficiencyof expenditure on networks
• Incentive schemes are used to regulate CoS in distributionand transmission networks
Implement an incentive scheme for maintaining orimproving general continuity levels
15/26 countries consider CoS in their regulation regime
6 countries plan to introduce such a regime (DE, GR, LU, AT, RO, CZ)
20
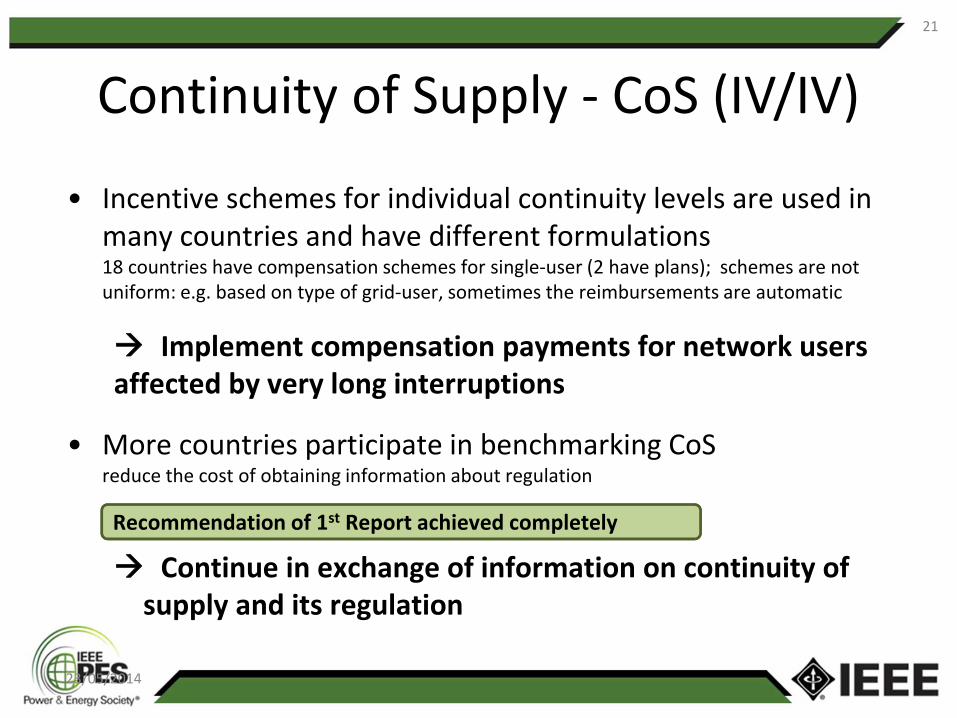
Continuity of Supply - CoS (IV/IV)
23/05/2014
• Incentive schemes for individual continuity levels are used inmany countries and have different formulations18 countries have compensation schemes for single-user (2 have plans); schemes are notuniform: e.g. based on type of grid-user, sometimes the reimbursements are automatic
Implement compensation payments for network usersaffected by very long interruptions
• More countries participate in benchmarking CoSreduce the cost of obtaining information about regulation
Continue in exchange of information on continuity ofsupply and its regulation
Recommendation of 1st Report achieved completely
21

Conclusion and Outlook I/II
• Results are presented on the basis of facts
• Clear recommendations for future developments are given
• Further harmonisation in (i) data collection;
(ii) indices calculation; (iii) quality analysis
• Further improvements of VQ standardisation
(EN 50160)
• Implementation of Guideline of Good Practise on VQ-Monitoring
• Attention on Smart Meters
22
Commercial Quality
Voltage Quality
Continuity of Supply
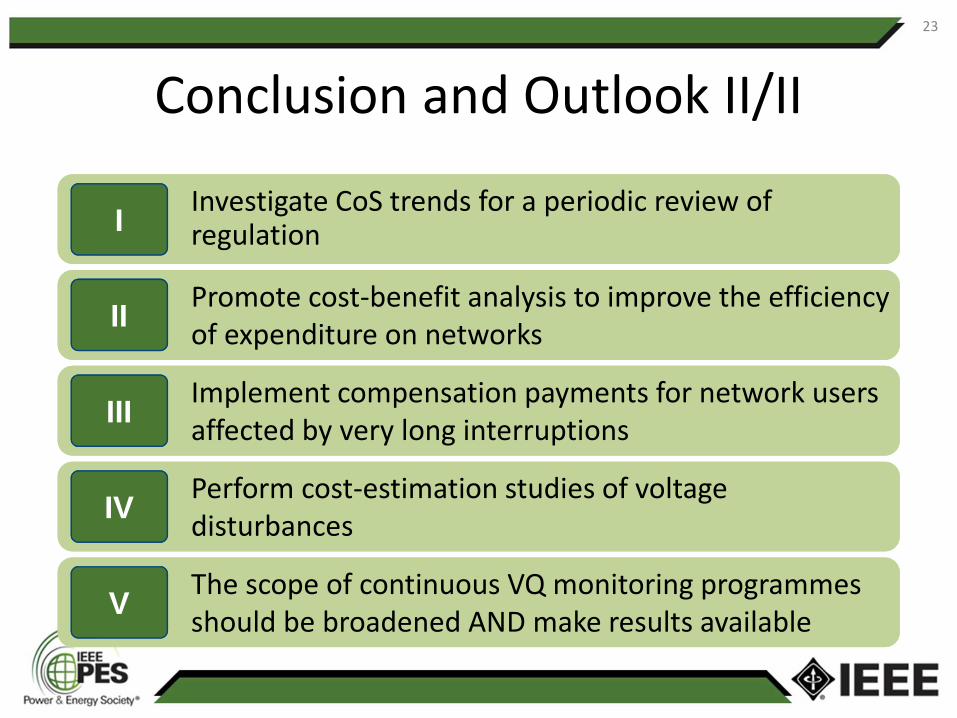
Conclusion and Outlook II/II
23
Investigate CoS trends for a periodic review ofregulationInvestigate CoS trends for a periodic review ofregulationI
Promote cost-benefit analysis to improve the efficiencyof expenditure on networksPromote cost-benefit analysis to improve the efficiencyof expenditure on networks
II
Implement compensation payments for network usersaffected by very long interruptionsImplement compensation payments for network usersaffected by very long interruptions
III
Perform cost-estimation studies of voltagedisturbancesPerform cost-estimation studies of voltagedisturbances
IV
The scope of continuous VQ monitoring programmesshould be broadened AND make results availableThe scope of continuous VQ monitoring programmesshould be broadened AND make results available
V

Plans/ideas for the 6th BR on CoS
• Differentiation/definition on planned & unplanned interruptions
• Focus on causes of interruptions (e.g. cause of “fiber cabeling”)
• Rules for time aggregation of interruptions
• Analysis on relationship of network performance and network structure
– Clustered sizes of DSOs in relationship to the network performance
– Improved questions on demand and distributed generation (classification ofcustomers)
• CAPEX/OPEX relationship to quality performance
• Recommendations for density (urban/sub-urban/rural)
• Use of quality indicators in regulation (comparison of regulation regimes,use within regulation regime and/or efficiency benchmarking)
• Definition of “good” quality for CoS (in form of individual standards)
24
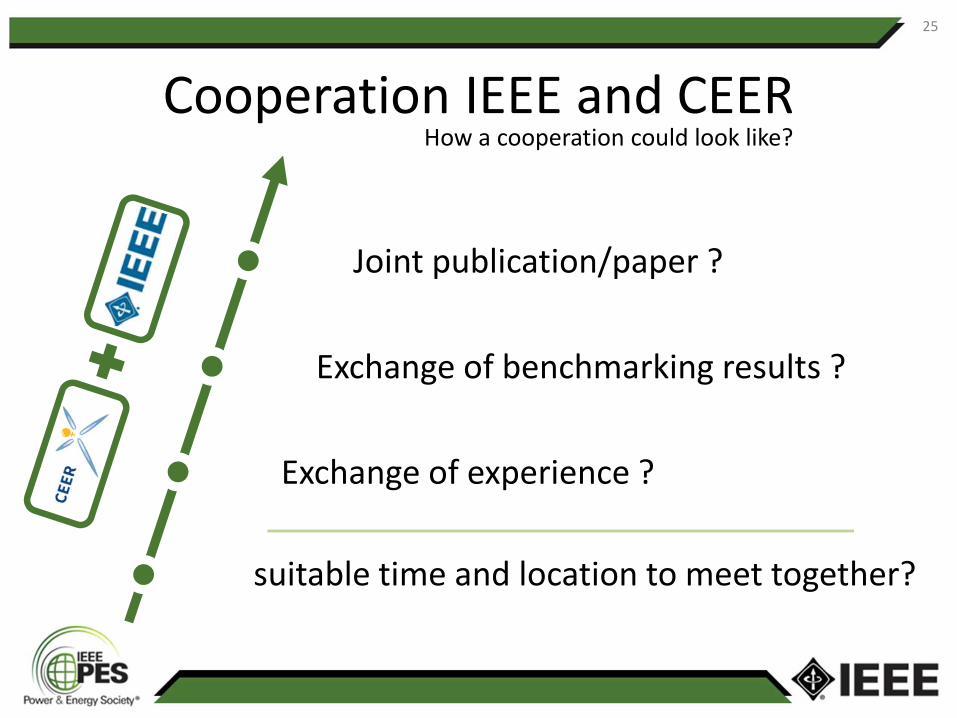
Cooperation IEEE and CEER
25
suitable time and location to meet together?
Exchange of experience ?
Joint publication/paper ?
Exchange of benchmarking results ?
How a cooperation could look like?
26
Dr. Werner FRIEDL
501+43 1 24724
www.e-control.at / www.ceer.eu
Prof. Math BOLLEN
+46 70 295 8424
http://www.ltu.se/
ANNEX – additional information
27
28
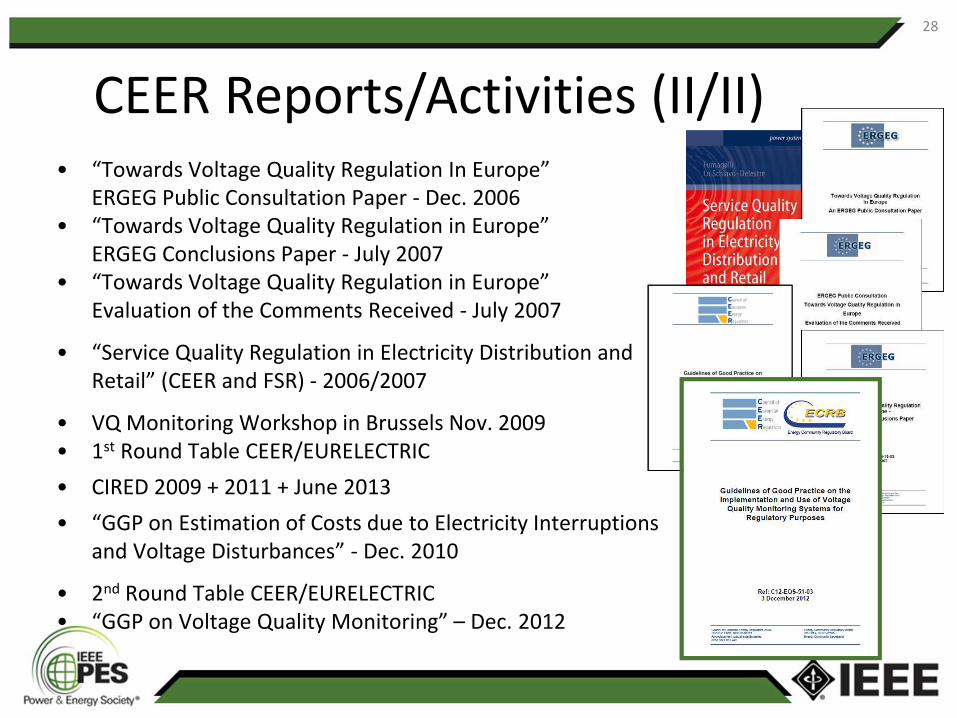
• “Towards Voltage Quality Regulation In Europe”ERGEG Public Consultation Paper - Dec. 2006
• “Towards Voltage Quality Regulation in Europe”ERGEG Conclusions Paper - July 2007
• “Towards Voltage Quality Regulation in Europe”Evaluation of the Comments Received - July 2007
• “Service Quality Regulation in Electricity Distribution andRetail” (CEER and FSR) - 2006/2007
• VQ Monitoring Workshop in Brussels Nov. 2009• 1st Round Table CEER/EURELECTRIC
• CIRED 2009 + 2011 + June 2013
• “GGP on Estimation of Costs due to Electricity Interruptionsand Voltage Disturbances” - Dec. 2010
• 2nd Round Table CEER/EURELECTRIC• “GGP on Voltage Quality Monitoring” – Dec. 2012
CEER Reports/Activities (II/II)

CEER Reports/Activities (I/II)
29
• 1st CEER Benchmarking Report - 2001
• 2nd CEER Benchmarking Report - 2003
• 3rd CEER Benchmarking Report - 2005
• 4th CEER Benchmarking Report - 2008
• 5th CEER Benchmarking Report – 2011• CEER Benchmarking Report 5.1 – 2014 (CoS)
• CEER Benchmarking Report 5.2 – 2015 (CoS)

Cooperation IEEE and CEER
30
suitable time and location to meet together?
Exchange of experience ?
Joint publication/paper ?
Exchange of benchmarking results ?
How a cooperation could look like?